fidelity canadian disciplined equity d
TRANSCRIPT
Fidelity Canadian Disciplined Equity® Fund
Annual Financial StatementsJune 30, 2021

Annual Financial Statements
Fidelity Canadian Disciplined Equity®Fund
Financial Statements
The accompanying notes are integral to these fnancial statements. See Note 1 for the Fund’s reporting periods.The accompanying notes are integral to these fnancial statements. See Note 1 for the Fund’s reporting periods.
Statements of Financial Position
Amounts in thousands of Canadian Dollars (except per security amounts)As at June 30, 2021 June 30, 2020
Current assets (Note 3)Investments at fair value through proft or loss (Note 8) $ 5,083,457 $ 3,195,139Cash – 1,874Receivable for investments sold 31,178 –Other receivables 6 –Accrued interest and dividends receivable 7,469 4,061Subscriptions receivable 6,136 3,470
5,128,246 3,204,544
Current liabilities (Note 3)Payable for investments purchased 29,373 1,910Redemptions payable 2,335 5,013Distributions payable (Note 5) 93 103Management and advisory fees payable (Note 4) 1,335 1,178Other payables to affliates (Note 4) 151 133Other payables and accrued expenses (Note 4) 135 120
33,422 8,457Net assets attributable to securityholders (Notes 3 and 6) $ 5,094,824 $ 3,196,087
Net assets attributable to securityholders per Series and per security (Note 6)Series A: ($37,327 and $37,535, respectively) $ 51.96 $ 42.25
Series B: ($572,447 and $516,772, respectively) $ 53.07 $ 43.16
Series F: ($130,338 and $95,210, respectively) $ 59.43 $ 48.36
Series F5: ($1,440 and $604, respectively) $ 27.61 $ 23.51
Series F8: ($1,093 and $833, respectively) $ 23.52 $ 20.42
Series O: ($4,079,628 and $2,347,787, respectively) $ 63.49 $ 51.70
Series T5: ($203 and $629, respectively) $ 16.92 $ 14.46
Series T8: ($479 and $839, respectively) $ 14.66 $ 13.04
Series S5: ($2,010 and $1,870, respectively) $ 17.41 $ 14.87
Series S8: ($15,652 and $14,845, respectively) $ 15.02 $ 13.34
Series E1: ($156,852 and $117,895, respectively) $ 15.86 $ 12.90
Series E1T5: ($1,552 and $745, respectively) $ 23.97 $ 20.47
Series E2: ($32,142 and $18,416, respectively) $ 15.87 $ 12.91
Series E2T5: ($25 and $20, respectively) $ 24.02 $ 20.51
Series E3: ($4,709 and $3,434, respectively) $ 15.88 $ 12.92
Series E4: ($4,097 and $3,513, respectively) $ 15.90 $ 12.94
Series E5: ($2 and $1, respectively) $ 15.90 $ 12.93
Series P1: ($38,481 and $25,426, respectively) $ 14.94 $ 12.16
Series P1T5: ($1,244 and $715, respectively) $ 22.69 $ 19.32
Series P2: ($8,979 and $4,364, respectively) $ 14.94 $ 12.16
Series P2T5: ($2 and $48, respectively) $ 21.79 $ 18.56
Series P3: ($5,322 and $4,493, respectively) $ 14.95 $ 12.16
Series P3T5: ($2 and $1, respectively) $ 21.84 $ 18.60
Series P4: ($797 and $91, respectively) $ 13.63 $ 11.09
Series P5: ($1 and $1, respectively) $ 13.64 $ 11.10
2

Annual Financial Statements
Fidelity Canadian Disciplined Equity®Fund
The accompanying notes are integral to these fnancial statements. See Note 1 for the Fund’s reporting periods.
Financial Statements – continued
Statements of Comprehensive Income (Loss)
Amounts in thousands of Canadian Dollars (except per security amounts)For the periods ended June 30, 2021 2020
Investment income (Note 3)Interest $ – $ 3Dividends 91,792 81,534Security lending 52 71Income distributions from Fidelity managed underlying funds 151 1,746
Net gain (loss) on investments Net realized gain (loss) on investments 343,726 116,289Change in net unrealized appreciation (depreciation) on investments 598,489 (123,279)
942,215 (6,990)Net gain (loss) on foreign currencies
Net realized gain (loss) on foreign currency transactions (60) 262Change in net unrealized appreciation (depreciation) on other net assets in foreign currencies – 8
(60) 270Total investment income (loss) 1,034,150 76,634
Operating expenses (Note 4)Management and advisory fees 15,444 15,124Administration fees 1,756 1,716Independent Review Committee fees 1 1Commissions and other portfolio costs 3,387 1,747Foreign taxes withheld (Note 5) 509 338Sales tax 1,777 1,735
Total operating expenses 22,874 20,661Expenses waived (Note 4) (213) (211)
Net operating expenses 22,661 20,450Net increase (decrease) in net assets attributable to securityholders from operations $ 1,011,489 $ 56,184
Increase (decrease) in net assets attributable to securityholders from operations per Series (Note 3)Series A $ 9,148 $ 224
Series B $ 134,241 $ 3,488
Series F $ 28,559 $ 1,285
Series F5 $ 222 $ 10
Series F8 $ 247 $ 33
Series O $ 782,297 $ 50,891
Series T5 $ 108 $ 5
Series T8 $ 152 $ 10
Series S5 $ 457 $ 11
Series S8 $ 3,724 $ 117
Series E1 $ 32,922 $ (273)
Series E1T5 $ 277 $ (2)
Series E2 $ 5,966 $ (86)
Series E2T5 $ 6 $ –
Series E3 $ 1,066 $ 19
Series E4 $ 937 $ (47)
Series E5 $ 1 $ –
Series P1 $ 7,908 $ 38
Series P1T5 $ 242 $ 11
Series P2 $ 1,599 $ 123
Series P2T5 $ 3 $ –
3

Annual Financial Statements
Fidelity Canadian Disciplined Equity®Fund
The accompanying notes are integral to these fnancial statements. See Note 1 for the Fund’s reporting periods.
Financial Statements – continued
Statements of Comprehensive Income (Loss) – continued
Amounts in thousands of Canadian Dollars (except per security amounts)For the periods ended June 30, 2021 2020
Series P3 $ 1,322 $ 330
Series P3T5 $ 1 $ –
Series P4 $ 84 $ (3)
Series P5 $ – $ –
Increase (decrease) in net assets attributable to securityholders from operations per Series per security (Notes 3 and 6)Series A $ 11.39 $ .23
Series B $ 11.80 $ .27
Series F $ 13.89 $ .65
Series F5 $ 6.74 $ .31
Series F8 $ 5.62 $ .83
Series O $ 15.54 $ 1.17
Series T5 $ 3.65 $ .11
Series T8 $ 3.24 $ .13
Series S5 $ 3.96 $ .09
Series S8 $ 3.48 $ .10
Series E1 $ 3.52 $ (.03)
Series E1T5 $ 5.62 $ (.08)
Series E2 $ 3.55 $ (.06)
Series E2T5 $ 5.51 $ .17
Series E3 $ 3.50 $ .06
Series E4 $ 3.58 $ (.20)
Series E5 $ 3.59 $ .10
Series P1 $ 3.49 $ .02
Series P1T5 $ 5.39 $ .29
Series P2 $ 3.47 $ .30
Series P2T5 $ 4.42 $ .30
Series P3 $ 3.54 $ .89
Series P3T5 $ 5.22 $ .32
Series P4 $ 2.90 $ (.75)
Series P5 $ 3.24 $ .21
4

Annual Financial Statements
Fidelity Canadian Disciplined Equity®Fund
The accompanying notes are integral to these fnancial statements. See Note 1 for the Fund’s reporting periods.
Financial Statements – continued
Statements of Changes in Net Assets Attributable to Securityholders
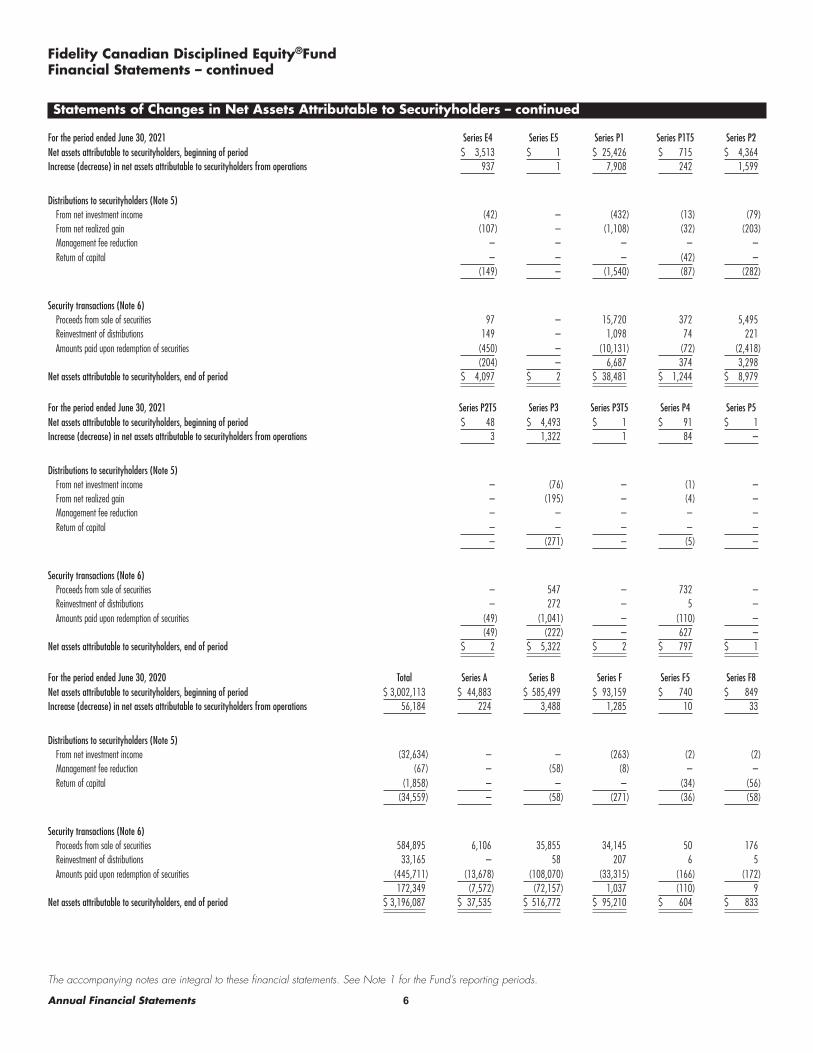
Amounts in thousands of Canadian DollarsFor the period ended June 30, 2021 Total Series A Series B Series F Series F5 Series F8Net assets attributable to securityholders, beginning of period $ 3,196,087 $ 37,535 $ 516,772 $ 95,210 $ 604 $ 833Increase (decrease) in net assets attributable to securityholders from operations 1,011,489 9,148 134,241 28,559 222 247
Distributions to securityholders (Note 5)From net investment income (58,794) (391) (5,950) (1,541) (9) (14)From net realized gain (150,688) (1,001) (15,249) (3,949) (24) (35)Management fee reduction (67) – (60) (6) – –Return of capital (1,684) – – – (39) (62)
(211,233) (1,392) (21,259) (5,496) (72) (111)
Security transactions (Note 6)Proceeds from sale of securities 1,470,300 4,575 36,433 40,912 1,111 83Reinvestment of distributions 206,894 1,380 20,567 3,899 36 51Amounts paid upon redemption of securities (578,713) (13,919) (114,307) (32,746) (461) (10)
1,098,481 (7,964) (57,307) 12,065 686 124Net assets attributable to securityholders, end of period $ 5,094,824 $ 37,327 $ 572,447 $ 130,338 $ 1,440 $ 1,093
For the period ended June 30, 2021 Series O Series T5 Series T8 Series S5 Series S8Net assets attributable to securityholders, beginning of period $ 2,347,787 $ 629 $ 839 $ 1,870 $ 14,845Increase (decrease) in net assets attributable to securityholders from operations 782,297 108 152 457 3,724
Distributions to securityholders (Note 5)From net investment income (48,262) (7) (6) (19) (163)From net realized gain (123,693) (17) (15) (49) (419)Management fee reduction – – – – (1)Return of capital – (21) (55) (90) (1,320)
(171,955) (45) (76) (158) (1,903)
Security transactions (Note 6)Proceeds from sale of securities 1,310,338 52 107 346 669Reinvestment of distributions 171,957 28 45 105 1,002Amounts paid upon redemption of securities (360,796) (569) (588) (610) (2,685)
1,121,499 (489) (436) (159) (1,014)Net assets attributable to securityholders, end of period $ 4,079,628 $ 203 $ 479 $ 2,010 $ 15,652
For the period ended June 30, 2021 Series E1 Series E1T5 Series E2 Series E2T5 Series E3Net assets attributable to securityholders, beginning of period $ 117,895 $ 745 $ 18,416 $ 20 $ 3,434Increase (decrease) in net assets attributable to securityholders from operations 32,922 277 5,966 6 1,066
Distributions to securityholders (Note 5)From net investment income (1,463) (11) (263) – (52)From net realized gain (3,749) (29) (675) (1) (134)Management fee reduction – – – – –Return of capital – (54) – (1) –
(5,212) (94) (938) (2) (186)
Security transactions (Note 6)Proceeds from sale of securities 37,895 644 12,169 – 2,003Reinvestment of distributions 4,927 58 843 1 176Amounts paid upon redemption of securities (31,575) (78) (4,314) – (1,784)
11,247 624 8,698 1 395Net assets attributable to securityholders, end of period $ 156,852 $ 1,552 $ 32,142 $ 25 $ 4,709
5
Annual Financial Statements
Fidelity Canadian Disciplined Equity®Fund
The accompanying notes are integral to these fnancial statements. See Note 1 for the Fund’s reporting periods.
Financial Statements – continued
Statements of Changes in Net Assets Attributable to Securityholders – continued
For the period ended June 30, 2021 Series E4 Series E5 Series P1 Series P1T5 Series P2Net assets attributable to securityholders, beginning of period $ 3,513 $ 1 $ 25,426 $ 715 $ 4,364Increase (decrease) in net assets attributable to securityholders from operations 937 1 7,908 242 1,599
Distributions to securityholders (Note 5)From net investment income (42) – (432) (13) (79)From net realized gain (107) – (1,108) (32) (203)Management fee reduction – – – – –Return of capital – – – (42) –
(149) – (1,540) (87) (282)
Security transactions (Note 6)Proceeds from sale of securities 97 – 15,720 372 5,495Reinvestment of distributions 149 – 1,098 74 221Amounts paid upon redemption of securities (450) – (10,131) (72) (2,418)
(204) – 6,687 374 3,298Net assets attributable to securityholders, end of period $ 4,097 $ 2 $ 38,481 $ 1,244 $ 8,979
For the period ended June 30, 2021 Series P2T5 Series P3 Series P3T5 Series P4 Series P5Net assets attributable to securityholders, beginning of period $ 48 $ 4,493 $ 1 $ 91 $ 1Increase (decrease) in net assets attributable to securityholders from operations 3 1,322 1 84 –
Distributions to securityholders (Note 5)From net investment income – (76) – (1) –From net realized gain – (195) – (4) –Management fee reduction – – – – –Return of capital – – – – –
– (271) – (5) –
Security transactions (Note 6)Proceeds from sale of securities – 547 – 732 –Reinvestment of distributions – 272 – 5 –Amounts paid upon redemption of securities (49) (1,041) – (110) –
(49) (222) – 627 –Net assets attributable to securityholders, end of period $ 2 $ 5,322 $ 2 $ 797 $ 1
For the period ended June 30, 2020 Total Series A Series B Series F Series F5 Series F8Net assets attributable to securityholders, beginning of period $ 3,002,113 $ 44,883 $ 585,499 $ 93,159 $ 740 $ 849Increase (decrease) in net assets attributable to securityholders from operations 56,184 224 3,488 1,285 10 33
Distributions to securityholders (Note 5)From net investment income (32,634) – – (263) (2) (2)Management fee reduction (67) – (58) (8) – –Return of capital (1,858) – – – (34) (56)
(34,559) – (58) (271) (36) (58)
Security transactions (Note 6)Proceeds from sale of securities 584,895 6,106 35,855 34,145 50 176Reinvestment of distributions 33,165 – 58 207 6 5Amounts paid upon redemption of securities (445,711) (13,678) (108,070) (33,315) (166) (172)
172,349 (7,572) (72,157) 1,037 (110) 9Net assets attributable to securityholders, end of period $ 3,196,087 $ 37,535 $ 516,772 $ 95,210 $ 604 $ 833
6

Annual Financial Statements
Fidelity Canadian Disciplined Equity®Fund
The accompanying notes are integral to these fnancial statements. See Note 1 for the Fund’s reporting periods.
Financial Statements – continued
Statements of Changes in Net Assets Attributable to Securityholders – continued
For the period ended June 30, 2020 Series O Series T5 Series T8 Series S5 Series S8Net assets attributable to securityholders, beginning of period $ 2,085,455 $ 728 $ 1,388 $ 2,136 $ 17,688Increase (decrease) in net assets attributable to securityholders from operations 50,891 5 10 11 117
Distributions to securityholders (Note 5)From net investment income (32,246) – – – –Management fee reduction – – – – (1)Return of capital – (36) (98) (104) (1,453)
(32,246) (36) (98) (104) (1,454)
Security transactions (Note 6)Proceeds from sale of securities 451,320 – 42 165 499Reinvestment of distributions 32,246 8 33 37 431Amounts paid upon redemption of securities (239,879) (76) (536) (375) (2,436)
243,687 (68) (461) (173) (1,506)Net assets attributable to securityholders, end of period $ 2,347,787 $ 629 $ 839 $ 1,870 $ 14,845
For the period ended June 30, 2020 Series E1 Series E1T5 Series E2 Series E2T5 Series E3Net assets attributable to securityholders, beginning of period $ 112,431 $ 711 $ 17,879 $ 35 $ 4,567Increase (decrease) in net assets attributable to securityholders from operations (273) (2) (86) – 19
Distributions to securityholders (Note 5)From net investment income – – – – –Management fee reduction – – – – –Return of capital – (39) – (1) –
– (39) – (1) –
Security transactions (Note 6)Proceeds from sale of securities 30,228 150 8,280 – 1,488Reinvestment of distributions – 18 – – –Amounts paid upon redemption of securities (24,491) (93) (7,657) (14) (2,640)
5,737 75 623 (14) (1,152)Net assets attributable to securityholders, end of period $ 117,895 $ 745 $ 18,416 $ 20 $ 3,434
For the period ended June 30, 2020 Series E4 Series E5 Series P1 Series P1T5 Series P2Net assets attributable to securityholders, beginning of period $ 2,696 $ 1 $ 21,265 $ 696 $ 5,510Increase (decrease) in net assets attributable to securityholders from operations (47) – 38 11 123
Distributions to securityholders (Note 5)From net investment income – – (78) (2) (25)Management fee reduction – – – – –Return of capital – – – (35) –
– – (78) (37) (25)
Security transactions (Note 6)Proceeds from sale of securities 915 – 10,045 15 1,347Reinvestment of distributions – – 57 30 22Amounts paid upon redemption of securities (51) – (5,901) – (2,613)
864 – 4,201 45 (1,244)Net assets attributable to securityholders, end of period $ 3,513 $ 1 $ 25,426 $ 715 $ 4,364
7
Annual Financial Statements
Fidelity Canadian Disciplined Equity®Fund
The accompanying notes are integral to these fnancial statements. See Note 1 for the Fund’s reporting periods.
Financial Statements – continued
Statements of Changes in Net Assets Attributable to Securityholders – continued
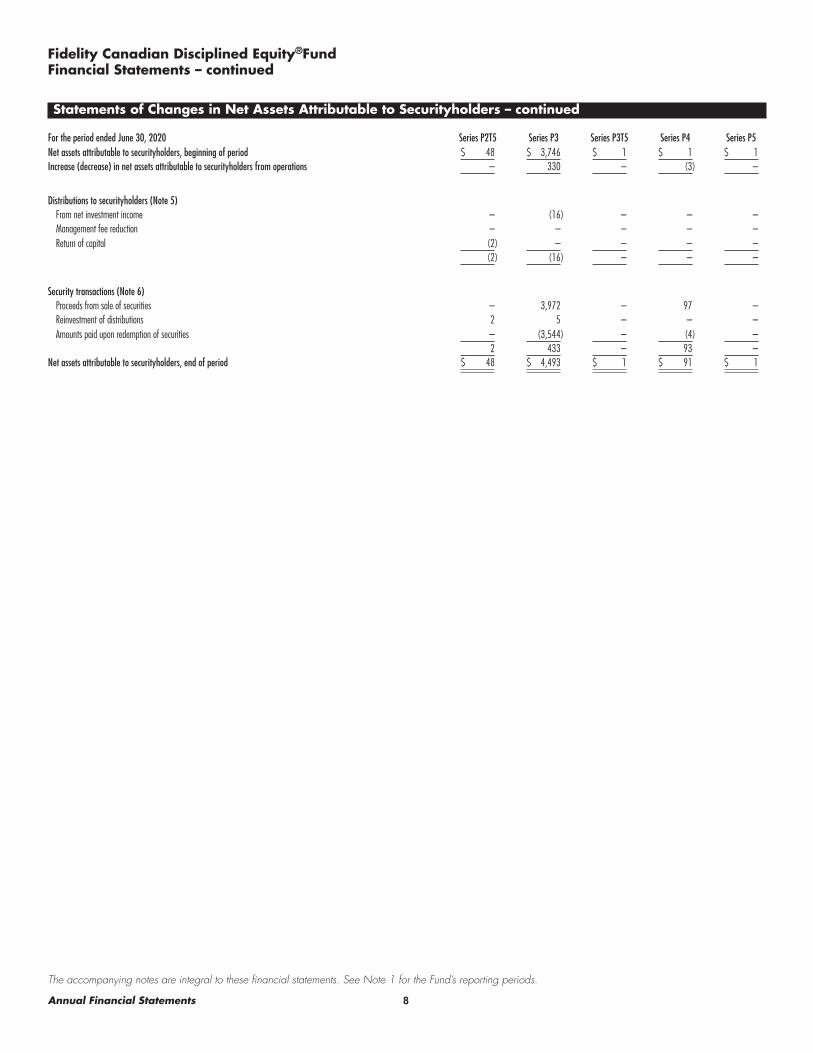
For the period ended June 30, 2020 Series P2T5 Series P3 Series P3T5 Series P4 Series P5Net assets attributable to securityholders, beginning of period $ 48 $ 3,746 $ 1 $ 1 $ 1Increase (decrease) in net assets attributable to securityholders from operations – 330 – (3) –
Distributions to securityholders (Note 5)From net investment income – (16) – – –Management fee reduction – – – – –Return of capital (2) – – – –
(2) (16) – – –
Security transactions (Note 6)Proceeds from sale of securities – 3,972 – 97 –Reinvestment of distributions 2 5 – – –Amounts paid upon redemption of securities – (3,544) – (4) –
2 433 – 93 –Net assets attributable to securityholders, end of period $ 48 $ 4,493 $ 1 $ 91 $ 1
8

Annual Financial Statements
Fidelity Canadian Disciplined Equity®Fund
The accompanying notes are integral to these fnancial statements. See Note 1 for the Fund’s reporting periods.
Financial Statements – continued
Statements of Cash Flows
Amounts in thousands of Canadian DollarsFor the periods ended June 30, 2021 2020Cash fows from (used in) operating activities: (Note 3)
Purchases of investments and derivatives $ (3,691,364) $ (2,147,035)Proceeds from sale and maturity of investments and derivatives 2,741,619 1,965,808Cash receipts from dividend income 87,874 82,905Cash receipts from interest income – 3Cash receipts from other investment income 52 71Cash paid for operating expenses (21,962) (20,251)
Net cash from (used in) operating activities (883,781) (118,499)Cash fows from (used in) fnancing activities: (Note 3)
Distributions to securityholders net of reinvestments (4,349) (1,403)Proceeds from sales of securities 1,376,015 506,172Amounts paid upon redemption of securities (489,772) (384,537)
Net cash from (used in) fnancing activities 881,894 120,232Net change in cash (1,887) 1,733Foreign exchange gain (loss) on cash 13 (13)Cash, beginning of period 1,874 154Cash, end of period $ – $ 1,874
9

Annual Financial Statements
Fidelity Canadian Disciplined Equity®Fund
The accompanying notes are integral to these fnancial statements. See Note 1 for the Fund’s reporting periods.
Schedule of Investments June 30, 2021Showing Percentage of Net Assets Attributable to Securityholders (Net Assets)
Equities – 97.8%Shares / Units Cost
(000s)Market Value
(000s)
Bermuda – 0.9%UTILITIES – 0.9%Brookfeld Renewable Partners LP 933,562 $ 35,337 $ 44,718
Canada – 90.6%COMMUNICATION SERVICES – 2.3%Cogeco Communications, Inc. 145 12 18Rogers Communications, Inc. Class B (non‑vtg.) 1,665,419 95,060 109,751Score Media & Gaming, Inc. 206,653 6,817 5,137TOTAL COMMUNICATION SERVICES 101,889 114,906CONSUMER DISCRETIONARY – 5.4%Canadian Tire Ltd. Class A (non‑vtg.) 341,298 50,562 66,949Dollarama, Inc. 2,485,806 113,191 141,045Linamar Corp. 382,077 27,945 29,706MTY Food Group, Inc. 573,323 22,937 31,286Recipe Unlimited Corp. 306,977 5,164 6,523TOTAL CONSUMER DISCRETIONARY 219,799 275,509CONSUMER STAPLES – 3.7%Alimentation Couche‑Tard, Inc. Class B (sub. vtg.) 3,222,116 66,055 146,767Empire Co. Ltd. Class A (non‑vtg.) 1,012,021 33,705 39,570Pet Valu Holdings Ltd. 122,081 2,442 3,264TOTAL CONSUMER STAPLES 102,202 189,601ENERGY – 12.2%ARC Resources Ltd. 3,227,890 25,761 34,054Canadian Natural Resources Ltd. 1,900,350 74,086 85,516Cenovus Energy, Inc. (Canada) 10,595,356 105,028 125,661Enbridge, Inc. 742,262 33,799 36,838Enerfex Ltd. 1,150,651 9,363 9,654Parex Resources, Inc. 633,904 14,474 13,122Parkland Corp. 1,212,701 41,968 48,581Pembina Pipeline Corp. 1,703,102 70,560 67,085Secure Energy Services, Inc. 352,197 1,478 1,483Suncor Energy, Inc. 1,249,439 38,613 37,096TC Energy Corp. 2,004,618 118,319 122,963Tourmaline Oil Corp. 1,145,591 28,639 40,588TOTAL ENERGY 562,088 622,641FINANCIALS – 29.7%Bank of Nova Scotia 2,694,265 190,249 217,212Brookfeld Asset Management Reinsurance Partners Ltd. 20,863 1,412 1,367Brookfeld Asset Management, Inc. (Canada) Class A 2,868,524 91,024 181,405Canadian Imperial Bank of Commerce 774,642 107,403 109,310iA Financial Corp, Inc. 585,578 40,940 39,521Intact Financial Corp. 127,861 18,354 21,533Manulife Financial Corp. 2,142,305 46,766 52,272National Bank of Canada 229,082 16,840 21,252Power Corp. of Canada (sub. vtg.) 1,443,274 55,766 56,547Royal Bank of Canada 3,261,652 277,165 409,630Sun Life Financial, Inc. 1,965,463 102,168 125,632Taiga Motors Corp. (a) 148,239 2,224 1,185The Toronto‑Dominion Bank 2,570,720 144,481 223,318Think Research Corp. 1,300,000 6,045 2,730TMX Group Ltd. 375,209 22,750 49,130TOTAL FINANCIALS 1,123,587 1,512,044HEALTH CARE – 1.2%Aurinia Pharmaceuticals, Inc. (Canada) 181,380 3,389 2,914
Shares / Units Cost
(000s)Market Value
(000s)
Bausch Health Cos., Inc. (Canada) 712,308 $ 20,389 $ 25,914Columbia Care, Inc. 2,575,100 22,497 14,910Curaleaf Holdings, Inc. 1,009,466 18,241 17,635MindBeacon Holdings, Inc. 132,100 1,057 616TOTAL HEALTH CARE 65,573 61,989INDUSTRIALS – 10.1%Canadian National Railway Co. 417,064 38,078 54,548Canadian Pacifc Railway Ltd. 2,288,574 135,695 218,147Lifeworks, Inc. 768,244 23,098 25,675SNC‑Lavalin Group, Inc. 1,073,639 30,910 34,625TFI International, Inc. (Canada) 495,376 45,857 56,062Thomson Reuters Corp. 1,036,995 88,050 127,685TOTAL INDUSTRIALS 361,688 516,742INFORMATION TECHNOLOGY – 9.5%CGI, Inc. Class A (sub. vtg.) 744,465 46,762 83,670Constellation Software, Inc. 38,077 34,772 71,486Docebo, Inc. 573,804 20,270 42,094Dye & Durham Ltd. 777,527 21,153 37,034Kinaxis, Inc. 234,131 25,929 38,180Nuvei Corp. (b) 275,773 16,833 27,980Shopify, Inc. Class A 83,670 26,074 151,683Softchoice Corp. 506,113 10,198 11,129TELUS International, Inc. 517,040 19,214 19,906TOTAL INFORMATION TECHNOLOGY 221,205 483,162MATERIALS – 11.5%Agnico Eagle Mines Ltd. (Canada) 537,365 55,605 40,281Barrick Gold Corp. (Canada) 93,167 2,258 2,389ERO Copper Corp. 1,058,537 24,430 27,533Franco‑Nevada Corp. 886,421 147,878 159,458Ivanhoe Mines Ltd. 2,833,927 12,304 25,364K92 Mining, Inc. 8,063,797 61,373 72,252Marathon Gold Corp. 1,148,091 3,744 3,697Methanex Corp. 1,318,842 57,679 54,191Nutrien Ltd. 1,264,386 93,320 94,968West Fraser Timber Co. Ltd. 511,044 33,366 45,478Wheaton Precious Metals Corp. 1,063,935 54,771 58,133TOTAL MATERIALS 546,728 583,744REAL ESTATE – 2.8%Colliers International Group, Inc. 290,248 32,251 40,292First Capital (REIT) unit 2,124,519 33,765 37,392Granite Real Estate Investment Trust 289,095 22,225 23,845Summit Industrial Income REIT 1,215,731 19,167 21,604Tricon Capital Group, Inc. 1,422,428 18,928 20,284TOTAL REAL ESTATE 126,336 143,417UTILITIES – 2.2%Brookfeld Renewable Corp. 274,932 12,519 14,318Fortis, Inc. 1,814,867 86,908 99,582TOTAL UTILITIES 99,427 113,900
TOTAL CANADA 3,530,522 4,617,655
Cayman Islands – 0.2%MATERIALS – 0.2%Ivanhoe Capital Acquisition Corp. unit 897,400 11,375 11,970
10

Annual Financial Statements
Fidelity Canadian Disciplined Equity®Fund
The accompanying notes are integral to these fnancial statements. See Note 1 for the Fund’s reporting periods.
Schedule of Investments – continued
Equities – continuedShares / Units Cost
(000s)Market Value
(000s)
United Kingdom – 0.4%MATERIALS – 0.4%Endeavour Mining PLC 722,315 $ 21,071 $ 19,228
United States of America – 5.7%CONSUMER DISCRETIONARY – 1.1%Tempur Sealy International, Inc. 1,126,500 48,924 54,725FINANCIALS – 1.7%Morgan Stanley 105,015 7,971 11,936Wells Fargo & Co. 1,288,624 68,057 72,345TOTAL FINANCIALS 76,028 84,281INDUSTRIALS – 1.3%Allison Transmission Holdings, Inc. 702,694 36,100 34,616Norfolk Southern Corp. 90,026 21,177 29,619TOTAL INDUSTRIALS 57,277 64,235INFORMATION TECHNOLOGY – 0.8%Salesforce.com, Inc. 133,591 33,437 40,451SentinelOne, Inc. 28,203 1,224 1,224TOTAL INFORMATION TECHNOLOGY 34,661 41,675MATERIALS – 0.2%Farmers Business Network, Inc. (a) 257,400 7,980 10,547UTILITIES – 0.6%NextEra Energy, Inc. 355,710 32,155 32,312
TOTAL UNITED STATES OF AMERICA 257,025 287,775TOTAL EQUITIES 3,855,330 4,981,346
Underlying Funds – 2.0%Shares / Units
(000s)
Fidelity Canadian Money Market Investment Trust ‑ Series O 10,211 102,111 102,111TOTAL INVESTMENT IN SECURITIES – 99.8% $3,957,441 5,083,457
NET OTHER ASSETS (LIABILITIES) – 0.2% 11,367NET ASSETS – 100% $ 5,094,824
Presentation Notes Cost amount includes broker commissions and other trading expenses, if any.
Legend(a) Private and/or restricted.
(b) Security exempt from registration under Rule 144A of the U.S. Securities Act of 1933. These securities may be resold in transactions exempt from registration, normally to qualifed institutional buyers. At the end of the period, the value of these securities amounted to $27,980,000 or 0.5% of Net Assets.
11
Annual Financial Statements
Fidelity Canadian Disciplined Equity®Fund
Fund Specifc Notes to Financial StatementsFor the periods ended June 30, 2021 and 2020(Amounts in thousands of Canadian dollars/thousands of securities unless otherwise stated)
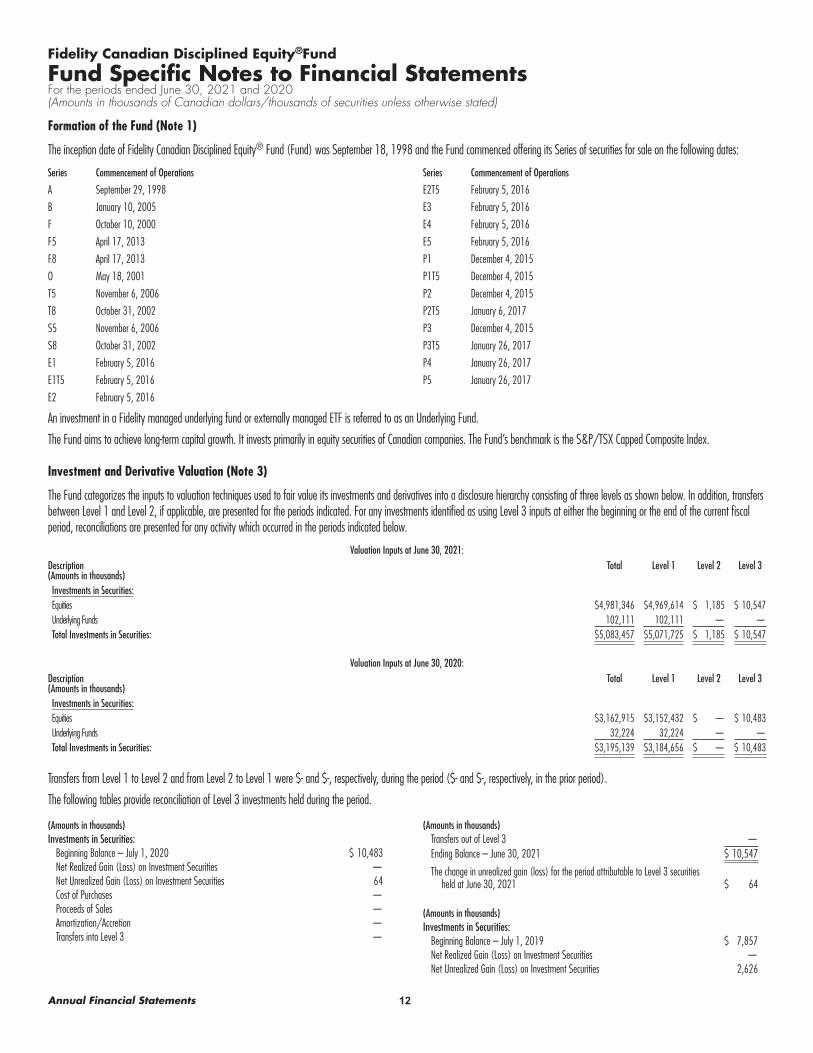
Formation of the Fund (Note 1)
The inception date of Fidelity Canadian Disciplined Equity® Fund (Fund) was September 18, 1998 and the Fund commenced offering its Series of securities for sale on the following dates:
Series Commencement of Operations
A September 29, 1998
B January 10, 2005
F October 10, 2000
F5 April 17, 2013
F8 April 17, 2013
O May 18, 2001
T5 November 6, 2006
T8 October 31, 2002
S5 November 6, 2006
S8 October 31, 2002
E1 February 5, 2016
E1T5 February 5, 2016
E2 February 5, 2016
Series Commencement of Operations
E2T5 February 5, 2016
E3 February 5, 2016
E4 February 5, 2016
E5 February 5, 2016
P1 December 4, 2015
P1T5 December 4, 2015
P2 December 4, 2015
P2T5 January 6, 2017
P3 December 4, 2015
P3T5 January 26, 2017
P4 January 26, 2017
P5 January 26, 2017
An investment in a Fidelity managed underlying fund or externally managed ETF is referred to as an Underlying Fund.
The Fund aims to achieve long‑term capital growth. It invests primarily in equity securities of Canadian companies. The Fund’s benchmark is the S&P/TSX Capped Composite Index.
Investment and Derivative Valuation (Note 3)
The Fund categorizes the inputs to valuation techniques used to fair value its investments and derivatives into a disclosure hierarchy consisting of three levels as shown below. In addition, transfers between Level 1 and Level 2, if applicable, are presented for the periods indicated. For any investments identifed as using Level 3 inputs at either the beginning or the end of the current fscal period, reconciliations are presented for any activity which occurred in the periods indicated below.
Valuation Inputs at June 30, 2021:Description Total Level 1 Level 2 Level 3(Amounts in thousands)Investments in Securities:Equities $ 4,981,346 $ 4,969,614 $ 1,185 $ 10,547Underlying Funds 102,111 102,111 — —Total Investments in Securities: $ 5,083,457 $ 5,071,725 $ 1,185 $ 10,547
Valuation Inputs at June 30, 2020:Description Total Level 1 Level 2 Level 3(Amounts in thousands)Investments in Securities:Equities $ 3,162,915 $ 3,152,432 $ — $ 10,483Underlying Funds 32,224 32,224 — —Total Investments in Securities: $ 3,195,139 $ 3,184,656 $ — $ 10,483
Transfers from Level 1 to Level 2 and from Level 2 to Level 1 were $‑ and $‑, respectively, during the period ($‑ and $‑, respectively, in the prior period).
The following tables provide reconciliation of Level 3 investments held during the period.
(Amounts in thousands)Investments in Securities:
Beginning Balance – July 1, 2020 $ 10,483Net Realized Gain (Loss) on Investment Securities —Net Unrealized Gain (Loss) on Investment Securities 64Cost of Purchases —Proceeds of Sales —Amortization/Accretion —Transfers into Level 3 —
(Amounts in thousands)Transfers out of Level 3 —Ending Balance – June 30, 2021 $ 10,547
The change in unrealized gain (loss) for the period attributable to Level 3 securities held at June 30, 2021 $ 64
(Amounts in thousands)Investments in Securities:
Beginning Balance – July 1, 2019 $ 7,857Net Realized Gain (Loss) on Investment Securities —Net Unrealized Gain (Loss) on Investment Securities 2,626
12
Annual Financial Statements
Fidelity Canadian Disciplined Equity®FundFund Specifc Notes to Financial Statements – continuedFor the periods ended June 30, 2021 and 2020(Amounts in thousands of Canadian dollars/thousands of securities unless otherwise stated)
(Amounts in thousands)Cost of Purchases —Proceeds of Sales —Amortization/Accretion —Transfers into Level 3 —
(Amounts in thousands)Transfers out of Level 3 —Ending Balance – June 30, 2020 $ 10,483
The change in unrealized gain (loss) for the period attributable to Level 3 securities held at June 30, 2020 $ 2,626
The Fund did not hold any signifcant positions of Level 3 investments at the beginning of, or end of, the period.
Securities Lending (Note 3)
The following tables reconcile the gross amount of income generated from the Fund’s securities lending transactions to what is retained by the Fund and reported under “Security lending” in the Statements of Comprehensive Income (Loss).
Period ended Total Income Earned ($) Fund Income Earned ($) SSB Income Earned ($)Fund % of Total Income
EarnedSSB % of Total Income
EarnedJune 30, 2021 61 52 9 85 15June 30, 2020 83 71 12 85 15
The Fund’s aggregate values of the securities loaned and the collateral received were as follows:
Fair value of securities on loan ($) Fair value of Collateral ($)
June 30, 2021 21,171 22,658June 30, 2020 – –
Management and Advisory Fee (Note 4)
Fidelity provides investment advice with respect to the Fund’s investment portfolio and arranges for the acquisition and disposition of portfolio investments, including all necessary brokerage arrangements. Prior to January 1, 2021, Fidelity had entered into a sub‑advisory agreement with Fidelity (Canada) Asset Management ULC to provide investment advice with respect to all or a portion of the investments of the Fund and arranged for the acquisition and disposition of portfolio investments, including all necessary brokerage arrangements. Effective January 1, 2021, Fidelity (Canada) Asset Management ULC amalgamated with Fidelity. The name of the amalgamated entity is Fidelity Investments Canada ULC. The amalgamation did not result in any change to the day‑to‑day business, operations, management or control of Fidelity or the Fund. The annual management fee rates for each Series were as follows:
Rate (%)Series A 2.000Series B 1.850Series F .850Series F5 .850Series F8 .850Series T5 2.000Series T8 2.000Series S5 1.850Series S8 1.850Series E1 1.825Series E1T5 1.825Series E2 1.800
Rate (%)Series E2T5 1.800Series E3 1.775Series E4 1.725Series E5 1.675Series P1 .825Series P1T5 .825Series P2 .800Series P2T5 .800Series P3 .775Series P3T5 .775Series P4 .725Series P5 .675
Administration Fee (Note 4)
The annual rate of the administration fee will fall under one of three tiers, depending on the net asset value of the Fund: Under $100 Million (Tier 1), $100 Million to $1 Billion (Tier 2) and Over $1 Billion (Tier 3). The administration fee of each Series is as follows:
Tier 1 (%) Tier 2 (%) Tier 3 (%)Series A 0.25 0.24 0.23Series B 0.225 0.215 0.205Series F 0.175 0.165 0.155Series F5 0.175 0.165 0.155Series F8 0.175 0.165 0.155Series T5 0.25 0.24 0.23
Tier 1 (%) Tier 2 (%) Tier 3 (%)Series T8 0.25 0.24 0.23Series S5 0.225 0.215 0.205Series S8 0.225 0.215 0.205Series E1 0.2 0.19 0.18Series E1T5 0.2 0.19 0.18Series E2 0.175 0.165 0.155
13
Annual Financial Statements
Fidelity Canadian Disciplined Equity®FundFund Specifc Notes to Financial Statements – continuedFor the periods ended June 30, 2021 and 2020(Amounts in thousands of Canadian dollars/thousands of securities unless otherwise stated)
Tier 1 (%) Tier 2 (%) Tier 3 (%)Series E2T5 0.175 0.165 0.155Series E3 0.15 0.14 0.13Series E4 0.15 0.14 0.13Series E5 0.125 0.115 0.105Series P1 0.15 0.14 0.13Series P1T5 0.15 0.14 0.13
Tier 1 (%) Tier 2 (%) Tier 3 (%)Series P2 0.125 0.115 0.105Series P2T5 0.125 0.115 0.105Series P3 0.1 0.09 0.08Series P3T5 0.1 0.09 0.08Series P4 0.1 0.09 0.08Series P5 0.075 0.065 0.055
Commissions and Other Portfolio Costs (Note 4)
The Fund paid commissions and other portfolio costs of $‑ (June 30, 2020: $‑) to brokerage frms that are affliates of Fidelity. In addition, the Fund paid $1,033 (June 30, 2020: $465) for research.
Taxation and Distributions (Note 5)
The Fund qualifes as a mutual fund trust under the provisions of the Income Tax Act (Canada).
As at the last taxation year‑end, the Fund had no capital losses and no non‑capital losses available to be carried forward.
Security Transactions and Affliated Ownership (Notes 3 and 6)
Security Transactions - Security transactions and weighted average securities for each Series were as follows:
Securities Outstanding, Beginning of Period Issued Reinvested Redeemed
Securities Outstanding, End of Period Weighted Average Securities
Period ended June 30, 2021Series A 888 96 30 (296) 718 803Series B 11,973 753 439 (2,379) 10,786 11,379Series F 1,969 757 75 (608) 2,193 2,056Series F5 26 43 1 (18) 52 33Series F8 41 3 2 – 46 44Series O 45,414 22,012 3,103 (6,269) 64,260 50,332Series T5 44 3 2 (37) 12 29Series T8 64 9 3 (43) 33 46Series S5 126 21 7 (38) 116 116Series S8 1,113 47 72 (190) 1,042 1,069Series E1 9,142 2,598 352 (2,200) 9,892 9,351Series E1T5 36 30 3 (4) 65 49Series E2 1,427 841 60 (302) 2,026 1,681Series E2T5 1 – – – 1 1Series E3 266 141 13 (124) 296 305Series E4 272 6 11 (31) 258 262Series E5 – – – – – –Series P1 2,091 1,152 84 (752) 2,575 2,267Series P1T5 37 17 4 (3) 55 45Series P2 359 407 17 (182) 601 461Series P2T5 3 – – (3) – 1Series P3 369 41 21 (75) 356 373Series P3T5 – – – – – –Series P4 8 59 – (9) 58 29Series P5 – – – – – –Period ended June 30, 2020Series A 1,064 140 – (316) 888 980Series B 13,617 814 1 (2,459) 11,973 12,720Series F 1,951 695 4 (681) 1,969 1,964Series F5 30 3 – (7) 26 29Series F8 39 10 – (8) 41 39Series O 40,848 8,713 597 (4,744) 45,414 43,348Series T5 48 – 1 (5) 44 47Series T8 97 3 2 (38) 64 81Series S5 137 11 2 (24) 126 131
14
Annual Financial Statements
Fidelity Canadian Disciplined Equity®FundFund Specifc Notes to Financial Statements – continuedFor the periods ended June 30, 2021 and 2020(Amounts in thousands of Canadian dollars/thousands of securities unless otherwise stated)
Securities Outstanding, Beginning of Period Issued Reinvested Redeemed
Securities Outstanding, End of Period Weighted Average Securities
Series S8 1,216 35 31 (169) 1,113 1,156Series E1 8,758 2,247 – (1,863) 9,142 9,045Series E1T5 33 6 1 (4) 36 35Series E2 1,392 610 – (575) 1,427 1,473Series E2T5 2 – – (1) 1 1Series E3 356 107 – (197) 266 324Series E4 210 66 – (4) 272 238Series E5 – – – – – –Series P1 1,771 806 4 (490) 2,091 1,966Series P1T5 35 – 2 – 37 36Series P2 459 111 2 (213) 359 408Series P2T5 2 – 1 – 3 3Series P3 312 346 – (289) 369 371Series P3T5 – – – – – –Series P4 – 8 – – 8 4Series P5 – – – – – –
Affliated Ownership – As at June 30, 2021, Fidelity and its affliates held approximately 67% of the Fund. As at June 30, 2020, Fidelity and its affliates held approximately 56% of the Fund.
Financial Instrument Risk (Note 7)
Credit Risk – Other than outlined in Note 3 in the Notes to Financial Statements, there were no signifcant concentrations of credit risk to counterparties as at each reporting period end.
Concentration Risk – Refer to the Derivative Exposure, Geographic Mix, Sector Mix, Asset Mix and Market Capitalization tables, as applicable, in the “Summary of Investment Portfolio” of the Fund’s Annual Management Report of Fund Performance as at June 30, 2021, which summarize the investment concentration risks that are relevant for the Fund.
Other Price Risk – If the benchmark had increased or decreased by 5% on June 30, 2021 and on June 30, 2020, with all other variables held constant, the net assets attributable to securi‑tyholders of the Fund would have increased or decreased by approximately $233,839 (June 30, 2020: $146,976). This change is estimated using the Fund’s beta which is calculated based on the historical correlation between the return of the Fund as compared to the return of the benchmark. In practice, the actual trading results may differ from this sensitivity analysis and the difference could be material.
Interest Rate Risk – The majority of the Fund’s fnancial instrument exposure is non‑interest bearing. As a result, the Fund is not subject to signifcant amounts of risk due to fuctuations in the prevailing levels of market interest rates.
Currency Risk – As at June 30, 2021 and June 30, 2020, the majority of the Fund’s monetary assets and liabilities are denominated in Canadian dollars. As a result, the Fund is not subject to signifcant amounts of currency risk.
Investment in Structured Entities (Note 8)
The following tables present additional information that is relevant to the Fund’s investment in Fidelity managed underlying funds.
June 30, 2021 Total Net Assets ($) Fair Value of Investment ($)Fidelity Canadian Money Market Investment Trust 2,734,017 102,111
June 30, 2020 Total Net Assets ($) Fair Value of Investment ($)Fidelity Canadian Money Market Investment Trust 1,674,616 32,224
Names presented in the tables refect names in effect as at the dates shown.
15
Annual Financial Statements
Notes to Financial StatementsFor the periods ended June 30, 2021 and 2020(Amounts in thousands of Canadian dollars unless otherwise stated)
1. Formation of the Funds
The Fidelity Funds (collectively the Funds), are open end investment trusts formed under the laws of Ontario and governed by a Master Declaration of Trust, as amended from time to time. The Funds are authorized to issue an unlimited number of securities. Fidelity Investments Canada ULC (Fidelity), as manager and trustee of the Funds (Manager), is responsible for the day-to-day operations and provides all general management and administrative services. Fidelity, as also the investment advisor, is responsible for the investment management of the Funds’ portfolios. The registered offce of the Funds is located at 483 Bay Street, Suite 300, Toronto, Ontario, M5G 2N7.
Currently, Fidelity mutual funds are offered in the following Series:
Series A, C, T5 and T8 securities are available to all investors in a deferred sales charge (DSC) option. Series A, T5 and T8 securities will be converted to lower management and advisory fee Series B, S5 and S8 securities, respectively, one year after completion of their redemption schedule. Series B, D, S5 and S8 securities are available to all investors in an initial sales charge (ISC) option. Series C and D securities are available to investors who have enrolled in the rebalancing service. Series F, F5 and F8 securities are usually only available to investors who have fee–based accounts with dealers who have signed an eligibility agreement with Fidelity. Series E1, E1T5, E2, E2T5, E3, E3T5, E4, E4T5, E5 and E5T5 (collectively “Series E”) securities are available only to investors who initially hold Series B and/or S5 securities and then become eligible to hold certain Series E securities. Series P1, P1T5, P2, P2T5, P3, P3T5, P4, P4T5, P5 and P5T5 (collectively “Series P”) securities are available only to investors who initially hold Series F and/or F5 securities and then become eligible to hold certain Series P securities. Series O securities are only available to: (i) institutional investors who may be individuals or fnancial institutions who have been approved by Fidelity and have entered into Series O fund purchase agreements with Fidelity; or (ii) other funds and accounts managed or advised by Fidelity. Series Q securities are only available to dealers that, on behalf of their clients who have granted them discretionary investment authority, use proprietary model portfolios or similar investment products. Dealers that want to purchase Series Q for their clients must enter into an appropriate eligibility agreement with Fidelity. Series I, I5 and I8 securities are available to all investors who have entered into a Series I Agreement with Fidelity and are available to all investors in an initial sales charge (ISC) option.
In addition, Series F5, F8, I5, I8, T5, T8, S5, S8, E1T5, E2T5, E3T5, E4T5, E5T5, P1T5, P2T5, P3T5, P4T5 and P5T5 securities distribute an amount comprised of net income and/or return of capital monthly, if available.
Each Fund meets the defnition of an investment entity as its purpose is to invest its net assets for capital growth and/or investment income for the beneft of its securityholders, and its invest-ment performance is measured on a fair value basis.
The Statements of Financial Position are as at June 30, 2021 and June 30, 2020, as applicable, and the Statements of Comprehensive Income (Loss), Changes in Net Assets Attributable to Securityholders and Cash Flows are for the years or periods ended June 30, 2021 and June 30, 2020, as applicable. For newly created Funds in either the current or prior period, the informa-tion presented is for the period from the Fund’s inception date to June 30, 2021 or June 30, 2020, as applicable. Each Fund’s inception date is disclosed in the Fund Specifc Notes to Financial Statements. The Schedule of Investments for each of the Funds is as at June 30, 2021. Throughout this document, reference to the periods refers to the reporting periods described above.
2. Basis of Accounting
Statement of Compliance – These fnancial statements have been prepared in accordance with International Financial Reporting Standards (IFRS) as issued by the International Accounting Standards Board (IASB). The accounting policies set out below have been applied consistently unless otherwise stated.
The fnancial statements were authorized for issue by Fidelity’s board of directors on September 8, 2021.
Functional and Presentation Currency – These fnancial statements are presented in Canadian dollars, which is each Fund’s functional currency; except for Fidelity U.S. Money Market Fund and Fidelity U.S. Money Market Investment Trust, which are presented in U.S. dollars.
Fund Specifc Notes to Financial Statements – Each Fund presents fnancial disclosure information that is relevant to its fnancial statements in its Fund Specifc Notes to Financial Statements. These disclosures can be found immediately following a Fund’s Schedule of Investments and are to be read in conjunction with these Notes to Financial Statements.
3. Summary of Signifcant Accounting Policies
Basis of Measurement – These fnancial statements have been prepared on the historical cost basis except for investments and derivatives which are measured at fair value in the Statements of Financial Position.
Use of Estimates and Judgments – Under IFRS, management is required to make certain estimates and judgments at the date of the fnancial statements. The principal fnancial statement components subject to signifcant accounting estimates and judgments include:
Fair value measurements – A Fund may invest in fnancial instruments that are not quoted in an active market. Where applicable, these instruments are categorized in Level 2 and Level 3 of the fair value hierarchy explained below. When current market prices or quotations are not readily available or reliable, valuation techniques will be applied in good faith and in accordance with procedures adopted by the Manager. Factors used in determining fair value may include, but are not limited to, broker quotes from reputable pricing sources, market or security specifc events, changes in interest rates and credit quality. Fair value models use observable data, to the extent practical; however, the Manager is required from time to time to make estimates and assumptions that are based on the best information available at that particular time. Changes in these estimates could impact the fair values of the fnancial instruments, and the impact could be material.
Classifcation and measurement of fnancial instruments – Fidelity has made signifcant judgments when determining the classifcation and measurement of a Fund’s fnancial instruments under IFRS 9 – Financial Instruments (IFRS 9). These judgments centre upon a cash fow characteristic and business model analysis. This analysis results in a Fund’s fnancial assets being measured at fair value through proft or loss due to factors including performance evaluation and management of a Fund on a fair value basis.
16

Annual Financial Statements
Notes to Financial Statements – continuedFor the periods ended June 30, 2021 and 2020(Amounts in thousands of Canadian dollars unless otherwise stated)
Presentation of fnancial instruments – Fidelity has made signifcant judgments when determining the classifcation of a Fund’s redeemable securities as fnancial liabilities in accordance with IAS 32 – Financial Instruments – Presentation (IAS 32).
These judgments centre upon the determination that a Fund’s redeemable securities do not have identical features where they are offered in multiple series, and their entitlements include a contractual obligation to distribute any net income and net realized capital gains at least annually in cash (at the request of the securityholder). Therefore, the ongoing redemption feature is not the securities’ only contractual obligation.
Determination of Relationship with Fidelity Managed Underlying Funds – Fidelity has made signifcant judgments when determining the ability of a Fund to control or signifcantly infuence a Fidelity managed underlying fund in accordance with IFRS 10 – Consolidated fnancial statements (IFRS 10) and IAS 28 – Investment in associates and joint ventures (IAS 28). In both determi-nations, Fidelity looks at the relevant activities such as voting rights, participation in policy choices and material cash fows such as subscription and redemption proceeds. Fidelity has determined that a Fund does not have the ability to control nor exercise signifcant infuence on any Fidelity managed underlying fund due to the Fund’s inability to exercise its voting rights and direct or participate in the fnancial and operating policy decisions.
Investment and Derivative Valuation – Investments, including derivatives, are categorized at fair value through proft or loss in accordance with IFRS 9 and measured at fair value.
Each Fund categorizes the inputs to valuation techniques used to fair value its investments and derivatives into a disclosure hierarchy consisting of three levels as shown below:
Level 1 – quoted prices in active markets for identical investments
Level 2 – other signifcant observable inputs (including quoted prices for similar investments, interest rates, prepayment speeds, etc.)
Level 3 – unobservable inputs (including the Fund’s own assumptions based on the best information available)
Changes in valuation techniques may result in transfers in or out of an assigned level within the disclosure hierarchy. Transfers between any levels are assumed to have occurred at the beginning of the period. Transfers between Level 1 and Level 2 are primarily attributable to the valuation technique used for foreign equity securities. Transfers into Level 3 are attributable to a lack of observable market data resulting from decreases in market activity, decreases in liquidity, security restructurings or corporate actions. Transfers out of Level 3 are attributable to observable market data becoming available for those securities.
Valuation techniques used to value a Fund’s investments and derivatives by major category are as follows:
Equity securities, including restricted equity securities and Exchange-traded funds (ETFs) for which market quotations are readily available, are valued at the last sales price or offcial closing price as reported by an independent pricing service on the primary market or exchange on which they are traded and are categorized as Level 1 in the hierarchy. In the event that the last sales price or offcial closing price is not readily available, or is outside the bid-ask spread, the point within the bid–ask spread that is most representative of fair value based on specifc facts and circumstances will be used. For foreign equity securities, when signifcant market or security specifc events arise, comparisons to the valuation of American Depositary Receipts (ADRs), futures contracts, ETFs and certain indexes as well as quoted prices for similar securities are used and are categorized as Level 2 in the hierarchy in these circumstances. Utilizing these techniques may result in transfers between Level 1 and Level 2. For equity securities, including restricted equity securities, where observable inputs are limited, assumptions about market activity and risk are used and these securi-ties may be categorized as Level 3 in the hierarchy.
Debt securities, including restricted debt securities, are valued based on prices received from independent pricing services or from dealers who make markets in such securities. Pricing services utilize matrix pricing which considers yield or price of bonds of comparable quality, coupon, maturity and type, prepayment speed assumptions, attributes of the collateral as well as dealer supplied prices and are generally categorized as Level 2 in the hierarchy, but may be categorized as Level 3.
Swaps are marked-to-market daily based on valuations from independent pricing services or dealer-supplied valuations and changes in value are recorded as unrealized appreciation (deprecia-tion). Pricing services utilize matrix pricing which considers comparisons to interest rate curves, credit spread curves, default possibilities and recovery rates and, as a result, swaps are generally categorized as Level 2 in the hierarchy.
When independent prices are unavailable or unreliable, debt securities and swaps may be valued utilizing pricing matrices which consider similar factors that would be used by independent pricing services. These are generally categorized as Level 2 in the hierarchy but may be Level 3 depending on the circumstances. Independent prices obtained from a single source or broker are evaluated by management and may be categorized as Level 3 in the hierarchy.
The Canadian dollar value of forward foreign currency contracts is determined using the closing foreign currency exchange rates and are categorized as Level 2 in the hierarchy. Futures contracts are valued at the settlement price established each day by the board of trade or exchange on which they are traded and are categorized as Level 1 in the hierarchy. Exchange-traded options are valued using the last sales price or, in the absence of a sale, the last offering price and are categorized as Level 1 in the hierarchy. Options traded over-the-counter are valued using dealer-supplied valuations and are categorized as Level 2 in the hierarchy.
Fidelity managed underlying funds and Fidelity managed ETFs that primarily invest in North American securities are valued at their closing net asset value per security (NAVPS) each business day. Fidelity managed ETFs that primarily invest in International securities are valued at mid pricing: average of last bid/ask price as reported by an independent pricing service based on a consolidated exchange. The consolidated exchange includes all exchanges in which the Fidelity managed ETF may be traded in which there are available daily market quotations of bid or ask. Fidelity managed underlying funds and ETFs are categorized as Level 1 in the hierarchy.
Short-term securities for which quotations are not readily available are valued at amortized cost, which approximates fair value and are categorized as Level 2 in the hierarchy.
Securities pledged as collateral or deposited to meet margin requirements follow the fair value policies outlined above and are identifed in the Schedule of Investments. In addition, these securi-ties are included in “Investments at fair value through proft or loss” in the Statements of Financial Position.
Cash – Cash, including foreign currency, is comprised of cash on deposit with the custodian.
17

Annual Financial Statements
Notes to Financial Statements – continuedFor the periods ended June 30, 2021 and 2020(Amounts in thousands of Canadian dollars unless otherwise stated)
Cash Collateral – Cash collateral is comprised of cash deposited to meet margin requirements or posted as collateral for open derivative contracts.
Impairment of Financial Assets - At each reporting date, each Fund measures the loss allowance for fnancial assets carried at amortized cost. If, at the reporting date, the credit risk has increased signifcantly since initial recognition, each Fund shall measure the loss allowance at an amount equal to the lifetime expected credit losses. If, at the reporting date, the credit risk has not increased signifcantly since initial recognition, each Fund shall measure the loss allowance at an amount equal to 12 – month expected credit losses. Signifcant fnancial diffculties and probability that the counterparty may default in payments are considered indicators that a loss allowance may be required. If the credit risk increases to the point that it is considered to be credit impaired, interest income will be calculated based on the gross carrying amount adjusted for the loss allowance.
Other Assets and Liabilities – Other assets and liabilities may include amounts due to or from the custodian, affliates or other counterparties for accrued income, investment transactions, a Fund’s security transactions, accrued expenses and other unsettled transactions at period end. These amounts are carried at amortized cost, which approximates fair value due to their short-term nature.
Offsetting Financial Instruments – Financial assets and liabilities are offset and the net amount is reported in the Statements of Financial Position when there is a legally enforceable right to offset the recognized amounts and there is an intention to settle on a net basis, or to realize the asset and settle the liability simultaneously.
Loans and Other Direct Debt Instruments – A Fund may invest in direct debt instruments which are interests in amounts owed to lenders by corporate or other borrowers. These instruments may be in the form of loans, trade claims or other receivables and may include standby fnancing commitments that obligate the Fund to supply additional cash to the borrower on demand. Loans may be acquired through assignment or participation. The Fund may be contractually obligated to receive approval from the agent bank and/or borrower prior to the sale of these loans. A Fund may also invest in unfunded loan commitments, which are contractual obligations for future funding. Information regarding unfunded commitments is included at the end of the Schedule of Investments.
Short Selling – Certain Funds may sell securities short, in which a borrowed security is sold in anticipation of a decline in the market value of that security. Short sales are classifed as fnancial liabilities at fair value through proft or loss. Gains and losses arising from changes in fair value of securities sold short, are shown in the Statements of Comprehensive Income as ‘‘Change in unrealized gain (loss)’’ and as ‘‘Net realized gain (loss)’’ when positions are closed out, where applicable. If a Fund sells a security short, it will borrow that security from a broker to complete the sale. The Fund will incur a loss as a result of a short sale if the price of the borrowed security increases between the date of the short sale and the date on which the Fund closes out its short position by buying that security. There can be no assurance that a Fund will be able to close out a short position at an acceptable time or price. Until the Fund replaces a borrowed security, it will maintain adequate margin with the broker consisting of cash and liquid securities. As at June 30, 2021, the margin maintained with the broker is noted in the Statements of Financial Position in ‘‘Deposits with brokers for securities sold short’’, if applicable.
Measurement of redeemable securities issued by the Funds – A Fund’s obligation for net assets attributable to securityholders is recorded at the redemption amount. As at June 30, 2021 and June 30, 2020, a Fund’s NAVPS may differ by less than $0.01 from its net assets attributable to securityholders per Series per security calculated in accordance with IFRS as a result of normal reporting period end procedures to close off the books and records. Any differences between NAVPS and net assets attributable to securityholders of $0.01 or more will be detailed in each fund’s Fund Specifc Notes to Financial Statements.
Investment Transactions, Income Recognition and Transaction Costs – Regular way purchases and sales of fnancial assets are recognized at their trade date. The cost of investments is determined on an average cost basis, excluding commissions and other portfolio transaction costs. Net realized gains and losses from the sale of investments (which may include proceeds received from litigation) and change in net unrealized appreciation (depreciation) on investments are calculated with reference to average cost of the related investment securities.
Interest income includes coupon interest and accretion of discount and amortization of premium on debt securities using the effective interest rate. This is the rate that exactly discounts the estimated future cash receipts through the expected life of the relevant debt securities, to their net carrying amounts. The principal value on infation-indexed securities is periodically adjusted to the rate of infation and interest is accrued based on the principal value. The adjustments to principal due to infation are refected as increases or decreases to interest income even though the principal is not received until maturity. Debt obligations may be placed on non-accrual status and related interest income may be reduced by ceasing current accruals and writing off interest receivables when the collection of all or a portion of interest has become doubtful based on consistently applied procedures. A debt obligation is removed from non-accrual status when the issuer resumes interest payments or when collectability of interest is reasonably assured. Dividend income, including income received from ETFs, is recognized on the ex-dividend date except for certain dividends from foreign securities where the ex-dividend date may have passed, which are recorded as soon as the ex-dividend date is known to Fidelity. Distributions received from investment trusts, including Fidelity managed underlying funds, are recorded as income, capital gains or a return of capital based on the best information available. Due to the nature of these investments, actual allocations could vary from this information. Distributions from investment trusts treated as a return of capital reduce the average cost of the underlying investment trusts. Where applicable, interest and dividends on investments sold short are accrued as expensed and are reported as a liability in the Statements of Financial Position in ‘‘Payable for interest and dividends on securities sold short’’ and in the Statements of Comprehensive Income (Loss) in ‘‘Dividend and interest expense on securities sold short’’.
Transaction costs, such as brokerage commissions, incurred in the purchase and sale of investment securities by a Fund are recognized as “Commissions and other portfolio costs” in the Statements of Comprehensive Income (Loss).
Foreign Currency Translation – Securities and other assets and liabilities denominated in a foreign currency are translated into the functional currency of a Fund at the period-end exchange rates. Purchases and sales of securities, income and expenses denominated in foreign currencies are translated into the functional currency at the exchange rate on the date of the respective transaction. The effects of exchange rate fuctuations on investments are included in the “Net realized gain (loss) on investments” and “Change in net unrealized appreciation (depreciation) on investments” and exchange rate fuctuations on other foreign currency transactions are included in the “Net realized gain (loss) on foreign currency transactions” and “Change in net unrealized appreciation (depreciation) on other net assets in foreign currencies” in the Statements of Comprehensive Income (Loss).
Reverse Repurchase Agreements – Uninvested cash balances may be transferred into one or more joint trading accounts with other Fidelity managed funds, where these balances are invested in reverse repurchase transactions. In reverse repurchase transactions, U.S. or Canadian Government securities are purchased from a counterparty who agrees to repurchase the securities at a
18

Annual Financial Statements
Notes to Financial Statements – continuedFor the periods ended June 30, 2021 and 2020(Amounts in thousands of Canadian dollars unless otherwise stated)
higher price at a specifed future date. The difference in price is reported as interest income. Credit risk arises from the potential for a counterparty to default on its obligation to repurchase the security. The risk is managed by the use of counterparties acceptable to Fidelity and by the receipt of the securities as collateral. The value of the collateral must be at least 102% of the daily fair value of the cash invested. Any reverse repurchase agreements open at period end are included in the Schedule of Investments. The Funds may have exposure to reverse repurchase agreements through their investment in the following Fidelity managed underlying funds: Fidelity Canadian Money Market Investment Trust or Fidelity U.S. Money Market Investment Trust.
The following tables summarize the securities pledged as collateral for any Fund investing in Canadian dollar reverse repurchase transactions:
June 30, 2021 Collateral Description Interest Rate (%) Maturity Date % of Collateral
Collateral Value as a % of CAD Cash Invested
Canadian Treasury Bonds 0.25 – 3.00 08/01/2023-12/01/2036 73.0Canadian Provincial Bonds 3.50 12/01/2048 27.0
100.0 102.3
June 30, 2020 Collateral Description Interest Rate (%) Maturity Date % of Collateral
Collateral Value as a % of CAD Cash Invested
Canadian Treasury Bills n/a 04/22/2021 19.8Canadian Treasury Bonds 2.00 – 4.25 11/01/2020 – 12/01/2036 60.3Canadian Provincial Bonds 2.90 12/02/2046 19.9
100.0 105.5
Securities Lending - A Fund may lend portfolio securities from time to time in order to earn additional income. Each Fund has entered into a securities lending program with State Street Bank and Trust Company (SSB) to act as its Securities Lending agent.
The aggregate market value of all securities loaned under securities lending transactions or sold in repurchase transactions cannot exceed 50% of the net asset value of a Fund. SSB is entitled to receive payments out of the gross amount generated from the securities lending transactions of a Fund and bear all operational costs directly related to securities lending as well as the cost of borrower default indemnifcation. A Fund receives collateral (in the form of obligations of, or guaranteed by, the Government of Canada, or a province thereof, or by the United States government or its agencies) against the loaned securities and maintains collateral in an amount of at least 105% of the market value of the loaned securities during the period of the loan. The market value of the loaned securities is determined daily at the close of business of the Fund and any additional required collateral is delivered to the Fund on the next business day.
Forward Foreign Currency Contracts – A Fund may use forward foreign currency contracts to facilitate transactions in foreign-denominated securities and to manage its currency exposure. Contracts to sell generally are used to mitigate the risk of the Fund’s investments against currency fuctuations, while contracts to buy generally are used to offset a previous contract to sell. Also, a contract to buy can be used to acquire exposure to foreign currencies and a contract to sell can be used to offset a previous contract to buy. These contracts involve market risk in excess of the unrealized gain or loss refected in the Statements of Financial Position. Fidelity monitors the credit rating of each counterparty with which it does business. All counterparties have a credit rating of at least A, as determined by Moody’s Investor Services, Inc. or S&P® at the date of purchase. A Fund may be required to pledge securities or cash as collateral to a counterparty, in an amount not less than the Fund’s unrealized loss on outstanding forward foreign currency contracts with that counterparty, subject to certain minimum transfer provisions. The Canadian dollar value of any currencies a Fund has committed to buy or sell is shown in the Schedule of Investments under the caption “Forward Foreign Currency Contracts.” This amount represents the aggregate exposure to each currency the Fund has acquired or sold through currency contracts at period end. Losses may arise from changes in the value of foreign currency or if the counterparties do not perform under the contracts’ terms.
Purchases and sales of forward foreign currency contracts having the same currency, settlement date and broker are offset and any realized gain (loss) is recognized on settlement date and settled with the counterparty on a net basis.
Futures Contracts – A Fund may invest in futures contracts to manage its exposure to the markets. Upon entering into a futures contract, a Fund is required to deposit with the clearing broker, no later than the following business day, an amount (initial margin) equal to a certain percentage of the face value of the contract. The initial margin may be in the form of cash or securities and is transferred to a segregated account on the settlement date. Subsequent payments (variation margin) are made or received depending on the daily fuctuations in the value of the futures contract and are accounted for as “Change in net unrealized appreciation (depreciation) on derivatives” in the Statements of Comprehensive Income (Loss). Upon the expiration or closing of the futures contract, realized gains or losses are recognized, and are recorded in the Statements of Comprehensive Income (Loss) as “Net realized gain (loss) on derivatives.” Futures contracts involve, to varying degrees, risk of loss in excess of the futures variation margin refected in the Statements of Financial Position. The underlying face amount at value of any open futures contracts at period end is shown in the Schedule of Investments under the caption “Futures Contracts.” This amount refects each contract’s exposure to the underlying instrument at period end. Losses may arise from changes in the value of the underlying instruments or if the counterparties do not perform under the contracts’ terms.
Options – Options give the purchaser the right, but not the obligation, to buy (call) or sell (put) an underlying security or fnancial instrument at an agreed exercise or strike price between or on certain dates. Options obligate the seller (writer) to buy (put) or sell (call) an underlying instrument at the exercise or strike price or cash settle an underlying derivative instrument if the holder exercises the option on or before the expiration date. A Fund may use OTC options to manage its exposure to potential investment risks.
Upon entering into an options contract, a Fund will pay or receive a premium. Premiums paid on purchased options are refected as cost of investments and premiums received on written options are refected as a liability and subsequently adjusted to fair value on the Statements of Financial Position. Certain options may be purchased or written with premiums to be paid or received on a future date. When an option is exercised, the cost or proceeds of the underlying instrument purchased or sold is adjusted by the amount of the premium. When an option is closed a gain or loss is realized depending on whether the proceeds or amount paid for the closing sale transaction is greater or less than the premium received or paid. When an option expires, gains and losses are
19
Annual Financial Statements
Notes to Financial Statements – continuedFor the periods ended June 30, 2021 and 2020(Amounts in thousands of Canadian dollars unless otherwise stated)
realized to the extent of premiums received and paid, respectively. The net realized and unrealized gains (losses) on written options are included on the Statements of Comprehensive Income (Loss) in “Net realized gain (loss) on derivatives” and “Change in net unrealized appreciation (depreciation) on derivatives.” The net realized and unrealized gains (losses) on purchased options are included on the Statements of Comprehensive Income (Loss) in “Net realized gain (loss) on investments” and “Change in net unrealized appreciation (depreciation) on investments.” A Fund may be required to pledge securities or cash as collateral to a counterparty, in an amount not less than the Fund’s unrealized loss on outstanding options with that counterparty, subject to certain minimum transfer provisions.
Any open options at period end are presented in the Schedule of Investments under the captions “Purchased Options,” “Purchased Swaptions,” “Written Options” and “Written Swaptions,” as applicable.
Swaps – A Fund may invest in swaps for the purpose of managing its exposure to interest rate or credit risk. A swap is a contract between two parties to exchange future cash fows at periodic intervals based on a notional principal amount. A bi-lateral OTC swap is a transaction between a Fund and a dealer counterparty where cash fows are exchanged between the two parties for the life of the swap. A centrally cleared OTC swap is a transaction executed between a Fund and a dealer counterparty, then cleared by a futures commission merchant (FCM) through a clearinghouse. Once cleared, the clearinghouse serves as a central counterparty, with whom a Fund exchanges cash fows for the life of the transaction, similar to transactions in futures contracts.
Bi-lateral OTC swaps are marked-to-market daily and changes in value are refected in the Statements of Financial Position in the “Bi-lateral OTC Swaps, at value” line items. Any upfront premiums paid or received upon entering a bi-lateral OTC swap to compensate for differences between stated terms of the swap and prevailing market conditions (e.g. credit spreads, interest rates or other factors) are recorded in net unrealized appreciation (depreciation) in the Statements of Financial Position and amortized to realized gain (loss) ratably over the term of the swap. Any unamortized upfront premiums are presented in the Schedule of Investments. A Fund may be required to pledge securities or cash as collateral to a counterparty, in an amount not less than the Fund’s unreal-ized loss on outstanding bi-lateral OTC swaps with that counterparty, subject to certain minimum transfer provisions.
Centrally cleared OTC swaps require a Fund to deposit either cash or securities (initial margin) with the FCM, at the instruction of and for the beneft of the clearinghouse. Centrally cleared OTC swaps are marked-to-market daily and subsequent payments (variation margin) are made or received depending on the daily fuctuations in the value of the swaps and are recorded as unrealized appreciation or (depreciation). These daily payments, if any, are included in receivable or payable for daily variation margin for derivative instruments in the Statements of Financial Position. Any premiums for centrally cleared OTC swaps are recorded periodically throughout the term of the swap to a daily variation margin account and included in unrealized appreciation (depreciation) in the Statements of Financial Position. Any premiums are recognized as realized gain (loss) upon termination or maturity of the swap.
Interest rate swaps are agreements to exchange cash fows based on a notional principal amount, for example, the exchange of fxed rate interest payments for foating rate interest payments. The periodic payments received or paid are recorded in the Statements of Comprehensive Income (Loss) as “Net realized gain (loss) on derivatives”. The primary risk associated with interest rate swaps is that unfavorable fuctuations of interest rates could adversely impact a Fund.
Credit default swaps involve the exchange of a fxed rate premium for protection against the loss in value of an underlying debt instrument in the event of a defned credit event (such as payment default or bankruptcy). Under the terms of the swap, one party acts as a “guarantor” receiving a periodic payment that is a fxed percentage applied to a notional principal amount. In return, the party agrees to purchase the notional amount of the underlying instrument, at par, if a credit event occurs during the term of the swap. A Fund may enter into credit default swaps in which the Fund or its counterparty act as guarantors. By acting as the guarantor of a swap, the Fund assumes the market and credit risk of the underlying instrument including liquidity and loss of value. Premiums received or paid are recorded in the Statements of Comprehensive Income (Loss) as “Net realized gain (loss) on derivatives”.
Gains or losses are realized upon termination of the swaps. Risks may exceed amounts recognized in the Statements of Financial Position. These risks include changes in the returns of the underly-ing instruments, failure of the counterparties to perform under the contracts’ terms and the possible lack of liquidity with respect to the swaps. Details of any swaps open at period end are included in the Schedule of Investments under the caption “Swaps”.
Delayed Delivery Transactions and When-Issued Securities – A Fund may purchase or sell securities on a delayed delivery or when-issued basis. Payment and delivery may take place after the customary settlement period for that security. The price of the underlying securities and the date when the securities will be delivered and paid for are fxed at the time the transaction is negoti-ated. During the time a delayed delivery sell is outstanding, the contract is marked to market daily and equivalent deliverable securities are held for the transaction. The value of unsettled securities purchased on a delayed delivery or when-issued basis are identifed as such in the Schedule of Investments. The Fund may receive compensation for interest forgone in the purchase of a delayed delivery or when-issued security. With respect to purchase commitments, a Fund identifes securities as segregated in its records with a value at least equal to the amount of the commitment. The payables and receivables associated with delayed delivery securities having the same coupon, settlement date, and broker are offset. Delayed delivery or when-issued securities that have been purchased from and sold to a different broker are refected as both payables and receivables in the Statements of Financial Position under the caption “Delayed delivery”. Losses may arise due to changes in the value of the underlying securities or if the counterparty does not perform under the contract, or if the issuer does not issue the securities due to political, economic, or other factors.
Special Purpose Acquisition Companies - Funds may invest in stock, warrants, and other securities of special purpose acquisition companies (SPACs) or similar special purpose entities. A SPAC is a publicly traded company that raises investment capital via an initial public offering (IPO) for the purpose of acquiring the equity securities of one or more existing companies via merger, busi-ness combination, acquisition or other similar transactions within a designated time frame.
Private Investment in Public Equity - Funds may acquire equity securities of an issuer through a private investment in a public equity (PIPE) transaction, including through commitments to purchase securities on a when-issued basis. A PIPE typically involves the purchase of securities directly from a publicly traded company in a private placement transaction. Securities purchased through PIPE transactions will be restricted from trading and considered illiquid until a resale registration statement for the securities is fled and declared effective. At period end, certain Funds had commitments to purchase when-issued securities through PIPE transactions with SPACs. The commitments are contingent upon the SPACs acquiring the securities of target companies. Unrealized appreciation (depreciation) on these commitments is separately presented in the Statements of Financial Position as Unrealized appreciation (depreciation) on unfunded commitments, and in the Statements of Comprehensive Income (Loss) as Change in net unrealized appreciation (depreciation) on unfunded commitments.
20
Annual Financial Statements
Notes to Financial Statements – continuedFor the periods ended June 30, 2021 and 2020(Amounts in thousands of Canadian dollars unless otherwise stated)
To-Be-Announced (TBA) Securities – TBA securities involve buying or selling U.S. mortgage-backed securities (MBS) on a forward commitment basis. A TBA transaction typically does not designate the actual security to be delivered and only includes an approximate principal amount; however delivered securities must meet specifed terms defned by industry guidelines, including issuer, rate and current principal amount outstanding on underlying mortgage pools. A Fund enters into a TBA transaction with the intent to take possession of or deliver the underlying MBS. Purchases and sales of TBA securities involve risks similar to those discussed above for delayed delivery and when-issued securities. TBA securities subject to a forward commitment to sell at period end are included at the end of the Schedule of Investments under the caption “TBA Sale Commitments.” The proceeds and value of these commitments are refected on the Statements of Financial Position.
Valuation of Series – Net assets attributable to securityholders is calculated for each Series of securities of a Fund. The net assets attributable to securityholders of a Series is computed by calculating the Series’ proportionate share of the assets and liabilities of the Fund common to all Series, adjusted for the assets and liabilities of the Fund attributable only to that Series. Expenses directly attributable to a Series are charged to that Series. Investment income and operating expenses are allocated proportionately to each Series based upon the relative net assets attributable to securityholders of each Series, except for items that can be specifcally attributed to one or more Series.
Per Security from Operations – The increase (decrease) in net assets attributable to securityholders resulting from operations per security in the Statements of Comprehensive Income (Loss) represent the operational increase (decrease) for each Series of a Fund, divided by the relevant weighted average securities outstanding during the period.
Statements of Cash Flows – When preparing the Statements of Cash Flows, a Fund nets the rollover activity of its short-term investments, and includes only the net cash fow impact in “Purchases of investments and derivatives” or “Proceeds from sale and maturity of investments and derivatives”, as applicable. Additionally, in accordance with IFRS, a Fund’s Statements of Cash Flows excludes non-cash transactions from its operating and fnancing activities.
4. Expenses and Other Related Party Transactions
Management and Advisory Fee – Fidelity serves as manager of the Funds. Fidelity is part of a broader collection of companies collectively known as Fidelity Investments. The Funds pay Fidelity a monthly management fee for its services and the provision of key management personnel to the Funds, based on the net asset value of each Series, calculated daily and payable monthly. To avoid duplication of management fees, Series O of Fidelity managed underlying funds are not subject to management fees. Where a Fund invests in a Fidelity managed underlying fund, whose series have management fees (non-Series O), Fidelity will make adjustments to ensure there is no duplication of management fees.
In addition, no management fees are charged with respect to the Series O securities, but securityholders will be charged a negotiated management fee directly.
Fidelity may reduce the management fee or a Fund expense for certain securityholders by reducing the management fee it charges to the Fund or reducing the amount charged to the Fund for cer-tain expenses and having the Fund pay out the amount of the reduction to the securityholders as a distribution. These distributions are disclosed as “Management fee reduction” in the Statements of Changes in Net Assets Attributable to Securityholders.
Administration Fee – Fidelity charges the Funds a fxed administration fee in place of certain variable and administrative expenses, including the provision of key administrative personnel to the Funds. Fidelity, in turn, pays all of the operating expenses of the Funds, other than certain specifed fund costs, including the fees and expenses of the Independent Review Committee, taxes, brokerage commissions and interest charges. The administration fee is in addition to the management fee and is based on the net asset value of each Series, calculated daily and payable monthly. To avoid duplication of fees, Series O securities of any Fidelity managed underlying fund are not subject to the Administration fee.
Independent Review Committee Fees – The Independent Review Committee (IRC), as required under National Instrument 81-107, reviews confict of interest matters referred to it by the Manager and provides recommendations or approves actions, as appropriate, that are in the best interest of the Funds. There are currently four members of the IRC who are independent of Fidelity and its affliates. IRC members are compensated by way of an annual retainer fee and a per meeting attendance fee, as well as reimbursed for expenses associated with IRC duties. These costs are allocated among the Funds proportionately by assets.
Sales Tax – Certain provinces have harmonized their Provincial Sales Tax (PST) with the federal Goods and Services Tax (GST). The Harmonized Sales Tax (HST) combines the GST rate of 5% with the PST rate of certain provinces. The Provincial GST/HST liability or refund is calculated using the residency of securityholders and the value of their interests in a Fund as at specifc times, rather than the physical location of a Fund. The effective GST/HST rate charged to each Series of a Fund is based on the securityholders’ proportionate investments by province, using each province’s HST rate or GST rate in the case of non-participating provinces. All amounts are included in the Statements of Comprehensive Income (Loss) as “Sales tax”.
Other Expenses – Other operating expenses represents fund costs attributable to a Fund that are not otherwise covered by the management fee or fxed administration fee as outlined in each Fund’s simplifed prospectus, and are not otherwise disclosed separately on the Statements of Comprehensive Income (Loss). Each Series of a Fund, other than Series O of a Fund, is responsible for its proportionate share of common fund costs in addition to expenses that it alone incurs. Series O of a Fund is responsible for its share of certain fund costs as outlined in the Fund’s simplifed prospectus.
Expenses Waived – Fidelity may absorb or waive certain expenses at its sole discretion and can terminate the absorption or waiver at any time. Any such waivers are disclosed as “Expenses waived” in the Statements of Comprehensive Income (Loss).
Commissions and Other Portfolio Costs – “Commissions and other portfolio costs” in the Statements of Comprehensive Income (Loss) are net of any reimbursements from brokers who reimbursed a portion of their commissions.
A portion of commissions may be paid for research. Amounts paid for research provided to the Funds by executing brokers are estimates made by Fidelity. Fidelity has established proce-dures to assist them in making a good faith determination that the Funds received a reasonable beneft considering the value of research goods and services and the amount of brokerage commissions paid.
21

Annual Financial Statements
Notes to Financial Statements – continuedFor the periods ended June 30, 2021 and 2020(Amounts in thousands of Canadian dollars unless otherwise stated)
In addition, a portion of a Fund’s portfolio transactions may be placed with brokerage frms which are affliates of Fidelity Investments, provided it determines that these affliates’ trade execution abilities and costs are comparable to those of non–affliated, qualifed brokerage frms, on an execution–only basis.
5. Taxation and Distributions
For tax purposes, each Fund has a December year–end. In each tax year, a Fund declares and credits as due and payable suffcient net investment income and net realized capital gains to secu-rityholders such that a Fund will not be subject to income taxes. As a result, each Fund does not record income taxes under IAS 12 – Income Taxes (IAS 12) and accordingly does not recognize the deferred tax beneft associated with tax loss carry forwards and other taxable temporary differences. Capital losses may be carried forward indefnitely to reduce future realized capital gains. Non–capital losses may be carried forward for up to 20 tax years to reduce future taxable income.
Foreign withholding taxes are imposed by certain countries on investment income and are estimated based on the tax rules and actual rates that exist in the foreign markets. Investment income is recorded gross of foreign taxes withheld. Foreign withholding taxes are accrued for in conjunction with the accrual for the related investment income and are included in “Foreign taxes withheld” on the Statements of Comprehensive Income (Loss) and “Other payables and accrued expenses” on the Statements of Financial Position. In addition, certain countries apply withholding taxes on capital gains on investments and such taxes are accrued against the relevant security and included in other payables and accrued expenses. The taxes paid on realized gains from sales of securities paid and the accrued tax liability on unrealized gains on securities subject to withholding taxes are included in “Foreign taxes withheld” and “Change in net unrealized appreciation (depreciation) on investments” in the Statements of Comprehensive Income (Loss), respectively.
Distributions are taxable in securityholders’ hands. At the end of each tax year, the character of the distributions is determined for tax purposes. Under the terms of the Declaration of Trust, the trustee may capitalize any distribution amount without any increase in the number of securities outstanding. Distributions, if any, are declared separately for each Series.
For Fidelity U.S. Money Market Fund and Fidelity U.S. Money Market Investment Trust, net investment income for tax purposes is determined based on the translated Canadian dollar equivalent from U.S. dollars in accordance with Canadian tax principles. Realized capital gains distributions may be generated as a result of aggregate gains realized from foreign exchange gain on securities valued in U.S. dollars and are consolidated accordingly. These distributions, if any, are for Canadian tax purposes only, and are not included in the accompanying fnancial statements. There were no capital gains distributions during the periods.
6. Capital Risk Management
Securities issued and outstanding are considered to be the capital of a Fund. The capital of each series of a Fund is divided into an unlimited number of securities of equal value, with no par value. All securities in a series of a Fund rank equally with respect to distributions. A securityholder of a Fund is entitled to one vote for each one dollar in value of securities owned. Fractional securities are proportionately entitled to these rights. A Fund generally has no restrictions or specifc capital requirements on the subscriptions and redemptions of securities other than minimum subscription requirements; although, on rare occasions, Fidelity may temporarily suspend securityholders’ right to redeem securities and postpone paying sale proceeds. The relevant movements attributable to securityholders are shown in the Statements of Changes in Net Assets Attributable to Securityholders of each Fund. In accordance with the objectives and the risk management policies, Fidelity endeavors to invest the subscriptions received in appropriate investments while maintaining suffcient liquidity to meet redemptions. Such liquidity is managed by investing the majority of assets in investments that can be readily disposed and via a Fund’s ability to borrow up to 5% of its net asset value.
7. Financial Instruments Risk
The COVID-19 (coronavirus disease) pandemic has caused volatility in global fnancial markets as well as signifcant disruptions to global business activity. The continued impact of unanticipated market disruptions, including COVID-19, is uncertain and may exacerbate pre-existing political, social or economic risk, and may disproportionately affect certain issuers, industries or types of securities. Such unanticipated market and economic disruptions, including COVID-19, may be short-term or may last for an extended period of time, and could have effects that cannot necessarily be presently foreseen.
A Fund’s activities expose it to a variety of fnancial instruments risks: credit risk, concentration risk, liquidity risk, other price risk, interest rate risk, currency risk and emerging market risk. Fidelity seeks to minimize potential adverse effects of these performance risks by employing professional, experienced portfolio advisors, by daily monitoring of positions and market events, and by diversifying the investment portfolio within the constraints of the investment mandate. Derivative fnancial instruments may be used to moderate certain risk exposures.
Portfolio risk is monitored daily and reviewed monthly by an investment compliance group. In addition, there is a formal quarterly review of each Fund. The investment compliance group, portfolio managers and the senior analysts attend a quarterly portfolio review. Portfolios within each strategy are reviewed relative to each other and to their benchmark. Active industry and security alloca-tions are analyzed.
Credit Risk – Credit risk is the risk that a counterparty to a fnancial instrument will fail to discharge an obligation or commitment that it has entered into with a Fund. A Fund’s own credit risk in the case of fnancial liabilities and a counterparty’s credit risk, both indirect and direct, are considered, where applicable, in determining the fair value of fnancial assets and fnancial liabilities. The carrying amount of investments and other assets represents the maximum credit risk exposure as at each reporting period end.
A Fund measures credit risk and expected credit losses using probability of default, exposure at default and loss given default. Management considers both historical analysis and forward looking information in determining any expected credit loss. A signifcant increase in credit risk is defned by management as any contractual payment which is more than 30 days past due or on a low quality credit standing. Any contractual payment which is more than 90 days past due is considered credit impaired. As at June 30, 2021 and June 30, 2020, all amounts receivable for invest-ments sold, cash or short term deposits are held with high credit quality counterparties. Management considers the probability of default to be close to zero as these instruments have a low risk of default and the counterparties have a strong capacity to meet their contractual obligations in the near term. As a result, no loss allowance has been recognised based on 12 – month expected credit losses as any such impairment would be wholly insignifcant to a Fund.
22

Annual Financial Statements
Notes to Financial Statements – continuedFor the periods ended June 30, 2021 and 2020(Amounts in thousands of Canadian dollars unless otherwise stated)
Non-investment grade commercial mortgage-backed securities (MBS) and high yield real estate fxed-income securities tend to be riskier than investment grade securities. If there are changes in the market’s perception of the issuers of these types of securities, in the credit worthiness of the underlying borrowers or in the assets backing the pools, then the value of the securities may be affected. There is risk that the underlying loans may not be repaid in full, which could lead to holders of MBS not receiving full repayment. A Fund may from time to time invest in securities that may be less liquid. This can make a Fund riskier than if it had invested with greater diversifcation and in more liquid investments.
Collateralized reverse repurchase agreements may result in credit exposure in the event that the counterparty to the transaction is unable to fulfll its contractual obligations. The risk is managed by the receipt of the underlying securities as collateral and use of counterparties whose credit worthiness is considered suffcient based on Fidelity’s independent review.
Credit risk exposure for derivative instruments is based on a Fund’s unrealized gain on the contractual obligations with the counterparty as at the reporting date. A Fund restricts its exposure to credit losses on derivative instruments by limiting its exposure to any one counterparty and by entering into transactions with counterparties who meet the minimum approved credit rating under securities regulations and other pre-set fnancial and non- fnancial criteria.
Concentration Risk – A Fund may be exposed to risk, both indirect and direct, based on the concentration levels of its fnancial instruments in various sectors, geographic regions, asset weight-ings and market capitalization, as applicable. Fidelity analyzes and monitors these concentration risks regularly.
Liquidity Risk – Liquidity risk is defned as the risk that a Fund may not be able to settle or meet its obligations on time or at a reasonable price. A Fund is exposed to daily cash redemptions of its redeemable securities. Redeemable securities are redeemed on demand at the securityholder’s option based on a Fund’s NAVPS at the time of redemption. A Fund may be exposed to indirect liquidity risk through its investments.
From time to time, securities that are not traded in an active market may be invested in and may be illiquid. Private and/or restricted securities held, if any, are identifed in the Schedule of Investments.
In accordance with securities regulations, investment funds must maintain at least 90% of assets in liquid investments; investments that are traded in an active market and can be readily disposed of. In addition, a Fund aims to retain suffcient cash and short-term investments to maintain liquidity, and has the ability to borrow up to 5% of its net asset value from the custodian for the purpose of funding redemptions. The liquidity position is monitored on a daily basis.
As at each reporting period end, the Funds did not have fnancial liabilities with maturities greater than 3 months.
Other Price Risk – Other price risk is the risk that the value of fnancial instruments will fuctuate as a result of changes in market prices (other than those arising from interest rate risk or currency risk on monetary instruments), whether caused by factors specifc to an individual investment, its issuer, or other factors affecting all instruments traded in a market or market segment. All fnancial instruments present a risk of loss of capital. This risk is moderated through a careful selection of securities and other fnancial instruments within the parameters of the investment strat-egy. The maximum risk resulting from fnancial instruments is equivalent to their fair value except for possible losses from options written and future contracts which can be unlimited. Investments and derivatives are susceptible to other price risk arising from uncertainties about future prices of the instruments.
In determining a Fund’s impact from exposure to other price risk, both indirect and direct, a beta may be used when applicable. Beta, a measure of the volatility of a security or a portfolio in comparison to the market as a whole, is derived from comparing 36 months of returns between the benchmark and a Fund. As such, beta inherently includes effects refected in interest rate and currency risks. A beta of 1 indicates the security’s price will move with the market. A beta of less than 1 means the security will be less volatile than the market. A beta of greater than 1 indicates the security’s price will be more volatile than the market. For example, if a stock’s beta is 1.2, it’s theoretically 20% more volatile than the market. Beta may not be representative of future beta.
Interest Rate Risk – Interest rate risk arises on interest-bearing fnancial instruments held directly or indirectly in the investment portfolio such as bonds. A Fund is exposed to the risk that the fair value or the future cash fows of interest-bearing fnancial instruments will fuctuate due to changes in the prevailing levels of market interest rates. Any excess cash may be invested in short-term investments at market interest rates.
The fxed income investment strategy for a Fund with exposure to investment grade bonds adheres to independent quantitative understanding of all benchmark and portfolio risk and return characteristics with an explicit understanding of all active exposures relative to the investment benchmark. Interest rate anticipation is not a signifcant component of the fxed income investment strategy.
High yield securities, including, but not limited to, security types commonly known as: high yield bonds, foating rate debt instruments, foating rate loans, senior secured debt obligations, convertible securities, high yield commercial MBS as well as some fxed income securities issued by corporations and governments in emerging market economies, may be more or less sensitive to changes in market interest rates, depending upon the securities’ coupon rates, terms to maturity and other factors. However, the volatility associated with these high yield securities is not a result of interest rate risk; in fact, the interest rate risk of these securities tends to be lower than the investment grade bonds, which generally pay lower coupon rates and/or offer lower yields. High yield securities typically are issued by companies that tend to be less creditworthy than investment grade bond issuers. As such, they carry greater default risk than investment grade bonds and accordingly offer higher coupon payments to compensate investors for this additional risk.
Currency Risk – Currency risk arises from fnancial instruments that are denominated in a currency other than a Fund’s functional currency. A Fund is exposed to the risk, both indirect and direct, that the value of fnancial instruments will fuctuate due to changes in exchange rates. Currency risk is not considered to arise from fnancial instruments that are non-monetary items such as equity investments, or forward foreign exchange contracts related to such non-monetary items. Foreign exchange exposure relating to non-monetary assets and liabilities is considered to be a component of other price risk, not foreign currency risk. Management monitors the exposure on all foreign currency denominated assets and liabilities, and may enter into forward foreign currency contracts to manage a Fund’s exposure to foreign exchange movements (such as the U.S. dollar, the Euro or the Yen). Generally, the use of forward contracts to hedge currency fuctuations as completely as possible will not result in the impact of currency fuctuations being eliminated altogether. Furthermore, during times of extreme market stress or volatility, a Fund may not be able to prevent losses from exposure to foreign currencies.
23
Annual Financial Statements
Notes to Financial Statements – continuedFor the periods ended June 30, 2021 and 2020(Amounts in thousands of Canadian dollars unless otherwise stated)
Emerging Market Risk – A Fund’s indirect and direct exposure in countries with limited or developing capital markets may involve greater risks than investments in more developed markets, and the prices of such investments may be volatile due to the consequences of political, social, or economic changes.
8. Investment in Structured Entities
A Fund’s investment in a Fidelity managed underlying fund represents an interest in a structured entity. A structured entity is an entity that has been designed so that voting or similar rights are not the dominant factor in deciding who controls the entity, such as when any voting rights relate to administrative tasks only and the relevant activities are directed by means of contractual arrange-ments such as those agreements executed by a Fund with its Manager and portfolio advisor.
A Fidelity managed underlying fund is fnanced through the issuance of its redeemable trust securities and its purpose is to invest its net assets for capital growth and/or investment income for the beneft of its securityholders.
A Fund does not control nor signifcantly infuence these structured entities, as defned by IFRS 10 and IAS 28, due to the Fund’s inability to exercise its voting rights and direct or participate in the fnancial and operating policy decisions.
The maximum risk of loss in an investment in a structured entity is equal to its fair value and carrying value which is included in “Investments at fair value through proft or loss” on the Statements of Financial Position. There is no difference between the maximum risk of loss and the carrying amounts of the assets and liabilities of a Fidelity managed underlying fund that relate to a Fund’s interests. There are additional risks associated with these investments. Refer to Note 7 for further discussion.
In the normal course of operations to fulfll its investment objective, a Fund will, from time to time, subscribe for additional securities or redeem securities of a Fidelity managed underlying fund. However, a Fund does not have any obligation or intention to provide fnancial support. In addition, a Fund may receive a distribution of income and/or capital gains from its investment as described above in Note 3.
ETFs may also be considered unconsolidated structured entities. The carrying value and maximum exposure to losses of such ETF holdings is equal to their fair value, which is included in the Statements of Financial Position. The change in fair value of these ETF holdings is included in the Statements of Comprehensive Income (Loss) in “Change in net unrealized appreciation (deprecia-tion) on investments.” Any ownership of externally managed ETFs that is 1% or greater is detailed in each applicable fund’s Fund Specifc Notes to Financial Statements.
In addition, MBS or asset-backed securities (ABS) are considered to be unconsolidated structured entities. MBS are formed by pooling various types of mortgages while ABS are formed by pooling assets such as auto loans, credit card receivables or student loans. An interest or claim to this future cash fow (interest and principal) is then sold in the form of debt or equity securities, which could be held by a Fund. A Fund accounts for these investments at fair value. The fair value of such securities, as disclosed in the Schedule of Investments, represents the maximum exposure to losses at that date.
9. Prime Broker Arrangements
The Manager has appointed prime brokers, including Scotia Capital Inc. and Morgan Stanley & Co. LLC, which may hold assets for certain Funds as these Funds may engage in short selling. The prime brokers provide prime brokerage services to the Funds, including trade execution and settlement, custody, securities lending and margin lending in connection with the short sale strategies of the Funds. The prime broker accounts may provide less segregation of the Funds’ assets than would be the case with a more conventional custody arrangement. As a result, the Funds’ assets could be frozen and inaccessible for withdrawal or subsequent trading for an extended period of time if the prime broker experiences fnancial diffculty. In such case, the Funds may experience losses due to insuffcient assets at the prime broker to satisfy the claims of its creditors and adverse market movements while its positions cannot be traded.
10. Leverage
Certain Funds may enter into leverage transactions that are repayable upon demand. Leverage occurs when the Fund borrows money or securities, or uses derivatives, to generate investment exposure that would otherwise not be possible. The Fund’s aggregate exposure to its sources of leverage is calculated as the sum of the following: (i) the market value of short holdings; (ii) the amount of cash borrowed for investment purposes; and (iii) the notional value of the Fund’s derivatives positions, excluding any derivatives used for hedging purposes. This exposure must not exceed 300% of the Fund’s NAV.
24
Annual Financial Statements
Management Responsibility for Financial Reporting
The accompanying fnancial statements of each of the Funds have been prepared by Fidelity Investments Canada ULC (Fidelity), as Manager of the Funds. Fidelity is responsible for the informa-tion and representations contained in these fnancial statements. The Board of Directors of Fidelity is responsible for reviewing and approving these fnancial statements.
Fidelity maintains appropriate processes to ensure that relevant and reliable fnancial information is produced. The fnancial statements have been prepared in accordance with International Financial Reporting Standards and include certain amounts and disclosures that are based on estimates and judgments. The signifcant accounting policies, which management believes are appropriate for the Fund, are described in Note 3 to the fnancial statements.
PricewaterhouseCoopers LLP is the external auditor of the Funds. It has audited the fnancial statements in accordance with Canadian generally accepted auditing standards to enable it to express to the securityholders its opinion on the fnancial statements. Its report is an integral part of these fnancial statements and is set out on the following page of this annual report.
Brock Dunlop
Vice President and Fund Treasurer Fidelity Investments Canada ULC September 8, 2021
25
PricewaterhouseCoopers LLPPwC Tower, 18 York Street, Suite 2600, Toronto, Ontario, Canada M5J 0B2 T: +1 416 863 1133, F: +1 416 365 8215
“PwC” refers to PricewaterhouseCoopers LLP, an Ontario limited liability partnership.
Independent auditor’s report
To the Securityholders and Trustee of
Fidelity American Disciplined Equity® Fund Fidelity American Equity Fund Fidelity American Equity Systematic Currency Hedged Fund Fidelity American High Yield Currency Neutral Fund Fidelity American High Yield Fund Fidelity Asset Allocation Private Pool Trust Fidelity Balanced Income Private Pool Trust Fidelity Balanced Managed Risk Portfolio Fidelity Balanced Portfolio Fidelity Balanced Private Pool Trust Fidelity Canadian Asset Allocation Fund Fidelity Canadian Balanced Fund Fidelity Canadian Bond Fund Fidelity Canadian Core Equity Fund Fidelity Canadian Disciplined Equity® Fund Fidelity Canadian Equity Multi-Asset Base Fund Fidelity Canadian Fundamental Equity Multi-Asset Base Fund Fidelity Canadian Government Long Bond Index Multi-Asset Base Fund Fidelity Canadian Growth Company Fund Fidelity Canadian Large Cap Fund Fidelity Canadian Money Market Fund Fidelity Canadian Money Market Investment Trust Fidelity Canadian Opportunities Fund Fidelity Canadian Real Return Bond Index Multi-Asset Base Fund Fidelity Canadian Short Term Bond Fund Fidelity Canadian Short Term Fixed Income Multi-Asset Base Fund Fidelity ClearPath® 2005 Portfolio Fidelity ClearPath® 2010 Portfolio Fidelity ClearPath® 2015 Portfolio Fidelity ClearPath® 2020 Portfolio Fidelity ClearPath® 2025 Portfolio Fidelity ClearPath® 2030 Portfolio Fidelity ClearPath® 2035 Portfolio Fidelity ClearPath® 2040 Portfolio Fidelity ClearPath® 2045 Portfolio
Fidelity ClearPath® 2050 Portfolio Fidelity ClearPath® 2055 Portfolio Fidelity ClearPath® 2060 Portfolio Fidelity ClearPath® Income Portfolio Fidelity Climate Leadership Balanced FundTM
Fidelity Climate Leadership Bond FundTM
Fidelity Climate Leadership FundTM
Fidelity Concentrated Canadian Equity Multi-Asset Base Fund Fidelity Concentrated Value Investment Trust Fidelity Conservative Managed Risk Portfolio Fidelity Convertible Securities Multi-Asset Base Fund Fidelity Corporate Bond Fund Fidelity Dividend Fund Fidelity Dividend Multi-Asset Base Fund Fidelity Dividend Plus Fund Fidelity Floating Rate High Income Currency Neutral Multi-Asset Base Fund Fidelity Floating Rate High Income Fund Fidelity Floating Rate High Income Multi-Asset Base Fund Fidelity Global Balanced Portfolio Fidelity Global Equity Investment Trust Fidelity Global Growth Portfolio Fidelity Global Income Portfolio Fidelity Global Value Long/Short Fund Fidelity Greater Canada Fund Fidelity Growth Portfolio Fidelity High Income Commercial Real Estate Currency Neutral Multi-Asset Base Fund Fidelity High Income Commercial Real Estate Multi-Asset Base Fund Fidelity Income Allocation Fund Fidelity Income Portfolio Fidelity International Equity Currency Neutral Investment Trust Fidelity International Equity Investment Trust Fidelity Long/Short Alternative Fund Fidelity Market Neutral Alternative Fund Fidelity Monthly Income Fund
26

Fidelity North American Equity Investment Trust Fidelity Premium Fixed Income Private Pool Fidelity Premium Money Market Private Pool Fidelity Premium Tactical Fixed Income Private Pool Fidelity Small Cap America Fund Fidelity Small Cap America Systematic Currency Hedged Fund Fidelity Special Situations Fund Fidelity Tactical Fixed Income Fund Fidelity True North® Fund Fidelity U.S. All Cap Fund Fidelity U.S. Bond Currency Neutral Multi-Asset Base Fund Fidelity U.S. Bond Multi-Asset Base Fund Fidelity U.S. Core Equity Fund Fidelity U.S. Dividend Currency Neutral Fund Fidelity U.S. Dividend Fund Fidelity U.S. Dividend Investment Trust Fidelity U.S. Dividend Private Pool
Fidelity U.S. Dividend Registered Fund Fidelity U.S. Dividend Systematic Currency Hedged Fund Fidelity U.S. Equity Investment Trust Fidelity U.S. Focused Stock Fund Fidelity U.S. Focused Stock Systematic Currency Hedged Fund Fidelity U.S. Growth and Income Private Pool Fidelity U.S. Growth Opportunities Investment Trust Fidelity U.S. Money Market Fund Fidelity U.S. Money Market Investment Trust Fidelity U.S. Monthly Income Fund Fidelity U.S. Small/Mid-Cap Equity Multi-Asset Base Fund Fidelity Women’s Leadership Fund Fidelity Women’s Leadership Systematic Currency Hedged Fund
(individually, a Fund)
Our opinion
In our opinion, the accompanying June 30, 2021 financial statements of each Fund present fairly, in all material respects, the financial position of each Fund, its financial performance and its cash flows as at and for the periods indicated in note 1 in accordance with International Financial Reporting Standards as issued by the International Accounting Standards Board (IFRS).
What we have audited The financial statements of each Fund comprise:
● the statements of financial position as at the period-end dates indicated in note 1;
● the statements of comprehensive income (loss) for the periods indicated in note 1;
● the statements of changes in net assets attributable to securityholders for the periods indicated innote 1;
● the statements of cash flows for the periods indicated in note 1; and
● the notes to the financial statements, which include significant accounting policies and otherexplanatory information.
Certain required disclosures have been presented elsewhere in the Annual Management Report of Fund Performance, rather than in the notes to the financial statements. These disclosures are cross-referenced from the financial statements and are identified as audited.
27
Basis for opinion
We conducted our audit in accordance with Canadian generally accepted auditing standards. Our responsibilities under those standards are further described in the Auditor’s responsibilities for the audit of the financial statements section of our report.
We believe that the audit evidence we have obtained is sufficient and appropriate to provide a basis for our opinion.
Independence We are independent of each Fund in accordance with the ethical requirements that are relevant to our audit of the financial statements in Canada. We have fulfilled our other ethical responsibilities in accordance with these requirements.
Other information
Management is responsible for the other information of each Fund. The other information comprises the Annual Management Report of Fund Performance of each Fund.
Our opinion on the financial statements does not cover the other information and we do not express any form of assurance conclusion thereon.
In connection with our audit of the financial statements of each Fund, our responsibility is to read the other information identified above and, in doing so, consider whether the other information is materially inconsistent with the financial statements of each Fund or our knowledge obtained in the audit, or otherwise appears to be materially misstated.
If, based on the work we have performed, we conclude that there is a material misstatement of this other information, we are required to report that fact. We have nothing to report in this regard.
Responsibilities of management and those charged with governance for the financial statements
Management is responsible for the preparation and fair presentation of the financial statements of each Fund in accordance with IFRS, and for such internal control as management determines is necessary to enable the preparation of financial statements that are free from material misstatement, whether due to fraud or error.
In preparing the financial statements, management is responsible for assessing the ability of each Fund to continue as a going concern, disclosing, as applicable, matters related to going concern and using the going concern basis of accounting unless management either intends to liquidate any Fund or to cease operations, or has no realistic alternative but to do so.
Those charged with governance are responsible for overseeing the financial reporting process of each Fund.
28
Auditor’s responsibilities for the audit of the financial statements
Our objectives are to obtain reasonable assurance about whether the financial statements as a whole for each Fund are free from material misstatement, whether due to fraud or error, and to issue an auditor’s report that includes our opinion. Reasonable assurance is a high level of assurance, but is not a guarantee that an audit conducted in accordance with Canadian generally accepted auditing standards will always detect a material misstatement when it exists. Misstatements can arise from fraud or error and are considered material if, individually or in the aggregate, they could reasonably be expected to influence the economic decisions of users taken on the basis of the financial statements of each Fund.
As part of an audit in accordance with Canadian generally accepted auditing standards, we exercise professional judgment and maintain professional skepticism throughout the audit. We also:
● Identify and assess the risks of material misstatement of the financial statements of each Fund, whether due to fraud or error, design and perform audit procedures responsive to those risks, and obtain audit evidence that is sufficient and appropriate to provide a basis for our opinion. The risk of not detecting a material misstatement resulting from fraud is higher than for one resulting from error, as fraud may involve collusion, forgery, intentional omissions, misrepresentations, or the override of internal control.
● Obtain an understanding of internal control relevant to the audit in order to design audit procedures that are appropriate in the circumstances, but not for the purpose of expressing an opinion on the effectiveness of the internal control of each Fund.
● Evaluate the appropriateness of accounting policies used and the reasonableness of accounting estimates and related disclosures made by management.
● Conclude on the appropriateness of management’s use of the going concern basis of accounting and, based on the audit evidence obtained, whether a material uncertainty exists related to events or conditions that may cast significant doubt on the ability of each Fund to continue as a going concern. If we conclude that a material uncertainty exists, we are required to draw attention in our auditor’s report to the related disclosures in the financial statements of each Fund or, if such disclosures are inadequate, to modify our opinion. Our conclusions are based on the audit evidence obtained up to the date of our auditor’s report. However, future events or conditions may cause any Fund to cease to continue as a going concern.
● Evaluate the overall presentation, structure and content of the financial statements of each Fund, including the disclosures, and whether the financial statements represent the underlying transactions and events in a manner that achieves fair presentation.
We communicate with those charged with governance regarding, among other matters, the planned scope and timing of the audit and significant audit findings, including any significant deficiencies in internal control that we identify during our audit.
/s/PricewaterhouseCoopers LLP
Chartered Professional Accountants, Licensed Public Accountants
Toronto, Ontario September 8, 2021
29


Fidelity Investments Canada ULC483 Bay Street, Suite 300Toronto, Ontario M5G 2N7
Manager, Transfer Agent and RegistrarFidelity Investments Canada ULC483 Bay Street, Suite 300Toronto, Ontario M5G 2N7
Portfolio AdviserFidelity Investments Canada ULCToronto, Ontario
CustodianState Street Trust Company of CanadaToronto, Ontario
AuditorPricewaterhouseCoopers LLPToronto, Ontario
Visit us online atwww.fidelity.caor call Fidelity Client Servicesat 1‑800‑263‑4077
Fidelity’s mutual funds are sold by registered Investment Professionals. Each Fund has a simplifed prospectus, which contains important information on the Fund, including its investment objective, purchase options, and applicable charges. Please obtain a copy of the prospectus, read it carefully, and consult your Investment Professional before investing. As with any investment, there are risks to investing in mutual funds. There is no assurance that any Fund will achieve its investment objective, and its net asset value, yield, and investment return will fuctuate from time to time with market conditions. Investors may experience a gain or loss when they sell their securities in any Fidelity Fund. Fidelity Global Funds may be more volatile than other Fidelity Funds as they concentrate investments in one sector and in fewer issuers; no single Fund is intended to be a complete diversifed investment program. Past performance is no assurance or indicator of future returns. There is no assurance that either Fidelity Canadian Money Market Fund, Fidelity Canadian Money Market Investment Trust, Fidelity U.S. Money Market Fund or Fidelity U.S. Money Market Investment Trust will be able to maintain its net asset value at a constant amount. The breakdown of Fund investments is presented to illustrate the way in which a Fund may invest, and may not be representative of a Fund’s current or future investments. A Fund’s investments may change at any time.
®Fidelity Investments is a registered trademark of Fidelity Investments Canada ULC.62.107435E 1.744312.121
FICL-CDE-ANN-0921