fiber optic lab manual
TRANSCRIPT

ANSWER GUIDE
Fiber Optic Lab ManualFifth Edition
1102.eps
INDUSTRIAL FIBER OPTICS

*
Copyright © 2004By Industrial Fiber Optics
* * *
All rights reserved. No part of this publication may be reproduced, stored in aretrieval system, or transmitted in any form or by any means without express
written permission from Industrial Fiber Optics.
* * * * *

- i -
TABLE OF CONTENTS
ACTIVITIES
COMPONENT IDENTIFICATION ..................................................... 1
MAKING A LIGHT GUIDE................................................................. 2
FIBER OPTIC CABLE TRANSMISSION................................................. 5
CONNECTORS AND SPLICES ............................................................ 8
INDEX MATCHING......................................................................... 11
FIBER TERMINATIONS .................................................................... 14
SPEED OF OPTO-ELECTRONIC DEVICES............................................. 17
FIBER OPTIC TRANSMITTERS........................................................... 20
RECEIVER AMPLIFIER DESIGN.......................................................... 24

- ii -

- 1 -
ACTIVITY I: COMPONENT IDENTIFICATION
In this activity students will identify and inventory all items in the Lab Kit . This willintroduce them to the nomenclature used in this manual and help them in the followingactivities when a particular item is called for. In the unlikely event that any kit componentsare found to be missing or damaged, please refer to the "Missing Parts Claims" section onpage 51 of the main manual.

- 2 -
ACTIVITY II: MAKING A LIGHT GUIDE
Table 2.1 Empirical data for 10 cm (4-inch) light guidewith air core.
LEDs LED OFF LED ON
Red 0* .02 mA
Table 2.2 Empirical data for 10 cm light guide with watercore.
Source LED OFF LED ON
Red 0* .61 mA
Table 2.3 Empirical data for 10 cm light guide with90-degree bend.
Source LED OFF LED ON
Red 0* .46 mA
* This current should measure very close to zero, or less then 1 µA .If the current is not this low, dim the roomlights or cover the light guide and associated electronics with a dark cloth to obtain best results.
Analysis & Questions
What is the amount of light in milliwatts (mW) which falls on the phototransistor when using thered LED with the 10 cm light guide and water core [assuming the responsivity of the phototransistor is50 milliamperes/milliwatt (mA/mW)]? What is it with no water in the core?
=
=
.
/ .
070
501 4
mA
mA mW
Wµ
phototransistor illumination with water core = .61 mA/ (50 mA/mW) = 12.2 µW
phototransistor illumination with no water in core = .02 mA/(50mA/mW) = 0.4 µW

- 3 -
Does the light guide couple more or less light onto the phototransistor with water in the core? Why?
More light .The water has a higher refractive index than air, so less light is lost at theboundary with the vinyl tubing. As a result more light travels down the light guide from theLED to the phototransistor.
Did the 90-degree bend significantly change the amount of light hitting the phototransistor? Why or Whynot?
The 90-degree bend did reduce the amount of light hitting the phototransistor. The bendcaused some of the light rays traveling down the light guide to fall inside the critical angle fortotal internal reflection. These rays escaped the light guide, reducing the amount of lightfalling on the phototransistor .
Calculate the critical angle of the light guide when water is used as the core. Assume the refractiveindex of water is 1.33.
θc =
= °
−sin.
.
1 11 33
48 8

- 4 -
Do you know of any other liquids that may trap more light inside the vinyl tubing than the water usedin this experiment?
To trap more light inside the vinyl light guide one should choose a liquid with a higherrefractive index than that of water. The higher the refractive index, the better the liquid willtrap light (without considering the effects of attenuation). To find more information aboutliquids with a high refractive index, one of the best areas to look is the reference section of alibrary. A common book found in this section is the "Handbook of Physics and Chemistry."Examples of liquids with a refractive index greater than 1.33 include Pentachloroethane(n=1.501), Xylidine (n=1.557) and Quinoline (n=1.622).
1023
Air or cladding
Light guide center
R1θc1 θc2
R1'
Air or cladding
Light guide center
R2
θc2 θc2
R2"
HOMEWORK PROJECT
Following are some typical fiber core/cladding outer diameters:
Single mode glass fiber:9/125 µm or 8/125 µm
Multimode glass fiber:50/125 µm62.5/125 µm100/140 µm
Multimode plastic:230/250 µm480/500 µm730/750 µm980/1000 µm (fiber used in the kit)1980/2000 µm
- 5 -
ACTIVITY III: FIBER OPTIC CABLE TRANSMISSION
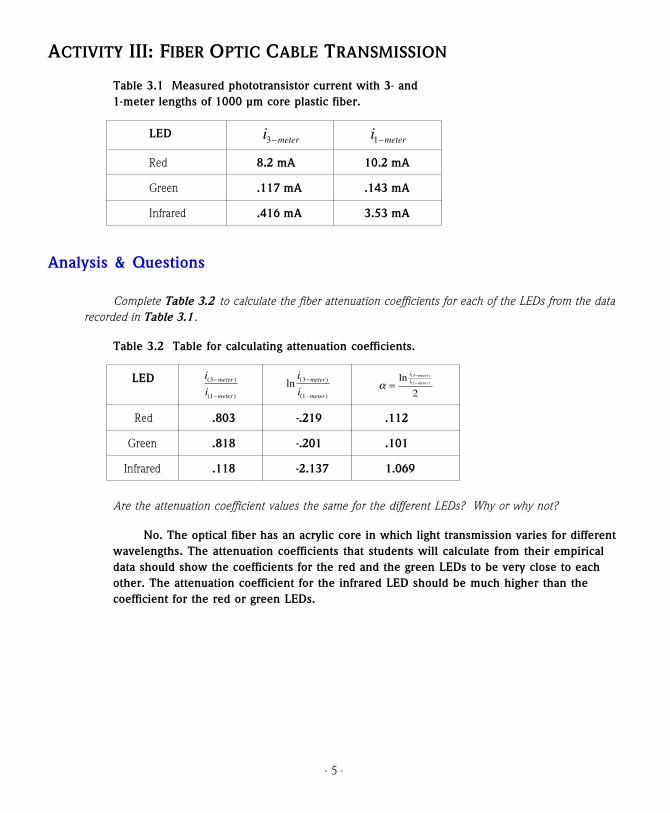
Table 3.1 Measured phototransistor current with 3- and1-meter lengths of 1000 µm core plastic fiber.
LED i meter3− i meter1−
Red 8.2 mA 10.2 mA
Green .117 mA .143 mA
Infrared .416 mA 3.53 mA
Analysis & Questions
Complete Table 3.2 to calculate the fiber attenuation coefficients for each of the LEDs from the datarecorded in Table 3.1 .
Table 3.2 Table for calculating attenuation coefficients.
LED i
imeter
meter
( )
( )
3
1
−
−
ln ( )
( )
i
imeter
meter
3
1
−
−α =
−
−ln ( )
( )
ii
meter
meter
3
1
2
Red .803 -.219 .112
Green .818 -.201 .101
Infrared .118 -2.137 1.069
Are the attenuation coefficient values the same for the different LEDs? Why or why not?
No. The optical fiber has an acrylic core in which light transmission varies for differentwavelengths. The attenuation coefficients that students will calculate from their empiricaldata should show the coefficients for the red and the green LEDs to be very close to eachother. The attenuation coefficient for the infrared LED should be much higher than thecoefficient for the red or green LEDs.
- 6 -
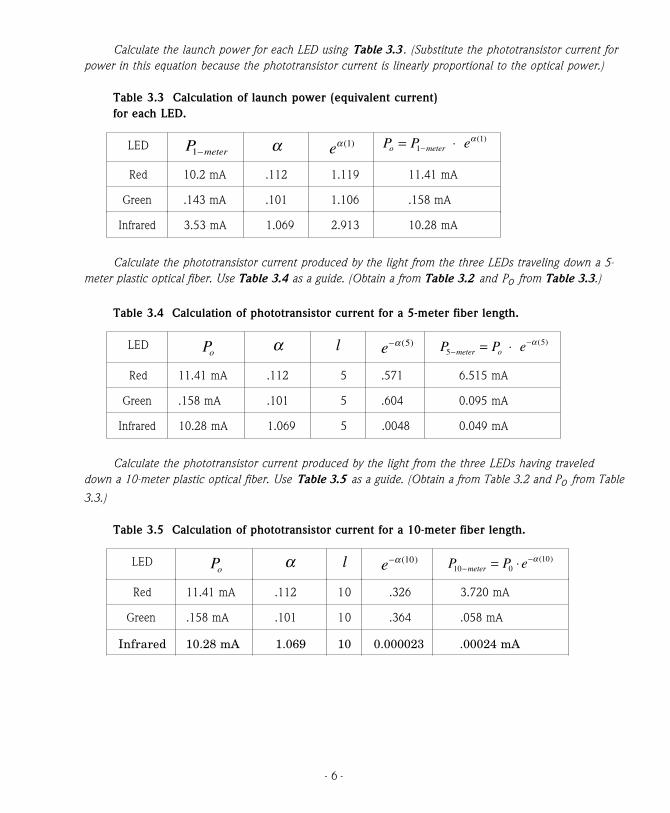
Calculate the launch power for each LED using Table 3.3 . (Substitute the phototransistor current forpower in this equation because the phototransistor current is linearly proportional to the optical power.)
Table 3.3 Calculation of launch power (equivalent current)for each LED.
LED P meter1− α eα ( )1 P P eo meter= ⋅−11 ( )α
Red 10.2 mA .112 1.119 11.41 mA
Green .143 mA .101 1.106 .158 mA
Infrared 3.53 mA 1.069 2.913 10.28 mA
Calculate the phototransistor current produced by the light from the three LEDs traveling down a 5-meter plastic optical fiber. Use Table 3.4 as a guide. (Obtain a from Table 3.2 and Po from Table 3.3.)
Table 3.4 Calculation of phototransistor current for a 5-meter fiber length.
LED Poα l e−α ( )5 P P emeter o5
5−
−= ⋅ ( )α
Red 11.41 mA .112 5 .571 6.515 mA
Green .158 mA .101 5 .604 0.095 mA
Infrared 10.28 mA 1.069 5 .0048 0.049 mA
Calculate the phototransistor current produced by the light from the three LEDs having traveleddown a 10-meter plastic optical fiber. Use Table 3.5 as a guide. (Obtain a from Table 3.2 and Po from Table
3.3.)
Table 3.5 Calculation of phototransistor current for a 10-meter fiber length.
LED Poα l e−α ( )10 P P emeter10 0
10−
−= ⋅ α ( )
Red 11.41 mA .112 10 .326 3.720 mA
Green .158 mA .101 10 .364 .058 mA
Infrared 10.28 mA 1.069 10 0.000023 .00024 mA

- 7 -
Plot measured phototransistor currents for the 1-meter and 3-meter lengths, and the calculatedphototransistor currents for the 5- and 10-meter fiber lengths for all three LEDs in Figure 3.2.
Phototransistor Current Versus Distance
0.001
0.01
0.1
1
1 0
100
0 1 3 5 1 0
M e t e r s
mA
Red
Green
Infrared
Fi gu re 3.2 P hototr an sistor c ur ren t c rea ted a t th e en d of var iou s fi ber len gth s for th reedi fferen t LE D ll ig ht sour ces.
Although this question did not ask students to include the LED launch power (Po) onthe chart, it is included on the one above. The purpose of the graph was to illustrate that theinfrared LED initially produced the most phototransistor current and the green LED thelowest. Then for any distance greater than 5 meters the red LED produced the mostphototransistor current.
The most commonly used wavelength for long distance transmission in plastic fiber isthe 650/660 nm window. This wavelength band offers the lowest material attenuation andreadily available LEDs with good optical output power. The graph above verifies that the650/660 nm wavelength band is the best choice to maximize the working distance withplastic fiber for the three light sources tested.
HOMEWORK PROJECT
The color red has a wavelength from 630 to 670 nm and the color green from 490 to540 nm.

- 8 -
ACTIVITY IV: CONNECTORS AND SPLICES
Table 4.1 Measured phototransistor current with 2-meter and 1-meter fibers joined with a simplexreceptacle.
LED Positionisimplex
Red 3.5 mA
Infrared #1 0.22 mA
#2 0.20 mA
#3 0.17 mA
#4 0.19 mA
Table 4.2 Measured phototransistor currentwith 2-meter and 1-meter optical fibersspliced together.
LED isplice
Red 3.9 mA
Infrared 0.25 mA
Analysis & Questions
Is the fiber's transmission more or less after the fiber connector is installed in the 3-meter fiber?Why?
A fiber’s transmission of light is less after a connector has been installed.Interconnection losses include those caused by:
• Fresnel reflections.
• Fiber ends not perfectly polished or cleaved.
• An air gap between the fibers causing the light rays to diverge more than they wouldhave if they had been inside the fiber core.
• Lateral and angular misalignment of fiber axis allowing light to leak out from the fiberjoint.

- 9 -
What happens to the measured phototransis tor current when the simplex assembly and 1-meter fiberare rotated to different positions within the simplex receptacle? Describe below the physical conditionsthat are occurring and why. (Drawing a picture might be helpful.)
The phototransistor current changes. As the simplex assembly and fiber are rotated in90° steps, changes occur in the lateral and angular alignment which cause variations in theamount of light coupled from one fiber to another. These physical variations cause changesin the amount of coupled light which travels down the optical fiber and is absorbed by thephototransistor.
Table 4.3 Comparison of transmission characteristics of a continuous 3-meter fiber optic cable to those of a 3-meter fiber length with fiber opticconnector installed.
LED Rotation iActivity III isimplex
%Transmission
Red 8.2 mA 3.5 mA 42.6
Infrared #1 .416 mA 0.22 mA 52.9
#2 .416 mA 0.20 mA 48.0
#3 .416 mA 0.17 mA 40.9
#4 .416 mA 0.19 mA 45.7
Table 4.4 Comparison of the transmission characteristics of acontinuous 3-meter fiber optic cable and those of a length with asplice in it.
LED iActivity III isplice%
Transmission
Red 8.2 mA 3.9 mA 47.6
Infrared .416 mA 0.25 mA 60.1
Is the transmission greater for the 3-meter fiber with the splice installed or with the simplexreceptacle? Is this what you expected? Why or why not?
The transmission is greater, or there is less loss, for a splice. Yes. Because the physicaltolerances are smaller for the splice, which tends to align fibers more accurately and allowslight to be better coupled from one fiber to another.

- 10 -
In your own words, state at least two advantages and disadvantages of fiber connectors versus fibersplices. List at least two for each.
The advantages and disadvantages of fiber splices and connectors can be described inmany ways. Below is a comparison of main features of splices and connectors from whichyou can interpret students' answers.
Connectors Splices
Non-permanent Permanent
Factory installable on fiber cables Easier to obtain low loss in field
Easy reconfiguration Lower attenuation
Simple to use Spliced fibers can fit inside conduit
Field installable Less expensive per interconnect
Stronger junction
Some are hermetically sealed
HOMEWORK PROJECT
We suggest that you review students' company selections so that their informationrequests arrive in time to complete ACTIVITY IX, and so you can ensure the selections theyhave made are within the scope of your class.

- 11 -
ACTIVITY V: INDEX MATCHING
Table 5.1 Measurements of photo-transistorcurrent when 2-meter and 1-meter fibers arespliced together with and without index-matching.
LED isplice iindex matched−
Red 3.9 mA 6.0 mA
Infrared 0.25 mA 0.36 mA
Analysis & Questions
Table 5.2 Comparison of the transmission characteristicsof a fiber splice with and without index-matching.
LED isplice iindex matched− % Improvement
Red 3.9 mA 6.0 mA 53.8
Infrared 0.25 mA 0.36 mA 44.0
Explain the change in transmission indicated by Column 4 in Table 5.2 .
Glycerin improved the transmission because its index of refraction was very close tothat of the fiber core. This reduced the Fresnel reflections, compensated for less-than-perfectfiber ends, and reduced light spreading at the splice. The glycerin in this activity acted as arefractive index-matching compound to demonstrate the procedure commonly called "index-matching" in the fiber optics industry. The students' most common answer should be "toreduce Fresnel reflections."
Explain in your own words what "index-matching" means.
An index match compound is liquid or gel with a refractive index close to that of fibercore materials. It eliminates the fiber core/air boundary conditions in splicing and isoccasionally used in connectors. Its main purpose is to reduce Fresnel reflections (althoughit sometimes reduces other losses as well).

- 12 -
Index-matching is sometimes used as a verb and refers to the procedure of using anindex-matching compound to minimize the loss between the junction of two fibers.
Calculate the magnitude of a Fresnel reflection using the equation at the introduction to this activity.Assume the refractive index of Medium #1, the fiber core, to be 1.49 and Medium #2, air, to be 1.0.
The ratio of the reflected power to the incident power is:
R = −+
= −+
=
η ηη η
2 1
2 1
2
21 1 491 1 49
3 87
.
.. %
By the boundary conditions shown in Figure 5.2 how many Fresnel reflections are there for anoptical ray passing from one fiber into the other? Calculate the increase in fiber transmission if a perfectlyindex-matched gel filled the gap between the fibers.
There are two Fresnel reflections. The first occurs when light passes from the first fibercore into the air gap; the second occurs when light passes from the air gap into the secondfiber core.
In glass fiber where tolerances of the components are much smaller and fiber ends aretruly polished or cleaved, a much smaller increase in transmission occurs when index-matching a fiber junction (than was observed in this activity). This is not to say that index-matching is not important in glass fiber.
Calculating the increase in fiber transmission due to Fresnel reflections will not showall of the improvements measured in this activity because the gel fills in small imperfectionsin the plastic fiber core, which reduces losses even further.
Often people calculate the increase in transmission simply by multiplying two timesthe loss, which would be an increase of 7.74%. Although this is approximately right for smalllosses, the more accurate method of determining the increase in transmission is:
= −−( )
11
1
R
where N is the number of boundaries and
R is the loss due to Fresnel reflections
N
The increase in this case would be 8.21%.
- 13 -
HOMEWORK PROJECT
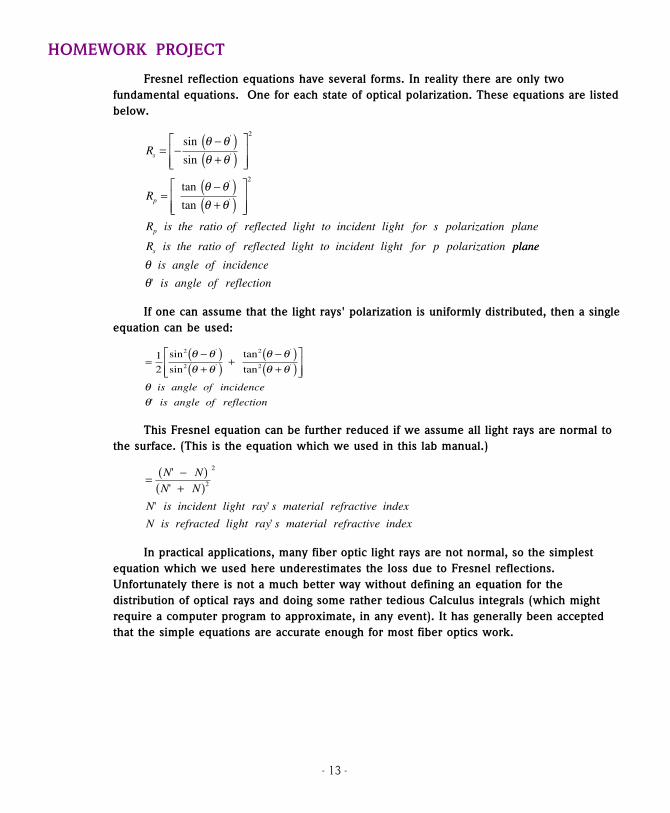
Fresnel reflection equations have several forms. In reality there are only twofundamental equations. One for each state of optical polarization. These equations are listedbelow.
R
R
R is the ratio of reflected light to incident light for s polarization plane
R is the ratio of reflected light to incident light for p polarization
s
p
p
s
= −−( )+( )
=−( )+( )
sin
sin
tan
tan
'
'
'
'
θ θθ θ
θ θθ θ
2
2
planeplane
is angle of incidence
is angle of reflection
θθ
'
If one can assume that the light rays' polarization is uniformly distributed, then a singleequation can be used:
=−( )+( ) +
−( )+( )
12
2
2
2
2
sin
sin
tan
tan
'
'
'
'
'
θ θθ θ
θ θθ θ
θθ
is angle of incidence
is angle of reflection
This Fresnel equation can be further reduced if we assume all light rays are normal tothe surface. (This is the equation which we used in this lab manual.)
= −( )+( )
N N
N N
N is incident light ray s material refractive index
N is refracted light ray s material refractive index
' '
' '
'
2
2
In practical applications, many fiber optic light rays are not normal, so the simplestequation which we used here underestimates the loss due to Fresnel reflections.Unfortunately there is not a much better way without defining an equation for thedistribution of optical rays and doing some rather tedious Calculus integrals (which mightrequire a computer program to approximate, in any event). It has generally been acceptedthat the simple equations are accurate enough for most fiber optics work.

- 14 -
ACTIVITY VI: FIBER TERMINATIONS
Table 6.1 Transmission data measured for a1-meter optical fiber with three different endpreparations.
Fiber Termination PhototransistorCurrent
Wire cutter 2.1 mA
Sharp knife 3.6 mA
Polished 4.4 mA
Analysis & Questions
In the space below draw pictures to show the differences between the fiber end polished with 600grit paper and the end polished with the 3 µm polishing film.
600 grit 3 µm film
1024
Table 6.2 Calculations for determining losses due to fiber endpreparation.
FiberTermination
PhototransistorCurrent
Column #3 Losses %
Wire cutter 3.92 mA 0.459 54.1
Sharp knife 7.25 mA 0.849 15.1
Polished 8.54 mA

- 15 -
Are the increased losses with poorer fiber termination what you expected? Why or why not?
Yes. This activity illustrates through measurements that the flatter and smoother thefiber end or tip, the higher the transmission. The data in Table 6.2 show that fiber ends withpoor ends or finishes have more losses.
Describe how the surface texture caused low phototransistor current with poorer terminations in thisactivity. Relate your answer to critical angle and fiber end termination. Drawing an illustration may behelpful.
The surface texture at the fiber ends directly determines losses when light exits a fiber.The rougher surface texture will cause the light to scatter more, as was shown in Figure 6.1of the main manual. More scatter has an effect similar to increasing the numerical apertureinside the fiber. Fibers with large numerical apertures require photodetectors with very largeactive areas to absorb all of the rapidly diverging light rays. In this experiment, when lightrays are diverging at a greater rate than is the case with normal operation, some of the raysare not absorbed by the photodetector or, as in this experiment, the phototransistor.
Describe how poor fiber termination on both ends, along with light exiting and entering, causesreduced optical power at the photodetector.
Poor fiber terminations cause scatter in the incident angle for light rays entering anoptical fiber. This scattering is generally uniform and will produce more light rays that arenot within the acceptance angle of the fiber core and cladding. These rays, or optical energy,are lost and will not travel down the optical fiber to the photodetector.
Poor termination at the photodetector fiber end was described in previous questions.This question is a rewording of a previous question as related to both fiber ends to make thestudents really think and fully understand what is happening at the optical fiber ends
For very short fiber lengths where design margins are good, poor fiber termination isnot an issue, but for long-distance telecommunications projects, every bit of optical powermust be conserved and utilized. Excess loss anywhere along a fiber system causes systemdegradation. An example of system degradation might be a very noisy telephone line. Forsome reason, that line is less than ideal or was poorly designed and has poor signal-to-noiseratio.

- 16 -
HOMEWORK PROJECT
There are many different fiber optic connectors and splice manufacturers. If a studentcomes up with a company that manufactures fiber optic fusion splicers, we feel that answercounts. The real purpose of the project is to teach students how to find resources. Sourcesfor fiber optic connector and splice companies include:
AT & T Microelectronics3M, Private Network ProductsAmphenol CorporationAugut Communications GroupEnsign-Bickford Optics CompanyHewlett-PackardMethode ElectronicsNorland ProductsOZ Optics, Ltd.Rifocs CorporationSeastar Instruments Ltd., Optics DivisionThomas & Betts Corp., Electronics Division

- 17 -
ACTIVITY VII: SPEED OF OPTO-ELECTRONIC DEVICES
Table 7.1 Measured values of photodetector rise and fall times,with an infrared LED as the optical source.
Detector Rise time Fall time
Phototransistor 3.4 µs 2.6 µs
Photodarlington 20.0 µs 4.0 µs
Photodiode 1.5 µs 1.5 µs
Table 7.2 Measured values of rise and fall times of fouroptical sources using the photodiode as the optical detector.
LED Rise time Fall time
Infrared 1.5 µs 1.5 µs
Red 1.7 µs 1.7 µs
Green 4.0 µs 2.0 µs
Pinlight 20.0 ms 15.0 µs
Analysis & Questions
Which of the photodetectors tested in Table 7.1 had the fastest rise and fall times?
The photodiode, although its speed is much quicker than can be measured in thecircuit shown. The 10 kΩ resistor allows enough magnitude for oscilloscope display of thesignal, but limits the photodiode speed because of breadboard and oscilloscope probecapacitance.
Are there any detectors tested in Table 7.1 in which the rise and fall times are significantly different?If so, which ones?
Yes. The data in Table 7.1 show a much slower rise time than fall time for thephotodarlington. In reality the rise time measured at the collector of the photodarlington isactually the turn-off time for the photodarlington; and the fall time measured at the collectoris the turn-on time of the device. This slower turn-off time versus turn-on time is typical ofall photodarlingtons.

- 18 -
Table 7.3 Calculation of detector upper frequency 3 dBbandwidth using an infrared LED as the optical source.
Detector Rise time Fall time f dB3
Phototransistor 3.4 µs 2.6 µs 103.0 kHz
Photodarl ington 20.0 µs 4.0 µs 17.5 kHz
Photodiode 1.5 µs 1.5 µs 233.3 kHz
Which photodetector has the largest bandwidth?
The photodiode.
Table 7.4 Calculations of light source upper frequency 3 dBbandwidth using a photodiode as the optical detector.
LED Rise time Fall time f dB3
Infrared 1.5 µs 1.5 µs 233.3 kHz
Red 1.7 µs 1.7 µs 205.9 kHz
Green 4 µs 2 µs 87.5 kHz
Pinlight 20.0 ms 15 ms 17.5 Hz
Which LED is the fastest in Table 7.4? Is this what you expected? Why?
The infrared LED. Yes. Data sheets for LEDs affirm that infrared types are normallyfaster than visible ones. Intuitively one might deduce this because, generally speaking, mostproduct specifications supplied by manufacturers are targeted at performance characteristicswhich buyers/users are most interested in. With infrared LEDs, which are used forcommunications, we would intuitively expect a higher bandwidth than with visible LEDs. Inthe case of visible LEDs which are designed for producing the most amount of visible light, itwould be an anomaly to find one with fast rise and fall times. Engineers may actually give upspeed or bandwidth during the design of a visible device to maximize the visible light output.
Why are incandescent bulbs not used as fiber optics light sources? (Use the data in this activity toformulate your answer.)
From the data it can be seen that incandescent bulbs are very slow and operate only atvery low frequencies. Incandescent bulbs are so slow because current flowing into the bulbheats the bulb filament to a temperature sufficiently high to produce radiation in the visiblerange. Electrical current into the bulb's filament does not directly produce electrons, unlike

- 19 -
LEDs' response to current. Incandescent bulbs are also not suited for fiber optics becausethey have short lifetimes and poor linearity.
Using information as required from Activity III , determine if a particular LED emits the greatestamount of optical power, has the best optical fiber transmission and the fastest rise/fall times. Which one?If one doesn't meet all the criteria, pick the best LED in each category and list it below.
There is no one best LED. Students will need to put on their thinking caps. The answerdepends on what performance characteristic the student feels is most important (and whichthey may include as part of their answer). The infrared LED clearly produces the mostphototransistor current as seen in Table 3.1 , and has the fastest rise and fall times. However,the infrared light also has the highest attenuation coefficient of all the LEDs tested (pooresttransmission). The red LEDs do not have as high starting optical power, but do have a muchlower attenuation coefficient. For applications using long fiber lengths, they may the bestchoice. The green LED, although an interesting color, offers no advantage in output power,fiber transmission or speed.
HOMEWORK PROJECT
Answers to this question may vary widely. Variables that can affect the student'sanswers include manufacturer, package type, size, and some devices are optimized for aparticular configuration. Ranges that we have found are listed below. You may choose tohave students list their sources of information as part of the project.
Device Rise time Fall time
Photodiode 1 ns to 3 µs 1 ns to 3 µs
Phototransistor 2 to 30 µs 2 to 30 µs
Photodarlington 40 µs to 1.5 ms 40 µs to 1.5 ms
Infrared LED 1 ns to 1 µs 2 ns to 1 µs
Red LED 120 ns to 300 ns 50 ns to 300 ns
Green LED 450 ns 200 ns

- 20 -
ACTIVITY VIII: FIBER OPTIC TRANSMITTERS
Table 8.1 Measured data takenfrom the circuit shown in Figure8.3 .
Measurement Data
Vce (LED on) 158 mV
VLED 1.96 V
Vce (LED off) 5 V*
Rise time 240 ns
Fall time 50 ns
Period3 dB 670 ns
Table 8.2 Measured data on the LEDdrive circuit shown in Figure 8.4.
Measurement Data
Vce 219 mV
Vf 1.97 V
Rise time 120 ns
Fall time 100 ns
Period3 dB 500 ns
Table 8.3 Measured data for the high-speed LED drive circuit shown in Figure8.5 .
Measurement Data
Vc (LED on) 3.36 V
Vc (LED off) 1.56 V
Rise time 20 ns*
Fall time 4 ns*
Period3dB 50 ns*
* Voltage at the collector of this transistorshould theoretically be 5 volts. In reality, whena multimeter is installed to read this voltage, asmall amount of current flows through theLED. The current is not enough that the LEDproduces light, but it does cause a small voltagedrop. Therefore, measurements between 3.5and 5 volts will be typical for this entry.
* 40 MHz oscilloscope may not be able tomeasure these fast transition times, but that isrevealed as the circuit capability when using a350 MHz oscilloscope as a measuringinstrument.

- 21 -
Table 8.4 Measured data for the analogLED drive circuit shown in Figure 8.6.
Measurement Data
Ic 7.9 mA
Vc (.5-volt input) 3 Vp-p
Vc (distorted) 7.8 Vp-p
Vi (distorted) 1.4 Vp-p
Period3 dB 128 ns
Analysis & Questions
Does the measured voltage across the collector of 2N3904 transistor in Figure 8.3 for the LED "on"and "off" compare favorably to what you expected? Why or why not?
Yes. When the transistor is in saturation, Vce should be very close to the .2 volts thatmost textbooks use. The collector voltage with the LED "off" does not measure +5 voltsbecause the multimeter draws a small current through the LED, causing a voltage drop.
With the LED "on" in Figure 8.3 calculate the "on" current using the measured data in this activityfor Vce (sat) and V f.
I
I mA
c
c
= − −
=
5 1 96 158150
19
. .
Using the measured rise time from Table 8.1 , calculate the 3 dB bandwidth for the circuit shown inFigure 8.3.
f
f MHz
dB
dB
3 9
3
35240 101 45
=⋅
=
−.
.
How does the calculated bandwidth compare to the measured bandwidth?
The measured bandwidth can be calculated from the following equation. (It is assumedthat students will have knowledge of this general equation from their electronicsexperience.)
MEASURED fns
MHz
dB
.
3
16701 49
=
=

- 22 -
The calculated 3 dB bandwidth from the rise time was determined to be 1.45 MHz andmeasure was 1.49 MHz. It would not be uncommon for the students' measured 3 dBbandwidth and calculated bandwidth from risetime to be ± 10% apart from each other.
Calculate the average current used by the LED driver in Figure 8.3, assuming it is being driven at a50 percent duty cycle.
I I Duty cycle I Duty cycle
I mA
I mA
avg PEAK MIN
avg
avg
= ⋅ + −
= ⋅ + ⋅
=
( )
. . .
.
1
19 2 5 0 5
9 6
Using the measured value for Vf , calculate the current through the LED in Figure 8.4.
I
I mA
c
c
= −
=
5 1 97150
20 2
.
.
Calculate the current through 2N3904 in Figure 8.4 when it is on and the LED is off.
I
I mA
c
c
= −
=
5 219150
31 9
.
.
What is the average current though the circuit shown in Figure 8.4, assuming that it is being drivenat a 50 % duty cycle?
ImA mA
I mA
avg
avg
= +
=
31 9 20 2
226 1
. .
.
Comparing the peak current and average current for the circuits in Figures 8.3 and 8.4 , whichwould cause the greatest power supply ripple? By how much?
To compare power supply ripple we shall use the ratio of the peak current divided bythe average current. Shown below is the ripple factor for the circuits in Figure 8.3 and 8.4 .
rfmA
mAFigure .
. 8 3
199 6
2
=
=
rfmA
mAFigure .
. .
.
8 4
31 925 6
1 25
=
=
The circuit in Figure 8.3 has a much higher power supply ripple, as can be seen by theequation which shows the Ipeak to Iaverage ratio to be 2, as compared to the same ratio forFigure 8.4, which is 1.25.
- 23 -
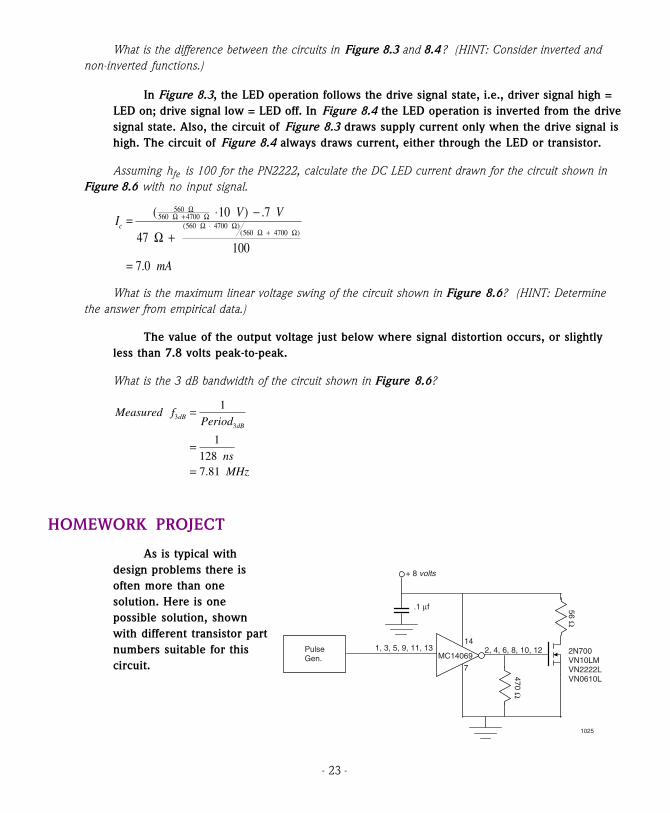
What is the difference between the circuits in Figure 8.3 and 8.4? (HINT: Consider inverted andnon-inverted functions.)
In Figure 8.3, the LED operation follows the drive signal state, i.e., driver signal high =LED on; drive signal low = LED off. In Figure 8.4 the LED operation is inverted from the drivesignal state. Also, the circuit of Figure 8.3 draws supply current only when the drive signal ishigh. The circuit of Figure 8.4 always draws current, either through the LED or transistor.
Assuming hfe is 100 for the PN2222, calculate the DC LED current drawn for the circuit shown inFigure 8.6 with no input signal.
IV V
mA
c = ⋅ −
Ω +
=
ΩΩ + Ω
Ω ⋅ ΩΩ + Ω
( ) .
.
( )( )
560560 4700
560 4700560 4700
10 7
47100
7 0
What is the maximum linear voltage swing of the circuit shown in Figure 8.6? (HINT: Determinethe answer from empirical data.)
The value of the output voltage just below where signal distortion occurs, or slightlyless than 7.8 volts peak-to-peak.
What is the 3 dB bandwidth of the circuit shown in Figure 8.6?
Measured fPeriod
nsMHz
dBdB
.
33
1
11287 81
=
=
=
HOMEWORK PROJECT
As is typical withdesign problems there isoften more than onesolution. Here is onepossible solution, shownwith different transistor partnumbers suitable for thiscircuit.
PulseGen.
1, 3, 5, 9, 11, 13 2, 4, 6, 8, 10, 1214
7
56 Ω
470 Ω
2N700VN10LMVN2222LVN0610L
+ 8 volts
.1 µf
MC14069
1025

- 24 -
ACTIVITY IX: RECEIVER AMPLIFIER DESIGN
Table 9.1 Measured data for various termination resistors, Rx, inthe circuit shown in Figure 9.2.
Rx Vp-p tr tf
100 kΩ 5.0 V 5.4 µs 7.0 µs
47 kΩ 3.2 V 4.5 µs 3.6 µs
10 kΩ 0.69 V 1.8 µs 1.3 µs
10 kΩ ||.001 µf 0.65 V 23 µs 21 µs
Table 9.2 Measured data for various termination resistors, Rf , inthe circuit shown in Figure 9.4.
Rf Vp-p tr tf
100 kΩ 4.5 V 7.2 µs 7.4 µs
47 kΩ 3.1 V 4.2 µs 5.0 µs
10 kΩ 0.66 V 1.6 µs 1.1 µs
10 kΩ ||.001 µf 0.66 V 1.5 µs 1.1 µs
Table 9.3 Measured data for various termination resistors, Rf , inthe circuit shown in Figure 9.5.
Rf Vp-p tr tf
100 kΩ 2.5 V 1.6 µs 1.1 µs
47 kΩ 1.9 V 1.3 µs 1.5 µs
10 kΩ 0.6 V 1.0 µs 1.2 µs
10 kΩ ||.001 µf 0.6 V 1.0 µs 1.2 µs

- 25 -
Table 9.4 Measured data for various termination points in thecircuit shown in Figure 9.6 (a).
Location Vp-p tr tf
Vemitter 4.8 V 4.0 µs 7.0 µs
V4069 5.0 V 0.5 µs 0.4 µs
Table 9.5 Measured data for various termination resistors, Rf , inthe circuit shown in Figure 9.6 (a).
Resistance Value
Phototransistor 213 Ω
Photodarlington 22 Ω
Analysis & Questions
What happens to the rise and fall times at the receiver as the resistor value is reduced in Figure 9.2?What happens to the peak-to-peak voltage?
The rise and fall times decrease as the resistor value is reduced, which increases thebandwidth. The peak-to-peak voltage, however, is also lowered.
What happens to the rise and fall times across the termination resistor (RX) when capacitance is
added in the circuit shown in Figure 9.2?
The rise and fall times increase when capacitance is added, decreasing the bandwidth.
What are the advantages and disadvantages of the receiver circuit shown in Figure 9.4 compared tothe circuit shown in Figure 9.2?
The circuit in Figure 9.4 reduces the effect of load resistance and capacitance on thevoltage developed across the transimpedance resistor Rf . As a result, the gain and bandwidthare significantly improved over the circuit in Figure 9.2. A disadvantage of Figure 9.4 is addedcomplexity in the circuit and power supply.
How does the addition of load capacitance affect the rise and fall times in the circuit shown in Figure9.4 as compared to Figure 9.2? Why?
Load capacitance has less effect on Figure 9.4 because the amplifier has a lower outputimpedance which isolates Rf from the load. This permits the load capacitance to be chargedand discharged more quickly, increasing the bandwidth.

- 26 -
Calculate the bandwidth of the receiver shown in Figure 9.4 with the 10 kΩ gain resistor installedusing the equation:
f
kHz
dB3 6
351 6 10219
=⋅
=
−.
.
Calculate the bandwidth of the bipolar transistor receiver in Figure 9.5 using the 10 kΩ feedbackresistor installed.
f
kHz
dB3 6
351 0 10350
=⋅
=
−.
.
How much more gain does the photodarlington have than the phototransistor in the circuit in Figure9.6 (a)? (Hint: Use the ratio of the resistors that were in parallel with the 390 Ω resistor which removeperiodic signal at the output of 4069.)
With a given optical input, the photodarlington requires a smaller load resistance thanthe phototransistor to develop the same output voltage. The relative gain can be found bydetermining the ratio of the resistors that results in the same signal level for each device:
GR
Rll phototransistor
l photodarlingtonRe .
( )
( )
.
=
= ΩΩ
=
21322
9 7
The photodarlington in this activity had a gain 9.7 times greater than thephototransistor.
HOMEWORK PROJECT
Students' written paragraphs must be interpreted by the instructor. A quick overviewof many fiber optic companies is found in the Photonics Corporate Guide, Volume I and theFiberoptic Product News Technology Reference. You may find it useful to purchase thesepublications. To order, see page 53 of the main manual for more information.

\

IF-LM-A