fiber intake in hemodialysis patients and its effects on
TRANSCRIPT
Illinois State University Illinois State University
ISU ReD: Research and eData ISU ReD: Research and eData
Theses and Dissertations
3-9-2019
Fiber Intake In Hemodialysis Patients And Its Effects On Fiber Intake In Hemodialysis Patients And Its Effects On
Symptoms Symptoms
Jennifer Langner Illinois State University, [email protected]
Follow this and additional works at: https://ir.library.illinoisstate.edu/etd
Part of the Human and Clinical Nutrition Commons
Recommended Citation Recommended Citation Langner, Jennifer, "Fiber Intake In Hemodialysis Patients And Its Effects On Symptoms" (2019). Theses and Dissertations. 1057. https://ir.library.illinoisstate.edu/etd/1057
This Thesis is brought to you for free and open access by ISU ReD: Research and eData. It has been accepted for inclusion in Theses and Dissertations by an authorized administrator of ISU ReD: Research and eData. For more information, please contact [email protected].

FIBER INTAKE IN HEMODIALYSIS PATIENTS AND ITS EFFECTS ON SYMPTOMS
JENNIFER LANGNER
40 Pages
On average 30 million adults are diagnosed with chronic kidney disease (CKD) in the
United States (National Kidney Foundation, 2017). Patients in late stage kidney disease and on
dialysis are placed on a restrictive diet to aid in the treatment of their disease. There are adverse
symptoms associated with dialysis including nausea, constipation, diarrhea and fatigue. Fiber has
been shown to decrease gastrointestinal symptoms such as reducing constipation and
inflammation in the body in healthy populations. This study examined 19 hemodialysis dialysis
patients and their fiber intake in relation to a variety of symptoms such as constipation, nausea,
vomiting, diarrhea, appetite and dry mouth. Results determined that there is a positive correlation
between soluble fiber and diarrhea severity (p=0.047). There were other variables that were
approaching significance such as dietary fiber and diarrhea frequency and severity and soluble
fiber and diarrhea frequency. In conclusion there was a connection between fiber and diarrhea
severity, however, more research is required to conclude that nutrition interventions with fiber
would be beneficial for this demographic.
KEYWORDS: hemodialysis; fiber intake; symptoms; gut microbiota; symptom severity;
symptom frequency

FIBER INTAKE IN HEMODIALYSIS PATIENTS AND ITS EFFECTS ON SYMPTOMS
JENNIFER LANGNER
A Thesis Submitted in Partial
Fulfillment of the Requirements
for the Degree of
MASTER OF SCIENCE
Department of Family and Consumer Sciences
ILLINOIS STATE UNIVERSITY
2019

© 2019 Jennifer Langner

FIBER INTAKE IN HEMODIALYSIS PATIENTS AND ITS EFFECTS ON SYMPTOMS
JENNIFER LANGNER
COMMITTEE MEMBERS:
Jennifer Barnes, Chair
SeonYoon Chung
Julie Raeder-Schumacher

i
ACKNOWLEDGMENTS
I would like to take the time to thank all the professors at Illinois State University for
preparing me for this research. I would like to thank Dr. Barnes for challenging me to study this
population, providing recommendations on improving research methods and research focuses
and providing lecture material to reference prior to conducting this research. I would also like
thank Dr. Ma for preparing me via research methods and statistics classes. Having these classes
and having an early chance to work on my literature prepared me for my final presentation. I
would like to thank my other thesis committee members Dr. Chung and Dr. Schumacher for
providing another insight on ways to improve my literature review and how to conduct my study
with as few errors as possible. Thank you to Illinois State University for preparing me for this
and giving me all the education to set me up for success.
J. L.

ii
CONTENTS
Page
ACKNOWLEDGMENTS i
TABLES iii
CHAPTER I: DIALYSIS AND FIBER INTAKE 1
Introduction 1
Methods and Results 3
Instrumentation 4
Data Analysis 4
Results 5
Discussion 6
Conclusion 10
CHAPTER II: REVIEW OF THE LITERATURE 15
Chronic Kidney Disease (CKD) 15
Peritoneal Dialysis and Hemodialysis 16
Nutrition Intervention 17
Malnutrition Risk for a Patient on Dialysis 19
Nutrients to Aid in Dialysis Patients 20
Importance of Fiber 22
Quality of Life and Symptoms 24
Summary 25
REFERENCES 27

iii
TABLES
Table Page
1. Demographics (mean, median, mode, SD) (n=19) 11
2. Mean and standard deviation of dietary fiber and soluble fiber intake 11
3. Soluble fiber correlation with symptom severity (n=19) 12
4. Dietary fiber correlation with symptom frequency (n=19) 12
5. Dietary fiber correlation with symptom severity (n=19) 13
6. Soluble fiber correlation with symptom frequency (n=19) 13
7. Dietary fiber correlation with symptom bother (n=19) 14
8. Soluble fiber correlation with symptom bother (n=19) 14

1
CHAPTER I: DIALYSIS AND FIBER INTAKE
Introduction
Approximately 30 million adults in the United States are diagnosed with chronic kidney
disease (CKD) (National Kidney Foundation, 2017). The kidney is a bean shaped organ located
in the superior lumbar region (Marieb, 2013). Functional kidneys have a crucial role in
maintaining electrolyte and fluid balance along with helping filter metabolic waste products and
removing additional fluid from the blood to be excreted as urine (Mahan, 2012). The kidney also
has additional roles unrelated to excretion of urine including blood pressure control, hormone
production and maintenance of calcium/phosphorus homeostasis (Mahan, 2012).
Some conditions that can lead to declining kidney function include inflammation,
repeated urinary infections, lupus, with the most common etiologies of diabetes and high blood
pressure (Chronic kidney disease, 2018). Kidney function is measured with glomerular filtration
rate (GFR). GFR is also used to categorize the severity of the disease (Mahan, 2012). This test
quantifies the amount of blood being filtered and the amount of creatine being cleared. (Chronic
kidney disease, 2018; Mahan, 2012). A normal GFR rate is 90 or greater and those in kidney
failure typically have a GFR of 15 or less (National Kidney Foundation, 2017). If kidney
function continues to decline a patient might require dialysis to replace functions normally
conducted by healthy kidneys. This intervention is necessary in end stage renal disease (ESRD).
One of the forms of dialysis is hemodialysis where the patient is connected to a machine
to serve as an artificial kidney to help filter the blood. During hemodialysis, the patient’s blood
gets filtered through a dialyzer which helps remove additional fluid, remove waste products, and
return the filtered blood to the patient (Hemodialysis, 2018). The treatment lasts about 3-5 hours

2
and the patient comes into a clinic roughly three times per week (Mahan, 2012). This process
along with following a renal diet can help maintain the health of the patients experiencing kidney
failure.
Patients on hemodialysis are typically on a restrictive diet of high protein, low potassium
and sodium, and management of fluid intake (K/DOQI, 2005). Patients on dialysis are advised to
have higher protein consumption to attenuate the catabolic state of the treatment and to preserve
lean body mass, which can also lead to a decreased rate of hospitalization (Chao, 2017). High
circulating potassium can cause cardiac arrhythmias and a reduction of blood pressure leading to
a higher risk of cardiovascular complications (Ko, 2017). The food items with the most
potassium include fruits, vegetables, whole grains and legumes (National Kidney Foundation,
2017). Phosphorus is also recommended to be limited because of its connections with
cardiovascular disease along with all cause mortality in patients with CKD (Hou, 2017; Suki,
2016). Phosphorus works alongside potassium to maintain fluid balance and bone formation and
is found in foods such as beans, legumes, dairy products and whole grains (Thompson, 2014).
With the reduction of food items and the symptoms of kidney disease, it can be challenging to
find foods the patients can eat. Because of the aggressive treatment during dialysis, it can lead to
a variety of symptoms that can hinder the quality of life of these patients.
There are associated symptoms that a patient can experience before, during, and after
treatment. Some of the symptoms include weakness or lack of energy, decreased mobility,
shortness of breath, and nausea and vomiting (Raj, 2017). Previous research has looked at
patients on hemodialysis and the association between nutritional status and quality of life. There
have been additional studies looking at nutrition interventions and the maintenance of these
symptoms and quality of life, however; fiber is not well studied.

3
As mentioned previously, hemodialysis patients are counseled to reduce high potassium
and high phosphorus foods such as fruits, vegetables, whole grains, beans and legumes. All of
these food items are excellent sources of fiber and have numerous health benefits. Fiber has been
shown to help with lowering the risk of heart disease, gastrointestinal diseases and cholesterol
levels (Anderson, 2009). Currently, heart disease is the leading causes of mortality in CKD
patients (United States renal data system, 2018). Dietary fiber also helps with constipation by
increasing fecal bulk in the large intestine and increasing the amount of water to help soften the
stool (Lambeau, 2017). Finally, it can help with supporting diverse bacteria populations
comprising the gut microbiota (Chung, 2016; Simpson, 2015). There are little data assessing the
connection between fiber intake and symptom severity in patients on hemodialysis.
The purpose of this study was to discover the connection between dialysis patients’
reported fiber intake and reported symptoms. The dietary intake specifically addressing the total
amount of fiber was compared to the symptoms the patient experiences. It was hypothesized that
the increase in fiber will lead to a decrease in symptom severity because of the overall health
benefits associated with fiber intake.
Methods and Results
A purposive sample of 20 participants in this cross-sectional study were recruited from
the Fresenius Kidney Clinic in Central Illinois. Inclusion criteria included English speaking, aged
18 and above, receiving hemodialysis and experiencing two or more kidney disease related
symptoms. Exclusion criteria included receiving peritoneal dialysis, had a kidney transplantation,
had a diagnosed gastrointestinal illness such as inflammatory bowel disease or had received
antibiotics or probiotics in the past three months.

4
Data was collected by interviewing patients and obtain a demographics, health condition
form, and informed consent. The demographics form collected data on gender, income, ethnicity,
education, and marital status. The heath condition form gathered information on behaviors,
dialysis-related gastrointestinal health and symptoms experiencing in the last week. Participants
also completed a food frequency questionnaire (FFQ) and dialysis frequency, severity, and
symptom burden index (DFSSBI) on their own or with assistance from the researchers.
All procedures were approved by the Institutional Review Board (IRB) prior to
recruitment or data collection. An incentive of a $20 gift card to Wal-Mart was given to thank
participants for their time. These gift cards were distributed after all documentation was
completed and turned in to the researcher.
Instrumentation
The Block Dialysis FFQ was utilized to analyze the overall diet with specific emphasis
on fiber intake. This questionnaire was utilized because of its validation in the hemodialysis
population (Kalantar-Zadeh, 2011). The FFQ quantifies specifically the amount of dietary fiber,
dietary soluble fiber and fiber from food sources such as beans, vegetables, fruits and grains. The
amount of fiber in the diet was recorded per respondent along with sex, age, weight and body
mass index (BMI). Dialysis frequency, severity, and symptom burden index (DFSSBI) analyzes
a 31-item index to observe severity of symptoms or distress in the last dialysis treatment,
specifically looking at appetite and fatigue. Kidney disease quality of life (KDQOL) evaluates 36
items in terms of health quality and dialysis specific testimonials (Peipert, 2018).
Data Analysis
Statistical analysis was performed using IBM Statistical Package for the Social Sciences
(SPSS) version 24. Means along with standard deviations were reported in the descriptive data.

5
A pearson correlation coefficient test determined the relationship between fiber intake and the
symptom severity of the patient. Relationships between fiber intake and reported patient quality
of life were also analyzed. A statistically significant p value was set at p<0.05.
Results
This study investigated the connection between fiber and symptoms of constipation,
nausea, vomiting, diarrhea, appetite and dry mouth associated with hemodialysis treatment.
Participants completed a series of surveys including a food frequency questionnaire (FFQ) and
dialysis frequency, severity, and symptom burden index (DFSSBI). Table 1 describes the
demographic of the participants. There were a total of 20 participants (n=20) who participated in
the study and one participant dropped out prior to the study ending. There were on average more
females than males (females 78.9% (n=15); males 21.1% (n=4)) with ages between 29-91 years
old. Weight was measured in kg and on average participants weighed 87.95 kg (SD=23.10).
Body mass index was calculated to be on average 29.16 (SD= 7.71), which falls in the
overweight category. After participants completed the FFQ, data analysis was conducted to
determine the total amount of dietary fiber and soluble fiber per day. On average, participants
consumed 12.55 grams of dietary fiber and 4.36 grams of soluble fiber (Table 2).
While looking at the symptoms, variables were broken down into symptom frequency,
symptom severity and symptom bother. Dietary fiber and soluble fiber were compared to the
symptoms of constipation, nausea, vomiting, diarrhea, appetite and dry mouth. A Pearson
correlation coefficient (p<0.05) determined the correlation between the type of fiber and the
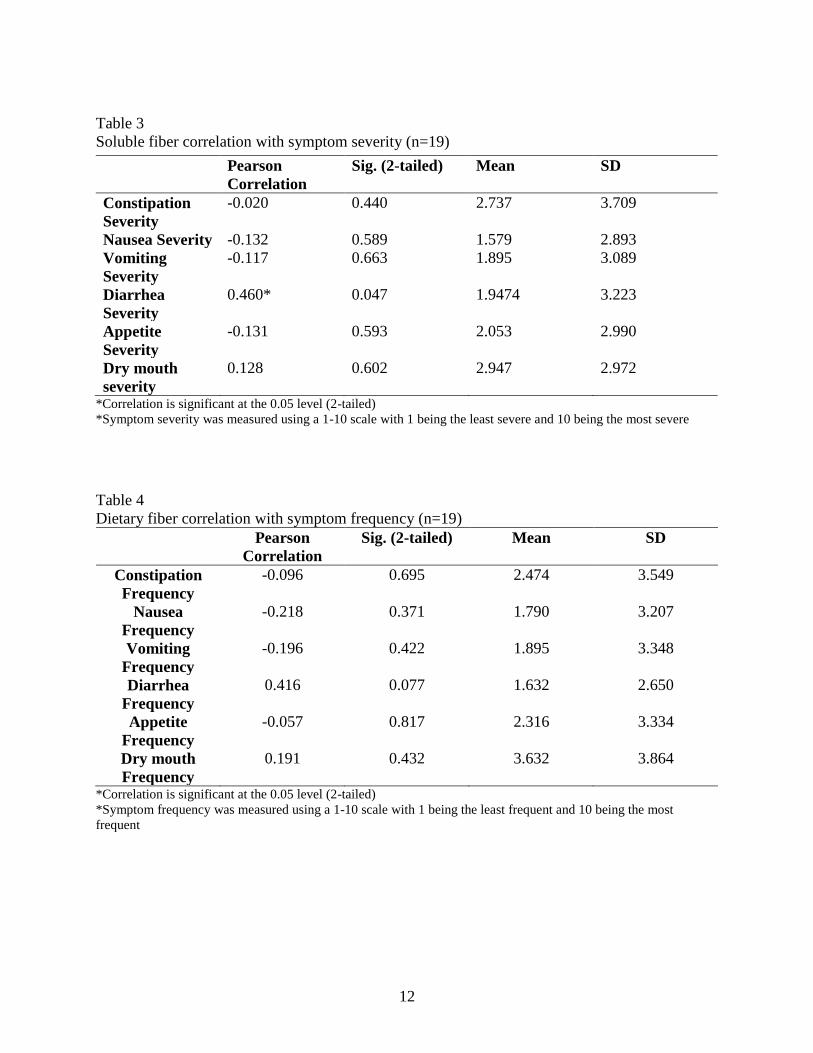
symptom variables. There was a statistically significant positive correlation between soluble
fiber and diarrhea severity with a Pearson correlation value of 0.460 (p=0.047) (Table 3).
6
There were multiple variables that were approaching significance but were not
statistically significant. Table 4 outlines the relationship between dietary fiber and symptom
frequency. There is a positive relationship between dietary fiber and diarrhea frequency with a
Pearson correlation of 0.416 (p=0.077). Soluble fiber and diarrhea frequency have a correlation
of 0.430 (p=0.066) (Table 6). Table 5 shows the correlation between dietary fiber and symptom
severity. The relationship between dietary fiber and diarrhea severity was approaching
significance with a Pearson correlation of 0.427 (p=0.068). Finally, there was no statistically
significant relationship between dietary fiber and symptom bother (Table 7) and soluble fiber
and symptom bother (Table 8).
Discussion
The DFSSBI was a detailed survey asking patients about their hemodialysis-related
symptoms and specifically for this study the focus was in frequency, severity and bother of six
symptoms. The main statistically significant connection between fiber and symptoms was
determined between soluble fiber and diarrhea severity. This study concluded that an increase in
soluble fiber was associated with an increase in diarrhea severity. There were additional trends
identified between dietary fiber and diarrhea frequency, severity and soluble fiber and diarrhea
frequency. Even though these results were not statistically significant, other research has
concluded that fiber intake relates to diarrhea. These results can be rationalized by the impaired
kidney function, impaired colon function and medications that a patient with CKD is prescribed.
When evaluating total amount of dietary and soluble fiber in CKD patients’ diet, the
average amount of fiber consumed by dialysis patients is 15.4 g/day (Chiavaroli , 2015). Patients
who participated in this study consumed just under this average, 12.55 g/day of dietary fiber.

7
Some of the common sources of fiber for the participants included pizza, high protein renal
drinks, vegetables, fruits and cereal. Fiber has multiple roles, which could potentially aid in
treatment options for patients on dialysis. One of the roles of dietary fiber is to reduce colon-
derived solutes and lower plasma urea by reducing the amount of ammonia (Sirich, 2015). There
is a conversion of diffusible ammonia to ammonium, which will lead to nitrogen being excreted
by the feces (Chiavaroli, 2015). This should in turn create less diarrhea, however, the findings
from this study do not support this outcome.
The kidneys help filter the blood and prevent accumulation of waste products in the blood
(Poesen, 2013). Because of the impairment to the kidneys to filter the blood and eliminate toxins
in CKD, there is a high risk of microbial dysbiosis (Khodor, 2017). Medications, acidosis and
altered colonic transit time are associated with microbial dysbiosis, which can trigger an
inflammatory response and an increase in toxins such as urea (Khodor, 2017). Along with urea
being produced, ammonia is also produced and aids in bacterial growth in the colon (Sato, 2005).
A previous study looked at fecal ammonia and urea and its relation to diarrhea in cows. Cows
that had an increase in ammonia had an increase in diarrhea symptoms (Sato, 2005). While cows
do have a different digestive system, this can be applied to the finding from this study in that
dialysis patients typically have increased urea leading to increased ammonia levels, which may
have been contributory to the participants’ diarrhea (Gauchan, 2015; Gowda, 2010).
The colon’s responsibility in the body is to absorb water and salt and absorb other
nutrients produced from bacterial fermentation of dietary fiber (Khodor, 2017). If the colon is not
functioning properly it could lead to an increase in water in the feces leading to diarrhea.
Previous studies have looked at rats with chronic renal failure and the amount of water in the
feces in relation to the colonic transit time. Because of a reduced colonic transit time the rats

8
experienced a higher amount of water in the feces in relation to chronic renal failure (Fu, 2011).
This same study also made a connection with the length of the colonic transit time. A reduced
transit time led to an increase in diarrhea and an increased transit time led to an increase in
constipation (Fu, 2011). The duration per treatment of the dialysis could also affect the severity
of diarrhea. There is a higher probability of patients who are on longer term dialysis to
experience more diarrhea during their treatment (Fu, 2011). Increased water in feces and
decreased transit times due to dialysis could have been another reason for these participants’
diarrhea. This study did not specifically address a duration per treatment of dialysis nor the total
length of time the participant was receiving dialysis. Colonic transit time could have been
reviewed in these participants to determine if this was a causative factor to their diarrhea.
In addition to physiological changes in the body with CKD, patients on dialysis take a
variety of medications to aid in treatment and decrease symptom bother. Anemia management is
one situation that can arise in dialysis patients which leads to patients being prescribed methoxy
polyethylene glycol (commercial name: Mircera) (Frimat, 2013). According to the U.S Food and
Drug Administration (FDA) one of the common symptoms for dialysis patients is diarrhea,
which can occur in greater than 10% of patients (FDA, 2015). This may have been another
contributing factor to why these participants exhibited diarrhea. Erythropoietin is another
medication that aids in anemia correction (Provatopoulou, 2011). Erythropoietin has been seen
to have influenza like symptoms with long-term administration (Singbarti, 1994). These two
medications are a few that patients in this study were administered. There could be a
bidirectional relationship with the medications patients are prescribed and the symptoms
associated during their treatment.

9
This study is one of the few studies to look at fiber intake in relation to symptoms
experienced on while dialysis. One additional study in particular looked at the connection
between soluble fiber and diarrhea symptoms. That study concluded that soluble fiber leads to an
increase in fecal weight but also leads to an increase in stool water content. This study concluded
that there is no statistically significant evidence to confirm that fiber was effective at treating
diarrhea (Slavin, 2009). Most of the literature revolves around protein energy wasting, urea and
creatine concentrations and other diseases that contribute to renal disease such as cardiovascular
disease. This study did address protein and urea concentrations slightly but did not address other
metabolic factors. An area that could be expanded on is fiber intake and its relation to decreasing
cardiovascular disease symptoms in patients with CKD.
This study was performed in one dialysis clinic and had numerous inclusion and
exclusion criteria, however, there are areas that could be improved to increase the accuracy of
the study. There are different factors in this study that can be addressed to explain the evidence
presented and why they conflict with previous research. Some potential errors of the study could
be small sample size, effectiveness of the food frequency questionnaire, and timing of dialysis.
There was one participant who chose to withdraw from the study resulting in a total of 19
participants. Future researchers should increase the sample size to get a larger range of
participants entering into the study to make the results more generalizable. In this study there
was a range of length of dialysis. Some patients started dialysis three weeks prior and others
have been on dialysis for multiple years. To have a more controlled investigation, there should
be a length of time that a participant should be on dialysis to be included in the inclusion criteria.
More data should have been analyzed in relation to blood chemistry. Accurate reporting of urea
and ammonia levels could have supported the conflicting results from previous research
10
regarding increased fiber intake and diarrhea. These participants also had polypharmacy, which
could have skewed results relating to diarrhea. Finally, quality of the fiber sources were not
evaluated in this study. As mentioned previously, some of the common sources of fiber included
pizza, protein shakes and cereal. There could have been a discussion on if the patient is currently
speaking and meeting with a dietitian and if they are following the renal diet with healthy forms
of fiber.
Conclusion
CKD is a chronic progressive disease that requires a large amount of research to
understand the progression of the disease. Nutrition interventions and maintenance of nutrition
status can potentially aid in the progression and potentially decrease the mortality of the patients.
This study was conducted to determine a connection between fiber intake and symptom severity,
bother and frequency in dialysis patients. After performing the FFQ and from evidence
concluded in the Pearson correlation coefficient analysis, there is a connection between soluble
fiber and diarrhea symptoms. There are multiple variables that were approaching significance,
which all related to fiber and diarrhea. Overall, more research is required to determine if fiber
can directly relate to a positive benefit on dialysis patients and a variety of symptoms.

11
Table 1
Demographics (mean, median, mode, SD) (n=19)
Mean Standard
Deviation
(SD)
Gender Male:
21.1%
Female:
78.9%
Weight 87.95
kg
23.10
BMI 29.16 7.71
Table 2
Mean and standard deviation of dietary fiber and
soluble fiber intake
Mean SD
Dietary
Fiber
12.55
grams
6.92
Soluble
Fiber
4.36
grams
2.24
12
Table 3
Soluble fiber correlation with symptom severity (n=19)
*Correlation is significant at the 0.05 level (2-tailed)
*Symptom severity was measured using a 1-10 scale with 1 being the least severe and 10 being the most severe
Table 4
Dietary fiber correlation with symptom frequency (n=19)
Pearson
Correlation
Sig. (2-tailed) Mean SD
Constipation
Frequency
-0.096 0.695 2.474 3.549
Nausea
Frequency
-0.218 0.371 1.790 3.207
Vomiting
Frequency
-0.196 0.422 1.895 3.348
Diarrhea
Frequency
0.416 0.077 1.632 2.650
Appetite
Frequency
-0.057 0.817 2.316 3.334
Dry mouth
Frequency
0.191 0.432 3.632 3.864
*Correlation is significant at the 0.05 level (2-tailed)
*Symptom frequency was measured using a 1-10 scale with 1 being the least frequent and 10 being the most
frequent
Pearson
Correlation
Sig. (2-tailed) Mean SD
Constipation
Severity
-0.020 0.440 2.737 3.709
Nausea Severity -0.132 0.589 1.579 2.893
Vomiting
Severity
-0.117 0.663 1.895 3.089
Diarrhea
Severity
0.460* 0.047 1.9474 3.223
Appetite
Severity
-0.131 0.593 2.053 2.990
Dry mouth
severity
0.128 0.602 2.947 2.972

13
Table 5
Dietary fiber correlation with symptom severity (n=19)
Pearson
Correlation
Sig. (2-tailed) Mean SD
Constipation
Severity
-0.110 0.653 2.737 3.709
Nausea Severity -0.184 0.450 1.579 2.893
Vomiting
Severity
-0.171 0.483 1.895 3.089
Diarrhea
Severity
0.427 0.068 1.9474 3.223
Appetite
Severity
-0.160 0.514 2.053 2.990
Dry mouth
Severity
0.114 0.642 2.947 2.972
*Correlation is significant at the 0.05 level (2-tailed)
*Symptom severity was measured using a 1-10 scale with 1 being the least severe and 10 being the most severe
Table 6
Soluble fiber correlation with symptom frequency (n=19)
Pearson
Correlation
Sig. (2-tailed) Mean SD
Constipation
Frequency
0.014 0.956 2.474 3.549
Nausea
Frequency
-0.179 0.464 1.790 3.207
Vomiting
Frequency
-0.154 0.528 1.895 3.348
Diarrhea
Frequency
0.430 0.066 1.632 2.650
Appetite
Frequency
-0.024 0.923 2.316 3.334
Dry mouth
Frequency
0.168 0.491 3.632 3.864
*Correlation is significant at the 0.05 level (2-tailed)
*Symptom frequency was measured using a 1-10 scale with 1 being the least frequent and 10 being the most
frequent

14
Table 7
Dietary fiber correlation with symptom bother (n=19)
Pearson
Correlation
Sig. (2-tailed) Mean SD
Constipation
Bother
-0.064 0.795 0.842 1.425
Nausea Bother -0.092 0.709 0.684 1.204
Vomiting
Bother
-0.340 0.154 0.632 1.383
Diarrhea
Bother
0.282 0.243 0.632 1.257
Appetite Bother -0.314 0.191 0.737 1.240
Dry mouth
Bother
-0.074 0.765 1.158 1.463
*Correlation is significant at the 0.05 level (2-tailed)
*Symptom bother was measured using a 0-4 scale with 0 being not very much and 4 being very much
Table 8
Soluble fiber correlation with symptom bother (n=19)
Pearson
Correlation
Sig. (2-tailed) Mean SD
Constipation
Bother
0.025 0.920 0.842 1.425
Nausea Bother -0.045 0.855 0.684 1.204
Vomiting
Bother
-0.303 0.207 0.632 1.383
Diarrhea
Bother
0.283 0.240 0.632 1.257
Appetite Bother -0.306 0.203 0.737 1.240
Dry mouth
Bother
-0.073 0.765 1.158 1.463
*Correlation is significant at the 0.05 level (2-tailed)
*Symptom bother was measured using a 0-4 scale with 0 being not very much and 4 being very much

15
CHAPTER II: REVIEW OF THE LITERATURE
End stage renal disease (ESRD) is a chronic condition that is evaluated medically and
nutritionally. Nutrition assessments have been completed and research has been conducted on
patients in ESRD. There are different ways to measure the nutrition status of patients, and many
of these tests revolve around macronutrients and micronutrients on a larger scale. By having a
better understanding of this, it will allow a study to review certain nutrients and its effect the
symptoms experienced with dialysis and ESRD. With a better understand on how different
macronutrients and micronutrients interact in the body, researchers can better understand
different treatment methodologies to enhance the quality of care of dialysis patients.
Chronic Kidney Disease (CKD)
Chronic kidney disease (CKD) is characterized as the inability of the kidneys to perform
proper function due to damage (Escott-Stump, 2015). Due to improper kidney function, there is
an excess build up of urea and other nitrogenous waste products that cannot be circulated out of
the bloodstream, (Escott- Stump, 2015). Some of the common risk factors associated with CKD
include diabetes, family history, smoking, hypertension and obesity (Kazancioğlu, 2013). There
are some modifiable risk factors with CKD including obesity, hyperglycemia and anemia
(Escott-Stump, 2015). There are five different stages of CKD, and each stage is categorized by a
decrease in glomerular filtration rate (GFR) (Mahan, 2012). GFR is used to determine how the
kidneys are functioning and is considered the gold standard of testing for kidney function (Jin,
2008). Once a patient surpasses stage four, severe decrease of function, and is in stage five,

16
kidney failure, medical treatment for end stage renal disease (ESRD) is required for management
of symptoms (Mahan, 2012).
Some common symptoms of ESRD are nausea, vomiting, metallic taste in the mouth and
cramps (Mahan, 2012). Findings as to why symptoms arise from CKD include edema, anemia,
weight loss and hyperkalemia (Chaudhry, 2018). Aside from physical symptoms, psychological
symptoms can also arise such as anxiety, depression and irregular sleep (Chong, 2013).
Depression is one of the most common psychiatric symptoms related to dialysis, and this can
lead to lower adherence of treatment, higher mortality and higher risk of peritonitis (AlDukhayel,
2015).
CKD is not a disease that stands alone, rather, there are other disease that can occur for
these patients. The common disease includes cardiovascular disease, diabetes and hypertension.
These diseases can either be a contributor as to when a patient has CKD or it can be a result of
the diagnosis of CKD. CKD is a risk factor for cardiovascular disease and hypertension.
Mortality risk is 10-30 times higher in individuals with CKD than the healthy population
(Sarnak, 2003). Diabetes also can cause kidney failure because of insulin resistance properties of
CKD.
Peritoneal Dialysis and Hemodialysis
Dialysis is a process where the blood is cleaned to remove solutes and waste products,
which is usually accomplished by a functioning kidney (Escott-Stump, 2015). There are two
common treatment options: Peritoneal dialysis and hemodialysis. To determine which treatment
option is the most appropriate, a physician needs to understand the motivation of the patient,
education, financial situation and other external factors (Sinnakirouchenan, 2011). Families of

17
the patient have to discuss which method will best suit the patient’s needs in terms of time,
available assistance if performing the dialysis at home and water supply in the home (Mahan,
2012).
Peritoneal dialysis utilizes the peritoneum, or membrane surrounding abdominal organs,
and utilizes a solution called dialysate via a catheter to excrete waste byproducts from the body
(Mahan 2012; Peritoneal dialysis, 2018). There are two options if peritoneal dialysis is needed:
continuous ambulatory peritoneal dialysis or intermittent peritoneal dialysis (Escott-Stump,
2015). There are advantages of peritoneal dialysis including a decrease in variability of blood
chemistry levels, less invasive, ability to live a more normal life and cost effective (Mahan 2012;
Pratsinis, 2018).
In hemodialysis, the waste products in the blood are diffused and removed from the blood
by an artificial kidney (Mahan, 2012). A typical treatment of hemodialysis takes three to five
hours and treatment is done three days a week (Mahan, 2012). Some considerations to take with
hemodialysis are availability to show up at a clinic, the health status of the patient, transportation
and family support (Alazmi, 2018). Protein wasting is also a concern with hemodialysis. About
40% of patients on hemodialysis have different stages of protein wasting so nutrition status must
be assessed regularly (Escott-Stump, 2015).
Nutrition Intervention
Nutrition counseling and intervention can help with the treatment of numerous diseases.
Some common data collected include anthropometrics, biochemical and general communication
about nutrition habits (Martin, 2009). When a patient is diagnosed with chronic kidney disease
(CKD), they are put on a restrictive diet to help with their compromised renal system. These

18
restrictions are due to the treatment plan they are put on and there is still controversy on the
amount of food that they should eat before treatment. There are a variety of restrictions that these
patients have, which makes the patients wonder what they can eat. Some of the nutrients that
need to be monitored are protein, phosphorus, potassium, fluid and some vitamins and minerals
(Kalantar-Zadeh, 2015).
For patients categorized as “pre-dialysis,” they are advised to eat a lower amount of
protein to help with the compromised kidney (Kalantar-Zadeh, 2015). Some other rationales are
to help reduce nitrogen intake, increase caloric consumption and reduce stress on the
gastrointestinal tract (Locatelli, 2017). When a patient transitions to dialysis, they are in a high
catabolic state so the risk of protein energy wasting (PEW) is high (Radjen, 2018). Some causes
of PEW can include the patient not being able to make their own food, depression, a
hypermetabolic disorder or dietary restrictions based off dietitian recommendation (Radjen,
2018). Some research recommends that a patient on dialysis should have a protein intake of 1.2-
1.4 g/kg/day, which is two times higher than those on non-dialysis (Kalantar-Zadeh, 2015). One
of the risks of increasing protein can be a higher amount of phosphorus and potassium, which
can increase the acidic environment of the body (Kalantar-Zadeh, 2015).
If patients on dialysis consume too much phosphorus, it can lead to weakened bones,
disruption in heart and muscle function and joint problems (National Kidney Foundation, 2017).
When there is too much phosphorus in the body, calcium is pulled from the bones leading to a
risk of brittle bones and breaks (National Kidney Foundation, 2017). For dialysis patients, it is
recommended for there to be a reduction of phosphorus because the kidneys have a decreased
ability to remove phosphorus, which can also lead to an increase of removal of calcium from the
bones (National Kidney Foundation, 2017). Phosphorus is found in a variety of protein based

19
foods, and if there is a reduction in the amount of phosphorus they are eating, professionals need
to monitor the patient to ensure these patients are not limiting protein intake to avoid muscle
wasting (Kalantar-Zadeh, 2015). It is recommended for patients to stay at an average of less than
800 mg/day (Kalantar-Zadeh, 2015).
Potassium is also a nutrient that is restricted for hemodialysis patients because of the risk
of an increased mortality risk (Kalantar-Zadeh, 2015). An increased amount of potassium can
lead to hyperkalemia, which can increase the risk of sudden cardiac death (Huang, 2015).
Education is needed for these patients because foods high in potassium can also contribute to
heart health. Professionals are required to provide the most beneficial options for patients to eat
without over consuming and overloading the body with potassium (Kalantar-Zadeh, 2015). The
National Kidney Foundation recommends potassium be limited to 2000 milligrams per day for
dialysis patients (National Kidney Foundation, 2017).
Malnutrition Risk for a Patient on Dialysis
Screenings for malnutrition are essential to make sure patients are not at nutritional risk.
As noted earlier, there are a larger number of nutrients to be assessed, and this is key to help with
the survival rate when patients are in the hospital. Some causes of malnutrition include anorexia,
reduced energy intake due to diet change, increased rate of protein catabolism and nutrient loss
in dialysis (Naini, 2016).
The prevalence of anorexia in the CKD population is around 56% (Schick, 2018).
Anorexia in dialysis patients relates to appetite inhibitors, pro-inflammatory cytokines and
neurotransmitter inhibitors related to satiety (Chazot, 2009). Because of the abdominal
discomfort a patient can experience, anorexia is common in hemodialysis, but there is limited

20
research on the direct relationship (Bergstroem, 1996). Anorexia can also increase a malnutrition
inflammation score (MIS), which can decrease quality
of life because of low nutrient intake (Naini, 2016).
Nutrient loss is a topic of interest in dialysis specifically with protein. PEW is the
byproduct of low nutrient intake and is common in those who are undernourished, as in dialysis
(Koefoed, 2016). Muscle or protein wasting can occur during dialysis because of inflammation,
hormone imbalances and a decreased dietary intake (Ikizler, 2010). Monitoring of protein
wasting will be critical to assess the patient and a variety of screening tools may be needed on a
weekly or monthly basis (Radjen, 2018).
There are a variety of tools practitioners can use to test nutritional status, and one is the
nutritional risk index (NRI). The NRI is used as a screening tool by looking at different measures
such as albumin, creatine and nitrogen. Knowing these levels will allow practitioners and
dietitians to evaluate the status of dialysis patients and avoid malnutrition (Prasad, 2016).
Nutrients to Aid in Dialysis Patients
Even though there is a restriction on what dialysis patients can eat, there are nutrients that
are needed to help with their treatment. Different vitamins and minerals have anti-inflammatory
properties that can help manage the symptoms of CKD. Vitamin B12, folate, probiotics and trace
minerals are some of the common nutrients that are seen to help dialysis patients.
Vitamin B12 aids in brain and nervous system function and can also help with hemoglobin
and DNA production (Shaban, 2014). Animal sources as well as dairy products contain a high
amount of vitamin B12. The amount of vitamin B12 is typically normal in dialysis patients;
however, patients need to keep an eye on it in fear of malnutrition (Shaban, 2014). Vitamin B12 is

21
also essential for folate metabolism for absorption, which makes looking at the concentration of
both essential for metabolism and nutritional normalization (Chazot, 2016).
Folate is another nutrient of interest because of its importance in red blood cell
production. One treatment for patients on dialysis is iron replacement therapy to help bring red
blood cells to a normal level and can also eliminate the amount of homocysteine in CKD
patients. Homocysteine is an amino acid that is formed when protein is broken down and can
cause blood clots and heart attacks. Folate is a nutrient that can be used for these patients to help
reduce the amount of homocysteine so long as there is adequate vitamin B12 stores (Schaefer,
2002; Shaban, 2014). Folate can be found in a variety of animal products and vegetables, but
looking at medications will help make sure there is no interference with folate metabolism
(Chazot, 2016).
Trace minerals are needed for the body and some of them include iron, zinc and copper.
Iron will help with the red blood cells, copper works in conjunction with iron for blood cell
production and zinc aids in wound healing. One of the things that needs to be monitored is the
amount of these trace minerals to avoid toxicity. Copper is an element that, if ingested too much,
can lead to toxicity, so it needs to be monitored (Shaban, 2014; Mafra 2016).
Probiotics contain different bacteria strains that are considered “good bacteria.” It helps
the digestive system in enhancing the health of the gut. Dialysis patients’ gut can be affected
because of the amount of toxins in the body as well as restrictions on certain food items.
Probiotics can also help with one of the risks of dialysis, which is inflammation (Bassola, 2016).
One research study in particular looked at the correlation probiotics and inflammation and it
concluded that an increase in probiotics led to a lower pro-inflammatory cytokines and a
reduction in proteinuric kidney disease (Khodor, 2017). Fiber can help normalize the gut, but

22
since dialysis patients are on a low fruit and vegetable diet, there needs to be something else to
help with the inflammation and composition of the gut microbiota (Bassola, 2016).
Importance of Fiber
Dietary fiber is found in fruits, vegetables, whole grains, beans and legumes and other
enriched sources. Fiber is classified in two ways: soluble and insoluble fiber. Each classification
aids in rate of digestion in different ways and moves either quicker or slower in the stomach and
small intestine (Ötles, 2014). Dietary fiber completes its full digestion in the large intestine (Li,
2017). An increase in fiber can help with a better diet quality and has helped with different
chronic diseases.
Fiber has been shown to help lower cholesterol, improve glucose tolerance and help with
general heart health (Lockyer, 2016). Fiber has been shown to help lower cholesterol and have
an inverse correlation with risk factors associated with coronary disease (Naumann, n.d.). Bile
salts are created from the liver in response to cholesterol metabolism (Wang, n.d.). Fiber
prevents the bile salts from reabsorbing which encourages the liver to produce more bile salts
and reduce the amount of cholesterol (Naumann, n.d.). Fiber is also beneficial for overall heart
health which can lead to a reduction in mortality in individuals. In a meta analysis of research
looking at the correlation of fiber and heart health, studies concluded that because of the lipid
lowering properties in fiber, it significantly reduces the risk of mortality from cardiovascular
disease (McRae, 2017). Since patients who have CKD are also at risk for cardiovascular disease,
previous research has looked directly into the effects lowering cardiovascular disease risks in
these patients.

23
As mentioned in the previous section, fruits and vegetables are typically reduced in CKD
patients on dialysis. Fiber is a key component to help create short chain fatty acids to be moved
into the walls of the colon. This is going to help promote normalization in the gut and a healthy
gut microbiota. Fiber has also been shown to help reduce the amount of inflammation in the
body (Bassola, 2016). Previous research has observed fiber consumption and its relation to
inflammatory diseases such as colitis, diabetes and cancer. Reserach confirmed that individuals
who consumed more dietary fiber had a lower incidence of these diseases (Maslowski, 2011).
Previous research has also looked at fiber intake and its effect on kidney health. Dietary
fiber has been shown to have a positive correlation on kidney health by an increase in nitrogen
excretion and a reduction in blood urea nitrogen (BUN) (Xu, 2014). A higher BUN level is
associated with a higher cardiovascular disease mortality risk, and a lower BUN level has been
seen to aid in the clinical side by decreasing hospitalizations and improving clinical outcomes
(JuJo, 2017).
Since fiber has numerous benefits, it makes researchers wonder if it can help with the
treatment of dialysis patients. Since dialysis patients are restricted in common high fiber foods, it
begs the question on the connection of fiber and these patients. In previous studies, the
correlation of fiber and GFR were observed see if the amount of fiber impacted the total GFR.
One study in particular concluded that the increase in fiber intake resulted in the retard of the
decrease of GFR and other pro-inflammatory factors (Lu Lu, 2017). Another study observed
dietary fiber and its effects on the colon. The study determined that fiber can reduce plasma urea
levels by 10-20% (Sirich, 2015). There are limited studies done on dialysis patients and, if there
is a connection, it could lead to another treatment to help inflammation.

24
Quality of Life and Symptoms
There has been a connection with patients in ESRD and poor quality of life and even an
increase in mortality (Gupta, 2016). Quality of life can even be identified in terms of
malnutrition, poor nutritional status, physical and emotional feelings. The mildest form of
malnutrition or undernutrion can lead to a decrease in quality of life for these individuals
(Moreira, 2013). There are multiple symptoms that can occur during or after dialysis, and it is
dependent on the person.
Nausea and vomiting are among some of the many symptoms of dialysis. There are a
variety of reasons an individual can experience nausea or vomiting such as gastrointestinal
distress, drop in blood pressure, anxiety, water imbalances and the amount of urea in the body
(Asgari, 2017). The renal diet is a restrictive diet intended to help during the treatment. Patients
who have CKD have increased levels of sodium and potassium in their saliva, which changes the
taste of certain foods and can cause nausea as well (Manley, 2015). Some ways to help patients
with nausea are to talk to a professional about what the appropriate time to eat is, whether it is
before or after treatment and evaluating electrolyte imbalances (Borzou, 2016).
Depression has been shown to affect 20-30% of people on hemodialysis (Treadwell,
2017). Depression can correlate with an increased level of pro-inflammatory cytokines in an
already highly inflammatory disease (Knuth, 2014). Previous studies have looked at the quality
of life of patients on dialysis, and it is lower than the general population leading to the
consideration of depression treatment alongside hemodialysis (Miljanović, 2018). Depression
can affect the treatment because the patient might not be motivated to go to treatment.
(Treadwell, 2017).

25
Fatigue does not affect each patient in the same way. Roughly 70-97% of patients who
are diagnosed with CKD experience fatigue (Joshwa , 2017). Some describe it as weakness,
tired, emotional or exhausted (Bossola, 2011). Roughly 45-80% of patients also experience
fatigue while on dialysis, and this has been shown to also increase mortality and decrease quality
of life (Moledina, 2015). This fatigue can also be from sleep disorders of the patient. Sleep
disorders are more prevalent in individuals on dialysis in comparison to those who are not on
dialysis (Moledina, 2015). This can be rationalized by the fluid buildup, toxins being flushed out
of the body and over catabolic state of the treatment (Chu, 2018).
Different gastrointestinal (GI) disorders such as gastro-esophageal reflux or esophagitis
can affect patients, and this can in turn lead to malnutrition in a patient (Esfahani, 2009). The
duration of the hemodialysis treatment in terms of months can also impact GI distress. One study
in particular concluded that 70% of patients experience some sort of GI issues yet the longer a
patient is on dialysis the less symptoms they experience (Vui Heng Chong, 2010). All of the
symptoms patients report are causal of dialysis can affect the quality of life as well as eating
patterns.
Summary
CKD is a progressive disease and, upon complete failure of the kidneys, requires dialysis
to help the patient maintain health status and provide a substitute for normal kidney function.
There are two different styles of dialysis, and the decision on which treatment option to use is
dependent on the patient and the current function of the kidneys. Malnutrition is risk associated
with dialysis because of the symptoms associated with dialysis such as fatigue, nausea and
vomiting. Nutrition therapy is a cost effective and non-invasive intervention that can improve

26
patient outcomes and quality of life. Previous research has looked into a variety of vitamins and
minerals such as B12, folate, probiotics and trace minerals to determine if there is a connection to
those nutrients and the relation to maintenance of health and wellness of the patient. Fiber is a
topic that has limited research on for dialysis patients. There are many benefits to fiber
consumption in the general population such as decreased inflammation, heart health benefits and
controlling blood glucose. There is limited research with fiber and its relation to CKD patients
directly. In dialysis patients, fiber plays key roles in decreasing inflammation, decreased GFR
and plasma urea. The overall goal of nutrition in CKD patients on dialysis is to maintain the
quality of life of the patient during the progression of the disease.
27
REFERENCES
Alazmi, M. A., & Aldabbagh, H. A. (2018). Quality of life in chronic hemodialysis patients in
Al-Qurayat General Hospital. Egyptian Journal of Hospital Medicine, 70(12), 2198–2201.
https://doi-org.libproxy.lib.ilstu.edu/10.12816/0045052
AlDukhayel A. (2015). Prevalence of depressive symptoms among hemodialysis and peritoneal
dialysis patients. International journal of health sciences, 9(1), 9-16.
Alonso, A., Nettleton, J. A., Ix, J. H., Boer, I. H., Folsom, A. R., Bidulescu, A., . . . Jacobs, D. R.
(2010). Dietary phosphorus, blood pressure, and incidence of hypertension in the
atherosclerosis risk in communities study and the multi-ethnic study of atherosclerosis.
Hypertension, 55(3), 776-784. doi:10.1161/hypertensionaha.109.143461
Anderson, J. W., Baird, P., Davis, R. H., Jr., Ferreri, S., Knudtson, M., Koraym, A., . . .
Williams, C. L. (2009). Health benefits of dietary fiber. Nutritional Reviews, 67(4), 188-205.
doi:10.1111/j.1753-4887.2009.00189.x
Asgari, M. R., Asghari, F., Ghods, A. A., Ghorbani, R., Hoshmand Motlagh, N., & Rahaei, F.
(2017). Incidence and severity of nausea and vomiting in a group of maintenance
hemodialysis patients. Journal of Renal Injury Prevention, 6(1), 49–55.
http://doi.org/10.15171/jrip.2017.09
Bassola, M. (2016). Can outcomes be improved in dialysis patients by optimizing trace mineral,
micronutrient, and antioxidant status?: The impact of probiotics and a high-fiber diet.
Seminars In Dialysis, 29(1), 50-51. doi:10.1111/sdi.12442

28
Bergstroem, J. (1996). Anorexia in Dialysis Patients. SEMINARS IN NEPHROLOGY, (3), 222.
Retrieved from
http://libproxy.lib.ilstu.edu/login?url=https://search.ebscohost.com/login.aspx?direct=true&d
b=edsbl&AN=RN008007937&site=eds-live&scope=site
Borzou, S. R., Mahdipour, F., Oshvandi, K., Salavati, M., & Alimohammadi, N. (2016). Effect
of mealtime during hemodialysis on patients’ complications. Journal of Caring Sciences,
5(4), 277-286. doi:10.15171/jcs.2016.029
Bossola, M., Vulpio, C., & Tazza, L. (2011). Fatigue in Chronic Dialysis Patients. Seminars In
Dialysis, 24(5), 550-555. doi:10.1111/j.1525-139X.2011.00956.x
Chang, W. X., Xu, N., Kumagai, T., Shiraishi, T., Kikuyama, T., Omizo, H., … Uchida, S. (n.d.).
The impact of normal range of serum phosphorus on the incidence of end-stage renal disease
by a propensity score snalysis. PLOS ONE, 11(4). https://doi-
org.libproxy.lib.ilstu.edu/10.1371/journal.pone.0154469
Chao, C., Tang, C., Cheng, R. W., Wang, M. Y., & Hung, K. (2017). Protein-energy wasting
significantly increases healthcare utilization and costs among patients with chronic kidney
disease: a propensity-score matched cohort study. Current Medical Research & Opinion,
33(9), 1705-1713. doi:10.1080/03007995.2017.1354823
Chaudhry, S. (2018). Chronic kidney disease (CKD). Retrieved from
http://www.pathophys.org/ckd/#Pathophysiology
Chazot, C. (2009). Why are chronic kidney disease patients anorexic and what can be done about
it? Seminars in Nephrology, 29(1), 15-23. doi:10.1016/j.semnephrol.2008.10.003

29
Chazot, C., Jean, G., & Kopple, J. D. (2016). Can Outcomes be Improved in Dialysis Patients by
Optimizing Trace Mineral, Micronutrient, and Antioxidant Status?: The Impact of Vitamins
and their Supplementation. Seminars In Dialysis, 29(1), 39-48. doi:10.1111/sdi.12443
Chiavaroli, L., Mirrahimi, A., Sievenpiper, J. L., Jenkins, D. J. A., & Darling, P. B. (2015).
Dietary fiber effects in chronic kidney disease: a systematic review and meta-analysis of
controlled feeding trials. European Journal of Clinical Nutrition, 69(7), 761–768. https://doi-
org.libproxy.lib.ilstu.edu/10.1038/ejcn.2014.237
Chong, Vui Heng, and Jackson Tan. 2013. “Prevalence of Gastrointestinal and Psychosomatic
Symptoms among Asian Patients Undergoing Regular Hemodialysis.” Nephrology 18 (2):
97–103. doi:10.1111/nep.12000.
Chronic kidney disease. (2018, March 28). Retrieved from
https://www.kidney.org/atoz/content/about-chronic-kidney-disease
Chu, G., Szymanski, K., Tomlins, M., Yates, N., & McDonald, V. M. (2018). Nursing care
considerations for dialysis patients with a sleep disorder. Renal Society of Australasia
Journal, 14(2), 52. Retrieved from
http://libproxy.lib.ilstu.edu/login?url=https://search.ebscohost.com/login.aspx?direct=true&d
b=edb&AN=130766973&site=eds-live&scope=site
Chung, W. F., Walker, A. W., Louis, P., Parkhill, J., Vermeiren, J., Bosscher, D., & ... Flint, H. J.
(2016). Modulation of the human gut microbiota by dietary fibres occurs at the species level.
BMC Biology, 141-13. doi:10.1186/s12915-015-0224-3
Escott-Stump, S. (2015). Nutrition and diagnosis-related care (7th ed.). Philadelphia: Wolters
Kluwer.

30
Esfahani, S. T., Madani, A., Ataei, N., Nadjafi, M., Mohseni, P., Allahverdi, B., & Haddadi, M.
(2009). Upper Gastrointestinal Disorders in Children with End-Stage Renal Disease. Acta
Medica Iranica, 47(1), 46-50.
FDA. (2015). Retrieved December 21, 2018, from
https://www.accessdata.fda.gov/drugsatfda_docs/label/2015/125164s070lbl.pdf
Frimat, L., Mariat, C., Landais, P., Koné, S., Commenges, B., & Choukroun, G. (2013). Anaemia
management with C.E.R.A. in routine clinical practice: OCEANE (Cohorte
Mircerapatientsnon-dialysés), a national, multicenter, longitudinal, observational prospective
study, in patients with chronic kidney disease not on dialysis. BMJ Open, 3(3).
doi:10.1136/bmjopen-2012-001888.
Fu, R.-G., Wang, Y., Yuan, H.-Z., Zhou, J.-P., Wang, L., Liu, X.-D., … Zhang, J. (2011). Effects
of Chronic Renal Failure on Gastrointestinal Motility: A Study on the Changes of Gastric
Emptying, Small Intestinal Transit, Interdigestive Myoelectric Complex, and Fecal Water
Content. Renal Failure, 33(6), 615–621. https://doi-
org.libproxy.lib.ilstu.edu/10.3109/0886022X.2011.581404
Gauchan, E., & Malla, K. K. (2015). Relationship of Renal Function Tests and Electrolyte
Levels with Severity of Dehydration in Acute Diarrhea. Journal of Nepal Health Research
Council, 13(1), 84. Retrieved from
http://libproxy.lib.ilstu.edu/login?url=https://search.ebscohost.com/login.aspx?direct=true&d
b=edb&AN=109931518&site=eds-live&scope=site
Gorman, M. A., & Bowman, C. (1993). Position of The American Dietetic Association: Health
implications of dietary fiber. Journal of the American Dietetic Association, 93(12), 1446-
1447. doi:10.1016/0002-8223(93)92252-s

31
Gowda, S., Desai, P. B., Kulkarni, S. S., Hull, V. V., Math, A. A., & Vernekar, S. N. (2010).
Markers of renal function tests. North American journal of medical sciences, 2(4), 170-3
Gupta, P., & Gupta, R. (2016). Severity of chronic kidney disease associated pruritus clinically
related to symptomatic pheripheral neuropathy in patients of end stage renal disease on
maintenance hemodialysis: Our experience. JK Science, 18(3), 150-154.
Hemodialysis. (2018, January 01). Retrieved April 26, 2018, from
https://www.niddk.nih.gov/health-information/kidney-disease/kidney-failure/hemodialysis
Hou, Y., Li, X., Sun, L., Qu, Z., Jiang, L., & Du, Y. (2017). Phosphorus and mortality risk in
end-stage renal disease: A meta-analysis. Clinica Chimica Acta, 474108-113.
doi:10.1016/j.cca.2017.09.005
Huang, C.-W., Lee, M.-J., Lee, P.-T., Hsu, C.-Y., Huang, W.-C., Chen, C.-L., … Fang, H.-C.
(2015). Low potassium dialysate as a protective factor of sudden cardiac death in
hemodialysis patients with hyperkalemia. PLoS ONE, 10(10), 1. Retrieved from
http://libproxy.lib.ilstu.edu/login?url=https://search.ebscohost.com/login.aspx?direct=true&d
b=edb&AN=110161843&site=eds-live&scope=site
Ikizler, T. A. (2010). Counteracting muscle wasting In patients receiving dialysis. Renal &
Urology News, 9(1), 16–18. Retrieved from
http://libproxy.lib.ilstu.edu/login?url=https://search.ebscohost.com/login.aspx?direct=true&d
b=a9h&AN=47691566&site=eds-live&scope=site
Jin, R., Grunkemeier, G. L., Brown, J. R., & Furnary, A. P. (2008). Estimated glomerular
filtration rate and renal function. The Annals of Thoracic Surgery, 86(1), 1-3.
doi:10.1016/j.athoracsur.2008.05.007

32
Joshwa, B. (2017). Fatigue in Patients with Chronic Kidney Disease: Evidence and Measures.
Nephrology Nursing Journal, 44(4), 337–344. Retrieved from
http://libproxy.lib.ilstu.edu/login?url=https://search.ebscohost.com/login.aspx?direct=true&d
b=c9h&AN=124650313&site=eds-live&scope=site
Jujo, K., Minami, Y., Haruki, S., Matsue, Y., Shimazaki, K., Kadowaki, H., . . . Hagiwara, N.
(2017). Persistent high blood urea nitrogen level is associated with increased risk of
cardiovascular events in patients with acute heart failure. ESC Heart Failure, 4(4), 545-553.
doi:10.1002/ehf2.12188
K/DOQI Clinical practice guidelines for bone metabolism and disease in children with chronic
kidney disease. (2005). American Journal of Kidney Diseases, 46, 4.
doi:10.1053/j.ajkd.2005.07.028
Kalantar-Zadeh, K., Tortorici, A. R., Chen, J. T., Kamgar, M., Lau, W., Moradi, H., & ...
Kovesdy, C. P. (2015). Dietary Restrictions in Dialysis Patients: Is There Anything Left to
Eat?. Seminars In Dialysis, 28(2), 159-168. doi:10.1111/sdi.12348
Kazancioğlu, R. (2013). Risk factors for chronic kidney disease: An update. Kidney International
Supplements, 3(4), 368-371. doi:10.1038/kisup.2013.79
Kelkar, M., Cleves, M. A., Foster, H. R., Hogan, W. R., James, L. P., & Martin, B. C. (2012).
Acute and chronic acetaminophen use and renal disease: a case-control study using pharmacy
and medical claims. Journal of managed care pharmacy : JMCP, 18(3), 234-46.
Khodor, S., & Shatat, I. (2017). Gut microbiome and kidney disease: a bidirectional relationship.
Pediatric Nephrology, 32(6), 921–931. https://doi-org.libproxy.lib.ilstu.edu/10.1007/s00467-
016-3392-7

33
Kidney Disease Statistics for the United States. (2016, December 01). Retrieved from
https://www.niddk.nih.gov/health-information/health-statistics/kidney-disease
Knuth, B., Radtke, V., Rocha, P., Silva, K. S., Dalsóglio, F., Gazal, M., & ... Oses, J. P. (2014).
Prevalence of depression symptoms and serum levels of interleukin-6 in hemodialysis
patients. Psychiatry & Clinical Neurosciences, 68(4), 275-282. doi:10.1111/pcn.12130
Ko, B., Chang, Y., Ryu, S., Kim, E. M., Lee, M. Y., Hyun, Y. Y., & Lee, K. (2017). Dietary acid
load and chronic kidney disease in elderly adults: Protein and potassium intake. Plos ONE,
12(9), 1-10. doi:10.1371/journal.pone.0185069
Koefoed, M., Kromann, C. B., Juliussen, S. R., Hvidtfeldt, D., Ekelund, B., Frandsen, N. E., &
Marckmann, P. (2016). Nutritional Status of Maintenance Dialysis Patients: Low Lean Body
Mass Index and Obesity Are Common, Protein-Energy Wasting Is Uncommon. PLoS ONE,
11(2), 1–11. https://doi-org.libproxy.lib.ilstu.edu/10.1371/journal.pone.0150012
Lambeau, K. V., & McRorie, J. W. (2017). Fiber supplements and clinically proven health
benefits: How to recognize and recommend an effective fiber therapy. Journal Of The
American Association Of Nurse Practitioners, 29(4), 216-223. doi:10.1002/2327-6924.12447
Li, Y. O., & Komarek, A. R. (2017). Dietary fibre basics: Health, nutrition, analysis, and
applications. Food Quality and Safety, 1(1), 47-59. doi:https://doi.org/10.1093/fqsafe/fyx007
Locatelli, F., Del Vecchio, L., & Aicardi, V. (2017). Nutritional Issues with Incremental
Dialysis: The Role of Low-Protein Diets. Seminars in Dialysis, 30(3), 246–250. https://doi-
org.libproxy.lib.ilstu.edu/10.1111/sdi.12585
Lockyer, S., Spiro, A., & Stanner, S. (2016). Dietary fibre and the prevention of chronic disease -
should health professionals be doing more to raise awareness?. Nutrition Bulletin, 41(3), 214-
231. doi:10.1111/nbu.12212

34
Lu Lu, Yan-Feng Huang, Ming-Qing Wang, De-Xiu Chen, Heng Wan, Lian-Bo Wei, … Xiao.
(2017). Dietary fiber intake is associated with chronic kidney disease (CKD) progression and
cardiovascular risk, but not protein nutritional status, in adults with CKD. Asia Pacific
Journal of Clinical Nutrition, 26(4), 598–605. https://doi-
org.libproxy.lib.ilstu.edu/10.6133/apjcn.072016.08
Mafra, D. (2016). Can outcomes be improved in dialysis patients by optimizing trace mineral,
micronutrient, and antioxidant status? The role of trace elements. Seminars In Dialysis,
29(1), 48-50. doi:10.1111/sdi.12444
Mahan, L. K., & Raymond, J. L. (2012). Krauses food & the nutrition care process (13th ed.).
St. Louis, MO: Elsevier.
Manley, K. J. (2015). Taste genetics and gastrointestinal symptoms experienced in chronic
kidney disease. European Journal Of Clinical Nutrition, 69(7), 781-785.
doi:10.1038/ejcn.2015.80
Mahan, L. K., & Raymond, J. L. (2012). Krauses food & the nutrition care process (13th ed.).
St. Louis, MO: Elsevier.
Marieb, E. N., & Hoehn, K. (2013). Human anatomy & physiology (9th ed.). Glenview, IL:
Pearson.
Maslowski, K. M., & Mackay, C. R. (2011). Diet, gut microbiota and immune responses. Nature
Immunology, 12(1), 5–9. https://doi-org.libproxy.lib.ilstu.edu/10.1038/ni0111-5
McRae M. P. (2017). Dietary Fiber Is Beneficial for the Prevention of Cardiovascular Disease:
An Umbrella Review of Meta-analyses. Journal of chiropractic medicine, 16(4), 289-299.
Milner, Q. (2003). Pathophysiology of chronic renal failure. BJA CEPD Reviews, 3(5), 130-133.
doi:10.1093/bjacepd/mkg130

35
Moledina, D. G., & Perry Wilson, F. (2015). Pharmacologic Treatment of Common Symptoms
in Dialysis Patients: A Narrative Review. Seminars In Dialysis, 28(4), 377-383.
doi:10.1111/sdi.12378
Moreira, A. C., Carolino, E., Domingos, F., Gaspar, A., Ponce, P., & Camilo, M. E. (2013).
Nutritional status influences generic and disease-specific quality of life measures in
haemodialysis patients. Nutricion Hospitalaria, 28(3), 951-957.
doi:10.3305/nh.2013.28.3.6454
Martin, F., Gonzalez, L., Rojas, E., Ruiz, N., Gonzalez, J., Pazarin, L., & Cueto-Manzano, A. M.
(2009). Conventional nutritional counseling maintains nutritional status of patients on
continuous ambulatory peritoneal dialysis in spite of systemic inflammation and decrease of
residual renal function. Nephrology, 14(5), 493-498. doi:10.1111/j.1440-1797.2008.01081.x
Miljanović, G., Marjanović, M., Radaković, S., Janošević, M., Mraović, T., & Rađen, S. (2018).
Health-related quality of life in patients undergoing hemodialysis. Vojnosanitetski Pregled:
Military Medical & Pharmaceutical Journal of Serbia, 75(3), 246–252. https://doi-
org.libproxy.lib.ilstu.edu/10.2298/VSP160511211M
Naini, A. E., Karbalaie, A., Abedini, M., Askari, G., & Moeinzadeh, F. (2016). Comparison of
malnutrition in hemodialysis and peritoneal dialysis patients and its relationship with
echocardiographic findings. Journal of Research in Medical Sciences, 21(1), 1–4. Retrieved
from
http://libproxy.lib.ilstu.edu/login?url=https://search.ebscohost.com/login.aspx?direct=true&d
b=a9h&AN=118099318&site=ehost-live&scope=site

36
Nasri, H., & Rafieian-Kopaei, M. (2015). Diabetes mellitus and renal failure: Prevention and
management. Journal of research in medical sciences : the official journal of Isfahan
University of Medical Sciences, 20(11), 1112-20.
National Kidney Foundation. (2017, February 03). Retrieved October 07, 2017, from
https://www.kidney.org/atoz/content/dietary_hemodialysis
Naumann, S., Schweiggert-Weisz, U., Bader-Mittermaier, S., Haller, D., & Eisner, P. (n.d.).
Differentiation of Adsorptive and Viscous Effects of Dietary Fibres on Bile Acid Release by
Means of In Vitro Digestion and Dialysis. INTERNATIONAL JOURNAL OF MOLECULAR
SCIENCES, 19(8). https://doi-org.libproxy.lib.ilstu.edu/10.3390/ijms19082193
Nuttall, F. Q. (2015). Body Mass Index. Nutrition Today, 50(3), 117-128.
doi:10.1097/nt.0000000000000092
Ötles, S., & Ozgoz, S. (2014). Health effects of dietary fiber. Acta Scientiarum Polonorum.
Technologia Alimentaria, 13(2), 191-202.
Peipert, J. D., Bentler, P. M., Klicko, K., & Hays, R. D. (2018). Original investigation:
psychometric properties of the kidney disease quality of life 36-Item short-form survey
(KDQOL-36) in the United States. American Journal Of Kidney Diseases, 71461-468.
doi:10.1053/j.ajkd.2017.07.020
Peritoneal dialysis. (2018, January 01). Retrieved from https://www.niddk.nih.gov/health-
information/kidney-disease/kidney-failure/peritoneal-dialysis#whatis
Poesen, R., Meijers, B., & Evenepoel, P. (2013). The Colon: An Overlooked Site for
Therapeutics in Dialysis Patients. Seminars in Dialysis, 26(3), 323–332. https://doi-
org.libproxy.lib.ilstu.edu/10.1111/sdi.12082

37
Prasad, N., Sinha, A., Gupta, A., Bhadauria, D., Manjunath, R., Kaul, A., & Sharma, R. K.
(2016). Validity of nutrition risk index as a malnutrition screening tool compared with
subjective global assessment in end-stage renal disease patients on peritoneal dialysis. Indian
Journal Of Nephrology, 26(1), 27-32. doi:10.4103/0971-4065.158449
Pratsinis, A., Jean-Christophe Leroux, & Olivier Devuyst. (2018). Peritoneal dialysis beyond
kidney failure? Journal of Controlled Release, 282, 3–12. https://doi-
org.libproxy.lib.ilstu.edu/http://dx.doi.org/10.1016/j.jconrel.2018.01.017
Provatopoulou, S. T., & Ziroyiannis, P. N. (2011). Clinical use of erythropoietin in chronic
kidney disease: outcomes and future prospects. Hippokratia, 15(2), 109-15
Radjen, S., Ristić-Medić, D., Terzić, B., Djurović, B., & Mijušković, M. (2018). Protein-energy
wasting in maintenance hemodialysis patients - etiology and diagnosis. Vojnosanitetski
Pregled: Military Medical & Pharmaceutical Journal of Serbia, 75(4), 404–409. https://doi-
org.libproxy.lib.ilstu.edu/10.2298/VSP160902352R
Raj, R., Ahuja, K. D., Frandsen, M., & Jose, M. (2017). Symptoms and their recognition in adult
haemodialysis patients: Interactions with quality of life. Nephrology, 22(3), 228-233.
doi:10.1111/nep.12754
Sarnak, M. J., Levey, A. S., Schoolwerth, A. C., MD, & Coresh, J., MD. (2003, October 28).
Kidney disease as a risk factor for development of cardiovascular disease. Retrieved
February 15, 2019, from
https://www.ahajournals.org/doi/full/10.1161/01.CIR.0000095676.90936.80

38
Sato, H., & Nakajima, J. (2005). Fecal ammonia, urea, volatile fatty acid and lactate levels in
dairy cows and their pathophysiological significance during diarrhea. ANIMAL SCIENCE
JOURNAL -ENGLISH EDITION-, (6), 595. Retrieved from
http://libproxy.lib.ilstu.edu/login?url=https://search.ebscohost.com/login.aspx?direct=true&d
b=edsbl&AN=RN177912837&site=eds-live&scope=site
Shaban, H., Ubaid-Ullah, M., & Berns, J. S. (2014). Measuring vitamin, mineral, and trace
element levels in dialysis patients. Seminars In Dialysis, 27(6), 582-586.
doi:10.1111/sdi.12260
Schick-Makaroff, K. (2018). Symptoms, Coping, and Quality of Life of People with Chronic
Kidney Disease. Nephrology Nursing Journal, 45(4), 339–355. Retrieved from
http://libproxy.lib.ilstu.edu/login?url=https://search.ebscohost.com/login.aspx?direct=true&
db=c9h&AN=131366617&site=eds-live&scope=site
Simpson, H. L., & Campbell, B. J. (2015). Review article: dietary fibre-microbiota interactions.
Alimentary Pharmacology & Therapeutics, 42(2), 158-179. doi:10.1111/apt.13248
Singbarti, G. (1994). Adverse events of erythropoietin in long-term and in acute/short-term
treatment. Retrieved from https://www.ncbi.nlm.nih.gov/pubmed/7950171.
Sinnakirouchenan, R., & Holley, J. L. (2011). Peritoneal dialysis versus hemodialysis: Risks,
benefits, and access issues. Advances in Chronic Kidney Disease, 18(6), 428-432.
doi:10.1053/j.ackd.2011.09.001
Sirich, T. L., & Uribarri, J. (2015). Dietary Protein and Fiber in End Stage Renal Disease.
Seminars in Dialysis, 28(1), 75–80. https://doi-org.libproxy.lib.ilstu.edu/10.1111/sdi.12315

39
Slavin, J., Savarino, V., Paredes-Diaz, A., & Fotopoulos, G. (2009). A Review of the Role of
Soluble Fiber in Health with Specific Reference to Wheat Dextrin. Journal of International
Medical Research, 37(1), 1–17. https://doi.org/10.1177/147323000903700101
Suki, W. N., & Moore, L. W. (2016). Phosphorus regulation in chronic kidney disease.
Methodist Debakey Cardiovascular Journal, 126-9.
Thompson, J. L., Manore, M., & Vaughan, L. A. (2014). The science of nutrition (3rd ed.).
Boston, MA: Pearson Education.
Treadwell, A. A. (2017). Examining depression in patients on dialysis. Nephrology Nursing
Journal, 44(4), 295–308. Retrieved from
http://libproxy.lib.ilstu.edu/login?url=https://search.ebscohost.com/login.aspx?direct=true&
db=c9h&AN=124650309&site=eds-live&scope=site
United States renal data system. (2018). Retrieved April 27, 2018, from
https://www.usrds.org/Default.aspx
Vui Heng Chong. (2010). Impact of duration of hemodialysis on gastrointestinal symptoms in
patients with end stage renal failure. Journal of Gastrointestinal & Liver Diseases, 19(4),
462–463. Retrieved from
http://libproxy.lib.ilstu.edu/login?url=https://search.ebscohost.com/login.aspx?direct=true&
db=a9h&AN=57632342&site=eds-live&scope=site’
Wang, W., Onnagawa, M., Yoshie, Y., & Suzuki, T. (n.d.). Binding of bile salts to soluble and
insoluble dietary fibers of seaweeds. FISHERIES SCIENCE, 67(6), 1169–1173. Retrieved
from
http://libproxy.lib.ilstu.edu/login?url=https://search.ebscohost.com/login.aspx?direct=true&
db=edswsc&AN=000172944900023&site=eds-live&scope=site

40
Xu, H., Huang, X., Risérus, U., Krishnamurthy, V. M., Cederholm, T., Arnlöv, J., Lindholm, B.,
Sjögren, P., … Carrero, J. J. (2014). Dietary fiber, kidney function, inflammation, and
mortality risk. Clinical journal of the American Society of Nephrology : CJASN, 9(12),
2104-10.