fiber deployment update end of year 1991system, fiber miles of fiber deployed, sheath miles of fiber...
TRANSCRIPT

FIBER DEPLOYMENT UPDATE
End of Year 1991
By Jon·atban M. Kraushaar
Industry Analysis Division - Common Carrier Bureau
Federal Communic.ati-Ons Commission
March 1992

FIBER DEPLOYMENT UPDATE
End of Year 1991
By Jonathan M. Kraushaar
Industry Analysis Division - Common Carrier Bureau
Federal Communications Commission
Introduction and Overview
This report was first released in December 1986; since then it has been updated annually. Its primary purpose is to document fiber capacity built or used by communications common ~arriers. It is divided into several sections. The first part reviews the elements .of · statistical data being collected and discusses the methods, procedures and shortcomings associated with the data and the data collection process. The following parts present key statistics for each of the main categories of carriers along with highlights of important issues and developments. Statistical data illustrating key fiber trends and developments are included in a series of tables following each section of the report.
The scope of this report was originally limited to data on the interexchange carriers and the regional Bell holding companies, but has for the last few years included data on urban fiber systems and non-Bell local operating companies. The report also presents a general review of the technology and associated current developments. A list of references is appended for those wishing to obtain a more in-depth analysis of a specific area of interest.
The interexchange carriers are an important driving force in the industry. Their interest in reliable and low-cost access is impacting the quality of service and development of technology all the way down to the locallevel. The expansion of their long-haul fiber capacity continues to focus on greater utilization of the existing deployed fiber, either by using te.chnologies with higher bit rates or throughputs, or by equipping previously "dark" fibers. Fiber growth for these carriers has been about 12 percent over the past two years.
The local operating companies have increased their fiber in pl·ant by about 35.4 percent this year compared to a revised growth figure of about 36.5 percept last year. These entities report the use of redundant fiber systems (sometimes called "rings"), fiber-to-the-curb systems in which the fiber does not extend all the way to the customer, and a number of fiber-to-the-home trials. Growth rates are influenced by economic and regulatory developments. However, over the longer term, significant levels of growth will be implementei as local carriers extend fiber closer to the customer by deploying more fiber in the feeder plant. It is also noted that while growth of deployed fiber for many of the companies appears to have declined this year, fiber growth for U.S. West and Bell Atlantic increased significantly. There
See reference 35.
has generally been increasing interest in fiber architectures and technologies that facilitate economically deploying fiber closer to the customer. This interest is evidenced, for example, by so-called fiber-to-the- curb systems which ap:fear to be supported by Bell Communications Research (Bellcore), at least for near-term use. In addition, fiber con figurations featuring redundant access are appearing in metropolitan areas.
Besides the local operating companies, there has also been expansion in the urban or metropolitan fiber systems. While the amount of fiber in these systems continues to be small in relation to the fiber deployed by the local operating companies, this continues to be a dynamic sector of the industry. Furthermore, these companies have attracted the attention of the interexchange carriers, who appear to be interested in efficient, reliable and low-cost alternatives for interconnecting their points-of-presence in metropolitan areas and accessing their customers in large office buildings. The urban fiber carriers have increased their fiber at an even greater rate this year than last. These entities structure their fiber in rings usually around metropolitan areas with high concentrations of businesses. The number of entities covered. by this report has been steadily increasing, reflecting the rapid growth of this sector.
Other entities such as electric utilities and cable TV companies have also been deploying fiber. Agreements for joint use or deployment by power utilities and interexchange carriers were discussed in past reports and continue to play a role in new deployments of interexchange carriers. New approaches for providing increased bandwidth capability to residences and businesses continue to be in the spotlight, with attention being placed on cost effective fiber architectures for such deployments. The innovative approaches of these entities should not be overlooked in this quest.
Items of Data Collected
This report summarizes survey data from three categories of carriers: interexchange carriers, local operating telephone companies, and metropolitan or urban fiber carriers.
Carriers were contacted by telephone and a written description of the requested data items was made available to them. These descriptions are summarized in the notes to the accompanying tables and have led, in some cases, to data adjustments for prior years. Five elements of the request are common to all carriers surveyed. These are route-miles of fiber system, fiber miles of fiber deployed, sheath miles of fiber cable deployed, fiber miles of "lit" or equipped fiber, and investment in backbone fiber facilities (i.e., underlying fiber, repeater, and deployment cost). It may be useful to note that two fiber cables ~xtending 100 miles along the same route and each containing 10 fibers would result in 100 route miles of fiber, 200 sheath miles, and 2,000 fiber miles in the statistics collected. '
These statistics are useful as an indication of the potential capacity of each carrier's system because the number of circuits that can be multiplexed onto the· same fiber can change as terminal and repeater technologies improve. Therefore, the same underlying fiber data can be used in conjunction with updated estimates of available terminal technology to arrive at updated estimates of maximum available capacity. For example, the advent of 1.76 gigabit terminal technology, which supports up to about 25,000 2-way circuits on a single fiber pair,
2 See reference 66.
2
more than tripled the capacity of earlier systems. 3 Many carriers are acutely aware that although up-front costs for fiber deployment in absolute terms are high, a significant portion of the total investment can be deferred until actual demand materializes, thus allowing the use of the most up-to-date equipment available for equipping the fiber.
A number of other items oCdata have been requested that are tailored to the category of carriers to which the request was made. For the interexchange carriers the total number of points of presence or points of interconnection to local or metropolitan carriers was requested, which was to include interconnection locations which may not be owned by the interexchange carrier. A number of carriers did not provide this data this year. AT&T provided point of presence data only for its switched services. The number of points of presence like fiber route mileage provides a very basic measure of network coverage.
To provide some estimate of the cost of equipping terminal and repeater electronic and optoelectronic equipment on fibers in relation to the underlying fiber investment, data on both backbone fiber investment and DS-3 investment was requested along with DS-3 mileage. Actual DS-3 mileage divided by the potential DS-3 mileage (i.e., assuming all fibers were equipped with the highest capacity systems) would provide an indication of the application of the latest available terminal and repeater technology and would provide a measure of current fiber utilization. Investment per DS-3 mile was calculated based on the limited available data and is listed in Table 4.
Information on fiber facilities leased from other entities was requested to insure that leased fiber capacity would not be included with owned fiber. This should have minimized the chance of double counting of fiber. In at least one instance fiber statistics have been revised to remove leased fiber, which had erroneously been included in prior data submissions. Finally, information on sharing of fiber facilities with electric utilities was requested this year but was not provided by many of the interexchange carriers. Although it is expected that this report has only identified a portion of the total leased and shared capacity, the information on the amount of leased fiber capacity also provides some indication of the amount of interaction among those entities deploying fiber.
Information on the application of fiber technology in several areas was included in the survey of the local operating companies. First, in formation on fiber-to-the-curb systems allowing residential fiber to be shared to the pedestal or drop wire by several residences was requested. Second, in formation on fiber technology trials including, but not limited to fiber-to-the-home trials, was requested. Third, information on fiber rings or redundancy arrangements (either dedicated or using a bus structure) was requested. These systems appear to compete with metropolitan or urban fiber systems. Finally, statistics on central office and customer fiber terminations not associated with fiber trials were incl.uded in this year's survey.
For metropolitan fiber carriers, information on the numbe·r of customer locations and buildings served was requested in addition to the information on the extent of deployed fiber. The information on buildings and customer locations served was provided by nearly all entities and is reported in Table 15.
3 The 1.76 gigabit systems can handle 36 DS-3's or 24,192 circuits as compared to 28 DS-3's or 18,816 circuits for the 1.2 gigabit systems.
3

Source Methods and Data Limitations
This report primarily focuses on domestic common carrier use of fiber and is based on survey work conducted since the fall of 1985. In prior years a significant amount of the data was collected through telephone interviews with key representatives of the carriers. This approach is now supplemented witli a written description of the survey items which is made available to each participating carrier. The items of data collected are described with. the tables. It was hoped that this procedure would make the reported data somewhat more uniform.
Telephone interviews and a survey item description sheet were used, and follow-up focused on clarification and questions about the responses as well as more general questions on current developments and trends. A number of trade associations including the Utilities Telecommunications Council representing electric utilities, the National Cable Television Association and the Association for Local Telecommunications Services (ALTS) representing urban fiber carriers have also provided input and have been very cooperative and helpful. The Bell Operating Companies were initially contacted by letter. The report has benefitted from the opportunity to talk directly with a variety of industry and industry association contacts. The author greatly appreciates the support and cooperation of all those individuals who made this report possible, especially in view of the fact that the survey was conducted informally and the responses were voluntary.
Most entities provided nearly all of the requested data. In a few instances, provided data may have been excluded from this report where inconsistences were detected or where data items not heretofore requested were not provided by enough of the reporting entities. Several reporting problems h<l.ve been identified in the past and an attempt has been made to correct these by modifying and augmenting the surveyed items. First, both route and cable sheath mileage were requested of interexchange and urban carriers to insure that carriers with multiple cables in a ro~te make a proper distinction in these data items. Second, the fact that fiber data requested is for owned fiber was reiterated and was further highlighted by separately requesting data on leased fiber. Third, more detailed information on fiber technology trials, fiber-to-the-curb systems and fiber terminations was requested of the Bell operating companies. Urban carriers were asked to supply counts of buildings and customer locations served by fiber. Local operating companies, which in many cases do not track buildings served, were asked to provide data on customer locations served by fiber rings or other forms of redundant access. In some instances their responses were incomplete or limited. Finally, the interexchange carriers were asked to separate backbone investment from the
investment associated with DS-3 additions.
With continuing merger and acquisition activity as well as joint ventures, capacity sharing arrangements, leases, etc., it has become increasingly difficultto be sure that no double counting of capacity has occurred. Of particular note is the fact that the interexchange carriers typically have categorized fiber constructed with electric utilities as owned cable even though long-term leases or right to use arrangements may have been used. Since the terms of such shared-use agreements with the electric utilities are confidential and may vary, there was no way of assuring that all such agreements were handled in the same way as they impact the amount of owned fiber. Nonetheless, fiber capacity obtained through long-term agreements with entities which themselves are not interexchange carriers would not lead to double counting insofar as the primary scope of this report is concerned. Thus, inclusion of such fiber as owned capacity of the interexchange carriers was permitted.
Another problem in evaluating the data is the widespread use of redundant paths or
4

routes. Redundancy, in general, makes it more difficult to benchmark utilization levels. Also, mergers compound this problem and may result in situations, due to overlapping of routes, where combined route mileages are less than the sum of the parts. In general, as mergers and overbuilds occur, the likelihood of ambiguity on route mileage data increases. For this reason, all carriers were requested to provide sheath mileage supplementing any route mileage data which was also provided.
Fiber cross section data, calculated by dividing the fiber mileage by the sheath mileage or route mileage, could be a useful check for data errors or misinterpretations. Nonetheless, a tendency to base fiber mileage on route mileage data and an estimated fiber count factor has limited the usefulness of this approach. Similar factors may also have been used in some cases to generate the DS-3 mileages and to provide lit fiber mileages, however there is indication that such problems have been partially addressed this year by the reporting entities. In particular, US Sprint no longer appears to use this approach and revised its previously submitted data with last year's submission to account for this. Williams Telecommunications had indicated that last year's reported data was not consistent with the previously published data series because it had previously included about 1,000 miles of microwave and an unspecified amount of leased fiber in its data. Historical data was therefore adjusted downward last year and again this year to account for the estimated impact of these factors. Also, with last year's report AT&T had eliminated a practice of rounding or estimating components of its totals before arriving at an aggregate. Based upon information provided by the company, downward adjustments to previously reported fiber mileage data were made to make the data more consistent. A T&T's 1989 route mileage was similarly adjusted, although the company could not confirm a similar rounding problem in its route mileage data.
Lit fiber data may have other pitfalls as well. In particular, route redundancy and backhauling may mask underlying usage levels. Most likely such route redundancy would tend to increase lit fiber percentage over the level which would otherwise exist. In general, abrupt changes in the amount of lit fiber on a year-to-year basis should alert the reader to possible problems with this data element. Some corrections to previously provided lit fiber data are re fleeted in the tables.
In interpreting data'and growth rates from the accompanying tables the reader should be aware that in a number of instances the current year's data was prepared prior to the end of the year and therefore may have been estimated. As such, uncertainty concerning project completion dates may have resulted in data and resulting growth distortions. This may tend to be more of a problem with the metropolitan fiber carriers which are a rapidly growing sector of the industry.
Interexchange Carriers
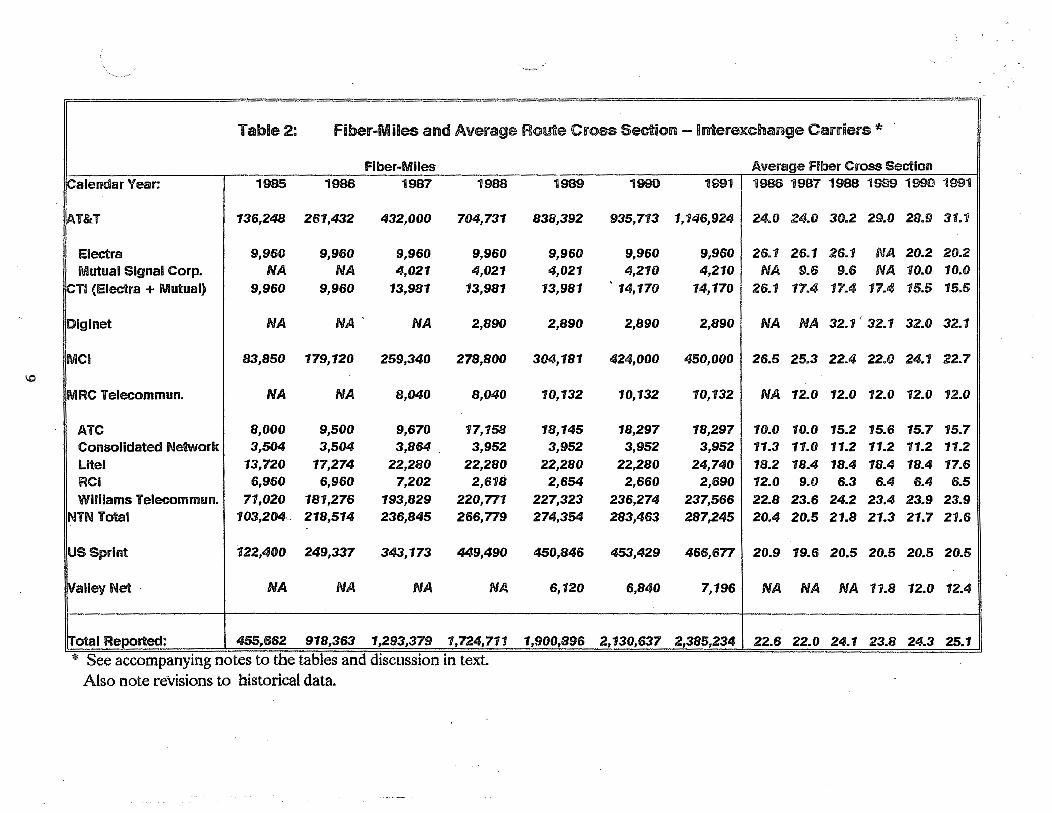
Data for the interexchange carriers is shown in Tables 1 through 4. This year, growth in fiber mileage deployed by interexchange carriers was about 11.9 percent, down slightly from last year's revised growth of 12.1 percent. AT & T's 11.6% increase in fiber mileage in 1990 included the effect of a downward adjustment of its 1990 fiber mileage and a proportional adjustment to its 1989 fiber mileage to correct for what has been characterized as rounding errors on components making up the total. In 1991 A T&T's fiber mileage grew by about 23%. Total fiber mileage deployed by the interexchange carriers is presently estimated at approximately 2.4 million miles, as shown in Table 2. Much of the long-haul interexchange fiber utilizes railroad rights of way, abandoned pipelines or is simply buried. There are also
5

a significant amount of microwave facilities, particularly in low density routes. In addition, some of the carriers are utilizing fiber built in conjunction with electric power company facilities and rights of way.
A rough estimate of the capa'city of all known fiber facilities used by the interexchange carriers, assuming 28 DS-3's or 18,816 circuits per fiber pair, suggests that on the order of 30 million DS-3 miles could eventually be equipped on the existing fiber using 1.2 Gbit/second terminal and repeater technology. Based on data provided this year or in prior years, the carriers have reported equipping more than 7 million DS-3 miles or close to a quarter of the available capacity associated with 1.2 gigabit technology, as determined from Tables 2 and 3. Table 4 summarizes the cost per route mile of fiber backbone and the cost per DS-3 mile. The cost per DS-3 mile was calculated by dividing the total DS-3 investment reported by the carrier by the corresponding number of DS-3 miles reported. This cost is affected by network complexity, system loading, and other factors.
As has been reported in prior fiber reports, a number of the interexchange carriers have been focusing attention on agreements facilitating joint deployment of fiber and associated shared use of rights of way with electric power utilities. This activity has been concentrated in the Southeast, where population has been growing and the local electric utilities have been more aggressive in seeking cost effective means of modernizing their internal telecommunications systems. The non-conductive character of fiber eliminates technical problems in COJ:l!bining electric transmission and communications facilities, such as ground loop, noise, and interference. This has led to the development of ground-wire fiber cable in which the fiber is placed within the core of ground-wire cable and has facilitated the combined construction of regional telecommunications and electric transmission facilities. With the increasing availability of ground-wire fiber and dielectric fiber cable (which can be strapped to existing power lines), utilities are taking advantage of fiber as a means for satisfying their own communications needs. Although the total amount of ground-wire fiber used by interexchange carriers is re la ti vely small in relation to the total amount ofinterexchange fiber deployed to date, a number of recent construction projects involving interexchange carriers and electric power companies have used ground-wire fiber. Those interexchange carriers reporting data on electric power company facilities report a total of more than 1,100 route miles and 25,000 fiber miles of this type of facility.
Many of the interexchange carriers have extended their routes and provided route diversity by a multiplicity of agreements among themselves. One organization set up early on to facilitate such agreements and to act as a magnet in obtaining capital for small fiber systems was National Telecommunications Network (NTN). NTN is a partnership comprised of Advance Telecommunications Company (ATC), Consolidated Network, Inc. (CNI), Litel, RCI and Williams Telecommunications Group (WTG). Telecom USA which was formerly an NTN partner is now owned by MCI. Its member companies are assessed a fee for the services that NTN provides which are now fairly limited in scope. The NTN companies interconnect directly and adhere to common technical standards that tend to facilitate sharing and other joint arrangements between the member companies.
NTN was originally set up to provide technical coordination, marketing, lobbying, and other administrative services for its member companies. Early on it provided a catalyst for investment in its member companies and gave those companies greater credibility in their financing activities. NTN's technical committee provided for common maintenance interconnection, and redundancy standards for its member companies but this organization has been inactive since early 1990. The original intent of NTN was also to provide for revenue and facility sharing for its member companies. This activity never fully materialized and now the
6

member companies make their own agreements among themselves and with nonmember companies. Much of NTN's role was overtaken by some of the larger partners which have a national presence and do national marketing. The NTN companies are directly interconnected; howev.er, there are now similar interconnection arrangements with nonmember companies.
Another feature of this sector of the industry has been mergers and acquisitions. Very recently Norlight was acquired by Midwestern Relay Co. and is now listed as MRC Telecommunications in the accompanying tables. Previous acquisitions i~clude MCI's acquisition of Telecom*USA during 1990 and Williams Telecommunications Group's acquisition of Lightnet which had reported a fiber network of about 5,300 route miles. Four major entities have emerged: US Sprint, MCI, Williams Telecommunications Group and AT&T. As indicated earlier Williams Telecommunications Group (WTG) and a number of smaller companies for convenience have been previously grouped in this report as NTN companies. Historical data for merged entities shown separately in prior fiber deployment reports has typically been combined in the tables this year for simplicity.
With equal access objectives largely met, the interexchange environment is now characterized by entities facing similar constraints and looking for ways to stimulate traffic and increase their market share. 4 In this environment the impact of differences in long distance rates and service quality resulting from differences in operating efficiencies of the interexchange carriers is reduced or limited by the local network and by local access charges which comprise a significant portion of the cost of a toll call. The interexchange carriers thus have exerted an indirect but important influence on developments in the local environment. They have affected the facility provisioning process and quality of service of the local operating telephone companies and have been relying increasingly ori more efficient and lower cost access arrangements and facilities to interconnect their points-of- presence, employing, where applicable, the fiber infrastructure of the metropolitan or urban fiber systems and the local operating companies. The significance of differences in marketing strategies and approaches that will impact local access will continue to be important factors impacting changes in market share and motivations of both interexchange and local carriers.
These effects and competitive pressures may become more pronounced if present economic conditions continue. It is important to note, however, that current trends in fiber deployment activity in the long-haul environment are not simply a function of current economic activity but are· also affected by the development of the technology, prior expectations of current economic activity and market share, and competitive effects and mergers discussed above. Capital construction programs for certain fiber backbone facilities of large carriers require significant lead times and thus tend to require longer range forecasting.
4 See reference 46.
7

Table 1: Route Miles - lnterexchange Carriers*
~
Route-Miies ,,r\
Calendar Year: 1985 1986 1987 1988 1989 19SO 1991
AT&T 5,677 10,893 18,000 23,324 28,900 32,398 36,871
Electra 382 382 382 382 382 493 493
Mutual Signal Corp. NA NA 421 421 421 421 421
ICTI (Electra + Mutual) 382 382 803 803 803 914 914
Piginet NA NA NA 90 90 90 90
MCI 3,025 6,752 10,267 12,467 13,839 17,600 19,793
MRC Telecommunications NA NA 670 670 844 844 844
ATC 800 950 967 1,127 1,163 1,163 1,163
Consolidated Network 310 310 352 352 352 352 352
Lit el 881 950 1,210 1,210 1,210 1,210 1,406
RCI 580 580 796 413 414 415 417
Williams Telecom. 3,084 7,936 8,202 9,135 9,725 9,893 9,930
NTN Total 5,655 10,726 11,527 12,237 12,864 13,033 13,268
US Sprint 5,300 11,915 17,476 21,938 22,002 22,093 22,725
Walley Net NA NA NA NA 520 570 581
!Total Reported: 20,039 40,668 58,743 71,529 79,862 87,542 95,086
"' See accompanying notes to the tables and discussion in text. Also note revisions to historical data.
-,
8
'°
Table 2: Fiber-Miles and Average Route Cross Section - lnterexchange Carriers * ·
Fiber-Miies Calendar Year: 1985 1986 1987 1988
AT&T 136,248 261,432 432,000 704,731
Electra 9,960 9,960 9,960 9,960 Mutual Signal Corp. NA NA 4,021 4,021
!CTI (Electra + Mutual) 9,960 9,960 13,981 13,981
Dlginet NA NA, NA 2,890
MCI 83,850 179,120 259,340 278,800
MRC Telecommun. NA NA 8,040 8,040
ATC 8,000 9,500 9,670 17,158 Consolidated Network 3,504 3,504 3,864 . 3,952 Lite I 13,720 17,274 22,280 22,280 RCI 6,960 6,960 7,202 2,618 Williams Telecommun. 71,020 181,276 193,829 220,771
NTN Total 103,204. 218,514 236,845 266,779
US Sprint 122,400 249,337 343,173 449,490
!Valley Net · NA NA NA NA
Total Reported: 455,662 918,363 1,293,379 1,724,711
* See accompanying notes to the tables and discussion in text Also note revisions to historical data.
Average Fiber Cross Section 1989 1990 1991 1986 1987 1988 1989 1990 1991
838,392 935,713 1,146,924 24.0 24.0 30.2 29.0 28.9 31.1
9,960 9,960 9,960 26.1 26.1 26.1 NA 20.2 20.2 4,021 4,210 4,210 NA 9.6 9.6 NA 10.0 10.0
13,981 '14,170 14,170 26.1 17.4 17.4 17.4 15.5 15.5
2,890 2,890 2,890 NA NA 32.1 ' 32.1 32.0 32.1
304,181 424,000 450,000 26.5 25.3 22.4 22.0 24.1 22.7
10,132 10,132 10,132 NA 12.0 12.0 12.0 12.0 12.0
18,145 18,297 18,297 10.0 10.0 15.2 15.6 15.7 15.7 3,952 3,952 3,952 11.3 n.o 11.2 11.2 11.2 11.2
22,280 22,280 24,740 18.2 18.4 18.4 18.4 18.4 17.6 2,654 2,660 2,690 12.0 9.0 6.3 6.4 6.4 6.5
227,323 236,274 237,566 22.8 23.6 24.2 23.4 23.9 23.9 274,354 283,463 287,245 20.4 20.5 21.8 21.3 21.7 21.6
450,846 453,429 466,677 20.9 19.6 20.5 20.5 20.5 20.5
6,120 6,840 7,196 NA NA NA 11 .8 12.0 12.4
1,900,896 2, 130,637 2,385,234 22.6 22.0 24 • ., 23.8 24.3 25.1

..... 0
Table 3: Percent Fiber Miles lit and DS-3 Miles - lnterexchange Carriers *
Percent Fiber Mi. lit Estimated DS-3 Miles
Calendar Year: 1987 1988 1989 1990 1991 1987 1988 1989
AT&T 26.5% 41.6% 45.5% 49.6% 44.6% NA 1,294,129 3,024,902
Electra 50.0% 71.0% NA 61.7% 64.6% NA NA NA Mutual Signal Corp. 60.0% 60.0% NA 43.4% 43.4% NA 10,080 NA
ICTI (Electra + Mutual) 52.9% 67.8% 55.1% 56.3% 58.3% NA NA NA
Dig I net NA NA 56.0% 50.0% NA NA NA 5,400
MCI 30.0% 40.0% 56.7°/o 64.3% NA 449,829 907,802 1,061,143
MRC Telecommunlcatlons 33.3% 50.0% 41.7% 65.0% NA NA 8,040 25,350
ATC 80.0% 69.0% 75.0% 90.0% 90.0% NA 171,580 NA Consolidated Network 33.0% 33.0% 50.0% 53.4% 53.4% NA 4,224 7,026 Lite I ._54.2% 54.9% 55.9% 60.6% 27.8% NA 52,293 55,869 RCI 34.-9% 57.4% 56.7% 56.7% 56.1% 7,164 5,206 10,446 Williams Telecommun. 42.5% 37.2% 49.0% 58.5% 58.2% 201,665 245,869 NA
NTN (total) 45.5% 45.2% 62.8% 60.6% 57.5%
US Sprint 30.0% 31.0% 50.4% 53.9% 55.1% 865,000 987,000 1,431,985
!Valley Net NA NA 37.3% 50.7% 40.0% NA NA 12,250
Total Reported: 31.8% 38.7°/o 48.1% 55.0% 49.2%
* See accompanying notes to the tables and discussion in text
1990 1991
3,656,642 4,383,896
17,822 28,625 5,944 5,944
23,766 34,569
NA NA
1,203,458 1,560,000
NA NA
NA NA 12,672 31,616 43,874 42,081 10,446 10, 155
NA NA
NA NA
NA 11,600

"""" """"
Table 4: ·Other Fiber Data - lntere:xchange Carriers *
Estimated Estimated Estimated Backbone DS-3 Backbone Points Previously Identified Fiber Investment Investment of leasing of Fiber Investment per per Route mi. Presence (Millions$) DS-3 mile (Thousands $) DS-3 Mi. Route Mi. Fiber Ml.
AT&T 2,616 231 71 745 14,502 NA 12,742
CTI 93 NA 102 26 NA NA NA '
Dlginet 7 NA 75 NA NA NA NA
MCI 1,343 NA 68 NA 215,000 5,400 NA
MRC Telecommunications 63 NA 75 NA NA 155 NA
A.TC 90 NA 77 44 NA 280 2,460 Consolidated Network 16 276 45 10 208 180 6,962
lite I 80 1,188 57 30 6,894 90 1,734 RCI 9 754 21 NA 4,809 130 558 Wiiiiams Te!ecommun. 452 NA 45 74 275 1, 100
NTN (total) 667 NA 50 158 11,911 955 12,814
US Sprint 1,704 350 75 NA NA NA 500
Valley Net 9 NA 16 21 NA NA NA
Total Reported: 6,503 265 72 950 241,413 6,510 26,056
* See accompanying notes to the tables and discussion in text.

Notes to Tables 1-4: (NA indicates data was not available)
In son1e instances carriers may have estimated certain data, such as end of year data received prior to the end of the year. Accuracy may also vary depending on the carrier's method of collecting and assembling its data. Historical data may have been changed from prior reports to reflect adjustments made this year. Also, in some cases historical data for merged entities has been combined. The reader may thus wish to refer to prior fiber deployment reports for previously reported data.
ATC refers to Advanced Telecommunications Corp., which was formerly known as Microtel.
AT&T's 1989 fiber mileage was adjusted downward last year to account for rounding errors in the components making up the total. AT&T's route mileage for 1989 was also adjusted downward from 31,871 to 28,900 even though AT&T could not confirm whether or not similar rounding or estimation problems affected the route mileage figure. Data shown in the tables includes domestic fiber only. Sheath mileage for AT&T was 38,184 as of the end of 1991. Other carriers submitting data indicate that sheath and route mileage are equal. AT&T's point of presence data only includes its switched services. (Also see reference 41.)
The Electra Network in Texas and Mutual Signal Corp. were acquired by Communications Transmission, Inc. (CTI). CTI also identified 52 route miles and 14,653 fiber miles of unspecified fiber in its 1989 data which is not reflected in the tables. Investment data for CTI reflects data which was previously provided.
Litel listed in the tables has very recently changed its name to LCI international.
Norlight was acquired in December 1991 by Midwestern Relay Co. and is now listed in the tables as MRC Telecommunications.
MCI data reflects the acquisition of Telecom*USA which had previously been formed by the merger of Southland Fibernet, Southern Net and Teleconnect. MCI historical DS-3 mileage had been adjusted to reflect fiber DS-3's only. MCI now reports 2.8 million DS-3 miles on all its facilities (including 13,146 route miles of digital microwave radio). DS-3 mileage on fiber facilities was estimated by the author based on overall DS-3 mile growth rates and data provided last year. Investment per DS-3 mile when calculated from incremental DS-3 mileage and incremental investment data for MCI ranged between $360 per DS-3 mile to about $650 per DS-3 mile, reflecting data provided for the past few years. Overall fiber investment shown in Table 4 for 1991 was estimated from data provided for 1990 and route mile growth for 1991.
US Sprint's historical data has been revised by the company. The reader may wish to refer to prior fiber deployment reports for comparison with previously supplied data. These revisions are shown in Tables 1 and 2 for the period since the merger of US Telecom and GTE toll facilities in 1986. US Sprint now reports 3,152.88 route miles and 64,755.24 fiber miles for 1985.
The composite historical data for Williams Telecommunication Group has been adjusted downward by the author to account for such things as previously included leased fiber and about 1,000 miles of microwave system. Historical data for Williams Telecommunications Group reflects the effect of acquisitions of LDX (1,379 route miles and 33,096 fiber-mi. reported by LDX for 1986) and Lightnet (5,300 route miles and 127,200 fiber mi. reported by Lightnet for 1988) and includes the effect of prior historical data supplied by those companies. Investment has been adjusted downward by the company to include only backbone fiber facilities. Further downward adjustments made this year removed a small amount of previously identified leased
12

fiber from the 1989 to 1991 data. (See prior fiber deployment reports.)
Data on percent of fibers lit may be distorted by route redundancy and method of reporting this data. Considerations affecting when a fiber pair is lit or equipped may vary from company to company and generally does not-indicate how many circuits are presently operating. In a number of instances prior data for percent lit fiber has been recalculated.
DS-3 mileage reflects actual DS-3's in use on fiber facilities only.
Primary investment data was requested for fiber backbone system only. Additional investment for equipping DS-3's was requested separately. Investment per route mile is calculated from aggregate investment data and route mileage provided. In cases where data was missing, investment was either based on previously provided data and system growth or was estimated on the basis of$ 75,000 per route mile.
Data on. leasing of fibers may be rounded or approximated based .on data provided in prior years. In some cases leased capacity is reported as DS-3's rather than entire fibers. Data provided on leased DS-3 miles may not be mutually exclusive with data 'on leased fiber.
Except for Valley Net which is a long haul network formed using facilities of several local telephone companies, Tables 1 and 2 reflect owned facilities. Fiber used in long term arrangements with electric utilities may be reported as owned fiber by some of the carriers.
Definitions and descriptions of the items in Tables 1-4:
Route miles of fiber -- The total mileage of fiber routes as would be seen on a network map.
Total fiber miles of fiber -- The number of fiber strand miles used in all routes including both lit and unlit fiber -- the sum of the number of miles of each owned cable weighted by the number of fiber strands. (Also see text of report.)
Sheath miles of fiber -- The total number of miles of fiber cable used in the network. (Typically 12 to 36 fibers are contained in a given sheath.)
Fiber miles of lit fiber -- The number of fiber strand miles activated or equipped with optoelectronic equipment at terminal and repeater sites and capable of providing at least one voice grade circuit.
Investment in backbone fiber facilities -- The total in vestment in fiber cable, deployment, and repeater sites but not including electronic or optoelectronic equipment.
DS-3 miles carried on fiber -- The number of miles of DS-3 system where each DS-3 system is capable of providing at least one equivalent 2-way voice grade circuit. ·
DS-3 investment per DS3 mile -- Additional investment for optoelectronic and electronic equipment per mile of DS-3 defined above.
Leased facilities -- Route miles, fiber miles or DS-3 miles leased from other interexcha1.1.ge carriers or resellers as applicable.
Point of Presence -- Point at which an interexchange carrier interfaces with a local operating company or metropolitan fiber carrier for access to its customers.
13

Local Telephone Companies
This section summarizes data from the Bell operating companies, rural carriers which provide data to the Rural Electrification Administration (REA), and companies affiliated with Contel, GTE, and United. The data is presented in Tables 5 through 13. A number of independent operating companies which together comprise less than 5% of the total fiber have not been included in the accompanying tables. A limited number of companies included in the data for rural companies provided by the REA may also be included in one of the other categories. Data covering the REA companies during 1991 was unavailable.
The plant of the local operating companies can be generally divided into three categories. These are interoffice, feeder and distribution. Interoffice facilities provide for the interconnection of telephone company central offices. Usually these facilities handle traffic from many subscribers and can take advantage of economies of scale.
Collectively, feeder and distribution plant is often termed subscriber plant. The" feeder" portion of plant provides for the part of the local loop which usually is arranged to enable many subscribers to share a common facility. Multiplexed or carrier systems, sometimes called pair gain systems, are used so that on a portion of the loop numerous subscribers can be handled on a single fiber or twisted wire pair. This survey revealed, however, that typically the telephone company will use single copper pairs for a subscriber all the way to the central office, rather than resorting to multiplexed or carrier systems. In many cases, use of existing spare wire pairs would be less expensive than adding a carrier system. However, when all pairs are exhausted, a carrier system is often the least costly way of adding more capacity. Addition of fiber in feeder plant is an attractive alternative in areas where all pairs are exhausted and are already fully equipped with carrier systems. In such cases it usually makes more sense to add a new fiber cable for new capacity rather than a new copper cable. These economic considerations provide the basic justification for fiber deployments by all types of local carriers, including carriers operating in rural areas, and provide a backdrop for other developments. 5
. The final portion of local transmission plant is the "distribution" plant. The distribution plant usually consists of dedicated fibers or wire pairs connecting subscribers to distribution points which are connected to the central office by feeder fiber. Penetration of fiber in distribution plant is the slowest, since there is less opportunity for multiple subscribers to share tP.e cost of the fiber and equipment needed to convert optical signals into electrical signals needed for the typical telephone set or terminal. Deployment of fiber in this portion of the plant has been the most controversial since it may shorten the expected useful life of existing copper facilities and its economic justification typically requires new sources of revenue and new services, some of which may be in competition with existing CATV services.
The local companies have been unable to provide data which distinguishes between feeder and distribution fiber partly because of problems in defining a uniform demarcation point between shared and dedicated subscriber plant. In addition, several of the companies have difficulty providing data which separated interoffice from subscriber fiber and copper, claimed that many facilities are jointly used for interoffice and subscriber applications and
5 See references 35 and 120.
14

that in some instances no good sources of data in these categories could be located. US West, for example, has stated that it has used exchange and toll categories as a substitute for the intero.ffice and subscriber categories that were requested. This would tend to result in an overestimate of the amount of subscriber fiber and copper. Ameritech has reported the use of engineering estimates to separate interoffice and subscriber fiber and copper. Other companies either do not provide certain subscriber data or do not indicate whether estimation procedures were used. Subscriber data is displayed in Tables 10, 11, and 13.
The survey of local companies leading to this report focused on a number of aspects of the fiber infrastructure of the local companies. The primary purpose of the survey was to track the amount of fiber in various portions of the operating company plant. While the survey also covered data on the amount of copper in plant which is included in Tables 11 through 13 of this report, the reader should exercise caution when attempting to compare the amount of fiber and copper in plant, since strands of fiber inherently have a much greater information carrying capacity than an equivalent number of copper wires and differing investments and maintenance expenses are associated with activation of comparable capacities on fiber and copper systems.
As part of the infrastructure of local operating company fiber, the survey requested data on interLATA fiber used exclusively for internal company business. These facilities could not be used by the Bell companies under the MFJ for carrying traffic other than official company traffic, and the data indicates the extent of their interLA TA facility base associated with such use. This data is summarized in Table 9.
Of particular interest was a determination of how and to what degree new fiber technology was being deployed by the operating companies. Thus, information on fiber rings, fiber-to-the-curb systems and new technology trials associated with fiber was requested. Under the price cap regime instituted in 1991, cost effective applications of new technology should be an increasingly important means by which the local companies will be able to enhance their profitability. Nonetheless, a possible desire to sacrifice long-term goals to short-term profitability by overly limiting the use of new technology or by ineffective or premature applications of technology would significantly mitigate the benefits of the technology or actually make a company less profitable over the long-term. Thus, in the future even greater interest both by regulators and the companies themselves in technology trials, extending beyond the well publicized fiber-to-the-home trials, should emerge. Exploration of more reliable and more efficient plant architectures and electronic configurations should continue to be one important element in such trials.
Some movement in this direction is already evident in response to perceived competitive pressures and a desire to lower the cost of deploying fiber to business.and residential customers. In a number of metropolitan areas, local telephone companies are deploying a redundant fiber structure generically known as a "ring," which provides for fiber redundancy by allowing customer access to be achieved from either of two diverse paths. Often fiber redundancy arrangements established by the Bell operating companies differ from the fiber rings of the urban carriers in that they use the existing plant structure with two separate access paths provided to the customer. US West, for example, has tariffed such redundant arrangements. Nonetheless, it should be noted that available data suggests that significantly more fibers appear to have been deployed to date in these arrangements than the number of current customers. For the purpose of this report these redundancy arrangements are all being classified as fiber rings and have been identified by the Bell operating companies in the ~ollowing metropolitan areas:
15

Illinois: Indiana: Michigan: Ohio: Wisconsin:
D.C.: Delaware: Maryland: New Jersey: Pennsylvania: Virginia:
Alabama: Florida:
Georgia: Kentucky: Louisiana: Mississippi: North Carolina: South Carolina: Tennessee:
Massachusetts: New Hampshire: New York: Rhode Island:
California:
Nevada:
Arkansas: Kansas:
Ameritech:
Chicago, Oakbrook, Northbrook Indianapolis Detroit, Grand Rapids, E. Grand Rapids, Dearborn, Dutton, Holland Cleveland, Columbus, Akron Milwaukee
Washington, D.C. Wilmington Baltimore
Bell Atlantic:
Cedar Knolls, Newark Philadelphia, Pittsburgh, Paoli, King of Prussia, Wayne, Conshocken Norfolk, Richmond
BellSouth:
Birmingham, Mobile, Montgomery, Huntsville Fort Lauderdale, Jacksonville, Miami, Orlando, West Palm Beach, Daytona Beach, Gainesville Atlanta, Columbus, Macon, Augusta, Savannah Louisville New Orleans, Shreveport, Baton Rouge, Lafayette Jackson Charlotte, Greensboro, Raleigh, Asheville Columbia, Green ville, Charleston Memphis, Nash ville, Knoxville, Chatanooga
NYNEX:
Boston, Cambridge, Greendale, Waltham, Worcester Nashua New York City, Buffalo Providence
Pacific Telesis:
San Francisco, Los Angeles, El Segundo, Oakland, San Diego, San Jose, Santa Clara, Sunnyvale, El Tarro, Berkeley, Anaheim, Sacramento, Irvine . Reno
Sou th western Bell:
Roger /Springdale Kansas City
16
Missouri: Oklahoma: Texas:
Arizona: Colorado: Idaho: Iowa: Minnesota: Nebraska: Oregon: Utah:
Dallas,
US West:
Phoenix, Tucson, Mesa Denver Boise Des Moines, Waterloo Minneapolis, St. Vadnais Omaha Portland
Washington: Salt Lake City Seattle
Fiber architectures which would reduce the cost of serving large numbers of residential customers with some form of wide bandwidth service are also being explored. One such application of technology in an architecture which is designed to make deployment of wideband capabilities to residences more cost effective is the use of what is called "fiber-to-the-curb." This approach involves sharing of fiber and equipment to convert optical to electrical signals by more than one residence. In this fiber is deployed to an interface point near the customer, which in newer construction sites is often referred to as a "pedestal.'' Sharing of expensive opto- electronic equipment is then possible, and coaxial or other copper wire systems can be used for the short link to the subscriber. Systems of this type have been deployed by some of the local operating companies, as shown in Table 8. Bellcore supports the use of these systems on an interim basis, and it is likely that these systems will evolve as they proliferate further. 6
Data on fiber technology trials is summarized in Table 8. These are primarily being used to test various fiber-to-residence arrangements and architectures, including systems with limited switched video capability. In some cases other fiber technology trials are also being conducted. BellSouth, for example, has reported trials of its 2.4 gigabit interoffice synchronous optical network (SONET) as well as SONET 150 megabit loop trials. BellSouth also reports a medical information communications application (MICA) which it characterizes as a research project rather than a trial. GTE and BellSouth have also reported an interesting broadband ISDN trial for a research project called VIST ANET involving a prototype network for interactive three dimensional medical imaging research. Pacific Bell has reported a technology test of a loop optical carrier system and an associated software support system. Bell Atlantic reports several trials involving bandwidth sharing and voice and video integration capability involving off-the-shelf systems with future broadband upgrading capability. 7
To better enable assessment of the deployment cost per fiber, investment and fiber count
6 See reference 66.
7 See reference 49.
17 .

data associated with fiber trials is also shown in Table 8. Evaluation of this data appears to suggest that per fiber costs of most systems undergoing trial range from $2,000 to an amount in exc~ss of $6,000 per deployed fiber. The cost per fiber of most of the systems appears to fall in the $6,000 range. Aside from the fiber trials and fiber redundancy arrangements alluded to above, there is presently little distribution fiber in place. Nonetheless, the operating companies are generally continuing. to deploy significant amounts of new fiber to modernize their plant and at the same time bring fiber closer to the customer. The effective management of rapidly developing fiber and related technologies will pose a major challenge to the operating companies in the years to come.
18
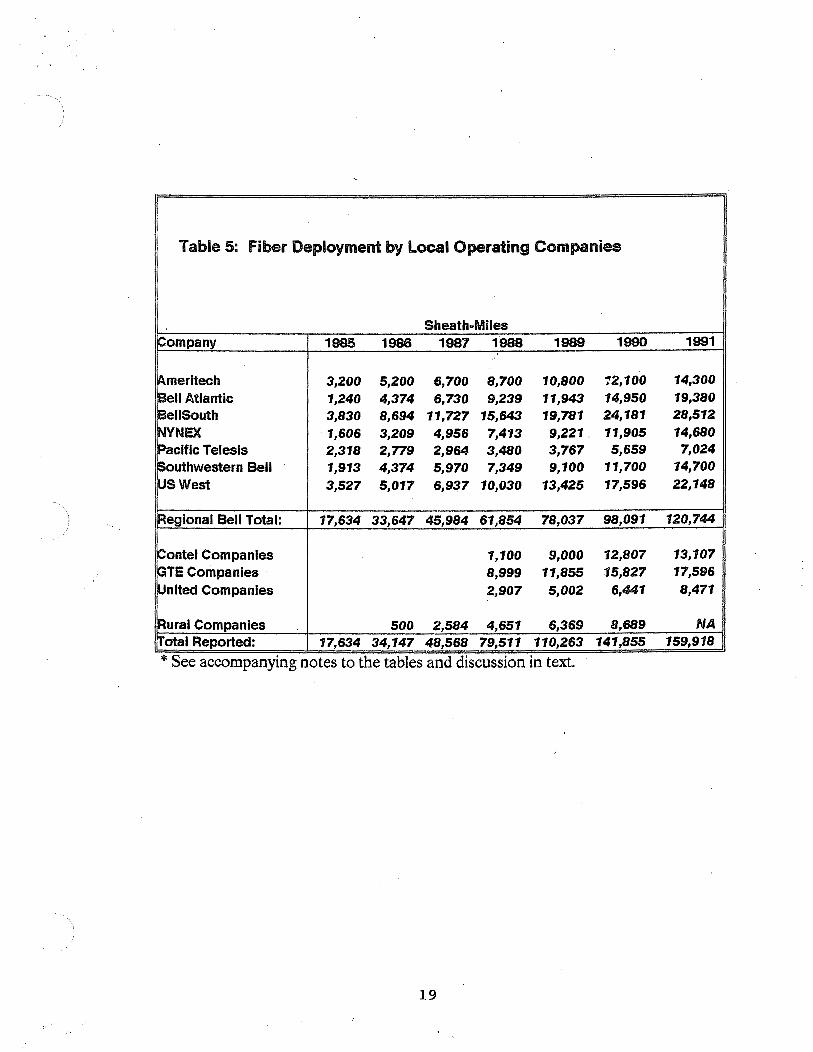
Table 5: Fiber Deployment by local Operating Companies
Sheath-Miies Company 1985 1986 1987 1988 1989 1990 1991
..
Ameritech 3,200 5,200 6,700 8,700 10,800 ~2,100 14,300 Bell Atlantic 1,240 4,374 6,730 9,239 11,943 14,950 19,380 BellSouth 3,830 8,694 11,727 15,643 19,781 24,181 28,512 NYNEX 1,606 3,209 4,956 7,413 9,221 11,905 14,680 Pacific Telesis 2,318 2,779 2,964 3,480 3,767 5,659 7,024 Southwestern Bell 1,913 4,374 5,970 7,349 9,100 11,700 14,700 US West 3,527 5,017 6,937 10,030 13,425 17,596 22,148
Regional Bell Total: 17,634 33,647 45,984 61,854 78,037 98,091 120,744
Contel Companies 1,100 9,000 12,807 13,107 GTE Companies 8,999 11,855 15,827 17,596 United Companies 2,907 5,002 6,441 8,471
Rural Companies 500 2,584 4,651 6,369 8,689 NA Total Reported: 17,634 34,147 48,568 79,511 110,263 141,855 159,918
* See accompanying notes to the tables and discussion in text
19

N 0
Table6: Fiber Deployment by Local Operating Companies
Fiber-Miies ~ompany 1985 1986 1987 1988 1989
!Ameritech 77,700 111,100 147,100 177,500 228,400 Bell Atlantic 83,085 150,847 227,507 311,022 373,398
BellSouth 50,807 170,092 218,489 319,248 445,452 NYNEX 83,384 129,743 207,077 290,600 357,766 Pacific Telesis 84,310 97,800 101,090 110,273 126,944 Southwestern Bell 70,490 151,043 . 182,911 214,948 270,300 US West 47,341 70,082 107,782 163,968 234,851
Regional Bell Totals: 497,117 880,707 1, 191,956 1,587,559 2,037,111 · ..
IContel Companies GTE Companies 134,677 163,396 United Companies 32,287 54,569
Rural Companies 2,000 14,236 28,705 42,260 Total Reported: 497,117 882,707 1,206,192 1,783,228 2,297,336
* See accompanying notes to the tables and discussion in text.
1990 1991
285,500 388,900 522,970 801,960 591,938 734,054 473,274 636,954 189,077 253,359 352,300 453,000 351,571 542,308
2,766,630 3,810,535
103,603 106,035 213,891 254,720
87,591 122,525
68,237 NA 3,239,952 4,293,815

Table 7: Average Fiber Cable Crose Section *
Company 1985 1986 1987 1988 19&a 1990 1991
Ameritech 24.3 21.4 22.0 20.4 21.1 23.6 27.2
Bell Atlantic 67.0 34.5 33.8 33.7 31.3 35.0 41.4
BellSouth 13.3 19.6 18.6 20.4 22.5 24.5 25.7
NYNEX 51.9 40.4 41.8 39.2 38.8 39.8 43.4
Pacific Telesis 36.4 35.2 34.1 31.7 33.7 33.4 36.1
Southwestern Bell 36.8 34.5 30.6 29.2 29.7 30.1 30.81 US West 13.4 14.0 15.5 16.3 17.5 20.0 24.5
'
Average - Bell Companies: 28.2 26.2 25.9 25.7 26.1 28.2 31.61 Contel Companies 8.6 8.1
GTE Companies 15.0 13.8 12.7 14.5 I United Companies 11.1 10.9 12.1 14.5
Rural Companies 4.0 5.5 6.2 6.6 7.9 NA Average - All Companies: 28.2 25.9 24.8 22.4 20.8 22.8 26.9
* See accompanying notes to the tables and discussion in text
21

N N
Table 8: Data on fiber Trials of local Operating Companies*
Recent Fiber Trial Data Fiber to Home Systems Fiber-to-Curb Systems
Investment Investment Systems Fibers Million$ Systems Fibers Millions$
Ameritech 2 266 2.49 0 0 0 Bell Atlantic 1 250 NA 1 5 NA BellSouth 10. 2,726 10.38 5 714 3.40 NYNEX 0 0 0.00 1 216 1.50 Pacific Telesis 0 0 0.00 1 288 1.20 Southwestern Bell 2 888 2.58 1 325 0.63 US West 2 192 0.60 3 384 2.00
Contel Companies 2 456 2.28 0 0 0.00 GTE Companies 1 2,406 15.60 0 0 0.00 United Companies 5 36 1.63 4 5 0.14
Rural Companies NA. .. NA NA NA NA NA lrotal Reported: 25 . 7,220 35.56 16 1,937 9
* See accompanying notes to the tables and discussion in text
Other Trials ,
Invest-Systems Fibers ment Type
'
2 0.3 SONET 1 56 0.2 Dig. Loop Carrier 3 24 0.168 SONET
1 Broadband ISDN

Table 9: Other 1991 fiber Data for Local Operating Companies
Aggregate lnterLata Fiber Fiber for Investment Internal Co.
* Loop Fiber (Miiiion $) Business Fiber Cust. Loe. Fibers Cust. Percent Route Fiber Rings- Served termln. Fibers Sub- Total Lit Mi. Ml. Cities by Rings atC.O. scriber Fiber
Ameritech 14 256 26,043 7,700 NA 453.3 57.8% 1 6 * Bell Atlantic 13 NA 12,715 132 NA 581.9 NA 28 4,258 BellSouth 33 NA 50,220 NA NA 921.2 NA 561 B,713
*NYNEX 9 1,454 35,667 NA 253.7 699.4 NA 154 2,872 *Pacific Telesis 14 280 35,076 NA 108.1 265.9 26.3% 981 10,981 Southwestern Bell 8 82 42,330 18,430 NA 489.6 43.0% 1,593 8,205 US West 14 309 51,363 2,744 200.9 481.4 21.0% NA NA
Contel Companies 9 NA NA NA NA 123.3 59.2% 2,622 14,968 fl< GTE Companies 7 95 NA NA NA 307.2 , 60.0% 8 67
\nited Companies 6 34 NA 507 NA 173.0 31.2% 93 1,284
!!Rural Companies NA NA NA NA NA NA NA NA NA lfrota1 Reported: 127 2,510 253,414 29,513 563 4,496 40.3% 6,040 49,353 * See accompanying notes to the tables and discussion in text
23
N .i::..
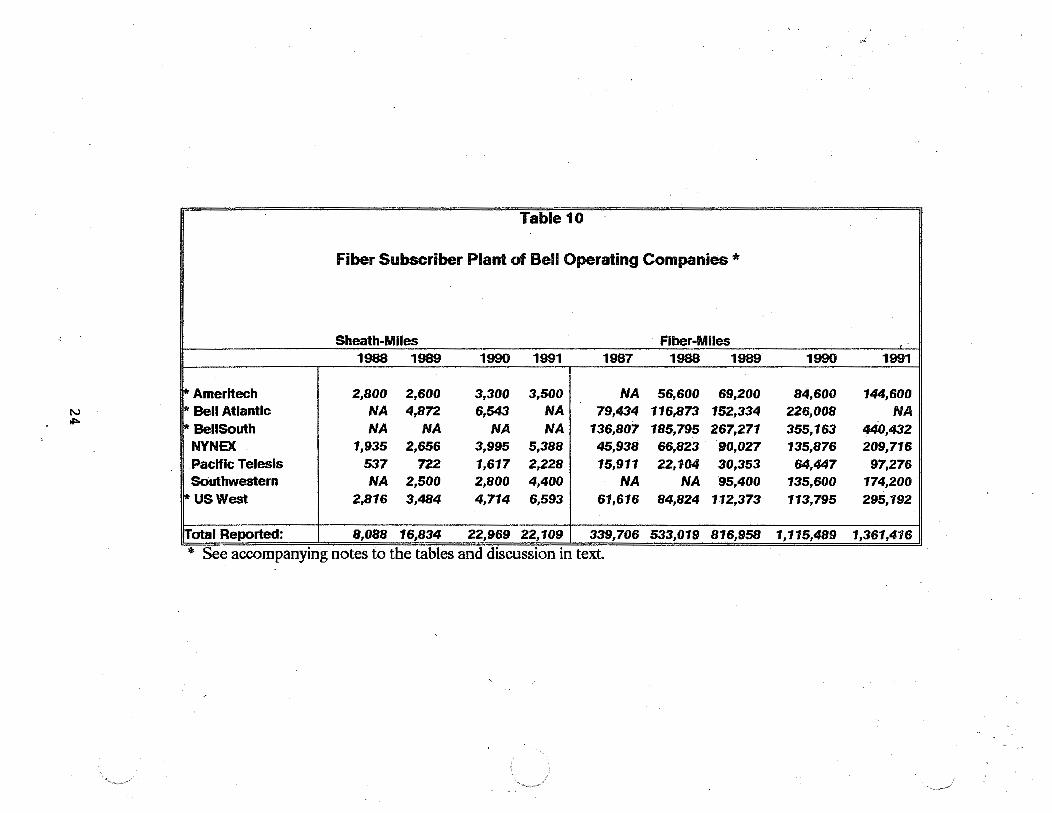
Table 10
Fiber Subscriber Plant of Bell Operating Companies *
Sheath-Miles Fiber-Miies 1988 1989 1990 1991 1987 1988 1989
I* Ameritech 2,800 2,600 3,300 3,500 NA 56,600 69,200 I'* Bell Atlantic NA 4,872 6,543 NA 79,434 116,873 152,334 *BellSouth NA NA NA NA 136,807 185,795 267,271
NYNEX 1,935 2,656 3,995 5,388 45,938 66,823 90,027 Pacific Telesis 537 722 1,617 2,228 15,911 22,104 30,353 Southwestern NA 2,500 2,800 4,400 NA NA 95,400
*US West 2,816 3,484 4,714 6,593 61,616 84,824 112,373
Total Reported: 8,088 16,834 22,969 22,109 339,706 533,019 816,958
* See accompanying notes to the tables and discussion in text.
1990 1991
84,600 144,600 226,008 NA 355,163 440,432 135,876 209,716
64,447 97,276 135,600 174,200 113,795 295,192
1,115,489 1,361,416

N (JI
Table 11
Copper Subscriber Plant of Bell Operating Companies *
Sheath-Miles Wire-Miies 1988 1989 1990 1991 1988 1989
~Ameritech 242,700 245,200 244,400 325,100 139,588,000 140,419,900 * Bell Atlantic 280,347 290,755 291,303 288,910 187,439,376 191,674,222 [A' BellSouth 559,993 564,236 566,080 570,385 238,775,565 241,225,031
NYNEX 225,547 229,508 232,731 232,867 130,892,737 134,247,385 Pacific Telesis 170,267 167,522 202,465 191,015 128,766,710 127,455,716 Southwestern NA 338,100 343,300 345,800 NA 156,900,000 ~US West 384,261 389,379 395,772 401,637 154,245,455 156,228,598
Total Reported: 1,863,115. 2,224,700 2,276,051 2,355,714 979,707,843 1,148,150,852
* See accompanying notes to the tables and discussion in text.
' 1990 1991
141,930,300 142,588,800 194,425,920 194,378, 100 243,457, 732 243,640,535 137,882,236 139,975,586 137,006,786 139,054,612 159,300,000 160,400,000 158,736,742 162,682,600
1,172,739,716 1, 182,720,233

N O'I
Table 12: fiber and Copper in Total Plant in Relation to Access lines - End.of Year 1990 *
Total Plant Per Thousand Access Lines ~ompany Access Lines 'Strand Miles Sheath Miles Miles Miies Miles Miles Percent Fiber Name Copper Fiber Copper Fiber
Copper Wire Fiber Copper Fiber Wire Strand Cable Cable Cable Strand
Ameritech 16,530,254 189,240,300 285,500 325,900 12, 100 11,448 17.3 19.7 0.7 3.6% 0.15% Bell Atlantic 17,905,495 194,425,920 522,970 291,303 14,950 10,858 29.2 16.3 0.8 4.9% 0.21% BellSouth 17,121,561 243,451,732 591,938 592,424 24, 181 13,738 33.4 33.4 1.4 3.9% 0.24% NYNEX 15,511,119 168,313,412 473,214 263,918 11,905 10,855 30.5 17.0 0.8 4.3% 0.28% Pacific Telesis 14,558,033 156,536,853 189,077 185,760 5,659 10,753 13.0 12.8 0.4 3.0% 0.12% !Southwestern Bell 11,817,930 169, 100,000 352,300 375,200 11, 700 14,309 29.8 31.7 1.0 3.0% 0.21% U.S. West 13,775,772 162,335,227 351,571 424,577 17,596 11,784 25.5 30.8 1.3 4.0% 0.22%
Total reoorted: 107,820, 164 1,283,469,504 2,766,630 2,459, 142 98,091 11,904 25.7 22.8 0.9 3.8% 0.22%
* See accompanying notes to the ~bles and discussi?n in text.

N -...!
Table 13: Fiber and Copper in Subscriber Plant in Relation to Access lines - End of Year 1990 *
Subscriber Plant Per Thousand Access Lines Access Lines Strand Miles Sheath Miles Miles Miles Miles Miles % Fiber
Copper Fiber Copper Fiber Sheath Copper Fiber Copper Fiber Wire Strand Cable Cable Miles
fir Ameritech 16,530,254 141,930,300 84,600 244,400 3,300 8,586 5. 1 14.8 0.20 1.3% fir Bell Atlantic 17,905,495 NA 226,008 NA 6,543 NA 12.6 NA 0.37 NA 1-k BellSouth 17,721,561 NA 355, 163 NA NA NA 20.0 NA NA NA
NYNEX 15,511, 119 137,882,236 135,876 232,731 3,995 8,889 8.8 15.0 0.26 1.7%
Pacific Telesis 14,558,033 137,006,786 . 64,447 202,465 1,617 9,411 4.4 13.9 0.11 0.8% Southwestern 11,817,930 159,300,000 135,600 343,300 2,800 13,480 11.5 29.0 0.24 0.8%.
*US West 13,775,772 158,736,742 113,795 395,772 4,714 11,523 8.3 28.7 0.34 1.2%
:Total reported: 107,820;·164 734,856,064 1,115,489 1,418,668 22,969 10,179 10.3 19.7 0.25 1.6%
* See accompanying notes to the tables and discussion in text

Notes to Tables 5-13:
Several of the initial operating company responses were incomplete, particularly those relating to loop fiber. The companies were generally responsive to further inquiry. In some cases more than one additional attempt was required to obtain the data that was requested. Some of the responses remained incomplete due to time constraints and apparent unavailability of the data.
Ameritech reports subscriber data based on engineering judgment.
Bell Atlantic and BellSouth data on subscriber copper is not available. Total copper is shown in place of subscriber copper. Bell Atlantic indicates that it cannot provide accurate data on lit fiber but references its form M data for 1990 which reported that about 31% of its fiber was lit. Bell Atlantic asserts that the form M data for lit fiber is estimated and not accurately tracked by the company. Bell Atlantic indicates that its only fibers to customers are for trials converted to regular service.
BellSouth subscriber fiber mileage for 1989, 1990, and 1991 as shown in Table 10 was estimated as 60% of the total fiber mileage based upon data provided by the company for 1987 and 1988. Other companies separating subscriber and interoffice fiber show an average of about 33% of the total fiber as subscriber and about 88% of the copper wire as subscriber. BellSouth con firms that its fiber investment does not include electronics at terminal or repeater sites.
GTE and United report customers served by fiber rings rather than customer locations.
NYNEX includes all customer building locations served by fiber, not just those locations associated with redundant configurations or rings.
Pacific Telesis data on customer locations served by fiber rings only includes Pacific Bell.
Data in the tables reflects the fact that prior to 1989 Southwestern Bell used interexchange and toll rather than interoffice and loop subcategories. South western Bell Data for 1989 to the present properly reflects loop and interoffice subcategories which were originally requested.
Total access line counts were taken from the annual Form M submissions of the carriers covering the 1990 calendar year. (See reference 41.)
l
Fiber rings refer to any form of redundant fiber facilities.
Definitions and descriptions of the items in Tables 5-13:
Total strand miles of fiber and strand miles of copper -- The number of fiber strand miles used in all routes (including both lit and unlit fiber and inactive copper pairs), i.e., the sum pf the number of miles of each cable multiplied by the number of strands. The terms "fiber-miles" and "fiber strand miles" are used interchangeably.
Percent lit fiber -- The number of fiber strand miles activated or equipped with optoelectronic ·equipment at terminal and repeater sites and capable of providing at least one voice grade circuit as a percentage of the total fiber miles of fiber.
28

Sheath miles of fiber cable and sheath miles of copper cable -- The total number of miles . of fiber cable used. (Typically 12 to 36 fibers are contained in a given sheath.)
InterLata fiber Systems -- The route mileage and fiber mileage of owned fiber systems used for internal company business.
Fiber-to-the-curb systems -- The number of fibers and systems employing shared fiber and electronics.
Fiber trials -- The number of recent or current fiber trials with the capital investment and the associated number of fibers.
Fiber Rings -- The number of cities in which fiber rings or other redundant fiber arrangements are in use.
Fibers Terminating at. the Central Office -- The number of fibers which terminate on central office facilities used or available for local loops.
Custoµl'e'r Locations Served by Fiber Rings -- The number of cus.tomer locations served by rings ·. dr other redundant fiber configurations.
Customer~Fibers '~ The total number of fibers to customers othe·r than for fiber trials.
Investment in fiber backbone facilities -- The total investment in fiber cable, deployment, and repeater sites (outside plant), not including electronic or optoelectronic equipment. Subscriber in vestment includes that portion of in vestment associated with subscriber loops.
InterLata fiber for internal company business -- The route and fiber mileage of facilities dedicated to internal company use.
29

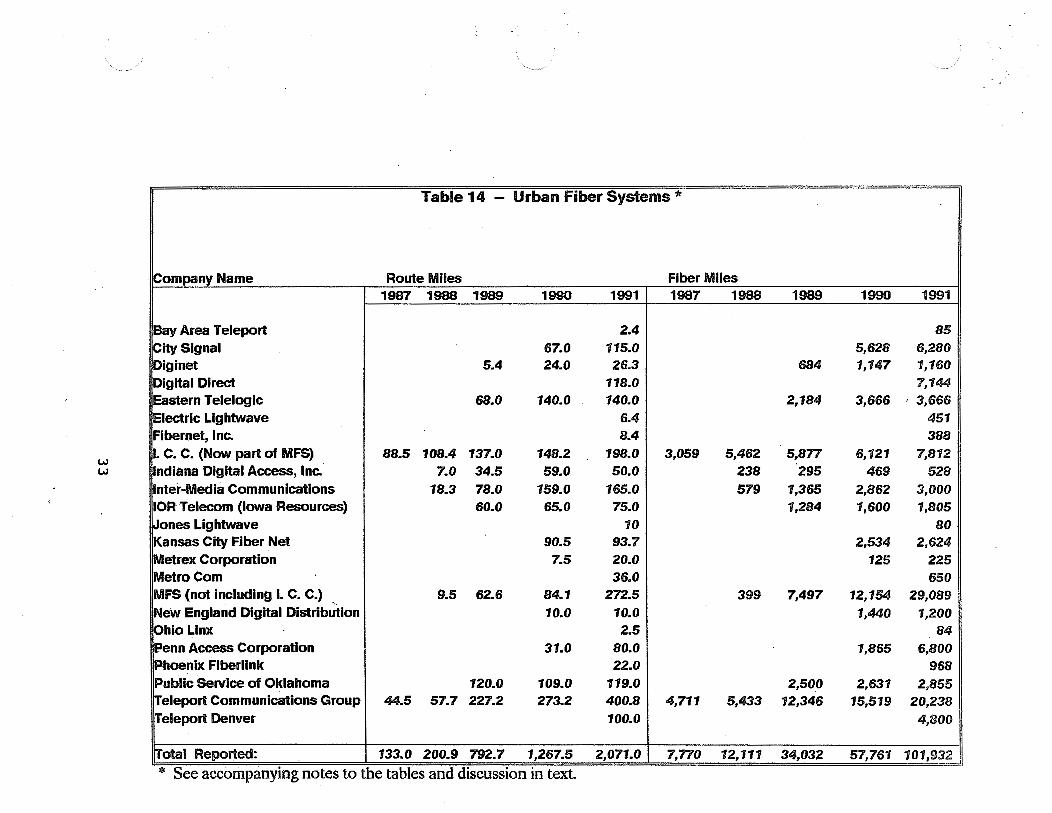
Urban Fiber Systems
. For the last few years, this report has included data on a number of entities deploying fiber in metropolitan or urban areas. This rapidly growing group of entities access large business customers using a ring or l,oop of fiber through areas of high business concentration and are attempting to offer the customer very reliable service with competitive service and maintenance intervals. Table 14 lists the key companies known to be involved in such systems. It is not intended to be an all inclusive list but has been expanded since data on these companies was first reported. It excludes companies that only operate microwave systems or that were constructing fiber plant that was not operational in 1991.
The key targets of the urban systems are large downtown office buildings in cities where the deployment cost and regulatory constraints of new fiber systems are not excessive. Typically a cable several miles in length containing 20 to 200 fibers is deployed in existing conduit or in subway tunnels in a ring structure. The ends of the fiber cable are connected at a hub location. At least one fiber pair in the ring is typically dedicated to a single office building and capacity is often eleetronically subdivided for customer access within the building. Some carriers are serving more than one customer with each fiber pair, while others have dedicated one or more.fiber pairs for a single customer, which is often an interexchange carrier. In either case, the fiber rings afford a simp'le inherent route redundancy arrangement since traffic can reach the hub in either direction around the loop.
Metropolitan or urban carriers have faced significant barriers to market entry because they must usually negotiate separately with each building owner, as well as obtain municipal franchises· and other permits and meet state legal regulatory requirements. Despite the obstacles, a number of entities have successfully established themselves, and at least two are now operating in a significant number of metropolitan areas. There has_ also been increasing acquision activity with the larger entities purchasing or showing an interest in purchasing a number of smaller entities. Some of the interest in metropolitan fiber systems is evident from Cable TV companies which are also using fiber in their CATV systems. The potential for merger and acquisition activity has thus mitigated to some extent the risk to small startup ventures. An operation in a single city typically involves a $2 million to $10 million investment and serves at least 20 buildings.
The companies typically offer non-switched services, and although they provide end user to end user links, most of their business is either for customer access to a long distance _carrier or for links between interexchange carrier points-of-presence. One of the larger entities has established the first 100 Megabit per second network over its facilities. Standards, availability of equipment, and customer requirements should facilitate further development of such networks.
The urban or metropolitan fiber systems have been vafuable to the interexchange carriers for providing facilities between their points-of-presence and have reduced the red tape and other problems associated with the facilities the interexchange carriers might otherwise be required to build in metropolitan or urban areas. Besides interexchange carriers, financial institutions are a significant customer category. Despite their touted reliability, cost, and competitive installation and maintenance intervals, customers with multiple sites may for administrative reasons choose not to use urban fiber carriers when some of those sites are not directly accessible to an urban fiber system.
Teleport Communications Group, one of the first urban or metropolitan fiber systems to appear, started in a single metropolitan area, has been expanding to other areas and has also
30

shown an interest in investing in existing entities. It has recently acquired DFW Metrolink in Dallas, Texas which had suffered financial difficulties. Teleport Communications Group initiaUy deployed a significant amount of fiber in Manhattan, both for access to satellite earth terminals outside the city and for digital services within New York City. The earth terminal traffic is associated with analog vi.cJ.eo services which have typically used a single fiber for each broadcast quality channel. Its operations have been extended to Boston, Chicago, Los Angeles, San Francisco, Houston, Dallas, and Los Angeles; and it has been attempting to enter the Washington, D.C. market. It also serves a number of smaller cities in New Jersey along the New York- New Jersey corridor, including Garden City, Jersey City, Newark, North Brunswick, Princeton and Weehauken, as well as Cambridge and a few similar sized cities in the Boston, Massachusetts area. Teleport Communications Group operates in each city through wholly owned subsidiaries or through partnerships and indicates that it currently reaches more than 500 buildings.
Another multi-city system, Metropolitan Fiber Systems, Inc. (MPS), is based in Chicago and has been constructing fiber facilities in a number of metropolitan areas through routes designed to maximize the number of large entities that can be served at minimum cost. MPS is 80% owned by Kiewit Communication Company, which had been involved in construction of a number of interexchange carrier fiber networks. This company is deploying fiber in each of its cities based upon a master plan involving one or more rings. The company promotes reliablity with redundant equipment and a backup route as well as a centralized maintenance reporting and deployment system. MFS was operational in 12 major metropolitan areas by the end of 1991 and typically deploys several hundred fiber miles per city.
Metropolitan Fiber Systems presently operates in Chicago, Minneapolis, Boston, Pittsburgh, Philadelphia, Baltimore, Houston, Los Angeles and San Francisco, New York City and Dallas. It has recently acquired Institutional Communications Company (ICC) in Washington, D. C., bringing its total estimated investment to more than $120 million. The Washington, D.C. system uses the subway tunnels as a right-of-way for much of its downtown fiber and has a number of small rings in areas of high business concentration and is serving about 212 buildings in Crystal City and Reston in Northern Virginia and New Carrollton in suburban Maryland. Traffic for its network is increased through leasing of DS-3 capacity to a number of distant cities providing feature group D access on a resale basis to the Washington area. The acquired entity, one of the oldest metropolitan fiber systems, has served both large business customers and interexchange carriers and has been providing service since 1986.
. Several operations serve a small number of medium to large cities and sometimes some of the surrounding counties. Eastern Telelogic is one such company and is based in Philadelphia. The company serves four counties in the Philadelphia metropolitan area (Montgomery, Philadelphia, Chester, and Delaware). 8 As of the ~nd of 1991 its full system is estimated at about 140 route miles and it reports serving more than 200 buildings. A second Philadelphia company, Philadephia Fiber Optic Corp., no longer appears to exist and the status of its deployed fiber could not be ascertained. This company had a single city system, which was to have been associated with a larger venture known as Fiber Optic Company of the U.S., which also no longer appears to exist. Another company, Diginet, operates urban systems along the Chicago and Milwaukee corridor as well as a link between the two cities. Indiana Digital Access provides service to a number of buildings in Indianapolis and Terre Haute and serves the surrounding towns of Muncie, Anderson and Lafayette with digital microwave, all within about 60 miles of Indianapolis. Finally, Intermedia Communications Co. of Florida which
8 See reference 112.
31

originally operated in Orlando and Tampa now also operates in Miami.
·A number of entities which have recently begun to deploy fiber are identified. Available statistics for those companies which were identified as having operating fiber systems in 1991 are included in Tables 14 and 15. Only companies having fiber systems in operation and providing data were included in the tables.
Companies surveyed include Bay Area Teleport in San Francisco which recently added fiber to an all microwave system; Electric Lightwave which operates in Portland, Oregon, and Seattle, Washington; Metrex which serves Atlanta and Birmingham; City Signal which serves Grand Rapids and Detroit; Penn Access which serves the Pittsburgh metropolitan area; and New England Digital Distribution which serves Boston and Cambridge. A new entity in this year's report is Digital Direct, a subsidiary of Westmarc Communications which began multicity operations in Seattle, Dallas and Chicago during 1991. Other entities covered for the first time in this report include Ohio Linx in Cleveland, Ohio; Metro Com in Columbus, Ohio; and Fibernet, Inc. which started operation in Rochester, New York and is expanding service to Buffalo, Albany and Syracuse, New York during 1992. Finally, Western Union ATS is operating urban fiber systems in a large number of cities. It was bought from Western Union and is now a subsidiary of MCI. Western Union ATS provides some of MCI's metropolitan conduit and fiber infrastructure in a significant number of cities, in addition to serving other customers.
Of some interest is the fact that the structure of the industry is leading to a greater number of corporate relationships between cable TV companies and urban fiber carriers. A number of the smaller urban systems, for example, are being or have been acquired by a cable TV company. Penn Access is being acquired by Digital Direct, Inc., a subsidiary of Westmar Communications which in turn is owned by TCI, a large cable TV company. Tile company ha:.. recently filed for state regulatory approval for this acquisition. In addition, a cable TV Company, American Cablevision, has established a subsidiary called Kansas City Fiber Net to provide an urban fiber system in Kansas City and Independence Kansas. Another company, Jones International, which already has a cable TV subsidiary called Jones Intercable, has established a sister subsidiary, called Jones Lightwave, to construct urban fiber systems. It now operates a system in Atlanta, Georgia. ·
Electric utilities are also involved in urban fiber networks. Two such entities, IOR Telecom (a subsidiary of Iowa Resources in the Des Moines, Iowa area) and Public Service of Oklahoma (an electric utility in the Tulsa, Oklahoma area) are providing transmission capacity to their customers as an adjunct to their electric power distribution activity.
As the urban fiber systems extend to more cities and attract more customers, they can be expected to selectively impact growth of demand of the lO'cal telephone companies. However, urban fiber systems can only serve those customers they can access. Their customers may, therefore, still be dependent on the local telephone companies. Urban fiber systems appear to have motivated local telephone companies to price special access closer to cost, and to serve larger customers by means of redundant facilities and fiber rings. Of particular note is the fact that a number of fiber rings or fiber redundancy arrangements have been reported by the Bell operating companies in many of the very same cities where urban fiber systems exist. 9 ·
9 See reference 69.
32
w w
Table 14 - Urban Fiber Systems*
!Company Name Route Miles Fiber Miies 1987 1988 1989 1990 1991 1987 1988
Bay Area Teleport 2.4 City Signal 67.0 115.0 Dlginet 5.4 24.0 26.3 Digital Direct 118.0 Eastern Teleloglc 68.0 140.0 140.0 Electric Llghtwave 6.4 Flbernet, Inc. 8.4 I. C. C. (Now part of MFS) 88.5 108.4 137.0 148.2 198.0 3,059 5,462 Indiana Digital Access, Inc. 7.0 34.5 59.0 50.0 238 Inter-Media Communications 18.3 78.0 159.0 165.0 579 IOR Telecom (Iowa Resources) 60.0 65.0 75.0 Jones Lightwave 10 Kansas City Fiber Net 90.5 93.7 Metrex Corporation 7.5 20.0 Metro Com 36.0 MFS (not Including I. C. C.) 9.5 62.6 84.1 272.5 399 New England Digital Distribution 10.0 10.0 Ohio Llnx 2.5 Penn Access Corporation 31.0 80.0 Phoenix Flberllnk 22.0 Public Service of Oklahoma 120.0 109.0 119.0 rreleport Communications Group 44.5 57.7 227.2 273.2 400.8 4,711 5,433 rreleport Denver 100.0
Total Reported: 133.0 200.9 792.7 1,267.5 2,071.0 7,770 12,111
* See accompanying notes to the tables and discussion in text.
1989 1990 1991
85 5,628 6,280
684 1,147 1,160 7,144
2,184 3,666 ' 3,666 451 388
5,877 6,121 7,812 295 469 528
1,365 2,862 3,000 1,284 1,600 1,805
80 2,534 2,624
125 225 650
7,497 12,154 29,089 1,440 1,200
84
1,865 6,800 968
2,500 2,631 2,855 12,346 15,519 20,238
4,800
34,032 57,761 101,932

Table 15 Urban fiber Systems Other Current Data -- 1991 *
Average Sheath Fiber
ompany Name Miies Count
Area Teleport 3 28.3 Signal 115 54.6
inet 28 41.0 ital Direct 138 51.7
astern Teleloglc 140 26.2 leciric llghtwave 6 69.6 ibernet, Inc. 8 46.2
• C. C. (Now part of MFS) 198 39.5 ndiana Digital Access, Inc. 50 10.6 nter-Media Communications 165 18.2 OR Telecom (Iowa Resources) 80 22.6
nes ligh' rave 10 8.0 ansas City Fiber Net ·131 20.0
ex Corporation 20 11.3 oCom 36 18.1 (not including I. C. C.) 273 106.7
ew England Digital Distribution 10 120.0 hio Linx 3 33.6 enn Access Corp. 80 85.0
nix Fiberlink 22 44.0 lie Service of Oklahoma 141 20.2
485 41.7 100 48.0
Reported: 2,242 45.5
Investment Milllonts$
0.2 5.0
11.9 14.4 13.0 2.0 NA
19.9 0.7 NA 4.0 0.5 NA 1.2 NA NA 5.0 NA NA 2.0 3.0 NA NA
82.6
* See accompanying notes to the tables and discussion in text
34
Percent Buildings I Fiber Cust.
Lit Loe.
60% 16 9 30% 14'1 126
80 45 30 4'1
65° NA 230
17% 24 21
NA NA 35
54% 406 212 61% 16 10
100% 140 105
61% 50 60 13% 1 2 51% 41 24 10% 7 ·1
NA 18 18 67°A 3,489 629
10% 30 15 NA 3 3 NA 60 60 2?0A 12 25 75% 26 42 73% 1,295 511 NA NA NA
58% 5,891 2,236

Notes· to Tables 14 and 15: (NA indicates data was not available)
Sheath mileage for Diginet and Metropolitan Fiber System, Inc., Intermedia Corp., Teleport Denver and where otherwise unavailable was assumed to be equal to route mileage.
Statistics shown are for backbone .system and reflect owned facilities. Bay Area Teleport, for example operates leased facilities which are not shown in the tables.
Diginet fiber data shown in Tables 14 and 15 does not include fiber connecting Milwaukee and Chicago that is shown in Tables 1 and 2. ·
Fibernet facilities shown in the tables only include its Rochester, New York operation.
Intermedia Corp. bas revised historical route and fiber mile data which had apparently not been reported cumulatively.
Average fiber count is calculated as the fiber mileage divided by the sheath mileage.
Definitions and descriptions of items in Tables 14 and 15:
Route miles of fiber -- The total number of miles of fiber routes as would be seen on a network map.
Total Fiber miles of fiber -- The number of fiber strand miles used in all routes including both lit and unlit fiber -- the sum of the number .of miles of each cable weighted by the number of fiber strands.
Sheath miles of fiber -- The total number of miles of fiber cable used. (Equal to or greater than route mileage.)
'Fiber miles of lit fiber -- The number of fiber strand miles activated or equipped with optoelectronic equipment at terminal and repeater sites and capable of providing at least one voice grade circuit .
Investment in fiber backbone facilities -- The total investment ·J.n fiber cable, deployment, repeater sites but not including electronic or optoelectronic equipment.
Buildings served -- The total number of buildings accessed by fiber where the carrier is capable of providing service.
Customer Locations -- The total number of customer locations or sites in bu·ildings accessed by fiber.
Cities Served -- A list of cities served by fiber facilities. (See text of report.)
35

Other Entities Deploying Fiber
The electric utilities and cable TV companies have also been deploying fiber. While these entities are beyond the primary scope of this report and are too numerous for a complete survey treatment, they are mentioned here insofar as they have introduced innovative and cost effective approaches in their deployments.
Previous reports highlighted joint deployments of electric utilities and interexchange carriers which typically use what is called "ground-wire fiber" in which the fiber is encased inside the standard ground-wire cable and deployed on the high voltage structures. Use of fiber electrically isolates the power facility from the communications link, and ground-wire fiber is believed to be less vulnerable to direct hits by lightning than to very serious power malfunctions that could melt the cable. Such risks, however, are expected to be lower than the outage risk of buried fiber associated, for example, with the fiber cables being accidentally dug up. Ground-wire fiber deployments involving long-term use agreements with interexchange carriers have provided a very cost effective means for many electric utilities to upgrade their own communications facilities, and a number of electric utilities, especially in the southeastern U.S., have been fairly active in promoting this approach. The deployments are also useful in that they may have a limited impact on future microwave frequency requirements associated with private microwave systems used by the electric utilities. Microwave systems, however, will often still be used for backup and to reach areas not accessible to fiber systems.
There are a number of different types of arrangements which have been used by the electric utilities in deploying fiber with the interexchange carriers. Typically the facilities are built under a negotiated long-term agreement sometimes characterized as an "enhanced right-of-way" or the utility leases or negotiates capacity built by a subsidiary. The details of these arrangements are beyond the scope of this report. As part of last year's survey several electric utilities or their subsidiaries in the Southeast, including TVA, Georgia Power, Alabama Power, MPX Systems, Carolina Power and Light and Entergy Corporation (formerly Middle South Utilities), were contacted. Last year's report identified about 3,400 route miles and about 65,000 fi:ber miles of ground-wire fiber systems for the above entities, either completed or nearing completion. All but about 675 route miles of this appeared to be associated with interexchange carriers. Continuing construction plans of these utilities through the 1992-93 time frame included an additional 770 route miles and about 18,800 fiber miles associated with interexchange carriers by three of the above entities. This year's survey focused on the foterexc;hange carriers rather than the electric utilities to determine the extent of their joint facilities with electric utilities. A limited response by the interexchange carriers only identified a total of only about 25,000 fiber miles of such facilites which is far below the total known to have been deployed. 10 ·
Besides the electric utilities, several cable TV companies have been fairly active during the past few years in fiber deployments. These include A TC, Jones Intercable, TCI, Continental Cable and American Cablevision. While a number of CATV companies use microwave systems for the backbone portion of their networks, other companies have concentrated on deploying fiber in the "trunking" or backbone portion of their plant which is shared by the largest number of subscribers and which most affects service quality. Last year's report documented more than 25,000 fiber miles which had been deployed by A TC and Jones
10 See references 101-103.
36

Intercable in what may be characterized as hybrid fiber/coax systems. The mode of deployment used takes advantage of the one-way character of transmission and is cost effective becau~e fiber repeaters are not used. Rather, input power at the source or head end is repeatedly split in fiber structured as a tree until power budgets are fully met. 11 This approach retains the coaxial cable nearest the subscriber with a minimum number of repeaters, and the costly coaxial investment a~sociated with accessing individual homes is retained in its existing form. These deployments of fiber are of interest in that they are primarily passive systems which are targeted to result in the greatest impact for the smallest incremental capital in vestment.
Tutorial Review of the Technology
Before discussing the technology itself, it may be useful to briefly review a few terms which have been frequently used in this report. First, the term "gigabit" is used to denote gigabits per second (billions of bits per second). "Megabit" is used to denote megabits per second (millions of bits per second). "Kilobit" is used to denote kilobits pe.r second (thousands of bits per second). These effective data rates are sometimes referred to as throughput rates or simply throughput. Another important term denoting capacity and used extensively in this report is the term OS-3. Before defining a OS-3 it is useful to define the term OS-1, a unit of capacity consisting of 24 equivalent 64 kilobit channels, each of which can be used to handle a single voice conversation. A OS-3 is a multiplexed bundle of 672 64 kilobit voice grade circuits (with a present standard bit rate of 44.736 megabits per second) which contain up to 28 channels operating at the OS-1 rate of 1.544 megabits per second.
Several acronyms relating to a number of fiber and digital standards are in common use in the literature. Two such terms, SONET and FDOI, refer to synchronous optical network standards and fiber distributed data interface standards respectively. 12 SONET standards will impact a significant part of local operating company networks and will affect, for example, digital cross connects associated with switched or reconfigurable OS-1 and OS-3 links. Equipment for local operating company applications is presently in greatest demand. Fiber distributed data interface standards will probably have greatest initial applicability to personal computer networks and metropolitan or urban fiber systems. 13
Another acronym, ISON, which stands for integrated switched digital network, refers to an overall application of the technology to provide for both newer digital and more traditional telephone services in an integrated network and incorporates the new network and interfacing standards which are being adopted world wide. While the acronym ISON has been loosely used to describe digital services, it is a term that primarily concerns the overall design strategy, interfacing standards and protocols for evolving the s,witched public telephone network. The concept as originally planned did not incorporate wideband video capability, which has not traditionally been provided by the local telephone carriers. Because ISON is a digital network concept, an overall ISON network capability, with widespread deployment of fiber is rapidly becoming a reality which will provide the protocols and interfacing standards
11 See references 21-23 .. 12
See references 107 and 132. 13 See reference 74.
37

for an emerging worldwide fiber network.
· Fiber is a relatively new transmission medium which uses light rather than electrical or microwave energy to provide for the transmission of intelligence. The light is propagated through thin strands of glass in a~ similar manner to the propagation of microwaves in a waveguide. The propagation medium can be much smaller for electromagnetic energy in the visible range than for microwaves because of the vastly smaller wavelength of light. Fiber became the medium of choice when losses were reduced to the point where repeater spacings and associated cost became competitive with earlier coaxial, microwave, and copper-pair transmission cost. Early fiber transmission systems used multimode fiber which allowed the light to propagate over many slightly different paths through the fiber. Each path had a slightly different length resulting in varying delays for selected portions of the signal. This enhanced a phenomenon called "dispersion", resulting in limitation of the maximum allowed transmission bit rate. Excessive bit rates could not be transmitted because dispersion caused the pulses to spread out and make the transmitted signal unintelligible.
Today, single mode fiber is used in long-haul high capacity systems. This type of fiber does not allow the light to propagate in more than one path or mode and significantly reduces the dispersion problem discussed above. As a result, transmission bit rates became limited by the technology used to modulate electrical signals onto the light source. Advances in this technology are gradually·pushing up the throughput of optical systems with transmission rates in the gigabit range already a reality.
The modulation of the light signal may take a number of forms. Traditionally, the highest capacity systems encoded transmitted information on pulses of light, since the lasers producing the light could easily be made to emit light pulses. The use of techniques of heterodyning, more analogous to information transfer of information on radio that is also under development, may enable even higher throughput data rates. In addition, wavelength division multiplexing using slightly different colors of light to enable simultaneous transmission of multiple signals, each in the gigabit range, are being developed. Theoretically, maximum throughputs as high as 25,000 gigabits or 25 terabits (trillions of bits per second) are possible as the transmission rate is limited only by the inherent frequency of the optical energy itself. Present experiments suggest that total system throughputs of about 100 gigabits on a single fiber are possible based on extensions of known technology. Engineers are investigating new technologies which may eventually make throughputs in the terabit range possible. However, the future application of higher system data rates may require smaller repeater spacings until further problems with dispersion are solved.
Technological Developments
Developments in fiber technology are occurring in several areas. The ongoing research typically has a long-term horizon. Fiber (optical) amplifiers, ultra low loss fiber, increases in information handling capability, and new network electronic configurations and fiber architectures are all areas under investigation. This section will briefly highlight some of the developments in these areas.
A basic interest in further lowering the cost of fiber systems on a per-circuit basis and extending their useful life has centered on increasing fiber system capacities and reducing the number of required repeaters. This will require higher speed laser emitters, use of multiple wavelengths or "rails," advances in repeater technology aind solutions to problems of dispersion. The highest capacity systems using a single optical wavelength, typically operate in the one to two gigabit range and handle between 28 and 36 DS-3's per fiber pair. AT&T's 1.76 gigabit
38

systems, for example have a capacity of 36 DS-3's or 24,192 equivalent voice circuits per fiber pair. AT&T also uses a 2 wavelength or "rail" system which can handle two 1.76 gigabit systems on a &ingle fiber pair. Research on more advanced systems, both using wavelength division multiplexing and higher bit rates using a single optical wavelength is continuing. Those systems using the wavelength divisJon approach will require a separate laser for each optical frequency (color) and will enable hundreds of thousands of telephone conversations to be simultaneously carried over a single fiber pair.
Developments to more fully exploit the vast potential capacities of the fiber medium itself have focused on the need to improve repeater and terminal technology, since existing single mode fiber is operating well below theoretical capacity limits of the fiber itself, even when systems in the 1 to 2 gigabit range are employed. Use of multiple optical wavelengths or rails has been demonstrated in the laboratory and in field tests and appears to provide the basis for the most immediate capacity increases. Other types of modulation including forms of analog modulation are also under investigation. Systems with throughputs of between 16 and 27 gigabits are also reportedly being developed or demonstrated in the laboratory by AT&T, Bellcore, British Telecom, NTT, and others.
Systems using a single optical wavelength on a fiber with throughputs in the gigabit range may require a special kind of single mode fiber called dispersion shifted fiber. For this and other reasons a good deal of current investigation to further increase capacity on existing fiber is focusing on wavelength division multiplexing. Because fiber technology has reached the point in which theoretical fiber capacities far exceed present repeater and terminal technology associated with the optical-electronic interface, fiber research activity is focusing on producing fiber with even lower losses by looking for other phenomena that could amplify light signals directly and cancel the effects of dispersion. This would permit larger spacing between repeaters, as well as boost potential capacities. As should be evident, accomplishments of greater spacing between repeaters is usually accompanied by lower bandwidth capability and vice versa, which is due partly to the phenomenon of dispersion. Thus, maximizing the product of the bandwidth and repeater spacing becomes the ultimate objective. 14
An exciting development in the research stage that may affect the industry within the next 10 to 15 years is ultra low loss halide fiber. This new type of fiber can potentially provide transmission without repeaters over distances exceeding 2,000 miles and undoubtedly will impact future transoceanic transmission systems. Bell Laboratories, Corning and others, including the Japanese, have been investigating halides, but many very difficult problems, _including the extreme brittleness of this kind of fiber, are yet to be solved.
To further enhance the capability of existing fiber, work on laser amplifiers which can be placed in line with fiber is another area of interest. Such devices are just now becoming available but cost may be prohibitive for many applications. qptical amplification offers interesting possibilities because the greatest limitation in transmitting data over fiber is the limitation in existing repeaters and terminal devices which must convert optical signals to electrical signals and back again. With optical repeaters the full capability of fiber would not be limited by the need to develop new generations of optoelectronic conversion devices. Such developments would be particularly advantageous in undersea fiber systems where capacities of systems could be increased with new terminal devices as technologies associated with the electro-optical interface improve, and the repeaters would not have to be touched. With optical repeaters, new generations of terminal electronics could thus increase system capacities without
14 See reference 11.
39

requiring new repeaters that effectively require a new cable to be laid. l5 AT&T and KDD in Japan expect to use fiber amplifiers in transoceanic cable in as little as three to four more years ·with capacity more than an order of magnitude greater than existing systems.16
Repeaters are required in fiber systems for two reasons. First, and most obvious, is the effect of attenuation or loss in the fiber. The second but equally critical effect of dispersion limits transmission bandwidth and repeater spacing. As propogation distance increases, light pulses on fiber tend to spread out due to this phenomenon. Dispersion is caused by very slight differences in distance traversed by different portions of the optical signal that affect bandwidth characteristics through constructive or destructive interference. This can be a . critical problem, since it limits the maximum data rate which can be transmitted or the allowable distance between repeaters.
Single mode fiber now in use vastly reduces dispersive effects over multimode fiber since only one mode or characteristic propogation path is allowed. Nonetheless, even further reductions of dispersion are required for fiber systems to support higher data rates over significantly longer distance, as would be encountere.d in underseas cables or in terrestrial systems with larger repeater spacing.
One very interesting approach has bee·n the use of what is called "soliton pulse transmission". A soliton is a pulse that remains unchanged by dispersive fiber effects during its transmission. Nonlinear quantum effects are employed to both amplify the signal and cancel the effects of dispersion. A continuous (non- pulsed) laser provides a background light level of sufficient power which, through a phenomenon described by quantum physics called " • II f f h . l l d . 1 . 1 17 pumpmg, causes a trans er o energy tot e propagatrng ower power pu se opt1ca s1gna . The propogation velocity can be altered by changing the light intensity through what is
known as the Kerr effect which can be used to control dispersion. l8 This would allow transmission at very high data rates without the need for repeaters which require conversion of optical to electronic signals and vice versa. Fiber systems operating with background laser pumping over their entire length could totally eliminate the need for repeaters, or this effect might be used over selected fiber sections to regenerate pulses optically. Further research in this area is going on at Bell Laboratories and elsewhere.
To date very long high capacity systems employing laser amplification techniques have been demonstrated including a recent coherent system demonstrated by NTT with 2.5 Gigabit data rates over distances approaching 1,400 miles. Such a system can be rated by multiplying .the maximum system length by the bandwidth which in this case is over 5,500 gigabitkilometers per second. An experimental high capacity system demonstrated at AT&T reportedly achieved transmission up to 50,000 gigabit-kilometers per second. In the future, when remaining problems are solved, fully optical working systems extending over 4,000 kilometers will be deployed. Transmission up to 9,000 kilometers would then only depend on proper control of the jitter of pulses due to quantum effects. These developments demonstrate
15 See reference 89.
16 See reference 34.
17 See reference 119.
18 See reference 34.
40

\at many current fiber system technologies, as amazing as they seem, are still only in their fancy. 19
Soliton pulse transmission and related technologies typically first find application in undersea environments where extending the useful life of cables by allowing future enhancements of their capacity will justify the expected higher early costs of these systems. Eventually, such technologies will significantly reduce the cost of building terrestrial systems by eliminating many costly repeaters.
The vast potential capacities of existing fiber will be realized as new repeater and termination technologies are developed. Unfortunately, these developments may not always coincide with practical real world requirements. As a result some carriers are beginning to weigh strategies and costs associated with alternatives of overbuilding certain existing routes with more fiber, upgrading the electronics on existing routes, and waiting for availability of new generations of electronics. It appears that those developments which will increase fiber capacities over current maximum levels using significantly higher bit rates are far enough in the futµ re to constrain the potential capabilities of existing systems, at least for the time being. In the immediate future, systems with multiple wavelengths or rails appear to be most likely. Availability of new capacity enhancing technologies and expected demand growth will impact the degree of new fiber deployments and overbuilds.
Another important area of interest has to do with electronic configurations and fiber architectures which would both minimize the cost of fiber deployment in the loop plant and improve overall network reliability. The portion of the plant closest to the customer is inherently the most costly, since opportunities for exploiting economies of scale in the loop e?-vironment are limited. Novel fiber architectures are important when trying to reach end
)ers with fiber in a more cost effective manner with lower chances of failure. For this Jason, more attention is being placed on new approaches for configuring fiber and electronics.
Fiber-to-the-curb systems have stood out as one obvious cost reducing configuration and a group of vendors already manufactures equipment for such systems. 20 Fiber rings, which can be used to serve end users or to interconnect central of fices, have stood out as one means for addressing reliability issues.
The fiber rings used by local operating companies and urban fiber carriers are one example of fiber configurations or architectures typically used for large businesses or
, downtown office buildings. Using this approach, fiber can access many large customers with system redundancy in a cost-effective manner. To share the available capacity on fibers used in fiber ring arrangements, the capacity is often subdivided by means of multiplexing and demultiplexing equipment, or a so-called bus structure has been used. This allows a customer to only access a portion of the fiber bandwidth on an as-needed basis. Further development and exploration of such approaches may eventually lead to more cost-effective ways of providing high bandwidth capabilities to residences as well as improving ove~all network reliabiliy.
In addition, new fiber configurations associated with fiber to the home trials of the operating telephone companies are emerging. In an attempt to reduce the cost of video to the home, system bandwidth is sometimes sacrificed by using a switched optical signal allowing the
19 See references 34 and 134.
20 See reference 80.
41

user to remotely control the video signal reaching the customer. Such switched systems when used for home entertainment are incompatible with existing CA TV systems which provide all signals (up to about 80 channels) to the customer simultaneously. Switched video systems also require extra equipment on the customer's premises and do not appear to allow the customer to simultaneously record one channel and watch another. Presently, optical switching technologies are at an early sta.pe of development, which will probably constrain the early possibilities of such systems. 2 Developing video and data compression technologies may also find application in video to the hoine systems. These technologies may also provide an impetus toward greater use of narrowband ISDN and may spur development of a variety of novel services to customers over existing facilities. One relatively promising compression technique based on fractal mathematics may provide compression ratios needed for transmission of television signals over narrowband ISDN lines. Such approaches in some form would allow more time for the economic development of broadband systems while stimulating demand for narrowband ISDN whose development extended over many years but whose use has been retarded by lack of such a stimulus and by preoccupation with wideband systems. 22
The cable TV industry has only recently begun to use fiber (since about 1988); however, early developments suggest that it has developed cost effective methods of deploying fiber in video applications that provide wide bandwidth for one-way communications. 23 Use of fiber in the backbone or "trunk" portion of the CA TV service provider's network, with a wide band width coaxial transmission system in the portion of the network nearest the subscribers, eliminates a large number of amplifiers which are currently associated with coaxial CATV systems, thus resulting in more uniformly reliable service to all customers with improved signal quality. The repeaterless backbone fiber network "feeds" a series of small cells each of which uses a small existing coaxial network. The coaxial cable going to the customer is unchanged, and no expensive and high maintenance equipment is required in the customer's premises for conversion of optical and electronic signals. The customer thus continues to receive the full set of channels, and the cable operator can justify the in vestment on the basis of improvement in service and reduction in system operating and maintenance costs. CA TV operators using such systems are clearly interested in new developments associated with optical amplifiers which will enable further use of fiber in their systems.
The portion of plant closest to the customer is generally the most costly because there are fewer opportunities for sharing that generally makes fiber systems so attractive. The fact that residential customers don't necessarily require the same bandwidth in both directions suggests that benefit may be derived by focusing on the expected evolution of bandwidth and switching requirements in both directions for residences and businesses, rather than on the fiber medium or conveyance itself. From a technical viewpoint, a facility combining a fiber "trunked" one-way wideband video capability with a return narrow band channel might be one means to accelerate the development of sophisticated communication.s services to residences on a cost-effective basis. Planned evolution of such a facility would. allow exploitation of new technology as it became cost effective. 24 '
. 21 See reference 30.
22 See references 7,62 and 148. 23 See references 21, 22, and 80. 24 See references 22 and 89.
42

Despite practical regulatory issues as well as issues involving the structure of very different utilities, it is natural to consider the embedded investment of existing CATV coaxial syste~s, which either serve or pass most U.S. households in the country and are designed primarily for one-way transmission, as part of an integrated system for residential use. Use and further development of such existing facilities together with telephone company facilities could permit new services to deveiop with less extensive commitments of new capital, than might be envisioned by early deployment of fiber to customers on a large-scale basis. Present industry and regulatory structure, however, does not appear to be leading to this kind of result. Instead, there have been a number of corporate relationships linking Cable TV and Urban fiber operations and a sense of some in the industry that competition will solve all the problems of introducing new technology into the local loop. More effective ways of utilizing new technology in the local loop will involve new ways of dealing with complex regulatory, management, and technical issues. New approaches both to develop and effectively manage deployment of innovative network architecture and technology merit continued investigation and highl~ht the neeq for careful and thorough planning prior to significant commitments of capital. 2
This section has only touched on some of the ongoing developments in fiber technology. Further information is contained in a number of references listed on the following pages. To better evaluate technological developments by the operating companies, a question on fiber trials, fiber-to-the-curb systems, and fiber ring architectures was asked in the survey. Data received is summarized in Table 8 of this report. Information of this kind may be useful in evaluating the awareness and responsiveness of the local operating telephone companies to the latest and most cost-effective technologies available to them.
25 See reference 135.
43

References:
1. Abel, Glenn, "Carriers For!ll Fiber Net for Long Distance Service," Communications Week, Jan 16, 1989,.p.10; "Williams Offers $365 M for Lightnet," Communications Week, Feb. 13, 1989, pp. 4,66,67.
2. "A Competitive Assessment of the U.S. Fiber Optics Industry," prepared by Office of Telecommunications, International Trade Administration, U. S. Department of Commerce, September 1984; Advance copy of revised report "The International Competitiveness Study of the Fiber·Optics Industry," dated Sept. 1988.
3. Alexander, Andrew, "Fiber Finds a Home at the Curb," Telephony, April 16, 1990, p. 160.
4. Aspell, Jennifer and Bergano, Neal S., "Erbium. Doped Fiber Amplifiers for Future Undersea Transmission Systems," IEEE Lishtwave Communications Systems, Nov.1990, pp. 63-66.
5. . AT&T Press Release, Basking Ridge, N.J. 07920 November 8, 1984. AT&T Press Release, Bedminster, N.J. Nov. 11, 1987.
6. earrett, Andrew C., "The Potential of Fiber Optics to the Home: A regulator's Perspective," Public Utilities Fortnishtly, Jan. 19, 1989, pp. 14-17. • •
7. Barnsley, Michael F. and Sloan, Alan D., "A Better Way to Compress Images," ~ Magazine, January 1988, pp. 215-223.
8. Bishop, Nick "Overhead Power Lines Help Fiber Go Aerial," Telephony, Jan 2, 1989, p.18.
9. Blake, Richard, "From POTS to B-ISDN: Take the Passive Approach," Telephone Engineer and Management, August 15, 1990, pp. 41-3.
10. Bohlin, Ron, Roth, Allan and Wenner, David L., "Do LEC's Need Magic to Cut Costs," Telephony, April 29, 1991, pp. 31-35.
11. Boult, Raymond,"Europeans to Supply Canadians With Longest Unrepeatered Link," Lightwave, Nov. 1990, p.9.
.. 12. Bradsher, Keith, "New Fiber Optic Cable Will Expand Calls Abroad and Defy Sharks,"
New York Times, Aug. 15, 1990, p. D7.
13. Brackett, Charles A., "Dense Wavelength Division Multiplexing: Principles and Applications," IEEE Journal on Selected Areas In Communications, Vol. 8, No. 6, Aug. 1990, p. 948.
14. Briere, Daniel, "MANs Provide Digital Services at Low Cost," Network World, November 12, 1990, p. 1, 51-60.
44

15. Brown, Ronald 0., "LEC Alternatives Offer Competitive Services and Pricing," Networking Management, pp. 46-53.
16. ·Burgess, John, "Fiber 'Optic Firms Face Hefty Hurdle -- D.C. seeks $100,000 fee from Applicants," Washington Business (Washington Post Insert), Oct 30, 1989, p. 5-6.
17. Burns, Conrad, U.S. Senator, "The Cable TV Problem: A ProCompetitive Approach," Public Utilities Fortnightly, Vol. 126, No. 4, Aug. 16, 1990, p. 16.
18. Bushaus, Dawn and Pfeiffer, Deborah, "Fiber to !the Home: A Family Affair," Telephony, Transmission Special Issue, November 1989.
19. Business Week, "Jeno Palucci's Dream: Bring Fiber Optics Home", Sept.21, 1987 pp.34-35.
20. Business Week,"Fiber Optics Getting Cheap Enough to Start Rewiring America," July 31, 1989, p. 86. " People Aren't Laughing at U. S. Sprint Anymore," July 31, 1989, pp. 82-6.
21. Chiddix, James A., Laor, Herzel, Pangrac, David M., Williamson, Louis D, and Wolfe, Ronald W., "A.M. Video on Fiber in CATV Systems: Need and Implementation," IEEE Journal on Selected Areas in Communications, Vol. 8, No. 7, Sept. 1990, p. 1229.
22. Chiddix, James A. "Fiber Backbone Trunking in Cable Television Networks: An Evolutionary Adoption of New Technology," IEEE Magazine of Lightwave Communications Systems, Feb. 1990.
23. Chiddix, James A, "Fibre Backbone for Cable TV Using Multichannel AM Video Trunking," International Journal of Digital and Analog Cabled Systems, (1989) Vol., 2, pp. 87-93.
24. Cochrane, Peter and Brain, Mike, "Future Optical Fiber Transmission Technology and Networks," IEEE Communications Magazine, Nov. 1988, pp. 45-60.
25. Coleman, John D., " A Powerful Problem for Local Loop Fiber," Telephony, June 4, 1990, pp. 28-34.
26. Coleman, John D., "Fiber on Trial," Telephone Engineer and Management, pp. 44-5.
27. Communication Daily, "MCI Leased Wiltel Route to Speed Coast to Coast Link-Up," Jan. 7, 1987.
28. Communications News "F.C.C. Rules For Norlight," Dec. 86, pp.20 and 26; "More Fiber Cuts Costs," Jan. 87, p.21.
29. Communications News, "Fiber Can Carry 10 Times the Load, Tests Show," "TAT-9 Cable Will Span Atlantic Ocean by 1991," "Fiber Optic Network Is tying Philadelphia Area," Dec. 1988, p.6.
30. Cooperman, Michael, Paige, A. and Sieber, Richard W., "Broadband Video Switching" IEEE Communications Magazine, Dec. 1989, p. 26.
45

31. Corman, Bill, Telephone Engineer and Management, July 15, 1985, pp. 131-2.
32. Data Communications, "Big Bandwidth Surge Likely; Who Will Use It and How?", . November 1986, pp 58-64; "F. C. C. Survey Finds 30 Percent of U .. S. Satellite
Transponders Idle," Feb. 1987, pp. 58-64; "Lightwave Future Gets Even Brighter," Feb. 1987, pp. 53-56.
33. Davis, Jeff, and Jander, Chris L., "Fiber in the Local Loop Spawns Power Concerns," Telephony, April 29, 1991, pp. 24,28.
34. Desurvire, Emmanuel, "Lightwave Communications: The Fifth Generation," Scientific American, January 1992, pp.114-121.
35. EccJeston, Douglas J. and Sicotte, John R. "Fiber Must Get Tough to Make It in the Local Loop," Telephony, Jan. 15, 1990, p. 26.
36. Eccleston, Douglas, J., "Making Optical Fiber Behave," Lightwave, Nov. 1990, p. 28.
37. The .Economist, "Company Brief· Cable and Wireless: Free at Last," Feb. 14, 1987, pp. 62-3, "Data Compression --Pntng by Nmbrs," May 21, 1988, pp. 100-102.
38. Edinger, Dennis, Duthie, Peter,and Prabhakara," A New Answer to Fiber Protection," Telephony, April 9, 1990, p. 53.
39. Engineer, Carl P., "Can PON go Broadband?" Telephony, January 14, 1991, pp. 30-5.
40. Federal Communications Commission, "In the Matter of Public Service Company of Oklahoma Request for Declaratory Ruling," adopted April 13, 1988 (DA 88-544). See also, First Report and Order, Docket No. 83-426, 57 RR2d 1486 (1985).
41. Federal Communications Commission. Statistics of Communications Common Carriers, 1990/91 edition.
42. Fleming, Stephen, "T-3 Networks Appease Intensifying Data Hunger -- Public Service of Oklahoma Fiber Optic Network," Communications News, Dec. 1988, p. 24.
43. Forbes Magazine, "Good-bye Cable T.V., Hello Fiber Optics," Sept. 19, 1988, pp. 175-179; "Hold the Phone," June 13, 1988, Vol 141, No. 13, p. 52.
44. Gabriel, Osie, "Don't Put All Your Eggs in One Telecom Basket," Facilities Design and Management, June 1991, p. 45.
45. Galbraith, Michael, "Japan Thinks Big on the Fiber Front," ·'Telephony, May 6, 1991, pp. 34-38.
46. Gareiss, Robin, "Wiltel Rethinks Strategy," Communications Week, Dec. 10, 1990, p. 37.
47. Gaw din, M., "Future Directions in Transmission," Telecommunications, December 1987, Vol. 21, No. 12, pp. 48-57.
48. Gawdin, M., "Lightwave Systems in the Subscriber Loop," Telecommµnications, May 1987, pp. 65-85.
46

49. Golden, Joseph, "Combined POTS and CATV: It's Fiber's Fortune," Telephone Engineer and Management, February 1, 1991, p. 47.
50. · Goldman, Alfred M., Jr. "Communications Satellites Versus Fiber Optics," published by the American Institute Aeronautics and Astronautics, Inc. with· permission, paper # 86-0620.
51. Gottesman, Jeffrey and Sentlinger, Jake "Will Fiber to the Home Be the End of Television?," Telephony, July 2, 1990, p. 18.
52. Guterl, Fred, "Fiber Optics Poised to Displace Satellites," IEEE Spectrum, August 1985, Vol. 22, No. 8, pp. 30-37.
53. Gross, Joel D., "Fiber Optic Networks Introduce Competition to the Local Telcos," Donaldson. Lufkin and Jenrette Securities Corporation Industry Viewpoint, Dec.6, 1989.
54. Guyon Janet, "AT&T to Focus 1987 Spending on Its Network," Wall Street Journal, Jan. 23, 1987, p. 4.
55. Hastad, Rusty and Deutscher, Dick, "Bringing Rural Fiber to the Home," Rural Telecommunications, Summer 1990, pp. 52-4.
56. Hawley, George T., "Break on Through to the Other Side," Telephony, January 14, 1991, pp. 38-48
57. Huegerich, Thomas P., ''Fiber for the Future, Today," Lightwave, Nov. 1990, p. 29.
58. Hughes, Greg, "Fourfold Cable Volume Increase Foreseen by the Ye'.lr 2000," Light wave, Nov. 1990, p. 29.
59. Information Week, "Fiber Optics: Business Lights the Way," Dec. 7, 1987, pp. 28-31.
60. Johnston, William B., "The Coming Glut of Phone Lines," Fortune, January 7, 1985, pp. 96-100.
61. Kaiser, Peter, Mid winter, John, and Shimada, Sadakuni, "Status and Future Trends in Terrestrial Optical Fiber Systems in North America, Europe and Japan," IEEE Communications Magazine, October 1987, Vol. 25, No. 10, pp. 8-13, pp. 14-17, pp. 18-21.
62. Kandembo, Stanley W., "Fractals Research Furthers Digitized Image Compression," Aviation Week and Space Technology," April 25, 1988, pp. 9i,95.
63. Karpinski, Richard, "MCI Acquires Rival Telecom*USA to Strengthen Market Position," Telephony, April 16, 1990, p.10.
64. Killette, Kathleen, "MFS Challenges Bells for Local-Loop Access," Communications Week, Nov. 20, 1989, p. 1.
65. Killette, Kathleen, "NYNEX Agrees to Colocation," Commmunications Week, Dec. 10, 1990, p.1.
66. Kim, Gary, "Fiber-to-Curb Gains Bellcore Near-Term Support," Lightwave, Nov. 1990,
47

p. 1, "Upsurge in Cable TV Fiber Seen," Lightwave, Nov. 1990, p. 16.
67. Kozak, Richard, "Alternative Access Carriers Provide Network Diversity," Networking Management, pp. 104-107.
68. Kozak, Richard, "Alternativ~. Local Access Via Fiber," Telecommunications, July, 1990.
69. Kraemer, Joseph S., "Alternative Carriers Gain Strength," Telephony, May 13, 1991, pp. 55-58.
70. Lannon, Larry, "Buddy Heins, Competitor & Risk Taker, Dives into the New Environment," Telephony, November 4, 1985, p. 48.
71. Lannon, Larry, "Southern Bell, NT Eye Fiber Project," Telephony, September 7, 1987, p. 8.
72. Lannon, Larry, "Sprint Puts Microwave Net on Block," Telephony, September 7, 1987, p. 3.
73. Laser Focus/ Electrooptics, "Fiber Optic Technology and Products," Nov. 1987, Vol 23, No, 11, p. 123; "Synchronous Rubbing Transmission in the Local Loop," Nov. 1987, Vol. 23, No. 11, pp. 132-7; "Fiber Optic Markets: Short Haul to Outdistance Long-Haul in 1990's," Oct. 1987, Vol. 23, No. 10, p. 134.
74. Levine, Judith, "IT'S FDDI MAN," Communications Week, Dec. 1990, p. 2.
75. Li, Tingye and Linke, Richard A., "Multigigabit per Second Lightwave Systems Research for Long Haul Applications," IEEE Communications Magazine, April 1988, Vol. 26, No. 4, pp. 29-35.
76. Liew, Soung C. and Lou, Kevin W. "New Architectures for Diversity in Fiber Loop Networks," IEEE Communications Magazine, Dec. 1989, p. 31.
77. Liahtwave, "Utilities Seek New Ways to Combine Lightwave Nets," Oct. 1987, pp. 17-19.
78. Lightwave, "Japan's Utilities Moving into Telecom," March 1988, p. 1.
7'9. Long Lines Statistics 1960-1982, AT&T Long Lines Business Research, April 1983.
80. Lu, Kevin W., Eiger, Martin I. and Lemberg, Howard L., "System and Cost Analyses of Broad-Band Fiber Loop Architectures," IEEE Journal on Selected areas in Communications, Vol. 8, No. 6, Aug. 1990.
81. Lynch, George P., "Fiber to the Home Telephony, August 10, 1987, pp. 62-66.
Illinois Bell Studies Local Loop Fiber,"
82. Mason, Charles, "MFS Seeks Ruling on RHC Fiber Rings," Telephony, July 2, 1990, p. 9.
83. Mathews, James E. UI, "Fiber Optic Technology Supports a Changing Market," Telecommunications, December 1987, Vol 21, No. 12, pp. 33-5.
48
84. McConnell, John S., "To PON or not to PON? That is the Question," Telephony, January 14, 1991, pp. 50-56.
85. MCI Press releases, MCI Corporate News Bureau, Washington, D.C., Jan. 29, 1987; May 14, 1987; July 20, 1987.
86. Minoli, Dan, "The 1987-1992 Outlook for Fiber-Optics Use in the U.S. Telecommunications Industry," Parts I.II.III.IV: Communications News, August, Sept., Oct., Nov., 1987, Vol.24, No.8: pp.34-39, No.9: pp.60-61, No.10: pp.61-62, No.11: pp.34-35.
87. Mordecai, Brian A., Hsing Russell Waring, David L., and Wilson, Daniels, "Repeaterless T-1 Technology Brings Copper and Fiber Together," Telephony, July 2, 1990, p. 29.
88. Murphy, Kevin W., "Couplers Let Fiber Phone Home," Telephone Engineering..J.!.!lll Management," pp. 60-65.
89. Nakagawa, Kiyoshi and Shimada, Sadakuni, "Optical Amplifiers in Future Optical Communications Systems," IEEE Lightwave Communications Systems," Nov. 1990, pp. 57-62. .
90. Nelson, Cal "What Cost Local Loop Fiber," Telephony, October 29, 1990, pp. 38-42.
91. Paulson, Bob, "Video DS-3 Fiber Gets Smart," Telephony, July 9, 1990, p. 27.
92. Pelton, Joseph N., "Satellites Versus Cable," Telecommunications, June 1988, pp. 35-6.
93. Pepper, Robert M., "Through the Looking Glass: Integrated Broadband Networks, Regulatory Policy and Institutional Change," OPP Working Paper Series, Federal Commµ.nications Commission, Nov. 1988, paper no. 24.
94. Port, Otis, "A Market of the Future Gets Ahead of Itself," Business Week, August 12, 1985, p. 29.
95. Powers, Eric, Communications Engineer, Public Service Co. of New Mexico, "Optical Fiber on the Power Line Right of Way," May 1988, reprint provided courtesy of Utilities Telecommunications Council.
96. Pitchford, Mark, "The Digital Transformation of the Local Loop," Telephony, November 6, 1989, pp. 54-58.
97. Rahe, Wiiliain J., "Future Directions for Fiber Op.tics Private Networks," Communications News, Dec. 1988, pp.22-23.
98. Rabon, Joe D., Chief Telecomm.unication Engineer Southern California Edison Co., "SCE Switched Digital Network 1988," reprint provided courtesy Utilities Telecommuncations Council.
99. Rayan, C. F., "BG&E Fiber Optic System Installation," presented to Pennsylavania Electric Assoc. Telecommunications Committee, Lackawanna Station, PA. June 2, 1987, reprint provided courtesy of Utilities Telecommunications Council.
100. Richter-Matthews, Lisa, "Put Fiber on a Pedestal or Curb it?" Telephone Engineer and
49

Management, November 1, 1989, p.33.
101. Rivkin, Steven R., "Rather Than Build New Plants Why Not Power Up Spot Prices,"The · Electricity Journal, March 1989, pp. 26-33.
102. Rivkin, Steven R. "White Knights for Fiber Nets: How Electric Can Help Telcos Build Fiber to the Home," Public Utilities Fortnightly," Vol. 126, No. 4, Aug. 16, 199.0, p. 20.
103. Rivkin, Steven R., "Telephone and Power Utility Pacts Could Speed Fiber to the Customer," Lightwave, Dec. 1989, p.4.
104. Runyon, Paul, "Fiber Moves into the Feeder Plant," Telephony, Jan. 2, 1989, pp. 40-45.
105. Selander, Hal, "The Economics of Fiber to the Subscriber," Public Utilities Fortnightly, Vol. 126, No. 4, Aug. 16, 1990, p. 24.
106. Sims, Calvin," Fiber Optics: The Boom Slows," New York Times, November 13, 1986, pp. D-1 and D-8.
107. Simpson, Alan, "The State of the Optical Art," Tel~phony, Aug. 27, 1990, p.40.
108. Si.perko, Charles M., "Lasernet-A Fiber Optic Intrastate Network - Planning and Engineering Considerations," IEEE Communications Masazine, May 1985, Vol. 23, No. 5, pp. 31-45.
109. Sperduto, Richard D., P.E.,"Fiber Optic Markets for the Electric Power Industry, presented at the Newport Conference on Fiber Optic Markets, Oct. 26, 1988, provided courtesy of Utilities Telecommunications Council.
110. Stanley, L.W., "A Tutorial Review of Techniques for Coherent Optical Fiber Transmission Systems," IEEE Communications Magazine, August 1985, Vol. 23, No. 8, pp. 37-53.
111. Southard, Robert K., "Fiber Optic Applications in Local Area Networking," Telecommunications, Dec. 1988, p. 51
112. Strano, Raymond P., "Building Bridges Over Bypass," Telephony, Jan. 15, 1990, p. 32.
113. Tagare, Sunil, ''Investment Frenzy!," Telephony, August 28, 1989, pp. 50-54.
114. Telephony, "Will Terabits Take Over?," December 14, 1987, p. 54.
115. Telephony, "Spending Strategies for the 1990's," Dec. 18, 1989, p. 31.
116. Telecommunications News, "BOC Efforts Accelerate Fiber Deployment in the Local Loop," July 1988, p. 18.
117. Testimony before National Strategy Hearing of Secretary of Energy, August 1, 1989, Washington, D.C.
118. Thomas, David, "Cable and Wireless Seeks to Protect Global Network Vision," Financia' Times of London, April 2, 1987, p.l.
50

119. · Tomlinson, W~ J., and.Stolen, Roger H., "Nonlinear Phenomena in Optical Fibers," IEEE Communications Magazine, April 1988, Vol. 26, no. 4, pp. 36-43. .,
120. Tratner, Mark, "Replacing Analog Carrier in the Local Loop," Telephone Engineer and Management, January 1, 1991, p. 40.
121. Travis, Paul," Fiber. Trial Powered by Network," Telephony, Nov. 13, 1989, p. 9.
122. Utilities Telecommunications Council, "Summary of Utility Fiber Optic Applications and Developments," 1988, provided courtesy of Utilities Telecommunications Council.
123. Utilities Telecommunications Council 1988 Annual Meeting, Boston Marriott Hotel June 26-30, 1988, "Papers presented at a panel on Fiber to the Home: A new Opportunity for Utilities" Panelists: Ron McMillon - Warner Cable Communications, Inc., Lawrence L. Hollingsworth - Ohio Edison Co., Kenneth G. Robinson - U.S; Dept. of Commerce, Charles M. Meehan - Utilities Telecommunications Council.
124. Utilities Telecommunications Council, "1990 Survey of Utility Fiber Optic Applications and Developments," July 1990, provided courtesy of Utilities Telecommunications Council.
125. Valovic, Tom, Fiber Optic Deployment Among Interexchange Carriers," Telecommunications, May 1987, pp. 40-53.
126. Valovic, Tom, "Fourteen Things You Should Know about ISON," Telecommunications, Vol. 21, No. 12, pp. 37-42.
127. Valovic, Tom, "ISON in the U.S.: An Assessment," Telecommunications, December 1987, Vol 21., No. 12, p. 8.
128. Valovic, Tom, "The Rewiring of America: Scenarios for Local Loop Distribution," Telecommunications, Jan. 1988, pp. 30-6.
129. Wall Street Journal, "Teleport Boston Corp.," Sept 22, 1988, p. 46, "Phone Firms Battle Cable-T. V. Operators Over Providing Fiber-Optic Home Links," Sept. 98, 1988, p. 23.
130. Warr, Michael, "Fiber Could Keep the Loop in Shape for Less," Telephony, December 3, 1990, pp. 21-2.
131. Warr, Michael, "Fiber to Home in 'City of the Future'," Telephony, September 21, 1987, p. 13, "Will Fiber Find Its Way Home?," Telephony, November 16, 1987, pp. 36-8.
132. Warr, Michael, "Evolution of an Idea," Telephony, June 1990 Supplement, Sonet Special Issue.
133. Warr, Michael, "It Might Take a Bus to Get Fiber Home," Telephony, pp. 40-1.
134. Warr, Michael, "Optical Fiber Amplifiers: Everybody Wants One," Telephony, March 18, 1991, pp. 51-2.
135. Warr, Michael, "Pulling Cable TV and Tel cos Together," Telephony, Jan. 15, 1990, p. 40.
51

136. Williamson, John, "Big Business Drives U. K. Local Fiber," Telephony, August 28, 1989, pp 28-32.
137. Williamson, John, "Fiber Optics: the European Mosaic," Telephony, Transmission Special, November 1990, pp. 44,6.
138. Williamson, John, "Asia Trips the Light Fantastic," Telephony, May 6, 1991, pp. 26-38.
139. Williamson, Sandra, "Fiber Technology Update at OFC '86", TelephQny, March 17, 1986, pp. 58-59; "The Last Tough Mile," Telephony, Feb. 16, 1987, p.37.
140. Wilson, Carol, "Bell Atlantic Goes on the Attack With Agressive Fiber Deployment," Telephony, March 19, 1990.
141. Wilson, Carol, "Siemens Pushes Fiber Strategy Home," Tel~phQny, April 2, 1990, p. 10.
142. Wilson, Carol, "Southwestern Bell, AT&T Take 'Fiber to the Home in First Trial," Telephony, August 31, 1987, p. 10.
143. Wilson, Carol and Warr, Michael, "1990 May Be Lucky Number for Fiber Deployment," Telephony, April 23, 1990, p. 11.
144. Wilson, Carol, "Vendors Race to Bring Fiber into the Loop," Telephony, Transmission Special, November 1990.
145. Wilson, William R., "Stretching the Loop Fiber Budget," Telephony, Jµly 8, 1991, pp. 29-38.
146. Wynter, L. E., "Fiber Optics Promises High-Tech Revolution," Wall Street Journal, September 9, 1986, p. 6.
147. Yates, Marshall, "The Promise of Fiber Optics," Public Vtilities FQrtniahtly, Vol. 126, No. 4, Aug. 16, 1990, p. 14.
148. Zorpette, Glenn, "Fractals: Not Just Another Pretty Picture," I. E. E. E. Spectrum, Volume 25, Issue 10, October 1988, pp. 29-31.
52