fet.unipu.hr · aleksandra krajnovi , jurica bosna ... edyta plebankiewicz, cracow university of...
TRANSCRIPT

REVIEW OF INNOVATION AND
COMPETITIVENESS A JOURNAL
OF ECONOMIC AND SOCIAL
RESEARCH
Government Expenditure and Economic Growth Nexus in Nigeria: Evidence from nonlinear ARDL and Causality Approaches Anthony Enisan Akinlo, Olufunmilayo Olayemi Jemiluyi
Human Capital Trajectory: Performance of Albania and Serbia in catching up the EU Countries Eglantina Hysa
Analysis of Classification Algorithms On Different Datasets S. Singaravelan, R. Arun, D. Arun Shunmugam, K. Ruba Soundar, R.Mayakrishnan, D. Murugan
Book review: Contemporary Labor Market Aleksandra Krajnović, Jurica Bosna
VOLUME
ISSUE 22018
4
VOLUME ISSUE4 2
RIC“Dr. MIJO MIRKOVIĆ”
JURA
J D
OBRILA UNIVERSITY OF PULA
FOUNDED IN 1960
FACU
LTY O
F ECONOMICS AND TOURISM
9 771849 879003

REVIEW OF INNOVATION AND
COMPETITIVENESS
A JOURNAL OF ECONOMIC
AND SOCIAL RESEARCH

REVIEW OF INNOVATION AND
COMPETITIVENESS
A JOURNAL OF ECONOMIC
AND SOCIAL RESEARCH
VOLUME
ISSUE 22018
4
RIC“Dr. MIJO MIRKOVIĆ”
JURA
J D
OBRILA UNIVERSITY OF PULA
FOUNDED IN 1960
FACU
LTY O
F ECONOMICS AND TOURISM

Editors
Marinko Škare, Juraj Dobrila University of Pula Danijela Križman Pavlović, Juraj Dobrila University of Pula
Board of Editors
Jurica Pavičić, University of Zagreb | Nikša Alfirević, University of Split | Tihomir Vranešević, University of Zagreb | Soumitra Sharma, Juraj Dobrila University of Pula | Branka Krivokapić Skoko, Charles Sturt University | Peide Liu, Shandong University | Jerzy Paslawski, Poznan University | Irene Lill, Tallinn University of Technology | Edyta Plebankiewicz, Cracow University of Technology | Edmundas Kazimieras Zavadskas, Vilnius Gediminas Technical University | Romualdas Ginevičius, Vilnius Gediminas Technical University | Maria-Gabriella Baldarelli, University of Bologna | Nawazish Mirza, S P Jain School of Global managnent | Vesna Buterin, University of Rijeka | Moshe Hagigi, Boston University
Managing Editor
Katarina Kostelić, Juraj Dobrila University of Pula
Lector
Filomena Škare
Editorial address
Juraj Dobrila University of Pula Faculty of economics and tourism “Dr. Mijo Mirković” Zagrebačka 30, 52100 Pula (Croatia) +385 (0)52 377-047, fax: +385 (0)52 377-013 e-mail: [email protected]
The Journal is published quarterly. Annual subscription: 200 HRK. Journal is published with the help of Ministry of science and education.
Design
Koncept, Pula
Grafika Režanci, Režanci
Copies
50
ISSN 1849-9015

CONTENTS
GOVERNMENT EXPENDITURE AND ECONOMIC GROWTH NEXUS IN NIGERIA: EVIDENCE FROM NONLINEAR ARDL AND CAUSALITY APPROACHES
Anthony Enisan Akinlo, Olufunmilayo Olayemi Jemiluyi 5
HUMAN CAPITAL TRAJECTORY: PERFORMANCE OF ALBANIA AND SERBIA IN CATCHING UP THE EU COUNTRIES
Eglantina Hysa 27
ANALYSIS OF CLASSIFICATION ALGORITHMS ON DIFFERENT DATASETS
S. Singaravelan, R. Arun, D. Arun Shunmugam, K. Ruba Soundar, R.Mayakrishnan, D. Murugan 41
BOOK REVIEW: CONTEMPORARY LABOR MARKETAleksandra Krajnović, Jurica Bosna 55


5
(5 - 26)RIC Anthony Enisan Akinlo, Olufunmilayo Olayemi Jemiluyi GOVERNMENT ExPENDITURE AND ECONOMIC GROWTH NExUS IN NIGERIA...
GOVERNMENT EXPENDITURE AND ECONOMIC GROWTH NEXUS IN NIGERIA:
EVIDENCE FROM NONLINEAR ARDL AND CAUSALITY APPROACHES
Anthony Enisan Akinlo, Olufunmilayo Olayemi Jemiluyi
(1) Department of Economics, Obafemi Awolowo University, Ile-Ife (2) Department of Economics, Obafemi Awolowo University, Ile-Ife
Anthony Enisan Akinlo Department of Economics, Obafemi Awolowo University, Ile-Ife, Nigeria
Article info Paper category: Original Scientific Paper
Received: 29.9.2017. Accepted: 8.6.2018.
JEL classification: O40, O55, R15
Keywords Government expenditure; Economic growth; NARDL cointegration; Nigeria
5

6
REVIEW OF INNOVATION AND COMPETITIVENESS VOLUME 4 | ISSUE 2 | 2018
ABSTRACTThe kernel of the debate on the relation between government spending and economic
growth is whether the former causes the latter or the latter causes the former. In addition, there is the issue of possibility of nonlinearity in the relation between government expendi-ture and economic growth.
Purpose. The purpose of this paper is to examine the relations between government expenditure and economic growth in Nigeria.
Design/Methodology/Approach. The nonlinearity and causality in the rela-tion between government expenditure and economic growth are examined using nonlinear autoregressive distributed lag model (NARDL), vector error correction model (VECM) and causality.
Findings/Implications. The findings show the existence of cointegration and nonlinear effect on the relation between government expenditure and economic growth in both long- and short-run. The results equally show unidirectional causality that runs from economic growth to government expenditure thus providing support for Wagner’s law in Ni-geria.
Originality. The findings from this study suggest that nonlinearity and asymmetry should be taken into account when examining the nexus between government expenditure and economic growth.

7
(5 - 26)RIC Anthony Enisan Akinlo, Olufunmilayo Olayemi Jemiluyi GOVERNMENT ExPENDITURE AND ECONOMIC GROWTH NExUS IN NIGERIA...
1. INTRODUCTION
Over the last three decades, the empirical study of the government expendi-ture-economic growth relation has attracted a great deal of attention in the literature both in the developed and developing economies. The kernel of the debate has been whether the causality between the two variables runs from national income (meas-ured as gross domestic product) to government expenditure or whether the causality runs from government expenditure to national income. The former perspective is associated with the Wagner’s law, which is otherwise known as the law of increasing government expenditure. The latter view is associated with the Keynesian theory.
Wagner theory argues that the share of government expenditure tends to in-crease more than proportionally with economic activity because the goods and ser-vices provided by the public sector generally have income elasticities greater than one. Consequently, according to Wagner’s law, the causality runs from national in-come to government expenditure, not in the opposite direction. According to the Keynesian view, an increase in government expenditure leads to an increase in eco-nomic growth through an expansionary fiscal policy. It is argued in the literature that as government spending increases, production also increases and thus aggregate de-mand, which ultimately leads to an increase in economic activity (GDP)1.
Without doubt, many studies have been conducted on the nexus between gov-ernment expenditure and national income (measured as GDP); large numbers of the existing studies are focused on developed and industrialized economies. Not many studies have been conducted in Sub-Saharan African countries. Asides, many of the existing studies on the subject matter are fraught with one problem or the others. Firstly, many of the existing studies adopted bivariate analysis. Bivariate model has been found to produce biased results because of problem of omitted variables. As a matter of fact, introduction of other variables into a bivariate could affect not only the direction of causality but also the magnitude of the coefficients of the results. Sec-ondly, some of the previous studies used cross-sectional data and thus not satisfac-torily addressing the country-specific issues.
Thirdly and more importantly, all known studies have assumed linear relation-ship between government expenditure and national income when in actual fact, the relationship may be non linear. Indeed, the inconclusiveness and ambiguity of the various studies testing the government expenditure-economic growth nexus may have stemmed from the possibility of nonlinearity in the relationship. The possibil-ity of nonlinear relationship between government expenditure and economic growth is very high. This is based on the fact that economic structure always undergoes struc-tural and behavioral changes. Consequently, the dynamics of government expendi-
1 Empirical support for the Wagner’s law can be found in the works of (Olomola, 2004; Aregbeyen, 2006; Lamartina and Zaghini, 2011; Mahdavi, 2009; Akinlo, 2013; Bayrak and Esen; 2014).However, the works of Huang, 2006; Dogan and Tang, 2006; Alimi, 2013; Ebaidalla, 2013; and Okoro, 2013 have provided evidence in support of the Keynesian hypothesis.

8
REVIEW OF INNOVATION AND COMPETITIVENESS VOLUME 4 | ISSUE 2 | 2018
ture in response to changes in economic growth could be diverse and vary in magni-tude across phases of the economic cycle. As an illustration, the Wagner law suggests that the elasticity of government expenditure with respect to economic growth will be the same and greater than unity over the boom-bust cycle. Indeed, empirical evi-dence has shown that relative share of government expenditure in GDP rises in the boom and rather than declining in response to falling GDP in subsequent bust, it often remains high (Hercowitz and Stawczynski, 2004; Ageli, 2013). This argument follows from Ratchet hypothesis (Bird, 1972) that government expenditure ratchet up in the boom and declines little or not at all during the bust. Given this fact, there is the need to investigate government expenditure-growth nexus accounting for pos-sible asymmetric fluctuations of expenditure over economic growth and vice-versa.
This study, therefore, is an attempt to correct the weaknesses of the existing studies by using nonlinear ARDL cointegration methodology (NARDL) proposed by Shin, Yu and Greenwood-Nimmo (2011) for Nigeria2. In order to take care of prob-lem of omitted variable bias, the study incorporates two variables namely inflation and trade openness, thus creating a multivariate model. Essentially, a better under-standing of the dynamic relation between government expenditure and GDP will aid the comprehension of policy-relevant issues over a short-to medium term horizon. Moreover, estimates from the analysis, in particular, the speed at which government expenditure adjust to the long-term relation with GDP after a shock in economic ac-tivity will assist in formulating budgetary adjustment plans that can help in achieving medium term budgetary objective or correct excess deficits in the economy.
Nigeria is an ideal country for examining the relationship between government expenditure and economic output since government in the country plays a signifi-cant role in the economy. The government is not just the largest employer of labour, it plays a vital role in the distribution and allocation of the available resources. In ad-dition, a casual examination of the growth rate of government expenditure and out-put show that the two variables gyrate together over the years possibly reflecting the developments in the oil sector necessitating the need to know which one causes the other. Hence, the objectives of this paper are to examine the nonlinear relationship between government spending and national income measured as gross domestic product (GDP) and determine the direction of causality between the two variables.
The rest of the article is organized as follows: Section 2 discusses the trends in government expenditure and economic growth over the period 1960-2012. Section 3 describes the empirical approach and data. Section 4 presents the empirical results. Section 5 looks at the direction of causality between government expenditure and na-tional income. The last section provides the conclusions.
2 Moreover, this methodology allows for asymmetry in both the long-and short run dynamics of the relationship examined.

9
(5 - 26)RIC Anthony Enisan Akinlo, Olufunmilayo Olayemi Jemiluyi GOVERNMENT ExPENDITURE AND ECONOMIC GROWTH NExUS IN NIGERIA...
2. TRENDS IN GOVERNMENT EXPENDITURE AND ECONOMIC GROWTH IN NIGERIA
Government expenditure increased sharply in Nigeria between the period 1961 and 2016. It increased from N163.9 billion in 1961 to N903.9 billion in 1970. The figure increased from N1463.6 million in 1971 to N60.286 billion in 1990. Govern-ment expenditure increased phenomenally to N941.69 billion in 1999 but decreased to N701.06 billion in 2000. The figure increased consistently to N5160.74 billion in 2016. Generally in terms of the magnitude, government expenditure increased phe-nomenally between 1961- 2016. This could be attributed to huge revenue from oil since early 70s.
In the same government expenditure as a percentage of GDP was single digit and ranged between 6% and 9% over the period 1961 to 1967. The percentage be-came double digit from 1968. Specifically, in 1968 the percentage was 13%. The ex-penditure level increased consistently to 20% in 1972 though the level dropped from 17% in 1970 to 15% in 1971. The total government expenditure, as a percentage of GDP decreased slightly to 18% and 15% in 1973 and 1974 respectively; it however, increased to 30% in 1980 though there was slight drop to 18% in 1979. The large in-crease in government expenditure between 1968 and 1975 could be attributed partly to the civil war in Nigeria between 1969 and 1970 and partly to rehabilitation and re-construction work that followed in the early 1970s. Government invested massively in infrastructure in the war torn areas.
Between 1981 and 2001, government expenditure as a percentage of GDP oscil-lated between 13% and 34%. For example, the expenditure GDP was 34% in 1993. This was the highest level recorded for the entire period 1960-2016. The expenditure level was consistently 10% and 14% between 2002 and 2009. However, from 2010 to 2016, the expenditure GDP ratio maintained a steady value of 5% to 7%. Figure 1. shows the trends of government expenditure and economic growth in Nigeria over the period 1961-2016.
10
REVIEW OF INNOVATION AND COMPETITIVENESS VOLUME 4 | ISSUE 2 | 2018
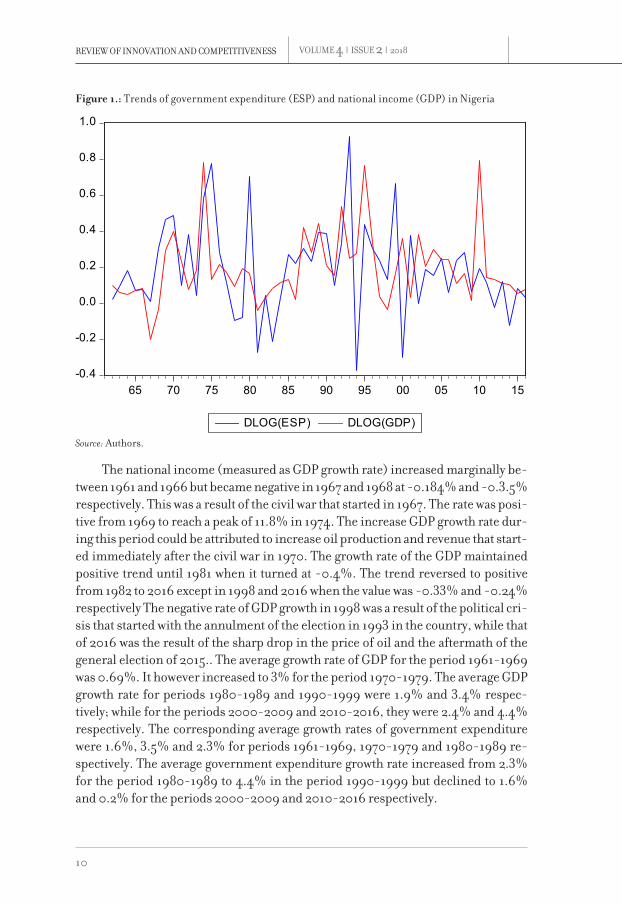
Figure 1.: Trends of government expenditure (ESP) and national income (GDP) in Nigeria
-0.4
-0.2
0.0
0.2
0.4
0.6
0.8
1.0
65 70 75 80 85 90 95 00 05 10 15
DLOG(ESP) DLOG(GDP)
Source: Authors.
The national income (measured as GDP growth rate) increased marginally be-tween 1961 and 1966 but became negative in 1967 and 1968 at -0.184% and -0.3.5% respectively. This was a result of the civil war that started in 1967. The rate was posi-tive from 1969 to reach a peak of 11.8% in 1974. The increase GDP growth rate dur-ing this period could be attributed to increase oil production and revenue that start-ed immediately after the civil war in 1970. The growth rate of the GDP maintained positive trend until 1981 when it turned at -0.4%. The trend reversed to positive from 1982 to 2016 except in 1998 and 2016 when the value was -0.33% and -0.24% respectively The negative rate of GDP growth in 1998 was a result of the political cri-sis that started with the annulment of the election in 1993 in the country, while that of 2016 was the result of the sharp drop in the price of oil and the aftermath of the general election of 2015.. The average growth rate of GDP for the period 1961-1969 was 0.69%. It however increased to 3% for the period 1970-1979. The average GDP growth rate for periods 1980-1989 and 1990-1999 were 1.9% and 3.4% respec-tively; while for the periods 2000-2009 and 2010-2016, they were 2.4% and 4.4% respectively. The corresponding average growth rates of government expenditure were 1.6%, 3.5% and 2.3% for periods 1961-1969, 1970-1979 and 1980-1989 re-spectively. The average government expenditure growth rate increased from 2.3% for the period 1980-1989 to 4.4% in the period 1990-1999 but declined to 1.6% and 0.2% for the periods 2000-2009 and 2010-2016 respectively.
11
(5 - 26)RIC Anthony Enisan Akinlo, Olufunmilayo Olayemi Jemiluyi GOVERNMENT ExPENDITURE AND ECONOMIC GROWTH NExUS IN NIGERIA...
In general, the main observation from Figure 1. is the close relationship be-tween the trends of government expenditure and national income measured as GDP over the period 1961-2016. The close movement of the two variables makes rather difficult to know which one leads the other by mere causal observation. It is therefore imperative to conduct a more rigorous analysis of the nexus between government ex-penditure and national income in Nigeria while taking into account possible nonlin-earity in their relationship in Nigeria.
3. METHODS
In the literature, the government expenditure-growth relations are usually examined by means of the standard time series techniques of cointegration, error-correction modeling and Granger causality. Although, these techniques are robust in assessing both the long run and short run relations, the implicit assumption in them is that the effects of changes in government expenditure on economic growth are symmetric. Accordingly, they are not adequate to capture potential asym-metries in the relations between government expenditure and economic growth. However recently, Shin et al (2011) developed a nonlinear ARDL cointegration methodology as an asymmetric extension to the well-known ARDL cointegration model of Pesaran and Shin (1999) and Pesaran, et al. (2001). The nonlinear ARDL is designed to capture both long run and short run asymmetries in a variable of interest.
To begin, we specify the following asymmetric long run equation of government expenditure in line with Peacock-Wiseman tradition3:
(1)
where ges is government expenditure, inf is the inflation rate and open is the degree of openness and gdp is the economic growth rate. α, β’s, μ and χ constitute vectors of long run parameters to be estimated. We have introduced two control variables in the equation (1) namely; inflation and trade openness based on the that other variables could have major impact on government expenditure. The omission of these variables could bias the direction of causality between government spend-ing and national income4.
3 The Peacock-Wiseman version of the government-national income nexus specifies government expenditure as a function of national income. Other variants of this specification include Musgrave version, Goffman version and Gupta version.
4 The choice of inflation and trade openness as control variables is based on the argument in the literature that changes in trade exert a dominant influence on changes on nominal GDP and that one of the primary causes of fluctuations in national income. In the same vein, it is contended that inflation could drive up goverment spending leading to expansionary monetary policy, which affect interest rate and economic activity.

12
REVIEW OF INNOVATION AND COMPETITIVENESS VOLUME 4 | ISSUE 2 | 2018
In equation (1), β+ and β- are partial sums of positive and negative changes in gdp: such that
.
Essentially, the long run relation as represented by equation (1) reflects asym-metric long run economic growth pass-through to government expenditure. As shown in Shin, et al. (2011), equation (1) can be framed in an ARDL setting along the line of Pesaran and Shin (1999) and Pesaran et al. (2001) as5:
(2)
where Δ denote the first difference and ρ-1, q-1, r-1 and m-1 are the lag lengths. Equation (2) is the usual model often used in past empirical studies to estimate
the long run relationship between government expenditure and economic growth based on the assumption of linearity; except that this study has introduced the pos-sibility of nonlinearity in modeling the relationship. Since all parameters contained in equation (2) are linear, the model can easily be estimated using standard ordinary least square (OLS) method.
The unrestricted specification of NARDL error correction model in equation (2) declares two different types of asymmetry; short and long-run asymmetries, which reflects two restrictions that can be tested by means of the standard Wald tests (Shin, et al., 2011):
(i) Long-run nonlinearity model where the null hypothesis of a linear long-run relationship can be tested through δ+ = δ-
(ii) Short-run nonlinearity model in which the null hypothesis of additive lin-earity can be tested through
Based on the estimated NARDL, a test for the presence of cointegration among the variables using a bounds testing approach of Pesaran, et al. (2001) and Shin, et al. (2011) can be performed. This involves the Wald F test of the null hypothesis, ρ = δ1+ = δ2
- = δ3 = δ4 = 0. In the final step, given that variables are cointegrated, then examination of long and short run asymmetries in relations between national in-come and government expenditure is made and inferences are drawn. In this step,
5 For a more extensive derivation of the model see Shin, et al. (2011)
13
(5 - 26)RIC Anthony Enisan Akinlo, Olufunmilayo Olayemi Jemiluyi GOVERNMENT ExPENDITURE AND ECONOMIC GROWTH NExUS IN NIGERIA...
we equally derive the asymmetric cumulative dynamic multiplier effects of a one per cent change in gdp+
t-1 and gdp-t-1 respectively as:
(3)
To further assess the relationship between government expenditure and na-tional income, we carry out granger causality test based on error correction model and obtained the the impulse response functions and the variance decompositions. The Granger causality based on error correction model helps not only to know the di-rection of causation but also to identify the variables that are exogenous and endoge-nous. Asides, the lagged ECM will inform us how it takes to revert back to equilibrium when there is shock to the variable. The VDC and IRFs will provide information on the relative degree of endogeneity and exogeneity of the variables.
3.1. Data
The time-series data adopted for the study are annual and cover the peri-od1960-2016. The data series are sourced from World Bank, World Development Indicator (WDI) CD-Rom (2016) and Central Bank of Nigeria, Statistical Bulletin (2017) edition. Specifically, national income (measured as gross domestic product) (gdp), inflation (inf) measured as consumer price index (1970=100) and openness (open) measured as sum of export and import as share of GDP were sourced from World Development Indicator. Government expenditure (GES) series was obtained from Central Bank of Nigeria; Statistical Bulletin. Gross domestic product and gov-ernment spending are measured in million of domestic currency Naira.
4. EMPIRICAL RESULTS
4.1. Empirical results and discussion
Given the requirement of the bound testing procedure that no I(2) variables are involved, we test for stationarity of the variables using ADF and PP unit roots. The results of these tests are given in Table 1. In the tests, we include both constant and trend terms and employ the AIC and SIC for the optimal lag order. The results in table 1 show that three variables namely; government expenditure, gross domestic product and trade openness are non-stationary in levels but stationary at first dif-ferencing using the ADF test. However, inflation is stationary at level. The same re-sults was obtained using Phillips-Perron test except for inflation variable which was stationary at level.

14
REVIEW OF INNOVATION AND COMPETITIVENESS VOLUME 4 | ISSUE 2 | 2018
Table 1.: Results of Unit Root Test
Variables Augmented Dickey-Fuller Test Philips-Perron Test
Level 1st Difference Remark Level 1st
Difference Remark
lnGDP 0.456 -4.711*** I(1) 0.644 -6.316*** I(1)lnGES -1.246 -4.743*** I(1) -1.058 -8.304*** I(1)lnOpen -1.377 -4.081*** I(1) -1.492 -8.998*** I(1)lnInf 2.893* -8.244*** I(0) -4.112* -12.730*** I(0)
Note: ***, ** and * denote significance level for 1%, 5% and 10% respectively. Source: Authors.
In addition, we apply the Zivot-Andrews (1992) unit root test that allows for one endogenous structural break in the series. The results presented in Table 2, suggest that the variables examined except inflation turn to break stationary process in the first differences.
Table 2.: Unit Root with structural Break
Variables level Break Date First Difference Break Date Status
Ln GDP -1.997 1986 -7.013 1974 L(1)lnGES -2.2860 1985 -9.390 1993 l(1)lnOpen -2.180 1972 -10.096 2009 l(1)lnInf -5.202*** 1994 - - l(0)
Note: *** denote significance at 1%. The breaks coincide with major economic and political events in Nigeria. The year 1972 was when the country changed from Pound to Naira and introduced the metric system. In 1974, the Military reneged on the planned to handover power in 1976. In 1985, there was a military coup in the country. 1986 was when structural adjustment programme was implemented. 1993-1994 witnessed political upheavals arising from the cancellation of the general election by General Babangida. In 2009, there was constitutional crisis following the sickness of President Yar Adua and the disruption of oil production by Niger delta militants.Source: Authors.
Given the fact that none of the variables is I(2), we then proceed to the bounds testing procedure.
Accordingly, we estimate equation (2) and apply the general-to-specific proce-dure to arrive at the model final specification. The maximum lag order considered is 3. Table 3. provides the results of the bounds F- statistics while Table 4. presents the model estimation results. The results of the bounds test shows that the four variables government expenditure, economic growth, openness and inflation rate, co-move in the long run. The statistic 9.941 exceeds the critical upper bound at both 5% and 1% level of significance.

15
(5 - 26)RIC Anthony Enisan Akinlo, Olufunmilayo Olayemi Jemiluyi GOVERNMENT ExPENDITURE AND ECONOMIC GROWTH NExUS IN NIGERIA...
Table 3.: Bounds Test for Non-linear Cointegration
Critical values
F-Statistic (prob) 5% 1% Remark
Lower Bound Upper Bound Lower Bound Upper Bound9.941(0.001) 2.86 4.01 3.74 5.06 Cointegration
Source: Authors.
Table 4.: NARDL Estimation results
Variable Coefficient T-Statistic p-Value
Dependent variable: ΔlnGESConstant 5.353*** 6.912 0.000lnGest-1 -0.865*** 6.519 0.000LnGdp+t-1 0.697*** 6.520 0.000lnGdp-t-1 -3.317*** -4.769 0.000lnOpet-1 0.605*** 5.320 0.000Lnlnft-1 0.081** 2.130 0.039ΔlnGdp+t 0.319** 2.192 0.034ΔlnGdp-t 0.519 0.519 0.607ΔlnGdp-t-1 1.769* 1.691 0.098ΔlnOpent 0.295** 2.403 0.021ΔlnInft 0.041 1.208 0.234Long-run (LR) asymmetric coefficients Long- and short-run symmetry testsLR+lnGdp = 0.81*** WLR,lnGdp = 23.09***(0.000)LR-lnGdp = -3.83*** WSR,lnGdp =14.75***(0.000)Statistics and Diagnostics testsχ2SC = 0.47 (0.63) χ2HET = 0.24 (0.99)χ2NORM = 37.01 (0.000) χ2FF = 0.20 (0.65)
Note: ***, ** and * denote significance level for 1%, 5% and 10% respectively. WLR, WSR: Wald test for the null of long- and short-run symmetry respectively. χ2SC, χ2NORM, χ2HET and χ2FF refer to LM test for serial correlation, normality, functional form and heteroscedasticity, respectively.Source: Authors.
The lower part of Table 4. presents some diagnostic tests of the estimated model. The tests for serial correlation LM (χ2
SC) and ARCH χ2(HET)test for heteroscedasticity
indicate that the model estimated is well specified. In addition, graphs of the CUSUM and CUSUMSQ statistics to test for structural stability of the model as shown in Figures 2. and 3. respectively show parameter stability. In both cases, the statistics lie within the critical bounds implying that all the coefficients in the estimated model are stable.
The presence of asymmetric impact in the long and short run is examined by the Wald test. This checks the null hypothesis of symmetry against the alternative of

16
REVIEW OF INNOVATION AND COMPETITIVENESS VOLUME 4 | ISSUE 2 | 2018
asymmetry. The results as presented at the bottom of Table 4. show the significance of asymmetry in the long- and short-run for government expenditure and national income. This implies that taking nonlinearity and asymmetry into account is impor-tant when analyzing the relationship between government expenditure and national income.
Figure 2.: The Cumulative Sum Graph based on the Nonlinear Autoregressive Distributed Lag (NARDL) Model Estimation
-20
-15
-10
-5
0
5
10
15
20
1975 1980 1985 1990 1995 2000 2005 2010 2015
CUSUM 5% SignificanceSource: Authors.
Figure 3.: The Cumulative Sum of Squares Graph based on the Nonlinear Autoregressive Distributed Lag Model (NARDL) Estimation
-0.4
-0.2
0.0
0.2
0.4
0.6
0.8
1.0
1.2
1.4
1975 1980 1985 1990 1995 2000 2005 2010 2015
CUSUM of Squares 5% SignificanceSource: Authors.

17
(5 - 26)RIC Anthony Enisan Akinlo, Olufunmilayo Olayemi Jemiluyi GOVERNMENT ExPENDITURE AND ECONOMIC GROWTH NExUS IN NIGERIA...
The result as presented in Table 4. shows asymmetric long run relation between government expenditure and national income. The increase in national income (measured and GDP) is positive and significantly related to government expendi-ture while the reduction in national income is negative and significantly related to government expenditure. Specifically, the result shows that a 1% increase in gross domestic product is related to the increase in the expected government expenditure by 0.8%. This finding implies that in the period of economic boom, government spends more. The result shows that economic growth is a major factor influencing government expenditure in Nigeria. This finding is in conformity with most empiri-cal evidence in the literature (Bayrak and Esen, 2014; Akinlo, 2013; Olomola, 2004). In contrast, the effect of the negative component of GDP (economic downturn) on government expenditure is negatively significant and larger in magnitude, with a 1% decrease in government expenditure resulting in about 3.83% decrease in govern-ment expenditure.
Simply put, in the long run, negative growth (economic downturn) has a con-siderably larger impact on government expenditure compared to positive growth (economic upturn). This finding suggests that government expenditure responses to variations in economic growth need not be the same during the booms (economic upturn) as during recessions (economic downturn) and should rather depend on the intensity/magnitude of the economic fluctuations. This is the main tenet of Bird (1971) Ratchet hypothesis, which posits an asymmetry in government expenditure share to GDP over the business cycle.
The long run coefficient of inflation is positive and significant at 1% signifi-cance level in line with a priori expectation. The results suggest that that 1% increase in domestic price level is related to the increase in expected government expenditure by roughly 0.1%. In the same way, the coefficient of trade openness is positive and significant, in line with the literature (Rodrik, 1978). The results show that 1% in-crease in trade openness leads to 0.67% rise in government expenditure. This sup-ports the findings of Aregbeyen (2014) and Adams and Sakyi (2012) for Nigeria and Sub-Saharan Africa respectively.
To investigate the pattern of dynamic asymmetric adjustment of government expenditure from its initial equilibrium to the new steady state in the long run shock, we use the dynamic multiplier propose by Shin et al (2014). Figure 4. shows the dy-namic effects of positive and negative changes in national income where government expenditure responds more rapidly to a decrease in national income as compared to an increase. The positive (undotted line) and negative (dotted line) curves show the asymmetric adjustment to positive and negative shocks at a given forecast respec-tively.

18
REVIEW OF INNOVATION AND COMPETITIVENESS VOLUME 4 | ISSUE 2 | 2018
Figure 4.: Dynamic Multipliers effects
-4
-2
0
2
4
6
8
LGDP +1%LGDP -1%Difference
Source: Authors.
5. GRANGER CAUSALITY RESULTS BASED ON VECM
To assess the direction of causality, the paper conducts the Granger causality test based on error correction model. The error correction helps to confirm the long run relationship and assist to identify which variable is exogenous (strong) and which endogenous (weak) and the ECM(-1) is the speed of adjustment that informs us on how long it takes to revert back to long-term equilibrium if that variable of adjust-ment is perturbed. Table 5 presents the results of the error correction model while Table 6. shows the results of the causal channels. As evidenced from the t-statistic of the ECM, only inflation variable is significant and thus endogenous. Other vari-ables are found to be exogenous (not statistically significant in the ECM results). This shows that a shock to inflation will have strong effect on government expenditure, national income and trade openness. This means that monetary policy must focus on inflation stability as it seems to have profound effect on government expenditure and on the growth of the economy. In terms of the direction of causation, the results in Table 6. shows the national income granger cause government expenditure and not otherwise. Also, the results show unidirectional causality from national income to openness and inflation.

19
(5 - 26)RIC Anthony Enisan Akinlo, Olufunmilayo Olayemi Jemiluyi GOVERNMENT ExPENDITURE AND ECONOMIC GROWTH NExUS IN NIGERIA...
Table 5.: Error Correction Model
Coefficient Standard Error T-Statistic Significant Result
ΔGES 0.0296 0.0594 0.4986 Not significant Exogenous
ΔGDP -0.0098 0.0507 -0.1875 Not significant Exogenous
ΔOPEN 0.0668 0.0537 1.2439 Not significant Exogenous
ΔINF 0.9248*** 0.2153 4.2959 Significant Endogenous
Note: *** denote significance at 1%Source: Authors.
Table 6.: Granger-Causality Results based on VECM
Independent Variables
Dependent Variables χ2 of lagged first differenced term [ρ -value]
ΔGES ΔGDP ΔOPEN ΔINF
ΔGES --- 7.203*** (0.007)
2.719 (0.100)
1.384 (0.239)
ΔGDP 0.007 (0.935) --- 0.027
0.870)0.752
(0.386)
ΔOPEN 0.045 (0.833)
4.223** (0.039) --- 1.987
(0.159)
ΔINF 0.801 (0.371)
3.011* (0.084)
0.808 (0.369) ---
Note: ***, ** and * denote significance level for 1%, 5% and 10% respectively. The figure in parenthesis represents the p-valueSource: Authors.
While error correction model can show the absolute endogeneity or exogeneity of a variable; it cannot give us the relative degree of endogeneity and exogeneity of a variable. To achieve the latter; we generate the variance decompositions of the vari-ables. The results from Generalized VDCs are as shown in Table 7. The variable that is ranked higher is the leading variable, and therefore should be set as the immediate target by the policymakers. The results in Table 7. for the 10 -years horizon, GDP is the most exogenous. All through the 10-years horizon, own shock accounts for over 90 per cent. Inflation is shown to be the most endogenous as own shock peters out rapidly to reach 57.11 per cent in the 10th period.

20
REVIEW OF INNOVATION AND COMPETITIVENESS VOLUME 4 | ISSUE 2 | 2018
Table 7.: Variance Decompositions (VDCs)
LGES Period LGES LGDP LOPEN LINF
1 100.0000 0.000000 0.000000 0.0000002 88.78236 8.781412 2.185496 0.2507273 87.66912 10.55327 1.579756 0.1978534 87.29101 10.74878 1.686946 0.2732635 87.20065 10.75229 1.666701 0.3803586 87.17504 10.62877 1.692683 0.5035097 87.17960 10.49858 1.713447 0.6083698 87.18783 10.37939 1.732784 0.6999909 87.19920 10.27526 1.749547 0.77599110 87.20945 10.18717 1.763664 0.839718LGDP Period LGES LGDP LOPEN LINF
1 6.817214 93.18279 0.000000 0.0000002 6.560591 92.55405 0.039266 0.8460943 6.611315 92.64394 0.079775 0.6649684 6.767703 92.54836 0.078700 0.6052365 6.870957 92.50946 0.079922 0.5396646 6.965927 92.46096 0.078859 0.4942547 7.038196 92.42587 0.077828 0.4581028 7.097387 92.39567 0.076835 0.4301049 7.144948 92.37146 0.075952 0.40764010 7.184048 92.35132 0.075199 0.389429LOPEN Period LGES LGDP LOPEN LINF
1 2.694232 0.635394 96.67037 0.0000002 4.933824 6.558275 88.48872 0.0191843 6.479144 6.837161 85.70650 0.9771924 7.509922 6.632767 84.19326 1.6640495 8.244072 6.352319 82.98679 2.4168246 8.781702 6.055533 82.15457 3.0081967 9.184229 5.812929 81.50198 3.5008628 9.496007 5.609191 80.99858 3.8962239 9.741824 5.442849 80.59666 4.21866410 9.940240 5.305284 80.27149 4.482983LINF Period LGES LGDP LOPEN LINF
1 0.062498 0.372268 0.607918 98.957322 1.307356 0.799702 4.114096 93.778853 3.882307 2.891128 3.837434 89.389134 6.937994 4.228931 3.888506 84.944575 10.29684 6.743406 3.682401 79.277356 13.43608 9.047442 3.476965 74.039517 16.31824 11.33861 3.265084 69.078078 18.88354 13.41301 3.068051 64.635419 21.16198 15.29133 2.888350 60.6583410 23.18268 16.97148 2.726509 57.11933
Source: Authors.

21
(5 - 26)RIC Anthony Enisan Akinlo, Olufunmilayo Olayemi Jemiluyi GOVERNMENT ExPENDITURE AND ECONOMIC GROWTH NExUS IN NIGERIA...
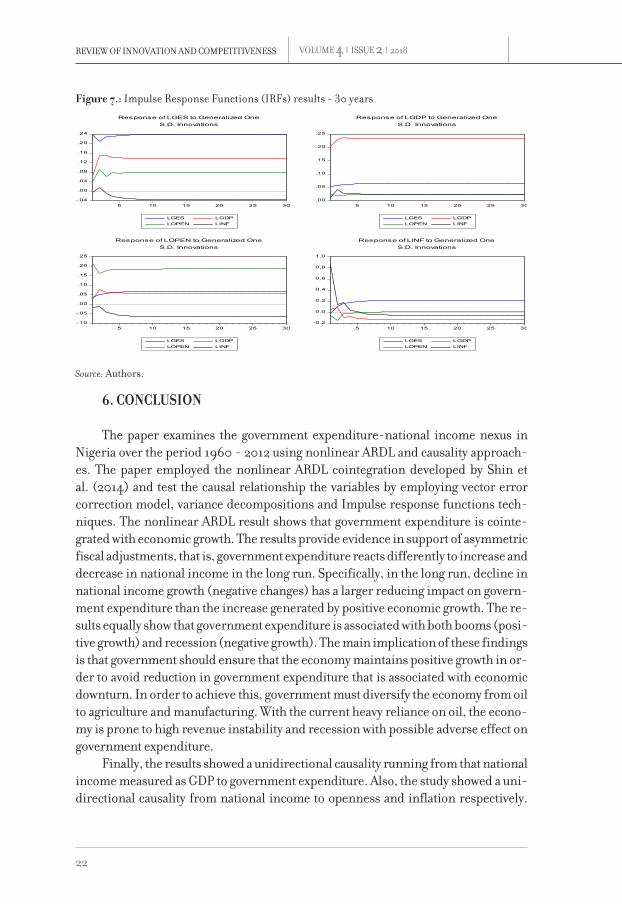
We proceed further to find the impact of shock of one variable on others and validate the degree of response and how long it would take to normalize using the Impulse Response functions (IRFs). Figure 5., 6. and 7. are the graph for the period 10, 20 and 30 years. As revealed in Figures 5., 6. and 7., a perturbation to the inflation variables generate a fast response from the three other exogenous variables.
Figure 5.: Impulse Response Functions (IRFs) results - 10 years
-.04
.00
.04
.08
.12
.16
.20
.24
1 2 3 4 5 6 7 8 9 10
LGES LGDPLOPEN LINF
Response of LGES to Generalized OneS.D. Innovations
.00
.05
.10
.15
.20
.25
1 2 3 4 5 6 7 8 9 10
LGES LGDPLOPEN LINF
Response of LGDP to Generalized OneS.D. Innovations
-.10
-.05
.00
.05
.10
.15
.20
.25
1 2 3 4 5 6 7 8 9 10
LGES LGDPLOPEN LINF
Response of LOPEN to Generalized OneS.D. Innovations
-0.2
0.0
0.2
0.4
0.6
0.8
1.0
1 2 3 4 5 6 7 8 9 10
LGES LGDPLOPEN LINF
Response of LINF to Generalized OneS.D. Innovations
Source: Authors.
Figure 6. : Impulse Response Functions (IRFs) results - 20 years
-.04
.00
.04
.08
.12
.16
.20
.24
2 4 6 8 10 12 14 16 18 20
LGES LGDPLOPEN LINF
Response of LGES to Generalized OneS.D. Innovations
.00
.05
.10
.15
.20
.25
2 4 6 8 10 12 14 16 18 20
LGES LGDPLOPEN LINF
Response of LGDP to Generalized OneS.D. Innovations
-.10
-.05
.00
.05
.10
.15
.20
.25
2 4 6 8 10 12 14 16 18 20
LGES LGDPLOPEN LINF
Response of LOPEN to Generalized OneS.D. Innovations
-0.2
0.0
0.2
0.4
0.6
0.8
1.0
2 4 6 8 10 12 14 16 18 20
LGES LGDPLOPEN LINF
Response of LINF to Generalized OneS.D. Innovations
Source: Authors.
22
REVIEW OF INNOVATION AND COMPETITIVENESS VOLUME 4 | ISSUE 2 | 2018
Figure 7.: Impulse Response Functions (IRFs) results - 30 years
-.04
.00
.04
.08
.12
.16
.20
.24
5 10 15 20 25 30
LGES LGDPLOPEN LINF
Response of LGES to Generalized OneS.D. Innovations
.00
.05
.10
.15
.20
.25
5 10 15 20 25 30
LGES LGDPLOPEN LINF
Response of LGDP to Generalized OneS.D. Innovations
-.10
-.05
.00
.05
.10
.15
.20
.25
5 10 15 20 25 30
LGES LGDPLOPEN LINF
Response of LOPEN to Generalized OneS.D. Innovations
-0.2
0.0
0.2
0.4
0.6
0.8
1.0
5 10 15 20 25 30
LGES LGDPLOPEN LINF
Response of LINF to Generalized OneS.D. Innovations
Source: Authors.
6. CONCLUSION
The paper examines the government expenditure-national income nexus in Nigeria over the period 1960 - 2012 using nonlinear ARDL and causality approach-es. The paper employed the nonlinear ARDL cointegration developed by Shin et al. (2014) and test the causal relationship the variables by employing vector error correction model, variance decompositions and Impulse response functions tech-niques. The nonlinear ARDL result shows that government expenditure is cointe-grated with economic growth. The results provide evidence in support of asymmetric fiscal adjustments, that is, government expenditure reacts differently to increase and decrease in national income in the long run. Specifically, in the long run, decline in national income growth (negative changes) has a larger reducing impact on govern-ment expenditure than the increase generated by positive economic growth. The re-sults equally show that government expenditure is associated with both booms (posi-tive growth) and recession (negative growth). The main implication of these findings is that government should ensure that the economy maintains positive growth in or-der to avoid reduction in government expenditure that is associated with economic downturn. In order to achieve this, government must diversify the economy from oil to agriculture and manufacturing. With the current heavy reliance on oil, the econo-my is prone to high revenue instability and recession with possible adverse effect on government expenditure.
Finally, the results showed a unidirectional causality running from that national income measured as GDP to government expenditure. Also, the study showed a uni-directional causality from national income to openness and inflation respectively.

23
(5 - 26)RIC Anthony Enisan Akinlo, Olufunmilayo Olayemi Jemiluyi GOVERNMENT ExPENDITURE AND ECONOMIC GROWTH NExUS IN NIGERIA...
The implication of the causality result is that policymakers should impact national income (GDP) to influence government expenditure. It also suggests that increase in government spending might not necessarily means inefficiency on the part of government as some economists have argued. In addition, effort at rolling back the government through rationalization of government spending might not necessarily have adverse effects on national income.

24
REVIEW OF INNOVATION AND COMPETITIVENESS VOLUME 4 | ISSUE 2 | 2018
REFERENCES
Adams, A., Sakyi, D., 2012. Globalisation, democracy and government spending in Sub-Saharan Africa: Evidence from panel data. In: Delic, Z., (Ed.), Globalisation and Responsibility, InTech, Croatia, (2012):137-152
Ageli, M., Wagner’s law of in Saudi Arabia 1970-2012: an econometric analysis. Asian Economic and Financial Review 3(5), (2013): 647-659
Akinlo, A. E., Government spending and economic growth nexus for Nigeria. Global Journal of Business Research 7(1), (2013): 33-41
Alimi, S., Testing augmented Wagner’s law for Nigeria based on cointegration and error-correction modeling techniques. MPRA Paper No. 52319, 2013.
Aregbeyen, O., Cointegration, causality and Wagner’s law: a test for Nigeria, 1970-2003. Economic and Financial Review 44(2), (2006): 1-17
Bayrak, M., Esen, O., Examining the validity of Wagner’s law in the OECD economies. Research in Applied Economics 6(3), (2014): 1-16
Bird, R., Wagner’s law: a pooled time series and cross section comparison. National Tax Journal 38, (1971): 209-218
Dogan, E., Tang, T. C., Government expenditure and national income: causality tests for five South East Asian countries. International Business and Economics Research Journal 5, (2006): 49-58
Ebaidalla, M., Causality between government expenditure and national income: evidence from Sudan. Journal of Economic Cooperation and Development 34(4), (2013): 61-76
Hercowitz, Z., Stawczynski,M., Cyclical ratcheting in government spending: evidence from the OECD. Review of Economics and Statistics 86(1), (2004): 353-361
Huang, C. J., Government expenditures in China and Taiwan: do they follow Wagner’s law? Journal of Economic Development 31(2), (2006): 139-148
Lamartina, S., Zaghini, A., Increasing public expenditure: Wagner’s law in OECD countries. German Economic Review 12(2), (2011): 149-164
Mahdavi, S., A re-examination of Wagner’s law based on disaggregated U. S. state-local government expenditure. The University Texas at San Antonio, College of Business Working Paper Series WP#010ECO-90-2009, 2009.
Okoro, A., Government spending and economic growth in Nigeria (1980-2011). Singaporean Journal of Business Economics and Management Studies 2(5), (2013): 81-92
Olomola, P., Cointegration analysis-causality testing and Wagner’s law: the case of Nigeria, 1970-2001. Journal of Social and Economic Development 6(1), (2004): 76-90
Pesaran, B., Pesaran, M. H., Time series econometrics using Microfit 5.0. Oxford University Press, Oxford, 2009.
Pesaran, M. H., Shin, Y., An autoregressive distributed lag modeling approach to cointegration analysis. In Econometrics and economic theory in the 20th century: The Ragnar Frisch centennial symposium, Edited by S. Strom. Cambridge: Cambridge University Press, 1999.
Pesaran, M. H., Shin, Y., Smith, R. J., Bounds testing approaches to the analysis of level relationships. Journal of Applied Econometrics 16, (2001): 289-326

25
(5 - 26)RIC Anthony Enisan Akinlo, Olufunmilayo Olayemi Jemiluyi GOVERNMENT ExPENDITURE AND ECONOMIC GROWTH NExUS IN NIGERIA...
Rodrik, D., Why do more open economies have bigger governments? The Journal of Political Economy 106(5), (1998): 997-1032
Shin, Y., Yu, B., Greenwood-Nimmo, M., Modeling asymmetric cointegration and dynamic multiplier in a nonlinear ARDL framework, Mimeo, 2011.
Zivot, E., Andrews D. W. K., Further evidence in the Great Crash, the Oil-Price shock, and the unit root hypothesis. Journal of Business and Economic Statistics 10, (1992): 251-270


27
(27 - 40)RIC Eglantina Hysa HUMAN CAPITAL TRAJECTORY: PERFORMANCE OF ALBANIA AND SERBIA...
HUMAN CAPITAL TRAJECTORY: PERFORMANCE OF ALBANIA AND SERBIA
IN CATCHING UP THE EU COUNTRIES
Eglantina Hysa
Eglantina Hysa Epoka University, Faculty of Economic and Administrative Sciences
Article info Paper category: Preliminary paper
Received: 23.1.2018. Accepted: 8.6.2018.
JEL classification: C13, I25, O40
Keywords Human Capital; Economic Growth; Gender Disparity
27

28
REVIEW OF INNOVATION AND COMPETITIVENESS VOLUME 4 | ISSUE 2 | 2018
ABSTRACT
Purpose. This paper focuses on the measurement of the human capital level in Alba-nia, Serbia and European Countries and in identifying the gaps between them. In addition, it focuses on the link between human capital and the Gross Domestic Product (GDP), by ex-tending the analyse in finding the gender disparity of human capital and GDP relationship. Lastly, this study estimates the growth rate of the human capital level for Albania and Serbia and make a comparison with the average human capital of the European Countries.
Methodology. The methodology used in the calculation of the growth rate of human capital is exponential trend method which makes possible the estimation of the years needed for Albania and Serbia to catch up the average of EU-28. The data employed mostly in the above-mentioned analysis is the data set taken from Barro and Lee (2010) corresponding the Educational Attainment Data from 1950 to 2010. For the estimation of the growth rate of the human capital level, additional data until 2015 have been used compiled from the UIS database and UN population database, respectively.
Findings. The findings show that Albania has a higher probability of an earlier convergence than the Serbia has. Even though the proxy of human capital for year 2010 for Albania (9.85), is lower than Serbia (10.97), Albania is experiencing a rapid increase in the average years of schooling.
Limitations. But again, the study is limited to data related to only the years of schooling without considering the quality of education and skills acquired.
Originality. This study can serve as a contributor to the performance examination of Albania and Serbia to the EU community with regard to human capital accumulation.
29
(27 - 40)RIC Eglantina Hysa HUMAN CAPITAL TRAJECTORY: PERFORMANCE OF ALBANIA AND SERBIA...
1. INTRODUCTION
The current and potential candidate countries to join EU - Albania, Bosnia and Herzegovina, the former Yugoslav Republic of Macedonia, Kosovo, Montenegro and Serbia - are facing new challenges comparing to the previous EU candidates. One of the most important challenges remains the difficulty the Western Balkan (WB) countries are having in transition to democracy which is accompanied to economi-cal distortions. WB countries are very often having reforms and structural changes creating loss in welfare, which means economical distortion. This transition could negatively affect various sectors, especially the education sector.
There are numerous studies examining the relationship between human capi-tal and economic growth, as well as the strength and the direction of such relation-ship. Human capital accumulation serves as a pushing engine to economic growth. According to Lucas (1993), the main engine of growth is the accumulation of human capital -of knowledge-and the main source of differences in living standards among nations is differences in human capital. Empirical evidence strongly supports the theory too, adding that not only human capital positively affects the economic growth of a country, but the economic growth, in turn, positively influences the human capi-tal.
Comparing the micro and macro studies, micro studies are found to be consist-ent with the finding that years of schooling, acquired skills, etc., tend to have higher probability to be employed and higher incomes. Whereas macro studies have suf-fered to be consistent and the findings have been controversy (Pritchett, 2001). Since literature review offers such controversies, the main aim of the paper is to explore the literature regarding the relationship among these two variables and the proxies used for human capital accumulation. Secondly, the study aims to compare the per-formance of WB countries with EU countries with regard to linkage of human capital with gender disparity and per capita GDP. Lastly, the study aims to estimate the years needed for Albania and Serbia in converging the EU level of capital accumulation.
This study focused on the two Western Balkan countries given the available of data starting from 1950. The time series dataset was essential for this study because growth rate calculations needed to be made. The paper is organized five section in-cluding introduction: Section 2 presents a literature review of the link between hu-man capital accumulation and economic growth. Section 3 describes the human capital in Albania, Serbia and EU countries, including the gender disparity, and its relationship to per capita GDP. Section 4 estimates the number of years needed for Albania and Serbia to catch up the EU countries. Section 5 summarizes main findings and concluding remarks.

30
REVIEW OF INNOVATION AND COMPETITIVENESS VOLUME 4 | ISSUE 2 | 2018
2. LITERATURE REVIEW
Since the 1960s, examining the link between human capital and economic growth using micro and macro theoretical and empirical approaches has been a great interest of scholars. From the microeconomic perspective, the level of education has a direct impact on the individual’s income. Education increases the probability to be employed, the individual’s labor productivity, skills’ enhancement and the chance to fit the market needs. From the macroeconomic perspective, human capital is seen as the promoter of the economy. Education improves labour productivity, pushes the technology and innovation, increases returns to capital by supporting a sustain-able economic growth. Madsen and Murtin, in 2017, found that the contribution of education in Britain has been equally important before and after the first industrial revolution. The empirical studies strongly support the fact that both, quantitative and qualitative education have positive effects on economic growth. Some of the key studies are being mentioned as below.
Although the definition of human capital is clear, measuring it still remains am-biguous, because it is hard to measure both the quantitative and qualitative educa-tion and it is much more difficult while trying to compare countries by using these measurements.
Different empirical studies have used different proxies of education in order to measure the impact of education on economic growth.
The main proxies of the education quantity founded in the literature review have been:
• Schooling enrolment ratios (Barro, 1991; Mankiw et al., 1992; Levine and Renelt, 1992),
• The average years of education/schooling (Barro and Lee, 1996, 2001 and 2010; Cohen and Soto, 2007; Hanushek and Woessmann, 2007; Krueger and Lindahl, 2001),
• Adult literacy rate (Azariadis and Drazen, 1990; Romer, 1990; Durlauf and Johnson, 1995),
• Education spending (Baldacci et al., 2008). Most of these studies found a strong relationship between education quantity
and economic growth and the education’s positive effect on economic growth (Krue-ger and Lindahl, 2001; Temple, 1999). Education facilitates the spread of innovation, technological progress, so the economic growth and because of wealthy economies, countries can invest more and more in education. However, this relationship can exist just from one side; either the education pushes economic growth or economic growth pushes education. In a very few studies the link between these two variables is found to be weak or even negative (Islam, 1995; Bils and Klenow, 2000; Pritchett, 2001). In some other studies education quantity and economic growth are found to be totally unrelated (Benhabib and Spiegel, 1994). The main proxies of the educa-

31
(27 - 40)RIC Eglantina Hysa HUMAN CAPITAL TRAJECTORY: PERFORMANCE OF ALBANIA AND SERBIA...
tion quality in the literature review are founded to be: survival rates, repetition rates, student/teacher ratios, schooling life expectancy, trained teachers in primary educa-tion, and education test scores.
The empirical studies that have used the education quality to examine the re-lationship with the economic growth are found to be relatively rare compared to the usage of the education quantity in the identification of this relationship.
Barro (1990) has measured the schooling quality by using the data on student scores and he found a positive relationship between schooling quality and economic growth. Hanushek and Kim (1995), Hanushek and Kimko (2000), Hanushek and Woessmann (2007) in their study were focused on mathematical and sciences skills concluding that these skills have strong impact on economic growth.
3. HUMAN CAPITAL STOCK IN ALBANIA, SERBIA AND EUROPEAN COUNTRIES
Two different data sets were used to describe the stock of human capital in Al-bania, Serbia and European Countries. The first data set is the international compa-rable data from Barro and Lee (2010) covering all European Countries and just two countries from Western Balkans, Albania and Serbia for the time period 1950-2010. This data shows the average years of schooling among the population aged 25 years old and over. Meanwhile, the second data source is based on data set offered by Hu-man Development Report of United Nations Development Program (2015). This data set covers some detailed records for the time period of 2005-2014 for all European Countries including Albania and Serbia. This data set also shows the average years of schooling among the population aged 25 years old and over.
Figure 1. presents average years of schooling for the EU member countries as well as Albania and Serbia. Moreover, EU-28 has been added to the list of these countries. EU-28 shows the average of all actual European Counties and it is used as a reference point for a comparison with Albania and Serbia.

32
REVIEW OF INNOVATION AND COMPETITIVENESS VOLUME 4 | ISSUE 2 | 2018
Figure 1.: Average Years of Schooling in EU Countries, Albania and Serbia, 2010
Source: Author’s calculations based on Barro and Lee’s (2010) data set.

33
(27 - 40)RIC Eglantina Hysa HUMAN CAPITAL TRAJECTORY: PERFORMANCE OF ALBANIA AND SERBIA...
The countries have been listed in descending order in terms of average years of schooling. Barro and Lee’s dataset offers the average years of total schooling, whereas the value for EU-28 has been calculated by taking the average of all EU countries. The top five countries representing the highest average years of schooling are Czech Re-public, Slovakia, Germany, Estonia and United Kingdom. Czech Republic is placed in the top list, having an average years of schooling per total of population equal to 13.16 and respectively 13.31 for males and 13.03 for females. Portugal and Italy are at the bottom of the list. Even though both Albania and Serbia show low level of average years of schooling comparing to the EU-28, Serbia appears just two countries below the EU average.
Figure 2. presents average years of schooling and gender disparity in EU-28, Al-bania, and Serbia. The gender disparity is defined as the ratio of females’ and males’ average years of schooling. In all of these three cases, the average years of schooling has been higher for male comparing to the female population. Even though the aver-age years of schooling in Albania is lower comparing to both Serbia and EU-28, Alba-nia shows a better performance in the gender disparity. Specifically, gender disparity is 0.97 in EU-28, 0.94 in Albania, 0.91 in Serbia.
Figure 2.: Average Years of Schooling and Gender Disparity in EU-28, Albania and Serbia, 2010
Source: Author’s calculations based on Barro and Lee’s (2010) data set.
Figure 3. presents gender disparity in each of the EU member countries (EU-28) as well as in Albania and Serbia. The countries have been arranged in ascending order in terms of gender disparity. A total of six countries are found to have a gender disparity greater than 1, which means that the female population has higher average years of schooling than male population. Estonia is the top country representing the

34
REVIEW OF INNOVATION AND COMPETITIVENESS VOLUME 4 | ISSUE 2 | 2018
widest gap of about 1.04 between females and males regarding gender disparity. Oth-er countries having females’ education higher than males’ one are: Ireland, Sweden, Belgium, Finland and Latvia. Meanwhile, the rest of the countries have relatively high average years of schooling for males comparing to females. The highest gender disparity is found to be in Luxemburg, showing a ratio of about 0.88. Regarding Alba-nia and Serbia, even though Serbia has a higher average years of schooling comparing to Albania, Albania fairs better in terms of gender disparity. The gender disparity is 0.94 in Albania and 0.91 in Serbia whereas this ratio is around 0.97 for the EU-28.
Figure 3.: Gender Gap in Average Years of Schooling, 2010
Source: Author’s calculations based on Barro and Lee’s (2010) data set.
The relationship between economic growth and human capital can be seen in Figure 4. The countries have been arranged in ascending order regarding their per capita gross domestic product (GDP). Figure 4. plots average years of schooling for each corresponding country. As expected and based on the previous works, gross do-mestic product should increase because of an increase of the education level. Con-trary to the expectations, the trends of these two variables do not support this direct link. The reason of this result most probably is because the there are other important factors that influence the GDP. Dellink et al. (2017) also have come to some conclu-sion that countries such as Tanzania have more scope to boost economic growth by improving education levels than e.g. the United States (of course, in level terms, higher education levels still imply higher income levels, ceteris paribus).

35
(27 - 40)RIC Eglantina Hysa HUMAN CAPITAL TRAJECTORY: PERFORMANCE OF ALBANIA AND SERBIA...
Even though Albania and Serbia are the countries having the lowest per capita GDP, Serbia has been thriving in catching up the performance of most of the EU countries with regard to the average years of schooling. Within the group of the EU countries, Portugal and Luxemburg are listed as the outliers. Portugal, having a mid-dle per capita GDP in the group of EU countries, has an average years of schooling of about 7.20. This is the lowest level of average years of schooling in EU zone. Portu-gal rests even behind the two WB countries, respectively Albania and Serbia. Mean-while, Luxemburg represents the other extreme case. It has the highest per capita GDP in the EU, but the performance of average years of schooling is not in line with that of per capita GDP.
Figure 4.: Average Years of Schooling by Distribution of per capita GDP, 2010
Source: Author’s calculations based on Barro and Lee’s (2010) data set.
Figure 5. depicts the relationship of economic growth and gender disparity. As in the previous chart, the countries have been arranged in ascending order regard-ing their per capita gross domestic product. Additionally, gender disparity has been plotted for each corresponding country. In the EU group, Latvia is the only country representing a gender disparity equal to one, even though it is the third country listed at the end regarding low level of per capita GDP in the European Union.
Luxemburg, Croatia, Greece and Malta show large gender disparities; males having higher average years of schooling females: 0.88, 0.92, 0.93 and 0.93, respec-

36
REVIEW OF INNOVATION AND COMPETITIVENESS VOLUME 4 | ISSUE 2 | 2018
tively. Luxemburg, as seen at the previous figure, seems to have high per capita GDP but a significant gap between males’ and females’ education level. This finding ap-pears to be contrary to the observation made by Klasen (2002), who indicated that gender disparity in education may slow down economic growth.
Figure 5.: Gender Disparity by Distribution of per capita GDP, 2010
Source: Author’s calculations based on Barro and Lee’s (2010) data set.
Whereas Estonia, Ireland, Belgium and Finland represent the countries that have a gender disparity greater than one (1.04, 1.03, 1.01 and 1.01, respectively), meaning that the females are more educated than males in terms of average years of schooling. Even in these cases, it is difficult to conclude that there is a direct relation between economic growth and gender disparity in education since these four coun-tries have different per capita GDP.
On the other hand, although Serbia does better in the average years of school-ing, Albania fairs better in terms of gender disparity. Albania has a gender disparity in education of about 0.94 in 2010, whereas Serbia has gender disparity in education of about 0.91.

37
(27 - 40)RIC Eglantina Hysa HUMAN CAPITAL TRAJECTORY: PERFORMANCE OF ALBANIA AND SERBIA...
4. ESTIMATED CONVERGENCE PERIOD OF ALBANIA AND SERBIA WITH EUROPEAN COUNTRIES
As indicated above, there is a gap between Western Balkan Countries such as Albania and Serbia and European Countries in terms of years of schooling. The aim of this section is to look at the possibility of convergence and estimate the time need-ed to close this gap. The exponential trend method was used to calculate the annual growth rate. Albania shows a higher growth rate, of about 2.8%, followed by Serbia and EU-28 with a growth rate of 1.7 and 1.4, respectively. These growth rates are found to be relatively high in the countries having a lower average years of school-ing. This is consistent also the diminishing returns concept. Backward economies are at an advantage compared to rich countries because of diminishing returns to the accumulation of capital per head (Soukiazis, 2000). Gerschenkron (1962) was the first to present the idea that the poor countries imitate and rich countries innovate, naming this phenomena as “ the advantages of relative backwardness”. Elmslie and Milberg in 1996, further develop this phenomena by arguing that diminishing re-turns characteristics might also come from the services and education sectors. In this case too, the educational attainment is conform to the diminishing returns concept. Siljak and Nagy (2018) in their empirical study done for time interval 2004 - 2013 have found that the Western Balkan countries converge towards the EU-28 Member States in economic aspects.
Comparing growth rates, as expected, the females’ growth rates are higher that males’ growth rates. This is because females have fewer number of schooling years.
Table 1.: Annual Growth Rate in Years of Schooling, 1950-2010 (in percentage)
Countries Total Male Female
EU-28 1.4 1.3 1.5Albania 2.8 2.5 3.1Serbia 1.7 1.3 2.1
Source: Author’s calculations based on Barro and Lee’s (2010) data set.
As noted in Table 1. and in Figure 5., countries with lower per capital GDP such as Albania, having a very low human capital in 1950s, (about 2.32), have made remark-able progress increasing years of schooling. Obviously, countries starting with high years of schooling find it more challenging to significantly further increase years of schooling, thus experiencing lower growth rates. Convergence in human capital can thus be expected because the time spent for schooling has an upper limit - people cannot study forever (Hyun H. Son, 2010).

38
REVIEW OF INNOVATION AND COMPETITIVENESS VOLUME 4 | ISSUE 2 | 2018
Table 2.: Convergence Year to EU-28 based on Annual Growth Rate of Years of Schooling, Base Year 2017
Countries Convergence Year Years to catch up EU-28
Albania 2019 +2 yearsSerbia 2021 +4 years
Source: Author’s calculations based on Barro and Lee’s (2010) data set, the UIS database and UN population database.
To estimate the time needed for the convergence, it is assumed that the coun-tries will continue to have the same growth rate they have experienced in the last 60 years, as calculated in Table 1. However, during the years, as countries are experienc-ing increases in the years of schooling, the calculated real growth rates can be even lower. Therefore, the results found in Table 2. are better to be considered as the lower limit time needed to convergence of Albania and Serbia to EU-28. Table 2 show that Albania will need at least 2 more years to catch up the EU-28 level, whereas Serbia needs at least 4 years, seen its’ low growth rate. The result seems to be surprising because Serbia is having higher average of years of schooling, but Albania is showing a rapider growth rate than Serbia.
5. CONCLUSIONS
Human capital is found to be one of the main inputs such as capital and land of Economic growth. Human capital, defined as education level (human capital re-fers to more than education level), which can include quantitative and/or qualitative indicators, essentially represents the production capacities of the people. Given the various proxies proposed to measure the human capital, this study uses the average years of schooling. This study used the data set (1950-2010) retrieved from Barro and Lee (2010) and for the years 2010-2015 from the UIS database and UN popula-tion database.
The research compared Albania and Serbia with the European Countries regard-ing human capital and the performance of these two countries in approaching their human capital level to the average of EU countries. Albania, having the lowest average years of schooling and the lowest GDP level, coupled with a lower gender disparity in education, is expected to have a higher growth rate of education. Assuming that the growth rate of education will continue to remain the same, the results show that Al-bania may catch up the average of EU countries education level by 2019. As for Serbia, the convergence may occur no earlier than 2021. Even though Serbia has a better per-formance in education level and GDP, its growth rate of education, approximately 1.7 percent, is lower than that of Albania. At the same time, the gender disparity in Serbia is found to be much higher than Albania but the females impact in this country’s con-vergence to the average of EU countries will be much more significant.

39
(27 - 40)RIC Eglantina Hysa HUMAN CAPITAL TRAJECTORY: PERFORMANCE OF ALBANIA AND SERBIA...
REFERENCES
Azariadis, Costas, and Allan Drazen. "Threshold externalities in economic development." The Quarterly Journal of Economics 105, no. 2 (1990): 501-526
Baldacci, Emanuele, Benedict Clements, Sanjeev Gupta, and Qiang Cui. "Social spending, human capital, and growth in developing countries." World development 36, no. 8 (2008): 1317-1341
Barro, Robert J. "Economic growth in a cross section of countries." The quarterly journal of economics 106, no. 2 (1991): 407-443
Barro, Robert J. "Government spending in a simple model of endogeneous growth." Journal of political economy 98, no. 5, Part 2 (1990): S103-S125
Barro, Robert J., and Jong Wha Lee. "International measures of schooling years and schooling quality." The American Economic Review 86, no. 2 (1996): 218-223
Barro, Robert J., and Jong-Wha Lee. "A New Data Set of Educational Attainment in the World, 1950-2010. NBER Working Paper No. 15902." National Bureau of Economic Research (2010).
Barro, Robert J., and Jong Wha Lee. "International data on educational attainment: updates and implications." oxford Economic papers 53, no. 3 (2001): 541-563
Benhabib, Jess, and Mark M. Spiegel. "The role of human capital in economic development evidence from aggregate cross-country data." Journal of Monetary economics 34, no. 2 (1994): 143-173
Bils, Mark, and Peter J. Klenow. "Does schooling cause growth?." American economic review 90, no. 5 (2000): 1160-1183
Cohen, Daniel, and Marcelo Soto. "Growth and human capital: good data, good results." Journal of economic growth 12, no. 1 (2007): 51-76
Dellink, Rob, Jean Chateau, Elisa Lanzi, and Bertrand Magné. "Long-term economic growth projections in the Shared Socioeconomic Pathways." Global Environmental Change 42 (2017): 200-214
Durlauf, Steven N., and Paul A. Johnson. "Multiple regimes and cross-country growth behaviour." Journal of applied econometrics 10, no. 4 (1995): 365-384
Elmslie, Bruce, and William Milberg. "The productivity convergence debate: A theoretical and methodological reconsideration." Cambridge Journal of Economics 20, no. 2 (1996): 153-182
Gerschenkron, Alexander. Economic backwardness in historical perspective: a book of essays. No. 330.947 G381. Cambridge, MA: Belknap Press of Harvard University Press, 1962.
Hanushek, Eric A., and Dennis D. Kimko. "Schooling, labor-force quality, and the growth of nations." American economic review 90, no. 5 (2000): 1184-1208
Hanushek, Eric A., and Dongwook Kim. Schooling, labor force quality, and economic growth. No. w5399. National bureau of economic research, 1995.
Hanushek, Eric A., and Ludger Wößmann. The role of school improvement in economic development. No. w12832. National Bureau of Economic Research, 2007.
Human Development Report 2015, Work For Human Development. 2015, report.hdr.undp.org.
Islam, Nazrul. "Growth empirics: a panel data approach." The Quarterly Journal of Economics 110, no. 4 (1995): 1127-1170

40
REVIEW OF INNOVATION AND COMPETITIVENESS VOLUME 4 | ISSUE 2 | 2018
Klasen, Stephan. "Low schooling for girls, slower growth for all? Cross-country evidence on the effect of gender inequality in education on economic development." The World Bank Economic Review 16, no. 3 (2002): 345-373
Krueger, Alan B., and Mikael Lindahl. "Education for growth: Why and for whom?." Journal of economic literature 39, no. 4 (2001): 1101-1136
Levine, Ross, and David Renelt. "A sensitivity analysis of cross-country growth regressions." The American economic review (1992): 942-963
Lucas Jr, Robert E. "Making a miracle." Econometrica: Journal of the Econometric Society (1993): 251-272
Madsen, Jakob B., and Fabrice Murtin. "British economic growth since 1270: the role of education." Journal of Economic Growth 22, no. 3 (2017): 229-272
Mankiw, N. Gregory, David Romer, and David N. Weil. "A contribution to the empirics of economic growth." The quarterly journal of economics 107, no. 2 (1992): 407-437
Pritchett, Lant. "Where has all the education gone?." The world bank economic review 15, no. 3 (2001): 367-391
Romer, Paul M. "Endogenous technological change." Journal of political Economy 98, no. 5, Part 2 (1990): S71-S102
Siljak, Dzenita, and Sándor Gyula Nagy. "The effects of the crisis on the convergence process of the Western Balkan countries towards the European Union." Society and Economy40, no. 1 (2018): 105
Soukiazis, Elias. "What have we learnt about convergence in Europe? Some theoretical and empirical considerations." Unpublished manuscript, 2000.
Temple, Jonathan. "The new growth evidence." Journal of economic Literature 37, no. 1 (1999): 112-156

41
(41 - 54)RIC S. Singaravelan, R. Arun, D. Arun Shunmugam, K. Ruba Soundar, R.Mayakrishnan, D. Murugan ANALYSIS OF CLASSIFICATION ALGORITHMS ON DIFFERENT DATASETS
ANALYSIS OF CLASSIFICATION ALGORITHMS ON DIFFERENT DATASETS
S. Singaravelan, R. Arun, D. Arun Shunmugam, K. Ruba Soundar, R.Mayakrishnan, D. Murugan
(1) Department of Computer Science and Engineering, P.S.R Engineering College, Sivakasi, India
(2) Department of Computer Science and Engineering, P.S.R Engineering College, Sivakasi, India
(3) Department of Computer Science and Engineering, P.S.R Engineering College, Sivakasi, India
(4) Department of Computer Science and Engineering, P.S.R Engineering College, Sivakasi, India
(5) Department of Computer Science and Engineering, Manonmaniam Sundaranar, University, Tirunelveli, India
S. Singaravelan Department of Computer Science and Engineering,
P.S.R Engineering College, Sivakasi, India [email protected]
Article info Paper category: Review paper
Received: 20.3.2018. Accepted: 9.7.2018.
JEL classification: C38
Keywords: Classification; Data Mining Techniques; Decision Tree; Sequential Minimal Optimization
41

42
REVIEW OF INNOVATION AND COMPETITIVENESS VOLUME 4 | ISSUE 2 | 2018
ABSTRACT
Purpose. Data mining is the forthcoming research area to solve different problems and classification is one of main problem in the field of data mining. In this paper, we use two classification algorithms J48 and Sequential Minimal Optimization alias SMO of the Weka interface.
Methodology. It can be used for testing several datasets. The performance of J48 and Sequential Minimal Optimization has been analyzed to choose the better algorithm based on the conditions of the datasets. The datasets have been chosen from UCI Machine Learn-ing Repository.
Findings. Algorithm J48 is based on C4.5 decision-based learning and algorithm Sequential Minimal Optimization uses the Support Vector Machine approach for classifica-tion of datasets. When comparing the performance of both algorithms we found Sequential Minimal Optimization is better algorithm in most of the cases.
Originality. This is the first implemented research work up to my knowledge, data sets classification problem handled in data mining using SMO with Weka interface.

43
(41 - 54)RIC S. Singaravelan, R. Arun, D. Arun Shunmugam, K. Ruba Soundar, R.Mayakrishnan, D. Murugan ANALYSIS OF CLASSIFICATION ALGORITHMS ON DIFFERENT DATASETS
1. INTRODUCTION
Data mining is the process to pull out patterns from large datasets by joining methods from statistics and artificial intelligence with database management. It is an upcoming field in today world in much discipline. It has been accepted as technology growth and the need for efficient data analysis is required. The plan of data mining is not to give tight rules by analyzing the data set, it is used to guess with some certainty while only analyzing a small set of the data.
In recent times, data mining has been obtained a great attention in the knowl-edge and information industry due to the vast availability of large amounts of data and the forthcoming need for converting such data into meaningful information and knowledge. The data mining technology is one comprehensive application of tech-nology item relying on the database technology, statistical analysis, artificial intel-ligence, and it has shown great commercial value and gradually to other profession penetration in the retail, insurance, telecommunication, power industries use (Hai-yang, 2011).
The major components of the architecture for a typical data mining system are shown in Figure 1. (Han, 2006). Good system architecture will make possible the data mining system to make best use of the software environment. It achieves data mining tasks in an effective and proper way to exchange information with other sys-tems which is adaptable to users with diverse requirements and change with time.
Figure 1.: Architecture of a Typical Data Mining System
Source: Authors.

44
REVIEW OF INNOVATION AND COMPETITIVENESS VOLUME 4 | ISSUE 2 | 2018
2. RELATED WORK
Recently studies have been done on various performance of decision tree and on back propagation. Classification is a classical problem in machine learning and data mining (Agrawal, 1993). Decision trees are popular because they are practical and easy to understand. Rules can also be extracted from decision trees easily. Many algorithms, such as ID3 (Quinlan, 1986) and C4.5(Quinlan, 1993), have been de-vised for decision tree construction.
In (Bengio, 2000) neural networks are suitable in data-rich environments and are typically used for extracting embedded knowledge in the form of rules, quantita-tive evaluation of these rules, clustering, self-organization, classification and regres-sion. They have an advantage, over other types of machine learning algorithms, for scaling. The use of neural networks in classification is not uncommon in machine learning community (Michie, 1994). In some cases, neural networks give a lower classification error rate than the decision trees but require longer learning time (Quinlan, 1994., Shavlik, 1991). A decision tree can be converted to a set of rules, each one corresponding to a tree branch. Algorithms have been proposed to learn di-rectly sets of rules (Clark, 1989) or to simplify the set of rules corresponding to a de-cision tree (Quinlan, 1993). The alternating decision tree method (Freund, 1991) is a classification algorithm that tries to combine the interpretability of decision trees with the accuracy improvement obtained by boosting (Sharma, 2013).
Devendra Kumar Tiwari (2014), have comparatively tested four classification algorithms to find the optimum algorithm for classification. The Credit Card Ap-proval dataset has been used for experimental purposes that contain 690 instances with 15 attributes and 1 class attribute to test and justify the differences among classi-fication algorithms. Gupta (2016) explains the analysis of classification and cluster-ing using some terms like Kappa Statistics, Mean Absolute Error, Confusion Matrix, Classification Accuracy correctly classified, incorrectly classified, root mean square error for different algorithms of classification and clustering. This paper considers the most extensively used tools, WEKA tool for this analysis purpose.
Kapur (2017) compared well performing classification algorithms such as Naïve Bayes, decision tree (J48), Random Forest, Naïve Bayes Multiple Nominal, K-star and IBk. Data that they have used is Student dataset and gauge students’ potential based on various indicators like previous performances and in other cases their background to give a comparative account on what method is the best in achieving that end. They discussed about various statistical measure used to calculate the per-formance of each classifier. Neelamegam (2013) overview of several major kinds of classification method including decision tree, Bayesian networks, k-nearest neigh-bor classifier, Neural Network, Support vector machine are discussed.
Several major kinds of classification algorithms including C4.5, k-nearest neighbor classifier, Naive Bayes, SVM, and IB3 (Archana.S., 2013). This paper pro-

45
(41 - 54)RIC S. Singaravelan, R. Arun, D. Arun Shunmugam, K. Ruba Soundar, R.Mayakrishnan, D. Murugan ANALYSIS OF CLASSIFICATION ALGORITHMS ON DIFFERENT DATASETS
vides a general survey of different classification algorithms and their advantages and disadvantages.
In this paper, different kinds of classification techniques are discussed such as Association Rule Mining, Bayesian Classification, and Decision Tree Classification, nearest neighbor classifier, neural Networks and Support Vector Machine (Bhar-athi,2014).
3. METHODOLOGY
3.1. Datasets
Data pre-processing, classification, clustering, association, regression and fea-ture selection these standard data mining tasks are supported by Weka. For classifi-cation purpose classify tab in Weka Explorer is used (Sudhir, 2013). Advantages of Weka tool:
• Available freely under the GNU General Public License.• It is portable, as it is implemented in the Java programming language and thus
runs on almost any platform.• It is easy to use due to its graphical user interfaces.
There are four datasets we have used in our paper taken from UCI Machine Learn-ing Repository (ml-repository). The details of each datasets are shown in Table 1.
Table 1.: Details of 4 datasets
Datasets Instances Attributes No. of Classes Type
Diabetes 768 9 2 NumericIris 150 5 3 NumericTic-Tac-Toe 958 10 2 NominalYuta-Selection 265 26 2 Numeric
Source: Authors.
In the diabetes dataset (Weka) several constraints were placed on the selection of instances from a larger database. All patients here are females at least 21 years old of Pima Indian heritage.
In the iris dataset contains 3 classes of 150 instances each, where each class re-fers to a type of iris plant. One class is linearly separable from the other 2; the latter are NOT linearly separable from each other.
The tic-tac-toe dataset encodes the complete set of possible board configura-tions at the end of tic-tac-toe games, where "x" is assumed to have played first
The overview of all products by designer Takiro Yuta. Refine your Designer Ta-kiro Yuta selection and filter the overview by product group, manufacturer or theme.

46
REVIEW OF INNOVATION AND COMPETITIVENESS VOLUME 4 | ISSUE 2 | 2018
3.2. Weka interface
Weka (Waikato Environment for Knowledge Analysis) is a popular suite of ma-chine learning software written in Java, developed at the University of Waikato, New Zealand (Witten, 2011). The Weka suite contains a collection of visualization tools and algorithms for data analysis and predictive modeling, together with graphical user interfaces for easy access to this functionality.
The original non-Java version of Weka was TCL/TK front-end software used to model algorithms implemented in other programming languages, plus data pre-processing utilities in C, and a Make file-based system for running machine learning experiments.
This Java-based version (Weka 3.7.7) is used in many different application ar-eas, for educational purposes and research. There are various advantages of Weka:
• It is freely available under the GNU General Public License • It is portable, since it is fully implemented in the Java programming language
and thus runs on almost any architecture • It is a huge collection of data preprocessing and modeling techniques • It is easy to use due to its graphical user interface
Weka supports several standard data mining tasks, more specifically, data pre-processing, clustering, classification, regression, visualization, and feature selec-tion. All techniques of Weka's software are predicated on the assumption that the data is available as a single flat file or relation, where each data point is described by a fixed number of attributes (normally, numeric or nominal attributes, but some other attribute types are also supported).
3.3. Classification algorithm J48
J48 algorithm of Weka software is a popular machine learning algorithm based upon J.R. Quilan C4.5 algorithm. All data to be examined will be of the categorical type and therefore continuous data will not be examined at this stage. The algorithm will however leave room for adaption to include this capability. The algorithm will be tested against C4.5 for verification purposes (Quinlan, 1993).
In Weka, the implementation of a learning algorithm is encapsulated in a class, and it may depend on other classes for some of its functionality. J48 class builds a C4.5 decision tree. Each time the Java virtual machine executes J48, it creates an instance of this class by allocating memory for building and storing a decision tree classifier. The algorithm, the classifier it builds, and a procedure for outputting the classifier is all part of that instantiation of the J48 class.
Larger programs are usually split into more than one class. The J48 class does not actually contain any code for building a decision tree. It includes references to instances of other classes that do most of the work. When there are several classes as in Weka software they become difficult to comprehend and navigate (Werbos, 1990).

47
(41 - 54)RIC S. Singaravelan, R. Arun, D. Arun Shunmugam, K. Ruba Soundar, R.Mayakrishnan, D. Murugan ANALYSIS OF CLASSIFICATION ALGORITHMS ON DIFFERENT DATASETS
3.4. Classification function Sequential Minimal Optimization
Sequential Minimal Optimization (SMO) is used for training a support vector classifier using polynomial or RBF kernels. It replaces all missing the values and transforms nominal attributes into binary ones. A single hidden layer neural net-work uses the same form of model as an SVM.
Training a Support Vector Machine (SVM) requires the solution of a very large quadratic programming (QP) optimization problem. SMO breaks this large QP problem into a series of smallest possible QP problems. These small QP problems are solved analytically, which avoids using a time-consuming numerical QP optimi-zation as an inner loop.
The amount of memory required for SMO is linear in the training set size, which allows SMO to handle very large training sets. Because large matrix computation is avoided, SMO scales somewhere between linear and quadratic in the training set size for various test problems, while a standard projected conjugate gradient (PCG) chunking algorithm scales somewhere between linear and cubic in the training set size.
SMO's computation time is dominated by SVM evaluation; hence SMO is fastest for linear SVMs and sparse data sets. For the MNIST database, SMO is as fast as PCG chunking; while for the UCI Adult database and linear SVMs, SMO can be more than 1000 times faster than the PCG chunking algorithm.
4. RESULTS
For evaluating a classifier quality, we can use confusion matrix. Consider the al-gorithm J48 running on iris dataset in WEKA, for this dataset we obtain three classes then we have 3x3 confusion matrix. The number of correctly classified instances is the sum of diagonals in the matrix; all others are incorrectly classified. Let TPA be the number of true positives of class A, TPB be the number of true positives of class B and TPC be the number of true positives of class C. Then, TPA refers to the positive tuples that were correctly labeled by the classifier in first row-first column i.e. 49. Similarly, TPB refer to the positive tuples that were correctly labeled by the classifier in second row-second column i.e. 47. And, TPC refer to the positive tuples that were correctly labeled by the classifier in third row-third column i.e. 48 shown in Table 2.

48
REVIEW OF INNOVATION AND COMPETITIVENESS VOLUME 4 | ISSUE 2 | 2018
Table 2.: Confusion matrix of three classes of Iris
Predicted class
Actual Class
A B C TotalA 49 1 0 50B 0 47 3 50C 0 2 48 50
Total 150
Source: Authors.
Accuracy = (TPA+TPB + TPC)/(Total number of classification)i.e. Accuracy = (49+47+48)/150 = 96The confusion matrix helps us to find the various evaluation measures like Accuracy, Recall, and Precision etc.
Table 3.: Accuracy on Diabetes
S.No Parameter J48 SMO
1 TP Rate 0.73 0.772 FP Rate 0.32 0.333 Precision 0.73 0.764 Recall 0.73 0.775 F-Measure 0.73 0.766 ROC Area 0.75 0.79
Source: Authors.
Figure 3.: Accuracy chart on Diabetes
Source: Authors.
In diabetes dataset the accuracy parameters have shown in Table 3. and Figure 3. The above chart shows that it has almost equal accuracy measures except ROC Area measure in which SMO has higher accuracy on the diabetes dataset. So, SMO is better method for diabetes.

49
(41 - 54)RIC S. Singaravelan, R. Arun, D. Arun Shunmugam, K. Ruba Soundar, R.Mayakrishnan, D. Murugan ANALYSIS OF CLASSIFICATION ALGORITHMS ON DIFFERENT DATASETS
Table 4.: Accuracy on Iris
S.No Parameter J48 SMO
1 TP Rate 0.98 0.992 FP Rate 0.01 0.003 Precision 0.98 0.994 Recall 0.98 0.995 F-Measure 0.98 0.996 ROC Area 0.98 0.99
Source: Authors.
Figure 4.: Accuracy chart on Iris
Source: Authors.
In iris dataset accuracy parameters have shown in Table 4. and Figure 4. Algo-rithm J48 having lower value than SMO. So, SMO is better method for iris dataset.
Table 5.: Accuracy on Tic-Tac-Toe
S.No Parameter J48 SMO
1 TP Rate 0.99 12 FP Rate 0.00 03 Precision 0.99 14 Recall 0.99 15 F-Measure 0.99 16 ROC Area 0.99 1
Source: Authors.

50
REVIEW OF INNOVATION AND COMPETITIVENESS VOLUME 4 | ISSUE 2 | 2018
Figure 5.: Accuracy chart on Tic-Tac-Toe
Source: Authors.
In tic-tac-toe dataset accuracy parameters have shown in Table 5. and Figure 5. The above chart shows that it has almost equal accuracy measures except ROC Area measure in which SMO has higher accuracy on the tic-tac-toe dataset. So, SMO is better method for tic-tac-toe dataset.
Table 6.: Accuracy on Yuta-Selection
S.No Parameter J48 SMO
1 TP Rate 0.67 0.682 FP Rate 0.36 0.433 Precision 0.67 0.694 Recall 0.67 0.685 F-Measure 0.67 0.656 ROC Area 0.65 0.66
Source: Authors.
Figure 6.: Accuracy chart on Yuta-Selection
Source: Authors.

51
(41 - 54)RIC S. Singaravelan, R. Arun, D. Arun Shunmugam, K. Ruba Soundar, R.Mayakrishnan, D. Murugan ANALYSIS OF CLASSIFICATION ALGORITHMS ON DIFFERENT DATASETS
In Yuta-Selection dataset accuracy parameters have shown in Table 6. and Fig-ure 6. SMO has better accuracy measures except FP rate. So, SMO is better method for Yuta-Selection dataset.
Table 8.: Accuracy measure of J48 and MLP
S.No Datasets J48 SMO
1 Diabetes 73.828 77.3432 Iris 96 963 Tic-Tac-Toe 84.551 98.3294 Yuta-Selection 67.924 68.679
Source: Authors.
From the values of Table 8 and the chart shown in Figure 8., the accuracy meas-ures are calculated on J48 and SMO algorithms.
Figure 8: Accuracy chart of J48 and MLP
Source: Authors.
The J48 and SMO classification algorithm applies on all the datasets for accuracy measure. From the above chart in Figure 8. it is clear that SMO gives better results for almost 3 datasets and approximate equal accuracy for iris dataset. Hence, we can clearly say that SMO is better algorithm than J48 for the given 4 datasets.
5. CONCLUSION
In this paper, we evaluate the performance in terms of classification accuracy of J48 and Sequential Minimal Optimization algorithms using various accuracy meas-ures like TP rate, FP rate, Precision, Recall, F-measure and ROC Area. Accuracy has been measured on each dataset. On diabetes, and tic-tac-toe datasets Sequential Minimal Optimization is clearly better algorithm. On iris and yuta-selection data-sets accuracy is almost equal and Sequential Minimal Optimization is slightly better

52
REVIEW OF INNOVATION AND COMPETITIVENESS VOLUME 4 | ISSUE 2 | 2018
algorithm. Thus, we found that Sequential Minimal Optimization is better algorithm in most of the cases. Generally neural networks have not been suited for data mining but from the above results we conclude that algorithm based on neural network has better learning capability hence suited for classification problems if learned prop-erly.
6. FUTURE SCOPE
For the future work new algorithms from classification can be integrated and much more datasets should be taken or try to get the real dataset from the industry to have the actual impact of the performance of algorithms taken into consideration.

53
(41 - 54)RIC S. Singaravelan, R. Arun, D. Arun Shunmugam, K. Ruba Soundar, R.Mayakrishnan, D. Murugan ANALYSIS OF CLASSIFICATION ALGORITHMS ON DIFFERENT DATASETS
REFERENCES
Haiyang, H., A Short Introduction to Data Mining and Its Applications, 2011 International Conference on Management and Service Science, Wuhan (2011):1-4
Han, J., Kamber, M., Data Mining: Concepts and Techniques, Morgan Kaufmann, 2006.
Agrawal, R., Imielinski, T., Swami, A.N., Database Mining: A Performance Perspective, IEEE Trans. Knowledge and Data Engineering (1993):914-925
Quinlan, J.R., Induction of Decision Trees, Machine Learning (1963):81-106
Quinlan, J.R., C4.5: Programs for Machine Learning, Morgan Kaufmann, 1993.
Bengio, Y., Buhmann, J. M., Embrechts, M., Zurada, J. M., Introduction to the special issue on neural networks for data mining and knowledge discovery, IEEE Trans. Neural Networks, (2000):545-549
Michie, D., Spiegelhalter, D.J., Taylor, C.C., Machine Learning, Neural and Statistical Classification, Ellis Horwood Series in Artificial Intelligence (1994): 263-266
Quinlan, J.R., Comparing Connectionist and Symbolic Learning Methods, In Proceedings of a workshop on Computational learning theory and natural learning systems (vol. 1): constraints and prospects: constraints and prospects, Stephen José Hanson, Ronald L. Rivest, and George A. Drastal (Eds.). MIT Press (1993): 445-456
Shavlik, J.W., Mooney, R.J., Towell, G.G., Symbolic and Neural Learning Algorithms: An Experimental Comparison, Machine Learning (1991):111-143
Clark, P., Niblett, T., The CN2 induction algorithm, Machine learning (1989):261-283
Freund, Y., Mason, L., The alternating decision tree algorithm, In Proceedings of the 16th International Conference on Machine Learning (1999):124-133
UCI Machine Learning Repository: http://archive.ics.uci.edu/ml/datasets.html
Weka: http://www.cs.waikato.ac.nz/~ml/weka/
Witten, I. H., Frank, E., Hall, M. A., Data Mining: Practical Machine Learning Tools and Techniques, 3rd ed. Morgan Kaufmann, 2011.
Werbos, P.J., Backpropagation Through Time: What It Does and How to Do It, in Proceedings of the IEEE (1990):1550-1560
Devendra Kumar Tiwary., A Comparative study of classification algorithms for credit card approval using weka, GIIRJ (2014):165-174
Shivangi Gupta., Comparative Analysis of classification Algorithms using WEKA tool, International Journal of Scientific & Engineering Research (2016):2014-2018
Bhrigu Kapur, Comparative Study on Marks Prediction using Data Mining and Classification Algorithms, IJARCS (2017):394-402
Trilok Chand Sharma, Manoj Jain, WEKA Approach for Comparative Study of Classification Algorithm, International Journal of Advanced Research in Computer and Communication Engineering (2013):1925-1931
Sudhir B., Jagtap., Kodge, B. G., Census Data Mining and Data Analysis using WEKA, International Conference in Emerging Trends in Science, Technology and Management, (2013):35-40

54
REVIEW OF INNOVATION AND COMPETITIVENESS VOLUME 4 | ISSUE 2 | 2018
Archana, S., Elangovan, K., Survey of Classification Techniques in Data Mining, International Journal of Computer Science and Mobile Applications, (2014):65-71
Bharathi, A., Deepankumar, E., Survey on Classification Techniques in Data Mining, International Journal on Recent and Innovation Trends in Computing and Communication, (2014):1983-1986
Neelamegam, S., Ramaraj, E., Classification algorithm in Data mining: An Overview, International Journal of P2P Network Trends and Technology, (2013):1-5

55
(55 - 60)RIC Aleksandra Krajnović, Jurica Bosna BOOK REVIEW: CONTEMPORARY LABOR MARKET
BOOK REVIEW: CONTEMPORARY LABOR MARKET
Aleksandra Krajnović, Jurica Bosna
(1) Department of Economics, University of Zadar, Splitska 1, 23000, Croatia (2) Department of Economics, University of Zadar, Splitska 1, 23000, Croatia
Aleksandra Krajnović Department of Economics, University of Zadar,
Splitska 1, 23000, Croatia [email protected]
Article info Paper category: Book review
Received: 27.4.2018. Accepted: 29.5.2018.
JEL classification: J00
55

56
REVIEW OF INNOVATION AND COMPETITIVENESS VOLUME 4 | ISSUE 2 | 2018
The book „Contemporary Labor Market“ written by Marija Bušelić, PhD, was published by Juraj Dobrila University of Pula. The book represents a scientific work accessible to experts, students, but also to a wider circle of readers.
In today's society of knowledge, with human labor, knowledge and creativity be-ing key drivers of all social and economic changes, the presented text is of special significance. Human labor formed as a meaningful action of people, impacting their environment in a way so that they could live, becomes the central space of economic activities and the foundation of a social reality. The book is possibly a continuation of an earlier work by the same author - Labor Market - A Theoretical Approach in a way that it is refreshed and supplemented with new and current areas and topics, which is particularly important in the complex area of research of the dynamic phenomenol-ogy of human labor.
The book has been published in today's world when scientific and professional literature is lacking written texts about this topic, especially those that cover these issues broadly and comprehensively, as it is done by the author of this book. With this book Bušelić confirms once more that she is a prominent scientist with excellent knowledge of opportunities and relationships within the domestic and international labor market. The methodical value of the book should also be highlighted, more precisely the way that the author has successfully introduced a depth of analysis of the studied phenomenon within the text.
At one point, the author explains complex fundamental theories in the field of labor economics, and then immediately, with incredible ease, actualizing the same theories and linking them to the latest phenomena and trends within the labor market. Apart from this skillful connection between theory and practice, the author success-fully vertically links the international level - the conventions and recommendations of international organizations (ILO, United Nations declarations, OECD, IOM) with the Directives of the European council, the Recommendations of the European Commis-sion, and the institutional and other frameworks of activities in the Republic of Croatia. This gains significance in today's world when one of the most important goals of sus-tainable development as defined by the United Nations is DECENT WORK - honest or dignified work, which this book contributes to through all the presented topics.
The author very skillfully structures the complex labor market issues over ten chapters, in which she shows all the most significant theoretical, legislative, practi-cal and other aspects of human labor phenomenology by starting with a theoretical background, continuing by presenting the supply and demand on the labor market, and then defining the institutional framework of the labor market, concluding the first part of the book with the chapter about salary and its determination.
Although not explicitly separated, in the second part of the book the author describes two key negative phenomena present in today's labor market - discrimi-nation and the types and measurement of unemployment. This represents a kind of crescendo of the entire work that “resolves” itself through the last two chapters

57
(55 - 60)RIC Aleksandra Krajnović, Jurica Bosna BOOK REVIEW: CONTEMPORARY LABOR MARKET
- Possibilities of reducing unemployment and Contemporary trends on the global labor market, through a positive message. By structuring the work in such a way, the author emphasizes the extraordinary importance of current occurrences related to human labor, together with its measurements, evaluation and other phenomena on the labor market that change the world dramatically today and shape the destinies of individuals, families, and even nations as a whole.
The 21st century is a time of change in the field of labor, occurring and chang-ing through extraordinary dynamics. It is therefore necessary to observe labor and related phenomenon in a wider and interdisciplinary way.
We live in a time when the world polarizes, and the differences between people and communities deepen, among other things because of the eternal, more or less explicitly stated, written or silent struggles between employers and workers regard-ing the eternal theme of profits and wages, but also regarding other, fundamental human rights that arise from labor or are related to labor. Although the author ad-dresses issues that are both difficult and related to the general social, demographic, and above all, political trends and phenomena she does not fall into ideology or an ideological debate in any segment of the text, but instead strongly relies on scientific principles.
It is interesting to note that the book does not end with the conclusion, allowing in such a way to the reader to make his own conclusion and to apply the knowledge within the area in which he/she lives and works in. Therefore, we consider this book a valuable contribution to be used not only by the scientists belonging to different scientific areas as well as students, but also practitioners, especially managers of all levels in companies and other organizations, experts, human resources manag-ers, as well as the general reader, given that it is a topic that represents the basis of knowledge regarding human labor, as well as organizations and institutions related to labor, employment and unemployment. This also leads to the idea of introducing a segment dedicated to the human curriculum into the secondary and other vocational schools.
Furthermore the book in question, being a kind of manual of the most relevant scientific and professional knowledge, but also regarding labor related issues, labor market, employment, unemployment, etc., it can be also recommended to experts working in public and private institutions and organizations related to labor, trade unions, public services and similar organizations, such as, for example, agencies and employment agencies, social services, etc. The book is definitely a valuable contribu-tion to the work of public sector officials of all levels, from the lowest to the highest, since familiarity with science and professional work is essential for making crucial decisions, especially concerning issues related to labor and employment rights.
The book starts with a Foreword, followed by the first chapter titled Concept and development of the labor market, in which the author discusses labor issues from the beginnings of its scientific study until now. The second chapter presents the theo-

58
REVIEW OF INNOVATION AND COMPETITIVENESS VOLUME 4 | ISSUE 2 | 2018
retical approaches to the labor market, its historical analysis and the development of its theoretical studies, from the theory of a perfectly competitive labor market, the theories emerging in the era of an imperfect competitive environment in the market economy, with a particular reference to Keynes' theory, to the eradication of Keynes-ianism, created in the early 1970s. What follows is the description of neoliberal theo-ries and post-Keynesians, together with a detailed description of key factors that have influenced this shift in the paradigm of the labor theory, but also the principles ac-cording to which a new economic policy should be developed, based on full employ-ment and the elimination of unemployment and discrimination in the labor market. The third chapter describes labor market as an „inversion of the goods and services market“ by analyzing in details job offers, with reference to individual job offers and the indifference curve, the effect of income and substitution, the household model (Becker's model), the elasticity of labor and other factors affecting labor supply such as wage level, education costs, but also the particularly current issue of migration. In describing labor demands particular attention has been dedicated to the analy-sis of short and long term demand, showing the optimal employment and demand for work in conditions of imperfect competition, as well as the elasticity of demand for labor. The fourth chapter shows core labor market institutions ranging from the global, European and national levels. The International Labor Organization has been described (ILO), the International Organization for Migration (IOM), and the emer-gence and functioning of trade unions from their beginnings to the present. This is followed by the description of other relevant organizations and bodies such as the Workers Council, the International Employers' Organization (IOE), the Economic and Social Council, Public Employment Offices, Employment Agencies and Labor Inspection. The fifth chapter describes the institutional framework of the labor mar-ket in the Republic of Croatia, giving an overview and a brief description of the most important provisions of labor law and labor relations law - the Labor Act, with refer-ence to the Labor Code, the collective agreement and employment contract, the Em-ployment Mediation Act and Unemployment Rights, with particular reference to the unemployment rights, the Occupational Safety Act, the Pension Insurance Act and the Health Insurance Act. The sixth chapter deals with wages as the dominant source of resources for workers and the associated factors affecting their level. When de-ciding on wages some of the key issues are the laws and other regulations, collective and individual labor contracts, salaries specified by labor regulations, with particular emphasizes being placed on the notion of adequate wages in relation to the Labor Act which prohibits any form of discrimination. This includes the definition of parts that represent the structure of the wages, the issue and the purpose of the minimum wage, the right to wages during a period when the person does not work, other material rights of the employed worker, such as cash receipts and receipts in kind, measures and activities for the protection of wages and severance pay in case of a termination of the employment contract that provides a detailed description of individual fac-

59
(55 - 60)RIC Aleksandra Krajnović, Jurica Bosna BOOK REVIEW: CONTEMPORARY LABOR MARKET
tors that have an impact on the formation of level of the wages. The seventh chapter deals with the forms of discrimination in the labor market and the related indicators of discrimination, the theories regarding discrimination on the labor market, the segmented labor markets, and specific names of individuals in relation to different collar colors according to their complexity, job characteristics and earnings. Since within the labor market there are many dimensions of discrimination, the role and importance of battling discrimination within the market is being emphasized. Be-cause of the many dimensions of discrimination, it does not surprise that there are different indicators of discrimination and relating discrimination theories, among which the most relevant are Becker’s model of discrimination, the market power model / monopsony model, statistics of discrimination and the pattern of accumula-tion. A segmented labor market involves the subdivision of the market on a primary and secondarily one due to the differences in wages, working conditions, career ad-vancement and employment security.
The unemployment issue as one of the greatest social and economic problems has been addressed in the eighth chapter which is focused on the types and ways of measuring unemployment and the causes of unemployment by emphasizing its complexity. At the end of the chapter, the author defines the economic and socio-psychological consequences of unemployment, alluding to the role and importance of battling unemployment, which is being discussed in Chapter 9. The ninth chapter Possibilities of reducing unemployment presents a detailed overview of direct and indirect measures for battling unemployment, employment opportunities for prob-lematically employable groups, self-employment as a way out from unemployment, flexible and contemporary forms of work, and finally the consequences of working within an informal economy. The last chapter titled Contemporary trends on the global labor market deals with the attitudes towards labor within the contemporary global labor market in terms of new jobs and the repeal of existing ones, the issue of guaranteed income, job allocation - outsourcing and the role and importance of the flexicurity policy. In addition to that the chapter deals with child labor issues, youth unemployment and very low earnings of employees, lifelong learning, and the mo-bility of people in the global labor market, world migration and asylees, brain drain and employment opportunities in the EU. The structure and scope of contemporary trends within the global labor market indicates that the author is excellently ac-quainted with contemporary global labor market issues.
It seems that today we live in era where all issues somehow gravitate around hu-man labor and its values. It almost seems that the economy is becoming an economy of labor as well as of human knowledge and competences, with social changes be-ing largely influenced by changes in labor. Therefore a question arises - is there a change in the paradigm of human labor as announced by Drucker with the division of work on blue and white collars (within the book the author describes this theory and supplements it with pink, gold and green collars)? Are the complexity and the
60
REVIEW OF INNOVATION AND COMPETITIVENESS VOLUME 4 | ISSUE 2 | 2018
prominent dynamics of the phenomenology of human labor leading towards a new way of observing the phenomena and relationships characteristic for human labor? These issues are present throughout the book, making its contribution particularly important since it describes current and highly relevant topics such as discrimina-tion, flexicurity, lifelong learning, outsourcing, and others.
For any author who would place himself in the position of writing a book on such a demanding, complex and dynamic subject such as human labor and the la-bor market, one of the key questions would probably be the selection of topics and the method to present them without leaving out fundamental theories and relevant knowledge on which labor theory is based, while at the same time updating the theme with the presentation of all relevant issues and areas that are present on the global, as well as on the European and national labor market "scene". We are convinced that Bušelić succeeded in that task entirely through her very specific and praise worthy contribution to the already published domestic and international scientific works dedicated to human labor. Furthermore, her work can serve as an incentive and basis for further research of a number of particular topics covered in this book.

bi

REVIEW OF INNOVATION AND
COMPETITIVENESS A JOURNAL
OF ECONOMIC AND SOCIAL
RESEARCH
Government Expenditure and Economic Growth Nexus in Nigeria: Evidence from nonlinear ARDL and Causality Approaches Anthony Enisan Akinlo, Olufunmilayo Olayemi Jemiluyi
Human Capital Trajectory: Performance of Albania and Serbia in catching up the EU Countries Eglantina Hysa
Analysis of Classification Algorithms On Different Datasets S. Singaravelan, R. Arun, D. Arun Shunmugam, K. Ruba Soundar, R.Mayakrishnan, D. Murugan
Book review: Contemporary Labor Market Aleksandra Krajnović, Jurica Bosna
VOLUME
ISSUE 22018
4
VOLUME ISSUE4 2
RIC“Dr. MIJO MIRKOVIĆ”
JURA
J D
OBRILA UNIVERSITY OF PULA
FOUNDED IN 1960
FACU
LTY O
F ECONOMICS AND TOURISM
9 771849 879003