fertility of women in the united states: 2012 - census · fertility of women in the united states:...
TRANSCRIPT

Issued July 2014P20-575
Population Characteristics
Fertility of Women in the United States: 2012
By Lindsay M. Monte and Renee R. Ellis
U.S. Department of Commerce Economics and Statistics Administration U.S. CENSUS BUREAU
census.gov
INTRODUCTION
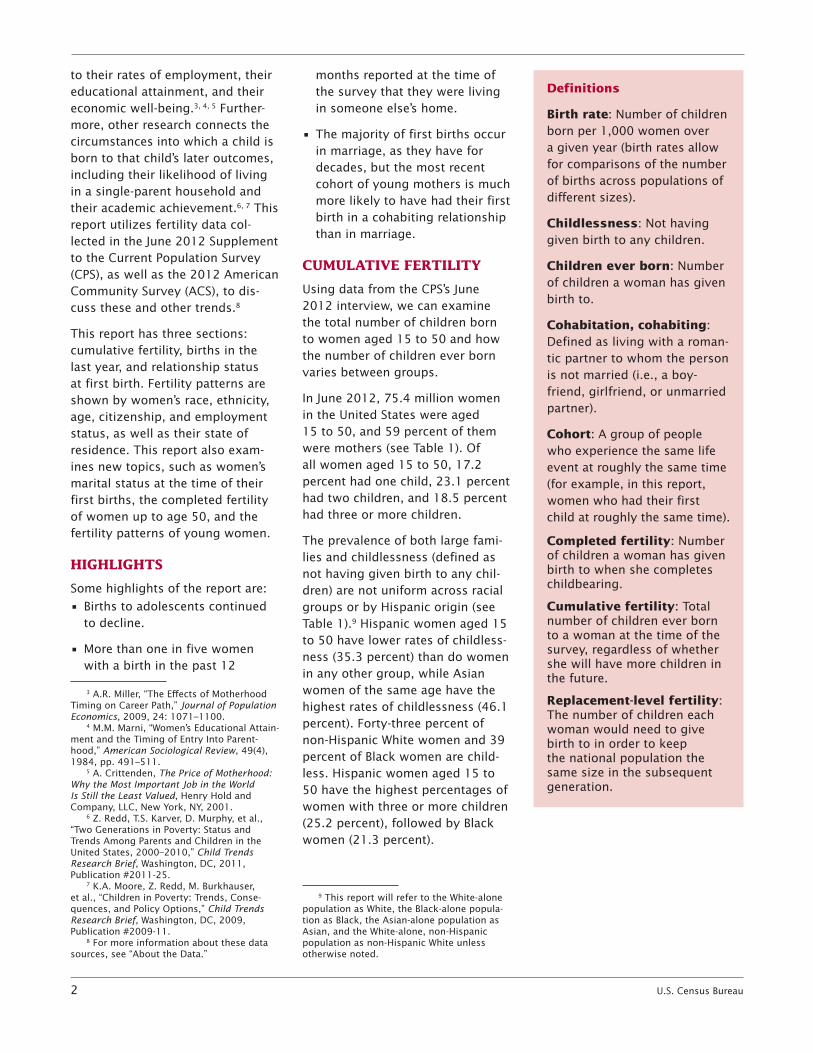
This report describes the fertility patterns of women in the United States, patterns which have changed sig-nificantly over time. The average number of children ever born has dropped from more than three children per woman in 1976 to about two children per woman in 2012 (see Figure 1). Recent years have also seen
drops in adolescent childbearing and increases in non-marital births.1, 2
These changes in fertility are important because recent research suggests that women’s childbearing is related
1 J.A. Martin, B.E. Hamilton, J.K. Osterman, et al., “Births: Final Data for 2012,” National Vital Statistics Reports, National Center for Health Statistics, Hyattsville, MD, 2013, Vol. 62, No. 9.
2 S.J. Ventura, “Changing Patterns of Nonmarital Childbearing in the United States,” NCHS data brief, National Center for Health Statistics, Hyattsville, MD, 2009, No. 18.
Figure 1.Children Ever Born Per 1,000 Women Aged 40 to 44: 1976–2012
Source: U.S. Census Bureau, Current Population Survey, 1976–2012.
Children born per 1,000 women
0
500
1000
1500
2000
2500
3000
3500
2012200820042000199619921988198419801976
0
500
1,000
1,500
2,000
2,500
3,000
3,500
2012200820042000199619921988198419801976
2 U.S. Census Bureau
to their rates of employment, their educational attainment, and their economic well-being.3, 4, 5 Further-more, other research connects the circumstances into which a child is born to that child’s later outcomes, including their likelihood of living in a single-parent household and their academic achievement.6, 7 This report utilizes fertility data col-lected in the June 2012 Supplement to the Current Population Survey (CPS), as well as the 2012 American Community Survey (ACS), to dis-cuss these and other trends.8
This report has three sections: cumulative fertility, births in the last year, and relationship status at first birth. Fertility patterns are shown by women’s race, ethnicity, age, citizenship, and employment status, as well as their state of residence. This report also exam-ines new topics, such as women’s marital status at the time of their first births, the completed fertility of women up to age 50, and the fertility patterns of young women.
HIGHLIGHTS
Some highlights of the report are:
• Birthstoadolescentscontinuedto decline.
•Morethanoneinfivewomenwith a birth in the past 12
3 A.R. Miller, “The Effects of Motherhood Timing on Career Path,” Journal of Population Economics, 2009, 24: 1071–1100.
4 M.M. Marni, “Women’s Educational Attain-ment and the Timing of Entry Into Parent-hood,” American Sociological Review, 49(4), 1984, pp. 491–511.
5 A. Crittenden, The Price of Motherhood: Why the Most Important Job in the World Is Still the Least Valued, Henry Hold and Company, LLC, New York, NY, 2001.
6 Z. Redd, T.S. Karver, D. Murphy, et al., “Two Generations in Poverty: Status and Trends Among Parents and Children in the United States, 2000–2010,” Child Trends Research Brief, Washington, DC, 2011, Publication #2011-25.
7 K.A. Moore, Z. Redd, M. Burkhauser, et al., “Children in Poverty: Trends, Conse-quences, and Policy Options,” Child Trends Research Brief, Washington, DC, 2009, Publication #2009-11.
8 For more information about these data sources, see “About the Data.”
months reported at the time of the survey that they were living in someone else’s home.
•Themajorityoffirstbirthsoccurin marriage, as they have for decades, but the most recent cohort of young mothers is much more likely to have had their first birth in a cohabiting relationship than in marriage.
CUMULATIVE FERTILITY
Using data from the CPS’s June 2012 interview, we can examine the total number of children born to women aged 15 to 50 and how the number of children ever born varies between groups.
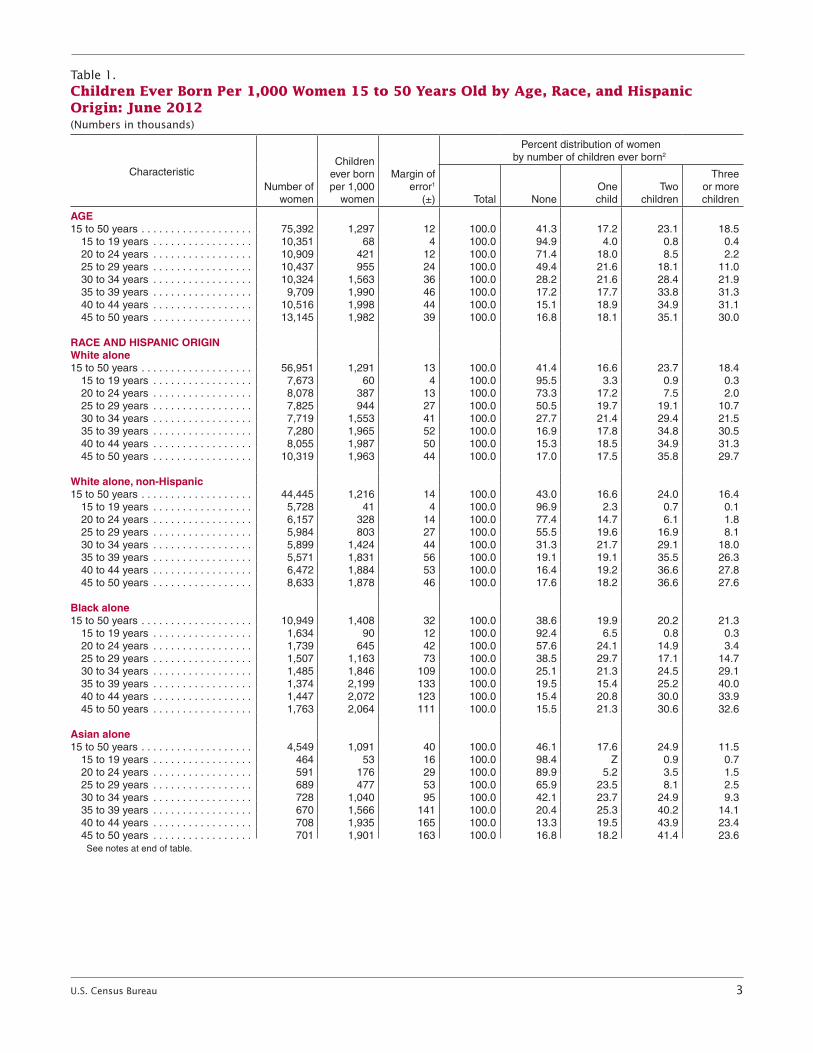
In June 2012, 75.4 million women in the United States were aged 15 to 50, and 59 percent of them were mothers (see Table 1). Of all women aged 15 to 50, 17.2 percent had one child, 23.1 percent had two children, and 18.5 percent had three or more children.
The prevalence of both large fami-lies and childlessness (defined as not having given birth to any chil-dren) are not uniform across racial groups or by Hispanic origin (see Table 1).9 Hispanic women aged 15 to 50 have lower rates of childless-ness (35.3 percent) than do women in any other group, while Asian women of the same age have the highest rates of childlessness (46.1 percent). Forty-three percent of non-Hispanic White women and 39 percent of Black women are child-less. Hispanic women aged 15 to 50 have the highest percentages of women with three or more children (25.2 percent), followed by Black women (21.3 percent).
9 This report will refer to the White-alone population as White, the Black-alone popula-tion as Black, the Asian-alone population as Asian, and the White-alone, non-Hispanic population as non-Hispanic White unless otherwise noted.
Definitions
Birth rate: Number of children born per 1,000 women over a given year (birth rates allow for comparisons of the number of births across populations of different sizes).
Childlessness: Not having given birth to any children.
Children ever born: Number of children a woman has given birth to.
Cohabitation, cohabiting: Defined as living with a roman-tic partner to whom the person is not married (i.e., a boy-friend, girlfriend, or unmarried partner).
Cohort: A group of people who experience the same life event at roughly the same time (for example, in this report, women who had their first child at roughly the same time).
Completed fertility: Number of children a woman has given birth to when she completes childbearing.
Cumulative fertility: Total number of children ever born to a woman at the time of the survey, regardless of whether she will have more children in the future.
Replacement-level fertility: The number of children each woman would need to give birth to in order to keep the national population the same size in the subsequent generation.
U.S. Census Bureau 3
Table 1. Children Ever Born Per 1,000 Women 15 to 50 Years Old by Age, Race, and Hispanic Origin: June 2012—Con.(Numbers in thousands)
Characteristic Number of
women
Children ever born per 1,000
women
Margin of error1
(±)
Percent distribution of women by number of children ever born2
Total None One child
Two children
Three or more children
AGE15 to 50 years . . . . . . . . . . . . . . . . . . . 75,392 1,297 12 100 .0 41 .3 17 .2 23 .1 18 .5 15 to 19 years . . . . . . . . . . . . . . . . . 10,351 68 4 100 .0 94 .9 4 .0 0 .8 0 .4 20 to 24 years . . . . . . . . . . . . . . . . . 10,909 421 12 100 .0 71 .4 18 .0 8 .5 2 .2 25 to 29 years . . . . . . . . . . . . . . . . . 10,437 955 24 100 .0 49 .4 21 .6 18 .1 11 .0 30 to 34 years . . . . . . . . . . . . . . . . . 10,324 1,563 36 100 .0 28 .2 21 .6 28 .4 21 .9 35 to 39 years . . . . . . . . . . . . . . . . . 9,709 1,990 46 100 .0 17 .2 17 .7 33 .8 31 .3 40 to 44 years . . . . . . . . . . . . . . . . . 10,516 1,998 44 100 .0 15 .1 18 .9 34 .9 31 .1 45 to 50 years . . . . . . . . . . . . . . . . . 13,145 1,982 39 100 .0 16 .8 18 .1 35 .1 30 .0
RACE AND HISPANIC ORIGINWhite alone15 to 50 years . . . . . . . . . . . . . . . . . . . 56,951 1,291 13 100 .0 41 .4 16 .6 23 .7 18 .4 15 to 19 years . . . . . . . . . . . . . . . . . 7,673 60 4 100 .0 95 .5 3 .3 0 .9 0 .3 20 to 24 years . . . . . . . . . . . . . . . . . 8,078 387 13 100 .0 73 .3 17 .2 7 .5 2 .0 25 to 29 years . . . . . . . . . . . . . . . . . 7,825 944 27 100 .0 50 .5 19 .7 19 .1 10 .7 30 to 34 years . . . . . . . . . . . . . . . . . 7,719 1,553 41 100 .0 27 .7 21 .4 29 .4 21 .5 35 to 39 years . . . . . . . . . . . . . . . . . 7,280 1,965 52 100 .0 16 .9 17 .8 34 .8 30 .5 40 to 44 years . . . . . . . . . . . . . . . . . 8,055 1,987 50 100 .0 15 .3 18 .5 34 .9 31 .3 45 to 50 years . . . . . . . . . . . . . . . . . 10,319 1,963 44 100 .0 17 .0 17 .5 35 .8 29 .7
White alone, non-Hispanic15 to 50 years . . . . . . . . . . . . . . . . . . . 44,445 1,216 14 100 .0 43 .0 16 .6 24 .0 16 .4 15 to 19 years . . . . . . . . . . . . . . . . . 5,728 41 4 100 .0 96 .9 2 .3 0 .7 0 .1 20 to 24 years . . . . . . . . . . . . . . . . . 6,157 328 14 100 .0 77 .4 14 .7 6 .1 1 .8 25 to 29 years . . . . . . . . . . . . . . . . . 5,984 803 27 100 .0 55 .5 19 .6 16 .9 8 .1 30 to 34 years . . . . . . . . . . . . . . . . . 5,899 1,424 44 100 .0 31 .3 21 .7 29 .1 18 .0 35 to 39 years . . . . . . . . . . . . . . . . . 5,571 1,831 56 100 .0 19 .1 19 .1 35 .5 26 .3 40 to 44 years . . . . . . . . . . . . . . . . . 6,472 1,884 53 100 .0 16 .4 19 .2 36 .6 27 .8 45 to 50 years . . . . . . . . . . . . . . . . . 8,633 1,878 46 100 .0 17 .6 18 .2 36 .6 27 .6
Black alone15 to 50 years . . . . . . . . . . . . . . . . . . . 10,949 1,408 32 100 .0 38 .6 19 .9 20 .2 21 .3 15 to 19 years . . . . . . . . . . . . . . . . . 1,634 90 12 100 .0 92 .4 6 .5 0 .8 0 .3 20 to 24 years . . . . . . . . . . . . . . . . . 1,739 645 42 100 .0 57 .6 24 .1 14 .9 3 .4 25 to 29 years . . . . . . . . . . . . . . . . . 1,507 1,163 73 100 .0 38 .5 29 .7 17 .1 14 .7 30 to 34 years . . . . . . . . . . . . . . . . . 1,485 1,846 109 100 .0 25 .1 21 .3 24 .5 29 .1 35 to 39 years . . . . . . . . . . . . . . . . . 1,374 2,199 133 100 .0 19 .5 15 .4 25 .2 40 .0 40 to 44 years . . . . . . . . . . . . . . . . . 1,447 2,072 123 100 .0 15 .4 20 .8 30 .0 33 .9 45 to 50 years . . . . . . . . . . . . . . . . . 1,763 2,064 111 100 .0 15 .5 21 .3 30 .6 32 .6
Asian alone15 to 50 years . . . . . . . . . . . . . . . . . . . 4,549 1,091 40 100 .0 46 .1 17 .6 24 .9 11 .5 15 to 19 years . . . . . . . . . . . . . . . . . 464 53 16 100 .0 98 .4 Z 0 .9 0 .7 20 to 24 years . . . . . . . . . . . . . . . . . 591 176 29 100 .0 89 .9 5 .2 3 .5 1 .5 25 to 29 years . . . . . . . . . . . . . . . . . 689 477 53 100 .0 65 .9 23 .5 8 .1 2 .5 30 to 34 years . . . . . . . . . . . . . . . . . 728 1,040 95 100 .0 42 .1 23 .7 24 .9 9 .3 35 to 39 years . . . . . . . . . . . . . . . . . 670 1,566 141 100 .0 20 .4 25 .3 40 .2 14 .1 40 to 44 years . . . . . . . . . . . . . . . . . 708 1,935 165 100 .0 13 .3 19 .5 43 .9 23 .4 45 to 50 years . . . . . . . . . . . . . . . . . 701 1,901 163 100 .0 16 .8 18 .2 41 .4 23 .6
See notes at end of table .

4 U.S. Census Bureau
Table 1. Children Ever Born Per 1,000 Women 15 to 50 Years Old by Age, Race, and Hispanic Origin: June 2012—Con.(Numbers in thousands)
Characteristic Number of
women
Children ever born per 1,000
women Margin of
Error1
Percent distribution of women by number of children ever born2
Total None One child
Two children
Three or more children
RACE AND HISPANIC ORIGIN—Con .
Hispanic (any race)15 to 50 years . . . . . . . . . . . . . . . . . . . 14,068 1,546 30 100 .0 35 .3 17 .2 22 .2 25 .2 15 to 19 years . . . . . . . . . . . . . . . . . 2,205 128 13 100 .0 90 .4 7 .5 1 .3 0 .8 20 to 24 years . . . . . . . . . . . . . . . . . 2,158 589 35 100 .0 60 .2 25 .0 12 .0 2 .8 25 to 29 years . . . . . . . . . . . . . . . . . 2,040 1,384 72 100 .0 34 .1 22 .1 25 .0 18 .9 30 to 34 years . . . . . . . . . . . . . . . . . 2,045 1,947 98 100 .0 16 .2 21 .4 30 .0 32 .4 35 to 39 years . . . . . . . . . . . . . . . . . 1,936 2,404 121 100 .0 9 .4 13 .8 32 .2 44 .7 40 to 44 years . . . . . . . . . . . . . . . . . 1,790 2,389 125 100 .0 10 .9 15 .5 28 .7 44 .9 45 to 50 years . . . . . . . . . . . . . . . . . 1,894 2,356 120 100 .0 14 .3 15 .3 30 .7 39 .7
Z Represents or rounds to zero .1 This number, when added to or subtracted from the estimate, represents the 90 percent confidence interval around the estimate . 2 The denominator for each of these percentages is the total number of women in the given age and race/ethnicity category . The numerator is the number of
women in that age and race/ethnicity category who have the given number of children . These percentages describe the fertility patterns of a given group of women . Across the line, the percentages will sum to 100 percent .
Source: U .S . Census Bureau, Current Population Survey, June 2012 .
U.S. Census Bureau 5
Completed Fertility
Completed fertility refers to the number of children that a woman has given birth to when she reaches the end of her childbear-ing years. This information is used to examine trends in family size and patterns of childbearing. Many of the women in the CPS sample are still in their childbearing years and may have more children in the future. However, women over 40 are unlikely to have more chil-dren, and so their data are used to
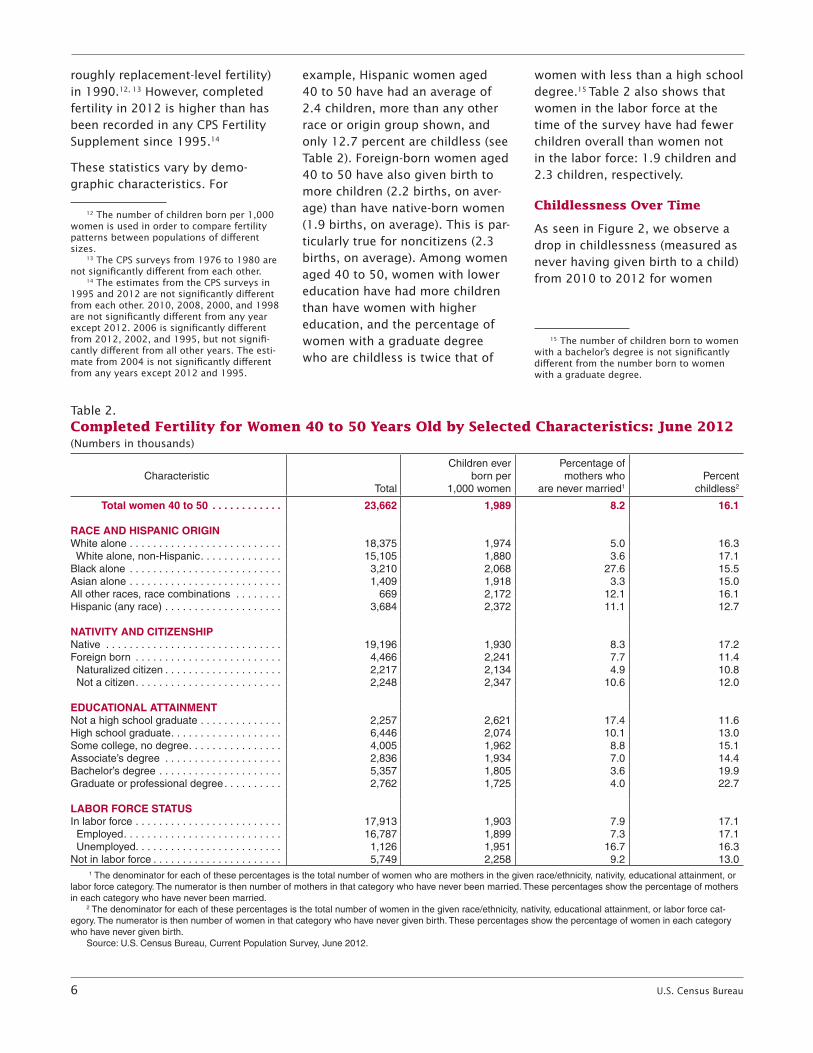
measure completed fertility.10 Table 2 shows key fertility indicators for the 23.7 million women aged 40 to 50. On average, women aged 40 to 50 have had about two children each, and 16.1 percent are child-less. Of those who are mothers, 8.2 percent have never been married.
10 According to the 2012 ACS data, only 7.1 percent of births in the past year were to women over 40 (see Table 3; this number is obtained by adding the percentage of all births for women 40 to 44 years old and the percentage of all births for women 45 to 50 years old). Given this, we presume that the data about these women in the CPS represent completed fertility.
Looking at completed fertility over time for women aged 40 to 44 shows how women’s childbearing has changed (see Figure 1).11 For example, the average total number of children born fell from about three children per woman (3,091 children per 1,000 women) in 1976 to about two children per woman (2,045 children per 1,000 women,
11 Prior to 2012, the CPS only collected fertility information for women up to age 44, so historical trends are examined using the population of women aged 40 to 44 in each survey.
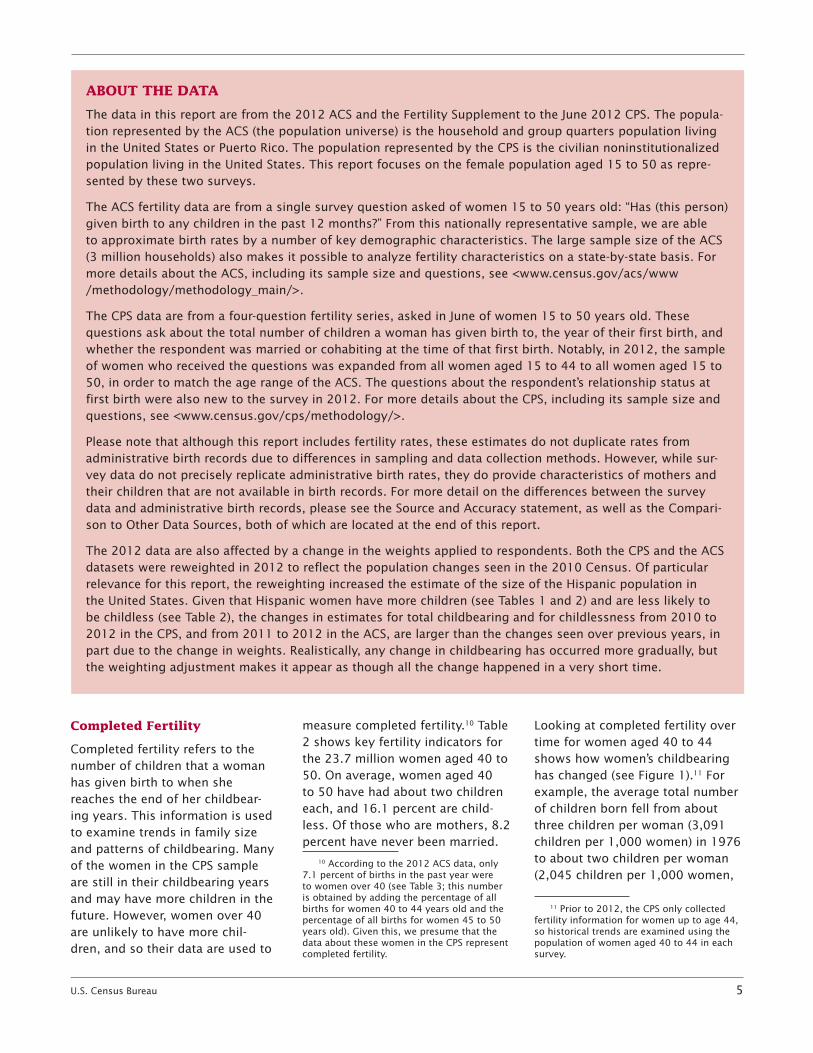
ABOUT THE DATA
The data in this report are from the 2012 ACS and the Fertility Supplement to the June 2012 CPS. The popula-tion represented by the ACS (the population universe) is the household and group quarters population living in the United States or Puerto Rico. The population represented by the CPS is the civilian noninstitutionalized population living in the United States. This report focuses on the female population aged 15 to 50 as repre-sented by these two surveys.
The ACS fertility data are from a single survey question asked of women 15 to 50 years old: “Has (this person) given birth to any children in the past 12 months?” From this nationally representative sample, we are able to approximate birth rates by a number of key demographic characteristics. The large sample size of the ACS (3 million households) also makes it possible to analyze fertility characteristics on a state-by-state basis. For more details about the ACS, including its sample size and questions, see <www.census.gov/acs/www /methodology/methodology_main/>.
The CPS data are from a four-question fertility series, asked in June of women 15 to 50 years old. These questions ask about the total number of children a woman has given birth to, the year of their first birth, and whether the respondent was married or cohabiting at the time of that first birth. Notably, in 2012, the sample of women who received the questions was expanded from all women aged 15 to 44 to all women aged 15 to 50, in order to match the age range of the ACS. The questions about the respondent’s relationship status at first birth were also new to the survey in 2012. For more details about the CPS, including its sample size and questions, see <www.census.gov/cps/methodology/>.
Please note that although this report includes fertility rates, these estimates do not duplicate rates from administrative birth records due to differences in sampling and data collection methods. However, while sur-vey data do not precisely replicate administrative birth rates, they do provide characteristics of mothers and their children that are not available in birth records. For more detail on the differences between the survey data and administrative birth records, please see the Source and Accuracy statement, as well as the Compari-son to Other Data Sources, both of which are located at the end of this report.
The 2012 data are also affected by a change in the weights applied to respondents. Both the CPS and the ACS datasets were reweighted in 2012 to reflect the population changes seen in the 2010 Census. Of particular relevance for this report, the reweighting increased the estimate of the size of the Hispanic population in the United States. Given that Hispanic women have more children (see Tables 1 and 2) and are less likely to be childless (see Table 2), the changes in estimates for total childbearing and for childlessness from 2010 to 2012 in the CPS, and from 2011 to 2012 in the ACS, are larger than the changes seen over previous years, in part due to the change in weights. Realistically, any change in childbearing has occurred more gradually, but theweightingadjustmentmakesitappearasthoughallthechangehappenedinaveryshorttime.
6 U.S. Census Bureau
roughly replacement-level fertility) in 1990.12, 13 However, completed fertility in 2012 is higher than has been recorded in any CPS Fertility Supplement since 1995.14
These statistics vary by demo-graphic characteristics. For
12 The number of children born per 1,000 women is used in order to compare fertility patterns between populations of different sizes.
13 The CPS surveys from 1976 to 1980 are not significantly different from each other.
14 The estimates from the CPS surveys in 1995 and 2012 are not significantly different from each other. 2010, 2008, 2000, and 1998 are not significantly different from any year except 2012. 2006 is significantly different from 2012, 2002, and 1995, but not signifi-cantly different from all other years. The esti-mate from 2004 is not significantly different from any years except 2012 and 1995.
example, Hispanic women aged 40 to 50 have had an average of 2.4 children, more than any other race or origin group shown, and only 12.7 percent are childless (see Table 2). Foreign-born women aged 40 to 50 have also given birth to more children (2.2 births, on aver-age) than have native-born women (1.9 births, on average). This is par-ticularly true for noncitizens (2.3 births, on average). Among women aged 40 to 50, women with lower education have had more children than have women with higher education, and the percentage of women with a graduate degree who are childless is twice that of
women with less than a high school degree.15 Table 2 also shows that women in the labor force at the time of the survey have had fewer children overall than women not in the labor force: 1.9 children and 2.3 children, respectively.
Childlessness Over Time
As seen in Figure 2, we observe a drop in childlessness (measured as never having given birth to a child) from 2010 to 2012 for women
15 The number of children born to women with a bachelor’s degree is not significantly different from the number born to women with a graduate degree.
Table 2.Completed Fertility for Women 40 to 50 Years Old by Selected Characteristics: June 2012(Numbers in thousands)
Characteristic Total
Children ever born per
1,000 women
Percentage of mothers who
are never married1 Percent
childless2
Total women 40 to 50 . . . . . . . . . . . . 23,662 1,989 8 .2 16 .1
RACE AND HISPANIC ORIGINWhite alone . . . . . . . . . . . . . . . . . . . . . . . . . . 18,375 1,974 5 .0 16 .3 White alone, non-Hispanic . . . . . . . . . . . . . . 15,105 1,880 3 .6 17 .1 Black alone . . . . . . . . . . . . . . . . . . . . . . . . . . 3,210 2,068 27 .6 15 .5 Asian alone . . . . . . . . . . . . . . . . . . . . . . . . . . 1,409 1,918 3 .3 15 .0 All other races, race combinations . . . . . . . . 669 2,172 12 .1 16 .1 Hispanic (any race) . . . . . . . . . . . . . . . . . . . . 3,684 2,372 11 .1 12 .7
NATIVITY AND CITIZENSHIPNative . . . . . . . . . . . . . . . . . . . . . . . . . . . . . . 19,196 1,930 8 .3 17 .2 Foreign born . . . . . . . . . . . . . . . . . . . . . . . . . 4,466 2,241 7 .7 11 .4 Naturalized citizen . . . . . . . . . . . . . . . . . . . . 2,217 2,134 4 .9 10 .8 Not a citizen . . . . . . . . . . . . . . . . . . . . . . . . . 2,248 2,347 10 .6 12 .0
EDUCATIONAL ATTAINMENTNot a high school graduate . . . . . . . . . . . . . . 2,257 2,621 17 .4 11 .6 High school graduate . . . . . . . . . . . . . . . . . . . 6,446 2,074 10 .1 13 .0 Some college, no degree . . . . . . . . . . . . . . . . 4,005 1,962 8 .8 15 .1 Associate’s degree . . . . . . . . . . . . . . . . . . . . 2,836 1,934 7 .0 14 .4 Bachelor’s degree . . . . . . . . . . . . . . . . . . . . . 5,357 1,805 3 .6 19 .9 Graduate or professional degree . . . . . . . . . . 2,762 1,725 4 .0 22 .7
LABOR FORCE STATUSIn labor force . . . . . . . . . . . . . . . . . . . . . . . . . 17,913 1,903 7 .9 17 .1 Employed . . . . . . . . . . . . . . . . . . . . . . . . . . . 16,787 1,899 7 .3 17 .1 Unemployed . . . . . . . . . . . . . . . . . . . . . . . . . 1,126 1,951 16 .7 16 .3 Not in labor force . . . . . . . . . . . . . . . . . . . . . . 5,749 2,258 9 .2 13 .0
1 The denominator for each of these percentages is the total number of women who are mothers in the given race/ethnicity, nativity, educational attainment, or labor force category . The numerator is then number of mothers in that category who have never been married . These percentages show the percentage of mothers in each category who have never been married .
2 The denominator for each of these percentages is the total number of women in the given race/ethnicity, nativity, educational attainment, or labor force cat-egory . The numerator is then number of women in that category who have never given birth . These percentages show the percentage of women in each category who have never given birth .
Source: U .S . Census Bureau, Current Population Survey, June 2012 .
U.S. Census Bureau 7
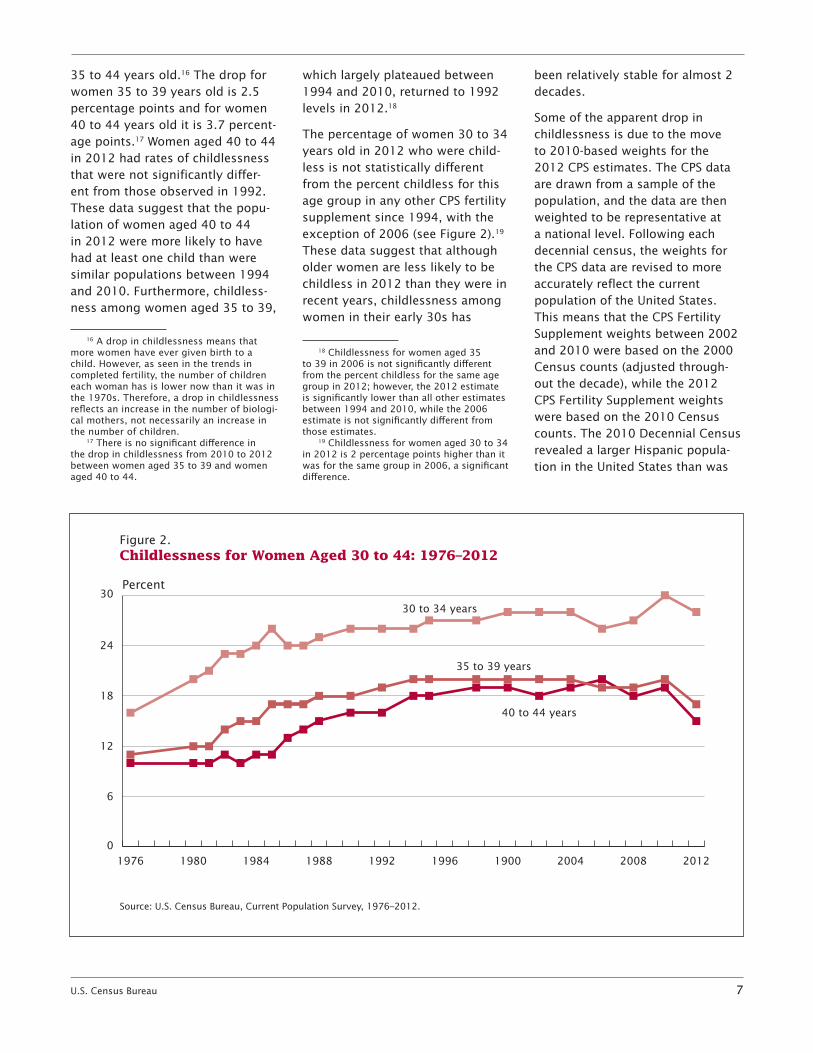
Figure 2.Childlessness for Women Aged 30 to 44: 1976–2012
Source: U.S. Census Bureau, Current Population Survey, 1976–2012.
Percent
5
10
15
20
25
30
201228240096928884801976
0
6
12
18
24
30
2012200820041900199619921988198419801976
40 to 44 years
35 to 39 years
30 to 34 years
5
10
15
20
25
30
2012200820041900199619921988198419801976
35 to 44 years old.16 The drop for women 35 to 39 years old is 2.5 percentage points and for women 40 to 44 years old it is 3.7 percent-age points.17 Women aged 40 to 44 in 2012 had rates of childlessness that were not significantly differ-ent from those observed in 1992. These data suggest that the popu-lation of women aged 40 to 44 in 2012 were more likely to have had at least one child than were similar populations between 1994 and 2010. Furthermore, childless-ness among women aged 35 to 39,
16 A drop in childlessness means that more women have ever given birth to a child. However, as seen in the trends in completed fertility, the number of children each woman has is lower now than it was in the 1970s. Therefore, a drop in childlessness reflects an increase in the number of biologi-cal mothers, not necessarily an increase in the number of children.
17 There is no significant difference in the drop in childlessness from 2010 to 2012 between women aged 35 to 39 and women aged 40 to 44.
which largely plateaued between 1994 and 2010, returned to 1992 levels in 2012.18
The percentage of women 30 to 34 years old in 2012 who were child-less is not statistically different from the percent childless for this age group in any other CPS fertility supplement since 1994, with the exception of 2006 (see Figure 2).19 These data suggest that although older women are less likely to be childless in 2012 than they were in recent years, childlessness among women in their early 30s has
18 Childlessness for women aged 35 to 39 in 2006 is not significantly different from the percent childless for the same age group in 2012; however, the 2012 estimate is significantly lower than all other estimates between 1994 and 2010, while the 2006 estimate is not significantly different from those estimates.
19 Childlessness for women aged 30 to 34 in 2012 is 2 percentage points higher than it was for the same group in 2006, a significant difference.
been relatively stable for almost 2 decades.
Some of the apparent drop in childlessness is due to the move to 2010-based weights for the 2012 CPS estimates. The CPS data are drawn from a sample of the population, and the data are then weighted to be representative at a national level. Following each decennial census, the weights for the CPS data are revised to more accurately reflect the current population of the United States. This means that the CPS Fertility Supplement weights between 2002 and 2010 were based on the 2000 Censuscounts(adjustedthrough-out the decade), while the 2012 CPS Fertility Supplement weights were based on the 2010 Census counts. The 2010 Decennial Census revealed a larger Hispanic popula-tion in the United States than was

8 U.S. Census Bureau
estimated for 2010 using the 2000-based weights. As Hispanic women are more likely to be mothers than are non-Hispanic women (see Tables 1 and 2), the new 2010-based weights are likely responsible for at least some of the decline in the percentage of childless women. However, when White, non-Hispanic women(whomakeupthemajorityof women aged 15 to 50) are con-sidered by themselves, we still see a significant decline in childlessness between 2010 and 2012 for women aged 35 to 44.20 This suggests that the drop in childlessness between 2010 and 2012 is not due solely to the switch to 2010-based weights.21
BIRTHS IN THE PAST YEAR
We use the ACS question about births in the past 12 months to examine characteristics of women who have had a birth in the prior year, as well as national- and state-level patterns for the same.
Table 3 shows that, of the more than 76 million women22 in the United States who were aged 15 to 50 in 2012, 4.1 million (5.4 per-cent) reported experiencing a birth in the previous 12 months. Propor-tionally, the fewest births were to women aged 45 to 50 (2.3 percent).
Births per 1,000 women in a given year represent a crude birth rate.23 We observe the highest birth rates
20 This is a special calculation not shown in the figure.
21 We plan to investigate this further by applying 2010-based weights to the 2010 CPS Fertility Supplement data, which is currently weighted using 2000-based weights. We will compare the difference in estimates depend-ing on the weights used, which will allow us to quantify the magnitude of the observed change in childlessness that is simply due to the revised weights.
22 This number is slightly higher than the population reported based on CPS data because it includes the group quarters popu-lation, as well as differences in weighting. For more information, see “Accuracy of the Estimates.”
23 As stated in the section “Comparison to Other Data Sources,” these data will not match NCHS’s birth rates due to differences in sampling and data collection.
for women in their late 20s and early 30s—103.3 and 103.2 births per 1,000 women, respectively (see Table 3).24 The next highest birth rate is for women in their early 20s, at 79.1 births per 1,000 women. The lowest birth rates are observed for adolescent women and for women 40 and older.
More than 60 percent of women who reported a birth in the prior year were married at the time of the survey,25 while about 30 per-cent of the women with a birth in the previous 12 months reported that they had never been married (see Table 3). However, relative to their respective populations, mar-ried women were significantly more likely to report a birth in the prior year than were women who had never been married.
Fertility levels also differed for women of different racial back-grounds (see Table 3). The low-est fertility rate in 2012 was for non-Hispanic White women (49 births per 1,000 women). The rate for Native Hawaiian or other Pacific Islanders was 79 births per 1,000 women. Black and Asian women both had a birth rate of 57 births per 1,000 women. American Indian or Alaska Native women had a birth rate of 66 births per 1,000 women.26
Nativity, Citizenship Status, and Hispanic Origin
Population growth is accomplished through immigration and fertility. In this section, fertility indicators are presented in terms of nativity, citi-zenship status, and Hispanic origin.
24 Birth rates for women aged 25 to 29 and women aged 30 to 34 are not signifi-cantly different.
25 We do not know if the marriage pre-ceded the birth, however, so we cannot say whether the births were to married women.
26 The fertility rate for American Indian or Alaska Native women is not significantly different from the rate for Native Hawaiian or other Pacific Islanders.
Based on ACS data in 2012, 21 percent of women 15 to 50 years old living in the United States who experienced a birth in the previous 12 months were born in another country (see Table 3). Approximately two-thirds of foreign-born women with a birth in the past year were not citizens of the United States (14.5 percent of all women with a birth in the 12 months prior to the survey). Overall, foreign-born women had birth rates of 68 births per 1,000 women, 17 births per 1,000 higher than that of native-born women (51 births per 1,000 women).
Hispanics are one of the fast-est growing groups in the United States.27, 28 According to the 2012 ACS data, Hispanic women aged 15 to 50 had 66 births per 1,000 women (see Table 3). Notably, more than half (52 percent) of the births to women of Hispanic descent were to women who were native-born citizens, while another 9 percent of the births to Hispanic women were to women who were naturalized citizens.29
Educational Attainment
Existing research suggests that women’s fertility decisions and educational attainment are inter-related. Research suggests that, for some women, early entry into motherhood may force them to leave school or prevent them from obtaining further education.30 In contrast, other research has shown that some women may delay childbearing in order to complete
27 Census Bureau Press Release, “Asians Fastest-Growing Race or Ethnic Group in 2012, Census Bureau Reports,” released June 13, 2013.
28 S.R. Ennis, M. Rios-Vargas, and N.C. Albert, “The Hispanic Population: 2010,” 2010 Census Briefs, C2010BR-04, U.S. Census Bureau, Washington, DC, 2011.
29 This is a special calculation not shown in the table.
30 Marni, 1984.

U.S. Census Bureau 9
Table 3.Women Who Had a Birth in the Past 12 Months Per 1,000 Women 15 to 50 Years Old by Selected Characteristics: 2012—Con. (Data based on sample. For information on confidentiality protection, sampling error, nonsampling error, and definitions, see www.census.gov/acs/www/)
Characteristic
Number of women Women who had a birth in the past 12 months
Total Percent distribution2 Births per
1,000 women
Estimate
Margin of error1
(±) Estimate
Margin of error1
(±) Estimate
Margin of error1
(±) Estimate
Margin of error1
(±)
Total . . . . . . . . . . . . . . . . . . . . . . . . 76,187,270 33,162 4,125,353 34,597 100 .0 X 54 .1 0 .5
AGE 15 to 19 years . . . . . . . . . . . . . . . . . . . . . . 10,504,417 25,569 224,867 7,746 5 .5 0 .2 21 .4 0 .7 20 to 24 years . . . . . . . . . . . . . . . . . . . . . . 10,964,399 19,784 867,363 17,615 21 .0 0 .4 79 .1 1 .6 25 to 29 years . . . . . . . . . . . . . . . . . . . . . . 10,487,164 13,555 1,083,239 17,055 26 .3 0 .4 103 .3 1 .6 30 to 34 years . . . . . . . . . . . . . . . . . . . . . . 10,401,742 11,091 1,073,091 18,163 26 .0 0 .4 103 .2 1 .7 35 to 39 years . . . . . . . . . . . . . . . . . . . . . . 9,813,118 35,792 584,180 12,139 14 .2 0 .3 59 .5 1 .2 40 to 44 years . . . . . . . . . . . . . . . . . . . . . . 10,616,865 35,444 199,729 7,036 4 .8 0 .2 18 .8 0 .7 45 to 50 years . . . . . . . . . . . . . . . . . . . . . . 13,399,565 26,447 92,884 4,924 2 .3 0 .1 6 .9 0 .4
MARITAL STATUSEver married . . . . . . . . . . . . . . . . . . . . . . . 41,771,205 71,671 2,835,170 27,346 68 .7 0 .4 67 .9 0 .6 Currently married . . . . . . . . . . . . . . . . . . . 32,044,246 90,893 2,547,653 25,875 61 .8 0 .4 79 .5 0 .7 Not currently married . . . . . . . . . . . . . . . . 9,726,959 51,330 287,517 9,565 7 .0 0 .2 29 .6 1 .0 Widowed . . . . . . . . . . . . . . . . . . . . . . . . 596,637 12,082 11,476 1,769 0 .3 0 .0 19 .2 2 .9 Divorced . . . . . . . . . . . . . . . . . . . . . . . . 6,982,428 40,613 182,317 7,944 4 .4 0 .2 26 .1 1 .1 Separated . . . . . . . . . . . . . . . . . . . . . . . 2,147,894 25,159 93,724 4,942 2 .3 0 .1 43 .6 2 .3 Never married . . . . . . . . . . . . . . . . . . . . . . 34,416,065 73,944 1,290,183 19,645 31 .3 0 .4 37 .5 0 .6
LIVING ARRANGEMENTSLiving in own household . . . . . . . . . . . . . . 48,809,085 88,289 3,153,869 28,955 76 .5 0 .4 64 .6 0 .6 Householder or spouse of householder . . 32,529,124 99,326 2,268,106 24,972 55 .0 0 .4 69 .7 0 .7 Householder or unmarried partner of householder . . . . . . . . . . . . . . . . . . . . . . 6,845,270 39,137 474,170 10,613 11 .5 0 .3 69 .3 1 .6 Householder with no spouse or partner present . . . . . . . . . . . . . . . . . . . . . . . . . . 9,434,691 39,594 411,593 10,467 10 .0 0 .2 43 .6 1 .1 Not living in own household . . . . . . . . . . . . 27,378,185 93,080 971,484 20,564 23 .5 0 .4 35 .5 0 .7 Living in a household unit . . . . . . . . . . . . 25,463,623 94,898 944,390 20,662 22 .9 0 .4 37 .1 0 .8 Living in group quarters . . . . . . . . . . . . . . 1,914,562 20,335 27,094 2,487 0 .7 0 .1 14 .2 1 .2
NATIVITY AND CITIZENSHIPNative . . . . . . . . . . . . . . . . . . . . . . . . . . . . 63,536,562 56,445 3,266,229 30,573 79 .2 0 .3 51 .4 0 .5 Foreign born . . . . . . . . . . . . . . . . . . . . . . . 12,650,708 46,698 859,124 15,633 20 .8 0 .3 67 .9 1 .2 Naturalized citizen . . . . . . . . . . . . . . . . . . 4,946,264 33,893 261,869 8,848 6 .3 0 .2 52 .9 1 .8 Not a citizen . . . . . . . . . . . . . . . . . . . . . . . 7,704,444 48,516 597,255 13,272 14 .5 0 .3 77 .5 1 .6
RACE AND HISPANIC ORIGINWhite alone . . . . . . . . . . . . . . . . . . . . . . . . 53,990,506 47,910 2,812,286 26,094 68 .2 0 .4 52 .1 0 .5 White alone, non-Hispanic . . . . . . . . . . . 44,790,429 19,435 2,206,855 22,673 53 .5 0 .4 49 .3 0 .5 Black alone . . . . . . . . . . . . . . . . . . . . . . . . 10,704,263 24,058 612,819 14,077 14 .9 0 .3 57 .3 1 .3 American Indian or Alaska Native alone . . . . . . . . . . . . . . . . . . . . . . . . . . . 662,889 9,581 43,599 2,451 1 .1 0 .1 65 .8 3 .6 Asian alone . . . . . . . . . . . . . . . . . . . . . . . . 4,544,112 15,964 259,018 8,987 6 .3 0 .2 57 .0 2 .0 Native Hawaiian and Other Pacific Islander alone . . . . . . . . . . . . . . . . . . . . 153,665 5,327 12,107 2,070 0 .3 0 .0 78 .8 13 .1 Some other race alone . . . . . . . . . . . . . . . 4,037,343 40,302 272,804 8,651 6 .6 0 .2 67 .6 2 .2 Two or more races . . . . . . . . . . . . . . . . . . . 2,094,492 27,111 112,720 5,179 2 .7 0 .1 53 .8 2 .4 Hispanic (any race) . . . . . . . . . . . . . . . . . . 14,102,302 13,446 931,798 15,379 22 .6 0 .3 66 .1 1 .1
EDUCATIONAL ATTAINMENTNot a high school graduate . . . . . . . . . . . . 13,559,177 50,560 634,956 15,781 15 .4 0 .4 46 .8 1 .1 High school degree . . . . . . . . . . . . . . . . . . 16,491,867 62,775 951,327 19,313 23 .1 0 .4 57 .7 1 .1 Some college or associate’s degree . . . . . 25,635,902 76,836 1,322,329 18,531 32 .1 0 .3 51 .6 0 .7 Bachelor’s degree . . . . . . . . . . . . . . . . . . . 13,863,148 57,137 778,838 14,858 18 .9 0 .3 56 .2 1 .1 Graduate or professional degree . . . . . . . . 6,637,176 42,371 437,903 11,030 10 .6 0 .3 66 .0 1 .6
See notes at end of table .
10 U.S. Census Bureau
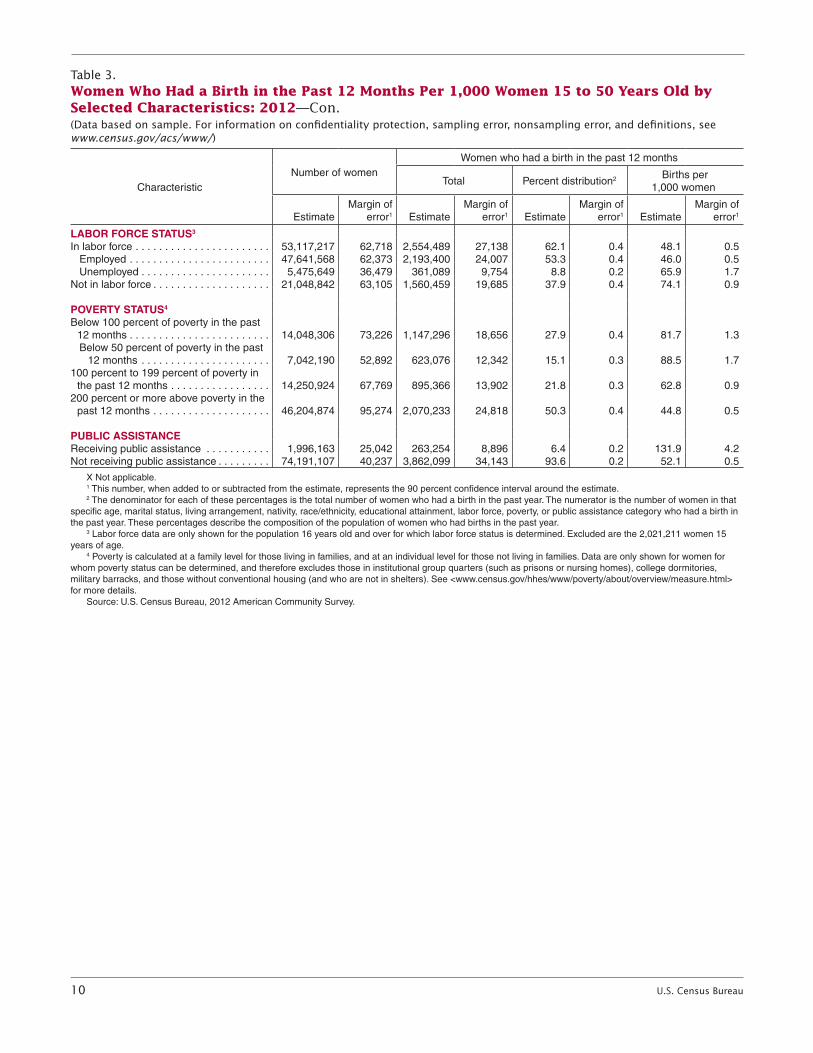
Table 3.Women Who Had a Birth in the Past 12 Months Per 1,000 Women 15 to 50 Years Old by Selected Characteristics: 2012—Con. (Data based on sample. For information on confidentiality protection, sampling error, nonsampling error, and definitions, see www.census.gov/acs/www/)
Characteristic Number of women
Women who had a birth in the past 12 months
Total Percent distribution2 Births per
1,000 women
Estimate Margin of
error1 Estimate Margin of
error1 Estimate Margin of
error1 Estimate Margin of
error1
LABOR FORCE STATUS3
In labor force . . . . . . . . . . . . . . . . . . . . . . . 53,117,217 62,718 2,554,489 27,138 62 .1 0 .4 48 .1 0 .5 Employed . . . . . . . . . . . . . . . . . . . . . . . . 47,641,568 62,373 2,193,400 24,007 53 .3 0 .4 46 .0 0 .5 Unemployed . . . . . . . . . . . . . . . . . . . . . . 5,475,649 36,479 361,089 9,754 8 .8 0 .2 65 .9 1 .7 Not in labor force . . . . . . . . . . . . . . . . . . . . 21,048,842 63,105 1,560,459 19,685 37 .9 0 .4 74 .1 0 .9
POVERTY STATUS4
Below 100 percent of poverty in the past 12 months . . . . . . . . . . . . . . . . . . . . . . . . 14,048,306 73,226 1,147,296 18,656 27 .9 0 .4 81 .7 1 .3
Below 50 percent of poverty in the past 12 months . . . . . . . . . . . . . . . . . . . . . . 7,042,190 52,892 623,076 12,342 15 .1 0 .3 88 .5 1 .7
100 percent to 199 percent of poverty in the past 12 months . . . . . . . . . . . . . . . . . 14,250,924 67,769 895,366 13,902 21 .8 0 .3 62 .8 0 .9
200 percent or more above poverty in the past 12 months . . . . . . . . . . . . . . . . . . . . 46,204,874 95,274 2,070,233 24,818 50 .3 0 .4 44 .8 0 .5
PUBLIC ASSISTANCEReceiving public assistance . . . . . . . . . . . 1,996,163 25,042 263,254 8,896 6 .4 0 .2 131 .9 4 .2 Not receiving public assistance . . . . . . . . . 74,191,107 40,237 3,862,099 34,143 93 .6 0 .2 52 .1 0 .5
X Not applicable .1 This number, when added to or subtracted from the estimate, represents the 90 percent confidence interval around the estimate . 2 The denominator for each of these percentages is the total number of women who had a birth in the past year . The numerator is the number of women in that
specific age, marital status, living arrangement, nativity, race/ethnicity, educational attainment, labor force, poverty, or public assistance category who had a birth in the past year . These percentages describe the composition of the population of women who had births in the past year .
3 Labor force data are only shown for the population 16 years old and over for which labor force status is determined . Excluded are the 2,021,211 women 15 years of age .
4 Poverty is calculated at a family level for those living in families, and at an individual level for those not living in families . Data are only shown for women for whom poverty status can be determined, and therefore excludes those in institutional group quarters (such as prisons or nursing homes), college dormitories, military barracks, and those without conventional housing (and who are not in shelters) . See <www .census .gov/hhes/www/poverty/about/overview/measure .html> for more details .
Source: U .S . Census Bureau, 2012 American Community Survey .

U.S. Census Bureau 11
more education.31, 32 Table 3 shows that about 32 percent of births in the prior year were to women with some college or an associate’s degree, more than any other group. Fifteen percent of births in the prior year were to women who did not have a high school degree.
Figure 3 shows births by current age and education in more detail. Adolescent birth rates were high-est among those with a high school diploma or GED.33 Some of this may be due to the fact that 71 percent of
31 Z. Wu and L. Macneill, “Education, Work, and Childbearing After Age 30,” Journal of Comparative Family Studies, 2002, 33(2): 191–213.
32 C. Amuedo-Dorantes and J. Kimmel, “The Motherhood Wage Gap for Women in the United States: The Importance of College and Fertility Delay,” Review of Economics of the Household, 2005, 3(1): 17–48.
33 Birth rates are not significantly different between 15 to 19 year olds with less than a high school degree, some college, or a bach-elor’s degree or more.
births to women in this age group were to women aged 18 or 19, who may have had a chance to finish high school prior to the birth.34
Among nonadolescent women, birth rates for women with less than a high school education peak in the early 20s and then fall across older ages (see Figure 3). In con-trast, women with a bachelor’s degree have the highest birth rate in their early 30s, reflecting the later entrance into motherhood among highly educated women.35
34 This is a special calculation not shown in the table.
35 For a review of the literature, see: M. Mills, R.R. Rindfuss, P. McDonald, et al., “Why do people postpone parenthood? Reasons and social policy incentives,” Human Reproduction Update, 2011, 17(6): 848–860.
Economic Portrait of Women With Recent Births
Looking at the economic circum-stances of women with recent births is important because research suggests that new moth-ers’ economic well-being and labor force attachment have long-term implications. For example, some have argued that time out of the labor force following childbirth puts mothers at a lifelong economic disadvantage when compared to nonmothers.36 From a different perspective, others have argued that the lack of universal maternity leave has meant that many women in the United States return to work soon after a birth, to the detriment of themselves and their newborns.37
36 Crittenden, 2001. 37 J.C. Gornick and M.K. Meyers, Families
That Work: Policies for Reconciling Parent-hood and Employment, Russell Sage Founda-tion, New York, NY, 2005.
Figure 3. Births in the Past 12 Months Per 1,000 Women 15 to 50 Years Old by Educational Attainment and Age: 2012(For information on confidentiality protection, sampling error, nonsampling error, and definitions, see www.census.gov/acs/www/)
Source: U.S. Census Bureau, 2012 American Community Survey.
Less than high school
High school graduate
Some college or associate’s degree
Bachelor’s degree or more
Births per 1,000 women
0
25
50
75
100
125
150
175
200
45–5040–4435–3930–3425–2920–2415–19
Age at time of interview

12 U.S. Census Bureau
Still others have noted that the economic circumstances into which a child is born influence that child’s cognitive development and future education and employment out-comes.38, 39 The following section details the economic circumstances of mothers who had a birth in the past year, including their rates of labor force participation, poverty, and public assistance receipt.
In 2012, more than half of women with a birth in the previ-ous 12 months (62 percent) were in the labor force (see Table 3), unchanged from 2008, the year the Census Bureau last released
38 Redd, Karver, Murphy, et al., 2011. 39 Moore, Redd, Burkhauser, et al., 2009.
a report on women’s fertility.40
Fertility rates for women not in the labor force (74 births per 1,000 women) were considerably higher than those of employed women (46 births per 1,000).
Twenty eight percent of women with a birth in the prior year were living in poverty in 2012 (see Table 3), up from 25 percent in 2008. The fertility rate for women in poverty was 82 births per 1,000—higher than the fertility rate of those with incomes at 100 to 199 percent of poverty (63 births per 1,000) and almost twice as high as those with incomes at or above 200 percent of poverty (45 births per 1,000). In
40 J.L. Dye, “Fertility of American Women: 2008,” Current Population Reports, P20-563, U.S. Census Bureau, Washington, DC, 2010.
2012, about 6 percent of women with a birth in the prior year were receiving public assistance, unchanged from 2008.
Figure 4 shows the percentage of women with a birth in the prior year who were in poverty by state. Generally speaking, states with higher poverty levels had higher percentages of births to poor women, while states with lower poverty had rates of births to poor women that were below the national average.41 Mississippi and
41 For additional information on poverty in U.S. states, see the following: A. Bishaw, “Areas With Concentrated Poverty: 2006–2010,” American Community Survey Briefs, ACSBR/10-17, U.S. Census Bureau, Washington, DC, 2011, and A. Bishaw, “Pov-erty: 2000–2012,” American Community Sur-vey Briefs, ACSBR/12-01, U.S. Census Bureau, Washington, DC, 2013.
!!
!!
!!
!!
!!
!!
!
!
!
!
!
!
!
!
!
!
!
!
!
!
!
!!
TX
CA
MT
AZ
ID
NV
KS
CO
NM
OR
UT
SD
IL
WY
NEIA
FL
MN
OK
ND
WI
WA
GAAL
MO
PA
AR
LA
NC
MS
NY
IN
MI
VA
TN
KY
SC
OH
ME
WV
VT
NH
NJMD
MA
CT
DE
RI
DC
AK
HI
Source: U.S. Census Bureau, 2012 American Community Survey.
0 500 Miles
0 100 Miles
0 100 Miles
Statistical significance as compared to the national average
Significantly higher
No difference
Significantly lower
Percentage of Women (Aged 15 to 50) Who Had a Birth in the Past 12 Months Who Were in Poverty: 2012
Figure 4.
U.S. average is 28.1
Note: Data based on sample. For information on confidentiality protection, sampling error, nonsampling error, and definitions, see www.census.gov/acs/www/.Data for individual states can be found in Appendix Table A.
U.S. Census Bureau 13
Montana were among the states with the highest percentages of births to women in poverty, both around 40 percent. Connecticut and Utah were among the states with the lowest rates; 18 percent of women with a birth in the prior year in both of these states were in poverty (see Appendix Table A for the numbers for each state).
Residential Portrait of Women With Recent Births
The characteristics of families and households have become more diverse in recent years. For exam-ple, many have noted an increase in the number of Americans living in combined households since 2007, and within that, others have noted an increase in multigenerational
households.42, 43 Additionally, recent research suggests that nonmarital births are increasingly occurring to women in cohabiting relation-ships.44 The following section details the living arrangements of women who gave birth in the year prior to the survey.
42 Combined households are defined as households that include at least one addi-tional adult (over 18 and not in school) who is neither the householder nor the spouse or cohabiting partner of the householder; see L. Mykyta and S. Macartney, “The Effects of Recession on Household Composition: Dou-bling Up and Economic Well-Being,” SEHSD Working Paper #2011-4, U.S. Census Bureau, Washington, DC, 2011.
43 D.A. Lofquist, “Multigenerational House-holds: 2009–2011,” American Community Survey Brief, ACSBR/11-03, U.S. Census Bureau, Washington, DC, 2012.
44 A. Chandra, G.M. Martinez, W.D. Mosher, et al., “Fertility, Family Planning, and Repro-ductive Health of U.S. Women: Data From the 2002 National Survey of Family Growth,” National Center for Health Statistics, Vital Health Statistics, 2005, 23(25).
In 2012, more than three-quarters of women with a birth in the previ-ous 12 months reported that they were living in their own home; 55 percent were either a married householder or the spouse of the householder (see Table 3).45 Twelve percent were in a cohabiting rela-tionship, and 10 percent did not have a spouse or partner present.
Notably, more than one in five women with a birth in the previous 12 months reported that they were living in someone else’s home at the time of the survey (see Table 3). Most (70 percent) of the women with recent births who lived in someone else’s home were the child of the householder; that is, the
45 The “householder” is the person in whose name the home is owned or rented.
!!
!!
!!
!!
!!
!!
!
!
!
!
!
!
!
!
!
!
!
!
!
!
!
!!
TX
CA
MT
AZ
ID
NV
KS
CO
NM
OR
UT
SD
IL
WY
NEIA
FL
MN
OK
ND
WI
WA
GAAL
MO
PA
AR
LA
NC
MS
NY
IN
MI
VA
TN
KY
SC
OH
ME
WV
VT
NH
NJMD
MA
CT
DE
RI
DC
AK
HI
0 500 Miles
0 100 Miles
0 100 Miles
Statistical significance as compared to the national average
Significantly higher
No difference
Significantly lower
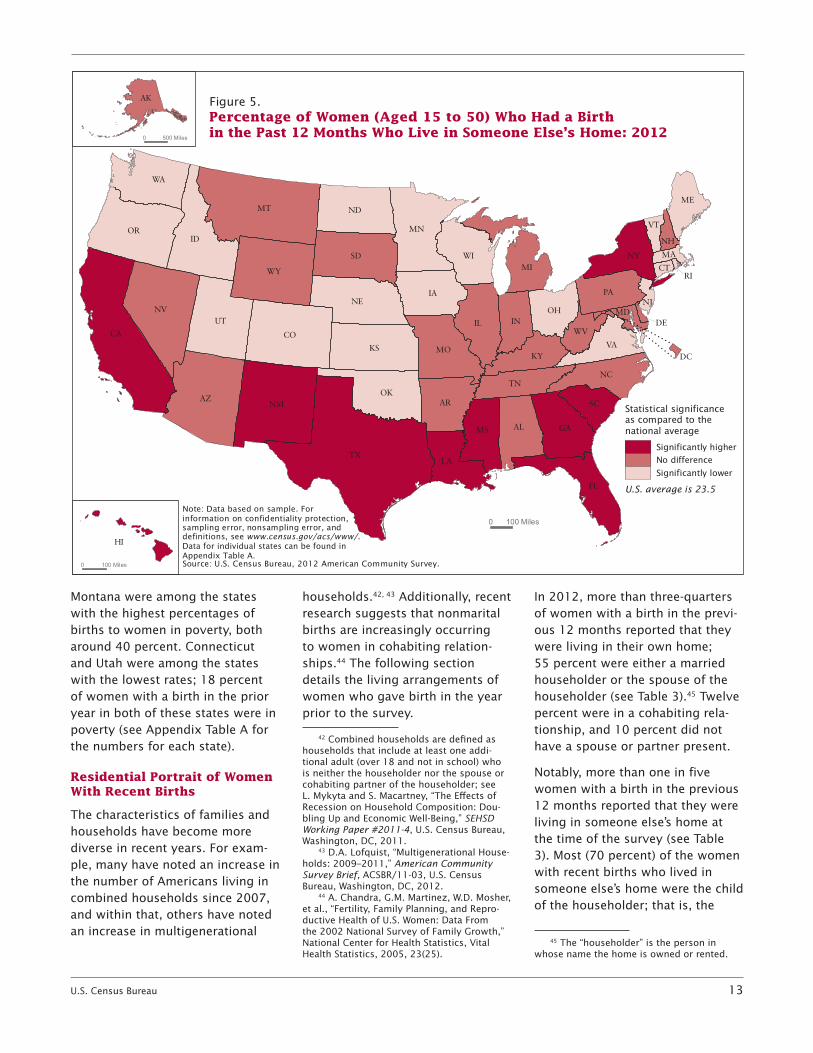
Percentage of Women (Aged 15 to 50) Who Had a Birth in the Past 12 Months Who Live in Someone Else’s Home: 2012
Figure 5.
U.S. average is 23.5
Source: U.S. Census Bureau, 2012 American Community Survey.
Note: Data based on sample. For information on confidentiality protection, sampling error, nonsampling error, and definitions, see www.census.gov/acs/www/.Data for individual states can be found in Appendix Table A.
14 U.S. Census Bureau
daughter of the person who owns or rents the home.46
Figure 5 shows the states in which women with a recent birth were more or less likely to live in some-one else’s home. It shows a con-centration of higher than average numbers of new mothers living in someone else’s home in states in the South, as well as higher than average levels of shared households in California and New York, states with high costs of housing.47 When Figure 5 is compared to a map of multigenerational households (households in which at least three generations live together), many of the same states stand out, sug-gesting that these two trends have significant geographic overlap.48
Births to Young Women
Vital Statistics data show that births to adolescents are currently at his-toric lows, having been more than halved since 1991.49 CPS data reflect this decline since 2008, as demon-strated by the rise in childlessness among women aged 15 to 19 from 93.7 percent in 2008 to 94.9 per-cent in 2012 (see Table 1).50
However, recent research shows that adolescent parenthood con-tinues to be linked to poverty, low academic achievement, and familial instability.51, 52 Additional evidence suggests that many of the negative
46 This is a special calculation not shown in the table.
47 Calculated from table S2506 ACS 2012 1-year estimates on American FactFinder.
48 For a map of the prevalence of shared households, see Figure 3 of S. Macartney and L. Mykyta, “Poverty and Shared Households by State: 2011,” American Community Survey Brief, ACSBR/11-05: U.S. Census Bureau, Washington, DC, 2012.
49 Martin, et al., 2013. 50 See Table 1 of Dye, 2010.51 S.D. Hoffman and R.A. Maynard, (eds.),
Kids Having Kids: Economic Costs and Social Consequences of Teen Pregnancy, 2nd Edition, Urban Institute Press, Washington, DC, 2008.
52 E. Terry-Humen, J. Manlove, and K.A. Moore, “Playing Catch-Up: How Children Born to Teen Mothers Fare,” National Cam-paign to Prevent Teen Pregnancy, Washington, DC, 2005.
repercussions of adolescent preg-nancy are also present for women who become mothers in their early 20s.53 The reasons offered for the persistence of poor outcomes, even for young mothers who are not adolescents, are varied, including high rates of unintended pregnancy among young women, as well as lower educational attainment, high rates of nonmarital births, and lower levels of workforce attachment on the part of young mothers. 54, 55, 56, 57
Neither the ACS nor the CPS can be used to examine the long-term effects of women giving birth when they are young. However, in light of concerns about early entry into motherhood, these data can offer more information about the popula-tion of young women (women aged 15 to 22) who have experienced a recent birth.
Out of the roughly 17 million women aged 15 to 22 in 2012, about 727 thousand (4 percent) reported a birth in the past year (see Table 4), constituting 18 percent of all births in the previous 12months.Thevastmajorityofwomen aged 15 to 22 who experi-enced a birth in the prior year were never married (73 percent). Of the 27 percent who reported being ever married, most were married at the time of the survey. Forty
53 J. Manlove, E. Terry-Humen, L. Mincielli, et al., “Outcomes Among Children of Teen Mothers at Kindergarten Entry and Through Adolescence: Analyses of Recent Data,” Invited chapter in R. Maynard, and S. Hoffman, (eds.), Kids Having Kids: Economic Costs and Social Consequences of Teen Pregnancy, 2nd edition, Urban Institute Press, Washington, DC, 2009.
54 L.B. Finer and S.K. Henshaw, “Dispari-ties in Rates of Unintended Pregnancy in the United States, 1994 and 2001,” Perspectives on Sexual and Reproductive Health, 2006, 38(2): 90–96.
55 K. Perper, K. Peterson, and J. Manlove, “Child Trends Fact Sheet: Diploma Attain- ment Among Teen Mothers,” Child Trends, Washington, DC, 2010.
56 S.J. Ventura and C.A. Bachrach, “Non-marital Childbearing in the United States, 1940–99,” National Vital Statistics Reports, 48(16), National Center for Health Statistics, Hyattsville, MD, 2000.
57 Miller, 2009.
percent of the women aged 15 to 22 who had a birth in the prior year reported living in their own households; 16 percent were living with a spouse, another 14 percent were cohabiting, and 9 percent did not have a spouse or partner in the household. However, 60 percent of young women with a birth in the prior year lived in someone else’s home, three out of four of whom were living with their own parent or parents.58
Ninety percent of women aged 15 to 22 who had a birth in the prior year were native born, while another 2 percent were natural-ized citizens (see Table 4). White women comprise the largest group of young women with a birth in the past year (61 percent); 29 percent of young women with a birth in the past year were Hispanic (regard-less of race), while 23 percent were Black, and one percent were Asian.
Although not all women in this age group who had a birth in the prior year were old enough to have completed a college degree or, in some cases, even high school, themajority(91percent)were18years old or older. 59 Therefore, given the age distribution, it is not surprising that 69 percent had a high school degree or more and one-third reported some college (see Table 4). Fifty-four percent of young women with a birth in the past year were in the labor force,60 while 37 percent were employed at the time of the survey.
While only 10 percent of young mothers who gave birth in the prior year received public assistance,
58 The proportion living with parents is a special calculation using the population of young women who were not living in their own household but were living in a house-hold unit.
59 This is a special calculation not shown in the table.
60 This estimate includes those employed and working, employed but on maternity leave, and those who are not employed but are looking for work.

U.S. Census Bureau 15
Table 4.Young Women (Aged 15 to 22) Who Had a Birth in the Past 12 Months by Selected Characteristics: 2012 (Data based on sample. For information on confidentiality protection, sampling error, nonsampling error, and definitions, see www.census.gov/acs/www/)
Characteristic Number of women
Women 15 to 22 who had a birth in the past 12 months
Total Percent distribution2
Estimate Margin of
error1 Estimate Margin of
error1 Estimate Margin of
error1
Total . . . . . . . . . . . . . . . . . . . . . . . . . . . . . . . . . . . . . . . . 17,362,834 45,889 727,069 16,639 100 .0 X
MARITAL STATUSEver married . . . . . . . . . . . . . . . . . . . . . . . . . . . . . . . . . . . . . . . 888,944 15,402 193,407 7,671 26 .6 0 .9 Currently married . . . . . . . . . . . . . . . . . . . . . . . . . . . . . . . . . . 779,763 13,603 175,153 7,409 24 .1 0 .9 Not currently married . . . . . . . . . . . . . . . . . . . . . . . . . . . . . . . 109,181 6,305 18,254 2,259 2 .5 0 .3 Never married . . . . . . . . . . . . . . . . . . . . . . . . . . . . . . . . . . . . . . 16,473,890 48,676 533,662 13,848 73 .4 0 .9
LIVING ARRANGEMENTSLiving in own household . . . . . . . . . . . . . . . . . . . . . . . . . . . . . . 1,998,209 23,806 288,053 10,098 39 .6 1 .0 Householder or spouse of householder . . . . . . . . . . . . . . . . . 716,385 15,447 116,554 5,934 16 .0 0 .7 Householder or unmarried partner of householder . . . . . . . . 646,822 14,650 105,035 6,055 14 .4 0 .7 Householder with no spouse or partner present . . . . . . . . . . 635,002 11,331 66,464 4,453 9 .1 0 .6 Not living in own household . . . . . . . . . . . . . . . . . . . . . . . . . . . . 15,364,625 49,442 439,016 11,922 60 .4 1 .0 Living in a household unit . . . . . . . . . . . . . . . . . . . . . . . . . . . 13,887,405 47,776 429,089 11,782 59 .0 1 .0 Living in group quarters . . . . . . . . . . . . . . . . . . . . . . . . . . . . . 1,477,220 15,139 9,927 1,594 1 .4 0 .2
NATIVITY AND CITIZENSHIPNative . . . . . . . . . . . . . . . . . . . . . . . . . . . . . . . . . . . . . . . . . . . . 15,981,513 44,156 654,490 15,675 90 .0 0 .6 Foreign born . . . . . . . . . . . . . . . . . . . . . . . . . . . . . . . . . . . . . . . 1,381,321 21,190 72,579 4,943 10 .0 0 .6 Naturalized citizen . . . . . . . . . . . . . . . . . . . . . . . . . . . . . . . . . . 367,998 10,393 10,971 2,070 1 .5 0 .3 Not a citizen . . . . . . . . . . . . . . . . . . . . . . . . . . . . . . . . . . . . . . . 1,013,323 19,169 61,608 4,484 8 .5 0 .6
RACE AND HISPANIC ORIGINWhite alone . . . . . . . . . . . . . . . . . . . . . . . . . . . . . . . . . . . . . . . . 11,953,843 32,534 443,859 11,987 61 .0 1 .0 White alone, non-Hispanic . . . . . . . . . . . . . . . . . . . . . . . . . . 9,651,172 24,350 309,352 9,736 42 .5 0 .9 Black alone . . . . . . . . . . . . . . . . . . . . . . . . . . . . . . . . . . . . . . . . 2,652,621 19,055 166,317 8,161 22 .9 1 .0 Asian alone . . . . . . . . . . . . . . . . . . . . . . . . . . . . . . . . . . . . . . . . 818,125 10,554 9,614 1,449 1 .3 0 .2 All other races, race combinations . . . . . . . . . . . . . . . . . . . . . . 1,938,245 23,191 107,279 5,626 14 .8 0 .7 Hispanic (any race) . . . . . . . . . . . . . . . . . . . . . . . . . . . . . . . . . . 3,590,221 17,088 213,004 7,739 29 .3 0 .8
EDUCATIONAL ATTAINMENTNot a high school graduate . . . . . . . . . . . . . . . . . . . . . . . . . . . . 7,470,791 26,446 225,579 8,434 31 .0 1 .0 High school graduate . . . . . . . . . . . . . . . . . . . . . . . . . . . . . . . . . 3,295,535 27,406 259,302 10,182 35 .7 1 .1 Some college or associate’s degree . . . . . . . . . . . . . . . . . . . . . 6,083,986 37,552 234,808 8,588 32 .3 0 .9 Bachelor’s degree or higher . . . . . . . . . . . . . . . . . . . . . . . . . . . . 512,522 10,790 7,380 1,490 1 .0 0 .2
LABOR FORCE3
In labor force . . . . . . . . . . . . . . . . . . . . . . . . . . . . . . . . . . . . . . . 7,987,398 40,576 387,077 11,143 54 .0 0 .8 Employed . . . . . . . . . . . . . . . . . . . . . . . . . . . . . . . . . . . . . . . 6,422,713 36,081 264,631 9,986 36 .9 1 .0 Unemployed . . . . . . . . . . . . . . . . . . . . . . . . . . . . . . . . . . . . . 1,564,685 23,427 122,446 5,600 17 .1 0 .7 Not in labor force . . . . . . . . . . . . . . . . . . . . . . . . . . . . . . . . . . . . 7,354,225 36,010 329,587 9,576 46 .0 0 .8
POVERTY STATUS4
Below 100 percent of poverty in the past 12 months . . . . . . . . . 4,169,445 40,705 344,351 10,574 47 .7 0 .9 Below 50 percent of poverty in the past 12 months . . . . . . . 2,287,596 30,059 202,532 7,595 28 .1 0 .8 100 to 199 percent of poverty in the past 12 months . . . . . . . . 3,438,315 34,530 193,677 7,020 26 .8 0 .8 200 percent or more of poverty in the past 12 months . . . . . . . 8,332,610 41,762 183,432 8,090 25 .4 0 .9
PUBLIC ASSISTANCEReceiving public assistance . . . . . . . . . . . . . . . . . . . . . . . . . . . 246,389 7,721 72,858 5,024 10 .0 0 .7 Not receiving public assistance . . . . . . . . . . . . . . . . . . . . . . . . . 17,116,445 46,127 654,211 16,742 90 .0 0 .7
X Not applicable .1 This number, when added to or subtracted from the estimate, represents the 90 percent confidence interval around the estimate . 2 The denominator for each of these percentages is the total number of young women who had a birth in the past year . The numerator is the number of young
women in that specific marital status, living arrangement, nativity, race/ethnicity, educational attainment, labor force, poverty, or public assistance category who had a birth in the past year . These percentages describe the composition of the population of young women who had births in the past year .
3 Labor force data are only shown for the population 16 years old and over for which labor force status is determined . Excluded are the 2,021,211 women 15 years of age .
4 Poverty is calculated at a family level for those living in families, and at an individual level for those not living in families . Data are only shown for women for whom poverty status can be determined, and therefore excludes those in institutional group quarters (such as prisons or nursing homes), college dormitories, military barracks, and those without conventional housing (and who are not in shelters) . See <www .census .gov/hhes/www/poverty/about/overview/measure .html> for more details .
Source: U .S . Census Bureau, 2012 American Community Survey .

16 U.S. Census Bureau
they had comparatively high rates of poverty (see Table 4). The nation’s official poverty rate was 15 percent in 2012,61 but 48 percent of young women with a birth in the prior year lived in households that were in poverty, and 28 percent were in extreme poverty (below 50 percent of the Federal Poverty Line).
Figure 6 shows states that had higher or lower proportions of young women with a recent birth than the nation overall. Births to young mothers (less than 23 years old at the time of the survey) are generally most prevalent in the states with the highest levels of
61 C. DeNavas-Walt, B.D. Proctor, J.C. Smith, “Income, Poverty, and Health Insurance Cover-age in the United States: 2012,” Current Popu-lation Reports, P60-245, U.S. Census Bureau, Washington, DC, 2013.
poverty.62 However, the prevalence of births to young mothers is also likely linked to the age distribution of the populations in these states. The low percentage of births to young women in Florida is likely due to the fact that Florida has a higher than average median age, while the higher than average per-centage of births to young women in Texas likely reflects the fact that Texas has a lower than average median age.63
62 See Bishaw, 2013 and Bishaw, 2011.63 For a map of relative median age by
state, see Figure 5 of L. Howden and J. Meyer, “Age and Sex Composition: 2010,” 2010 Cen-sus Briefs, C2010BR-03, U.S. Census Bureau, Washington, DC, 2011.
RELATIONSHIP STATUS AT FIRST BIRTH OVER TIME
In addition to total fertility, we examine changes over time in women’s relationship status at first birth. This information comes from newly available CPS data on mar-riage and cohabitation at the time of entry into motherhood. As in years past, the CPS Fertility Supplement asks women how many children they have ever had. However, in an effort to reduce redundancy with the ACS, the focus of the remaining questions is now on the first birth, rather than the most recent birth. For women 15 to 50 years old who report having given birth, the CPS now asks about the year of their first birth and whether they were married or cohabiting at that birth.
!!
!!
!!
!!
!!
!!
!
!
!
!
!
!
!
!
!
!
!
!
!
!
!
!!
TX
CA
MT
AZ
ID
NV
KS
CO
NM
OR
UT
SD
IL
WY
NEIA
FL
MN
OK
ND
WI
WA
GAAL
MO
PA
AR
LA
NC
MS
NY
IN
MI
VA
TN
KY
SC
OH
ME
WV
VT
NH
NJMD
MA
CT
DE
RI
DC
AK
HI
0 500 Miles
0 100 Miles
0 100 Miles
Statistical significance as compared to the national average
Significantly higher
No difference
Significantly lower
Percentage of Young Women (Aged 15 to 22) Who Had a Birthin the Past 12 Months : 2012
Figure 6.
U.S. average is 4.2
Source: U.S. Census Bureau, 2012 American Community Survey.
Note: Data based on sample. For information on confidentiality protection, sampling error, nonsampling error, and definitions, see www.census.gov/acs/www/.Data for individual states can be found in Appendix Table A.
U.S. Census Bureau 17
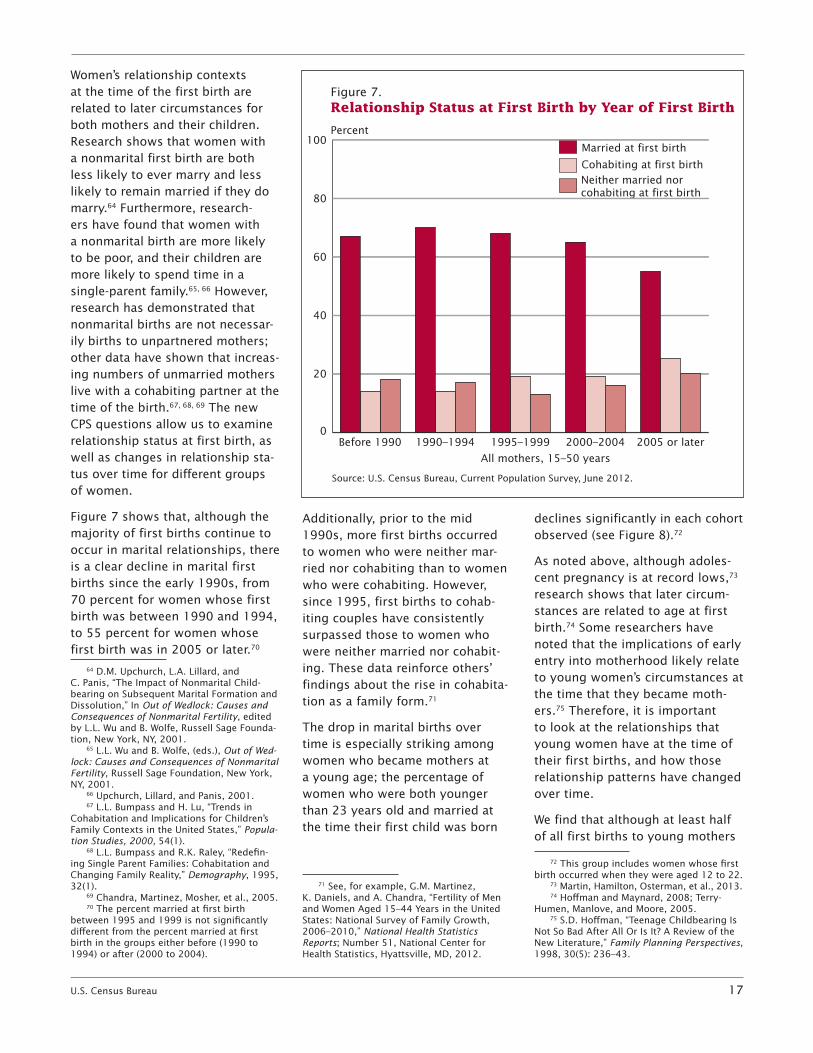
Women’s relationship contexts at the time of the first birth are related to later circumstances for both mothers and their children. Research shows that women with a nonmarital first birth are both less likely to ever marry and less likely to remain married if they do marry.64 Furthermore, research-ers have found that women with a nonmarital birth are more likely to be poor, and their children are more likely to spend time in a single-parent family.65, 66 However, research has demonstrated that nonmarital births are not necessar-ily births to unpartnered mothers; other data have shown that increas-ing numbers of unmarried mothers live with a cohabiting partner at the time of the birth.67, 68, 69 The new CPS questions allow us to examine relationship status at first birth, as well as changes in relationship sta-tus over time for different groups of women.
Figure 7 shows that, although the majorityoffirstbirthscontinuetooccur in marital relationships, there is a clear decline in marital first births since the early 1990s, from 70 percent for women whose first birth was between 1990 and 1994, to 55 percent for women whose first birth was in 2005 or later.70
64 D.M. Upchurch, L.A. Lillard, and C. Panis, “The Impact of Nonmarital Child-bearing on Subsequent Marital Formation and Dissolution,” In Out of Wedlock: Causes and Consequences of Nonmarital Fertility, edited by L.L. Wu and B. Wolfe, Russell Sage Founda-tion, New York, NY, 2001.
65 L.L. Wu and B. Wolfe, (eds.), Out of Wed-lock: Causes and Consequences of Nonmarital Fertility, Russell Sage Foundation, New York, NY, 2001.
66 Upchurch, Lillard, and Panis, 2001.67 L.L. Bumpass and H. Lu, “Trends in
Cohabitation and Implications for Children’s Family Contexts in the United States,” Popula-tion Studies, 2000, 54(1).
68 L.L. Bumpass and R.K. Raley, “Redefin-ing Single Parent Families: Cohabitation and Changing Family Reality,” Demography, 1995, 32(1).
69 Chandra, Martinez, Mosher, et al., 2005. 70 The percent married at first birth
between 1995 and 1999 is not significantly different from the percent married at first birth in the groups either before (1990 to 1994) or after (2000 to 2004).
Additionally, prior to the mid 1990s, more first births occurred to women who were neither mar-ried nor cohabiting than to women who were cohabiting. However, since 1995, first births to cohab-iting couples have consistently surpassed those to women who were neither married nor cohabit-ing. These data reinforce others’ findings about the rise in cohabita-tion as a family form.71
The drop in marital births over time is especially striking among women who became mothers at a young age; the percentage of women who were both younger than 23 years old and married at the time their first child was born
71 See, for example, G.M. Martinez, K. Daniels, and A. Chandra, “Fertility of Men and Women Aged 15–44 Years in the United States: National Survey of Family Growth, 2006–2010,” National Health Statistics Reports; Number 51, National Center for Health Statistics, Hyattsville, MD, 2012.
declines significantly in each cohort observed (see Figure 8).72
As noted above, although adoles-cent pregnancy is at record lows,73 research shows that later circum-stances are related to age at first birth.74 Some researchers have noted that the implications of early entry into motherhood likely relate to young women’s circumstances at the time that they became moth-ers.75 Therefore, it is important to look at the relationships that young women have at the time of their first births, and how those relationship patterns have changed over time.
We find that although at least half of all first births to young mothers
72 This group includes women whose first birth occurred when they were aged 12 to 22.
73 Martin, Hamilton, Osterman, et al., 2013. 74 Hoffman and Maynard, 2008; Terry-
Humen, Manlove, and Moore, 2005.75 S.D. Hoffman, “Teenage Childbearing Is
Not So Bad After All Or Is It? A Review of the New Literature,” Family Planning Perspectives, 1998, 30(5): 236–43.
0 20 40 60 80 100 120 140
35–50 years old
25–34 years old
15–24 years old
Figure 7. Relationship Status at First Birth by Year of First Birth
Total
Less than highschool
High schoolgraduate
Some college orassociate’s degree
Bachelor’sdegree or more
Source: U.S. Census Bureau, Current Population Survey, June 2012.
Married at first birth
Cohabiting at first birthNeither married norcohabiting at first birth
Source: U.S. Census Bureau, American Community Survey: 2008. See Detailed Table 10.
Figure 3. Births in the Last Year per 1,000 Women 15 to 50 Years Old by Educational Attainment and Age: 2008
All mothers, 15–50 years
Percent
0
20
40
60
80
100
2005 or later2000–20041995–19991990–1994Before 1990
18 U.S. Census Bureau
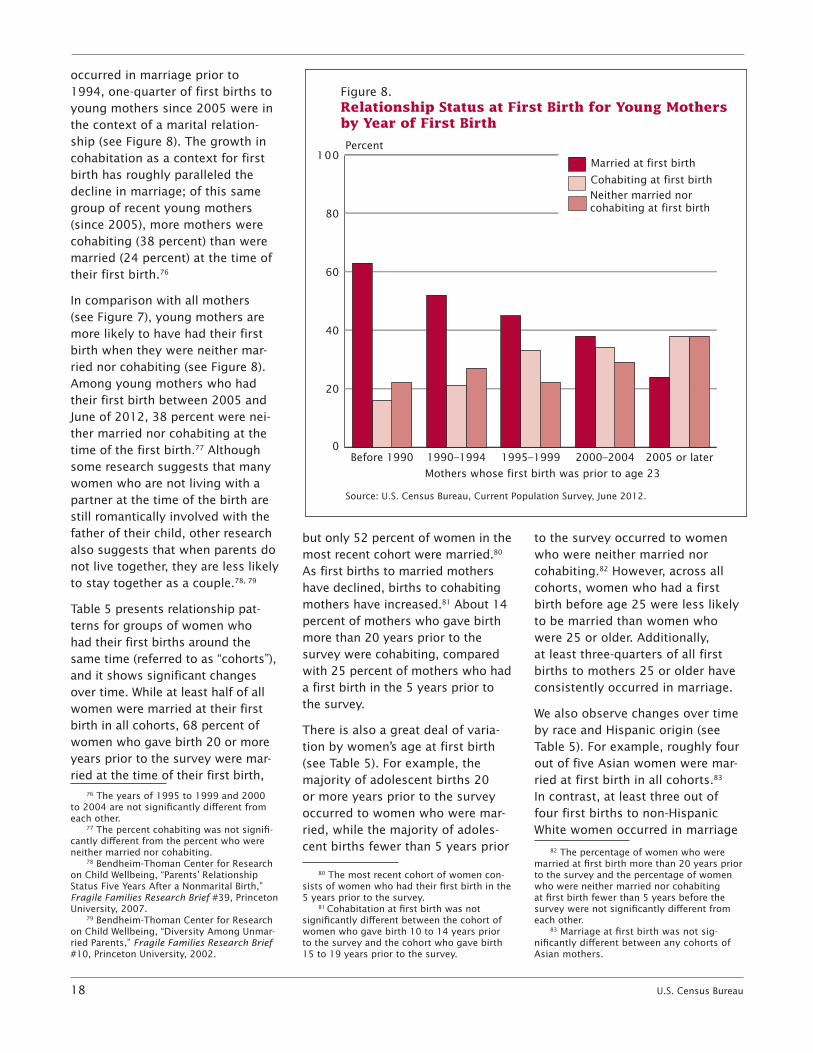
occurred in marriage prior to 1994, one-quarter of first births to young mothers since 2005 were in the context of a marital relation-ship (see Figure 8). The growth in cohabitation as a context for first birth has roughly paralleled the decline in marriage; of this same group of recent young mothers (since 2005), more mothers were cohabiting (38 percent) than were married (24 percent) at the time of their first birth.76
In comparison with all mothers (see Figure 7), young mothers are more likely to have had their first birth when they were neither mar-ried nor cohabiting (see Figure 8). Among young mothers who had their first birth between 2005 and June of 2012, 38 percent were nei-ther married nor cohabiting at the time of the first birth.77 Although some research suggests that many women who are not living with a partner at the time of the birth are still romantically involved with the father of their child, other research also suggests that when parents do not live together, they are less likely to stay together as a couple.78, 79
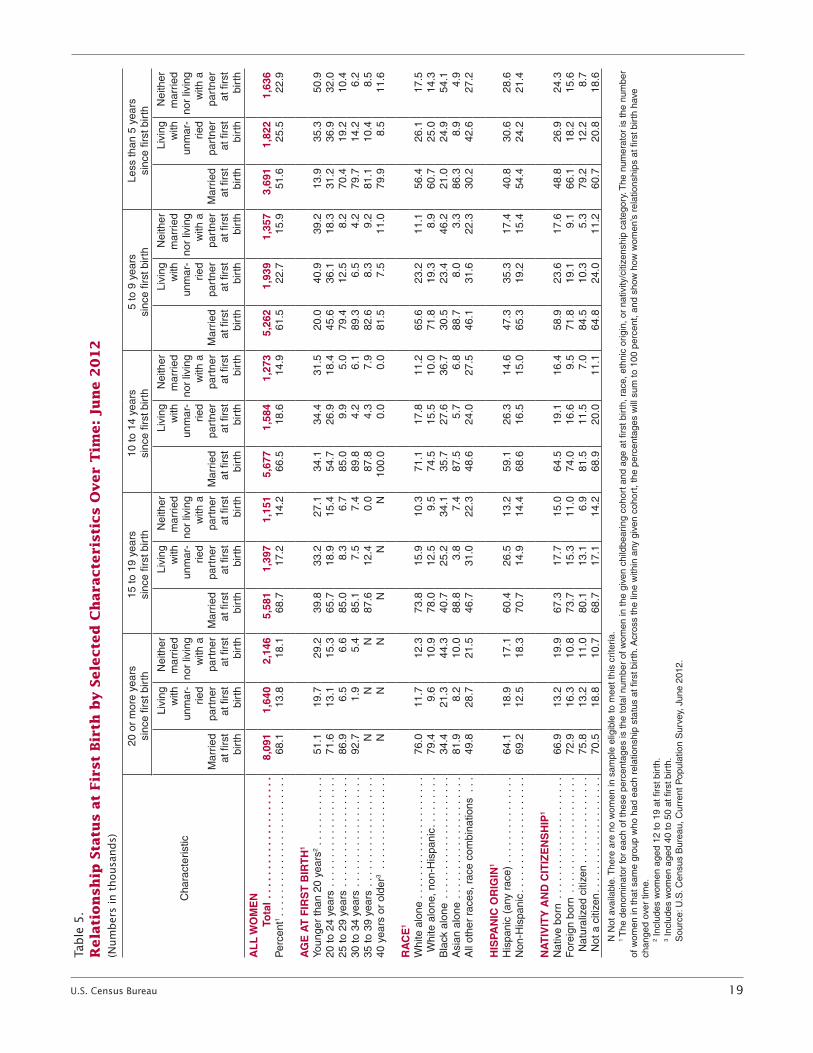
Table 5 presents relationship pat-terns for groups of women who had their first births around the same time (referred to as “cohorts”), and it shows significant changes over time. While at least half of all women were married at their first birth in all cohorts, 68 percent of women who gave birth 20 or more years prior to the survey were mar-ried at the time of their first birth,
76 The years of 1995 to 1999 and 2000 to 2004 are not significantly different from each other.
77 The percent cohabiting was not signifi-cantly different from the percent who were neither married nor cohabiting.
78 Bendheim-Thoman Center for Research on Child Wellbeing, “Parents’ Relationship Status Five Years After a Nonmarital Birth,” Fragile Families Research Brief #39, Princeton University, 2007.
79 Bendheim-Thoman Center for Research on Child Wellbeing, “Diversity Among Unmar-ried Parents,” Fragile Families Research Brief #10, Princeton University, 2002.
but only 52 percent of women in the most recent cohort were married.80
As first births to married mothers have declined, births to cohabiting mothers have increased.81 About 14 percent of mothers who gave birth more than 20 years prior to the survey were cohabiting, compared with 25 percent of mothers who had a first birth in the 5 years prior to the survey.
There is also a great deal of varia-tion by women’s age at first birth (see Table 5). For example, the majorityofadolescentbirths20or more years prior to the survey occurred to women who were mar-ried,whilethemajorityofadoles-cent births fewer than 5 years prior
80 The most recent cohort of women con-sists of women who had their first birth in the 5 years prior to the survey.
81 Cohabitation at first birth was not significantly different between the cohort of women who gave birth 10 to 14 years prior to the survey and the cohort who gave birth 15 to 19 years prior to the survey.
to the survey occurred to women who were neither married nor cohabiting.82 However, across all cohorts, women who had a first birth before age 25 were less likely to be married than women who were 25 or older. Additionally, at least three-quarters of all first births to mothers 25 or older have consistently occurred in marriage.
We also observe changes over time by race and Hispanic origin (see Table 5). For example, roughly four out of five Asian women were mar-ried at first birth in all cohorts.83 In contrast, at least three out of four first births to non-Hispanic White women occurred in marriage
82 The percentage of women who were married at first birth more than 20 years prior to the survey and the percentage of women who were neither married nor cohabiting at first birth fewer than 5 years before the survey were not significantly different from each other.
83 Marriage at first birth was not sig-nificantly different between any cohorts of Asian mothers.
0 20 40 60 80 100 120 140
35–50 years old
25–34 years old
15–24 years old
Figure 8. Relationship Status at First Birth for Young Mothers by Year of First Birth
Total
Less than highschool
High schoolgraduate
Some college orassociate’s degree
Bachelor’sdegree or more
Source: U.S. Census Bureau, Current Population Survey, June 2012.
Married at first birth
Cohabiting at first birthNeither married norcohabiting at first birth
Source: U.S. Census Bureau, American Community Survey: 2008. See Detailed Table 10.
Figure 3. Births in the Last Year per 1,000 Women 15 to 50 Years Old by Educational Attainment and Age: 2008
Mothers whose first birth was prior to age 23
Percent
0
20
40
60
80
100
2005 or later2000–20041995–19991990–1994Before 1990
U.S. Census Bureau 19
Table
5.
Rela
tion
sh
ip S
tatu
s a
t Fir
st
Bir
th b
y S
ele
cte
d C
hara
cte
risti
cs O
ver
Tim
e: Ju
ne 2
01
2(N
um
ber
s in
thousa
nds)
Cha
ract
eris
tic
20 o
r m
ore
year
s si
nce
first
bir
th15
to 1
9 ye
ars
sinc
e fir
st b
irth
10 to
14
year
s si
nce
first
bir
th5
to 9
yea
rs
sinc
e fir
st b
irth
Less
than
5 y
ears
si
nce
first
bir
th
Mar
ried
at fi
rst
birt
h
Livi
ng
with
un
mar
-rie
d pa
rtne
r at
firs
t bi
rth
Nei
ther
m
arrie
d no
r liv
ing
with
a
part
ner
at fi
rst
birt
h
Mar
ried
at fi
rst
birt
h
Livi
ng
with
un
mar
-rie
d pa
rtne
r at
firs
t bi
rth
Nei
ther
m
arrie
d no
r liv
ing
with
a
part
ner
at fi
rst
birt
h
Mar
ried
at fi
rst
birt
h
Livi
ng
with
un
mar
-rie
d pa
rtne
r at
firs
t bi
rth
Nei
ther
m
arrie
d no
r liv
ing
with
a
part
ner
at fi
rst
birt
h
Mar
ried
at fi
rst
birt
h
Livi
ng
with
un
mar
-rie
d pa
rtne
r at
firs
t bi
rth
Nei
ther
m
arrie
d no
r liv
ing
with
a
part
ner
at fi
rst
birt
h
Mar
ried
at fi
rst
birt
h
Livi
ng
with
un
mar
-rie
d pa
rtne
r at
firs
t bi
rth
Nei
ther
m
arrie
d no
r liv
ing
with
a
part
ner
at fi
rst
birt
h
AL
L W
OM
EN
To
tal
. . . .
. . . .
. . . .
. . . .
. . . .
. 8
,091
1
,640
2
,146
5
,581
1
,397
1
,151
5
,677
1
,584
1
,273
5
,262
1
,939
1
,357
3
,691
1
,822
1
,636
P
erce
nt1 .
. . . .
. . . .
. . . .
. . . .
. . . .
. . .
68 .1
13 .8
18 .1
68 .7
17 .2
14 .2
66 .5
18 .6
14 .9
61 .5
22 .7
15 .9
51 .6
25 .5
22 .9
AG
E A
T F
IRS
T B
IRT
H1
Youn
ger
than
20
year
s2 . .
. . . .
. . . .
. .51
.119
.729
.239
.833
.227
.134
.134
.431
.520
.040
.939
.213
.935
.350
.920
to 2
4 ye
ars
. . . .
. . . .
. . . .
. . . .
. . .
71 .6
13 .1
15 .3
65 .7
18 .9
15 .4
54 .7
26 .9
18 .4
45 .6
36 .1
18 .3
31 .2
36 .9
32 .0
25 to
29
year
s . .
. . . .
. . . .
. . . .
. . . .
.86
.96 .
56 .
685
.08 .
36 .
785
.09 .
95 .
079
.412
.58 .
270
.419
.210
.430
to 3
4 ye
ars
. . . .
. . . .
. . . .
. . . .
. . .
92 .7
1 .9
5 .4
85 .1
7 .5
7 .4
89 .8
4 .2
6 .1
89 .3
6 .5
4 .2
79 .7
14 .2
6 .2
35 to
39
year
s . .
. . . .
. . . .
. . . .
. . . .
.N
NN
87 .6
12 .4
0 .0
87 .8
4 .3
7 .9
82 .6
8 .3
9 .2
81 .1
10 .4
8 .5
40 y
ears
or
olde
r3 .
. . . .
. . . .
. . . .
. . .
NN
NN
NN
100 .
00 .
00 .
081
.57 .
511
.079
.98 .
511
.6
RA
CE
1
Whi
te a
lone
. . .
. . . .
. . . .
. . . .
. . . .
. .76
.011
.712
.373
.815
.910
.371
.117
.811
.265
.623
.211
.156
.426
.117
.5 W
hite
alo
ne, n
on-H
ispa
nic .
. . . .
. . . .
79 .4
9 .6
10 .9
78 .0
12 .5
9 .5
74 .5
15 .5
10 .0
71 .8
19 .3
8 .9
60 .7
25 .0
14 .3
Bla
ck a
lone
. . .
. . . .
. . . .
. . . .
. . . .
. .34
.421
.344
.340
.725
.234
.135
.727
.636
.730
.523
.446
.221
.024
.954
.1A
sian
alo
ne .
. . . .
. . . .
. . . .
. . . .
. . . .
81 .9
8 .2
10 .0
88 .8
3 .8
7 .4
87 .5
5 .7
6 .8
88 .7
8 .0
3 .3
86 .3
8 .9
4 .9
All
othe
r ra
ces,
rac
e co
mbi
natio
ns .
. .49
.828
.721
.546
.731
.022
.348
.624
.027
.546
.131
.622
.330
.242
.627
.2
HIS
PAN
IC O
RIG
IN1
His
pani
c (a
ny r
ace)
. . .
. . . .
. . . .
. . . .
64 .1
18 .9
17 .1
60 .4
26 .5
13 .2
59 .1
26 .3
14 .6
47 .3
35 .3
17 .4
40 .8
30 .6
28 .6
Non
-His
pani
c . .
. . . .
. . . .
. . . .
. . . .
. .69
.212
.518
.370
.714
.914
.468
.616
.515
.065
.319
.215
.454
.424
.221
.4
NA
TIV
ITY
AN
D C
ITIZ
EN
SH
IP1
Nat
ive
born
. . .
. . . .
. . . .
. . . .
. . . .
. .66
.913
.219
.967
.317
.715
.064
.519
.116
.458
.923
.617
.648
.826
.924
.3F
orei
gn b
orn
. . .
. . . .
. . . .
. . . .
. . . .
.72
.916
.310
.873
.715
.311
.074
.016
.69 .
571
.819
.19 .
166
.118
.215
.6 N
atur
aliz
ed c
itize
n . .
. . . .
. . . .
. . . .
.75
.813
.211
.080
.113
.16 .
981
.511
.57 .
084
.510
.35 .
379
.212
.28 .
7 N
ot a
citi
zen
. . . .
. . . .
. . . .
. . . .
. . . .
70 .5
18 .8
10 .7
68 .7
17 .1
14 .2
68 .9
20 .0
11 .1
64 .8
24 .0
11 .2
60 .7
20 .8
18 .6
N N
ot a
vaila
ble .
The
re a
re n
o w
omen
in s
ampl
e el
igib
le to
mee
t thi
s cr
iteria
.1 T
he d
enom
inat
or fo
r ea
ch o
f the
se p
erce
ntag
es is
the
tota
l num
ber
of w
omen
in th
e gi
ven
child
bear
ing
coho
rt a
nd a
ge a
t firs
t bir
th, r
ace,
eth
nic
orig
in, o
r na
tivity
/citi
zens
hip
cate
gory
. The
num
erat
or is
the
num
ber
of w
omen
in th
at s
ame
grou
p w
ho h
ad e
ach
rela
tions
hip
stat
us a
t firs
t bir
th . A
cros
s th
e lin
e w
ithin
any
giv
en c
ohor
t, th
e pe
rcen
tage
s w
ill s
um to
100
per
cent
, and
sho
w h
ow w
omen
’s r
elat
ions
hips
at fi
rst b
irth
hav
e ch
ange
d ov
er ti
me .
2 In
clud
es w
omen
age
d 12
to 1
9 at
firs
t bir
th .
3 In
clud
es w
omen
age
d 40
to 5
0 at
firs
t bir
th .
Sou
rce:
U .S
. Cen
sus
Bur
eau,
Cur
rent
Pop
ulat
ion
Sur
vey,
Jun
e 20
12 .
20 U.S. Census Bureau
until the most recent two cohorts, when the percent married at first birth fell to 72 percent for those whose first birth was 5 to 9 years prior to the survey, and 61 per-cent for those in the most recent cohort.84 Black women had the low-est percentages of women married at first birth in all cohorts. Sixty-four percent of Hispanic women who gave birth more than 20 years prior to the survey were married at first birth, while 41 percent of the Hispanic women who gave birth in the 5 years prior to the survey were married at first birth.85
One quarter of both Black and non-Hispanic White women whose first birth was in the 5 years prior to the survey were cohabiting at the time of the first birth (see Table 5).86 Across all but the most recent cohort, cohabitation at first birth was more common among His-panic women than it was among non-Hispanics.87 Among first births within the 9 years prior to the sur-vey, native-born women were more likely than foreign-born women to have been cohabiting at the time of the birth.
Between 9 and 11 percent of non-Hispanic White women were neither married nor cohabiting at the time of their first birth up until the most recent cohort, but for those whose
84 The percent married at first birth was not significantly different between the cohort that gave birth 10 to 14 years prior to the survey and the cohort that gave birth 15 to 19 years prior to the survey for non-Hispanic, White mothers.
85 The percent married at first birth was not significantly different between the cohorts that gave birth 10 or more years prior to the survey for Hispanic mothers. The percent married at first birth was also not significantly different between the cohort that gave birth 5 to 10 years prior to the survey and the cohort that gave birth less than 5 years before the survey for Hispanic mothers.
86 Cohabitation at first birth was not significantly different between Black and non-Hispanic White mothers in the cohort that gave birth within 5 years of the survey.
87 Cohabitation at first birth was not significantly different between Hispanic and non-Hispanic mothers in the cohort that gave birth 5 or less years prior to the survey.
first birth was fewer than 5 years prior to the survey, the number rose to 14 percent (see Table 5).88 Although at least a third of Black women were neither married nor cohabiting at first birth in all cohorts, half of Black women in the most recent cohort were neither married nor cohabiting at first birth. The percentage of Hispanic women who had a first birth while neither married nor cohabiting did not vary significantly among earlier cohorts; however, 29 percent of Hispanic women who had their first birth in the 5 years prior to the survey were neither married nor cohabiting.
Foreign-born women consistently had a higher percentage of their first births in marriage than did native-born women, as well as a lower percentage of first births to women who were neither married nor cohabiting (see Table 5).
Relationship Status at First Birth and Later Life Circumstances
Research shows that women’s relationship status at their first birth is correlated with later life circumstances. Some of this is probably related to women’s other circumstances at the time of their first birth. For example, researchers have found that nonmarital births tend to be concentrated among women facing disadvantages, such as lower education and higher poverty.89, 90 However, additional
88 There were no significant differences between any of the cohorts of women who were neither married nor cohabiting at first birth in the cohorts 5 or more years prior to the survey. However, all cohorts of women who were neither married nor cohabiting at first birth in the cohorts 5 or more years prior to the survey are significantly different from the most recent cohort of women who were neither married nor cohabiting at first birth.
89 S.D. Hoffman and E.M. Foster, “Economic Correlates of Nonmarital Childbearing Among Adult Women,” Family Planning Perspectives, 1997, 29(3).
90 D.M. Upchurch, L.A. Lillard, and C.W.A. Panis, “Nonmarital Childbearing; Influ-ences of Education, Marriage, and Fertility,” Demography, 2002, 39(2).
evidence suggests that nonmarital births also contribute to continued poverty and disadvantage later.91 The CPS data allow us to examine this relationship in more depth.
Statistical models were run to examine the association between women’s relationship status at first birth and their circumstances at the time of the survey. These models generate predictions of the chance that someone with a given history will experience a given event while accounting for other characteristics that are also related to women’s circumstances (such as their age and number of children).
Four logistic regression models (see About Regression Analysis) were used to predict four differ-ent outcomes in two areas that are important for the well-being of children and families: economic well-being and family stability. A large body of research demon-strates that poverty is associated with negative outcomes for chil-dren, adults, and families, affecting children’s academic performance, women’s health, and family stabili-ty.92, 93, 94 However, because the CPS fertility data do not include a direct measure of poverty, educational attainment and labor force attach-ment were used as approximations of economic well-being. To mea-sure the importance of first-birth circumstances for later economic well-being, we predicted the likeli-hood that a woman had a high school diploma, as well as whether
91 For a review of recent literature on the topic, see S. McLanahan and C. Percheski, “Family Structure and the Reproduction of Inequalities,” Annual Review of Sociology, 2008, 34: 257–276.
92 Moore, Redd, Burkhauser, et al., 2009.93 M. Cohen, “Impact of poverty on
women’s health,” Canadian Family Physician, 1994, 40: 949–958.
94 A. Lewen, “The effect of economic stability on familial stability among welfare recipients,” Evaluation Review, 2005, 29(30): 223–240.

U.S. Census Bureau 21
a woman was unemployed at the time of the survey.95
Family instability is defined as changes in the composition of a family that are not caused by either birth or death and, like poverty, it is negatively associated with the well-being of both children and adults. Other research has linked parents’ relationship instability to higher levels of problem behavior, lower levels of high school completion, and decreased emotional well-being in their children.96, 97, 98, 99 For adults, relationship instability has been linked to economic insecurity,
95 In this context, the formal definition of unemployment is used, meaning that women who are unemployed are those who do not have employment, but who are trying to become employed. Women who do not havejobsbutarenotlookingtogetjobsareclassified as not in the labor force and are not included in the population of women who are unemployed.
96 S.E. Cavenaugh and A.C. Huston, “Fam-ily Instability and Children’s Early Problem Behavior,” Social Forces, 2006, 85: 551–581.
97 C.R. Martinez and M.S. Forgatch, “AdjustingtoChange:LinkingFamilyStruc-ture Transitions With Parenting and Boys’ Adjustment,”Journal of Family Psychology, 2002, 16: 107–117.
98 P. Suet-Ling and J. Dong-Beom, “The Effects of Change in Family Structure and Income on Dropping Out of Middle and High School,” Journal of Family Issues, 2000, 21: 147–169.
99 L.L. Wu and E. Thomson, “Race Differ-ences in Family Experience and Early Sexual Initiation: Dynamic Models of Family Structure and Family Change,” Journal of Marriage and the Family, 2001, 63: 682–696.
increased stress, and lower levels of parental involvement.100, 101, 102 To examine the implications of first birth circumstances for later familial stability, we predict the likelihood that a woman is married at the time of the survey, as well as the likeli-hood that she lives in a blended or stepfamily.
The benefit to using regression models to predict these outcomes is that we can account for other factors that are also known to affect a woman’s later circum-stances. For example, research has shown that both economic well-being and family instability vary by race, ethnicity, and nativity.103 Other research has shown that a woman’s age at first birth also mat-ters for later outcomes, as does her number of children ever born and the time elapsed since that first
100 C. Osbourne, L.M. Berger, and K. Magnuson, “Family Structure Transitions and Changes in Maternal Resources and Well-being,” Demography, 2012, 4923–47.
101 Cavenaugh and Huston, 2006.102 Martinez and Forgatch, 2002.103 D. Lichter, Z. Qian, and M. Crowley,
“Race and poverty: Divergent fortunes of America’s children?” Focus, 2006, 24(3): 8–16.
birth.104, 105, 106 Therefore, all models take into account the mother’s race, Hispanic origin, nativity, age at first birth, years since first birth, and number of children ever born, and estimate the relationship between first-birth circumstances and later outcomes while controlling for these other influences.
After taking these other factors into account, women who were unmarried at their first birth were less likely to have a high school degree at the time of the survey than were mothers who were mar-ried at the time of their first birth, and this was particularly true for women who were neither married nor cohabiting at first birth (see Figure 9).107, 108 Although other data suggest that women with a nonmarital first birth are likely to have lower educational attainment to begin with, these data suggest that, even over the course of many years, women with a nonmarital first birth do not catch up to their counterparts whose first birth was in marriage.109, 110 Perhaps related to their lower educational attain-ment, we further find that women
104 Miller, 2009.105 S.E. Kirmeyer and B.E. Hamilton, “Child-
bearing Differences Among Three Genera- tions of U.S. Women,” NCHS Data Brief, Number 68, National Center for Health Statistics, Hyattsville, MD, 2011.
106 Bureau of Labor Statistics, “Employ-ment Characteristics of Families—2012,” Bureau of Labor Statistics News Release, 2013, USDL-13-0730.
107 Net of controls, women who were cohabiting at their first birth have 0.7 times the odds of having a high school degree at the time of the survey as women who were mar-ried at their first birth, and women who were neither married nor cohabiting at their first birth have 0.5 times the odds of having a high school degree at the time of the survey as women who were married at their first birth.
108 Net of controls, women who were neither married nor cohabiting at their first birth have 0.8 times the odds of having a high school degree at the time of the survey as women who were cohabiting at their first birth.
109 R.R. Rindfuss, S.P. Morgan, and K. Offutt, “Education and the Changing Age Pattern of American Fertility: 1969–1989,” Demography: 1996, 33(3).
110 Upchurch, Lillard, and Panis, 2002.
ABOUT REGRESSION ANALYSIS
Regression analysis is a statistical technique used to estimate the rela-tionships between a dependent variable, or outcome, and one or more independent, or predictor, variables. For example, a person’s level of education likely predicts their income, but other factors, such as years of work experience, also matter. Regression models allow researchers to identify the size of the relationship between education and income, while also taking years of experience and other factors into account.
Logistic regression is a specific type of regression model used to predict a dichotomous, or two-way, categorical outcome (for example, “employed” vs. “not employed”). Because the model is predicting a binary outcome (either true or not true), logistic regression produces a measure of the natural logarithm of the odds of the outcome being true, given the other variables being accounted for.
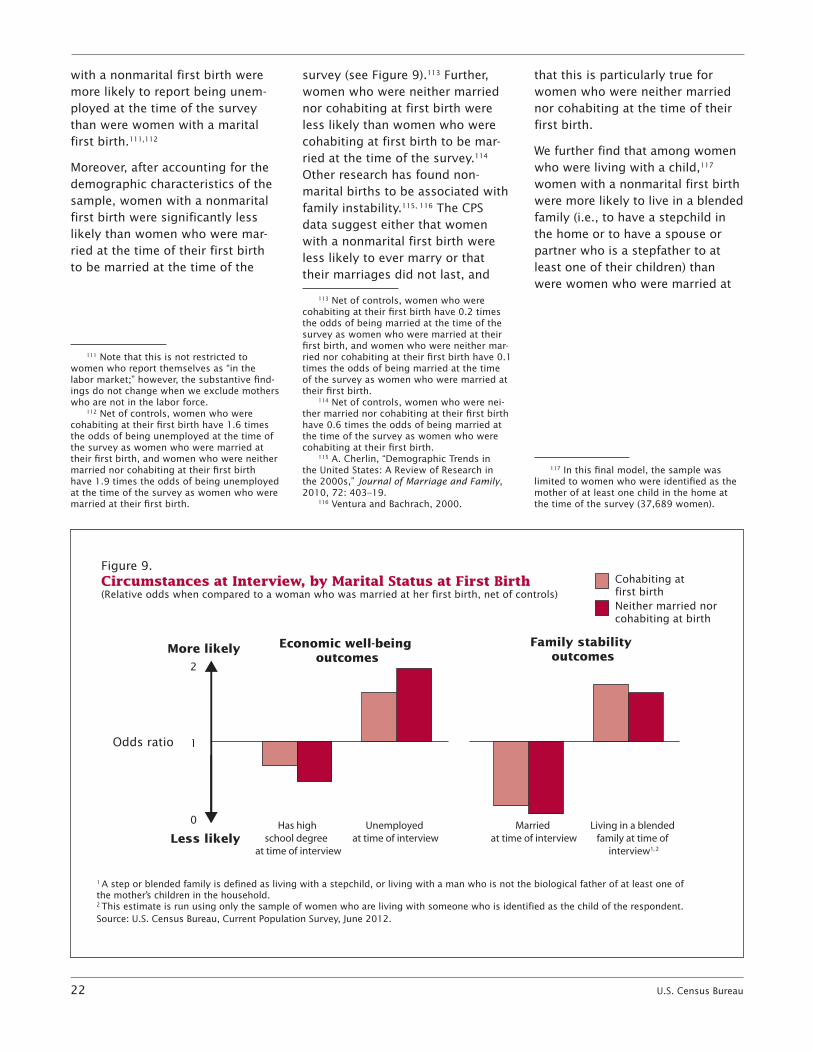
22 U.S. Census Bureau
with a nonmarital first birth were more likely to report being unem-ployed at the time of the survey than were women with a marital first birth.111,112
Moreover, after accounting for the demographic characteristics of the sample, women with a nonmarital first birth were significantly less likely than women who were mar-ried at the time of their first birth to be married at the time of the
111 Note that this is not restricted to women who report themselves as “in the labor market;” however, the substantive find-ings do not change when we exclude mothers who are not in the labor force.
112 Net of controls, women who were cohabiting at their first birth have 1.6 times the odds of being unemployed at the time of the survey as women who were married at their first birth, and women who were neither married nor cohabiting at their first birth have 1.9 times the odds of being unemployed at the time of the survey as women who were married at their first birth.
survey (see Figure 9).113 Further, women who were neither married nor cohabiting at first birth were less likely than women who were cohabiting at first birth to be mar-ried at the time of the survey.114
Other research has found non-marital births to be associated with family instability.115, 116 The CPS data suggest either that women with a nonmarital first birth were less likely to ever marry or that their marriages did not last, and
113 Net of controls, women who were cohabiting at their first birth have 0.2 times the odds of being married at the time of the survey as women who were married at their first birth, and women who were neither mar-ried nor cohabiting at their first birth have 0.1 times the odds of being married at the time of the survey as women who were married at their first birth.
114 Net of controls, women who were nei-ther married nor cohabiting at their first birth have 0.6 times the odds of being married at the time of the survey as women who were cohabiting at their first birth.
115 A. Cherlin, “Demographic Trends in the United States: A Review of Research in the 2000s,” Journal of Marriage and Family, 2010, 72: 403–19.
116 Ventura and Bachrach, 2000.
that this is particularly true for women who were neither married nor cohabiting at the time of their first birth.
We further find that among women who were living with a child,117 women with a nonmarital first birth were more likely to live in a blended family (i.e., to have a stepchild in the home or to have a spouse or partner who is a stepfather to at least one of their children) than were women who were married at
117 In this final model, the sample was limited to women who were identified as the mother of at least one child in the home at the time of the survey (37,689 women).
Figure 9.Circumstances at Interview, by Marital Status at First Birth(Relative odds when compared to a woman who was married at her first birth, net of controls)
1 A step or blended family is defined as living with a stepchild, or living with a man who is not the biological father of at least one of the mother’s children in the household.2 This estimate is run using only the sample of women who are living with someone who is identified as the child of the respondent. Source: U.S. Census Bureau, Current Population Survey, June 2012.
Economic well-being outcomes
Family stability outcomes
More likely
Less likely
Odds ratio
Cohabiting at first birthNeither married nor cohabiting at birth
2
1
0 Unemployed at time of interview
Has high school degree
at time of interview
Living in a blended family at time of
interview1, 2
Married at time of interview
U.S. Census Bureau 23
first birth (see Figure 9).118 This sug-gests that women with nonmarital first births experience higher family turbulence than women whose first birth was in marriage. Taken together, all of these data suggest that women with nonmarital first births may face continued disadvan-tage over their lives compared with women with marital first births.
SOURCE OF THE DATA
Some estimates in this report come from data obtained in the June 2012 CPS and from the CPS in earlier years. The Census Bureau conducts this survey every month, although this report uses only data from the every-other-year June sur-veys for its estimates.
The population represented (the population universe) in the Fertility Supplement to the June 2012 CPS is the female, civilian, noninstitution-alized population, 15 to 50 years old, living in the United States. The institutionalized population, which is excluded from the population universe, is composed primarily of the population in correctional insti-tutions and nursing homes.
This report also presents data from the 2012 ACS. The population rep-resented (the population universe) in the ACS includes the popula-tion living in households, plus the population living in group quarters. According to the 2010 Census, 8 million people, or 2.6 percent of the total population, lived in group
118 Net of controls, women who were cohabiting at their first birth have 1.7 times the odds of living in a blended family at the time of the survey as women who were mar-ried at their first birth, and women who were neither married nor cohabiting at their first birth have 1.6 times the odds of living in a blended family at the time of the survey as women who were married at their first birth. However, although both categories of women with nonmarital first births are significantly different from women with marital first births, within nonmarital births, women who were cohabiting at first birth are not significantly different from women who were neither mar-ried nor cohabiting in terms of their odds of living in a blended family at interview.
quarters. Of this number, roughly 4 million were institutionalized— primarily in correctional institutions and nursing homes, while roughly 4 million were noninstitutionalized (such as in college dormitories or other types of group quarters).
COMPARISON WITH OTHER DATA SOURCES
Comparative estimates on annual births are made between the ACS and data collected in the Vital Sta-tistics Registration system and pub-lished by the National Center for Health Statistics (NCHS); see Appen-dix Table B for these estimates.
The ACS birth rate is slightly dif-ferent from the NCHS birth rate for a calendar year because the ACS asks whether a woman had a birth in the past 12 months, extending back from the date of the interview. In this way, the 2012 ACS data captures births occurring between January of 2011 and December of 2012. In contrast, vital statistics data (as collected by NCHS) are administrative records of births that occurred during the calendar year of January to December of 2012. Additionally, NCHS birth data record the geographic loca-tion in which the birth took place, while ACS collects the area where the woman lives at the time of the survey. Moreover, birth rates by age will be slightly different from age-specific birth rates published by NCHS since the women’s age in the ACS data is at the time of the survey interview date, while her age in the NCHS data is at the time she gave birth.119
Due to these differences in data collection, the ACS tends to under-estimate the number of women 15 to 19 years old with a birth in the
119 For more information, see T. Johnson and J.L. Dye, “Indicators of Marriage and Fertil-ity in the United States,” from the American Community Survey: 2000 to 2003, U.S. Census Bureau, presentation released May 2005.
last year because about half of the 19 year olds will be 20 years old by the time of the survey. Similarly, the ACS tends to gain births from women 39 years old who turn 40 before the survey date. This produces more births to women 40 to 44 years old in the ACS than reported by Vital Statistics. For this reason, and the fact that women are having births at older ages, the ACS includes women aged 45 to 50 in the survey questionnaire.
ACCURACY OF THE ESTIMATES
Statisticsfromsurveysaresubjectto sampling and nonsampling error. All comparisons presented in this report have taken sampling error into account and are significant at the 90 percent confidence level. This means that the 90 percent confidence interval for the differ-ence between the estimates being compared does not include zero. Nonsampling errors in surveys may be attributed to a variety of sources, such as how the survey was designed, how respondents interpret questions, how able and willing respondents are to pro-vide correct answers, and how accurately the answers are coded and classified. The Census Bureau employs quality control procedures throughout the production process, including the overall design of surveys, the wording of questions, review of the work of interviewers and coders, and statistical review of reports to minimize these errors.
The CPS weighting procedure uses ratio estimation whereby sample estimatesareadjustedtoinde-pendent estimates of the national population by age, race, sex, and Hispanic origin. This weighting partially corrects for bias due to undercoverage, but biases may still be present when people who are missed by the survey differ from

24 U.S. Census Bureau
those interviewed in ways other than age, race, sex, and Hispanic origin. How this weighting proce-dure affects other variables in the survey is not precisely known. All of these considerations affect com-parisons across different surveys or data sources.
For further information on statisti-cal standards and the computation and use of standard errors for the CPS, go to <www.census.gov/prod /techdoc/cps/cpsjun12.pdf> or contact the Census Bureau Demo-graphic Statistical Methods Division on the Internet at <dsmd.source [email protected]>.
The final ACS population estimates areadjustedintheweightingpro-cedure for coverage errors by con-trolling specific survey estimates to independent population controls by sex, age, race, and Hispanic origin. The final ACS estimates of housing units are controlled to independent estimates of total housing. This weighting partially corrects for bias due to over or undercoverage, but biases may still be present, for example, when people missed differ from those interviewed in ways other than sex, age, race, and Hispanic origin. How this weighting
procedure affects other variables in the survey is not precisely known. All of these considerations affect comparisons across different sur-veys or data sources.
For further information on the ACS sample, weighting procedures, sampling error, nonsampling error, and quality measures from the ACS, see <http://factfinder.census .gov/home/en/datanotes/exp _acs2012.html>.
MORE INFORMATION
Detailed tables showing the char-acteristics of women aged 15 to 50 by fertility indicators are available on the Internet at <www.census.gov>.
CONTACTS
For additional information on these topics, contact: Lindsay M. Monte [email protected]
Renee R. Ellis [email protected]
Fertility and Family Statistics Branch
(301) 763-2416
USER COMMENTS
The Census Bureau welcomes the comments and advice of users of its data and reports. If you have any suggestions or comments, please write to:
Chief, SEHSD Division U.S. Census Bureau Washington, DC 20233-8800
Or send an e-mail inquiry to: [email protected]
SUGGESTED CITATION
Monte, Lindsay M., and Ellis, Renee R., Fertility of Women in the United States: June 2012, Current Popula-tion Reports, P20-575, U.S. Census Bureau, Washington, DC, 2014.

U.S. Census Bureau 25
Appendix Table A. Data for Map Figures(Data based on sample. For information on confidentiality protection, sampling error, nonsampling error, and definitions, see www.census.gov/acs/www/)
Area
Figure 4 Figure 5 Figure 6
Percentage of women aged 15 to 50 with a birth
in the past 12 months who were in poverty
Percentage of women aged 15 to 50 with a birth
in the past 12 months who were living in
someone else’s home
Percentage of young women aged 15 to 22 who had a birth
in the past 12 months
Estimate Margin of
error1 Estimate Margin of
error1 Estimate Margin of
error1
United States (US) . . . . . . . 28 .1 0 .4 23 .5 0 .4 4 .2 0 .1
Alabama (AL) . . . . . . . . . . . . . . . . . . 32 .4 3 .6 26 .2 2 .9 5 .9 0 .7 Alaska (AK) . . . . . . . . . . . . . . . . . . . 23 .0 5 .6 22 .0 5 .6 4 .8 1 .7 Arizona (AZ) . . . . . . . . . . . . . . . . . . 31 .3 2 .8 23 .2 2 .1 5 .0 0 .7 Arkansas (AR) . . . . . . . . . . . . . . . . . 30 .8 3 .7 21 .5 3 .4 5 .5 0 .9 California (CA) . . . . . . . . . . . . . . . . . 26 .6 1 .1 27 .9 1 .0 3 .4 0 .2 Colorado (CO) . . . . . . . . . . . . . . . . . 24 .1 2 .9 16 .6 2 .4 3 .7 0 .6 Connecticut (CT) . . . . . . . . . . . . . . . 17 .8 2 .8 14 .9 2 .8 2 .3 0 .6 Delaware (DE) . . . . . . . . . . . . . . . . . 19 .5 6 .6 22 .8 6 .2 3 .8 1 .5 District of Columbia (DC) . . . . . . . . . 22 .0 6 .9 23 .4 8 .6 3 .6 1 .3 Florida (FL) . . . . . . . . . . . . . . . . . . . 30 .9 1 .9 29 .3 2 .4 3 .6 0 .4
Georgia (GA) . . . . . . . . . . . . . . . . . . 30 .3 2 .1 25 .8 1 .9 4 .6 0 .5 Hawaii (HI) . . . . . . . . . . . . . . . . . . . . 21 .8 4 .5 31 .3 5 .6 4 .8 1 .4 Idaho (ID) . . . . . . . . . . . . . . . . . . . . . 28 .4 5 .0 14 .7 3 .9 5 .7 1 .4 Illinois (IL) . . . . . . . . . . . . . . . . . . . . 24 .5 1 .6 22 .9 1 .9 3 .5 0 .4 Indiana (IN) . . . . . . . . . . . . . . . . . . . 32 .5 2 .8 21 .4 2 .3 5 .1 0 .6 Iowa (IA) . . . . . . . . . . . . . . . . . . . . . 27 .5 3 .2 13 .5 2 .5 4 .0 0 .6 Kansas (KS) . . . . . . . . . . . . . . . . . . 24 .6 3 .4 19 .1 2 .9 5 .5 1 .1 Kentucky (KY) . . . . . . . . . . . . . . . . . 32 .9 3 .0 23 .9 2 .7 5 .6 0 .8 Louisiana (LA) . . . . . . . . . . . . . . . . . 33 .2 3 .4 30 .8 3 .3 5 .4 0 .9 Maine (ME) . . . . . . . . . . . . . . . . . . . 33 .2 6 .1 14 .4 5 .0 4 .1 1 .3
Maryland (MD) . . . . . . . . . . . . . . . . . 20 .1 2 .6 25 .6 2 .4 3 .8 0 .6 Massachusetts . . . . . . . . . . . . . . . . . 19 .9 2 .6 15 .7 2 .0 1 .4 0 .3 Michigan (MI) . . . . . . . . . . . . . . . . . . 32 .4 2 .0 22 .1 1 .9 3 .7 0 .4 Minnesota (MN) . . . . . . . . . . . . . . . . 21 .0 2 .3 11 .6 1 .5 2 .7 0 .4 Mississippi (MS) . . . . . . . . . . . . . . . 42 .0 5 .0 35 .3 4 .5 6 .0 0 .9 Missouri (MO) . . . . . . . . . . . . . . . . . 34 .1 2 .9 22 .2 2 .7 5 .9 0 .8 Montana (MT) . . . . . . . . . . . . . . . . . 41 .3 5 .7 22 .9 6 .5 3 .8 1 .3 Nebraska (NE) . . . . . . . . . . . . . . . . . 22 .9 4 .0 13 .1 2 .9 4 .2 0 .9 Nevada (NV) . . . . . . . . . . . . . . . . . . 32 .5 4 .8 24 .3 4 .1 4 .8 1 .1 New Hampshire (NH) . . . . . . . . . . . 21 .0 6 .1 20 .0 5 .7 2 .8 1 .1
New Jersey (NJ) . . . . . . . . . . . . . . . 21 .6 2 .1 20 .4 2 .3 2 .9 0 .5 New Mexico (NM) . . . . . . . . . . . . . . 35 .9 4 .8 32 .7 5 .0 6 .0 1 .3 New York (NY) . . . . . . . . . . . . . . . . . 26 .1 1 .4 25 .1 1 .5 2 .8 0 .3 North Carolina (NC) . . . . . . . . . . . . . 33 .3 2 .1 23 .9 2 .0 5 .2 0 .5 North Dakota (ND) . . . . . . . . . . . . . . 24 .5 6 .1 7 .1 2 .7 4 .6 1 .4 Ohio (OH) . . . . . . . . . . . . . . . . . . . . 33 .6 2 .2 21 .0 1 .8 4 .9 0 .4 Oklahoma (OK) . . . . . . . . . . . . . . . . 33 .9 2 .8 20 .2 2 .6 6 .3 0 .7 Oregon (OR) . . . . . . . . . . . . . . . . . . 31 .7 4 .3 19 .3 2 .9 3 .1 0 .7 Pennsylvania (PA) . . . . . . . . . . . . . . 26 .5 1 .7 23 .1 1 .8 3 .6 0 .3 Rhode Island (RI) . . . . . . . . . . . . . . 22 .6 7 .4 15 .9 5 .7 2 .7 1 .0
South Carolina (SC) . . . . . . . . . . . . 38 .7 3 .3 29 .1 3 .9 6 .1 0 .8 South Dakota (SD) . . . . . . . . . . . . . 31 .5 5 .4 20 .6 5 .9 6 .0 1 .6 Tennessee (TN) . . . . . . . . . . . . . . . . 32 .6 2 .8 23 .1 2 .8 5 .0 0 .6 Texas (TX) . . . . . . . . . . . . . . . . . . . . 28 .7 1 .5 27 .6 1 .4 5 .9 0 .3 Utah (UT) . . . . . . . . . . . . . . . . . . . . . 18 .0 2 .7 16 .9 2 .6 4 .1 0 .8 Vermont (VT) . . . . . . . . . . . . . . . . . . 27 .5 8 .7 15 .1 5 .5 2 .5 1 .1 Virginia (VA) . . . . . . . . . . . . . . . . . . . 22 .4 2 .1 19 .9 2 .1 4 .0 0 .5 Washington (WA) . . . . . . . . . . . . . . . 22 .7 2 .4 16 .9 2 .1 3 .7 0 .6 West Virginia (WV) . . . . . . . . . . . . . 36 .9 5 .5 22 .1 5 .3 4 .5 1 .3 Wisconsin (WI) . . . . . . . . . . . . . . . . 23 .1 2 .3 13 .2 1 .8 3 .0 0 .5 Wyoming (WY) . . . . . . . . . . . . . . . . . 23 .4 6 .1 21 .2 7 .4 4 .8 1 .9
1 When the margin of error is added to or subtracted from the point estimate, it produces a 90 percent confidence interval .Source: U .S . Census Bureau, 2012 American Community Survey .
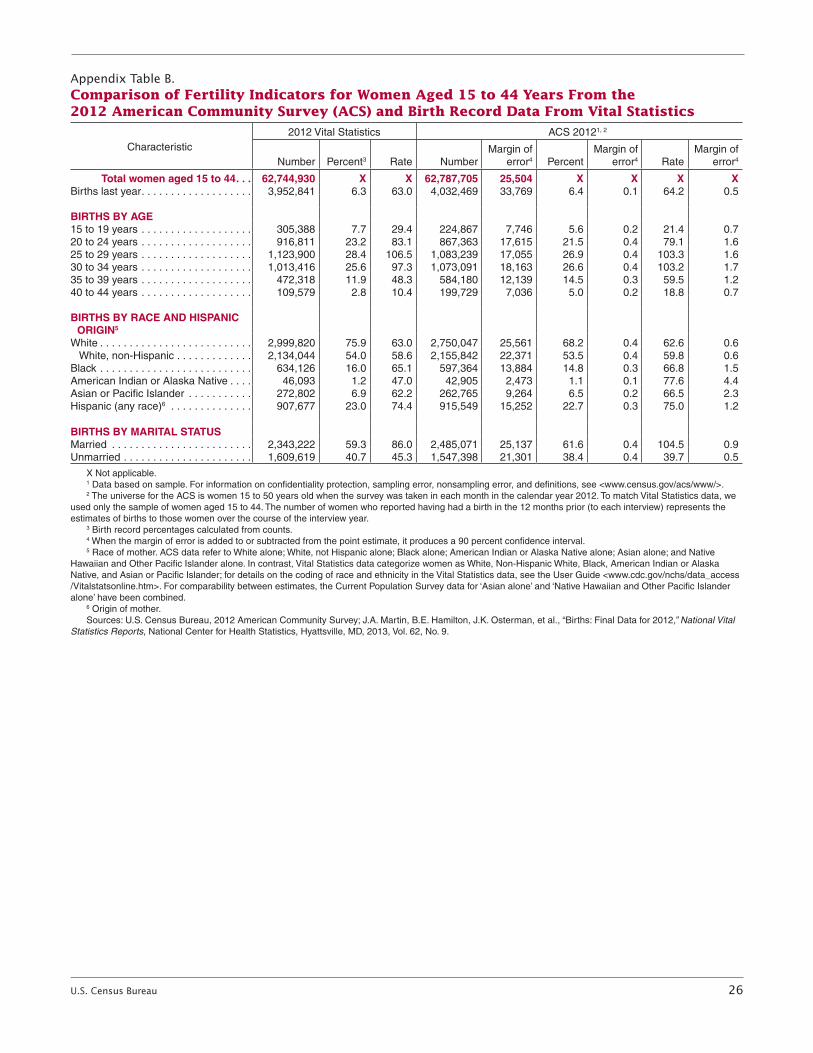
U.S. Census Bureau 26
Appendix Table B. Comparison of Fertility Indicators for Women Aged 15 to 44 Years From the 2012 American Community Survey (ACS) and Birth Record Data From Vital Statistics
Characteristic 2012 Vital Statistics ACS 20121, 2
Number Percent3 Rate NumberMargin of
error4 PercentMargin of
error4 RateMargin of
error4
Total women aged 15 to 44 . . . 62,744,930 X X 62,787,705 25,504 X X X XBirths last year . . . . . . . . . . . . . . . . . . . 3,952,841 6 .3 63 .0 4,032,469 33,769 6 .4 0 .1 64 .2 0 .5
BIRTHS BY AGE15 to 19 years . . . . . . . . . . . . . . . . . . . 305,388 7 .7 29 .4 224,867 7,746 5 .6 0 .2 21 .4 0 .7 20 to 24 years . . . . . . . . . . . . . . . . . . . 916,811 23 .2 83 .1 867,363 17,615 21 .5 0 .4 79 .1 1 .6 25 to 29 years . . . . . . . . . . . . . . . . . . . 1,123,900 28 .4 106 .5 1,083,239 17,055 26 .9 0 .4 103 .3 1 .6 30 to 34 years . . . . . . . . . . . . . . . . . . . 1,013,416 25 .6 97 .3 1,073,091 18,163 26 .6 0 .4 103 .2 1 .7 35 to 39 years . . . . . . . . . . . . . . . . . . . 472,318 11 .9 48 .3 584,180 12,139 14 .5 0 .3 59 .5 1 .2 40 to 44 years . . . . . . . . . . . . . . . . . . . 109,579 2 .8 10 .4 199,729 7,036 5 .0 0 .2 18 .8 0 .7
BIRTHS BY RACE AND HISPANIC ORIGIN5
White . . . . . . . . . . . . . . . . . . . . . . . . . . 2,999,820 75 .9 63 .0 2,750,047 25,561 68 .2 0 .4 62 .6 0 .6 White, non-Hispanic . . . . . . . . . . . . . 2,134,044 54 .0 58 .6 2,155,842 22,371 53 .5 0 .4 59 .8 0 .6 Black . . . . . . . . . . . . . . . . . . . . . . . . . . 634,126 16 .0 65 .1 597,364 13,884 14 .8 0 .3 66 .8 1 .5 American Indian or Alaska Native . . . . 46,093 1 .2 47 .0 42,905 2,473 1 .1 0 .1 77 .6 4 .4 Asian or Pacific Islander . . . . . . . . . . . 272,802 6 .9 62 .2 262,765 9,264 6 .5 0 .2 66 .5 2 .3 Hispanic (any race)6 . . . . . . . . . . . . . . 907,677 23 .0 74 .4 915,549 15,252 22 .7 0 .3 75 .0 1 .2
BIRTHS BY MARITAL STATUSMarried . . . . . . . . . . . . . . . . . . . . . . . . 2,343,222 59 .3 86 .0 2,485,071 25,137 61 .6 0 .4 104 .5 0 .9 Unmarried . . . . . . . . . . . . . . . . . . . . . . 1,609,619 40 .7 45 .3 1,547,398 21,301 38 .4 0 .4 39 .7 0 .5
X Not applicable .1 Data based on sample . For information on confidentiality protection, sampling error, nonsampling error, and definitions, see <www .census .gov/acs/www/> .2 The universe for the ACS is women 15 to 50 years old when the survey was taken in each month in the calendar year 2012 . To match Vital Statistics data, we
used only the sample of women aged 15 to 44 . The number of women who reported having had a birth in the 12 months prior (to each interview) represents the estimates of births to those women over the course of the interview year .
3 Birth record percentages calculated from counts .4 When the margin of error is added to or subtracted from the point estimate, it produces a 90 percent confidence interval .5 Race of mother . ACS data refer to White alone; White, not Hispanic alone; Black alone; American Indian or Alaska Native alone; Asian alone; and Native
Hawaiian and Other Pacific Islander alone . In contrast, Vital Statistics data categorize women as White, Non-Hispanic White, Black, American Indian or Alaska Native, and Asian or Pacific Islander; for details on the coding of race and ethnicity in the Vital Statistics data, see the User Guide <www .cdc .gov/nchs/data_access /Vitalstatsonline .htm> . For comparability between estimates, the Current Population Survey data for ‘Asian alone’ and ‘Native Hawaiian and Other Pacific Islander alone’ have been combined .
6 Origin of mother .Sources: U .S . Census Bureau, 2012 American Community Survey; J .A . Martin, B .E . Hamilton, J .K . Osterman, et al ., “Births: Final Data for 2012,” National Vital
Statistics Reports, National Center for Health Statistics, Hyattsville, MD, 2013, Vol . 62, No . 9 .