fertility, intra-generational redistribution, and social security sustainability
TRANSCRIPT

Fertility, Intra-Generational Redistribution,and Social Security Sustainability
Makoto Hirazawa School of Economics, Chukyo UniversityKoji Kitaura Faculty of Social Sciences, Hosei UniversityAkira Yakita Graduate School of Economics, Nagoya City
University
Abstract. Incorporating heterogeneity in preference to having children into an overlappinggenerations model of a small open economy, we examine the effects of changes in the sizeof pay-as-you-go (PAYG) social security on fertility choices of individuals and populationgrowth of the economy. It is shown that PAYG social security will raise populationgrowth by increasing the number of individuals who have children and the number ofchildren parents have if the system involves redistribution between retirees with differentcontributions, whereas, if it has no redistribution, PAYG social security does not affectthe fertility decisions of individuals. JEL classification: H55, J13, J14, J18
Fecondite, redistribution intra-generationnelle, et durabilite de la securite sociale. Incorpo-rant l’heterogeneite des preferences pour avoir des enfants dans un modele d’une petiteeconomie ouverte avec des generations qui se chevauchent, on examine les effets dechangements dans l’importance de la securite sociale par repartition sur les choix defecondite des individus et sur la croissance de la population dans l’economie. On montreque cette forme de securite sociale augmente la croissance de la population en accrois-sant a la fois le nombre de personnes qui ont des enfants et le nombre d’enfants que lesparents choisissent d’avoir si le systeme implique une redistribution entre les gens a laretraite qui ont fait des contributions differentes, alors que, si le regime n’implique aucune
The authors gratefully acknowledge two anonymous referees for their insightful comments andsuggestions. This paper was read at the 13th Annual Conference of the Association for PublicEconomic Theory (PET12), held at the Academia Sinica in Taiwan. The authors thank Davidde la Croix, Fabio Mariani, and the session participants for their insightful comments. They arealso grateful to Kazutoshi Miyazawa, Kazumasa Oguro, Shinji Yamashige and the seminarparticipants at the Demographic Transition and Public Finance Workshop (HitotsubashiUniversity) and the Nagoya Macroeconomics Workshop (Nagoya City University) for theirhelpful comments on earlier versions. The financial support from the Japan Security ScholarshipFoundation (Nihon Shoken Shogaku Zaidan) is gratefully acknowledged.Email: [email protected]; [email protected]; [email protected]
Canadian Journal of Economics/Revue canadienne d’Economique, Vol. 47, No. 1February / fevrier 2014. Printed in Canada / Imprime au Canada
0008-4085 / 14 / 98–114 / C© Canadian Economics Association
Fertility, Intra-Generational Redistribution 99
redistribution, le regime de securite sociale par repartition n’affecte pas les decisions defecondite des individus.
1. Introduction
Declining fertility rates put pressure on the financing of pay-as-you-go (PAYG)social security systems, especially, in western countries. The fertility decline mayalso endanger the sustainability of society itself in the sense that the populationmay approach zero (e.g., Cigno 1993; Sinn 2004). The cost of rearing childrenmust be shouldered by each household, while the size of a person’s pensionbenefits depends on everyone else’s fertility decisions, giving some individualsthe incentive for free-riding by receiving benefits without paying the cost (e.g.,Folbre 1994). Such free-riding is considered to exert negative effects on the fer-tility decisions of individuals. Thus, social security reforms have been proposedto resolve the problem by, for example, conversion of social security benefits toa parental dividend (Bental 1989; Burggraf 1993), to a (voluntary) self-financingsocial security program that promises a return equal to the individual fertil-ity rate (Eckstein and Wolpin 1985) or to a PAYG social security cum childallowance system (van Groezen et al. 2003). As a matter of fact, the social secu-rity systems employed in most developed countries involve some degree of suchintra-generational redistribution, although the works cited above assumed ho-mogeneous individuals. For example, a flat-rate benefit system partly financed byconsumption taxes will be introduced in Japan (e.g., the 2004 revision).1 The flat-rate benefit scheme involves intra-generational redistribution when individualsare heterogeneous, while consumption taxes will be proportional to the respectiveconsumption levels of individuals.
Our purpose in the present study is to examine the intra-generational redistri-bution effects of PAYG social security on the sustainability of the social securitysystem through changes in fertility decisions of individuals, that is, decisions asto whether or not to have children and how many, while focusing on the intra-generational redistribution through pension benefits between individuals withand without children. The longer the child-rearing time, the shorter the workingtime, and hence the lower the contribution to PAYG social security. Most of theliterature has not explicitly taken into account the effects of the intra-generationalredistribution through PAYG social security benefits on fertility decisions of in-dividuals in considering reforms of PAYG social security, although there aremany works assuming heterogeneous agents.2 The paper closest to our own is
1 It is often said that the trend of social security reform in the world is the switch fromdefined-benefit to defined-contribution systems. In contrast, the reform in Japan can be said tomaintain the property of “collective annuities” a la Cremer, Lozachmeur, and Pestieau (2010)through a defined-benefit system.
2 For example, assuming both wage inequality and longevity difference among individuals,Cremer, Lozachmeur, and Pestieau (2010) showed that when the former dominates, a flat rate

100 M. Hirazawa, K. Kitaura, and A. Yakita
that of Cremer, Gavari, and Pestieau (2008), who showed that, assuming bothendogenous fertility and heterogeneity in the ability to raise children, the optimalPAYG schemes require a marginal subsidy on fertility to correct for the external-ity under perfect information and additional subsidy, depending on whether theredistribution is geared more to people with more children. However, they didnot consider the forgone income of child rearing.3 The present paper takes intoaccount the trade-off in time allocation between market work and child rearing,which is important in the present context if the child-rearing cost consists of unitsof parents’ time, that is, forgone income of parents and units of goods (Barro andBecker 1989, 486). This is our contribution to the literature. The present studyassumes heterogeneity among individuals in the degree of their preference forhaving children.4
We show first that for a given social security contribution rate, the number ofindividuals who have children is greater when the benefit level is not linked to thecontribution, that is, under the Beveridgean benefit scheme, than when the benefitlevel is proportional to the contribution, that is, under the Bismarckian benefitscheme. Second, it is shown that a rise in the contribution rate increases thefertility rate through increases in the number of individuals who have childrenand the number of children they have under the Beveridgean scheme. In thiscase, therefore, it enhances the sustainability of the social security system in thesense that the supporters of both will increase in the future. In contrast, underthe Bismarckian benefit scheme without intra-generational redistribution, anincrease in the contribution rate does not affect the population growth rate, thatis, the rate of return to PAYG social security contributions.
This paper is organized as follows. The next two sections introduce the modelof a small open economy, and Section 4 examines the effect of a PAYG social se-curity system on the population growth rate of the economy and then the welfareeffects of a change in the contribution rate. We assume a defined-contributionsystem in the present study. Our analysis concentrates on steady states in orderto examine the long-term effects of the scheme change. Section 5 concludes thepaper.
benefit (Beveridgean) system is more welfare improving than a contribution (Bismarckian)system. Cremer, Lozachmeur, and Pestieau (2004) also showed that, assuming heterogeneousindividuals in the levels of productivity and health status, redistribution through social securitymay impose an implicit tax on postponed retirement, thus inducing early retirement for someindividuals. In the present study, we assume inequality in contributions, owing to differences inthe lengths of working time rather than wage inequality.
3 Their focus is, in contrast, the second-best policies rather than a positive analysis of socialsecurity reforms.
4 Zhang and Zhang (1998) emphasized the parental motive to have children in modellingendogenous fertility. However, unlike ours, they considered two basic utility configurations:altruistic and non-altruistic.

Fertility, Intra-Generational Redistribution 101
2. Model
We consider a small open economy facing the world interest rate, r, which isassumed to remain constant over time. Assuming a neoclassical constant-returns-to-scale production function and perfectly competitive factor markets, the wagerate, w, is also constant.
The economy is populated by overlapping generations of people who live forthree periods. Each individual is reared by his parent in the first period of life,works and possibly rears children in the second, and retires in the third. Individ-uals in each generation differ only in their preference for having children. Thedegree of the preference of an individual is represented by the (marginal) util-ity weight, α, of having children relative to material consumption.5 We assumethat α is distributed over [0, α] according to the cumulative distribution functionF(α) = ∫ α
0 f (x)dx, where f (x) is the density function and F(α) = 1.6 The distri-bution is assumed to be the same for every generation, though the populationsize may change over time.
2.1. IndividualsNormalizing the time endowment during the working period to one, and assum-ing that the rearing time per child ε is constant, the budget constraints of anindividual of generation t, who works in period t, in the second and third periodsare given, respectively, as
w(1 − τ )(1 − εnt) = c1t + st (1a)
Rst + σβt+1 = c2t+1, (1b)
where τ is the social security contribution rate in each period, nt is the number ofchildren he rears, c1
t and c2t+1 are consumption in the second and third periods, st
is savings, R = 1 + r is the gross rate of interest, and σβt+1 is the social securitybenefits paid to him in period t + 1. βt+1 denotes the social security benefits paidto the individuals who choose to have no children, that is, those who contributemost to the social security system, and the parameter σ reflects the extent ofintra-generational redistribution among retirees or, in other words, from theviewpoint of individuals, the degree of actuarial fairness of public pensions. Thecase of σ = 1 corresponds to full redistribution within the generation (i.e., a flat-rate benefit scheme or the Beveridgean scheme), while the case of σ = 1 − εnt
5 Alternatively, we may assume that α denotes the probability of having children. The parametershould be interpreted cautiously, since the number of children is not necessarily determined byparents’ preference in reality. There are many couples who do not have children even thoughthey want them. We exclude this case in our study.
6 The upper bound is assumed to be sufficiently great.
102 M. Hirazawa, K. Kitaura, and A. Yakita
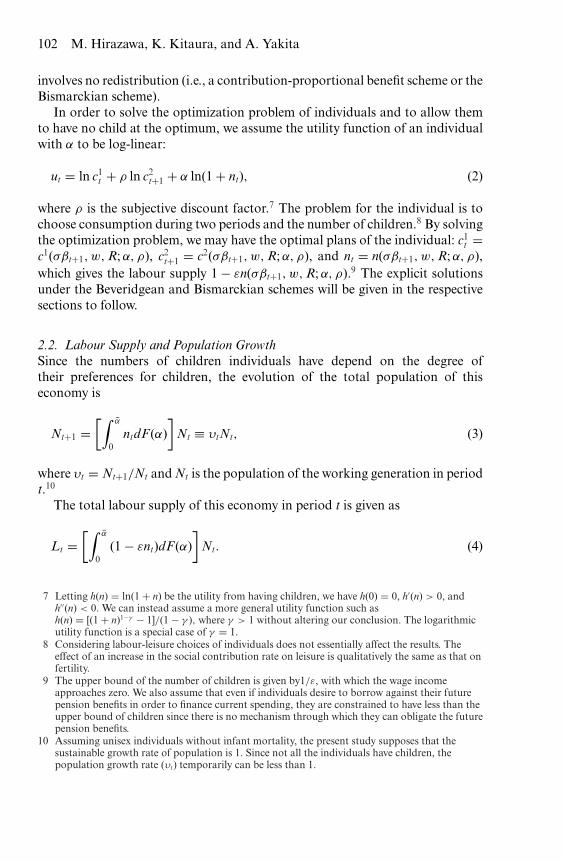
involves no redistribution (i.e., a contribution-proportional benefit scheme or theBismarckian scheme).
In order to solve the optimization problem of individuals and to allow themto have no child at the optimum, we assume the utility function of an individualwith α to be log-linear:
ut = ln c1t + ρ ln c2
t+1 + α ln(1 + nt), (2)
where ρ is the subjective discount factor.7 The problem for the individual is tochoose consumption during two periods and the number of children.8 By solvingthe optimization problem, we may have the optimal plans of the individual: c1
t =c1(σβt+1, w, R; α, ρ), c2
t+1 = c2(σβt+1, w, R; α, ρ), and nt = n(σβt+1, w, R; α, ρ),which gives the labour supply 1 − εn(σβt+1, w, R; α, ρ).9 The explicit solutionsunder the Beveridgean and Bismarckian schemes will be given in the respectivesections to follow.
2.2. Labour Supply and Population GrowthSince the numbers of children individuals have depend on the degree oftheir preferences for children, the evolution of the total population of thiseconomy is
Nt+1 =[∫ α
0ntdF(α)
]Nt ≡ υtNt, (3)
where υt = Nt+1/Nt and Nt is the population of the working generation in periodt.10
The total labour supply of this economy in period t is given as
Lt =[∫ α
0(1 − εnt)dF(α)
]Nt. (4)
7 Letting h(n) = ln(1 + n) be the utility from having children, we have h(0) = 0, h′(n) > 0, andh′′(n) < 0. We can instead assume a more general utility function such ash(n) = [(1 + n)1−γ − 1]/(1 − γ ), where γ > 1 without altering our conclusion. The logarithmicutility function is a special case of γ = 1.
8 Considering labour-leisure choices of individuals does not essentially affect the results. Theeffect of an increase in the social contribution rate on leisure is qualitatively the same as that onfertility.
9 The upper bound of the number of children is given by1/ε, with which the wage incomeapproaches zero. We also assume that even if individuals desire to borrow against their futurepension benefits in order to finance current spending, they are constrained to have less than theupper bound of children since there is no mechanism through which they can obligate the futurepension benefits.
10 Assuming unisex individuals without infant mortality, the present study supposes that thesustainable growth rate of population is 1. Since not all the individuals have children, thepopulation growth rate (υt) temporarily can be less than 1.
Fertility, Intra-Generational Redistribution 103
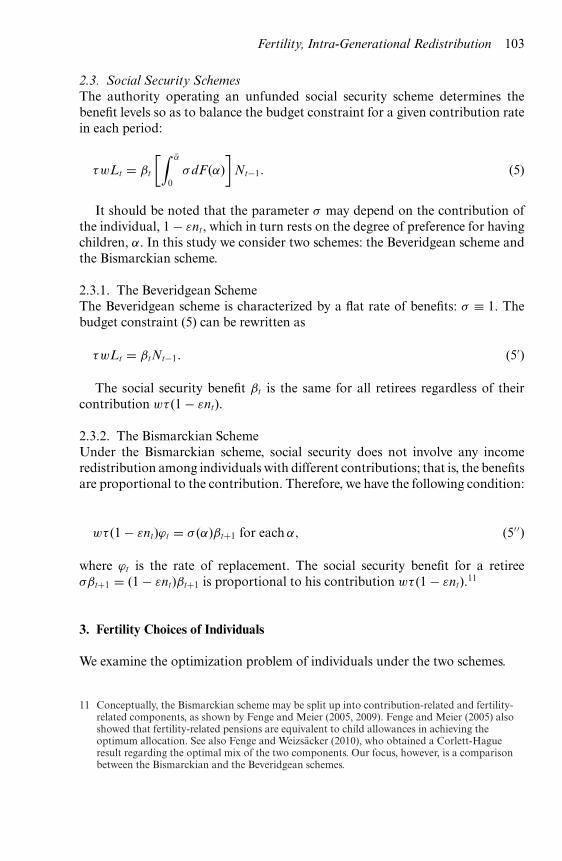
2.3. Social Security SchemesThe authority operating an unfunded social security scheme determines thebenefit levels so as to balance the budget constraint for a given contribution ratein each period:
τwLt = βt
[∫ α
0σdF(α)
]Nt−1. (5)
It should be noted that the parameter σ may depend on the contribution ofthe individual, 1 − εnt, which in turn rests on the degree of preference for havingchildren, α. In this study we consider two schemes: the Beveridgean scheme andthe Bismarckian scheme.
2.3.1. The Beveridgean SchemeThe Beveridgean scheme is characterized by a flat rate of benefits: σ ≡ 1. Thebudget constraint (5) can be rewritten as
τwLt = βtNt−1. (5′)
The social security benefit βt is the same for all retirees regardless of theircontribution wτ (1 − εnt).
2.3.2. The Bismarckian SchemeUnder the Bismarckian scheme, social security does not involve any incomeredistribution among individuals with different contributions; that is, the benefitsare proportional to the contribution. Therefore, we have the following condition:
wτ (1 − εnt)ϕt = σ (α)βt+1 for each α, (5′′)
where ϕt is the rate of replacement. The social security benefit for a retireeσβt+1 = (1 − εnt)βt+1 is proportional to his contribution wτ (1 − εnt).11
3. Fertility Choices of Individuals
We examine the optimization problem of individuals under the two schemes.
11 Conceptually, the Bismarckian scheme may be split up into contribution-related and fertility-related components, as shown by Fenge and Meier (2005, 2009). Fenge and Meier (2005) alsoshowed that fertility-related pensions are equivalent to child allowances in achieving theoptimum allocation. See also Fenge and Weizsacker (2010), who obtained a Corlett-Hagueresult regarding the optimal mix of the two components. Our focus, however, is a comparisonbetween the Bismarckian and the Beveridgean schemes.

104 M. Hirazawa, K. Kitaura, and A. Yakita
3.1. Under the Beveridgean SchemeThe optimization problem of individuals is to choose consumption and thenumber of children so as to maximize the lifetime utility (2) with respect tothe budget constraints (1) and the non-negative constraint on the number ofchildren:
Maxc1
t ,c2t+1,nt
ln c1t + ρ ln c2
t+1 + α ln(1 + nt)
s.t. w(1 − τ )(1 − εnt) − c1t − (c2
t+1 − βt+1)/R = 0 (6)
nt ≥ 0. (7)
Denoting the Lagrangean multipliers attached to the constraints (6) and (7)by λt and θt, respectively, the first-order conditions are
1/c1t − λt = 0 (8a)
ρ/c2t+1 − λt/R = 0 (8b)
α/(1 + nt) − λtw(1 − τ )ε + θt = 0 (8c)
θtnt = 0, θt ≥ 0. (8d)
Condition (8d) implies that (i) nt > 0 and θt = 0 or (ii) nt = 0 and θt ≥ 0.In case (i), the conditions (8a)–(8c) give the solution (c1
t , c2t+1, nt) > 0, while in
case (ii), the conditions determine (c1t , c2
t+1, θt) > 0. The optimum plans can beobtained as follows:
Case (i) : c1t = [w(1 − τ )(1 + ε) + (βt+1/R)]/(1 + ρ + α) (9)
nt = {w(1 − τ )[α − ε(1 + ρ)] + α(βt+1/R)}/[w(1 − τ )ε(1 + ρ + α)], (10)
where∂nt
∂α= 1 + ρ
w(1 − τ )εw(1 − τ )(1 + ε) + βt+1/R
(1 + ρ + α)2> 0 (11a)
Fertility, Intra-Generational Redistribution 105
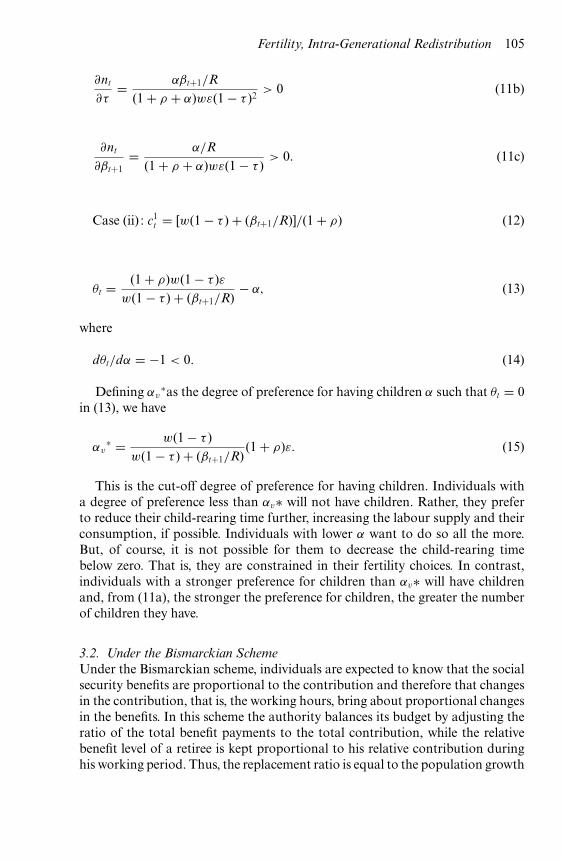
∂nt
∂τ= αβt+1/R
(1 + ρ + α)wε(1 − τ )2> 0 (11b)
∂nt
∂βt+1= α/R
(1 + ρ + α)wε(1 − τ )> 0. (11c)
Case (ii) : c1t = [w(1 − τ ) + (βt+1/R)]/(1 + ρ) (12)
θt = (1 + ρ)w(1 − τ )εw(1 − τ ) + (βt+1/R)
− α, (13)
where
dθt/dα = −1 < 0. (14)
Defining αv∗as the degree of preference for having children α such that θt = 0
in (13), we have
αv∗ = w(1 − τ )
w(1 − τ ) + (βt+1/R)(1 + ρ)ε. (15)
This is the cut-off degree of preference for having children. Individuals witha degree of preference less than αv∗ will not have children. Rather, they preferto reduce their child-rearing time further, increasing the labour supply and theirconsumption, if possible. Individuals with lower α want to do so all the more.But, of course, it is not possible for them to decrease the child-rearing timebelow zero. That is, they are constrained in their fertility choices. In contrast,individuals with a stronger preference for children than αv∗ will have childrenand, from (11a), the stronger the preference for children, the greater the numberof children they have.
3.2. Under the Bismarckian SchemeUnder the Bismarckian scheme, individuals are expected to know that the socialsecurity benefits are proportional to the contribution and therefore that changesin the contribution, that is, the working hours, bring about proportional changesin the benefits. In this scheme the authority balances its budget by adjusting theratio of the total benefit payments to the total contribution, while the relativebenefit level of a retiree is kept proportional to his relative contribution duringhis working period. Thus, the replacement ratio is equal to the population growth

106 M. Hirazawa, K. Kitaura, and A. Yakita
rate under this scheme. We assume here the perfect foresight of individuals withrespect to the replacement rate. Therefore, we have ϕt = υt.
12
Taking (5′′) into account, the budget constraint of an individual of generationt can be rewritten as
w(1 − εnt){1 − τ [1 − (υt/R)]} = c1t + (c2
t+1/R). (16)
Thus, the maximization problem of an individual can be written as
Maxc1
t ,c2t+1,nt
ln c1t + ρ ln c2
t+1 + α ln(1 + nt)
s.t. (16)
nt ≥ 0. (7)
Denoting the Lagrangean multipliers attached to the constraints (16) and (7)by μt and ηt, respectively, we obtain
1/c1t − μt = 0 (17a)
ρ/c2t+1 − μt/R = 0 (17b)
α/(1 + nt) − μtwε{1 − τ [1 − (υt/R)]} + ηt = 0 (17c)
ηtnt = 0, ηt ≥ 0. (17d)
As in the previous case, we have two cases: (i) nt > 0 and ηt = 0 and (ii) nt = 0andηt ≥ 0. We obtain the optimal plan in each case as follows:
Case (i) : c1t = w(1 + ε){1 − τ [1 − (υt/R)]}/(1 + ρ + α) (18)
nt = [α − (1 + ρ)ε]/[(1 + ρ + α)ε], (19)
where
∂nt
∂α= 1 + ε
ε
1 + ρ
(1 + ρ + α)2> 0,
∂nt
∂τ= 0 and
∂nt
∂βt+1= 0. (20)
12 In the present setting, although the per worker wage rate remains constant, the aggregateincome grows at the rate of population growth.

Fertility, Intra-Generational Redistribution 107
Case (ii) : c1t = w{1 − τ [1 − (υt/R)]}/(1 + ρ) (21)
ηt = (1 + ρ)ε − α (22)
where dηt/dα = −1 < 0. (23)
Defining αs∗ as the degree of preference for having children α such that ηt = 0,we have
αs∗ = (1 + ρ)ε. (24)
This is the cut-off degree of preference for having children. Individuals with adegree of preference less than αs∗ will not have children. As in the Beveridgeancase, they rather wish to further reduce their child-rearing time, increasing thelabour supply and their consumption if possible. Individuals with lower α wantto do so all the more, but they cannot. Thus, individuals with α < αs∗ are con-strained in their fertility choices. In contrast, individuals with a greater preferencefor children than αs∗ will have children and, from (20), the stronger the preferencefor children, the greater the number of children they have.
3.3. The Beveridgean Scheme versus the Bismarckian SchemeIf there are individuals with sufficiently little preference for having children, someindividuals will not have children under both schemes, as shown in (15) and (24).Since the social security benefits are positive, we have
αs∗ > αv
∗. (25)
That is, for the same contribution rate, the cut-off degree of preference forhaving children under the Beveridgean scheme is lower than that under theBismarckian scheme. There are individuals who would have children under theBeveridgean scheme but not under the Bismarckian scheme. Comparing (10) with(19), we can see that for an individual with a degree of preference for children, ifhe has children, the number of children preferred under the Beveridgean schemeis greater than that under the Bismarckian scheme. Thus, we have the followingresult:13
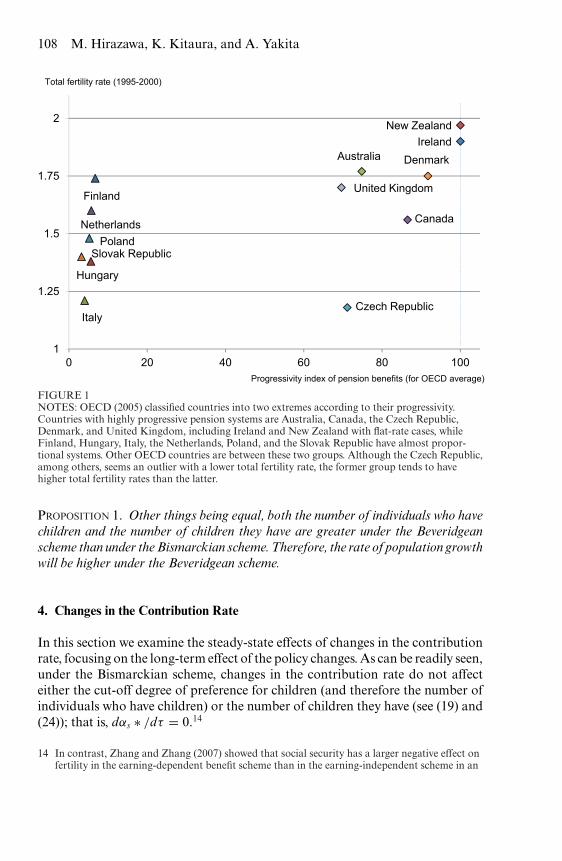
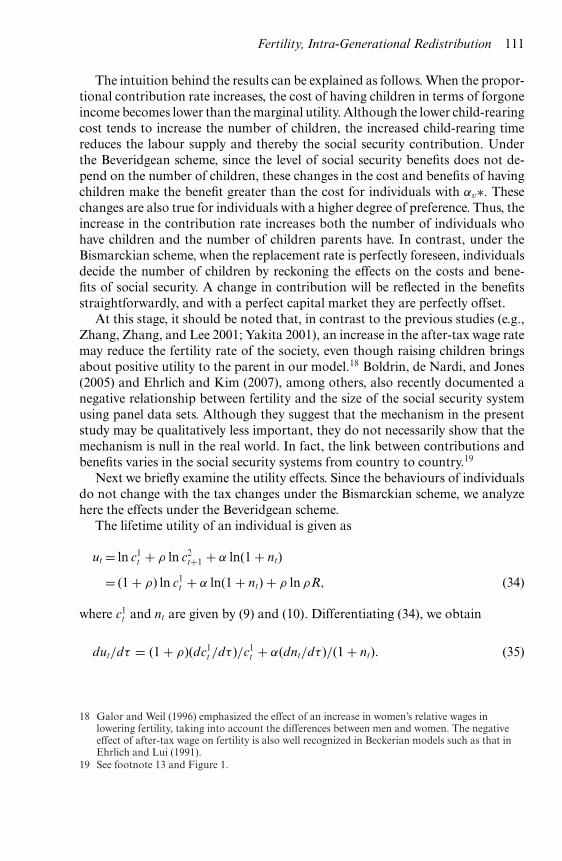
13 The social security systems of Ireland and New Zealand are the flat-rate schemes, that is, theBeveridgean scheme, while those in Italy and the Slovak Republic have a close link betweencontributions and benefits, that is, nearly the Bismarckian scheme (see OECD 2005); Irelandand New Zealand had total fertility rates of 1.90 and 1.97 during 1995–2000, respectively, higherthan those in Italy and Slovak Republic of 1.21 and 1.40, respectively (UN 2003). See Figure 1.
108 M. Hirazawa, K. Kitaura, and A. Yakita
Finland
Hungary
Italy
NetherlandsPoland
Slovak Republic
IrelandNew Zealand
Australia
Canada
Czech Republic
Denmark
United Kingdom
1
1.25
1.5
1.75
2
0 20 40 60 80 100
Total fertility rate (1995-2000)
Progressivity index of pension benefits (for OECD average)
FIGURE 1NOTES: OECD (2005) classified countries into two extremes according to their progressivity.Countries with highly progressive pension systems are Australia, Canada, the Czech Republic,Denmark, and United Kingdom, including Ireland and New Zealand with flat-rate cases, whileFinland, Hungary, Italy, the Netherlands, Poland, and the Slovak Republic have almost propor-tional systems. Other OECD countries are between these two groups. Although the Czech Republic,among others, seems an outlier with a lower total fertility rate, the former group tends to havehigher total fertility rates than the latter.
PROPOSITION 1. Other things being equal, both the number of individuals who havechildren and the number of children they have are greater under the Beveridgeanscheme than under the Bismarckian scheme. Therefore, the rate of population growthwill be higher under the Beveridgean scheme.
4. Changes in the Contribution Rate
In this section we examine the steady-state effects of changes in the contributionrate, focusing on the long-term effect of the policy changes. As can be readily seen,under the Bismarckian scheme, changes in the contribution rate do not affecteither the cut-off degree of preference for children (and therefore the number ofindividuals who have children) or the number of children they have (see (19) and(24)); that is, dαs ∗ /dτ = 0.14
14 In contrast, Zhang and Zhang (2007) showed that social security has a larger negative effect onfertility in the earning-dependent benefit scheme than in the earning-independent scheme in an

Fertility, Intra-Generational Redistribution 109
On the other hand, under the Beveridgean scheme, from (3), (4), and (5) andmaking use of the result in Section 3.1, we obtain
dβ
dτ= w
[∫ α∗
0dF(α)+
∫ α
α∗(1−εn)dF(α)
]υ−wτευ
∫ α
α∗
(∂n∂τ
+ ∂n∂β
dβ
dτ
)dF(α)
+wτ
[∫ α∗
0dF(α)+
∫ α
α∗(1−εn)dF(α)
]dυ
dτ(26)
dυ
dτ=∫ α
α∗
(∂n∂τ
+ ∂n∂β
dβ
dτ
)dF(α), (27)
where n(α∗) = 0 is used. (In this section, notation α∗ is used instead of αv∗ whenit is not confusing.) Inserting (27) into (26), we have
dβ
dτ
{1 + β
[ε∫ α∗
0 dF(α) + ∫ α
α∗ (1 − εn)dF(α)− 1
υ
](∫ α
α∗
∂n∂β
dF(α))}
= β
{1τ
−[
ε∫ α∗0 dF(α) + ∫ α
α∗ (1 − εn)dF(α)− 1
υ
](∫ α
α∗
∂n∂τ
dF(α))}
, (28)
where, assuming 1 − 2εnt > 0, we have15
ε∫ α∗0 dF(α) + ∫ α
α∗ (1 − εn)dF(α)− 1
υ≡ V < 0.
Differentiating αv∗ in (15) with respect to τ , we have
[1 + β
Rw(1 − τ )
]2 dα∗dτ
+ (1 + ρ)εRw(1 − τ )
dβ
dτ= − (1 + ρ)εβ
Rw(1 − τ )2. (29)
From (28) and (29) we have
⎛⎝ 1 + βV (
∫ α
α∗∂n∂β
dF) 0
(1+ρ)εRw(1−τ ) [1 + β
Rw(1−τ ) ]2
⎞⎠(
dβ
dτ
dα∗dτ
)=⎛⎝ β
τ− βV (
∫ α
α∗∂n∂τ
dF)
− (1+ρ)εβRw(1−τ )2
⎞⎠ . (30)
overlapping-generations model with operative bequest. The difference between us stems fromthe fact that the bequest costs tend to reduce the number of children in their model, while thereare no such costs in our model.
15 Since, if ε = 0.075, as in de la Croix and Doepke (2003), we have 1/ε = 13.33, the conditionholds plausibly.

110 M. Hirazawa, K. Kitaura, and A. Yakita
From (30) we obtain
dβ
dτ= G−1
[β
τ− βV
(∫ α
α∗
∂n∂τ
dF)][
1 + β
Rw(1 − τ )
]2
(31)
dα∗dτ
= G−1 −(1 + ρ)εβRw(1 − τ )
{[1 + βV
(∫ α
α∗
∂n∂β
dF)]
11 − τ
+ 1τ
− V(∫ α
α∗
∂n∂τ
dF)}
,
(32)
where
G =[
1 + βV(∫ α
α∗
∂n∂β
dF)][
1 + β
Rw(1 − τ )
]2
.
We assume here that G > 0.16 Therefore, it follows that
dαv ∗ /dτ < 0, (33)
and dβ/dτ > 0. An increase in the contribution rate lowers the cut-off degree ofpreference for children and therefore increases the number of individuals whohave children under the Beveridgean scheme. Together with (11b) and (11c), theincreased contribution rate raises the fertility rate in the economy as a whole.Thus, we have the following proposition.17
PROPOSITION 2.
i) Under the Beveridgean scheme, an expansion of social security reduces the cut-off degree, thereby raising the population growth rate of the economy throughincreasing both the number of individuals who have children and the numberof children they have.
ii) Under the Bismarckian scheme, an increase in the social security contributiondoes not affect either the number of individuals who have children or the numberof children they have.
16 Otherwise, if G < 0, we have dβ/dτ < 0; that is, decreases in the contribution rate raise the levelof social security benefits, implausible as it seems.
17 Our results crucially depend on the assumption of the payroll tax for social security. However, itis not implausible, and is even common in the literature, to assume non-lump-sum contribu-tions. See, for example, Sinn (2004) and Zhang, Zhang, and Lee (2001), although Bental (1989)and van Groezen, Leers, and Meijdam (2003) assumed lump-sum taxes. Samuelson (1975)showed the effect of PAYG social security on the dynamic resource allocation assuming alump-sum contribution by identical individuals. In the real world, for instance, Swedenintroduced a proportional tax in 1999, while Japan has adopted different schemes withlump-sum and proportional contributions.
Fertility, Intra-Generational Redistribution 111
The intuition behind the results can be explained as follows. When the propor-tional contribution rate increases, the cost of having children in terms of forgoneincome becomes lower than the marginal utility. Although the lower child-rearingcost tends to increase the number of children, the increased child-rearing timereduces the labour supply and thereby the social security contribution. Underthe Beveridgean scheme, since the level of social security benefits does not de-pend on the number of children, these changes in the cost and benefits of havingchildren make the benefit greater than the cost for individuals with αv∗. Thesechanges are also true for individuals with a higher degree of preference. Thus, theincrease in the contribution rate increases both the number of individuals whohave children and the number of children parents have. In contrast, under theBismarckian scheme, when the replacement rate is perfectly foreseen, individualsdecide the number of children by reckoning the effects on the costs and bene-fits of social security. A change in contribution will be reflected in the benefitsstraightforwardly, and with a perfect capital market they are perfectly offset.
At this stage, it should be noted that, in contrast to the previous studies (e.g.,Zhang, Zhang, and Lee 2001; Yakita 2001), an increase in the after-tax wage ratemay reduce the fertility rate of the society, even though raising children bringsabout positive utility to the parent in our model.18 Boldrin, de Nardi, and Jones(2005) and Ehrlich and Kim (2007), among others, also recently documented anegative relationship between fertility and the size of the social security systemusing panel data sets. Although they suggest that the mechanism in the presentstudy may be qualitatively less important, they do not necessarily show that themechanism is null in the real world. In fact, the link between contributions andbenefits varies in the social security systems from country to country.19
Next we briefly examine the utility effects. Since the behaviours of individualsdo not change with the tax changes under the Bismarckian scheme, we analyzehere the effects under the Beveridgean scheme.
The lifetime utility of an individual is given as
ut = ln c1t + ρ ln c2
t+1 + α ln(1 + nt)
= (1 + ρ) ln c1t + α ln(1 + nt) + ρ ln ρR, (34)
where c1t and nt are given by (9) and (10). Differentiating (34), we obtain
dut/dτ = (1 + ρ)(dc1t /dτ )/c1
t + α(dnt/dτ )/(1 + nt). (35)
18 Galor and Weil (1996) emphasized the effect of an increase in women’s relative wages inlowering fertility, taking into account the differences between men and women. The negativeeffect of after-tax wage on fertility is also well recognized in Beckerian models such as that inEhrlich and Lui (1991).
19 See footnote 13 and Figure 1.

112 M. Hirazawa, K. Kitaura, and A. Yakita
From (9) and (10) we obtain
dc1t /dτ = [−w(1 + ε)R + (dβt+1/dτ )]/[(1 + ρ + α)R] (36)
dnt/dτ = α[(1 − τ )(dβt+1/dτ ) + βt+1]/[wε(1 + ρ + α)(1 − τ )2R] > 0. (37)
If dβt+1/dτ ( > 0) is sufficiently great (small), we have dc1t /dτ >(<) 0 in (36).
Therefore, we have the following two cases. If dβt+1/dτ is sufficiently great,(35) is positive. In this case, the utility effect of an increase in the contributionrate is positive for all degrees of preference for children.20 On the other hand,if dβt+1/dτ is small, the first term on the right-hand side of (35) is negative.Therefore, for individuals whose degree of preference for children is too small tohave children, the utility effect is negative, since the second term on the right-handside of (35) is absent. For individuals with a sufficiently high degree of preferencefor children, the positive second term will dominate the negative first, makingthe utility effect positive. For individuals with intermediate preference, the utilityeffect is ambiguous. When an increase in the contribution rate does not increasethe benefit level sufficiently, the redistribution from individuals without childrento those with children will improve the welfare of the latter individuals at the costof the former.
Since the capital labour ratio of the economy as a whole remains constant,the decreased total labour supply is associated with a reduction in total capitalper worker, Kt/Nt, where Kt is the total capital. Under the constant-returns-to-scale technology, total output per worker also decreases. However, since a higherfertility rate increases the number of workers, whether the total capital decreasesor not is ambiguous. On the other hand, savings of an individual is given asst = w(1 − τ )(1 − εnt) − c1
t , from which we have
dst/dτ = −w(1 − εnt) − wε(1 − τ )(dnt/dτ ) − (dc1t /dτ ). (38)
From (36) and (37), we can show that, if dβt+1/dτ is great enough to holddc1
t /dτ > 0, we have dst/dτ < 0 for all workers, that is, total savings decreases,and that if dc1
t /dτ < 0, the effect on the total savings is not clear. Therefore,whether capital flows into or out of the economy is ambiguous in general. Itis noted that, even if dβt+1/dτ is sufficiently great and hence the lifetime utilityincreases for all degrees of preference, increases in the contribution rate do notnecessarily increase capital flows into the economy.
20 Under plausible values of parameters of τ and ε (as in fn15), if population growth rate is lowrelative to the interest rate, for example, when the economy is in the dynamic efficient range, wewill have dc1/dτ < 0.

Fertility, Intra-Generational Redistribution 113
5. Concluding Remarks
Assuming heterogeneity of individuals with respect to the preference for havingchildren in an overlapping-generations model of a small open economy, we ex-amined the effect of a change in the size of the PAYG social security system onfertility through redistribution among beneficiaries with different contributionsdue to different child-rearing time. The feature of this model is the existenceof the cut-off degree of preference: that is, individuals with a lower degree ofpreference than the cut-off degree do not have children. Redistribution from in-dividuals without children and with a high contribution to those with childrenand low contributions raises the fertility rate of the economy under the Bev-eridgean scheme. If social security benefits do not involve redistribution amongretirees, that is, under the Bismarckian scheme, the size of the social securitysystem does not affect fertility. Thus, the social security scheme with flat-rate,rather than contribution-proportional, benefits will enhance the sustainabilityof the social security system in the sense that the fertility rate is higher for agiven contribution rate. This result may indicate a promising direction of socialsecurity reforms for sustainability.
We have assumed away other public expenditures in order to focus on socialsecurity. Long-term care, for example, may expand life expectancy, requiring inturn more pension benefit payment. We have also assumed a small open economy.If the wage rate is affected by the labour supply, as in a closed economy, the effectof an increase in the contribution rate on the benefit level may be negative whenthe wage decrease is too great. In that case, the fertility rate may be lowered bythe raised contribution rate. Finally, technical progress may raise the wage rate,which may in turn decrease the number of individuals having children. Theseissues are subjects for future research.
References
Barro, R.J., and G.S. Becker (1989) “Fertility Choice in a Model of Economic Growth.”Econometrica 57, 481–501
Bental, B. (1989) “The Old Age Security Hypothesis and Optimal Population Growth.”Journal of Population Economics 1, 285–301
Boldrin, M., M. de Nardi, and L.E. Jones (2005) “Fertility and Social Security.” NBERWorking Paper No. 11146
Burggraf, S.P. (1993) “How Should the Cost of Child Rearing be Distributed?’ Challenge36, 48–55
Cigno, A. (1993) “Intergenerational Transfers without Altruism: Family, Market andState.” European Journal of Political Economy 9, 505–18
Cremer, H., F. Gavari, and P. Pestieau (2008) “Pensions with Heterogeneous Individualsand Endogenous Fertility.” Journal of Population Economics 21, 961–81
Cremer, H., J.-M. Lozachmeur, and P. Pestieau (2004) “Social Security, Retirement Ageand Optimal Income Taxation.” Journal of Public Economics 88, 2259–81

114 M. Hirazawa, K. Kitaura, and A. Yakita
— (2010) “Collective Annuities and Redistribution.” Journal of Public Economic Theory12, 23–41
de la Croix, D., and M. Doepke (2003) “Inequality and Growth: Why DifferentialFertility Matters.” American Economic Review 93, 1091–113
Eckstein, Z., and K.I. Wolpin (1985) “Endogenous Fertility and Optimal PopulationSize.” Journal of Public Economics 27, 93–106
Ehrlich, I., and J. Kim (2007) “Social Security, Demographic Trends and EconomicGrowth: Theory and Evidence from the International Experience.” Review ofEconomic Dynamics 10, 55–77
Ehrlich, I., and F. Lui (1991) “Intergenerational Trade, Longevity, and EconomicGrowth.” Journal of Political Economy 99, 1029–59
Fenge, R., and V. Meier (2005) “Pensions and Fertility Incentives.” Canadian Journal ofEconomics 38, 28–48
— (2009) “Are Family Allowances and Fertility-Related Pensions Perfect Substitutes?”International Tax and Public Finance 16, 137–63
Fenge, R., and J. von Weizsacker (2010) “Mixing Bismarck and Child Pension Systems:An Optimum Taxation Approach.” Journal of Population Economics 23, 805–23
Folbre, N. (1994) “Children as Public Goods.” American Economic Review, Papers andProceedings 84, 86–90
Galor, O., and D.N. Weil (1996) “The Gender Gap, Fertility, and Growth.” AmericanEconomic Review 86, 374–87
OECD (2005) Pensions at a Glance. Paris: OECDSamuelson, P.A. (1975) “The Optimal Growth Rate of Population.” International
Economic Review 16, 531–8Sinn, H.-W. (2004) “The Pay-As-You-Go Pension System As a Fertility Insurance and
Enforcement Device.” Journal of Public Economics 88, 1335–57United Nations (UN) (2003) World Population Prospects: The 2002 Revision. Vol. 1:
Comprehensive Tables. New York: United Nationsvan Groezen, B., T. Leers, and L. Meijdam (2003) “Social Security and Endogenous
Fertility: Pension and Child Allowances as Siamese Twins.” Journal of PublicEconomics 87, 233–51
Yakita, A. (2001) “Uncertain Lifetime, Fertility and Social Security.” Journal ofPopulation Economics 14, 635–40
Zhang, J., and J. Zhang (1998) “Social Security, International Transfers, andEndogenous Growth.” Canadian Journal of Economics 31, 1225–41
— (2007) “Optimal Social Security in a Dynastic Model with Investment Externalitiesand Endogenous Fertility.” Journal of Economic Dynamics and Control 31, 3545–67
Zhang, J., J. Zhang, and R. Lee (2001) “Mortality Decline and Long-Run EconomicGrowth.” Journal of Public Economics 80, 485–507