ferric sulphate leaching of pyrrhotite tailings · ii ferric sulfate leaching of pyrrhotite...
TRANSCRIPT

FERRIC SULPHATE LEACHING OF PYRRHOTITE
TAILINGS
by
Nazanin Samadifard
A thesis submitted in conformity with the requirements
for the degree of Master of Applied Science
Graduate Department of Chemical Engineering and Applied Chemistry
University of Toronto
© Copyright by Nazanin Samadifard 2015

ii
Ferric Sulfate Leaching of Pyrrhotite Tailings
Nazanin Samadifard
Master of Applied Science
Department of Chemical Engineering and Applied Chemistry
University of Toronto
2015
Abstract
The present study investigates the potential to recover nickel from pyrrhotite tailings produced
at the smelting operations of Vale in Sudbury, Ontario. Leaching tests were performed in acidic
ferric sulphate media with 0.14 wt.% solids. The temperature was varied between 30 °C and
55 °C, and the ferric concentration was in a range 0.02- 0.3 M. The shrinking core model (SCM)
was applied on the nickel extraction data. The dominant reaction mechanism was found to be
diffusion control. The Arrhenius plot yielded an activation energy of Ea=62.12 kJ/mol based on
apparent reaction rates obtained by the SCM. The reaction order with respect to ferric ion was
found to be 1.0 at the high concentration range. SEM images of partially leached tailings
confirmed the presence of elemental sulphur around the pyrrhotite particles, which was
responsible for the observed non-linear leaching kinetics (diffusion control).

iii
Acknowledgments
I would like to express my sincere appreciation to my supervisor Dr. Vladimiros Papangelakis
for his constant support, guidance and patience throughout the course of my study.
Financial support of Vale Canada, Glencore, the Ontario Centers of Excellence (OCE), the
Centre for Excellence in Mining Innovation (CEMI), and the Natural Sciences and Engineering
Research Council of Canada (NSERC) are gratefully acknowledged.
I would extend my grateful thanks to Dr. Cheryl Washer for being a great consultant in the later
stages of my project, and other members of APEC laboratory for their friendship, guidance and
generosity.
The most sincere gratitude goes to my parents and my lovely family for their support and
encouragement in all aspects of my life.
Finally, I dedicate this thesis to my dear husband Mohammadreza Dadkhah for his
unconditional love and support during the completion of my master’s degree.
iv
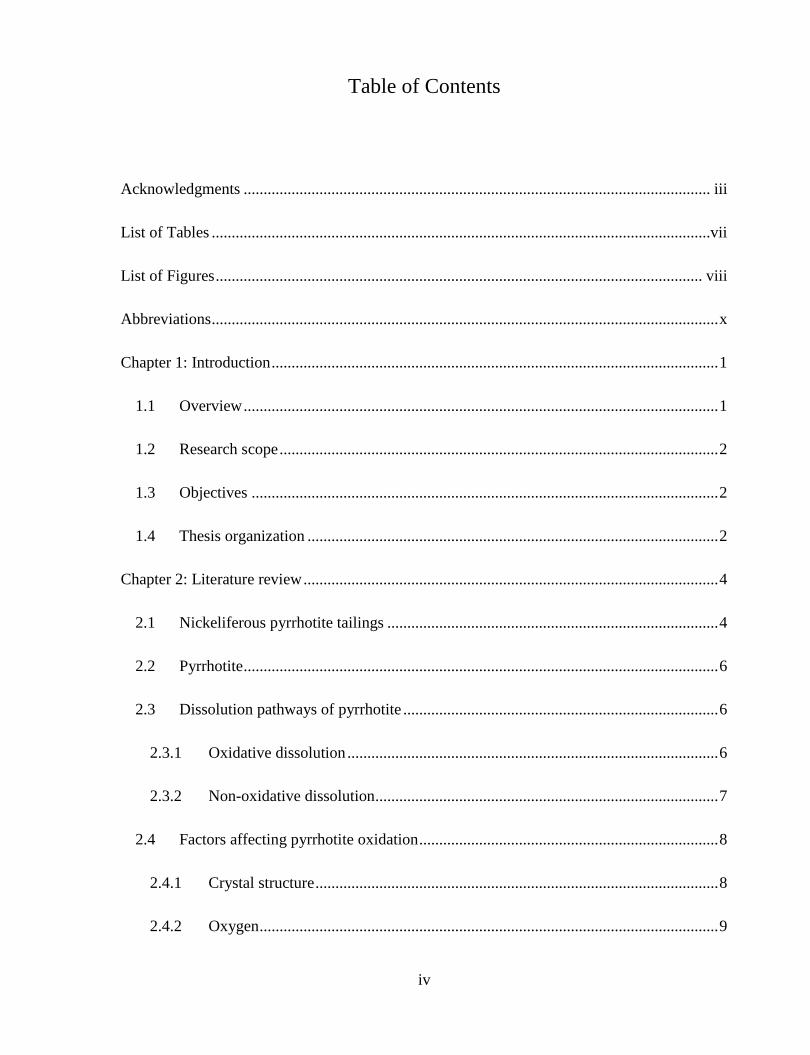
Table of Contents
Acknowledgments ..................................................................................................................... iii
List of Tables .............................................................................................................................vii
List of Figures .......................................................................................................................... viii
Abbreviations ............................................................................................................................... x
Chapter 1: Introduction ................................................................................................................ 1
1.1 Overview ....................................................................................................................... 1
1.2 Research scope .............................................................................................................. 2
1.3 Objectives ..................................................................................................................... 2
1.4 Thesis organization ....................................................................................................... 2
Chapter 2: Literature review ........................................................................................................ 4
2.1 Nickeliferous pyrrhotite tailings ................................................................................... 4
2.2 Pyrrhotite ....................................................................................................................... 6
2.3 Dissolution pathways of pyrrhotite ............................................................................... 6
2.3.1 Oxidative dissolution ............................................................................................. 6
2.3.2 Non-oxidative dissolution ...................................................................................... 7
2.4 Factors affecting pyrrhotite oxidation ........................................................................... 8
2.4.1 Crystal structure ..................................................................................................... 8
2.4.2 Oxygen ................................................................................................................... 9

v
2.4.3 Ferric ion concentration ......................................................................................... 9
2.4.4 Temperature ........................................................................................................... 9
2.5 Oxidation-reduction potential ..................................................................................... 10
2.6 Shrinking core model .................................................................................................. 11
2.7 Passivation .................................................................................................................. 13
Chapter 3: Materials and experimental procedures ................................................................... 15
3.1 Materials ..................................................................................................................... 15
3.2 Characterization of pyrrhotite tailings ........................................................................ 15
3.2.1 Particle size distribution ...................................................................................... 15
3.2.2 Chemical characterization ................................................................................... 16
3.2.3 Mineralogical characterization ............................................................................ 17
3.3 Leaching tests .............................................................................................................. 18
3.4 Analytical techniques .................................................................................................. 19
3.4.1 ICP analysis ......................................................................................................... 19
3.4.2 Potassium dichromate titration ............................................................................ 20
3.4.3 HPLC analysis ..................................................................................................... 20
3.4.4 SEM analysis ....................................................................................................... 21
3.5 Elemental sulfur determination ................................................................................... 21
Chapter 4: Results and discussions ............................................................................................ 23
4.1 Effect of temperature on nickel extraction .................................................................. 23
4.2 Effect of ferric sulphate concentration on nickel extraction ....................................... 27

vi
4.3 Elemental sulphur generation during leaching............................................................ 30
4.4 Morphology of elemental sulphur ............................................................................... 36
Chapter 5: Conclusions .............................................................................................................. 39
References.................................................................................................................................. 41
Appendices ................................................................................................................................ 45
Appendix A. Nickel extraction kinetics at different temperatures......................................... 45
Appendix B. Ferric sulphate concentration effect on nickel extraction ................................. 53
Appendix C. Elemental sulphur determination ...................................................................... 63
Appendix D. SEM images and EDX Spectra ........................................................................ 72

vii
List of Tables
Table 2-1. Activation energies obtained for oxidation of pyrrhotite and pentlandite. .............. 10
Table 2-2. ORP correction factors for different reference electrodes. ...................................... 11
Table 2-3. Shrinking core model mechanisms. ......................................................................... 13
Table 3-1. Elemental composition of pyrrhotite tailings. .......................................................... 17
Table 3-2. Mineralogical composition of pyrrhotite tailings. .................................................... 17
Table 4-1. Diffusion-control apparent rate constant values at various temperatures. ............... 26
Table 4-2. Chemical reaction-control apparent rate constant values at various temperatures. . 26
Table 4-3. Diffusion-control apparent rate constants at various ferric sulphate concentrations.
................................................................................................................................................... 29
viii
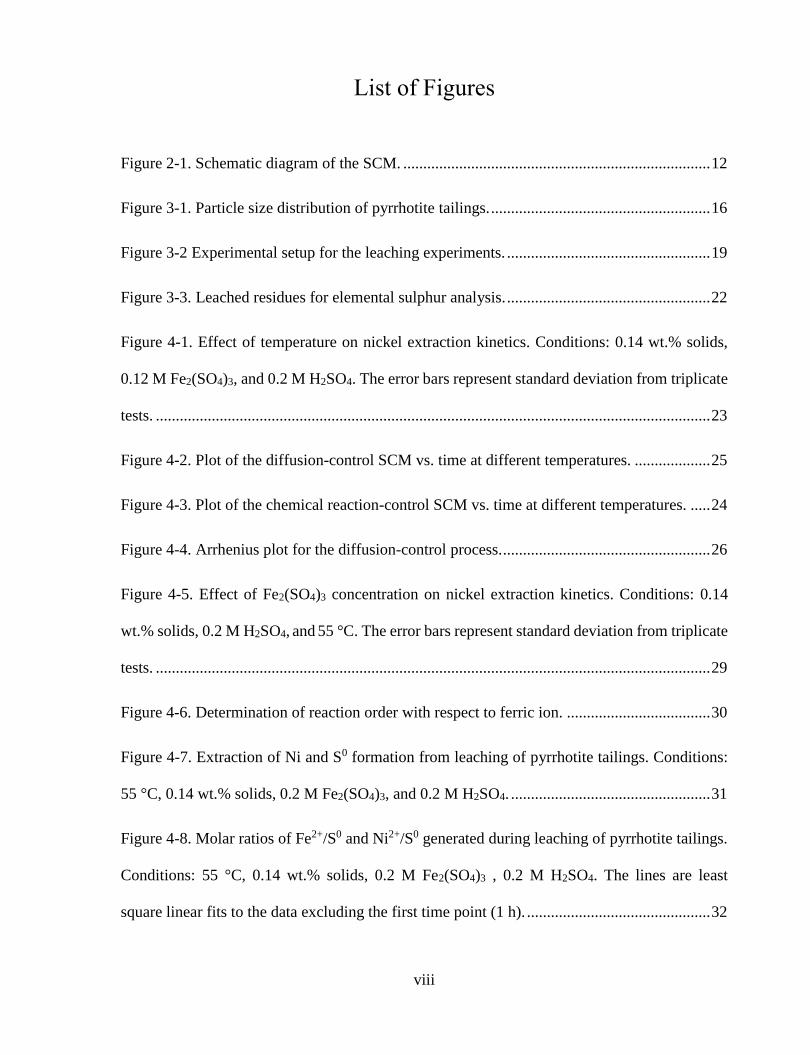
List of Figures
Figure 2-1. Schematic diagram of the SCM. ............................................................................. 12
Figure 3-1. Particle size distribution of pyrrhotite tailings. ....................................................... 16
Figure 3-2 Experimental setup for the leaching experiments. ................................................... 19
Figure 3-3. Leached residues for elemental sulphur analysis. ................................................... 22
Figure 4-1. Effect of temperature on nickel extraction kinetics. Conditions: 0.14 wt.% solids,
0.12 M Fe2(SO4)3, and 0.2 M H2SO4. The error bars represent standard deviation from triplicate
tests. ........................................................................................................................................... 23
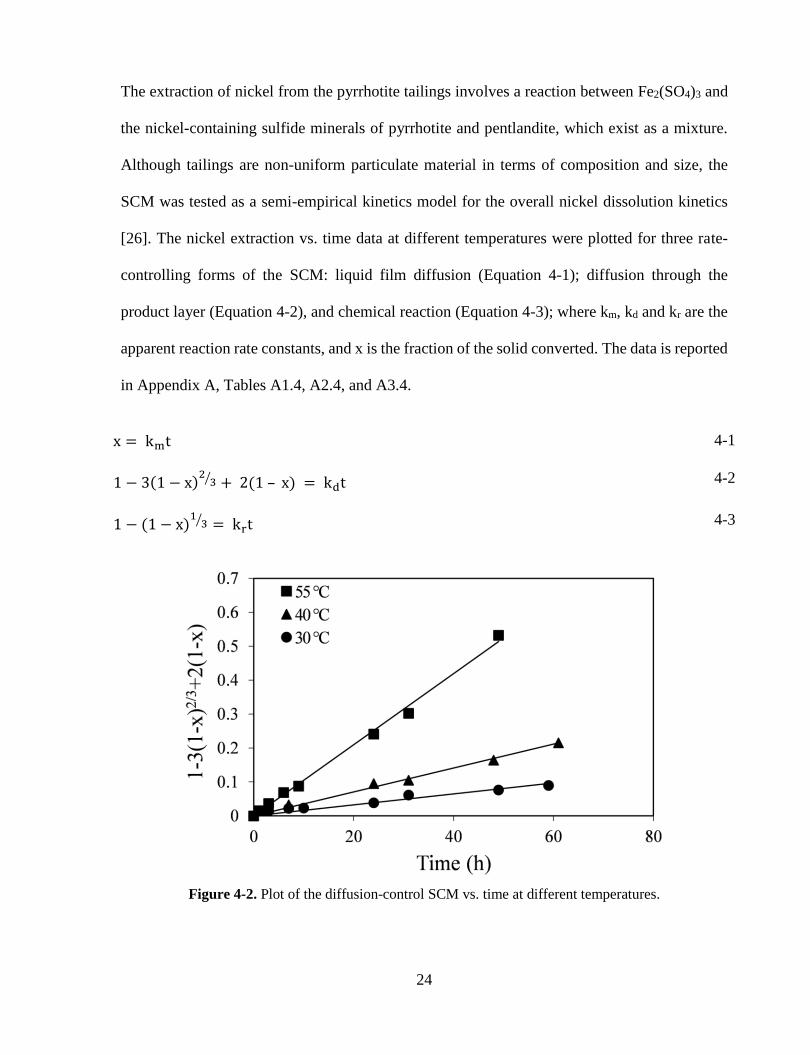
Figure 4-2. Plot of the diffusion-control SCM vs. time at different temperatures. ................... 25
Figure 4-3. Plot of the chemical reaction-control SCM vs. time at different temperatures. ..... 24
Figure 4-4. Arrhenius plot for the diffusion-control process. .................................................... 26
Figure 4-5. Effect of Fe2(SO4)3 concentration on nickel extraction kinetics. Conditions: 0.14
wt.% solids, 0.2 M H2SO4, and 55 °C. The error bars represent standard deviation from triplicate
tests. ........................................................................................................................................... 29
Figure 4-6. Determination of reaction order with respect to ferric ion. .................................... 30
Figure 4-7. Extraction of Ni and S0 formation from leaching of pyrrhotite tailings. Conditions:
55 °C, 0.14 wt.% solids, 0.2 M Fe2(SO4)3, and 0.2 M H2SO4. .................................................. 31
Figure 4-8. Molar ratios of Fe2+/S0 and Ni2+/S0 generated during leaching of pyrrhotite tailings.
Conditions: 55 °C, 0.14 wt.% solids, 0.2 M Fe2(SO4)3 , 0.2 M H2SO4. The lines are least
square linear fits to the data excluding the first time point (1 h). .............................................. 32

ix
Figure 4-9. Extraction of Ni and S0 formation from leaching of pyrrhotite tailings. Conditions:
40 °C, 0.14 wt.% solids, 0.2 M Fe2(SO4)3, and 0.2 M H2SO4 ................................................... 34
Figure 4-10. Molar ratios of Fe2+/S0 and Ni2+/S0 generated during leaching of pyrrhotite tailings.
Conditions: 40 °C, 0.14 wt.% solids, 0.2 M Fe2(SO4)3 , 0.2 M H2SO4. The lines are least
square linear fits to the data. ..................................................................................................... 34
Figure 4-11. ORP and pH values of the leach solution measured at different times for 55 °C and
40 °C. Conditions: 0.14 wt.% solids, 0.2 M Fe2(SO4)3, and 0.2 M H2SO4 ............................... 36
Figure 4-12. SEM-BSE images of partially leached pyrrhotite particles after (a) time 0 (0%), (b)
19h (50%), (c) 72 h (80%) and (d) 144 h (90%) of leaching. Conditions: 55 °C, 0.56 wt.% solids,
0.2 M Fe2(SO4)3, and 0.2 M H2SO4. .......................................................................................... 37
Figure 4-13. Elemental maps of a pyrrhotite particle after 90% nickel extraction. ................... 38
x
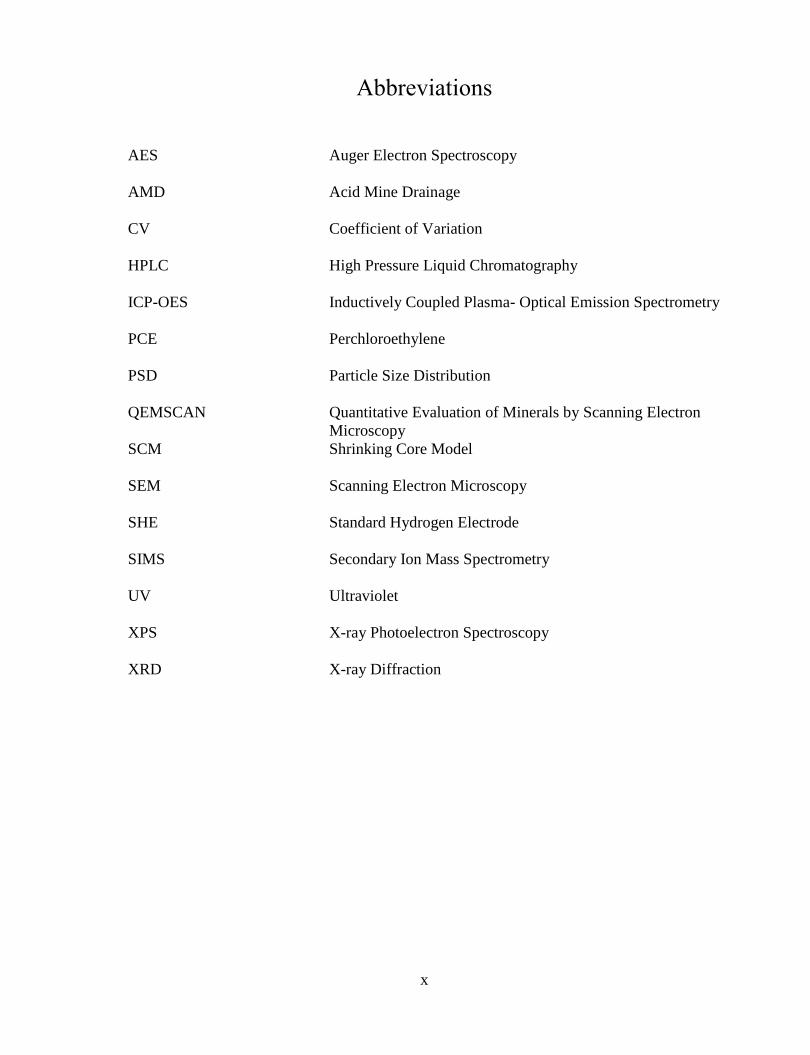
Abbreviations
AES Auger Electron Spectroscopy
AMD Acid Mine Drainage
CV Coefficient of Variation
HPLC High Pressure Liquid Chromatography
ICP-OES Inductively Coupled Plasma- Optical Emission Spectrometry
PCE Perchloroethylene
PSD Particle Size Distribution
QEMSCAN Quantitative Evaluation of Minerals by Scanning Electron
Microscopy
SCM Shrinking Core Model
SEM Scanning Electron Microscopy
SHE Standard Hydrogen Electrode
SIMS Secondary Ion Mass Spectrometry
UV
Ultraviolet
XPS X-ray Photoelectron Spectroscopy
XRD X-ray Diffraction
1
Chapter 1: Introduction
1.1 Overview
Due to continuous exploitation, high-grade sulphide ores are gradually being exhausted. Low-
grade sulphide minerals, including mining wastes are being considered as alternative metal
resources for the future. Over the past 50 years, the Sudbury region in Ontario, Canada, has
accumulated 50-100 million tonnes of pyrrhotite tailings as a consequence of the local smelting
operations [1]. These tailings would be a significant low-grade nickel resource if a low-cost
process for nickel recovery could be developed. In addition, environmental hazards like acid
mine drainage (AMD) could be reduced by treating the pyrrhotite tailings. Previously, several
pyrometallurgical processes were investigated for the treatment of the pyrrhotite tailings [1, 2,
3, 4]; however, most were abandoned due to the production of SO2 gas during the roasting
process and the introduction of additional Fe in the slag. On the other hand, limited laboratory
studies have been performed using hydrometallurgical techniques such as acid leaching by
hydrochloric and nitric acid, or by high-pressure oxidation [5, 6, 7].
Although hydrometallurgical methods offer the advantage of avoiding SO2 emissions, none of
these lab-scale processes has ever been commercialized. Recently, a bioleaching process was
investigated as an alternative hydrometallurgical process in our lab [8]. In this process concept,
pyrrhotite and pentlandite, the two principal nickel-bearing minerals in the tailings, are leached
by ferric sulphate which is regenerated by microbial assistance.
Ferric ion is a strong oxidizing agent that plays an important role in oxidation of sulphide ores.
Only few studies have been conducted on the leaching of pyrrhotite in ferric sulphate solution

2
[9, 10, 11], whereas the direct effect of ferric ion on the oxidation of the pyrrhotite tailings has
not been systematically studied. Earlier studies have shown that elemental sulphur is the
dominant product of the ferric sulphate leaching of pyrrhotite [12, 13]. This is advantageous
over the production of sulphuric acid as a by-product that would require recovery, storage, or
neutralization, and impoundment of vast amounts of gypsum, which would make the process
uneconomical.
1.2 Research scope
The aim of this work is to study the leaching kinetics of the nickeliferous pyrrhotite tailings in
concentrated ferric sulphate media under abiotic conditions and develop a kinetics model that
can be used for process design. The results of this study would be very useful in any follow-up
bioleaching study, as it would set a baseline for the chemical performance of the system.
1.3 Objectives
The main objectives of this study are the following:
1. Characterize the mineralogy and chemistry of pyrrhotite tailings
2. Evaluate and explain the effects of ferric ion concentration and temperature on the
kinetics of nickel extraction
3. Determine the dissolution mechanism of pyrrhotite tailings
4. Investigate the formation and morphology of elemental sulphur produced during ferric
sulphate leaching of pyrrhotite tailings
1.4 Thesis organization
Chapter 2 provides a literature review on nickeliferous pyrrhotite tailings and pyrrhotite

3
oxidation. Chapter 3 introduces the experimental procedures and analytical techniques. Chapter
4 discusses the experimental results, and Chapter 5 summarizes the key findings of this study.
The complete set of results obtained from the experiments is given in the appendices.

4
2 Chapter 2: Literature review
2.1 Nickeliferous pyrrhotite tailings
The Sudbury basin in Ontario contains ore reserves from which, currently, both nickel and
copper concentrates are produced. Both Vale and Glencore have been mining this ore type for
more than 100 years. The ore contains the sulphide minerals pentlandite, chalcopyrite, pyrite,
and large amounts of nickeliferous pyrrhotite. After grinding the ore, the minerals are
concentrated into various fractions using flotation processes. Chalcopyrite is recovered as a
copper concentrate for smelting, while pentlandite is recovered as a nickel concentrate. Since
the nickel content of nickeliferous pyrrhotite is low (~0.8%) compare to pentlandite (~32%), it
is removed from the nickel concentrate using pyrrhotite rejection circuits at the mills and
disposed of in tailing ponds. The tailings are predominantly pyrrhotite with trace amounts of
other sulphide minerals, as well as some gangue minerals (silicates). The majority of nickel is
found within the pyrrhotite matrix, and the remainder is present as an interlocked fine-grained
pentlandite fraction [1].
As mentioned earlier, pyrometallurgical processes for the treatment of the pyrrhotite tailings
were abandoned due to the production of SO2 gas. In 1947-1954 Inco (Vale) developed two
processes based on the dead roasting of the pyrrhotite tailings to produce SO2 gas and iron-
nickel oxide. The SO2 gas was processed in an acid plant to produce saleable high-grade
sulphuric acid. The iron-nickel oxide was selectively reduced to an iron-nickel alloy (FeNi) in
a rotary kiln and then leached in ammonia-ammonium carbonate solution. The nickel was
recovered as nickel oxide (NiO) by precipitation, then the iron oxide was indurated in a sintering
machine. From this process the overall nickel recovery and the sulphur content of the iron ore

5
were about 85% and 0.25%, respectively. Thomson et al. has provided some details about the
Inco roasting process [2].
In 1960, Falconbridge (Glencore) began the operation of a pilot plant using a selective
sulphation roast. The nickel from leaching was precipitated with fresh pyrrhotite, iron, and
sulphur to form a matte that was treated in a smelter for nickel recovery. The iron ore and nickel
produced from this process represented 97.2% and 87.5% recovery, respectively. Despite its low
sulphur content (0.47%), the iron ore did not meet the quality standards as a salable product.
The sulphation conditions in the process produced high concentrations of SO3 and caused
extensive aerial pollution [1, 3, 4].
Furthermore, limited lab-scale studies have been performed using hydrometallurgical
techniques. Van Weert et al. [5] conducted an investigation on leaching of nickeliferous
pyrrhotite in 6-8 N hydrochloric acid at 60-90 °C. Relatively fast leaching rates were obtained.
The main drawback of this method was that pentlandite, the other nickel-bearing mineral, could
not be leached under these conditions; also part of the solubilized nickel reprecipitated with iron
as nickeliferous marcasite (FeS2). In general, acid leaching is the least known practiced
application since it involves the formation and handling of hydrogen sulphide (H2S).
Falconbridge performed a preliminary study on oxidation of pyrrhotite tailings using an
autoclave at 100 psi air pressure and 110 °C. Although, there were no mineralogical restrictions
in this route, the process never progressed beyond the experimental stage [7].
In order to design and optimize a hydrometallurgical treatment flowsheet for nickeliferous
pyrrhotite tailings, a good understanding of chemistry and dissolution pathways of pyrrhotite is
necessary.

6
2.2 Pyrrhotite
Pyrrhotite is one of the most abundant sulphide minerals in mining environments. It has the
generic formula Fe1-xS, where x varies between 0 and 0.125 based on the vacancy of iron atoms
in the crystal structure. Pyrrhotite with the stoichiometric formula FeS is called troilite, and it
has a hexagonal structure. The monoclinic and more common structure of pyrrhotite (Fe7S8) is
magnetic due to the deficiency of iron atoms in the structure.
2.3 Dissolution pathways of pyrrhotite
For most sulfide minerals, two main pathways of dissolution were suggested, namely oxidative
and non-oxidative dissolution [10, 12, 14].
2.3.1 Oxidative dissolution
Both oxygen and ferric ion are important oxidants of sulphide minerals. When oxygen is the
primary oxidant of pyrrhotite, the oxidation reaction can proceed by reaction 2-1, where x varies
between 0 and 0.125.
Fe1−xS + (2 − 0.5x)O2 + xH2O → (1 − x)Fe2+ + SO42− + 2xH+ 2-1
2Fe2+ + 0.5O2 + 2H+ → 2Fe3+ + H2O 2-2
Fe3+ + 3H2O → Fe(OH)3 + 3H+ 2-3
Fe1−xS + (8 − 2x)Fe3+ + 4H2O → (9 − 3x)Fe2+ + SO42− + 8H+ 2-4
In reaction 2-2, ferrous ion (Fe2+) is oxidized to ferric ion (Fe3+) by oxygen. At pH > 3, ferric
ion precipitates as ferric hydroxide (Fe(OH)3), shown in reaction 2-3, but if the reaction occurs

7
under acidic conditions, a significant quantity of ferric ion will remain in the solution and can
act as the oxidant of pyrrhotite (reaction 2-4). However, the oxidation reactions may not proceed
to completion, and partial oxidation may occur instead [10, 13, 15]. In this case, a small
proportion of sulphide in the mineral is transformed to sulphate ions, and the remainder is
accumulated as elemental sulfur, shown in reactions 2-5 and 2-7. Reactions 2-6 and 2-8 show
that elemental sulphur from the partial oxidation of pyrrhotite can further oxidize to sulphate
ions; however, this can occur only at temperatures above the melting point of sulphur (~120 °C)
[16, 17].
Fe1−xS + (0.5 − 0.5x)O2 + (2 − 2x)H+ → (1 − x)Fe2+ + S0 + (1 − x)H2O 2-5
S0 + 1.5O2 + H2O → SO42− + 2H+ 2-6
Fe1−xS + (2 − 2x)Fe3+ → (3 − 3x)Fe2+ + S0 2-7
S0 + 6 Fe3+ + 4H2O → SO42− + 8H+ + 6Fe2+ 2-8
2.3.2 Non-oxidative dissolution
Non-oxidative dissolution of sulphide minerals is another pathway of dissolution, which is an
acid consuming reaction and produces a significant amount of hydrogen sulphide (H2S)
according to reaction 2-9.
Fe1−xS + 2H+ → H2S + (1 − x)Fe2+ 2-9
Tewari and Campbell [18] studied the dissolution of commercial troilite in dilute sulfuric acid
and reported that the dissolution rate constant of troilite in pH values between 2 and 5.3 at 25
°C is 2.7 ± 0.2 ×10 -6 m/s. Van Weert et al. [5] investigated the kinetics of pyrrhotite dissolution
under various conditions in hydrochloric acid, and they found that relatively rapid dissolution is

8
preceded by an induction period, during which no hydrogen sulphide is evolved. Thomas et al.
[19] studied the oxidation of synthesized pyrrhotite by 1 M perchloric acid and observed an
induction period followed by hydrogen sulphide production at different temperature ranges.
Temperature, acid strength, and the amount of surface oxidation products were found to be the
controlling factors of the length of the induction period.
2.4 Factors affecting pyrrhotite oxidation
Several variables have been identified as the main controlling factors of the rate of pyrrhotite
oxidation.
2.4.1 Crystal structure
There is a lack of consensus in the literature about whether monoclinic or hexagonal pyrrhotite
is more reactive towards oxidation. Conventionally, it is thought that the monoclinic structure
is more reactive phase of pyrrhotite; this can be attributed to the vacancy of iron atoms in the
crystal structure, which promotes electron transfer between the oxidant and the crystal lattice.
Lehmann et al. [20] showed that in a cyanide solution, monoclinic pyrrhotite has a higher
dissolution rate than the hexagonal structure under various experimental conditions. Orlova et
al. [21] reported the opposite result, finding that hexagonal pyrrhotite is more reactive than
monoclinic pyrrhotite. Janzen et al. [10] studied the oxidation behaviour of twelve pyrrhotite
samples, ranging from pure hexagonal to pure monoclinic. They measured the oxidation rates
in terms of sulphate production and iron release and found no consistent correlation between the
oxidation rate of pyrrhotite and the pyrrhotite structure.

9
2.4.2 Oxygen
Oxygen is the primary oxidant of pyrrhotite in basic environments. Knipe et al. [22] investigated
the interaction of water and the surface of pyrrhotite in the absence of oxygen, concluding that
no oxidation is observed upon exposure of pyrrhotite to deoxygenated water. There are relatively
few studies that relate the oxidation rate of pyrrhotite to the amount of dissolved oxygen. Many
studies have related the oxidation rates of sulphide ores to the partial pressure of oxygen [23,
10, 24]. Filippou et al. [24] studied the oxidative pressure leaching of monoclinic pyrrhotite at
two different temperature regimes: below and above the melting point of sulphur (119 °C). They
found that for temperatures above 119 °C, the rate of pyrrhotite oxidation shows first order
dependency on oxygen partial pressure, whereas in the low temperature regime, the reaction rate
is proportional to the square root of oxygen partial pressure.
2.4.3 Ferric ion concentration
At low pH values (pH <3) and atmospheric pressure, sulfides are mainly oxidized by ferric ion,
and the kinetics of pyrrhotite oxidation by oxygen are relatively slow [10]. Accordingly, oxygen
is considered to be the oxidizing agent for oxidation of ferrous ion to ferric ion as shown in
reaction 2-2.
2.4.4 Temperature
The oxidation kinetics of pyrrhotite increases with increasing temperature. Generally, chemical
leaching follows the Arrhenius law that describes the reaction rate constant (k) as a function of
temperature (T) and activation energy (Ea) according to Equation 2-10. Several studies have
reported activation energies for oxidation of pyrrhotite and pentlandite under different leaching
conditions. Some of these values are listed in Table 2-1.

10
k = A e−EaRT
2-10
Table 2-1. Activation energies obtained for oxidation of pyrrhotite and pentlandite.
Sample Condition Oxidant Activation energy
(kJ/mol) Reference
Nickeliferous
Pyrrhotite
4-37 °C
pH=2.5
Bacteria 40 [15]
12 Museum-grade
pyrrhotite samples
25-45 °C
pH=2.5
Oxygen 47.7-62.5 a
79.1-106 b
[10]
Museum-grade
pyrrhotite samples
7.5-35 °C
pH=2.5
Ferric 22.8-63
[11]
Museum-grade
pyrrhotite samples
10-33 °C
pH=2
pH=4
pH=6
Oxygen 58.1
52.4
100.4
[11]
Pyrrhotite ore
from Bolivia
30-45 °C
pH=2
Ferric 99 [9]
Nickeliferous
pyrrhotite from
Sudbury
80-180 °C
0.5 M H2SO4
Oxygen
68.5 [24]
Pentlandite 30, 80 °C
PO2 1,100%
Ferric
61 [25]
a. Based on iron release
b. Based on sulphate release
2.5 Oxidation-reduction potential
Ferric ion is a strong oxidizing agent and the relative abundance of ferric and ferrous ions in
solution is the principal factor that determines oxidation-reduction potential (ORP) of a leach
solution (also known as redox potential). Equations 2-11 and 2-12 are used to determine the

11
ORP at 25 °C, where the activities of ferrous and ferric irons are replaced by their concentrations
in dilute solutions.
Fe3+ + �̅� → Fe2+ 𝜀0 = 0.771 2-11
Eh = 0.771 + 0.059 log[Fe3+]
[Fe2+]
2-12
ORP is defined by Equation 2-12 when the standard hydrogen electrode (SHE) is the reference
electrode. Correction factors should be used to convert the ORP measurements with different
reference electrodes to Eh, shown in Table 2-2.
Table 2-2. ORP correction factors for different reference electrodes.
Reference electrode Electrode potential with respect to SHE
(mV)
Standard hydrogen electrode (SHE) 0
Saturated calomel electrode (SCE) +241
Ag/AgCl , 1 M KCl +192
Ag/AgCl , 4 M KCl + 228
Ag/AgCl , sat. KCl +236
2.6 Shrinking core model
Shrinking core model (SCM) is the most relevant kinetic model applied to the leaching kinetics
of low-grade ores. The model is based on the reaction zone on a particle, which shrinks inwards
as the reaction proceeds and leaves a solid product layer behind. The SCM assumes that the

12
reaction is first order with respect to the reactant, and particles are of uniform size [26].
Considering this model, five steps contribute to the overall rate of reaction as shown in Figure
2-1.
1) Diffusion of the reactant through the liquid film to the surface of the particle.
2) Diffusion of the reactant through the solid product layer to the surface of the unreacted
core.
3) Reaction of the reactant with the surface of the unreacted core.
4) Diffusion of the liquid products through the layer to the exterior surface of the particle.
5) Diffusion of the liquid products through the liquid film back into the main fluid.
Figure 2-1. Schematic diagram of the SCM.
In cases where the reaction is irreversible and no liquid product is formed, steps 4 and 5 do not
contribute to the overall reaction rate, therefore the reaction would be controlled by one or a
combination of the following mechanisms:
1) Liquid film diffusion
Liquid Film
Solid Product
Unreacted Core
Surface of the particle
rc
R

13
2) Chemical reaction
3) Diffusion through the product layer
Table 2-3 shows the mathematical description of the shrinking core kinetic models, where
XB is the fraction of ore that is converted.
Table 2-3. Shrinking core model mechanisms.
Rate controlling
mechanism
Reaction equation
The time of
complete reaction
(τ)
Parameters
Film diffusion t
τ= XB 𝜏 =
𝑅𝜌𝐵
3𝑏𝑘𝑔𝐶𝐴
kg: mass transfer coefficient
between fluid and particle
b: stoichiometric reaction
coefficient
τ: the time of complete
reaction
ks: first order rate constant for
the surface reaction
De: effective diffusion
coefficient of A in the
product layer
CA: concentration of A in the
fluid
ρB: molar density of B in the
solid
R: initial particle radius
Chemical reaction t
τ= 1 − 3(1 − XB)
13 𝜏 =
𝑅𝜌𝐵
𝑏𝑘𝑠𝐶𝐴
Diffusion through
the product layer
t
τ= 1 − 3(1 − XB)
23 + 2(1 − XB)
𝜏 =𝑅2𝜌𝐵
6𝑏𝐷𝑒𝐶𝐴
2.7 Passivation
Passivation is one of the most common problems of leaching of sulphide minerals. It describes
the situation in which the mineral surface is covered with a layer of by-product like an oxide or
other insoluble species. The product layer hinders the diffusion of reactants and products in/out
of the sulphide particles and slows down the leaching kinetics. The existence of a passivation
layer may not be proven based on only the chemical and thermodynamic properties of the leach
solution, and it would only be directly detectable by the sensitive surface analysis methods such
14
as X-ray photoelectron spectroscopy (XPS), Auger electron spectroscopy (AES or SAM) or
secondary ion mass spectrometry (SIMS).
The formation of a product layer on pyrrhotite and pentlandite has been investigated by Legrand
et al. [27]. They examined the oxidation of pyrrhotite and pentlandite in an aqueous solution
with pH=9.3 and showed that a thin layer of Fe (III)-hydroxide (probably FeOOH) is formed on
the surface of both minerals. Lu et al. [28] studied the kinetics and mechanism of pentlandite
leaching in aerated acidic chloride/sulphate solutions and observed that pentlandite experiences
passivation by elemental sulphur at low potentials. Ahonen and Tuovinen [15] performed a
number of column bioleaching experiments with a complex sulphide ore and observed a
compact ferric oxide/oxy-hydroxide, elemental sulphur, and covelite layer on pyrrhotite
surfaces.

15
3 Chapter 3: Materials and experimental procedures
This chapter describes material characterization, experimental procedure, and analytical
techniques used in this work.
3.1 Materials
Upgraded pyrrhotite tailings were obtained from Vale’s nickel smelting operations in Sudbury,
Ontario. The slurry was delivered in a large bucket, containing deoxygenated water due to the
reducing and reactive nature of pyrrhotite. A core sample was taken and homogenized using a
heavy-duty impeller. It was subsequently vacuum-filtered through Whatman quantitative filter
paper and collected as several small cakes. The cakes were kept in double-sealed plastic bags in
a freezer at -20 °C to minimize surface oxidation by oxygen in air. One day prior to any
experiment, samples were thawed and their moisture content was determined. All chemicals
used for preparing the solutions were reagent grade, and MilliQ deionized water was used.
3.2 Characterization of pyrrhotite tailings
3.2.1 Particle size distribution
The average particle size distribution of the pyrrhotite taillings were determined using a light
scattering technique with Malvern Mastersizer 2000. Figure 3-1 shows the particle size
distribution (PSD) of the pyrrhotite tailings. The distribution shows a tail on the left side
indicating the presence of fine particles at about 20 Vol% below 10 μm. The average particle
size is about 32 μm with a d50 of 28 μm and a coefficient of variation (CV) of 0.82.

16
Figure 3-1. Particle size distribution of pyrrhotite tailings.
3.2.2 Chemical characterization
Elemental composition of the pyrrhotite tailings was determined by digestion in aqua regia (1:3
HNO3: HCl) at high temperature. Approximately 0.4 g of the tailings was dissolved in a 20 mL
aqua regia solution, transferred to a sealed vessel, and heated to 200 °C in a microwave digester
(Ethos EZ Microwave Digestion System). The mixture was diluted with 5% trace metal nitric
acid in a volumetric flask. Multiple sets of dilutions were made based on the expected
concentrations of base metals in the solution and were analyzed using Inductively Coupled
Plasma-Optical Emission Spectrometry (ICP-OES), Agilent Technologies 700. Although the
exact composition of the pyrrhotite tailings produced at the mill varies with variations inside the
ore body, the general composition is shown in Table 3-1. Fe (52.8%), S (32.0%), and Ni (1.0%),
were found to be the most abundant elements in the pyrrhotite tailings.

17
Table 3-1. Elemental composition of pyrrhotite tailings.
3.2.3 Mineralogical characterization
Mineralogical characterization of the tailings was determined by Quantitative Evaluation of
Materials by Scanning Electron Microscopy (QEMSCAN) at SGS Canada Inc., Lakefield, ON,
and summarized in Table 3-2. Monoclinic Pyrrhotite (Fe7S8) is dominant at 86.2 wt.%, whereas
pentlandite accounts for only 1.2 wt.% of the tailings although it holds 40% of the total nickel.
The balance of 60% is associated with pyrrhotite.
Table 3-2. Mineralogical composition of pyrrhotite tailings.
Mineral Chemical Formula wt. %
Pyrrhotite Fe7S8 86.2
Pentlandite (Fe,Ni)9S8 1.2
Chalcopyrite CuFeS2 0.7
Pyrite FeS2 0.4
Silicates Mg2SiO4 3.8
Fe-(Ti) Oxides Fe3O4, FeTiO3 4.6
Quartz SiO2 3.1
Element Concentration (wt.%)
Fe 52.81
S 32.00
Ni 1.00
Al 0.38
Cu 0.28
Ca 0.28
Mg 0.18
Co 0.02
Mn 0.02
Cr 0.01

18
3.3 Leaching tests
Leaching experiments were conducted in baffle-based Erlenmeyer flasks. Each flask was filled
with 500 mL solution containing 0.2 M sulphuric acid and different ferric sulphate
concentrations. The ferric sulphate concentrations tested were 0.02, 0.1, 0.2, and 0.3 M,
corresponding to 1.3, 6.4, 12.7, and 19.1 excess stoichiometric levels with respect to monoclinic
pyrrhotite based on the following overall reaction.
Fe7S8 + 14Fe3+ → 21Fe2+ + 8S0 3-1
Before adding the pyrrhotite sample, the solution was heated to the desired temperature (30, 40,
or 55 °C) on an orbital shaker set at 250 rpm. 250 rpm was enough to ensure solid suspension.
The reaction was initiated by adding about 0.7 g of the pyrrhotite tailings to the solution, unless
otherwise stated. The small solids content ensured that leaching was performed under constant
ferric concentration, which is a prerequisite to test the SCM on the extraction values. The flasks
were then capped with aluminum foil to prevent cross-contamination. At regular time-intervals,
the shaker was stopped, and the flasks were weighed to determine the mass of water that had
evaporated. The evaporated water loss was made up by adding an equal volume of deionized
water. The flasks were mixed thoroughly by shaking to keep the pulp density uniform, and 5
mL of slurry samples were taken for analysis. The samples were then immediately filtered using
0.45 μm syringe filters and analyzed for ORP, pH, nickel and ferrous ion concentration. Figure
3-2 shows the experimental setup for the leaching experiments.

19
Figure 3-2 Experimental setup for the leaching experiments.
3.4 Analytical techniques
Liquid samples taken during the leaching experiments were analyzed for the dissolved ferrous
ion (Fe2+), dissolved nickel (Ni2+) and other trace metal elements. Selected solid samples after
filtration were used for acid digestion or elemental sulphur analysis.
3.4.1 ICP analysis
The concentrations of trace metals in the liquid samples were analyzed via ICP-OES.
Wavelength calibration and torch alignment were routinely applied to ensure the normal
operation of the ICP system. To prepare the calibration standards, a multi-element stock solution
containing 250 mg/L Fe, Ni, S, Mg, and 100 mg/L Al, Cu, Co, Mn, Zn, and Cr was diluted with
5% trace metal nitric acid. The dilution factors were selected according to the expected
concentrations of the elements of interest and the detection limit of the ICP.
20
3.4.2 Potassium dichromate titration
Ferrous ion concentration in the liquid samples was determined potentiometrically with 0.01 M
potassium dichromate solution (K2Cr2O7). In the redox potential between potassium dichromate
and ferrous ion, dichromate ion (Cr2O72-) gets reduced to two chromium III (Cr3+) ions in an
acidic environment with enough hydrogen ions (H+), shown in reactions 3-2 and 3-3.
Cr2O72− + 14H+ + 6�̅� → 2Cr3+ + 7H2O 3-2
Fe3+ + �̅� → Fe2+ 3-3
Cr2O72− + 6Fe2+ + 14H+ → 6Fe3+ + 2Cr3+ + 7H2O 3-4
Reaction 3-4 represents the net ionic reaction. The 1:6 mole ratio of Cr2O72- : Fe2+ provides the
stoichiometric basis for all of the titration calculations.
3.4.3 HPLC analysis
All HPLC analyses were performed by High Performance Liquid Chromatography (HPLC)
analysis with a DIONEX 3000 HPLC system having a 20 μL injection volume and a DIONEX
UV detector operating at 254 nm with a 5 nm bandwidth. A Dionex Acclaim 120 C18 reverse-
phase column (4.6 x 250 mm; 5 μm) was used with a mobile phase composed of 95% methanol
(HPLC Grade, min. purity 99.9%) and 5% water (0.2 μm filtered) at a flow rate of 1 mL/min.
Because the presence of air bubbles in the mobile phase accounts for a variety of interferences,
it was degassed using helium sparging for about 30 min before passing it through the column.
Each measurement lasted for 25 min, and the peak corresponding to the elemental sulphur
appeared somewhere between 15 and 20 min, due to small changes in the eluent composition.

21
3.4.4 SEM analysis
The presence of elemental sulphur on the reacted pyrrhotite tailings was visualized on polished
epoxy mounts using JEOL JSM-840 Scanning Electron Microscope (SEM) utilizing back-
scattered electrons (BSE) at 15 keV accelerating potential difference. Energy-dispersive X-ray
(EDX) spectra were obtained with the same instrument. About 1 g of the solid sample was gently
dispersed in epoxy and adequate time was allowed to ensure that the material is fully cured
(about 24 hours). The sample mount was gently ground and polished with a 1200 grit silicon
carbide paper under running water and then subjected to SEM analysis.
3.5 Elemental sulphur determination
To extract elemental sulphur from the leach slurry, a combination of the techniques described
by Dutrizac, and McGuire and Hamers [29, 30] was used. At the end of the leaching test the
contents of the flask were vacuum filtered with a 10 cm Buchner filter using 15 cm Whatman
filter paper. To remove any sulphur from the walls of the flask, it was rinsed several times with
water and re-filtered. The residue was then washed twice with a weak sulphuric acid solution
(pH=3) to remove metal ions adsorbed by the residue. The filtrates were analyzed for nickel
content using ICP. The filter paper with the leach residue was dried in a vacuum oven at 40 °C
(overnight) as shown in Figure 3-3. It was then folded several times and placed in a beaker
containing 50 mL of PCE for 24 h. After sulphur extraction, the PCE solution was filtered using
a 0.2 µm nylon syringe filter, and, if necessary, sequential dilutions were performed with PCE
to bring the concentration of the sample to within the linear range of the standard solutions (6 -
240 mg/L of sulphur). The samples and the standards were then analyzed for elemental sulphur
using HPLC. To measure any elemental sulfur that might exist on the pyrrhotite surface prior to

22
leaching, a known amount of sample (~0.25 g) was dissolved in 25 mL PCE and subjected to
the same HPLC analysis. Standard solutions for elemental sulphur analysis were prepared within
the range of 6-240 mg/L by a procedure similar to that employed by McGuire and Hamers [30].
Figure 3-3. Leached residues for elemental sulphur analysis.

23
4 Chapter 4: Results and discussions
4.1 Effect of temperature on nickel extraction
Figure 4-1 shows the effect of temperature on the kinetics of nickel extraction from the
pyrrhotite tailings. These results were obtained by leaching about 0.14 wt.% solids in acidic
ferric sulphate solution at 30, 40, and 55 °C, 0.12 M Fe2(SO4)3, and 0.2 M H2SO4. At 55 °C the
nickel extraction is about 90% within 50 h, whereas at 30 and 40 °C the nickel extraction rate is
slower, indicating a possible leveling off before complete dissolution. The curve fitting in Figure
4-1 was made with the diffusion-control SCM which is discussed below. The raw extraction
data is reported in Appendix A, Tables A1.2, A2.2, and A3.2.
Figure 4-1. Effect of temperature on nickel extraction kinetics. Conditions: 0.14 wt.% solids,
0.12 M Fe2(SO4)3 and 0.2 M H2SO4. The error bars represent standard deviation from
triplicate tests.
24
The extraction of nickel from the pyrrhotite tailings involves a reaction between Fe2(SO4)3 and
the nickel-containing sulfide minerals of pyrrhotite and pentlandite, which exist as a mixture.
Although tailings are non-uniform particulate material in terms of composition and size, the
SCM was tested as a semi-empirical kinetics model for the overall nickel dissolution kinetics
[26]. The nickel extraction vs. time data at different temperatures were plotted for three rate-
controlling forms of the SCM: liquid film diffusion (Equation 4-1); diffusion through the
product layer (Equation 4-2), and chemical reaction (Equation 4-3); where km, kd and kr are the
apparent reaction rate constants, and x is the fraction of the solid converted. The data is reported
in Appendix A, Tables A1.4, A2.4, and A3.4.
x = kmt 4-1
1 − 3(1 − x)2
3⁄ + 2(1 – x) = kdt 4-2
1 − (1 − x)1
3⁄ = krt 4-3
4-3
Figure 4-2. Plot of the diffusion-control SCM vs. time at different temperatures.

25
Figure 4-3. Plot of the chemical reaction-control SCM vs. time at different temperatures.
Equation 4-1 was ruled out because the curves in Figure 4-1 are not linear. The straight-line
plots in Figure 4-2 produce higher correlation coefficients for all the temperatures in comparison
to the chemical reaction-control SCM (Figure 4-3). Moreover, in Figure 4-2, the fitted lines at
different temperatures extrapolate through the origin or are very close to the origin, whereas in
Figure 4-3 they do not. Apparent diffusion-control and chemical reaction-control rate constants
(kd and kr) at various temperatures were obtained from the slopes of the linear fits in Figures 4-
2 and 4-3 as shown in Tables 4-1 and 4-2, respectively. These values were used in an Arrhenius
plot shown in Figure 4-4. The linear fit to the data in Figure 4-4 gave an activation energy value
of Ea=62.12 kJ/mol with a correlation coefficient close to unity (R2=0.99). This is a high
activation energy value commonly attributed to chemical reaction-control processes rather than
diffusion-control processes since the former are more sensitive to temperature than the latter
[26].

26
Table 4-1. Diffusion-control apparent rate constant values at various temperatures.
Temperature (°C) kd (h-1) R2
55 1.05×10⁻² 0.99
40 0.35×10⁻² 0.99
30 0.16×10⁻² 0.94
Table 4-2. Chemical reaction-control apparent rate constant values at various temperatures.
Temperature (°C) kr (h-1) R2
55 0.96×10⁻² 0.96
40 0.45×10⁻² 0.92
30 0.25×10⁻² 0.83
Figure 4-4. Arrhenius plot for the diffusion-control process.
However, a number of kinetic studies on different systems have reported high values of
activation energy for diffusion-control dissolution of sulphide minerals [25, 31]. Gbor and Jia

27
[32] proposed that this behaviour is due to the wide particle size distribution (PSD) of the
particles. They showed mathematically that when the coefficient of variation (CV) of the PSD
is large (0.7 <CV< 1.2), it could affect the interpretation of the leaching data; for example, a
chemical reaction-control process can be mistakenly interpreted as a diffusion-control process.
The CV of the PSD of the pyrrhotite tailings was found to be 0.82, which is within the range
indicated above.
The fact that the tailings are composed of two individual nickel-bearing minerals, each
containing almost half of the total nickel, may complicate things. The present study was set to
develop an overall model accounting for the overall kinetics behaviour of nickel in both
pyrrhotite and pentlandite in the tailings. To obtain an accurate kinetic model for nickel
extraction, the oxidation kinetics of pyrrhotite and pentlandite need to be known separately. This
information needs to become available by tracking the conversion of each individual mineral in
the mixture. A method proposed by Ingraham et al. [33] based on the idea that pyrrhotite is an
acid soluble mineral, while pentlandite is essentially not acid soluble could be applied to the
pyrrhotite tailings. Given the very small amount of pentlandite (1.2 wt.%) in the tailings and the
experimentation under very low percent solids (~1.4 wt.%), it was not possible to achieve this
in the present study, and therefore it was decided to treat the tailings as a uniform mixture until
we develop a mineral separation (physical or chemical) protocol.
4.2 Effect of ferric sulphate concentration on nickel extraction
Figure 4-5 shows the effect of ferric sulphate concentration on the percent extraction of nickel
at 55 °C. The results show that the rate of nickel extraction increases with increasing ferric
sulphate concentration from 0.02 to 0.3 M. At 0.3 M ferric sulphate about 30 h of retention time
is needed to achieve 96% extraction. At lower concentrations of ferric sulphate, the kinetics are

28
slower and the extraction curves tend to reach a plateau before complete dissolution of the
tailings was achieved. The raw extraction data is reported in Appendix B, Tables B1.2, B2.2,
B3.2, and B4.2. The curve fitting in Figure 4-5 was made with the diffusion-control SCM. The
plot of the diffusion-control SCM vs. time produced linear fits with higher correlation
coefficients for all the ferric sulphate concentrations as to the chemical reaction-control SCM.
Apparent diffusion-control rate constants (kd) were obtained from the slopes of the linear fits
and are shown in Table 4-3. (More details of the SCM data and the corresponding plots are
provided in Appendix B, Tables B1.4, B2.4, B3.4, and B4.4 and Figures B-2 and B-3).
Using the mixed solvent-electrolyte (MSE) chemical model of the OLI software (OLI Analyzer
Studio 3.2), the concentrations of different iron species were calculated at 55 °C, 0.2 M H2SO4,
and different ferric sulphate concentrations (0.02-0.3 M). It can be seen in Table 4-3 that ferric
ion was found to be the dominant species, while Fe(OH)2+ concentration was low and did not
vary significantly over the range of ferric sulphate concentrations tested. Therefore, the order of
reaction was determined with respect to ferric ion concentration.

29
Figure 4-5. Effect of Fe2(SO4)3 concentration on nickel extraction kinetics. Conditions: 55 °C, 0.14
wt.% solids, and 0.2 M H2SO4, and. The error bars represent standard deviation from
triplicate tests.
Table 4-3. Diffusion-control apparent rate constants at various concentrations of ferric sulphate and
other iron species.
Fe2(SO4)3
(M)
Fe3+ Fe(OH)2+ kd (h-1) R2
0.3 0.502 0.0021 2.50×10⁻² 0.99
0.2 0.311 0.0025 1.00×10⁻² 0.97
0.1 0.153
0.0024
0.
0.71×10⁻²
0.98
0.02 0.039 0.0011 0.39×10⁻² 0.99
Figure 4-6 7 shows a plot of the log10 of kd against the log10 of ferric concentration, and the
linear fit to the data indicates that the order of reaction with respect to ferric ion is about 0.6.
However, the order of reaction with respect to ferric ion within the range of 0.1 to 0.3 M ferric
sulphate gives a value of 1.0 which is consistent with the expected value for a diffusion-
control process, since Fick’s law is first order with respect to diffusing species. This
discrepancy is due to the fact that at 0.02 M ferric sulphate the stoichiometric ratio of ferric

30
sulphate: pyrrhotite is 1.2:1 and does not meet the requirements for the use of the SCM, where
the concentration of the reactant is required to remain constant during the reaction. Therefore,
the lowest ferric sulphate concentration (0.02 M) was ruled out for determination of the
reaction order with respect to ferric ion.
Figure 4-6. Determination of reaction order with respect to ferric ion.
4.3 Elemental sulphur generation during leaching
Figure 4-7 shows the extraction of nickel and elemental sulphur formation at 55 °C, 0.2 M
Fe2(SO4)3 and 0.2 M H2SO4. Each pair of points represents a separate experiment since the low
percent solids employed did not permit sufficient slurry sampling for sulphur analysis. It can be
seen in Figure 4-7 that the pyrrhotite tailings dissolve relatively fast, and after about 50 h 85%
extraction of nickel is achieved, and about 75% of the sulphide in the pyrrhotite tailings has
been converted into elemental sulphur. Although the extraction curves follow a similar trend,
the elemental sulphur extraction is consistently lower. The difference should be the amount of

31
sulphide oxidized to sulphate ions, although the amount of sulphate could not be determined due
to the high sulphate background in the ferric sulphate solution. The data of nickel extraction and
elemental sulphur conversion is reported in Appendix C, Tables C1.2, C1.3, and C1.4.
Figure 4-7. Extraction of Ni and S0 formation from leaching of pyrrhotite tailings. Conditions: 55 °C,
0.14 wt.% solids, 0.2 M Fe2(SO4)3, and 0.2 M H2SO4.
Figure 4-8 shows the molar ratios of Fe2+/S0 and Ni2+/S0 with time from data in Figure 4-7.
Initially (at ~ 1 h), the molar ratios of Fe2+/S0 and Ni2+/S0 are high suggesting that the dissolution
of the pyrrhotite tailings at the beginning of leaching does not produce as much elemental
sulphur as at later stages of reaction. This is likely due to the direct acid attack of pyrrhotite with
the formation of dissolved hydrogen sulphide, shown in reaction 4-4 (two electrons are added
to account for the non-stoichiometric nature of pyrrhotite). However, no noticeable gaseous
hydrogen sulphide was detected, it is possible that subsequent oxidation of hydrogen sulphide
by ferric ions occurs at a slower rate according to reaction 4-5. In any case, initial surface
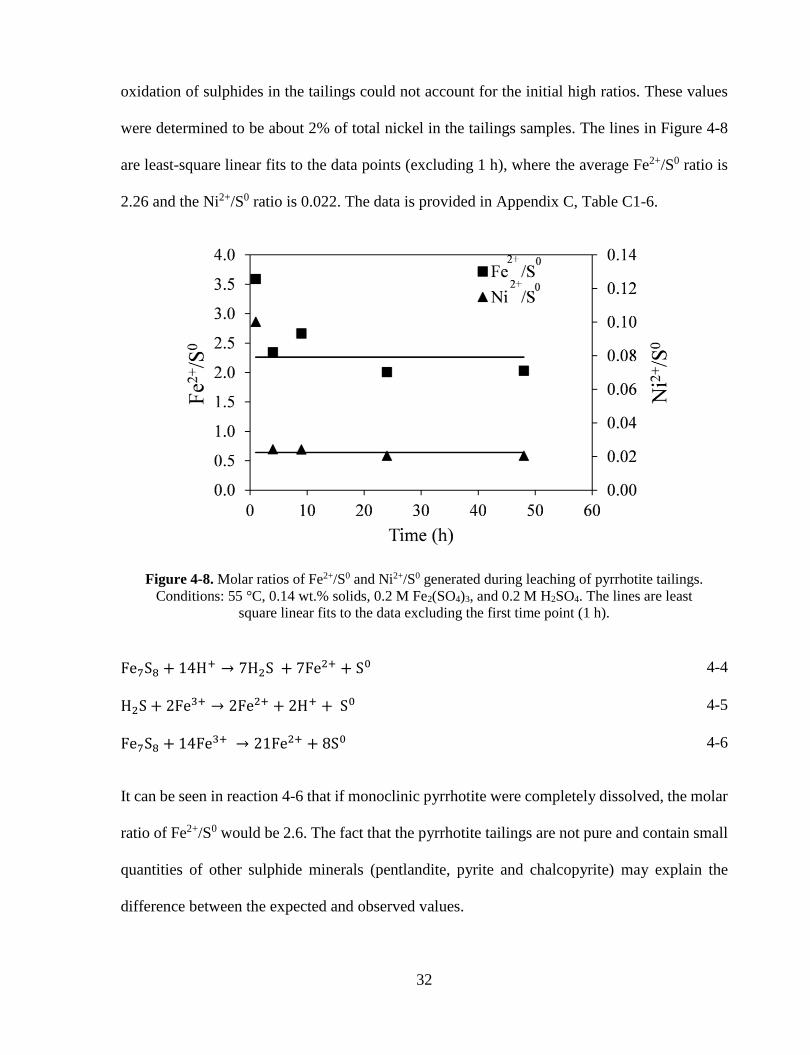
32
oxidation of sulphides in the tailings could not account for the initial high ratios. These values
were determined to be about 2% of total nickel in the tailings samples. The lines in Figure 4-8
are least-square linear fits to the data points (excluding 1 h), where the average Fe2+/S0 ratio is
2.26 and the Ni2+/S0 ratio is 0.022. The data is provided in Appendix C, Table C1-6.
Figure 4-8. Molar ratios of Fe2+/S0 and Ni2+/S0 generated during leaching of pyrrhotite tailings.
Conditions: 55 °C, 0.14 wt.% solids, 0.2 M Fe2(SO4)3, and 0.2 M H2SO4. The lines are least
square linear fits to the data excluding the first time point (1 h).
Fe7S8 + 14H+ → 7H2S + 7Fe2+ + S0 4-4
H2S + 2Fe3+ → 2Fe2+ + 2H+ + S0 4-5
Fe7S8 + 14Fe3+ → 21Fe2+ + 8S0 4-6
It can be seen in reaction 4-6 that if monoclinic pyrrhotite were completely dissolved, the molar
ratio of Fe2+/S0 would be 2.6. The fact that the pyrrhotite tailings are not pure and contain small
quantities of other sulphide minerals (pentlandite, pyrite and chalcopyrite) may explain the
difference between the expected and observed values.
33
Pyrrhotite is the dominant mineral of the tailings (86.2 wt.%), and therefore most of the
elemental sulphur produced is the by-product of pyrrhotite dissolution. However, nickel in the
tailings is attributed to both pentlandite and pyrrhotite, accounting for 40 and 60% of the total
nickel, respectively. Accordingly, if pyrrhotite and pentlandite react at different rates, the
Ni2+/S0 ratio is expected to change during the reaction, but it can be seen in Figure 4-8 that the
Ni2+/S0 ratio remains relatively constant over time. This shows that there is a similarity
between the dissolution rates of both pyrrhotite and pentlandite, indicating that no galvanic
interaction has occurred between the two minerals. This supports the use of the SCM for the
analysis of the dissolution kinetics. The theoretical value of Ni2+/S0 obtained based on the
assumption that pyrrhotite and pentlandite react at a similar rate is 0.02 which is comparable
with the molar ratios obtained for both 55 and 40 °C (Ni2+/S0 = 0.022).
To examine whether ferrous ion is re-oxidized to ferric ion due to oxygen entrainment, a control
experiment was conducted in which 0.02 M ferrous ion was added to 0.2 M ferric sulphate
solution at 55 °C and 250 rpm. After one week, the concentration of ferrous ion remained
reasonably constant over time (1% overall reduction). This suggests that there was no oxygen
entrainment in these tests, and all oxidative reactions are due to ferric attack.
Figure 4-9 shows the extraction of nickel and elemental sulphur formation from the leaching of
the pyrrhotite tailings at a lower temperature of 40 °C, 0.2 M Fe2(SO4)3, and 0.2 M H2SO4, where
each pair of points represents a separate experiment. It can be seen in Figure 4-9 that the
pyrrhotite tailings dissolve relatively fast, and after about 100 h 80% of nickel is extracted, while
only about 70% of sulphide is extracted as elemental sulphur. Although the extraction curve for
elemental sulphur follows a similar trend to that of nickel, the elemental sulphur extraction is

34
consistently lower due to reasons explained above. The data of nickel extraction and elemental
sulphur conversion is reported in Appendix C, Tables C2.2, C2.3, and C2.4.
Figure 4-9. Extraction of Ni and S0 formation from leaching of pyrrhotite tailings.
Conditions: 40 °C, 0.14 wt.% solids, 0.2 M Fe2(SO4)3, and 0.2 M H2SO4.
Figure 4-10. Molar ratios of Fe2+/S0 and Ni2+/S0 generated during leaching of pyrrhotite
Tailings. Conditions: 40 °C, 0.14 wt.% solids, 0.2 M Fe2(SO4)3, and 0.2 M H2SO4 . The lines are least-
square linear fits to the data.

35
Figure 4-10 shows the molar ratios of Fe2+/S0 and Ni2+/S0 with time from data in Figure 4-9.
The lines are least-square linear fits to the data points, where the average ratios of Ni2+/S0 and
Fe2+/S0 are 2.62 and 0.022, respectively. Here, the relatively constant Ni2+/S0 ratio shows that
the rates of nickel extraction from both pyrrhotite (60% of total Ni) and pentlandite (40% of
total Ni) must be very similar. The constant molar ratios of Ni2+/S0 and Fe2+/S0 are similar at
both temperatures of 40 and 55 °C indicating that the measured elemental sulphur yield was
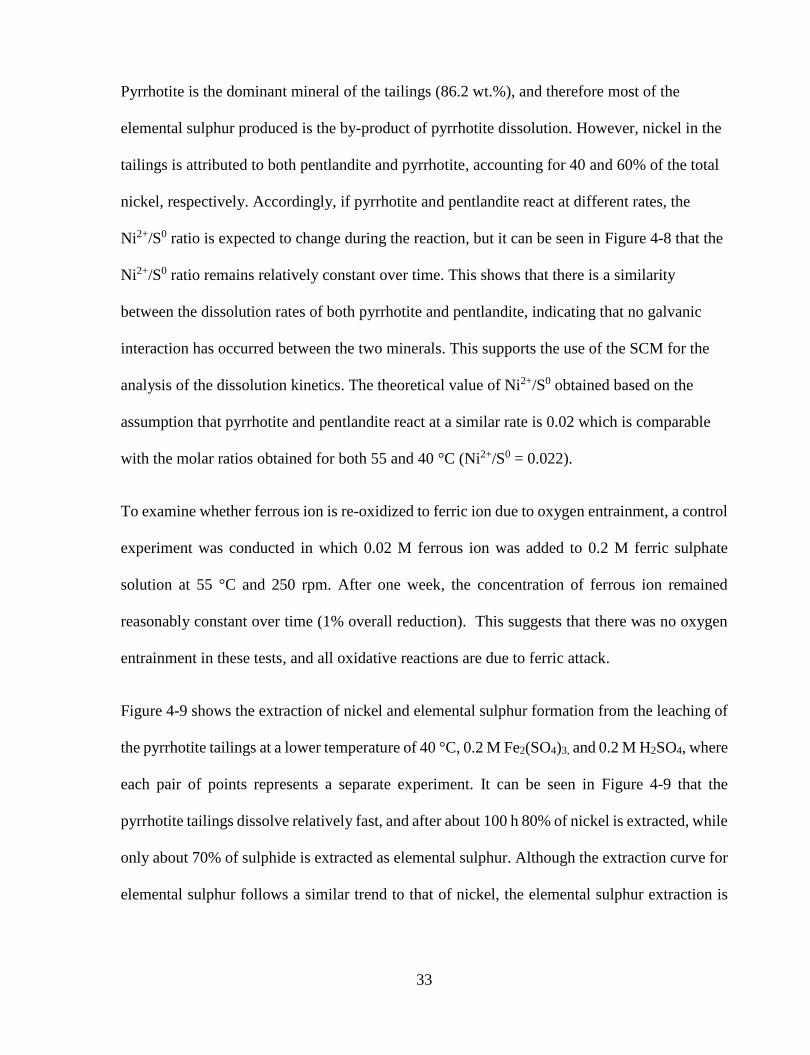
essentially independent of the temperature of the leach solution. Figure 4-11 shows that the ORP
and pH values of the leach solution remain relatively constant at both temperatures. The data is
provided in Appendix C, Tables C2-5 and C2-6.
36
Figure 4-11. ORP and pH values of the leach solution measured at different times for 55 °C and
40 °C. Conditions: 0.14 wt.% solids, 0.2 M Fe2(SO4)3, and 0.2 M H2SO4.
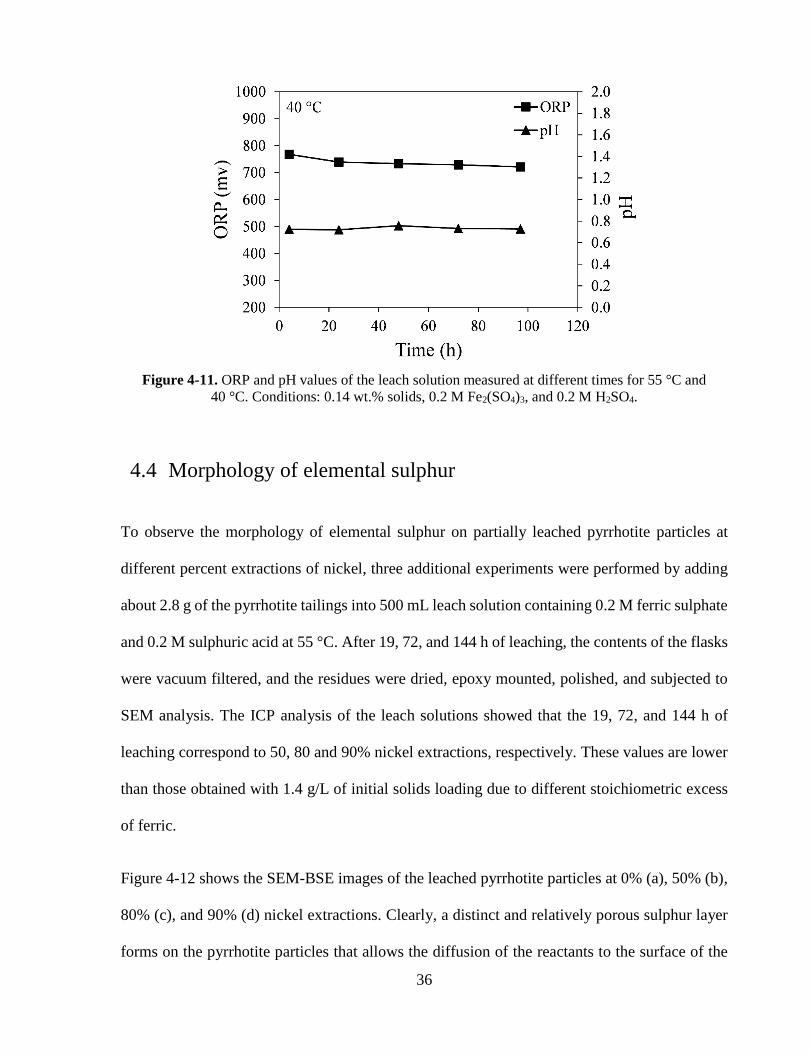
4.4 Morphology of elemental sulphur
To observe the morphology of elemental sulphur on partially leached pyrrhotite particles at
different percent extractions of nickel, three additional experiments were performed by adding
about 2.8 g of the pyrrhotite tailings into 500 mL leach solution containing 0.2 M ferric sulphate
and 0.2 M sulphuric acid at 55 °C. After 19, 72, and 144 h of leaching, the contents of the flasks
were vacuum filtered, and the residues were dried, epoxy mounted, polished, and subjected to
SEM analysis. The ICP analysis of the leach solutions showed that the 19, 72, and 144 h of
leaching correspond to 50, 80 and 90% nickel extractions, respectively. These values are lower
than those obtained with 1.4 g/L of initial solids loading due to different stoichiometric excess
of ferric.
Figure 4-12 shows the SEM-BSE images of the leached pyrrhotite particles at 0% (a), 50% (b),
80% (c), and 90% (d) nickel extractions. Clearly, a distinct and relatively porous sulphur layer
forms on the pyrrhotite particles that allows the diffusion of the reactants to the surface of the

37
particles. This is consistent with the postulated SCM for diffusion through the product layer-
control processes. It seems that as the layer grows, it reaches a point that halts the reaction. This
phenomenon is less dominant as the temperature increases and accelerates the rate of allowing
sulphur to remain amorphous and porous for a longer time. Elemental mapping of a pyrrhotite
particle after 90% nickel extraction was obtained with the help of EDX and are shown in Figure
4-13.
Figure 4-12. SEM-BSE images of partially leached pyrrhotite particles after (a) time 0 (0%), (b) 19h
(50%), (c) 72 h (80%) and (d) 144 h (90%) of leaching. Conditions: 55 °C, 0.56 wt.% solids, 0.2 M
Fe2(SO4)3, and 0.2 M H2SO4.

38
Figure 4-13. Elemental maps of a pyrrhotite particle after 90% nickel extraction.
20 20 µm

39
5 Chapter 5: Conclusions
The present work investigated the dissolution kinetics of pyrrhotite tailings from Sudbury,
Ontario, Canada, in concentrated ferric sulphate media. The effect of temperature on the nickel
extraction kinetics was investigated, and the dissolution mechanism of the tailings was
determined using the SCM. The diffusion-control kinetic model best fit the nickel extraction
data within the temperature range studied (30- 55 °C) with an activation energy value of 62.12
kJ/mol. The high activation energy was attributed to the wide PSD and the non-homogeneity of
the tailings (two nickel-bearing minerals). The reaction order with respect to ferric ion was found
to be 0.65 for the whole range of concentrations studied. However, the order of reaction with
respect to ferric ion was found to be 1.0 for ferric sulphate concentrations ranging from 0.1 to
0.3 M.
The results of this study suggested that the overall dissolution process of the pyrrhotite tailings
was governed by diffusion through the sulphur product layer. The molar ratios of Fe2+/S0 and
Ni2+/S0 at 40 °C were about 2.62 and 0.022, respectively, regardless of time. Similar values of
the molar ratios were obtained at 55 °C, where Fe2+/S0 ratio was 2.26 and Ni2+/S0 ratio was
0.022. The Fe2+/S0 ratios compare well with the theoretical value of 2.6 based on reaction
stoichiometry, whereas the constant Ni2+/S0 ratio is indicative of a similarity between the
dissolution rates of both pyrrhotite and pentlandite.
SEM-BSE images showed a distinct and relatively porous layer of elemental sulphur around the
leached pyrrhotite particles. Continuation of the leaching process resulted in a progressive
thickening of the sulphur layer to the point of reaction stoppage at certain extraction levels

40
depending on temperature. This is consistent with the observed non-linear leaching kinetics
(diffusion control).

41
References
[1] Peek, E., Barners, A.,Tuzum, " Nickeliferous pyrrhotite –Waste or resource?," Minerals
Engineering, vol. 24, no. 7, pp. 625-637, 2011.
[2] Thompson, R.B., Roesner, G., "Fluid bed roasting – principles and practice," Extractive
Metallurgy of Copper, Nickel and Cobalt, 1961.
[3] Queneau Paul, E., Sproule William, K., Illis, A., "Method for producing high-grade iron
oxide from ores rich in nickeliferous pyrrhotite," Patent 2556215, 1951.
[4] Queneau Paul, E., William Sproul, K., Clyde, N.J.G., "Method for producing high-grade
hematite from nickeliferous iron sulphide ore," Patent 2719082, 1955.
[5] Van Weert, G., Mah, K., Piret, N.L., "Hydrochloric acid leaching of nickeliferous
pyrrhotite from the Sudbury District," Bulletin of the Canadian Institute of Metallurgy, vol. 67,
no. 741, pp. 97-103, 1974.
[6] Droppert, D.J., Shang, Y., "The leaching behaviour of nickeliferous pyrrhotite
concentrate in hot nitric acid," Hydrometallurgy, vol. 39, no. 1, pp. 169-182, 1995.
[7] Thornhill, P.G., "Autoclave Treatment of Pyrrhotite for Sulphur Recovery," Canadian
Metallurgical Quarterly, vol. 8, no. 2, pp. 219-225, 1969.
[8] Garg, S., Papangelakis, V.G., Mahadevan, R., Edwards, E., Krause, E., "Bioleaching of
pyrrhotite tailings for Ni extraction- initial scoping tests," MetSoc of CIM proceedings of the
51st annual conference of metallurgists, 2012.
[9] Beolchini, F., Veglio, F., "Kinetic modeling of pyrrhotite ore leaching by ferric iron and
related statistical analysis," American Chemical Society, vol. 38, no. 9, pp. 3296-3299, 1999.

42
[10] Janzen, M.P., Nicholoson, R.V., Scharer, J.M., "Pyrrhotite reaction kinetics: reaction
rates for oxidation by oxygen, ferric iron, and for nonoxidative dissolution," Geochimica et
Cosmochimica Acta, vol. 64, no. 9, pp. 1511-1522, 2000.
[11] Nicholson, V.R., "Iron-sulfide oxidation mechanisms: Laboratory studies," Short Course
Handbook on Environmental Geochemistry, vol. 22, pp. 163–183, 1994.
[12] Subramanian, K.N., Stratigakos, E.S., Jennings, P.H., "Hydrometallurgical processing
of pyrrhotite," Canadian Metallurgical Quarterly, vol. 11, no. 2, pp. 425-434, 1972.
[13] Steger, H.F., Desjardins, L.E., "Oxidation of sulphide minerals, 4. pyrite, chalcopyrite
and pyrrhotite," Chemical Geology, vol. 23, no. 1, pp. 225-237, 1978.
[14] Belzile, N., Chen, Y., Cai, M., Li, Y., "A review on pyrrhotite oxidation," Journal of
Geochemical Exploration, vol. 84, no. 2, pp. 65-76, 2004.
[15] Ahonen, L., Tuovinen, O.H., "Solid-Phase Alteration and Iron Transformation in
Column Bioleaching of a Complex Sulfide Ore," American Chemical Society, 1994.
[16] Corriou, J., Kikindai, T., "The aqueous oxidation of elemental sulfur and different
chemical properties of the allotropic forms S λ and S μ," Journal of Inorganic and Nuclear
Chemistry, vol. 43, no. 1, pp. 9-15, 1981.
[17] Lotens, J.P., Wesker, E., "The behaviour of sulphur in the oxidative leaching of sulphidic
minerals," Hydrometallurgy, vol. 18, no. 1, pp. 39-54, 1987.
[18] Tewari, P.H., Campbell, A.B., "Dissolution of iron sulphide (troilite) in aqueous
sulphuric acid," Journal of physical Chemistry, vol. 80, no. 17, pp. 1844-1848, 1976.
[19] Thomas, J.E., Jones, C.F., Skinner, W.M., Smart, R.C., "The role of surface sulphur
species in the inhibition of pyrrhotite dissolution in acidic solutions," Geochimica et
Cosmochimica Acta, vol. 62, no. 9, pp. 1555-1565, 1998.

43
[20] Lehmann, M.N., Kaur, P., Pennifold, R.M., Dunn, J.G., "A comparative study of the
dissolution of hexagonal and monoclinic pyrrhotites in cynaide solution," Hydrometallurgy, vol.
55, no. 3, pp. 255-273, 2000.
[21] Orlova, T.A., Stupnikov, V.M., Krestan, A.L., "Mechanism of oxidative dissolution of
sulphides," Zhurnal Prikladnoi Khimii, vol. 61, no. 10, pp. 2172-2177, 1988.
[22] Knipe, S.W., Mycroft J.R., Pratt, A.R., Nesbitt, H.W., Bancroft, G.M., "X-ray
photoelectron spectroscopic study of water adsorption on iron sulphide minerals," Geochimica
et Cosmochimica Acta, vol. 59, no. 6, pp. 1079-1090, 1995.
[23] Rimstidt, M.A., DONALD, J., "The kinetics and electrochemical rate-determining step
of aqueous pyrite oxidation," Geochimlca et Cosmochimica Acta, vol. 58, no. 24, pp. 5443-
5454, 1994.
[24] Filippou, D., Konduru, R.,Demopoulos, G.P., "A kinetic study on the acid pressure
leaching of pyrrhotite," Hydrometallurgy, vol. 47, no. 1, pp. 1-18, 1997.
[25] Corrans, I.J., Scholtz, M.T., "A kinetic sutdy of the leaching of pentlandite in acidic
ferric sulphate solutions," Journal of South African Institute of Mining and Metallurgy, vol. 76,
no. 10, pp. 403-411, 1976.
[26] Levenspiel, O., Chemical Reaction Engineering, 1972.
[27] Legrand, D.L., Bancroft, G.M., Nesbitt, H.W., "Oxidation/alteration of pentlandite and
pyrrhotite surfaces at pH 9.3: Part 1. Assignment of XPS spectra and chemical trends,"
American Mineralogist, vol. 90, no. 7, pp. 1042-1054, 2005.
[28] Lu, Z.Y., Jeffrey, M.I., Zhu, Y., Lawson, F., "Studies of pentlandite leaching in mixed
oxygenated acidic chloride-sulfate solutions," Hydrometallurgy, vol. 56, no. 1, pp. 63–74, 2000.
[29] Dutrizac, J.E., "Elemental Sulphur Formation During the Ferric Sulphate Leaching of
Chalcopyrite," Canadian Metallurgical Quarterly, vol. 28, no. 4, pp. 337-344, 1989.

44
[30] McGuire, M. M., Hamers, R. J., "Extraction and Quantitative Analysis of Elemental
Sulfur from Sulfide Mineral Surfaces by High-Performance Liquid Chromatography,"
Environmental Science & Technology, vol. 34, no. 21, pp. 4651-4655, 2000.
[31] Jena, P.K., Barbosa-Filho, O., Vasconcelos, I.C., "Studies on the kinetics of slurry
chlorination of a sphalerite concentrate by chlorine gas," Hydrometallurgy, vol. 52, no. 2, pp.
111–122, 1999.
[32] Gbor, P.K., Jia, C.Q., "Critical evaluation of coupling particle size distribution with the
shrinking core model," Chemical Engineering Science, vol. 59, no. 10, pp. 1979 – 1987, 2004.
[33] Ingraham, T.F., parsons, H.W., Cabri, L.J., “Leaching of pyrrhotite in hydrochloric
acid," Canadian Metallurgical Quarterly, vol. 11, no. 2, pp. 407-411, 1972.

45
Appendices
Appendix A. Nickel extraction kinetics at different temperatures
Figure 4-1 in chapter 4 shows the effect of temperature on the kinetics of nickel extraction from
the pyrrhotite tailings. The experimental conditions performed at 55, 40, and 30 °C are shown
in Tables A1.1, A2.1, and A3.1, respectively. The raw data corresponding to the extraction
curves in Figure 4.1 are shown in tables A1.2, A2.2, and A3.2.
Table A1.1 Experimental conditions for nickel extraction at 55 °C.
Temperature 55 °C
Fe2(SO4)3.5H2O (g) 28.7
Fe2(SO4)3.5H2O (M) 0.12
Shaking speed (rpm) 250
H2SO4 (M) 0.2
Reaction volume (mL) 500
Sample IDs Exp-1, Exp-2, Exp-3
Wet weight (g) Exp-1. 0.72
Exp-2. 0.72
Exp-3. 0.72
Sample moisture content (wt%) 8.26
Dry weight (g) Exp-1. 0.67
Exp-2. 0.67
Exp-3. 0.67
Ni weight in the dry sample (mg)
(1 wt.%)
Exp-1. 6.7
Exp-2. 6.7
Exp-3. 6.7
46
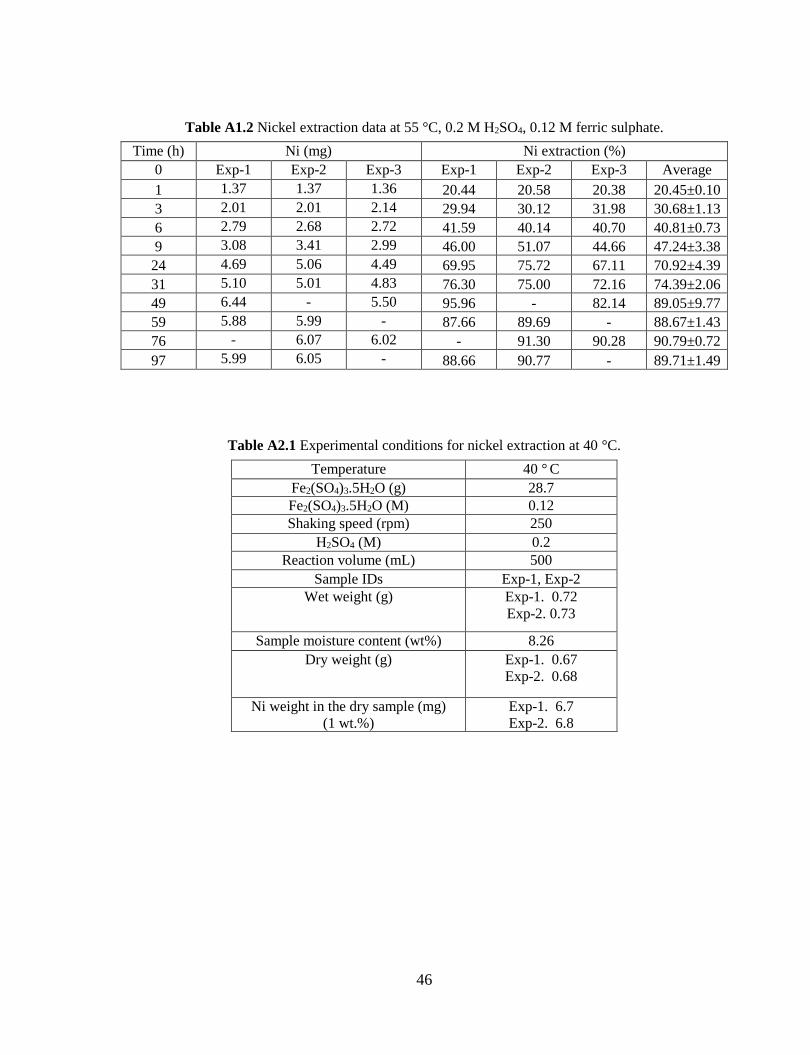
Table A1.2 Nickel extraction data at 55 °C, 0.2 M H2SO4, 0.12 M ferric sulphate.
Table A2.1 Experimental conditions for nickel extraction at 40 °C.
Time (h) Ni (mg) Ni extraction (%)
0 Exp-1 Exp-2 Exp-3 Exp-1 Exp-2 Exp-3 Average
1 1.37 1.37 1.36 20.44 20.58 20.38 20.45±0.10
3 2.01 2.01 2.14 29.94 30.12 31.98 30.68±1.13
6 2.79 2.68 2.72 41.59 40.14 40.70 40.81±0.73
9 3.08 3.41 2.99 46.00 51.07 44.66 47.24±3.38
24 4.69 5.06 4.49 69.95 75.72 67.11 70.92±4.39
31 5.10 5.01 4.83 76.30 75.00 72.16 74.39±2.06
49 6.44 - 5.50 95.96 - 82.14 89.05±9.77
59 5.88 5.99 - 87.66 89.69 - 88.67±1.43
76 - 6.07 6.02 - 91.30 90.28 90.79±0.72
97 5.99 6.05 - 88.66 90.77 - 89.71±1.49
Temperature 40 ° C
Fe2(SO4)3.5H2O (g) 28.7
Fe2(SO4)3.5H2O (M) 0.12
Shaking speed (rpm) 250
H2SO4 (M) 0.2
Reaction volume (mL) 500
Sample IDs Exp-1, Exp-2
Wet weight (g) Exp-1. 0.72
Exp-2. 0.73
Sample moisture content (wt%) 8.26
Dry weight (g) Exp-1. 0.67
Exp-2. 0.68
Ni weight in the dry sample (mg)
(1 wt.%)
Exp-1. 6.7
Exp-2. 6.8

47
Table A2.2 Nickel extraction data at 40 °C, 0.2 M H2SO4, 0.12 M ferric sulphate.
Table A3.1 Experimental conditions for nickel extraction at 30 °C.
Time (h) Ni (mg) Ni extraction (%)
0 Exp-1 Exp-2 Exp-1 Exp-2 Average
1 1.36 1.32 20.30 19.75 20.02±0.39
3 1.59 1.78 23.76 26.70 25.23±2.08
7 1.95 - 29.05 - 29.05
24 3.27 3.01 48.85 45.15 47.00±2.61
31 3.35 3.20 50.07 48.01 49.04±1.46
48 3.96 3.92 59.17 58.82 58.99±0.25
61 4.40 - 65.62 - 65.62
73 4.46 4.50 66.57 67.45 67.01±0.62
96 5.01 4.68 74.79 72.10 72.44±3.32
120 5.44 5.39 81.13 80.75 80.94±0.27
Temperature 30 °C
Fe2(SO4)3.5H2O (g) 28.7
Fe2(SO4)3.5H2O (M) 0.12
Shaking speed (rpm) 250
H2SO4 (M) 0.2
Reaction volume (mL) 500
Sample IDs Exp-1, Exp-2, Exp-3
Wet weight (g) Exp-1. 0.72
Exp-2. 0.72
Exp-3. 0.72
Moisture content (wt%) 8.26
Dry weight (g) Exp-1. 0.67
Exp-2. 0.67
Exp-3. 0.67
Ni weight in the dry sample (mg)
(1 wt.%)
Exp-1. 6.7
Exp-2. 6.7
Exp-3. 6.7

48
Table A3.2 Nickel extraction data at 30 °C, 0.2 M H2SO4, 0.12 M ferric sulphate.
Ferrous ion concentration and pH values of the leach solutions, corresponding to Figure 4-1 in
chapter 4, were measured during the ferric leaching of the pyrrhotite tailings. Figure A-1 shows
the ferrous ion concentration curves at 55, 40, and 30 °C, and the raw data are shown in tables
A1.3, A2.3, and A3.3, respectively.
Figure A-1. Ferrous ion concentration at different temperatures and 0.12 M ferric sulphate-0.2 M
H2SO4 media.
Time(h) Ni (mg) Ni extraction (%)
0 Exp-1 Exp-2 Exp-3 Exp-1 Exp-2 Exp-3 Average
3 1.37 1.32 1.37 20.44 19.74 20.33 20.17±0.37
7 1.55 - - 23.12 - - 23.12
10 1.63 1.66 1.70 24.30 24.86 25.23 24.80±0.47
24 2.15 2.02 2.15 31.96 30.32 31.91 31.40±0.93
31 2.69 2.24 2.89 39.98 33.55 42.94 38.83±4.80
49 2.75 2.53 3.31 40.95 37.92 49.05 42.64±5.75
59 3.03 3.10 - 45.08 46.47 - 45.78±0.98
76 3.01 2.72 2.74 44.78 40.68 40.67 42.04±2.37
97 3.21 3.10 3.13 47.72 46.44 46.49 46.88±0.72
120 3.50 3.29 3.41 52.08 49.28 50.64 50.67±1.40

49
Table A1.3 Ferrous ion concentrations and pH values at 55 °C, 0.2 M H2SO4, 0.12M ferric sulphate.
Samples Time (h) Fe2+ (M) pH Average Fe2+ Average pH
Exp.1
Exp.2
Exp.3
1
0.0014
0.0017
0.0014
0.87
0.81
0.84
0.0015±0.0001 0.84±0.030
Exp.1
Exp.2
Exp.3
3 0.0057
0.006
0.0055
0.79
0.83
0.83
0.0057±0.0002
0.82±0.028
Exp.1
Exp.2
Exp.3
6 0.0091
0.0096
0.0091
0.78
0.80
0.80
0.0093±0.0003
0.79±0.013
Exp.1
Exp.2
Exp.3
9 0.0110
0.0115
0.0115
0.76
0.79
0.82
0.0114±0.0003
0.79±0.028
Exp.1
Exp.2
Exp.3
24 0.0168
0.0173
0.0173
0.81
0.87
0.79
0.0171±0.0003
0.82±0.045
Exp.1
Exp.2
Exp.3
31 0.018
0.0195
0.018
0.78
0.83
0.87
0.0185±0.0008
0.82±0.045
Exp.1
Exp.2
Exp.3
49 0.021
0.021
0.021
0.84
0.85
0.84
0.021
0.84±0.002
Exp.1
Exp.2
Exp.3
59 0.021
0.021
0.021
0.79
0.79
0.83
0.021
0.80±0.022
Exp.1
Exp.2
Exp.3
76 0.021
0.021
0.021
0.80
0.85
0.83
0.021
0.83±0.022
Table A2.3 Ferrous ion concentrations and pH values at 40 °C, 0.2 M H2SO4, 0.12 M ferric sulphate.
Samples Time (h) Fe2+ (M) pH Average Fe2+ Average pH
Exp.1
Exp.2
3 0.0031
0.0035
0.88
0.86
0.0033±0.0003
0.87±0.009
Exp.1
Exp.2
7 0.0058
-
0.891
-
0.0058
0.89
Exp.1
Exp.2
24 0.0108
0.0117
0.81
0.82
0.0112±0.0006
0.81±0.009
Exp.1
Exp.2
31 0.012
-
0.79
-
0.012
0.79
Exp.1 48 0.015 0.85

50
Exp.2 0.0154 0.79 0.0152±0.0003 0.82±0.042
Exp.1
Exp.2
61 0.0171
-
0.81
-
0.0171
0.81
Exp.1
Exp.2
73 0.0182
0.0187
0.78
0.74
0.0185±0.0004
0.76±0.029
Exp.1
Exp.2
96 0.02
0.0199
0.82
0.80
0.0199±0.0001
0.81±0.018
Table A3.3 Ferrous ion concentrations and pH values at 30 °C, 0.2 M H2SO4, 0.12 M ferric sulphate.
Samples Time (h) Fe2+ (M) pH Average Fe2+ Average pH
Exp.1
Exp.2
Exp.3
3
0.0019
0.0019
0.0019
0.90
0.87
0.90
0.00192
0.89±0.004
Exp.1
Exp.2
Exp.3
7 0.0041
0.0034
0.0041
0.92
0.82
0.83
0.0038±0.000
42
0.86±0.011
Exp.1
Exp.2
Exp.3
10 0.0055
0.0048
0.0058
0.77
0.78
0.76
0.0054±0.000
5
0.78±0.047
Exp.1
Exp.2
Exp.3
24 0.0096
0.0084
0.0091
0.86
0.87
0.84
0.009±0.0006
0.86±0.015
Exp.1
Exp.2
Exp.3
31 0.0096
0.009
0.0096
0.89
0.86
0.76
0.0094±0.000
35
0.84±0.069
Exp.1
Exp.2
Exp.3
49 0.012
0.0114
0.0126
0.80
0.73
0.70
0.012±0.0006
0.74±0.054
Exp.1
Exp.2
Exp.3
59 0.0132
0.0126
0.0126
0.80
0.73
0.84
0.0128±0.000
35
0.79±0.536
Exp.1
Exp.2
Exp.3
76 0.0144
0.0132
0.0144
0.81
0.79
0.89
0.014±0.0007
0.83±0.051
Exp.1
Exp.2
Exp.3
97 0.0156
0.0144
0.0156
0.85
0.79
0.78
0.0152±0.000
7
0.81±0.037

51
The shrinking core model (SCM) was applied to the nickel extraction data at different
temperatures (30, 40, and 55 °C), and the results were plotted in Figures 4-2 and 4-3 in Chapter
4 for diffusion-control and chemical reaction-control kinetic models. The raw data of the figures
is summarized in Tables A1-4, A2-4, and A3-4.
Table A1.4 SCM fitted to nickel extraction data at 55 °C, 0.2 M H2SO4, 0.12 M ferric sulphate.
Time (h) Conversion (x) 1-(1-x)1/3 1-3(1-x)2/3+2(1-x)
0 0 0 0
1 0.205 0.073 0.015
3 0.307 0.115 0.037
6 0.408 0.160 0.069
9 0.453 0.182 0.087
24 0.685 0.320 0.241
31 0.744 0.364 0.302
49 0.890 0.521 0.532
Table A2.4 SCM fitted to nickel extraction data at 40 °C, 0.2 M H2SO4, 0.12 M ferric sulphate.
Time (h) Conversion (x) Chemical-control
model
1-(1-x)1/3
Diffusion-control
model
1-3(1-x)2/3+2(1-x)
0 0 0 0
1 0.200 0.072 0.015
3 0.252 0.092 0.024
7 0.290 0.108 0.032
24 0.470 0.191 0.095
31 0.490 0.201 0.105
48 0.590 0.257 0.164
61 0.656 0.299 0.215

52
Table A3.4 SCM fitted to nickel extraction data at 30 °C, 0.2 M H2SO4, 0.12 M ferric sulphate.
Time (h) Conversion (x) Chemical-control
model
1-(1-x)1/3
Diffusion-control
model
1-3(1-x)2/3+2(1-x)
0 0 0 0
3 0.201 0.072 0.015
7 0.231 0.088 0.022
10 0.247 0.091 0.023
24 0.314 0.118 0.038
31 0.389 0.151 0.061
49 0.426 0.169 0.076
59 0.458 0.185 0.090

53
Appendix B. Ferric sulphate concentration effect on nickel extraction
Figure 4-1 in chapter 4 shows the effect of ferric sulphate concentration on the kinetics of nickel
extraction from the pyrrhotite tailings. The experimental conditions performed at 0.3, 0.2, 0.1,
and 0.02 M ferric sulphate are shown in Tables B1.1, B2.1, B3.1, and B4.1, respectively. The
raw data corresponding to the extraction curves in Figure 4.5 is shown in tables B1.2, B2.2,
B3.2, and B4.2.
Table B1.1 Experimental conditions.
.
Table B1.2 Nickel extraction data at 55 °C, 0.2 M H2SO4, 0.3 M ferric sulphate
Temperature 55 °C
Fe2(SO4)3.5H2O (g) 72.8
Fe2(SO4)3.5H2O (M) 0.3
Shaking speed (rpm) 250
H2SO4 (M) 0.2
Reaction volume (mL) 500
Sample IDs Exp-1, Exp-2, Exp-3
Wet weight (g) Exp-1. 0.681
Exp-2. 0.680
Exp-3. 0.682
Sample moisture content (wt.%) 8.26
Dry weight (g) Exp-1. 0.625
Exp-2. 0.621
Exp-3. 0.626
Nickel content in the dry samples
(mg) (1 wt.%)
Exp-1. 6.25
Exp-2. 6.21
Exp-3. 6.26
Time (h) Ni (mg) Ni Extraction (%)
0 Exp-1 Exp-2 Exp-3 Exp-1 Exp-2 Exp-3 Average
1 2.56 2.61 2.63 40.90 42.09 42.08 41.69±0.69
3 3.13 3.29 3.32 50.06 52.97 53.09 52.04±1.72
6 3.66 3.61 3.67 58.50 58.06 58.73 58.43±0.34
9 4.09 4.05 3.95 65.36 65.17 63.11 64.54±1.25
24 5.57 5.76 5.82 89.12 92.69 93.14 91.65±2.20
30 5.91 6.08 6.06 94.62 97.88 97.05 96.52±1.69

54
Table B2.1 Experimental conditions.
Table B2.2 Nickel extraction data at 55 °C, 0.2 M H2SO4, 0.3 M ferric sulphate.
Temperature 55 °C
Fe2(SO4)3.5H2O (g) 49
Fe2(SO4)3.5H2O (M) 0.2
Shaking speed (rpm) 250
H2SO4 (M) 0.2
Reaction volume (mL) 500
Sample IDs Exp-1, Exp-2
Wet weight (g) Exp-1. 0.6821
Exp-2. 0.6823
Sample moisture content (wt.%) 7.00
Dry weight (g) Exp-1. 0.634
Exp-2. 0.634
Nickel content in the dry samples
(mg) (1 wt.%)
Exp-1. 6.34
Exp-2. 6.34
Time (h) Ni (mg) Ni extraction (%)
0 Exp-1 Exp-2 Exp-1 Exp-2 Average
1 1.88 1.87 29.63 29.47 29.55±0.11
3 2.39 2.40 37.61 37.78 37.69±0.12
6 2.90 3.00 45.74 47.33 46.54±1.12
8.5 3.14 3.25 49.53 51.20 50.37±1.18
23 4.49 4.53 70.70 71.37 71.04±0.48
30 4.83 4.87 76.13 76.72 76.43±0.42
48 5.30 5.40 83.55 85.18 84.36±1.15
72 5.69 5.73 87.82 88.43 88.13±0.43
96 5.70 5.66 89.87 89.23 89.55±0.45

55
Table B3.1 Experimental conditions.
Table B3.2 Nickel extraction data at 55 °C, 0.2 M H2SO4, 0.1 M ferric sulphate.
Temperature 55 °C
Fe2(SO4)3.5H2O (g) 24.5
Fe2(SO4)3.5H2O (M) 0.1
Shaking speed (rpm) 250
H2SO4 (M) 0.2
Reaction volume (mL) 500
Sample IDs Exp-1, Exp-2
Wet weight (g) Exp-1. 0.681
Exp-2. 0.682
Sample moisture content (wt.%) 7.00
Dry weight (g) Exp-1. 0.634
Exp-2. 0.634
Nickel content in the dry samples
(mg) (1 wt.%)
Exp-1. 6.34
Exp-2. 6.34
Time (h) Ni (mg) Ni extraction (%)
Exp-1 Exp-2 Exp-1 Exp-2 Average
1 1.18 1.18 18.55 18.55 18.55±0.0016
3 1.69 1.70 26.63 26.83 26.73±0.13
6 2.27 2.26 35.86 35.60 35.73±0.18
8.5 2.57 2.68 40.56 42.19 41.38±1.15
23 3.83 3.89 60.51 61.29 60.90±0.55
30 4.41 4.22 69.63 66.54 68.09±2.19
48 4.78 4.77 75.45 75.22 75.34±0.17
56.5 4.79 4.86 75.65 76.66 76.15±0.72
72 4.93 5.04 77.81 79.51 78.66±1.21
96 5.70 5.16 80.40 81.31 80.85±0.64

56
Table B4.1 Experimental conditions.
Table B4.2 Nickel extraction data at 55 °C, 0.2 M H2SO4, 0.02 M ferric sulphate.
Ferrous ion concentration and pH values of the leach solutions, corresponding to Figure 4-5 in
chapter 4, were measured during the ferric leaching of the pyrrhotite tailings. Figure B-1 shows
the ferrous ion concentration curves at 0.3, 0.2, 0.1, and 0.02 M and the raw data are shown in
tables B1.3, B2.3, B3.3, and B4.3, respectively.
Temperature 55 °C
Fe2(SO4)3.5H2O (g) 4.9
Fe2(SO4)3.5H2O (M) 0.02
Shaking speed (rpm) 250
H2SO4 (M) 0.2
Reaction volume (mL) 500
Sample IDs Exp-1, Exp-2
Wet weight (g) Exp-1. 0.6826
Exp-2. 0.6825
Sample moisture content (wt%) 7
Dry weight (g) Exp-1. 0.6348
Exp-2. 0.6347
Ni weight in the dry sample (mg) (1
wt.%)
Exp-1. 6.3482
Exp-2. 6.3472
Time (h) Ni (mg) Ni Extraction (%)
0 Exp-1 Exp-2 Exp-1 Exp-2 Average
1 0.69 0.63 10.90 9.93 10.42±0.68
3 1.13 1.07 17.82 16.92 17.36±0.64
6 1.66 1.57 26.25 24.74 25.49±1.07
8.5 1.93 1.81 30.33 28.59 29.47±1.23
23 3.12 3.04 49.10 47.89 48.49±0.86
30 3.44 3.36 54.21 52.96 53.59±0.89
48 4.10 4.06 64.65 64.00 64.32±0.46
72 4.46 4.42 70.27 69.61 69.94±0.47
96 4.63 4.54 72.98 71.50 72.24±1.05

57
Figure B-1. Ferrous ion concentration at different ferric sulphate concentrations, 55 °C and 0.2 M
H2SO4.
Table B1.3 Ferrous ion concentrations and pH values at 55 °C, 0.2 M H2SO4, 0.3 M ferric sulphate.
Samples Time (h) Fe2+ (M) pH Average Fe2+ Average pH
Exp.1
Exp.2
Exp.3
1
0.0018
0.0018
0.0018
0.649
0.739
0.723
0.0018
0.7037±0.048
Exp.1
Exp.2
Exp.3
3 0.0054
0.0054
0.006
0.625
0.706
0.692
0.0056±0.000
3
0.6743±0.043
2
Exp.1
Exp.2
Exp.3
6 0.0072
0.009
0.009
0.769
0.697
0.785
0.0084±0.001
0
0.7503±0.046
9
Exp.1
Exp.2
Exp.3
9 0.0096
0.0102
0.0108
0.583
0.667
0.664
0.0102±0.000
6
0.638±0.0476
Exp.1
Exp.2
Exp.3
24 0.015
0.0156
-
0.611
0.706
0.599
0.0153±0.000
4
0.6386±0.058
6
Exp.1
Exp.2
Exp.3
30 0.0162
0.0168
0.0168
0.689
0.716
0.699
0.0166±0.000
5
0.7013±0.013
6

58
Table B2.3 Ferrous ion concentrations at 55 °C, 0.2 M H2SO4, 0.2 M ferric sulphate.
Samples Time (h) Fe2+ (M) Average Fe2+ (M)
Exp.1
Exp.2
1
0.0012
0.0012
0.0012
Exp.1
Exp.2
3 0.0039
0.0042
0.00405±0.0002
Exp.1
Exp.2
8.5 0.0084
0.009
0.0087±0.0004
Exp.1
Exp.2
23 0.0132
0.0138
0.0135±0.0004
Exp.1
Exp.2
30 0.0144
0.0144
0.0144
Exp.1
Exp.2
48 0.0156
0.0162
0.0159±0.0004
Exp.1
Exp.2
56.5 0.0162
0.0162
0.0162
Exp.1
Exp.2
72 0.0168
0.0168
0.0168
Exp.1
Exp.2
96 0.0174
0.0174
0.0174
Table B3.3 Ferrous ion concentrations at 55 °C, 0.2 M H2SO4, 0.1 M ferric sulphate.
Samples Time (h) Fe2+ (M) Average Fe2+ (M)
Exp.1
Exp.2
1 0.0009
0.0012
0.00105±0.0002
Exp.1
Exp.2
3 0.0036
0.0036
0.0036
Exp.1
Exp.2
8.5 0.0078
0.0078
0.0078
Exp.1
Exp.2
23 0.0132
0.0126
0.0129±0.0004
Exp.1
Exp.2
30 0.0132
0.0138
0.0135±0.0004
Exp.1
Exp.2
48 0.0156
0.0150
0.0153±0.0004
Exp.1
Exp.2
56.5 0.0156
0.0156
0.0156
Exp.1
Exp.2
76 0.0162
0.0162
0.0162
Exp.1
Exp.2
96 0.0168
0.0168
0.0168

59
Table B4.3 Ferrous ion concentrations at 55 °C, 0.2 M H2SO4, 0.02 M ferric sulphate.
Samples Time (h) Fe 2+ (M) Average Fe2+
Exp.1
Exp.2
3 0.0027
0.0024
0.00255±0.0002
Exp.1
Exp.2
8.5 0.0054
0.0054
0.0054±0
Exp.1
Exp.2
23 0.009
0.0096
0.0093±
Exp.1
Exp.2
30 0.0102
0.0102
0.0102±0
Exp.1
Exp.2
48 0.012
0.012
0.012±0
Exp.1
Exp.2
56.5 0.0123
0.012
0.01215±0.0002
Exp.1
Exp.2
79 0.0132
0.0138
0.0135±0.0004
Exp.1
Exp.2
96 0.0138
0.0138
0.0138±0
The shrinking core model (SCM) was applied to the nickel extraction data at different ferric
sulphate concentrations (0.3, 0.2, 0.1, and 0.02 M), and the results are plotted in Figures B-2
and B-3 for diffusion-control and chemical reaction-control kinetic models. The raw data of
these figures is summarized in Tables B1-4, B2-4, B3-4, and B4-4. The straight-line plots in
Figure 4-2 produce higher correlation coefficients for all the temperatures in comparison to the
chemical reaction-control SCM (Figure 4-3). Moreover, in Figure 4-2, the fitted lines at
different temperatures extrapolate through the origin or are very close to the origin, whereas in
Figure 4-3 they do not. Therefore, the process is diffusion control.
Table B1.4 SCM fitted to nickel extraction data at 55 °C, 0.2 M H2SO4, 0.3 M ferric sulphate.
Time (h) 0.3M Conversion (x) 1-(1-x)1/3 1-3(1-x)2/3+2(1-x)
0 0 0 0
1 0.42 0.07 0.16
3 0.52 0.12 0.22
6 0.58 0.16 0.25
9 0.65 0.21 0.29
24 0.92 0.59 0.56
30 0.97 0.75 0.67

60
Table B2.4 SCM fitted to nickel extraction data at 55 °C, 0.2 M H2SO4, 0.2 M ferric sulphate.
Time (h) 0.2M Conversion (x) 1-(1-x)1/3 1-3(1-x)2/3+2(1-x)
0 0 0 0
1 0.30 0.03 0.11
3 0.38 0.06 0.15
6 0.47 0.09 0.19
8.5 0.50 0.11 0.21
24 0.71 0.27 0.34
30 0.76 0.33 0.38
48 0.84 0.44 0.46
Table B3.4 SCM fitted to nickel extraction data at 55 °C, 0.2 M H2SO4, 0.1 M ferric sulphate.
Time (h) Conversion (x) 1-(1-x)1/3 1-3(1-x)2/3+2(1-x)
0 0 0 0
1 0.19 0.01 0.07
3 0.27 0.03 0.10
6 0.36 0.05 0.14
8.5 0.41 0.07 0.16
23 0.61 0.18 0.27
30 0.68 0.24 0.32
48 0.75 0.31 0.37
Table B4.4 SCM data fitted to nickel extraction data at 55 °C, 0.2 M H2SO4, 0.02 M ferric sulphate.
Time (h) Conversion (x) 1-(1-x)1/3 1-3(1-x)2/3+2(1-x)
0 0 0 0
1 0.1 0.003 0.04
3 0.17 0.01 0.06
6 0.25 0.02 0.09
8.5 0.29 0.03 0.11
23 0.48 0.10 0.20
30 0.53 0.13 0.23
48 0.64 0.20 0.29
72 0.69 0.25 0.33

61
Figure B-2. Plot of chemical reaction-control SCM at various ferric sulphate concentrations.
Figure B-3. Plot of diffusion-control SCM at various ferric sulphate concentrations.

62
Table B5.1 Surface reaction-control apparent rate constant values at various ferric sulphate
concentrations obtained from the slopes of linear fits in Figure B-2.
Fe2(SO4)3 (M) kr (h-1) R2
0.3 2.0×10⁻² 0.90
0.2 0.84×10⁻² 0.90
0.1 0.72×10⁻²
0.91
0.02 0.45×10⁻² 0.91
Table B5.2 Diffusion-control apparent rate constants at various ferric sulphate
concentrations obtained from the slopes of linear fits in Figure B-3.
Fe2(SO4)3 (M) kd (h-1) R2
0.3 2.50×10⁻² 0.99
0.2 1.00×10⁻² 0.97
0.1 0.71×10⁻²
0.98
0.02 0.39×10⁻² 0.98
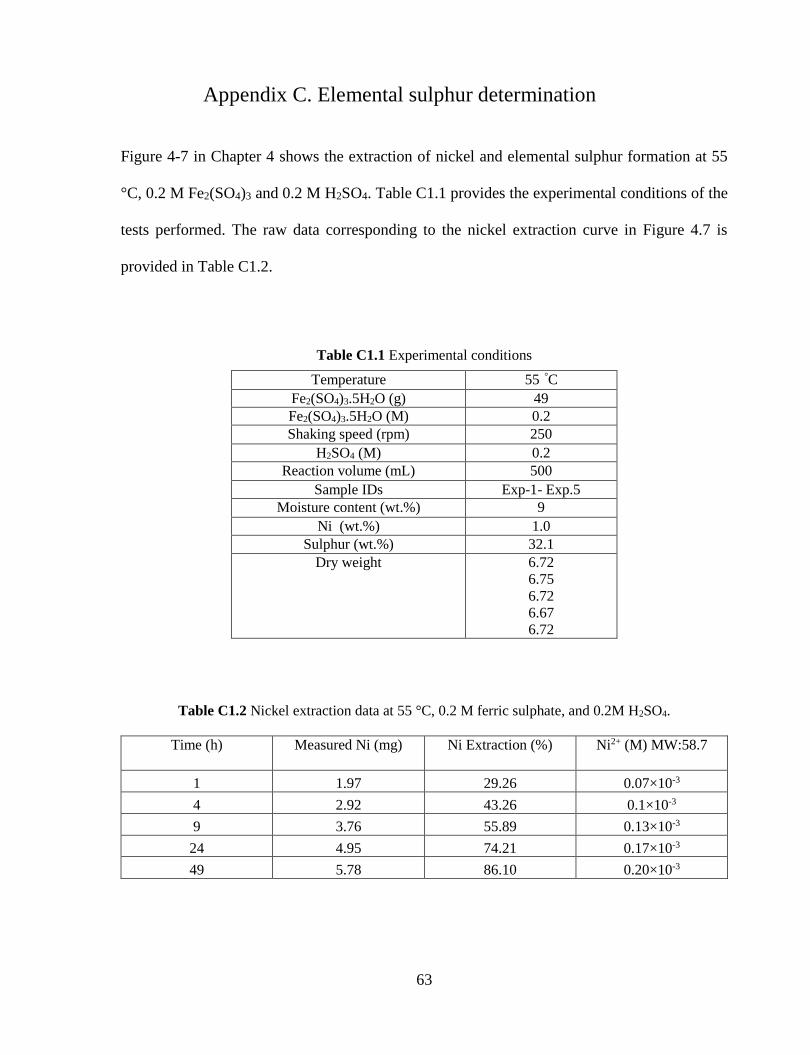
63
Appendix C. Elemental sulphur determination
Figure 4-7 in Chapter 4 shows the extraction of nickel and elemental sulphur formation at 55
°C, 0.2 M Fe2(SO4)3 and 0.2 M H2SO4. Table C1.1 provides the experimental conditions of the
tests performed. The raw data corresponding to the nickel extraction curve in Figure 4.7 is
provided in Table C1.2.
Table C1.1 Experimental conditions
Table C1.2 Nickel extraction data at 55 °C, 0.2 M ferric sulphate, and 0.2M H2SO4.
Temperature 55 °C
Fe2(SO4)3.5H2O (g) 49
Fe2(SO4)3.5H2O (M) 0.2
Shaking speed (rpm) 250
H2SO4 (M) 0.2
Reaction volume (mL) 500
Sample IDs Exp-1- Exp.5
Moisture content (wt.%) 9
Ni (wt.%) 1.0
Sulphur (wt.%) 32.1
Dry weight 6.72
6.75
6.72
6.67
6.72
Time (h) Measured Ni (mg)
Ni Extraction (%) Ni2+ (M) MW:58.7
1 1.97 29.26 0.07×10⁻³
4 2.92 43.26 0.1×10⁻³
9 3.76 55.89 0.13×10⁻³
24 4.95 74.21 0.17×10⁻³
49 5.78 86.10 0.20×10⁻³

64
As explained in section 3.5 of chapter 3, the concentration of elemental sulphur present in the
leached residue was measured using HPLC. Standard solutions for elemental sulphur analysis
were prepared within the range of 6-240 mg/L by a procedure similar to that employed by
McGuire and Hamers [30]. The standard HPLC calibration curve is shown in Figure C-1, where
the equation of the linear fit is y= 2.35 x – 1.36. In order to calculate the sulphur concentration
of the leached sample, the peak area (from HPLC) is inserted in the linear equation of the
following calibration curve.
Figure C-1. Standard HPLC calibration curve for sulphur analysis at 55 °C.
Each measurement lasted for 25 min, and the peak corresponding to the elemental sulphur
appeared somewhere between 15 and 20 min, due to small changes in the eluent composition.
Figure C-2 shows the HPLC chromatographs of elemental sulphur having a retention time of
15.5 min. The data obtained from the HPLC analysis of the samples leached at 55 °C, 0.2 M
ferric sulphate, and 0.2M H2SO is provided in Table C1.3.

65
Figure C-2. HPLC Chromatograms of elemental sulphur. The elemental sulphur peak appears at 15.5
min.
Table C1.3 HPLC data for the analysis of elemental sulphur kinetics at 55 °C, 0.2 M ferric sulphate,
and 0.2M H2SO4.
Peak area
HPLC
Dilution
factor
Peak Area Peak area
x dilution
factor
Peak are
with filter
paper
subtracted
Sulphur
(mg/L)
Volume
(mL) Sulphur
(mg)
Filter
paper 1
5.54
5.54
0
0
25
0
1 h 50 3.77 188.56 183.02 427.85 25 10.70
4 h 50 22.47 1123.34 1117.80 2620.11 25 65.50
9 h 50 29.00 1449.97 1444.43 3386.11 25 84.65
24 h 50 45.00 2250.12 2244.58 5262.62 25 131.57
49 h 50 52.48 2624.01 2618.47 6139.47 25 153.49

66
Table C1.4 Elemental sulphur conversion data at 55 °C, 0.2 M ferric sulphate, and 0.2M H2SO4.
Ferrous ion concentration, pH, and ORP values of the leach solutions, corresponding to Figure
4-7 in chapter 4, were measured during the ferric leaching of the pyrrhotite tailings. Figure C-3
shows the ferrous ion concentration curve and the raw data is shown in Table C1.5.
Figure C-3. Ferrous ion concentration at 55 °C, 0.2 M ferric sulphate and 0.2 M H2SO4 media.
Time (h) Measured S0 (mg)
S conversion (%) S0 (M) MW:32
1 0 0 0.66×10⁻³
4 10.70 5.13474 4.1×10⁻³
9 65.50 31.2611 5.3×10⁻³
24 84.65 40.61268 8.22×10⁻³
49 131.57 63.5763 9.6×10⁻³

67
Table C1.5 Ferrous ion concentrations, pH and ORP values at 55 °C, 0.2 M ferric sulphate, and 0.2M
H2SO4.
Sample Time (h) Fe2+ (M) Eh
SCE (mV)
pH ORP
SHE (V)
Exp-1 1 0.0024 550 0.64 791
Exp-2 4 0.0096 523 0.67 764
Exp-3 9 0.0141 510 0.67 751
Exp-4 24 0.0165 505 0.67 746
Exp-5 49 0.0195 501 0.67 742
Figure 4-8 in chapter 4 shows the molar ratios of Fe2+/S0 and Ni2+/S0 with time from data in
Figure 4-7. The calculation of these molar ratios is provided in Table C1.6, where the molarities
of, Ni2+, S0, and Fe2+ are from Tables C1.2, C1.4, and C1.5, respectively.
Table C1.6 Analysis of molar ratios of Fe2+/S0 and Ni2+/S0 at 55 °C.
Time (h) Ni2+/S0 Fe2+/S0
1 0.100 3.59
4 0.024 2.34
9 0.024 2.84
24 0.021 2.19
49 0.021 2.03

68
Figure 4-9 in Chapter 4 shows the extraction of nickel and elemental sulphur formation at 40
°C, 0.2 M Fe2(SO4)3 and 0.2 M H2SO4. Table C2.1 provides the experimental conditions of the
tests performed. The raw data corresponding to the nickel extraction curve in Figure 4.9 is
provided in Table C2.2.
Table C2.1 Experimental conditions.
Table C2.2 Nickel extraction data at 40 °C, 0.2 M ferric sulphate, and 0.2M H2SO4.
Temperature 40 °C
Fe2(SO4)3.5H2O (g) 49
Fe2(SO4)3.5H2O (M) 0.2
Shaking speed (rpm) 250
H2SO4 (M) 0.2
Reaction volume (mL) 500
Sample IDs Exp-1- Exp.5
Moisture content (wt.%) 9
Ni (wt.%) 1.0
Sulphur (wt.%) 32.1
Dry weight (g) Exp-1 0.46
Exp-2 0.65
Exp-3 0.65
Exp-4 0.65
Exp-5 0.65
Time (h) Measured Ni (mg)
Ni Extraction (%) Ni2+ (M)
4 1.967179 29.3 0.06×10⁻³
24 2.924076 43.3 0.13×10⁻³
48 3.758084 55.9 0.16×10⁻³
72 4.954033 74.2 0.17×10⁻³
97 5.778863 86.0 0.19×10⁻³

69
As explained in section 3.5 of chapter 3, the concentration of elemental sulphur present in the
leached residue was measured using HPLC. Standard solutions for elemental sulphur analysis
were prepared within the range of 6-240 mg/L by a procedure similar to that employed by
McGuire and Hamers [30]. The standard HPLC calibration curve for elemental sulphur analysis
at 40 °C is shown in Figure C-4, where the equation of the linear fit is y= 1.84 x – 6.002. In
order to calculate the sulphur concentration of the leached sample, the peak area (from HPLC
analysis) is inserted in the linear equation of the following calibration curve. The data obtained
from the HPLC analysis of the samples leached at 40 °C, 0.2 M ferric sulphate, and 0.2M H2SO4
is provided in Table C2.3.
Figure C-4. Standard HPLC Calibration curve for sulphur analysis at 40 °C.

70
Table C2.3 HPLC data for the analysis of elemental sulphur kinetics at 40 °C, 0.2 M ferric sulphate,
and 0.2M H2SO4.
Peak area
HPLC
Dilution
factor
Peak Area Peak area
x dilution
factor
Peak are
with filter
paper
subtracted
Sulphur
(mg/L)
Volume
(mL)
Elemental
sulphur
(mg)
Filter
paper 1
4.54 4.54 0 0
20
0
4 h 50 16.42 821.22 816.68 1501.17 20 30.02
24 h 50 46.24 2311.93 2307.39 4252.28 25 106.31
48 h 50 25.73 1286.58 1282.02 2360.01 50 118.01
72 h 50 28.60 1430.07 1425.53 2624.80 50 131.24
97 h 50 33.83 1691.43 1686.89 3107.14 50 155.35
Table C2.4 Elemental sulphur conversion data at 40°C, 0.2 M ferric sulphate, and 0.2M H2SO4.
Time (h) Measured S0 (mg)
S conversion (%) S0 (M) MW:32
4 30.02 20.16 1.87×10⁻³
24 106.31 50.85 6.64×10⁻³
48 118.01 57.73 7.38×10⁻³
72 131.24 62.95 5.20×10⁻³
97 155.35 74.33 9.71×10⁻³
Ferrous ion concentration, pH, and ORP values of the leach solutions, corresponding to Figure
4-9 in chapter 4, were measured during the ferric leaching of the pyrrhotite tailings. Figure C-5
shows the ferrous ion concentration curve and the raw data is shown in Table C2.5
Table C2.5 Ferrous ion concentrations and pH values at 40 °C, 0.2 M ferric sulphate, and 0.2M H2SO4
.Time (h) Fe2+ (M) ORP
SCE (mV)
pH ORP
SHE (V)
4 0.0054 527 0.72 768
24 0.0156 498 0.72 739
48 0.0204 492 0.76 733
72 0.0216 488 0.73 729
97 0.024 480 0.73 721

71
Figure C-5. Ferrous ion concentration at 40 °C, 0.2 M ferric sulphate and 0.2 M H2SO4 media.
Figure 4-8 in chapter 4 shows the molar ratios of Fe2+/S0 and Ni2+/S0 with time from data in
Figure 4-7. The calculation of these molar ratios is provided in Table C2.6, where the molarities
of, Ni2+, S0, and Fe2+ are from Tables C2.2, C2.4, and C2.5, respectively.
Table C2.6 Analysis of molar ratios of Fe2+/S0 and Ni2+/S0 at 40 °C.
Time (h) Ni2+/S0 Fe2+/S0
4 0.032 2.88
24 0.019 2.35
48 0.021 2.77
72 0.021 2.63
97 0.019 2.47

72
Appendix D. SEM images and EDX Spectra
D.1 Additional SEM image, elemental maps, and EDX spectra of the leached pyrrhotite particle after
80% nickel extraction.
SEM image Fe
S Ni
1 +
2
+

73
Element Weight %
S 27.20
Fe 46.75
Ni 0.7
C and O 25.35
Total 100
Element Weight %
S 29.15
Fe 2.16
Ni 0.09
C and O 68.60
Total 100
1
.
2
.
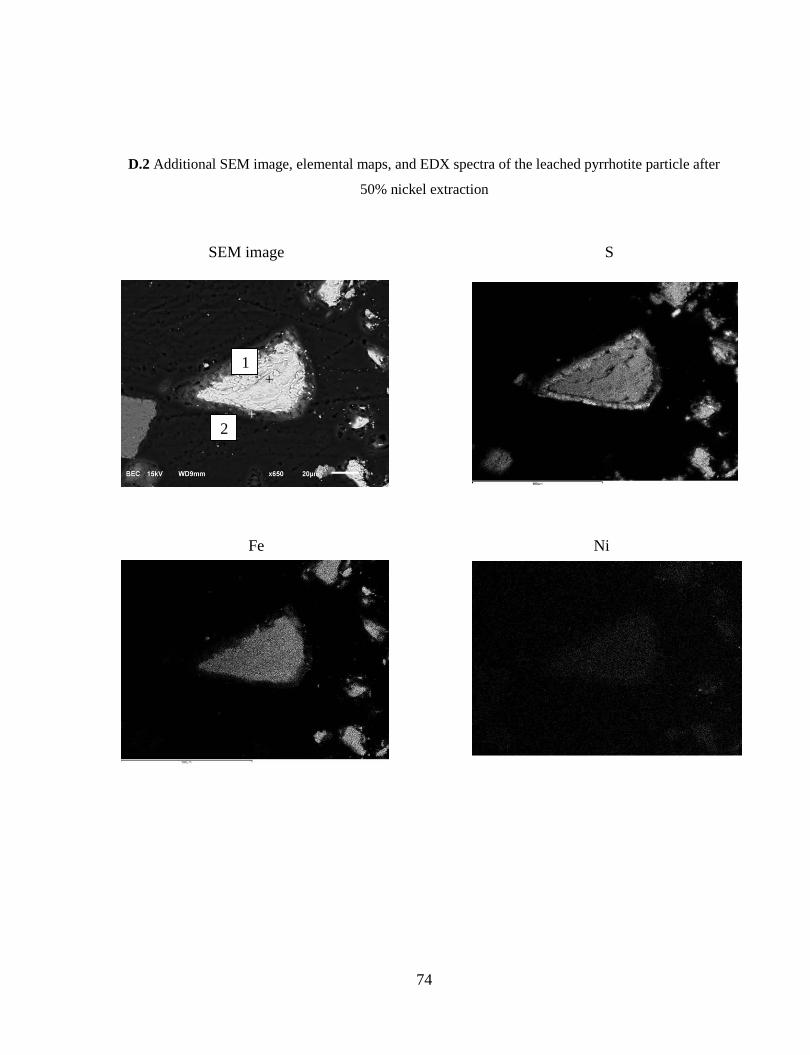
74
D.2 Additional SEM image, elemental maps, and EDX spectra of the leached pyrrhotite particle after
50% nickel extraction
SEM image S
Fe Ni
1 +
2 +

75
D3. Additional SEM-BSE images
Element Weight %
S 49.15
Fe 6.39
Ni 0.22
C and O 44.24
Total 100
Element Weight %
S 23.67
Fe 38.54
Ni 0.9
C and O 36.89
Total 100
1 2
.
80% reacted
50% reacted
80% reacted
90% reacted