fermentative metabolism of chlamydomonas reinhardtii' · hemocytometer. light intensities were...
TRANSCRIPT

Plant Physiol. (1984) 75, 212-2180032-0889/84/75/02 12/07/$0 1.00/0
Fermentative Metabolism of Chlamydomonas reinhardtii'I. ANALYSIS OF FERMENTATIVE PRODUCTS FROM STARCH IN DARK AND LIGHT
Received for publication September 21, 1983 and in revised form December 29, 1983
RENfE P. GFELLER2 AND MARTIN GIBBS*Institutefor Photobiology ofCells and Organelles, Brandeis University, Waltham, Massachusetts 02254
ABSTRACT
The anaerobic starch breakdown into end-products in the green algChiamydomonas reinhardtii F-60 has been investigted in the dark andin the light. The effects of 343,4-dichlorophenyl)-1,1-dimethylurea(DCMU) and carbonyl cyanide-p-trifluoromethoxyphenyl hydrazone(FCCP) on the fermentation in the light have also been investigted.
Anaerobic starch breakdown rnte (13.1 ± 3.5 micromoles C permilligram chlorophyll per hour) is increased 2-fold by FCCP in the dark.Light (100 watts per square meter) decreases up to 4-fold the dark rate,an inhibition reversed by FCCP. Stimulation of starch breakdown by theproton ionophore FCCP points to a pH-controlled rate-limiting step inthe dark, while inhibition by light, and its reversal by FCCP, indicates acontrol by energy charge in the light.
In the dark, formate, acetate, and ethanol are formed in the ratios of2.07:1.07:0.91, and account for roughly 100% of the C from the starch.H2 production is OA3 mole per mole glucose in the starch. Glycerol >-lactate, and CO2 have been detected in minor amounts.
In the light, with DCMU and FCCP present, acetate is produced in a1:1 ratio to formate, and H2 evolution is 2.13 moles per mole glucose.When FCCP only is present, acetate production is lower, and CO2 andH2 evolution is 1.60 and 4.73 moles per mole glucose, respectively.When DCMU alone is present, CO2 and H2 photoevolution is higher
than in the dark. Without DCMU, CO2 and H2 evolution is about 100%higher than in its presence. In both conditions, acetate is not formed. Inall conditions in the light, ethanol is a minor product. Formate productionis least affected by light.The stoichiometry in the dark indicates that starch is degraded via the
glycolytic pathway, and pyruvate is broken down into acetyl-CoA andformate. Acetyl-CoA is further dissimilated into acetate and ethanol. Inthe light, acetate is produced only in the presence of FCCP and, whenphotophosphorylation is possible, it is used in unidentified reactions.Ethanol formation is inhibited by the light in all conditions.
Most ofthe recent work connected with anaerobic metabolismin algae has focused on the assimilation and formation of H2 (4,18). As pointed out by Klein et al. (20), since H2 is only one ofseveral end-products of fermentation in green algae, it is neces-sary to place the H2 production in the broader context of thefermentative metabolism in order to gain a deeper understandingof the mechanisms that account for its evolution. In addition toH2, one or more of the following end-products of algal carbohy-drate (endogenous starch or exogenous glucose) fermentation
' Supported by Department of Energy DE-AC02-76-ER03231 andNational Science Foundation PCM 79-22612.
2Supported partially with grants from Fonds National Suisse de laRecherche Scientifique and Holderbank Stiftung.
have been detected: C02, formate, acetate, ethanol, lactate, glyc-erol, and butanediol (3, 19, 20, 28).
Classical glycolysis followed by subsequent metabolism of thepyruvate to the various end-products has been proposed toaccount for the anaerobic catabolism of starch or glucose in thegreen algae (17, 19, 27). Except for H2 evolution, the effect oflight on fermentative carbon flow has received little attention.This is principally due to the problems involved with photosyn-thetic fixation of the CO2 that might be evolved fermentatively.The first to attempt to resolve this question were Klein and Betz(20) who reported that light had no effect on the rate of starchbreakdown or the pattern of fermentation in Chlamydomonasmoewusii. But they used extremely low levels of light (160 lux)in order not to eliminate the H2 metabolism and to prevent arefixation ofthe CO2 evolved. On the other hand, Hirt et al. (15)demonstrated that light can inhibit severely the rate of anaerobicglycolysis in Scenedesmus obliquus as monitored by D-lactic acidformation. Bamberger et al. (2) made use of C. reinhardtii F-60,a mutant characterized by an incomplete photosynthetic carbonreduction pathway but an intact photosynthetic electron trans-port chain, to monitor 'true' CO2 and H2 evolution. To accountfor their results, they proposed an involvement between anaero-bic carbohydrate metabolism and the photosynthetic electrontransport chain, implying that carbohydrate degradation is en-tirely or partially localized in the chloroplast. The purpose ofourstudy was to establish for the first time a complete fermentativebalance in C. reinhardtii F-60 between starch and the end-products in the dark, and subsequently to determine whetherlight would modify this pattern. Since it had been shown that H2evolution was stimulated by light, it was of interest to checkwhether this increased H2 production would occur at the expenseof a reduced end-product of fermentation. This point has somesignificance in relation to the controversial question ofthe sourceofthe H2 evolved in light. Experimental conditions also includedthe presence of FCCP3, a weak acid proton ionophore thatuncouples photophosphorylation but has no effect on substratelevel phosphorylation, and the presence of DCMU, an inhibitorof electron transport from PSII to plastoquinone. These inhibi-tors were used in an attempt to minimize the complexity arisingfrom the interactions between starch dissimilation and the light-induced electron transport and a possible reutilization of thefermentative end-product. Preliminary reports of this work haveappeared elsewhere (8, 9).
MATERIALS AND METHODSAlgae and Growth Conditions. Chlamydomonas reinhardtii
(Dangeard), mutant strain F-60, obtained from R. K. Togasaki,Indiana University, was grown on an acetate-supplemented me-
' Abbreviations: FCCP, carbonyl cyanide-p-trifluoromethoxyphenylhydrazone; O/R, oxidation/reduction; PCV, packed cell volume; RQ,respiratory quotient.
212 www.plantphysiol.orgon June 13, 2019 - Published by Downloaded from
Copyright © 1984 American Society of Plant Biologists. All rights reserved.
FERMENTATIVE METABOLISM OF CHLAMYDOMONAS
dium (24, modified from I 1) at 25°C on a rotary shaker in 2-Lflasks under a low light intensity (0.6 w/m2). Stock cultures weremaintained on agar plates of the same medium. Cells from oneplate were used to innoculate one flask. Algal cells were grownfor 5 d until they reached the end ofthe exponential phase. Someof the cells were single and motile, while most were in variousdivision stages, with two or four, sometimes more, daughter cellsenclosed in the mother cell wall. Cell density was 1 x 10⁷ to 1.5x I07 cells/ml, Chl content was 13.9 ± 4 jg/107 cells, PCV was7.2 ± 1.5 ,ul/107 cells, dry weight is 0.5 ± 0.2 mg/107 cells, andstarch content was 184 ± 28 Mmol C/mg Chl. No bacterialcontamination was observed upon microscopic examination.
Experimental Procedures. Algal cells (1 L) were harvested bycentrifugation (1SOOg, 8 min), washed with 50 to 100 ml of 28mM Hepes (free acid) adjusted to pH 7.5 with Tris (free base),and resuspended in the same buffer at a final density of 70 to140 ,g Chl/ml. Cells were kept on ice until onset of the experi-ment. A cell suspension of 3 ml was placed in 20 ml Warburgflasks attached to a constant pressure respirometer (Gilson Med-ical Electronics, Inc.). Inhibitors were added in the side arm ofthe Warburg flask as a 5 or 10 mm solution in 100% methanolin order to insure that the final concentration of methanol wouldnot be over 0.2% v/v. Methanol was added at the same finalconcentration in control flasks. KOH at 20%, when present, wasplaced in the center well of the flask as a CO2 trapping agent.The algal suspension was incubated in a water bath maintainedat 28C, with shaking speed at 80 cycles/min. Light was providedby 75-w reflector flood bulbs placed underneath the water bath.The algae were made anaerobic by 4 cycles of vacuum (wateraspirator) and flushing with 02-free N2 (Matheson; certified lessthan 5 A 02/L), and then flushing with the same N2 continuouslyfor 10 min. Thirty min after the beginning of incubation, inhib-itors were added, a sample was taken from two control flasks,light was turned on, and the first reading was made. Three andone-half h later, the incubation was terminated by placing theflasks on ice. H2 evolution was measured manometrically inflasks where KOH was present in the center well. HCO3 initiallybound (to the cells or to the buffer) or produced during theadaptation period was measured as the gas evolved by tipping0.6 ml 2 M H2SO4 from a side arm into the cell suspension justafter the adaptation period in two control flasks containing noKOH. Acid was also tipped into flasks containing no KOH atthe end of incubation. The total gas evolved in those flasks wasassumed to be the sum of H2 and CO2 evolved during incubationand CO2 evolved from HCO3 initially present, and CO2 evolu-tion was calculated accordingly.For time course experiments, 38-ml bottles sealed with a serum
cap were used, and samples were taken anaerobically with asyringe. In experiments where substrates were fed to the cells,they were added before the incubation at a final concentrationof 1 mm.
Analysis of Nongaseous Metabolites. Starch was determinedby a method modified from Klein and Betz (19): 1 ml cellsuspension was spun down (6000g, 5 min), and the supernatantfraction was set aside for analysis of soluble products. The pelletwas resuspended in 0.1 ml methanol, washed with 2 ml metha-nol, and then with 2 ml 100 mM Na-acetate (pH 4.5), andresuspended in 1.7 ml of the acetate buffer. The samples werethen sonicated for 10 s (Branson Sonifier, microprobe, energylevel 6). After autoclaving the samples for 10 min to solubilizethe starch, 2.2 units of amyloglucosidase were added, and thesamples were incubated 14 h in a water bath at 55C. After thesamples were adjusted to 2.0 ml with H20 and centrifuged to geta clear supernatant fraction, glucose was assayed with the glucoseoxidase-peroxidase method (Sigma 510).
Soluble metabolites were measured in the incubation mediumafter spinning the cells down for starch analysis. After ethanol
and lactate had been measured, samples were kept frozen forsubsequent analyses. When metabolites inside the cells weremeasured, 1 ml of cell suspension was pelleted, washed withincubation buffer, and 0.5 ml of 0.3 M HC104 was added.Samples were sonicated 10 s in the cold, centrifuged (6000g, 5min), and the supernatant fractions saved. The pellets were rinsedwith the same amount of HC 104, and the two supernatantfractions were pooled. To neutralize the acid and remove theperchlorate, 0.4 ml of 0.75 M KHCO3 was added, the sampleswere centrifuged (6000g, 5 min), and the supernatant fractionswere adjusted to 2 ml with incubation buffer.
Ethanol was assayed with alcohol dehydrogenase (6), formatewith formate dehydrogenase (16), D-lactate with D-lactate dehy-drogenase, using the same method as with L-lactate dehydroge-nase (17), glycerol with glycerokinase and glycerol-P dehydroge-nase (30), and acetate with acetyl-CoA synthetase, citrate syn-thase, and malate dehydrogenase (test-combination for aceticacid, Boehringer-Mannheim, 148261).Other Analyses. Chl was assayed by the method of Arnon (1).
For dry weight measurements, 5-ml cell suspensions were washedwith distilled H20, resuspended in 1 to 2 ml distilled H20, anddried on preweighed filter papers in an oven at 95C for 24 h.PCV was measured after centrifuging 1 ml cell suspension for 10min at full speed in a clinical table-top centrifuge in a micro-tipgraduated centrifuge tube. Cell counts were performed with ahemocytometer. Light intensities were measured with an Inter-national Light radiometer, model 700A.
Chemicals. Biochemicals and buffers were from Sigma, exceptthe acetic acid determination kit. Other chemicals were fromFisher Scientific Co. DCMU and FCCP were a gift from E. I.DuPont de Nemours and Co. Hepes (free acid) was recrystallizedin methanol and dried over vacuum before use, since it wasfound that it contained approximately 1 mol % ethanol.
Calculations. Carbon recovery is defined as the ratio of mol ofC in the fermentative end-products to the mol ofC in the starchmetabolized. Hydrogen recovery is defined as the ratio of mol ofavailable H in the fermentative end-products to the mol ofavailable H in the starch metabolized, where the mol of availableH in a compound of general formula CaHnOz is calculated as 4a+ n - 2z. O/R index is defined as the ratio of the weighed sumof the O/R values of the oxidized end-products to the weighedsum of the O/R values of the reduced end-products, where theO/R value of a compound of general formula CaHNOz is calcu-lated as z - n/2. Average balances are calculated by averagingindividual balances of single experiments.
RESULTS
Starch Breakdown and Light. Our study on the effects ofanaerobicity in C. reinhardtii F-60 focuses on the metabolism ofstarch, the principal endogenous reserve carbohydrate of thisalga, and which is totally confined to the chloroplast. Comparedto aerobic starch breakdown, the anaerobic rate in the first h isessentially similar but increased thereafter over the aerobic valueby approximately 50% (Fig. 1). Also depicted in this figure is theobservation that 10 Mm FCCP stimulates starch degradationunder both atmospheres, and eliminates the Pasteur effect (asdefined by a ratio of starch consumed in N2/starch consumed inair higher than 1).
Light decreases anaerobic starch breakdown by a factor ofapproximately 2 and 4 at 40 w/m2 and 100 w/m2, respectively(Fig. 2). This decrease cannot be attributed to photosyntheticallyproduced O2 since a similar inhibition is observed in the presenceof 10 MM DCMU. In sharp contrast to the inhibition by light ofstarch breakdown, H2 evolution is increased in light and nearlysaturated at 40 w/m2. While 10 gM DCMU is ineffective withrespect to starch breakdown, this concentration of DCMU de-creases H2 production at 100 w/m2 to 55% of the control level.
213
www.plantphysiol.orgon June 13, 2019 - Published by Downloaded from Copyright © 1984 American Society of Plant Biologists. All rights reserved.

GFELLER AND GIBBS
~~N2
8
~60- Air
E 0
40~
20-
00.5 1 2 3 4 5
Time (h)FIG. 1. Time course ofstarch breakdown under aerobic and anaerobic
conditions in dark. Cells which were under anaerobic conditions wereflushed with N2 for 10 min, and the first sample was taken 20 minthereafter. FCCP (10 Mm) was added after adaptation.
40A20
320/i
520
100
0 10
0 20 40 60 80 100-2
W-mFIG. 2. Anaerobic starch breakdown and H2 evolution at various light
intensities. Cells were adapted in dark under N2 for 30 min prior toincubation (for 3.5 h) either in dark or in light. DCMU (10 Mm) was
added after adaptation. (0), umol C in the starch consumed; (0), zmolC in the starch consumed in presence ofDCMU; (A), Mmol H2 evolved;(A), gmol H2 evolved in presence of DCMU.
FIG. 3. Effect of light and FCCP on anaerobic starch breakdown.Cells were adapted for 30 min under N2 prior to 3.5 h incubation in darkor light. FCCP (5 gM) was added after adaptation.
Table I. Fermentative Productsfrom Starch by C. reinhardiii F-60:Carbon Recovery, Recovery ofAvailable Hydrogen, and OIR BalanceCells were adapted for 30 min under N2 in the dark, and incubated in
the dark or in the light (100 w/m2) for 3.5 h. Data are taken fromduplicates in eight or more experiments (dark), or in three or moreexperiments (light). Starch breakdown rates (Mmol C/mg Chl - h) in thesame experiments as in Table II are the following: dark, 13.1 ± 3.5; light,4.95 ± 1.35.
Fermentative Product Dark Lightmol product/mol Glca
Formate 2.07 ± 0.27 0.90 ± 0.23Acetate 1.07 ±0.18 noneEthanol 0.91 ± 0.11 0.12 ± 0.07Glycerol 0.04 ± 0.01 0.02 ± 0.01CO2 0.02 ± 0.05 2.48 ± 0.94H2 0.43 ±0.07 6.92 ± 1.10
BalancesC recovery(%) 103 ± 10 59 ± 9H recovery(%) 102 ± 7 76 ± 9O/R index 0.94 ± 0.06 0.79 ± 0.23
a mol product/mol Glc refers to the glucose units in the starch con-sumed.
In the presence of FCCP, the light-induced inhibition of starchbreakdown is offset, resulting in similar rates for both light anddark (Fig. 3).
Fermentative Balnce in Dark and Light. Fermentative prod-ucts yielded from the anaerobic breakdown of starch are listedin Table I. In dark, formate, acetate, and ethanol are producedin approximate ratios of 2:1:1, and account for more than 90%ofthe C in the starch consumed. Glycerol is synthesized in minoramounts. Traces ofD-lactate, but no L-lactate, have been detectedin some experiments (data not shown). Glycerol and lactate havebeen monitored both in the medium and inside the cells. C02,when evolved, is produced in minor amounts. H2 evolution indark serves as a minor sink for the reducing power generatedduring starch metabolism, accounting for no more than 20% of
214 Plant Physiol. Vol. 75, 1984
www.plantphysiol.orgon June 13, 2019 - Published by Downloaded from Copyright © 1984 American Society of Plant Biologists. All rights reserved.
FERMENTATIVE METABOLISM OF CHLAMYDOMONAS
the reduced equivalents, while ethanol formation serves as themajor sink. C and H recoveries are close to 100%, which is takenas evidence that no major fermentative product in the dark hasbeen overlooked, and no source ofC other than starch is used toany significant extent. The fact that free NH3 is not found inamounts greater than 1 to 3% (mol/mol C in starch consumed,data not shown) is an indication that protein and amino acidmetabolism is minimal under these conditions. In the dark,FCCP has no effect on the stoichiometry of the fermentation,except for decreasing H2 production to 33% ± 12% (relative tostarch consumed) of the control. The accuracy of the methodused does not allow us to document whether this decreased H2production is accompanied by an increased ethanol formation.The inhibition ofdark H2 evolution by uncouplers has been firstdocumented by Gaffron and Rubin (7).
Light (100 w/m2) affects the stoichiometry (Table I) in additionto inhibiting the rate of starch breakdown. While the largeincrease in CO2 evolution can be partially attributed to cellularrespiration sustained by the photosynthetically generated 02
which is coupled to H2 photoevolution, some other mechanismmust be invoked to account for CO2 evolution in the presenceof DCMU (Table II) which is significantly greater than in thedark (Table I). When compared to the dark, H2 evolution, in theabsence or presence ofDCMU, is dramatically stimulated in thelight, both in relative terms (Table I) and in absolute terms (Fig.2). If the H2 evolved in the presence ofDCMU reflects the sameamount ofH2 coming from the oxidation ofstarch in the absenceofDCMU, a calculation can be made to estimate the fraction ofCO2 derived from cellular respiration in the absence of DCMU:(H2 in light [7 mol] - H2 in light and DCMU [3 mol]) - 0.5 = 2mol 02 evolved photosynthetically, and an equivalent amountof respiratory CO2 if the RQ is 1. This leaves 2.5 - 2 = 0.5 molCO2 produced in the light independently of respiration. Theamount of CO2 (1 mol) produced in the presence of DCMU istwice higher and is unaccounted for.
Ethanol production in light is inhibited, whether in control(light alone) samples (Table I) or in the presence ofeitherDCMUor FCCP (Table II). This inhibition cannot be ascribed to aconsumption of the ethanol produced, since ethanol is not usedaerobically or anaerobically, in dark or in light, by C. reinhardtiiF-60 (data not shown). Similarly, acetate production is totallyprevented in light (Table I) or in light with DCMU (Table II). Inthe presence of FCCP (Table II), however, the ratio of acetate to
formate exceeds the ratio of 1:2 found in the dark. Inhibition ofboth acetate and ethanol production is effected already at a lightintensity of 40 w/m2 (data not shown). In light, without FCCP,incomplete recoveries of C and H indicate that some of themetabolites derived from starch are diverted either to an unde-termined fermentative product, or to a build-up of reserve ma-terial other than starch. No pyruvate or D-lactate is found eitherin the medium or inside the cells. In the presence of FCCP, bothC and H recoveries are much higher, and in some experimentshigher than 100%, suggesting that possibly some other source inaddition to starch is utilized. Less than 1 mol % (relative to C instarch consumed) NH3 is formed in these experiments, which isan indication that it is not likely that amino acids are used asanother C source. In the light, with or without DCMU, exoge-nous acetate is taken up anaerobically, but this does not occurin the presence of FCCP (data not shown).
DISCUSSION
The presence of a Pasteur effect in algae has been postulatedto originate from the energy required for the cell to survive underanaerobic stress until normal aerobic conditions are restored(26). The larger effect of FCCP in the dark on aerobic relative toanaerobic starch breakdown is indicative that the rate limitingstep differs under the two conditions. Aerobically, coupling ofoxidative phosphorylation is presumably pace setting, while un-der anaerobiosis, a pH-dependent enzymic step regulates therate. This is postulated because in the dark and in N2, FCCP, aweak acid proton translocator, can mediate its effects on theglycolytic flux only through pH-sensitive enzymic reactions,since under these conditions phosphorylation is not coupled toelectron flow. It is assumed that FCCP will equalize the pH ofthe various cellular compartments with the pH of the buffer inthe incubation medium. It is known that proton ionophores donot affect substrate level phosphorylation (25). The fact thatthere is no inhibition ofstarch breakdown by light in the presenceof FCCP (Fig. 3) is taken as evidence that this inhibition ismediated through the energy charge. When photophosphoryla-tion is uncoupled from electron transport, a 'dark' situation isreestablished, at least as far as the factors affecting the rate ofstarch catabolism are concerned. Fructose-6-P kinase, a keycontrol enzyme of the glycolytic pathway, has been documentedto be affected both by the energy charge and pH in a variety oforganisms (26, 29). It is possible that the site of control of
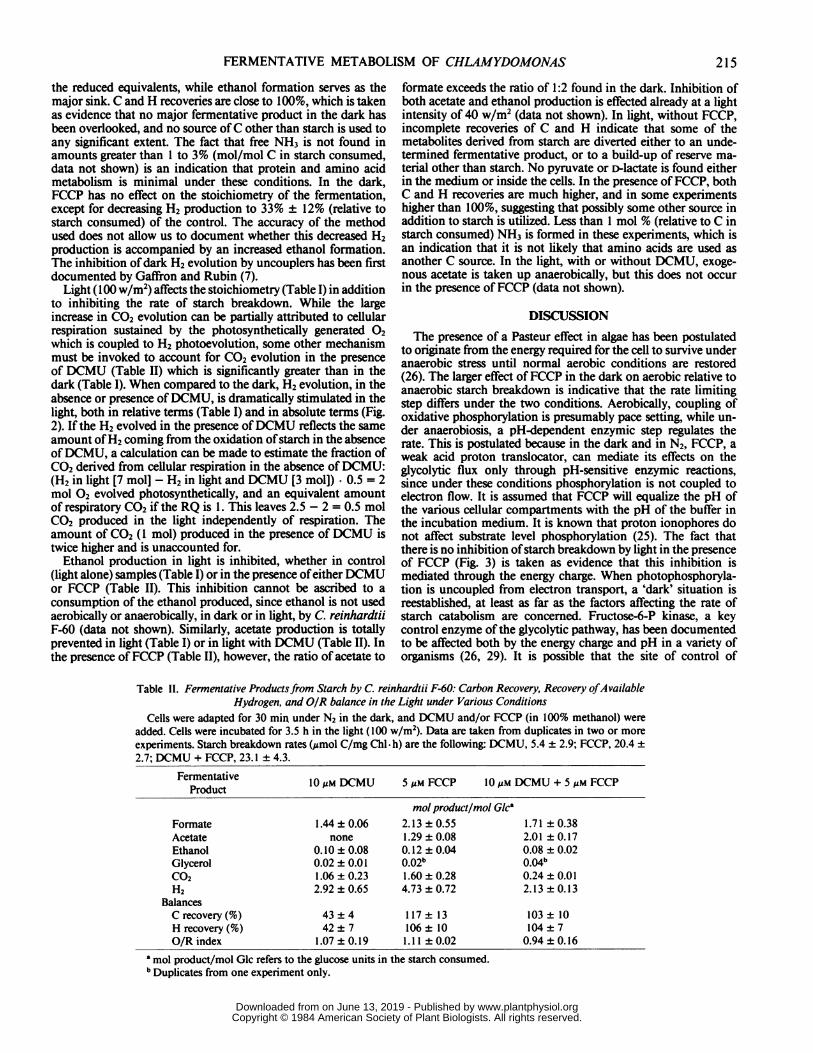
Table II. Fermentative Productsfrom Starch by C. reinhardtii F-60: Carbon Recovery, Recovery ofAvailableHydrogen, and O/R balance in the Light under Various Conditions
Cells were adapted for 30 min under N2 in the dark, and DCMU and/or FCCP (in 100% methanol) wereadded. Cells were incubated for 3.5 h in the light (100 w/m2). Data are taken from duplicates in two or moreexperiments. Starch breakdown rates (Mmol C/mg Chl * h) are the following: DCMU, 5.4 ± 2.9; FCCP, 20.4 +2.7; DCMU + FCCP, 23.1 ± 4.3.
Fermentative 10 Mm DCMU 5 Am FCCP 10 Mm DCMU + 5 Am FCCPProduct
moi product/mol GlcaFormate 1.44 ± 0.06 2.13 ± 0.55 1.71 ± 0.38Acetate none 1.29 ± 0.08 2.01 ± 0.17Ethanol 0.10 ± 0.08 0.12 ± 0.04 0.08 ± 0.02Glycerol 0.02 + 0.01 0.02b 0.04bCO2 1.06 + 0.23 1.60 ± 0.28 0.24 + 0.01H2 2.92 ± 0.65 4.73 ± 0.72 2.13 + 0.13
BalancesCrecovery(%) 43±4 117± 13 103 10H recovery (%) 42 7 106 ± 10 104 7O/R index 1.07 ± 0.19 1.11 ± 0.02 0.94 ± 0.16
a mol product/mol Glc refers to the glucose units in the starch consumed.b Duplicates from one experiment only.
215
www.plantphysiol.orgon June 13, 2019 - Published by Downloaded from Copyright © 1984 American Society of Plant Biologists. All rights reserved.
GFELLER AND GIBBS
anaerobic glycolysis in green algae is also located at this step.Consistent with our postulate are the results of a study of theeffects of light on algal fermentative rates by Hirt et al. (15), whoreported that light inhibited anaerobic glycolysis (monitored byD-lactate formation) in wild-type Scenedesmus, but increased itin a mutant unable to carry out photophosphorylation. Theseresults were taken as an indication that the light-induced inhi-bition of glycolysis is due to the state of the energy charge, withthe implication ofa similar mechanism to the one mediating thePasteur effect. On the other hand, a control of the amylolyticstep by pH alone may play a role, inasmuch as it was shown thatthe pH optimum of C. reinhardthi amylase is close to 7.5 (LeviC, M Gibbs 1984 Plant Physiol 74: 459-463).
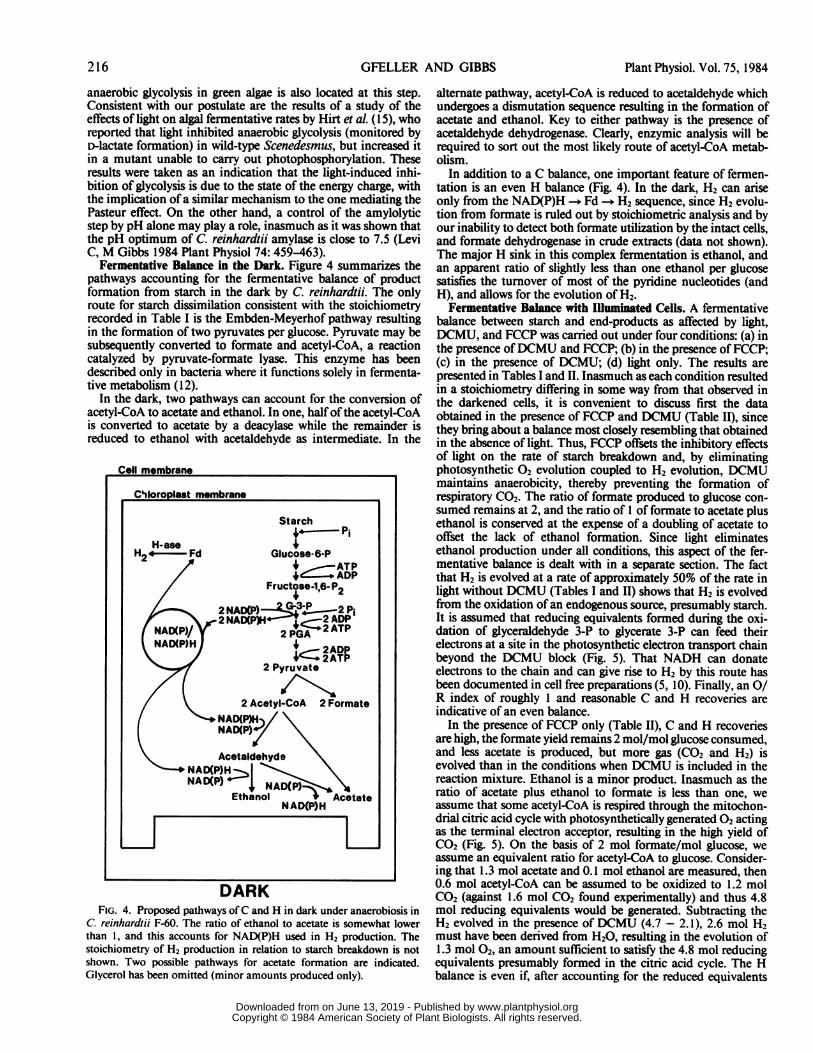
Fermentative Balance in the Dark. Figure 4 summaizes thepathways accounting for the fermentative balance of productformation from starch in the dark by C. reinhardtii. The onlyroute for starch dissimilation consistent with the stoichiometryrecorded in Table I is the Embden-Meyerhof pathway resultingin the formation of two pyruvates per glucose. Pyruvate may besubsequently converted to formate and acetyl-CoA, a reactioncatalyzed by pyruvate-formate lyase. This enzyme has beendescribed only in bacteria where it functions solely in fermenta-tive metabolism (12).
In the dark, two pathways can account for the conversion ofacetyl-CoA to acetate and ethanol. In one, half of the acetyl-CoAis converted to acetate by a deacylase while the remainder isreduced to ethanol with acetaldehyde as intermediate. In the
Cell membrane
C'iloroplast membrane
DARKFIG. 4. Proposed pathways of C and H in dark under anaerobiosis in
C. reinhardiii F-60. The ratio of ethanol to acetate is somewhat lowerthan 1, and this accounts for NAD(P)H used in H2 production. The
stoichiometry of H2 production in relation to starch breakdown is notshown. Two possible pathways for acetate formation are indicated.Glycerol has been omitted (minor amounts produced only).
alternate pathway, acetyl-CoA is reduced to acetaldehyde whichundergoes a dismutation sequence resulting in the formation ofacetate and ethanol. Key to either pathway is the presence ofacetaldehyde dehydrogenase. Clearly, enzymic analysis will berequired to sort out the most likely route of acetyl-CoA metab-olism.
In addition to a C balance, one important feature of fermen-tation is an even H balance (Fig. 4). In the dark, H2 can ariseonly from the NAD(P)H -- Fd --*H2 sequence, since H2 evolu-tion from formate is ruled out by stoichiometric analysis and byour inability to detect both formate utilization by the intact cells,and formate dehydrogenase in crude extracts (data not shown).The major H sink in this complex fermentation is ethanol, andan apparent ratio of slightly less than one ethanol per glucosesatisfies the turnover of most of the pyridine nucleotides (andH), and allows for the evolution of H2.
Fermentative Balance with Illnminated Cells. A fermentativebalance between starch and end-products as affected by light,DCMU, and FCCP was carried out under four conditions: (a) inthe presence ofDCMU and FCCP; (b) in the presence of FCCP;(c) in the presence of DCMU; (d) light only. The results arepresented in Tables I and II. Inasmuch as each condition resultedin a stoichiometry differing in some way from that observed inthe darkened cells, it is convenient to discuss first the dataobtained in the presence of FCCP and DCMU (Table II), sincethey bring about a balance most closely resembling that obtainedin the absence of light. Thus, FCCP offsets the inhibitory effectsof light on the rate of starch breakdown and, by eliminatingphotosynthetic 02 evolution coupled to H2 evolution, DCMUmaintains anaerobicity, thereby preventing the formation ofrespiratory CO2. The ratio of formate produced to glucose con-sumed remains at 2, and the ratio of 1 of formate to acetate plusethanol is conserved at the expense of a doubling of acetate tooffset the lack of ethanol formation. Since light eliminatesethanol production under all conditions, this aspect of the fer-mentative balance is dealt with in a separate section. The factthat H2 is evolved at a rate of approximately 50% of the rate inlight without DCMU (Tables I and II) shows that H2 is evolvedfrom the oxidation ofan endogenous source, presumably starch.It is assumed that reducing equivalents formed during the oxi-dation of glyceraldehyde 3-P to glycerate 3-P can feed theirelectrons at a site in the photosynthetic electron transport chainbeyond the DCMU block (Fig. 5). That NADH can donateelectrons to the chain and can give rise to H2 by this route hasbeen documented in cell free preparations (5, 10). Finally, an 0/R index of roughly 1 and reasonable C and H recoveries areindicative of an even balance.
In the presence of FCCP only (Table II), C and H recoveriesare high, the formate yield remains 2 mol/mol glucose consumed,and less acetate is produced, but more gas (CO2 and H2) isevolved than in the conditions when DCMU is included in thereaction mixture. Ethanol is a minor product. Inasmuch as theratio of acetate plus ethanol to formate is less than one, weassume that some acetyl-CoA is respired through the mitochon-drial citric acid cycle with photosynthetically generated 02 actingas the terminal electron acceptor, resulting in the high yield ofCO2 (Fig. 5). On the basis of 2 mol formate/mol glucose, weassume an equivalent ratio for acetyl-CoA to glucose. Consider-ing that 1.3 mol acetate and 0.1 mol ethanol are measured, then0.6 mol acetyl-CoA can be assumed to be oxidized to 1.2 molCO2 (against 1.6 mol CO2 found experimentally) and thus 4.8mol reducing equivalents would be generated. Subtracting theH2 evolved in the presence of DCMU (4.7 - 2.1), 2.6 mol H2must have been derived from H20, resulting in the evolution of1.3 mol 02, an amount sufficient to satisfy the 4.8 mol reducingequivalents presumably formed in the citric acid cycle. The Hbalance is even if, after accounting for the reduced equivalents
216 Plant Physiol. Vol. 75, 1984
www.plantphysiol.orgon June 13, 2019 - Published by Downloaded from Copyright © 1984 American Society of Plant Biologists. All rights reserved.

FERMENTATIVE METABOLISM OF CHLAMYDOMONAS
Cell membrane
LIGHT
FIG. 5. Proposed pathways ofC and H in light under a N2 atmospherein C. reinhardtii F-60. Stoichiometry of photosynthetic water splitting,H2 production, and CO2 production is not shown. DCMU block andinhibition of coupled phosphorylations by FCCP are shown. In absenceof DCMU, photosynthetically produced 02 is thought to allow mito-chondrial respiration. In presence of DCMU (true anaerobiosis), thesource ofCO2 produced is not shown. Acetate production in light occurs
in presence of FCCP only. Two possible pathways for acetate formationare indicated; for simplification, the NAD(P)H turnover involved in one
of those pathways is not shown. Glycerol and ethanol have been omitted(minor amounts produced only).
in the 0.1 mol ethanol, 1.8 x 2 mol reducing equivalents fromglycolysis remain to account for H2 not arising from H20 (Fig.5). The calculated total H2 evolution is 2.6 + 1.8 = 4.4 mol,which compares favorably with the 4.7 mol found experimen-tally.
In the presence of DCMU alone (Table II), the fermentativepattern is characterized by a poor C and H recovery, the absenceof both ethanol and acetate, and a formate production lowerthan 2 mol/mol glucose consumed, which is taken as an indica-tion that not all the C flow proceeds through pyruvate-formatelyase. This condition may reveal the decarboxylation ofpyruvateto CO2 and acetaldehyde catalyzed by pyruvate decarboxylase,as proposed for C. moewusii (19). The absence of acetate whenthe uncoupler is removed from the reaction medium indicatesthe requirement of ATP for the reutilization of the two carbonacid. It is this reutilization of the acetate into unidentified com-pounds which may account for the low (43%) recoveries of Cand H.When the algae are illuminated in the absence of FCCP and
DCMU (Table I), acetate is not found in the reaction medium,and the ratio of formate to glucose drops from 2 to 1, indicatingalternate metabolism of pyruvate, while both C02 and H2 evo-
lutions are strikingly increased. Once again, the high CO2 yieldis apparently the result of an activation of the citric acid cycle byphotosynthetically generated 02, and the H2 evolution apparentlyrepresents the combined yields from two sources, namely H20and starch. As in the case when DCMU was included, the C andH recoveries are low, indicating the formation of unaccountedfor compounds.
Inhibition of Ethanol Production in the Light. Illuminationprevents the formation of ethanol (except for minor amounts)under all conditions tested. Assuming acetaldehyde and alcoholdehydrogenases remain active, it seems that the inability of thecell to produce ethanol is due to the absence of available reducedpyridine nucleotides during illumination. It may well be that inthe light the electron transport chain is oxidized since the elec-trons can be bled off as H2. This oxidized state would favor thetransfer of reducing equivalents generated during the oxidationof glyceraldehyde 3-P to glycerate 3-P from the reduced pyridinenucleotides to the chain at the plastoquinone site, preventing thereduction of acetyl-CoA to acetaldehyde and ethanol. The flowof reducing equivalents preferentially into the photosyntheticelectron transport chain would account for the increased H2evolution (Tables I and II). This would occur at the expense ofethanol, the major metabolic sink for H in the dark.
Cellular Compartmentation. The question of the cellular com-partmentation of the enzymic reactions of the fermentativedegradation of starch into its end-products is worthy ofcommentand has been dealt with in Figures 4 and 5 by assigning thecomplete pathway (with the exception of the mitochondriallylocated citric acid cycle) to one compartment, the chloroplast.We have done this primarily because it is difficult to envisage aneven H balance both in the dark and in the light if the oxidative(glyceraldehyde 3-P dehydrogenase) and the reductive (acetalde-hyde and ethanol dehydrogenases) steps of the fermentativepathway are assigned to different cellular locations. We havecome to this conclusion on the basis of the well documentedreports that the inner membrane of the higher plant chloroplast(14) and of the algal chloroplast (22) is impermeable to thepyridine nucleotides. We recognize the fact that triose-P canefflux to the cytoplasm, but we have discounted this occurrencebecause the cytoplasmically generated ATP would not be avail-able to the chloroplastic fructose-6-phosphokinase (23). Thecellular site of the hydrogenase remains unknown but presum-ably is in the chloroplast to account for light-induced H2 metab-olism. Finally, this laboratory has recently reported the isolationof a photosynthetically competent chloroplast from Chlamydo-monas (21). The validity of cellular assignation of the fermenta-tive events, depicted in Figures 4 and 5, now can be tested.
LITERATURE CITED
1. ARNON DI 1969 Copper enzymes in isolated chloroplasts. Polyphenoloxidasein Beta vulgaris. Plant Physiol 24: 1-15
2. BAMBERGER ES, D KING, DL ERBES, M GIBBS 1982 H2 and CO2 evolution byanaerobically adapted Chiamydomonas reinhardtii F-60. Plant Physiol 69:1268-1273
3. BARKER HA 1935 The metabolism of the colorless alga Prototheca zopfii. JCell Comp Physiol 7: 73-93
4. BEN-AMoTz A 1972 Hydrogen metabolism. In M Gibbs, E Latzko, eds,Encyclopedia of Plant Physiology, Vol 6, Springer-Verlag, New York, pp497-506
5. BEN-AMoTz A, M GIBBS 1975 Hydrogen metabolism in photosynthetic orga-nisms. II. Light-dependent hydrogen evolution by preparations from Chia-mydomonas, Scenedesmus and spinach. Biochem Biophys Res Commun 64:355-359
6. BERNT E, I GUTMANN 1974 Ethanol. Determination with alcohol dehydroge-nase and NAD. In HU Bergmeyer, ed, Methods of Enzymatic Analysis, Vol3. Academic Press, New York, pp 1499-1502
7. GAFFRON H, J RUBIN 1942 Fermentative and photochemical production ofhydrogen in algae. J Gen Physiol 26: 219-240
8. GFELLER RP, M GIBBS 1982 Fermentation of starch by Chiamydomonasreinhardtii F-60 in the dark. Plant Physiol 69: S-148
9. GFELLER RP, M GIBBS 1983 Anaerobic metabolism of Chlamydomonas rein-
217
www.plantphysiol.orgon June 13, 2019 - Published by Downloaded from Copyright © 1984 American Society of Plant Biologists. All rights reserved.
218 GFELLER
hardtii in light and dark. Book of Abstracts. Sixth International Congress onPhotosynthesis. Brussels 102-16
10. GODDE D, A TREBST 1980 NADH as electron donor for the photosyntheticmembrane of Chlamydomonas reinhardtii. Arch Microbiol 127: 245-252
1 1. GORMAN DS, RP LEVINE 1965 Cytochrome fand plastoquinone; theirsequencein the photosynthetic electron transport chain of Chlamydomonas reinhard-tii. Proc Natl Acad Sci USA 54: 1665-1669
12. GOTTSCHALK G 1979 Bacterial Metabolism. Springer-Verlag, New York, p 19413. GUTMANN I, AW WAHLEFELD 1974 L(+)Lactate. Determination with lactate
dehydrogenase and NAD. In HU Bergmeyer, ed, Methods of EnzymaticAnalysis, Vol 3. Academic Press, New York, pp 1464-1468
14. HEBER U, HW HELDT 1981 The chloroplast envelope: structure, function androle in leaf metabolism. Annu Rev Plant Physiol 32: 139-168
15. HIRT G, W TANNER, 0 KANDLER 1971 Effect of light on the rate of glycolysisin Scenedesmus obliquus. Plant Physiol 47: 841-843
16. HOPNER T, J KNAPPE 1974 Formate. Determination with formate dehydrog-enase. In HU Bergmeyer, ed, Methods of Enzymatic Analysis, Vol 3.Academic Press, New York, pp 1551-1555
17. KALTWASSER H, TS STUART, H GAFFRON 1969 Light-dependent hydrogenevolution by Scenedesmus. Planta 89: 309-322
18. KESSLER E 1974 Hydrogenase, photoreduction and anaerobic growth. In WDPStewart ed, Algal Physiology and Biochemistry. University of CaliforniaPress, Berkeley, pp 465-473
19. KLEIN U, A BETz 1978 Fermentative metabolism of hydrogen-evolving Chla-mydomonas moewusii. Plant Physiol 61: 953-956
AND GIBBS Plant Physiol. Vol. 75, 1984
20. KLEIN U, K KREUZBERG, A BETZ 1981 Chemicals produced by unicellularalgae in anaerobiosis. In M Moo-Young, CW Robinson, eds, Advances inBiotechnology, Vol 2. Pergamon Press, New York, pp 97-102
21. KLEIN U, C CHEN, M GIBBS, KA PLATr-ALOIA 1983 Cellular fractionation ofChiamydomonas reinhardiii with emphasis on the isolation of the chloro-plast. Plant Physiol 72: 481-487
22. KLEIN U, C CHEN, M GIBBS 1983 Photosynthetic properties of chloroplastsfrom Chiamydomonas reinhardiii. Plant Physiol 72: 488-491
23. Kow YW, DL ERBES, M GIBBS 1982 Chloroplast respiration. Plant Physiol69: 442-447
24. PEAVEY DG, RP GFELLER, M GIBBS 1983 Presence ofa Pasteur effect in algae.Physiol Veg 21: 337-342
25. RIEMERSMA JC 1968 Effects of sodium azide and 2,4-dinitrophenol on phos-phorylation reactions and ions fluxes in Saccharomyces cerevisiae. BiochimBiophys Acta 153: 80-87
26. ROSE IA, ZB ROSE 1969 Glycolysis: regulation and mechanisms ofthe enzymes.Comp Biochem 17: 93-161
27. SYRETT PJ 1958 Fermentation of glucose by Chlorella vulgaris. Nature 182:1734-1735
28. SYRET PJ, HA WONG 1963 The fermentation ofglucose by Chlorella vulgaris.Biochem J 89: 308-315
29. UI M 1966 A role of phosphofructokinase in pH-dependent regulation ofglycolysis. Biochim Biophys Acta 124: 310-322
30. WIELAND 0 1974 Glycerol. UV method. In HU Bergmeyer, ed, Methods ofEnzymatic Analysis, Vol 3. Academic Press, New York, pp 1404-1409
www.plantphysiol.orgon June 13, 2019 - Published by Downloaded from Copyright © 1984 American Society of Plant Biologists. All rights reserved.