fermentation fortification of active vitamin b12 in food
TRANSCRIPT

University of Helsinki
Department of Food and Environmental Sciences
EKT-series 1763
Fermentation fortification of active vitamin B12 in food matrices usingPropionibacterium freudenreichii: Analysis, production and stability
Bhawani Chamlagain
Academic Dissertation
To be presented, with the permission of the Faculty of Agriculture and Forestry, University ofHelsinki, for the public examination in the lecture hall B2, Viikki, on November 25th, 2016 at
12 o’clock noon.
Helsinki 2016

Custos: Professor Vieno PiironenDepartment of Food and Environmental SciencesUniversity of HelsinkiHelsinki, Finland
Supervisors: Professor Vieno PiironenDepartment of Food and Environmental SciencesUniversity of HelsinkiHelsinki, Finland
Docent Pekka VarmanenDepartment of Food and Environmental SciencesUniversity of HelsinkiHelsinki, Finland
Docent Susanna KariluotoDepartment of Food and Environmental SciencesUniversity of HelsinkiHelsinki, Finland
Reviewers: Associate Professor Jayashree ArcotSchool of Chemical EngineeringThe University of New South WalesSydney, Australia
Dr Vesa JoutsjokiPrincipal Research ScientistNatural Resources Institute FinlandJokioinen, Finland
Opponent: Professor Cornelia WitthöftDepartment of Chemistry and Biomedical SciencesLinnaeus UniversityKalmar, Sweden
ISBN 978-951-51-2752-5 (paperback)ISBN 978-951-51-2753-2 (PDF; http://ethesis.helsinki.fi)ISSN 0355-1180
UnigrafiaHelsinki 2016

Chamlagain, B. 2016. Fermentation fortification of active vitamin B12 in food matrices using Propionibacteriumfreudenreichii: Analysis, production and stability (dissertation). EKT-series 1763. University of Helsinki,Department of Food and Environmental Sciences. 71 + 41 pp.
AbstractVitamin B12 (later B12) intake is insufficient in developing countries, and globally, vegetarians and vegansare also at risk of B12 deficiency. Occurring naturally only in foods of animal origin, new affordable andsustainable dietary sources of B12 are needed to ensure sufficient intake. The only known food-gradeproducers of active B12, Propionibacterium freudenreichii strains, however, are yet to be exploited to enrichplant-based foods with B12. The B12 production capacity of P. freudenreichii depends on the strain, and theavailability of the B12 lower ligand (5,6-dimethylbenzimidazole, DMBI) is a key factor for the productionof active B12. Bread can be considered as a potential food for B12 fortification; yet the stability of in situ-produced B12 incorporated during breadmaking processes is not known. Current analytical methods such asthe microbiological assay (MBA) lack the required specificity and the existing high-performance liquidchromatography (HPLC) methods are only capable of measuring higher B12 levels in fortified foods andsupplements. The determination of active B12 in fermented foods, however, needs sensitive and selectivemethods.
An ultra-HPLC (UHPLC) method was developed and validated to measure the active B12 contents. Theidentity of the B12 form was confirmed with an ion-trap or quadrupole time-of-flight mass spectrometry(MS). The B12 production capacity of 27 P. freudenreichii and 3 Propionibacterium acidipropionici strainswas first studied in whey-based medium (WBM), and three of these P. freudenreichii strains were chosen tostudy B12 production in three aqueous cereal matrices prepared from malted barley (BM; 33% w/v), barleyflour (BF; 6% w/v) and wheat aleurone (AM). Riboflavin (RF) and nicotinamide (NAM) as food-gradereplacements for DMBI were investigated in WBM and cereal matrices. The stability of in situ-producedB12 and added cyanocobalamin (CNCbl) and hydroxocobalamin (OHCbl) during straight-dough, sponge-dough and sourdough breadmaking was studied.
The developed UHPLC method employing an Acquity high-strength silica (HSS) T3 column showedexcellent separation of active B12 from its analogues. A low limit of detection (0.075 ng/inj) enabled themeasurement of the B12 levels in cell extracts directly and following immunoaffinity purification in extractsof fermented cereal matrices and B12-fortified baking samples. Analysis with UHPLC–MS confirmed theproduction of active B12 by all 27 P. freudenreichii strains in WBM and 3 P. freudenreichii strains in cerealmatrices. P. acidipropionici strains, however, produced an inactive form (pseudovitamin B12), thus makingthem unsuitable for active B12 fortification in foods.
The level of B12 production in WBM varied considerably between the strains (0.45 3.35 μg/mL), whichincreased up to 4-fold in 12 of the 27 P. freudenreichii strains following supplementation with RF and NAM.In many of these strains, the B12 yield was higher with RF and NAM co-supplementation than with DMBI.In cereal matrices without supplementation, the produced levels of active B12 (9 37 ng/g) with P.freudenreichii strains were nutritionally significant. The B12 production increased many-fold, reaching upto 430 ng/g in BM, 39 ng/g in BF and 114 ng/g by adding cobalt (Co) and reached 712 ng/g in BM and 180ng/g in AM with RF and NAM co-supplementation with Co. The incorporated in situ-produced B12 wasretained during straight-dough breadmaking and the loss of 29% during sourdough baking was similar to thelosses observed for relatively stable CNCbl. However, the added OHCbl decreased by 21%, 31% and 44%respectively in straight-dough, sponge-dough and sourdough breadmaking. These results showed that B12produced in situ and incorporated during breadmaking was well retained in the bread prepared by theconventional breadmaking processes.
This thesis shows that UHPLC combined with MS allows for the accurate identification and quantitation oflow levels of active B12 in fermented food matrices ( 1 ng/g). P. freudenreichii strains could be utilised forin situ production of active B12 in cereal matrices and WBM. The availability of RF and NAM couldconsiderably improve B12 production. The produced levels could easily fulfil the recommended dietaryallowance set for B12 (e.g. 2 2.4 μg/day for adults), and could be well retained in bread in the commonlyused breadmaking processes.

PrefaceThis study was carried out at the Division of Food Chemistry and Division of DairyMicrobiology, Department of Food and Environmental Sciences, University of Helsinki. Thestudy was a part of the Academy of Finland funded project “Natural fortification of foods:Microbial in situ synthesis of vitamin B12 and folate in cereal matrix”. This doctoral work wasfinancially supported by the grant from the Research Foundation of University of Helsinki andRaisio Research Foundation, and a funded doctoral position by the Finnish Graduate School onApplied Sciences: Bioengineering, Food & Nutrition, Environment (ABS) and the Academy ofFinland project. The author kindly appreciates their financial support.My sincere gratitude goes to my supervisor Professor Vieno Piironen. You introduced me tothe field of vitamin B12 as a research assistant. Thank you for your insightful advice, discussionand critical comments on the experimental works and while writing the manuscripts. WheneverI had questions, you were always available to address them no matter how busy you were. Yourexcellent scientific expertise and the sound planning skills will always inspire me. I am gratefulto my co-supervisors Docent Pekka Varmanen and Docent Susanna Kariluoto for providingresearch insight, technical skills and productive discussions. Your advice and critical commentsduring the study period were highly helpful. I kindly thank our collaborators, at ETH Zurich,Professor Christophe Lacroix and Dr Franck Grattepanche. Your excellent collaborationprovided a solid foundation for our vitamin B12 research.
I express my sincere gratitude to Associate Professor Jayashree Arcot and Dr Vesa Joutsjokifor the critical evaluation of my doctoral dissertation and the comments and suggestions youprovided.
I kindly appreciate my follow-up group members Professor Emeritus Hannu Salovaara,Professor Maija Tenkanen and Docent Anna-Maija Lampi for their valuable feedback on myresearch work. I would like to thank Docent Velimatti Ollilainen for introducing me to theworld of LC–MS and always keeping the door open for me. I am grateful for your friendlinessand support.
My special thank goes to Dr Minnamari Edelmann who introduced me to the world of vitaminB12 analysis and we continued working side-by-side during the whole project. Needless to say,this study would have been incomplete without the support of my colleague and doctoral studentPaulina Deptula who is working alongside in the microbiology part of the Academy project.Thank you for your help in the microbiological works and your contribution in writing thepapers. It was fun and lively working with you in the lab as well as your active discussion inthe meetings. I especially thank Miikka Olin for his expert assistance in the LC and LC–MSworks and sharing the laughter in the office. I thank Tessa Sugito, Emmi Hovilehto, SaijaRautio, Marco Santin and Kaisa Hiippala, who carried out their master thesis work during thisproject. Your contribution is highly appreciated. Thank also goes to our research traineesTyphaine Parodi, Xinju Jiang and Anish Kiran.

I would like to thank my colleagues Tuuli Koivumäki, Göker Gürbüz, Marjo Pulkkinen, QiaoShi, Bei Wang and Zhen Wang for the lively environment in the office and around the corridor.I had a good discussion with you Dr Annelie Damerau, Dr Mari Lehtonen and Dr Petri Kyllion research as well as the life beyond science. Thank you Maija Ylinen and Taru Rautavesi foryour help in the lab. It was fun sharing the coffee time with you all in D-building. I enjoyedevery celebration in the coffee room, whether it was about the acceptance of a paper or successof a project or a grant or somebody’s farewell.
Last but not the least, I owe my deepest gratitude to my family back home who supportedrelentlessly and understood me during my eight years of stay far from their eyes. I am so luckyto have support and encouragement from my wife Pushpa Gnyawali. Thank you for your loveand care during this journey.
Helsinki, November 2016
Bhawani Chamlagain

List of Original Publications
I Chamlagain B, Edelmann M, Kariluoto S, Ollilainen V, Piironen V. 2015. Ultra-high performance liquid chromatographic and mass spectrometric analysis ofactive vitamin B12 in cells of Propionibacterium and fermented cereal matrices.Food Chem. 166:630–638.
II Chamlagain B, Deptula P, Edelmann M, Kariluoto S, Grattepanche F, LacroixC, Varmanen P, Piironen V. 2016. Effect of the lower ligand precursors onvitamin B12 production by food-grade Propionibacteria. LWT - Food Sci.Technol. 72:117–124.
III Chamlagain B, Sugito TA, Deptula P, Edelmann M, Kariluoto S, Varmanen P,Piironen V. In situ production of active vitamin B12 in cereal matrices usingPropionibacterium freudenreichii. Submitted.
IV Edelmann M, Chamlagain B, Santin M, Kariluoto S, Piironen V. 2016. Stabilityof added and in situ-produced vitamin B12 in breadmaking. Food Chem.204:21–28.
The papers are reproduced with the kind permission from the publisher Elsevier.
Contribution of the author to papers I to IV:
I, II, III Bhawani Chamlagain planned the study together with the other authors and hewas responsible for the experimental works. He had the main responsibility forinterpreting the results and was the corresponding author of the papers.
IV Bhawani Chamlagain planned the study together with the other authors and heparticipated in the analysis of vitamin B12. He contributed to the preparation ofthe manuscript.

AbbreviationsAdoCbl adenosylcobalaminAM wheat aleurone matrixBEH ethylene bridged hybridBF barley flour matrixBM barley malt matrixCNCbl cyanocobalaminCo cobaltDMBI 5,6-dimethylbenzimidazoleFMN flavin mononucleotideFAD flavin adenine dinucleotideHPLC high performance liquid chromatographyHSS high strength silicaLC liquid chromatographyLC–MS liquid chromatography–mass spectrometryLOD limit of detectionLOQ limit of quantitationMBA microbiological assayMeCbl methylcobalaminMEM malt-extract mediumMS mass spectrometryMS/MS tandem mass spectrometryNA nicotinic acidNAM nicotinamideNaMN nicotinate mononucleotideNMR nuclear magnetic resonanceOD optical densityOHCbl hydroxocobalaminPAB PropionibacteriaPDA photo diode arrayQTOF quadrupole time-of-flightRF riboflavinTFA trifluoroacetic acidUHPLC ultra-high performance liquid chromatographyUV ultravioletWBM whey-based medium

Table of contents
ABSTRACT ...............................................................................................................................................3
PREFACE ..................................................................................................................................................4
LIST OF ORIGINAL PUBLICATIONS ...............................................................................................6
ABBREVIATIONS ...................................................................................................................................7
1 INTRODUCTION ................................................................................................................................11
2 REVIEW OF THE LITERATURE ...................................................................................................132.1 Vitamin B12 ....................................................................................................................................13
2.1.1 Structure ...................................................................................................................................132.1.2 Metabolic functions .................................................................................................................132.1.3 Active B12 and B12 analogues: Bioactivity in humans .........................................................14
2.3 B12 contents in foods .....................................................................................................................152.4 Dietary intake levels and the current B12 deficiency status ..........................................................162.5 Analysis of B12 in foods ................................................................................................................17
2.5.1 Microbiological assay ..............................................................................................................172.5.2 Liquid chromatographic methods (High-performance liquid chromatography and ultra-highperformance liquid chromatography) ...............................................................................................182.5.3 Mass spectrometry ...................................................................................................................192.5.4 Other methods ..........................................................................................................................20
2.6 B12 fortification in foods by fermentation .....................................................................................202.6.1 General B12 biosynthesis ........................................................................................................212.6.2 B12 biosynthesis in Propionibacteria ......................................................................................222.6.3 Biosynthesis of DMBI in Propionibacterium freudenreichii .................................................222.6.4 Availability and activation of the lower ligand: Production of active B12 or its analogues .24
2.7 Active B12 production with food-grade Propionibacterium freudenreichii.................................242.7.1 Riboflavin and niacin for active B12 production ....................................................................252.7.2 Effect of cobalt, fermentation conditions and carbon sources on B12 production ................26
2.8 Potential of in situ B12 fortification in plant-based foods .............................................................262.9 Stability of B12 compounds in food processes ..............................................................................28
3 AIMS ......................................................................................................................................................29
4 MATERIALS AND METHODS ........................................................................................................304.1 Propionibacteria strains...................................................................................................................304.2 Preparation of the fermentation media ...........................................................................................30
4.2.1 Whey-based medium (Study II) ..............................................................................................304.2.2 Cereal matrices (Studies I, III) and malt-extract medium (Study IV) ....................................31
4.3 Supplementation with precursors ...................................................................................................314.4 Fermentation and monitoring .........................................................................................................314.5 B12 stability during breadmaking (IV) ..........................................................................................32
4.5.1 Stability of cyanocobalamin and hydroxocobalamin ..............................................................324.5.2 Stability of in situ-produced B12 ............................................................................................33
4.6 B12 analysis ....................................................................................................................................344.6.1 Extraction .................................................................................................................................344.6.2 Immunoaffinity purification (Studies I, III, IV) ......................................................................344.6.3 Ultra-high performance liquid chromatography (Studies I–IV) .............................................344.6.4 Mass spectrometry (Studies I III) ...........................................................................................354.6.5 Microbiological assay (Studies I, III, IV) ...............................................................................35

4.7 Analysis of other components and fermentation metabolites ........................................................354.7.1 Riboflavin (Study II) ................................................................................................................354.7.2 Sugars and organic acids (Studies II, III) ................................................................................36
4.8 Statistical analysis ...........................................................................................................................36
5 RESULTS ..............................................................................................................................................375.1 Optimisation and validation of the ultra-high performance liquid chromatography method for B12analysis (Study I) ..................................................................................................................................37
5.1.1 Flow rate optimisation and C18 column selection ..................................................................375.1.2 Immunoaffinity purification and recovery tests ......................................................................375.1.3 Specificity of the developed ultra-high performance liquid chromatography method ..........39
5.2 Ultra-high performance liquid chromatography–mass spectrometry identification of the B12compounds ............................................................................................................................................39
5.2.1 Ultra-high performance liquid chromatography–ion-trap mass spectrometry (Studies I, II) 395.2.2 Ultra-high performance liquid chromatography–quadrupole time-of-flight mass spectrometry(Study III) ..........................................................................................................................................41
5.3 B12 production by Propionibacteria in whey-based medium ........................................................425.3.1 B12 production without precursor supplementation ...............................................................425.3.2 Effect of riboflavin and nicotinamide supplementation time on B12 production..................435.3.3 Effect of natural precursors vs 5,6-dimethylbenzimidazole on B12 production ...................44
5.4 B12 production in cereal matrices by Propionibacterium freudenreichii strains .........................465.4.1 B12 production in barley malt matrix .....................................................................................465.4.2 B12 production in barley flour and aleurone matrices ...........................................................47
5.5 Stability of B12 compounds during three breadmaking processes................................................485.5.1 Stability of cyanocobalamin and hydroxocobalamin ..............................................................485.5.2 Stability of in situ-produced B12 by Propionibacterium freudenreichii ...............................49
5.6 Comparison of the B12 contents obtained by the ultra-high performance liquid chromatographymethod and by microbiological assay ..................................................................................................51
5.6.1. Fermented whey-based medium (Study II and this thesis) ....................................................515.6.2 Fermented cereal matrices (Studies I, III) ...............................................................................525.6.3 B12 Added or in situ-fortified samples during breadmaking (Study IV) ..............................52
6 DISCUSSION .......................................................................................................................................546.1 Sensitivity and selectivity of the developed ultra-high performance liquid chromatography method ...............................................................................................................................................................546.2 Ultra-high performance liquid chromatography–mass spectrometry confirms the production ofactive B12 or its inactive form in whey-based medium and cereal matrices by Propionibacteria .....556.3 The ultra-high performance liquid chromatography method is more selective than themicrobiological assay for measuring active B12 in fermented food matrices ....................................566.4 Active B12 production in whey-based medium and cereal matrices by Propionibacteriumfreudenreichii ........................................................................................................................................58
6.4.1 Active B12 production without supplementation of 5,6-dimethylbenzimidazole or itsprecursors ..........................................................................................................................................586.4.2 Potential to increase B12 production by co-supplementation with riboflavin and nicotinamide ...........................................................................................................................................................60
6.5 In situ-produced B12 is stable during breadmaking ......................................................................61
7 CONCLUSIONS ..................................................................................................................................63
8 REFERENCES .....................................................................................................................................65


1 Introduction
11
1 Introduction
In nature, vitamin B12 (hereafter B12) is synthesised by only a few bacteria and algae (Martenset al. 2002). The natural occurrence of B12 is thus restricted to foods of animal origin (meat,fish, eggs and dairy products) obtained either from their feed or due to gut microbial activities(Martens et al. 2002; Truswell 2007; Watanabe et al. 2014). Some plant-based products maycontain a certain amount of B12 if processed with microorganisms capable of synthesising B12(Watanabe et al. 2013). This selective natural distribution of B12 only in foods of animal origin,unlike other vitamins, exposes certain population groups, such as vegetarians and vegans, to ahigher risk of B12 deficiency (Sych et al. 2016). The B12 intake is lower than the recommendeddietary allowance (2 2.4 μg/d) in the lower income countries due to limited access to animal-based foods or avoidance for religious or ethical reasons (Allen 2009; Sych et al. 2016).Fortification is one way to address such B12 deficiencies (Pawlak et al. 2013); however, in situB12 production via the fermentation of plant-based foods is a sustainable and attractive way toensure sufficient dietary B12 intake.B12 is an active cobamide for humans with 5,6-dimethylbenzimidazole (DMBI) as the lowerligand. Several other cobamides with a structure identical to B12 but with a different lowerligand are synthesised by microorganisms and are defined as B12 analogues. The DMBI ligandof B12 is essential for its absorption and bioactivity in humans (Stupperich and Nexø 1991).The inactive B12 analogues, however, function as the cofactor for B12-dependent enzymes inmany microorganisms (Herbert 1988; Taga and Walker 2008). The microbiological assay(MBA), the commonly used B12 reference method of the AOAC (2006), uses the cobamide-dependent growth of the assay organism Lactobacillus delbrueckii ATCC 7830. MBA thusmeasures active B12 as well as inactive forms that support the growth of the assay organism(Watanabe et al. 2013). However, analytical methods for measuring B12 in fermented foodsand microbial materials need to distinguish the active forms from the inactive analogues and tobe sensitive enough to be able to measure the low B12 levels encountered in food products (Ball2006). The ultra-high performance liquid chromatography (UHPLC) and liquidchromatography-mass spectrometry (LC–MS) methods could prove useful for the accurateidentification and selective quantitation of active B12 in foods, particularly in fermented foodmatrices.
Plant-based foods are often fermented with lactic acid bacteria to enrich them with vitamins,including B12 (Denter and Bisping 1994; LeBlanc et al. 2010; Hugenholtz 2013). So far, lacticacid bacteria (e.g. Lactobacillus reuteri) have not been shown to produce active B12 (Santos etal. 2007; Hazra et al. 2013; Hugenholtz 2013). However, the Emmental cheese starterPropionibacterium freudenreichii from Propionibacteria (PAB) is known to synthesise activeB12 (Hugenschmidt et al. 2011; Thierry et al. 2011). For a long time, the biosynthesis of DMBIin the aerotolerant P. freudenreichii was not completely understood. Deptula et al. (2015)recently showed that the enzyme BluB/CobT2 is responsible for the biosynthesis of DMBI inP. freudenreichii from reduced flavin mononucleotide (FMN). The in vivo experimentsconfirmed that DMBI synthesis in P. freudenreichii requires oxygen (Deptula et al. 2015), asin aerobic microorganisms (Martens et al. 2002; Taga et al. 2007), leading to the production ofthe active forms of B12. In commercial production, DMBI is added to increase B12 yields
12
(Martens et al. 2002); however, DMBI supplementation is not possible in food fermentation.The use of P. freudenreichii for in situ B12 fortification in plant-based foods, however, islimited.
Previous studies had shown that riboflavin (RF) is the precursor of DMBI biosynthesis in P.freudenreichii (Renz 1970; Lingens et al. 1992) and niacin stimulates its transformation intoDMBI (Hörig and Renz 1980). Providing RF and niacin either as supplements or foodingredients rich in these vitamins could be natural alternatives to DMBI for improving in situB12 production. However, the natural PAB strains differ in B12 production (Hugenschmidt etal. 2010) and their response to RF and niacin is not known. The novel use of cereal matrices foractive B12 in situ fortification using P. freudenreichii requires the selection of a proper strainand knowledge regarding the effect of key precursors that are supplemented or naturally presentin the matrices during B12 production. Besides, knowledge on the stability of the in situsynthesised B12 in food matrices for their potential use in food applications, such asbreadmaking, is lacking.
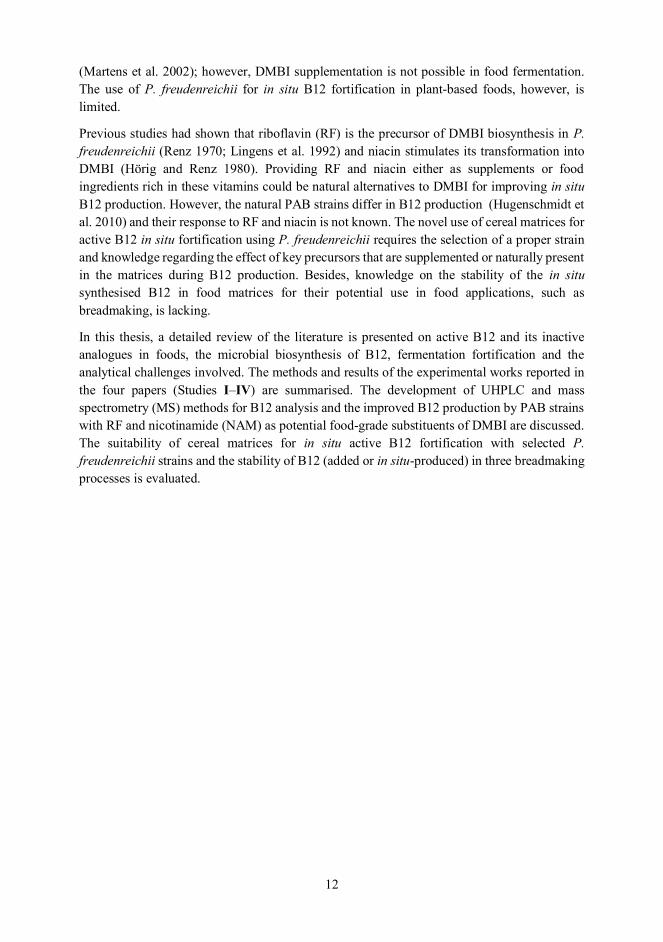
In this thesis, a detailed review of the literature is presented on active B12 and its inactiveanalogues in foods, the microbial biosynthesis of B12, fermentation fortification and theanalytical challenges involved. The methods and results of the experimental works reported inthe four papers (Studies I IV) are summarised. The development of UHPLC and massspectrometry (MS) methods for B12 analysis and the improved B12 production by PAB strainswith RF and nicotinamide (NAM) as potential food-grade substituents of DMBI are discussed.The suitability of cereal matrices for in situ active B12 fortification with selected P.freudenreichii strains and the stability of B12 (added or in situ-produced) in three breadmakingprocesses is evaluated.

2 Review of the literature
13
2 Review of the literature
2.1 Vitamin B122.1.1 StructureVitamin B12 (hereafter B12) is a general term used to define four cobamides with a commonlower ligand of 5,6-dimethylbenzimidazole (DMBI) in the -position and one of four upperligands (adenosyl, methyl, hydroxo or cyano) in the -position (Figure 1); respectively calledadenosylcobalamin (AdoCbl), methylcobalamin (MeCbl), hydroxocobalamin (OHCbl) andcyanocobalamin (CNCbl). A central cobalt (Co) atom coordinates the four pyrrole rings, withthe lower ligand connected by a phosphate–sugar bond and the upper ligand as a metal–carbonbond (Figure 1). AdoCbl and MeCbl are the coenzyme forms required for the activity of thetwo enzymes methionine synthase and methylmalonyl-CoA (Pawlak et al. 2013). OHCbl isformed when B12 compounds are exposed to light (Juzeniene and Nizauskaite 2013; Green andMiller 2014), whereas CNCbl is the commercial form used in vitamin supplements and fortifiedfoods prepared via a reaction with cyanide during industrial manufacture (Martens et al. 2002;Sych et al. 2016). OHCbl and CNCbl, however, are equally absorbed similarly to the coenzymeforms and are converted into the biological forms in humans (Vorobjeva 1999; Obeid et al.2015).
Figure 1. Structure of vitamin B12 with the lower ligand of 5,6-dimethylbenzimidazole (DMBI) and the upperligand consisting of either a 5 -deoxyadenosyl, methyl, hydroxyl or cyano group, with their respective names beingadenosylcobalamin (AdoCbl), methylcobalamin (MeCbl), hydroxocobalamin (OHCbl) and cyanocobalamin(CNCbl).
2.1.2 Metabolic functionsIt took another four decades to confirm the actual structure of the unknown substance in pigliver (B12) which in the 1920s was used to treat pernicious anaemia (Green and Miller 2014).

14
Biochemical studies confirmed that B12 is required for the activity of only two enzymes inhumans: methionine synthase and methylmalonyl-CoA mutase (Truswell 2007; Nielsen et al.2012). As shown in Figure 2, MeCbl is involved in methylation of homocysteine to methionineby transferring the methyl group from 5-methyl tetrahydrofolate and is also involved in thebiosynthesis of DNA (Nielsen et al. 2012; Green and Miller 2014). AdoCbl acts as a cofactorfor methylmalonyl-CoA mutase which is responsible for the formation of succinyl-CoA frommethylmalonyl-CoA and is involved in the metabolism of odd-chain-length fatty acids andcertain branched-chain amino acids (Roth et al. 1996). The methylation reaction is linked tofolate metabolism (Figure 2). B12 deficiency thus affects the synthesis of methionine and denovo synthesis of DNA and RNA. A lack of either B12 or folate is responsible for thedevelopment of megaloblastic anaemia due to defective DNA synthesis and of other associateddisorders (Selhub and Paul 2011).
Figure 2. The cofactor functions of methylcobalamin (MeCbl) and adenosylcobalamin (AdoCbl) in humans(adopted from Nielsen et al. 2012).
2.1.3 Active B12 and B12 analogues: Bioactivity in humansThe molecules with a corrinoid B12 structure (Figure 1) are called cobamides. The cobamidesshare an otherwise identical molecular structure but differ in the lower ligand. In nature, severalcobamides are found as a result of microbial activities (Renz 1999; Sych et al. 2016). Humansand animals are only able to absorb cobamides with DMBI as the lower ligand (Stupperich andNexø 1991; Roth et al. 1996), whereas cobamides with non-DMBI lower ligands are alsobioavailable to microorganisms (Taga and Walker 2008; Crofts et al. 2013). To make thedistinction clear between human-active and non-human-active B12 compounds, cobamideswith a lower ligand other than DMBI are called B12 analogues or biologically inactive B12(Renz 1999; Watanabe et al. 2013). In the B12 analogues synthesised by many microorganisms,the DMBI of active B12 is substituted by e.g. other benzimidazoles, purines or phenoliccompounds, as shown in Figure 3 (Renz 1999; Girard et al. 2009; Crofts et al. 2013).

2 Review of the literature
15
Figure 3. Example of the lower ligands present in the cobamides synthesised by microorganisms.
One of the frequently encountered B12 analogues is pseudovitamin B12 (adenylcobamide) thathas adenine as its lower ligand. Pseudovitamin B12 is produced by L. reuteri (Santos et al.2007; Molina et al. 2012), even when grown with DMBI supplementation. Salmonellatyphimurium, on the other hand, produces pseudovitamin B12 and 2-methyladenylcobamideunder anaerobic growth conditions but synthesises active B12 under aerobic conditions (Keckand Renz 2000). PAB produce active B12 as well as inactive forms depending on the speciesand the incubation conditions (Quesada-Chanto et al. 1998b; Renz 1999; Vorobjeva 1999). Forexample, P. freudenreichii under aerobic growth produces active B12 whereas it alsosynthesises a low level of pseudovitamin B12 under anaerobic incubation (Deptula et al. 2015).Propionibacterium acidipropionici lacks the gene responsible for the biosynthesis of DMBI(Parizzi et al. 2012), thus it probably synthesises inactive forms in the absence of DMBI.Therefore, the analysis of B12 requires the use of appropriate methods that are able todistinguish the active forms from the inactive analogues.
2.3 B12 contents in foodsThe distribution of B12 in foods is restricted to foods of animal origin (Table 1). Meat, fish,milk, and their products are therefore the main sources of B12 in human diets. The highest B12content is found in liver (e.g., beef liver 83.1 μg/100 g), whereas the level of B12 in chicken(0.22 μg/100 g) is considerably lower compared to other meats (Stabler and Allen 2004; Ball2006). Foods of plant origin are lacking in B12 unless contaminated or processed with B12-synthesising microorganisms (Watanabe et al. 2014). For example, tempeh containsapproximately 0.18 8 μg/100 g of B12 (Watanabe 2007) and some mushrooms may containtraces of B12 (Koyyalamudi et al. 2009; Watanabe et al. 2012). Some edible algae – chlorellaand spirulina – are reported to contain B12 levels of 30 200 μg/100 g dry weight (Watanabe

16
2007). However, in some algal products, up to 95% of the reported B12 values come fromhuman-inactive B12 analogues such as pseudovitamin B12 (Watanabe et al. 2002; Stabler andAllen 2004; Miyamoto et al. 2006).Table 1. B12 contents in selected foods and edible algal products (adopted from Stabler and Allen (2004), Ball(2006) and Watanabe et al. (2014)).
Food types Food B12, μg/100 gMeat Beef liver 83
Beef 2.6Lamb 3.0Goat 1.2Pork 0.8Chicken 0.20
Milk and milk products Cow milk 0.4Yoghurt 0.6Cheese 2.9
Egg 1.3Fish and shellfish Fish 2.1 9.6
Clams 96Oysters 18.7Shrimp 1.5
Fermented plant foods Tempeh 0.2 6.3Algal products Dried purple laver (nori) 55 71*
Chlorella and spirulina‡ 30 200* Others Fermented tea Trace
Mushroom Trace* Dry weight basis ‡ contains mostly inactive pseudovitamin B12.
2.4 Dietary intake levels and the current B12 deficiency statusThe average intake of B12 in developed countries is well above the recommended dietaryallowance (RDA) of 2 2.4 μg/d (Stabler and Allen 2004). For example, the median intake of3.5 5.0 μg/d in the United States (Institute of Medicine 1998) was lower than that of 5.7 8.0μg/d in the Nordic countries (Nordic Nutrition Recommendations 2012 2013). Due to theinadequate consumption of animal products, the estimated intake of B12 is below the RDA indeveloping countries (Allen 2009). The intake levels are well reflected in the B12 status of thepopulations globally. Only <6% of the UK and US population below 60 years of age were B12deficient compared to 40% of children and adults in Latin America and 70 80% inschoolchildren and adults in Africa and India (Allen 2009). Globally, vegetarians and vegansare often at risk of B12 deficiency (WHO 2008); the prevalence, however, is relatively low indeveloped countries due to the intake of B12 supplements or fortified foods (Stabler and Allen2004; Elorinne et al. 2016). Besides, pregnant or lactating women, infants and young childrenwith a low B12 intake are susceptible to B12 deficiency (WHO 2008). Despite an adequateintake, B12 deficiency is found in the elderly due to malabsorption of food-bound B12 and alsoin people with pernicious anaemia (Nielsen et al. 2012).

2 Review of the literature
17
2.5 Analysis of B12 in foodsThe measurement of B12 in food products is problematic for two main reasons: one, its lowconcentration in non-fortified foods and two, the possible inclusion of B12 analogues whenmeasured with non-specific methods (Stabler and Allen 2004; Ball 2006). In addition, the non-cyano forms of B12 are sensitive to light, thus complicating the accurate quantification of theindividual forms (Kumar et al. 2010). As CNCbl is relatively stable, the native B12 compoundsin samples are converted into CNCbl by heat extraction with cyanide (Ball 2006). The universaltool for B12 measurement, the MBA developed in the 1950s, was based on the growth of L.delbrueckii ATCC 7830 (previously known as L. leichmannii) in proportion to the amount ofB12 in the sample extract (Hoffmann et al. 1949; Skeggs et al. 1950; Emery et al. 1951; Ford1952; Ford 1953). Alongside MBA, colorimetric and spectrophotometric methods were alsoused for the analysis of B12 in food and microbial materials (Fisher 1953; Shaw and Bessell1960). In the last three decades, several chromatographic methods utilising different detectiontechniques in combination with improved sample preparations have been developed and arebeing increasingly applied for B12 analysis (Ball 2006; Kumar et al. 2010; Green and Miller2014). Although modern liquid chromatographic methods are more selective, MBA is still oneof the most sensitive methods (detection limit: 1 20 pg/mL) for B12 quantification (Kumar etal. 2010; Sych et al. 2016) and is an official method recommended by the AOAC (2006). Recentadvances in liquid chromatographic separation, e.g. UHPLC (Swartz 2005) and samplepurification using immunoaffinity columns (Heudi et al. 2006; Marley et al. 2009; enyuva andGilbert 2010) have considerably improved the analytical sensitivity of the LC-based methods.
2.5.1 Microbiological assayMBA has been in use for over 60 years as an official method for the analysis of B12. Significantimprovements have been achieved during this period; the assay is relatively simple and takes ashorter time than the traditional method did. The early assays were performed in test tubes (Ball2006); the introduction of 96-well microtiter plates made the assay faster with lower operatingcosts (Kelleher and Broin 1991). These days, MBA is performed essentially on microtiter plates(Kumar et al. 2010; Guggisberg et al. 2012) and serves as a reference method while developingmodern analytical methods for B12 analysis.
One major drawback of MBA is its poor specificity: the test organism L. delbrueckii 7830 notonly grows with active B12 forms but also with the B12 analogues and nucleic acids (Bermanet al. 1956; Ball 2006). B12 MBA measurements of animal-based foods would be appropriatebecause they mostly contain active B12; however, using MBA for the analysis of B12 insamples of microbiological origin could be problematic. Taranto et al. (2003), using MBA,reported that L. reuteri CRL1098 was the first lactic acid bacteria to produce B12 (50 ng/mL),but it turned out to be pseudovitamin B12 (Santos et al. 2007), the inactive B12 analogue inhumans. In some shellfish and spirulina tablets, the B12 content obtained by MBA wasapproximately 6 8-fold greater than that detected with the chemiluminescence method(Watanabe et al. 1998), probably due to the contribution from B12 analogues. Up to 2.2-foldhigher B12 contents were obtained by MBA than by HPLC when a range of meat products wasanalysed by Guggisberg et al. (2012). In general, in foods analysed by MBA, B12 analoguescould represent about 5 30% of the reported B12 contents (Ball 2006). The poor specificity ofMBA thus needs to be taken into consideration when analysing B12 from food samples that

18
likely contain B12 analogues or are processed with microorganisms. Methods that are moreselective could be utilised to confirm any discrepancy in the results obtained by MBA.
2.5.2 Liquid chromatographic methods (High-performance liquid chromatography andultra-high performance liquid chromatography)HPLC techniques are gradually being adopted for the analysis of B12 in fortified foods, infantformula and vitamin supplements (Heudi et al. 2006; Campos-Gi enez et al. 2008; Marley etal. 2009; Chen et al. 2010). Apart from fortified foods, they have also been used for measuringB12 contents in meat (Kelly et al. 2005; Guggisberg et al. 2012; Szterk et al. 2012) and dairyproducts (Van Wyk and Britz 2010). The popularity of chromatographic methods led to a fewHPLC-based methods for B12 analysis (Schimpf et al. 2012; Giménez 2014) being recentlyproposed as the official methods of the AOAC. Table 1 shows the currently usedchromatographic methods with detection techniques to analyse B12 in a range of food samples.
Table 2. Liquid chromatography (LC) methods developed for B12 analysis in fortified and non-fortified foods.Method Sample types LOD (LOQ) ReferenceHPLC–UV Breakfast cereals, cereal bars, infant cereals,
cocoa beverages, milk- and soy-based infantformulas, clinical nutrition products, skimmilk powder, acid whey powder andpolyvitamin premixes
1 (3) ng/g Campos-Gi enezet al. 2008
HPLC–ESI–MS Infant milk powders and multivitamin-multimineral tablets
2 ng/g Luo et al. 2006
UHPLC–MS Fortified milk powders and rice powders 6 (19) ng/mL Lu et al. 2008
HPLC–UV/Vis: on-line sample cleanup
Multivitamin dietary supplements 3.3 (10) ng/inj Chen et al. 2010
HPLC–UV Fermented dairy products and cultures ofPAB
5 ng/mL Van Wyk andBritz 2010
HPLC–UV:Immunoaffinitypurification
Meat products 2 (7) ng/g Guggisberg et al.2012
HPLC–UV:Immunoaffinityclean-up
NIST SRM, whey-based infant formula,high protein powdered drinks and bars,wheat breakfast cereal, carbonated softdrinks, fruit juices and B12 tablets
1.5 (5) ng/inj Marley et al. 2009
HPLC–UV:Immunoaffinityextraction
Milk-based infant formula powder, infantcereals with fruits and milk, breakfastcereals, polyvitaminated mixes, petfood andhealth care products
3 (10) ng/mL Heudi et al. 2006
HPLC–MS: SPE Raw beef products 0.1 ng/20 μL inj Szterk et al. 2012HPLC–UV:Immunoaffinitypurification
Infant formula and adult nutritionals 10 ng/mL Kirchner et al.2012
LOD = limit of detection; LOQ = limit of quantitation. The values are given as reported in the studies.

2 Review of the literature
19
Almost all HPLC methods for B12 analysis are based on reverse-phase chromatography usinga column packed with C18 particles and the aqueous mobile phase consisting of eitheracetonitrile or methanol operated in an isocratic or gradient mode (Kumar et al. 2010). Thedetection is performed with a UV detector or photodiode array (PDA) set at a range of 361 372nm, with 361 nm being the commonly used wavelength for detection of CNCbl. Pakin et al.(2005) used an HPLC method based on fluorescence detection after B12 was purified from foodsamples and chemically converted into the fluorescent compound -ribazole. With thistechnique, the quantitation limit was improved to 3 ng/g; the method, however, is timeconsuming.
The HPLC–UV methods are not able to quantify the very low concentrations of B12 in non-supplemented foods due to poor sensitivity and selectivity (Gentili and Caretti 2013). However,the introduction of immunoaffinity purification simultaneously allows for the removal ofinterfering substances from the sample extracts and the concentration of the analyte in thefortified samples (Marley et al. 2009; Guggisberg et al. 2012; Giménez 2014). The quantitationlimits of the reported HPLC methods range from 3 10 ng/mL or g of sample (Table 2) withlarge sample sizes needed for the analysis.
The better sensitivity and efficiency offered by UHPLC technology (e.g. operating under highpressure and the use of < 2-μm particles) in terms of improved peak resolution, peak sharpnessand shorter run time (Owen et al. 2011) for analysing B12 in foods is yet to be realised. Morerecently, a UHPLC method with mass spectrometric detection was developed and validated formeasuring B12 in milk and dairy products (Zironi et al. 2013). The first action HPLC AOACmethod (Campos-Gi enez et al. 2012) was later improved by applying a UHPLC system forB12 measurement in infant formula and adult nutritionals (Giménez 2014). However, sensitivemethods using UHPLC for B12 analysis of non-fortified and fermented food materials areneeded.
2.5.3 Mass spectrometryMS has been useful, in addition to nuclear magnetic resonance (NMR), in obtaining thestructural confirmation of B12 and its analogues (Santos et al. 2007; Crofts et al. 2013; Deptulaet al. 2015). It is simple and easier to operate than NMR and can be conveniently interfacedwith the existing LC system. More importantly, MS supplements the LC–ultraviolet-visiblespectroscopy (LC–UV/Vis) identification, and it is useful when the standard compounds arenot commercially available. MS detection has also been applied for the quantitation of B12 indairy products (Zironi et al. 2014) and fortified foods (Lu et al. 2008). However, MS is widelyused for identification purposes rather than for quantitation.
The commonly used mass spectrometers for the B12 analysis of foods and microbial samplesemploy electrospray ionization in the positive ion mode with triple quadrupole, time-of-flightor ion-trap detection techniques. Koyyalamudi et al. (2009) applied quadrupole MS for theidentification of the corrinoid in cultivated mushrooms through a comparison with the B12compounds in foods known to contain active B12 such as beef, salmon, eggs and milk. Thelevel of B12 in milk and milk products was measured using a triple quadrupole massspectrometer connected to a UPLC system (Zironi et al. 2014). The same technique was usedby Santos et al. (2007) to identify the type of B12 compound (pseudovitamin B12) in the cells

20
of L. reuteri. MS with an ion trap combined with time-of-flight detectors has been used for theidentification of active B12 and/or analogues of B12 (e.g. pseudovitamin B12) in the cellbiomass of the edible cyanobacterium Nostochopsis sp. (Hashimoto et al. 2012), shellfish (Tenget al. 2015) and CNCbl-enriched lettuce (Bito et al. 2013).
2.5.4 Other methodsBesides the MBA and LC-based methods, alternative techniques that are available for B12determination are described in detail in a review by Kumar et al. (2010). They include thetraditional spectrophotometric methods, protein-binding assays using the intrinsic factor orB12-specific antibodies, and the chemiluminescence method that is based on the reaction of Co(from B12) with the assay reagent complex luminol–hydrogen peroxide. With these methods,although some of them are sensitive, their low specificity remains a serious drawback. Forexample, chemiluminescence is extremely sensitive, allowing B12 measurements up to thepicogram to femtogram level. The results, however, can easily be skewed by other metal-containing compounds such as inactive B12 analogues (Kumar et al. 2010). The assay resultsbased on binding proteins can also be affected by the interaction of the binding factors withfood proteins (Sych et al. 2016). Nevertheless, the modern analytical methods for measuringthe B12 contents in foods have evolved from the biochemical methods that were developed forassessing the B12 status by analysing the B12 in the biological fluids (e.g., blood).
2.6 B12 fortification in foods by fermentationTo address B12 deficiency due to inadequate dietary intake, plant-based foods could bepotential vehicles for B12 fortification (Pawlak et al. 2013). The full benefit of a vegetarian dietis impacted by the lack of a few key nutrients in plant-derived foods, such as B12 (Marsh et al.2012). Therefore, it is highly recommended that vegetarians and vegans take B12-fortifiedfoods or supplements to avoid the consequences of a B12 deficiency (Elmadfa and Singer 2009;Pawlak et al. 2014). The introduction of B12 in foods could be achieved by supplementing withpurified B12 compounds during food processing (Winkels et al. 2008) or via in situ productionby microorganisms capable of synthesising B12 (Keuth and Bisping 1994; Babuchowski et al.1999; Hugenholtz and Smid 2002; Sych et al. 2016). In addition to naturally fortifying foodswith B12, fortification by fermentation provides other benefits such as improving the textureand storage stability of the finished product (Hugenholtz et al. 2002; Tinzl-Malang et al. 2015).The chemical production of B12 is a complicated and economically unviable process;commercial B12 manufacturing, therefore, relies totally on biotechnological production(Martens et al. 2002; Sych et al. 2016). Currently, manufacturing utilises genetically engineeredstrains of Pseudomonas denitrificans, Bacillus megaterium and P. freudenreichii (Hugenholtzet al. 2002; Thierry et al. 2011; Sych et al. 2016), enabling yields as high as 206 μg/mL (Martenset al. 2002). However, B12 production in foods cannot be carried out with genetically modifiedstrains, and must instead use bacterial strains that are generally recognised as safe (GRAS) suchas P. freudenreichii (Hugenschmidt et al. 2010; Deptula et al. 2015; Sych et al. 2016) directlyin foods or as food ingredients after minimal processing (Hugenholtz et al. 2002). Apart fromthe bacterial strains, the fermentation conditions, medium composition and the keysupplements, Co and DMBI, affect B12 production (Li et al. 2008; Burgess et al. 2009; Wanget al. 2015).

2 Review of the literature
21
2.6.1 General B12 biosynthesisB12 is synthesised by a limited group of bacteria and archaea (Raux et al. 2000) via twodifferent pathways, aerobic and anaerobic, in a complex process involving around 30 enzymaticreactions (Martens et al. 2002; Burgess et al. 2009). The biosynthetic pathways are mostlystudied in the aerobic bacterium P. denitrificans and the anaerobic bacteria P. freudenreichiiand S. typhimurium (Roth et al. 1996). Many of the steps are common in both pathways, butthey differ in terms of oxygen requirement during corrin ring synthesis (the aerobic pathway),the timing of Co insertion and the biosynthesis of the lower ligand DMBI (Figure 4) (Roth etal. 1996; Warren et al. 2002). The Co is inserted during the early stage of B12 biosynthesis inthe anaerobic pathway, whereas this reaction happens after several steps in the corrin ringformation in the oxygen-dependent pathway (Raux et al. 2000; Warren et al. 2002; Moore andWarren 2012). In this thesis, the focus is on B12 biosynthesis by aerotolerant PAB in which theB12 corrin ring is synthesised by the anaerobic route while the synthesis of the lower ligandrequires oxygen (Figure 4) (Martens et al. 2002; Deptula et al. 2015).
Figure 4. The key differences in the aerobic and anaerobic biosynthetic pathways of B12 (adopted from Martenset al. 2002). The aerobic biosynthesis of 5,6-dimethylbenzimidazole (DMBI) from flavin mononucleotide (FMN)(e.g. in Propionibacterium freudenreichii) is highlighted.

22
2.6.2 B12 biosynthesis in PropionibacteriaPAB are classically divided into two groups: dairy (isolated from cheese and milk) andcutaneous (human skin). P. freudenreichii and P. acidipropionici are the dairy PAB commonlyused in foods (Thierry et al. 2011). The species P. freudenreichii is further divided into twosubspecies (subsp. freudenreichii and subsp. shermanii) based on lactose utilisation and nitratereduction. However, this phenotypic division has been disputed because strains belonging tosub-group freudenreichii are not always lactose negative (de Freitas et al. 2015). P.freudenreichii is one of the few microorganisms, that has been extensively studied to unravelthe microbial biosynthesis of B12 (Roth et al. 1996; Warren et al. 2002).
As part of the energy production pathway from pyruvate to propionate, PAB require B12 as acofactor for the methylmalonyl-CoA mutase to isomerise succinyl-CoA to methylmalonyl-CoAconversion (Vorobjeva 1999; Thierry et al. 2011). Although the biosynthesis of B12 in PABtakes place via the anaerobic route, one of the steps in the biosynthesis of DMBI, however,requires oxygen (Renz 1999; Hugenholtz et al. 2002; Deptula et al. 2015). Thus, the availabilityof oxygen during the fermentation regulates the production of active B12 or of analogues witha non-DMBI lower ligand (Renz 1999; Deptula et al. 2015). In PAB, the availability of DMBIby de novo synthesis or external supplementation is a critical factor for the production ofhuman-active B12. Only a brief summary of the key steps of B12 biosynthesis in P.freudenreichii is presented with a focus on the biosynthesis of the lower ligand in the lattersection.
The biosynthesis of B12 deviates from other tetrapyrroles (e.g. chlorophyll, heme) from thecommon precursor uroporphyrinogen III (Figure 4). After methylation to form precorrin-2,further reactions up to the synthesis of the intermediate adenosylcobinamide – the B12 lackingthe nucleotide moiety – proceed either via an oxygen-dependent pathway or anaerobic route(Roth et al. 1996). The aerobic pathway requires molecular oxygen to produce precorrin-4 in aprocess of ring contraction, whereas Co is inserted into precorrin-2 during anaerobic B12biosynthesis to form Co-precorrin-2 (Moore and Warren 2012). After several steps, Co isinserted into the fully contracted corrin ring in the aerobic route. Adenosylcobinamide is theultimate intermediate in both pathways, which is then joined by -ribazole 5 phosphate tocomplete the biosynthesis (Figure 2). Before the final reaction takes place, adenosylcobinamidemust be activated into adenosylcobinamide-GDP (guanosine diphosphate) by the CobV orCobS protein (Roth et al. 1996).
The biosynthesis of the nucleotide loop base DMBI (Figure 4) again differs in aerobic andanaerobic microorganisms. The DMBI part of B12 is synthesised, depending on themicroorganisms, either aerobically (e.g. P. freudenreichii) from flavin compounds (RF, FMN,flavin adenine dinucleotide (FAD)) or without oxygen via the anaerobic route (e.g. Eubacteriumlimosum) from a combination of glycine, formate, glutamine and erythrose-4-phosphate (Höriget al. 1978; Warren et al. 2002). Although P. freudenreichii synthesises adenosylcobinamideanaerobically, the DMBI part is synthesised via the aerobic route from FMN (Renz andWeyhenmeyer 1972; Hörig et al. 1978; Deptula et al. 2015).
2.6.3 Biosynthesis of DMBI in Propionibacterium freudenreichiiEven after a detailed understanding of B12 biosynthesis was gained, the exact mechanism forDMBI biosynthesis remained unclear until recently. Taga et al. (2007) confirmed for the first

2 Review of the literature
23
time that the single enzyme BluB was responsible for the formation of DMBI from reducedFMN in a soil bacterium Sinorhizobium meliloti (Figure 5). This mechanism, found in aerobicor aerotolerant microorganisms, requires molecular oxygen (Renz and Weyhenmeyer 1972;Taga et al. 2007). Deptula et al. (2015) recently confirmed in P. freudenreichii subsp. shermaniiDSM 4902 that a fused enzyme (BluB/CobT2) carries out both the formation of DMBI and itsactivation into the nucleotide (Figure 5). In Salmonella enterica, DMBI is synthesisedaerobically, but the bacterium produces pseudovitamin B12 and 2-methyladenylcobamide withnon-DMBI lower ligands during anaerobic growth (Keck and Renz 2000).
Figure 5. Aerobic biosynthesis of 5,6-dimethylbenzimidazole (DMBI) from reduced flavin mononucleotide(FMN) (derived from riboflavin (RF), FMN or flavin adenine dinucleotide (FAD)) by the BluB enzyme (adoptedfrom Taga et al. 2007). BluB is fused with CobT in Propionibacterium freudenreichii, which both transforms andactivates DMBI into -ribazole-phosphate (Deptula et al. 2015).
Flavin compounds are the substrate for DMBI biosynthesis in P. freudenreichii in the presenceof oxygen and this was already shown to be the case in the 1970s (Renz 1970; Renz andWeyhenmeyer 1972; Hörig and Renz 1977; Hörig et al. 1978). The first direct evidence of RFas the precursor of DMBI in P. freudenreichii was produced by Renz (1970) through studyingthe incorporation of 14C-labelled RF into the B12 structure by the cell homogenates of P.

24
freudenreichii during aerobic incubation. In further experiments performed with differentlylabelled RF (Renz and Weyhenmeyer 1972; Hörig and Renz 1977; Hörig et al. 1978), DMBIwas shown to be derived from RF. The biological forms of RF – FMN and FAD – were foundto be better substrates for the synthesis of DMBI than RF was; FMN being the immediatesubstrate in this transformation (Hörig and Renz 1980). The exact mechanisms behind DMBIbiosynthesis in the aerobic pathway remained unclear until the discovery of the BluB protein(Gray and Escalante-Semerena 2007; Taga et al. 2007). After the discovery of theRhodospirillum rubrum BluB homologue in the sequence of P. freudenreichii CIRM-BIA1T
(Falentin et al. 2010), Deptula et al. (2015) confirmed that a fused enzyme (BluB/CobT2)carries out the transformation of reduced FMN into DMBI and its activation into -ribazole-phosphate (Figure 5).
2.6.4 Availability and activation of the lower ligand: Production of active B12 or itsanalogues
Before the final step in the biosynthesis of B12, the lower ligand is activated by the CobTenzyme into the phosphoribosylated base through the transfer of the ribose-phosphate moietyof nicotinate mononucleotide (NaMN) while releasing nicotinate (Maggio-Hall and Escalante-Semerena 1999). A number of B12 analogues are synthesised by microorganisms, clearlydemonstrating that other nucleotide bases are also incorporated into adenosylcobinamide toform alternative cobamides (Renz 1999; Taga and Walker 2008; Crofts et al. 2013). Studies ofthe substrate specificity of the CobT homologues from different organisms have shown that theCobT enzyme can activate a range of lower ligands (Crofts et al. 2013); DMBI, however, is thepreferred substrate for CobT homologues (Hazra et al. 2013). These recent findings were inagreement with the production of either active B12 or other human-inactive forms dependingon the availability of DMBI or its de novo synthesis, for example in S. enterica (Anderson etal. 2008; Chan et al. 2014) and P. freudenreichii (Deptula et al. 2015). A lack of DMBI couldlead to the production of pseudovitamin B12 and other analogues in P. freudenreichii(Vorobjeva 1999; Deptula et al. 2015). The CobT homologue of the lactic acid bacteria L.reuteri only activates adenine (Crofts et al. 2013), thus only producing pseudovitamin B12 evenwhen DMBI is provided (Santos et al. 2007). Therefore, the availability of the lower ligand andthe specificity of the CobT enzyme dictate the production of active or inactive B12 forms (Renz1999; Crofts et al. 2013).
2.7 Active B12 production with food-grade Propionibacterium freudenreichiiThe fact that P. freudenreichii prefers to synthesise active B12 and that other B12-synthesisingbacteria allowed for use in foods are unable to produce active B12 makes P. freudenreichii apotential candidate for the natural enrichment of B12 in foods. However, P. freudenreichiistrains differ considerably in terms of their B12 production (Hugenschmidt et al. 2010) and thebiosynthesis of DMBI has been reported to be a key factor limiting B12 biosynthesis (Martenset al. 2002). With insufficient DMBI, the biosynthesis could lead to the production of inactiveB12 forms or it could remain incomplete as adenosylcobinamide (Vorobjeva 1999). Forindustrial B12 production, DMBI is supplemented after the first 3 days of anaerobicfermentation and then shifted to an aerobic incubation for another 3 4 days (Martens et al.
2 Review of the literature
25
2002). The early addition of DMBI has been shown to suppress growth and B12 production(Marwaha et al. 1983). However, DMBI cannot be added to foods; B12 production in foodsneeds to be undertaken with food ingredients that are permitted in food applications. As DMBIis synthesised from RF in P. freudenreichii and its biosynthesis could be enhanced by niacin(Hörig and Renz 1980), these food-grade DMBI alternatives can be considered for in situ B12production in foods. Availability of these two vitamins likely enhances active B12 productionin food fermentation, possibly through enhanced biosynthesis of DMBI and its activation intothe nucleotide leading to the complete biosynthesis of active B12.
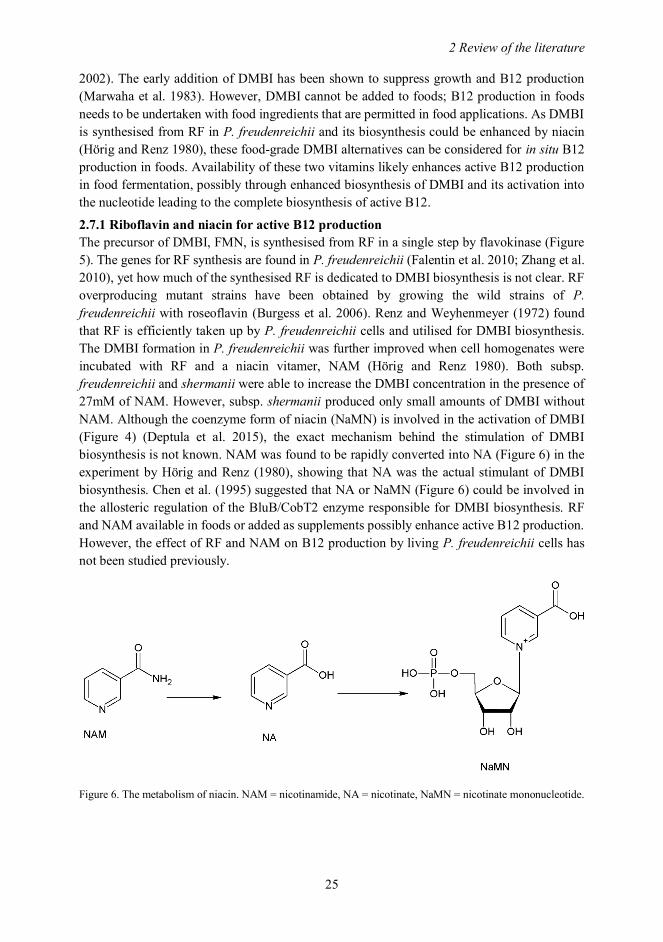
2.7.1 Riboflavin and niacin for active B12 productionThe precursor of DMBI, FMN, is synthesised from RF in a single step by flavokinase (Figure5). The genes for RF synthesis are found in P. freudenreichii (Falentin et al. 2010; Zhang et al.2010), yet how much of the synthesised RF is dedicated to DMBI biosynthesis is not clear. RFoverproducing mutant strains have been obtained by growing the wild strains of P.freudenreichii with roseoflavin (Burgess et al. 2006). Renz and Weyhenmeyer (1972) foundthat RF is efficiently taken up by P. freudenreichii cells and utilised for DMBI biosynthesis.The DMBI formation in P. freudenreichii was further improved when cell homogenates wereincubated with RF and a niacin vitamer, NAM (Hörig and Renz 1980). Both subsp.freudenreichii and shermanii were able to increase the DMBI concentration in the presence of27mM of NAM. However, subsp. shermanii produced only small amounts of DMBI withoutNAM. Although the coenzyme form of niacin (NaMN) is involved in the activation of DMBI(Figure 4) (Deptula et al. 2015), the exact mechanism behind the stimulation of DMBIbiosynthesis is not known. NAM was found to be rapidly converted into NA (Figure 6) in theexperiment by Hörig and Renz (1980), showing that NA was the actual stimulant of DMBIbiosynthesis. Chen et al. (1995) suggested that NA or NaMN (Figure 6) could be involved inthe allosteric regulation of the BluB/CobT2 enzyme responsible for DMBI biosynthesis. RFand NAM available in foods or added as supplements possibly enhance active B12 production.However, the effect of RF and NAM on B12 production by living P. freudenreichii cells hasnot been studied previously.
Figure 6. The metabolism of niacin. NAM = nicotinamide, NA = nicotinate, NaMN = nicotinate mononucleotide.

26
2.7.2 Effect of cobalt, fermentation conditions and carbon sources on B12 productionBerry and Bullerman (1966) found that a Co level of 5 μg/mL was sufficient to produce a goodlevel of B12 (15 μg/mL) by a P. freudenreichii strain in whey medium supplemented with yeastextract. Higher than 5 μg/mL Co levels did not increase the yield, which was also seen in thestudy by Hugenschmidt et al. (2011). However, the natural level of Co in food media is wellbelow this optimised level of 5 μg/mL. For example, B12 production increased byapproximately 3-fold in supplemented whey permeate medium (440 ng/mL) following 5 μg/mLof Co addition compared to only 140 ng/mL without supplementation (Hugenschmidt et al.2011). The Co additions increased the B12 level in tempeh production with Citrobacter freundiior Klebsiella pneumonie by approximately 2.3-fold (Keuth and Bisping 1994).Supplementation with Co and DMBI is standard practice to increase the B12 yields in industrialB12 production (Burgess et al. 2009).
The B12 manufacturing process with P. freudenreichii is usually divided into two phases:anaerobic growth (3 days) for the synthesis of adenosylcobinamide followed by 3 4 days ofaerobic fermentation for DMBI synthesis and completion of B12 biosynthesis (Ye et al. 1996;Martens et al. 2002). Even though P. freudenreichii is able to grow at a moderate oxygenconcentration, the production of B12, however, is considerably reduced in an aerobicfermentation with > 80% oxygen concentration (Quesada-Chanto et al. 1998a). Nevertheless,oxygen is essential for DMBI biosynthesis in P. freudenreichii, which otherwise producesinactive B12 compounds or results in accumulation of the intermediate biosynthetic products(Vorobjeva 1999; Hugenholtz et al. 2002).
A number of carbon sources are utilised by P. freudenreichii such as lactate, glucose and lactose(Hettinga and Reinbold 1972; Falentin et al. 2010); the lactose utilisation, however, is strain-dependent (Loux et al. 2015). Lactate is the preferred substrate for P. freudenreichii (Piveteau1999); it may be able to utilise fructose but cannot metabolise maltose and sucrose (Vorobjeva1999; Loux et al. 2015). Other carbon sources which P. freudenreichii can metabolise aremannose, glycerol, inositol and galactose (Falentin et al. 2010; Koskinen et al. 2015). On theother hand, P. acidipropionici metabolises diverse carbon sources, including sucrose andmaltose (Parizzi et al. 2012). The main fermentation metabolites of PAB are propionate andacetate; their relative proportion is affected by the carbon substrates and the presence of oxygen(Piveteau 1999). An excess of propionate is inhibitory for the growth of P. freudenreichii andB12 production (Hsu and Yang 1991; Vorobjeva 1999) and that is why the accumulated acidsare usually neutralised in commercial B12 manufacturing (Martens et al. 2002). In foodfermentation, propionate and acetate are beneficial as antifungal agents to improve the storageperiod of the products (Suomalainen and Mäyrä-Makinen 1999; Vorobjeva 1999).
2.8 Potential of in situ B12 fortification in plant-based foodsSome plant-based food sources are reported to contain B12 levels ranging from a trace amountto a nutritionally relevant level (Watanabe et al. 2013). Fermented beans such as tempeh (0.78 μg/100 g) and natto (0.1 1.9 μg/100 g), cabbage fermented with PAB (7.2 μg/100 g),fermented tea (0.1 0.5 μg/ 100 g dry weight), edible algae, for example dried green and purplelavers (133 μg/100 g dry weight) and some edible mushrooms (0.01 2.65 μg/100 g dry weight)

2 Review of the literature
27
may be suitable B12-containing foods for vegetarians (Watanabe et al. 2013). In addition, B12-enriched vegetables have been produced such as lettuce leaves produced using hydroponics(Bito et al. 2013) and Japanese radish sprouts prepared by soaking in a 200-μg/mL B12 solution(Sato et al. 2004). Some of the values reported for these products may include inactive B12compounds when the analytical methods used were less specific (e.g. MBA). Nevertheless, thelow level of B12 content in these products and their inconvenience for incorporating into one’sdaily diet shows the need for more convenient plant-based B12 food sources.
The prospect of using the lactic acid bacteria L. reuteri strains for B12 enrichment in fermentedcereal and soy-based products has been suggested in previous studies (Taranto et al. 2003;LeBlanc et al. 2010; Capozzi et al. 2012; Molina et al. 2012; Gu et al. 2015). Taranto et al.(2003), for the first time, reported that the lactic acid bacterium L. reuteri CRL1098 producesB12, which in a later study (Santos et al. 2007) actually turned out to be pseudovitamin B12.So far, L. reuteri has not been shown to produce active B12 (Santos et al. 2007; Crofts et al.2013; Varmanen et al. 2016). Therefore, P. freudenreichii remains the only known food-gradespecies to produce active B12 but it has not yet been fully exploited for in situ B12 fortificationin plant-based fermented food products. However, P. freudenreichii strains have previouslybeen utilised to increase the B12 content of dairy products. The B12 content of a 7-dayfermented kefir was increased from 2.2 μg/100 mL in control samples to 9.2 μg/100 mL byincorporating P. freudenreichii cells during kefir production (Van Wyk et al. 2011).
Cereal materials are commonly fermented to improve the technological, functional andnutritional qualities of the finished products (Salovaara and Simonson 2004). They containfermentable sugars and a good level of minerals and vitamins, which are needed for the growthof the fermenting microorganisms (Salovaara and Simonson 2004). For example, the folatecontent of cereal matrices was increased several-fold by fermentation with lactic acid bacteriaand yeasts (Capozzi et al. 2012; Kariluoto et al. 2014). The ability of Propionibacterium sp.ABM 5378 to produce folate in cereal matrices (25 40 ng/g) was demonstrated in the study byKariluoto et al. (2014). Although known for active B12 production, to the best of ourknowledge, the use of P. freudenreichii for in situ B12 fortification of cereal matrices has notbeen previously reported. The fermentable sugars in cereals vary between 2 5%, with ryecontaining a higher level of free sugars than other cereals do (Salovaara and Simonson 2004).Glucose or other sugars can be added to the matrices, or matrices rich in fermentable sugarssuch as malted flours can be utilised for improving the growth of P. freudenreichii. Therefore,cereal matrices could be a good medium for the in situ production of B12.
The Co content of cereals and cereal products range from < 10 up to 60 ng/g dry matter, withwhole grain flours and the bran fraction containing the highest amounts (Hokin et al. 2004;Ekholm et al. 2007). The distribution of Co in cereal grains and other plant foods variesaccording to soil factors and the plant genotypes (Kabata-Pendias and Mukherjee 2007). Forexample, Egyptian wheat grains contained several-fold higher Co (160 380 ng/g) as comparedto trace levels (1.1 18 ng/g) in wheat grains grown in Norway and Sweden (Kabata-Pendiasand Mukherjee 2007). Likewise, Australian wheat varieties varied widely in terms of their Colevel (13 231 ng/g). However, the availability of Co from cereal materials during aqueousprocessing for B12 production is not clear.

28
2.9 Stability of B12 compounds in food processesB12 is a relatively stable vitamin if foods are stored at room temperature and protected fromlight, and aqueous solutions of B12 compounds are also found to be stable during autoclaving(120 °C/20 min) and boiling (Ball 2006). CNCbl is more stable than the coenzyme B12 formsare. AdoCbl and MeCbl in aqueous solutions are instantly converted into OHCbl on exposureto light (Juzeniene and Nizauskaite 2013). Even CNCbl is converted into OHCbl if it is notprotected from light. The photo-conversion does not affect the biological activity of the B12forms as long as the reaction is limited to the alteration of the upper ligand (Sych et al. 2016).However, OHCbl is further degraded by strong oxidising agents such as ascorbic acid, sulphiteand iron(II) salts (Ball 2006; Ahmad et al. 2014). The B12 present in raw foods is generallystable because it is mostly protected from light and usually exists as found-forms with foodproteins (Sych et al. 2016).
Processing of foods, however, could significantly destroy the natural B12 levels. Theknowledge on the retention of B12 during different food processes is rather limited to foodpreparations related to meat, milk and fish. With these products, the losses during cooking,grilling or stir-frying were in the range of 22 35% (Bennink and Ono 1982; Lešková et al.2006). Czerwonka et al. (2014) found that grilling, roasting and frying beef could lead to theloss of 28.4%, 36.2% and 48.7% of the B12 content compared to that of the raw meat,respectively. The losses partly resulted from the release of moisture and fat from the meatduring the cooking processes. Likewise, cooked herring contained 47% less B12 after boilingin water (5 min), 41% after steaming (9 min), 43% after frying (4 min) and 59% after grilling(7.5 min) or microwaving (500 W; 1 min) than the original B12 content in the raw fish(Nishioka et al. 2011). The microwaving of raw beef and pork for 6 min at 500 W resulted inan approximate loss of 30 40% of B12, whereas the destruction of B12 in cow milk was evengreater (48%) (Watanabe et al. 1998).
Information on the stability of added B12 compounds or microbiologically produced B12during the preparation of plant-based foods is scarce. Studies are, however, available for thestability of folate in baking and other cereal processes (Gujska and Majewska 2005; Andersonet al. 2010). In a baking powder-leavened breadmaking process with added folate and CNCbl,almost 19 23% of the added CNCbl was lost in the baking process (Winkels et al. 2008).Approximately 45% of the fortified CNCbl in the wheat flour was destroyed during wheat-dough baking, as found in the wheat flour B-enrichment programme in France (Czernichow etal. 2003). Clearly, studies on the retention of the naturally introduced B12 in food systemsduring food processes and storage are needed.

3 Aims
29
3 AimsThe main aim of this study was to investigate active B12 fortification in food matrices byfermentation with food-grade P. freudenreichii and to develop sensitive and selective methodsfor B12 analysis.
The specific objectives were:
1. To develop UHPLC methods for sensitive and selective quantitation of active B12 andLC–MS methods for its accurate identification (Studies I, III).
2. To study active B12 production by food-grade Propionibacteria focusing on theavailability of the lower ligand precursors (Study II).
3. To study in situ active B12 fortification in aqueous cereal matrices (Study III).4. To study the stability of in-situ produced B12 during breadmaking (Study IV).

30
4 Materials and methods
4.1 Propionibacteria strainsAltogether, 30 PAB strains (256–266; 274–292) were studied for their B12 production in whey-based medium (WBM) in Study II (Table 3) and 3 of the P. freudenreichii strains (256, 263and 266) were selected for B12 production in the cereal matrices prepared from barley maltflour (BM; 33% w/v), barley flour (BF; 6% w/v) and wheat aleurone (AM; 15% w/v) in StudyIII. P. freudenreichii strain 266 was the starter culture used for the fermentation of theexperimental barley and rye malt matrices in Study I, whereas the malt-extract medium (MEM)used in the baking stability study (Study IV) was fermented with P. freudenreichii 282 (typestrain). Three of the 30 PAB strains (278—280) were P. acidipropionici species, while the restof the strains belonged to the species P. freudenreichii. Strains that had both probable cereal(274 280) and dairy (256–266 and 281–292) origins were included in this study (Table 3).Table 3. Propionibacteria (PAB) strains (27 Propionibacterium freudenreichii and 3 Propionibacteriumacidipropionici) with their sources of isolation studied for B12 production in whey-based medium (WBM) (StudyII). The strains used in other studies are highlighted.
Dairy origins(Valio Ltd., Helsinki,Finland)
Cereal origins(Polttimo Ltd., Lahti,Finland)
Culture collection(DSMZ, Braunschweig,Germany)
P. freudenreichii P. freudenreichii P. freudenreichii subsp.shermaniiDSM 4902256 (III) 283 274
257 284 275 281
258 285 276 P. freudenreichii subsp.freudenreichii DSM 20271259 286 277
260 287 P. acidipropionici 282 (IV)
261 288 278
262 289 279
263 (III) 290 280
264 291
265 292
266* (I, III)* Strain isolated from a cheese starter culture (Study I)
4.2 Preparation of the fermentation media4.2.1 Whey-based medium (Study II)WBM (pH 6.4) was prepared by following the method by Hugenschmidt et al. (2010) usingdemineralised whey powder (Demi 50; Valio Ltd., Helsinki, Finland). The medium per Lcontained 60 g of whey-extract, 10 g of granulated yeast extract (Merck, Darmstadt, Germany),13 g of sodium D/L-lactate syrup (60% w/v; Sigma-Aldrich, Steinheim, Germany), 0.1 g ofTween 80 (Sigma-Aldrich), 0.2 g of MgSO4 (Merck), 0.02 g of Mn(II)SO4 (Merck), 1 M ofpotassium phosphate buffer (Merck) and 5 mg of CoCl2 (Sigma-Aldrich).

4 Materials and methods
31
4.2.2 Cereal matrices (Studies I, III) and malt-extract medium (Study IV)The cereal flours were mixed in boiling MilliQ water and cooked for 2 min. The matrices wereautoclaved (121 °C; 15 min) and then allowed to cool. Before the inoculation, the matrices wereaseptically weighed (20 g) in 50-mL Falcon tubes. A filter-sterilised (0.2 μm) solution of CoCl2
was added to the matrices (5 μg/g) studied for B12 production with added Co.
The MEM (pH 6.4) per L contained 100 g of barley malt extract (Laihian Mallas Ltd., Laihia,Finland), 8 g of sodium D/L-lactate syrup, 5 g of tryptone (Sigma-Aldrich), 1 M of potassiumphosphate buffer and 5 mg of CoCl2. Barley malt extract and lactate syrup were dissolved inMilliQ water, adjusted to pH 6.4 with the phosphate buffer, filled to the mark with MilliQ waterand centrifuged. The supernatant was separately autoclaved from the tryptone stock solution(0.2 g/mL in MilliQ water) and mixed just before the fermentation experiment. A filter-sterilised (0.2 μm) stock solution of CoCl2 was added to obtain the final medium.
4.3 Supplementation with precursorsPreliminary study (reported in this thesis)
The B12 production in WBM without and with Co supplementation was investigated with twoP. freudenreichii strains: 256 and 266. In addition, ten P. freudenreichii strains (256 266) werecompared for their B12 production in WBM with Co and DMBI co-supplementation beforecarrying out the detailed experiments reported in Study II.
Actual supplementation (Studies II, III)RF (40 μM), the co-addition of RF and NAM (27 mM) or DMBI (100 μM) was added to WBM(Study II) or to the cereal matrices (Study III) intended for the respective supplementation. RFand NAM were added on day 0 based on Study II, whereas DMBI was supplemented on day 6of the fermentation (Hugenschmidt et al. 2010). The effect of the RF and NAM co-supplementation time (day 0, 3 and 6) on B12 production in WBM was optimised with P.freudenreichii strains 256 and 266 (Study II).
4.4 Fermentation and monitoringThe cryopreserved ( 80 °C) cultures of the strains in glycerol were transferred onto propionicagar medium (Study II) and then incubated for 3–4 days at 30 °C under anaerobic conditions(Anaerocult C, Merck, Germany). To perform three biological replicate fermentations for eachstrain, three individual colonies were separately sub-cultured three times in WBM withoutCoCl2. To prepare fermented MEM for the baking experiments in Study IV, the colonies werepropagated in MEM without CoCl2. For B12 production experiments, the final cultures wereinoculated (1%) in 20 mL of WBM (Study II), in 20 g of the cereal matrices (Study III) or in300 mL of MEM (Study IV).
The inoculated media were incubated for 7 days at 30 °C, first for 72 h under anaerobicconditions (Anaerocult C, Merck) and then for a further 96 h under aerobic incubation andshaking conditions (150 rpm). To create the aerobic atmosphere, the tubes/bottles were openedin sterile conditions and then closed again.

32
The growth was monitored by measuring the optical density (600 nm; OD600) after 168 h ofincubation for WBM (Study II) and MEM (Study IV), and by counting the viable cell counts(cfu/g) at the beginning and after the 168 h of incubation for the cereal matrices (Study III).The pH was measured before and after the fermentation with a MeterLab pH meter (RadiometerAnalytical, Lyon, France). The B12 content of the fermented WBM was determined byanalysing the B12 content in the cell biomass that was obtained. To get the cell biomass, thefermented WBM was centrifuged (12,000 × g; 10 min), the pellet was washed with 10 mL ofPBS buffer (pH 7.3; Oxoid, Hampshire, UK) and centrifuged once again. Fermented cerealmatrices were analysed directly to measure the B12 content. The cell biomasses, supernatantand the fermented cereal matrices were stored at 20 °C.
4.5 B12 stability during breadmaking (IV)The stability of B12 in breadmaking was studied for added compounds (CNCbl and OHCbl)and B12 produced in situ in MEM with P. freudenreichii strain 282 under normal bakingconditions (i.e. in daylight/laboratory lighting conditions and at room temperature). Thestability was investigated for three breadmaking processes: straight-dough, sponge-dough andsourdough baking.
4.5.1 Stability of cyanocobalamin and hydroxocobalaminStraight- and sponge-dough bakingStraight-dough and sponge-dough breads were prepared (Study IV) from white wheat flour(75% extraction rate) according to the recipe given in Table 4 and the process shown in theflowchart (Figure 7). For each baking experiment, fresh CNCbl and OHCbl standard solutions(ca. 0.20.4 mg/mL) were prepared in water under subdued light and kept protected fromexposure to light.
Table 4. Recipe for each dough replicate used for straight-dough, sponge-dough and sourdough breadmaking.
Dough type Ingredient Weight (g) The mass ratio to flourmass (%)
Straight- orsponge-dough Wheat flour 400 100
Tap water or fermented MEM 238 59.5Fresh yeast 16 4Sugar 12 3Margarine 12 3Salt 4 1
Sourdough Rye flour 281 100Tap water or fermented MEM 243 86Sourdough seed 20 7Salt 5 1.7

4 Materials and methods
33
Figure 7. A simplified flow chart of the three baking processes used to study the stability of added standardcompounds and the in situ-produced B12 in the breadmaking. MEM = malt-extract medium.
The straight-dough baking was repeated three times: without added CNCbl or OHCbl (controlbreads) and with added B12 compounds (fortified breads). The baking experiment wasreplicated twice for sponge-dough baking. For both of these processes, the standard B12compounds were added (ca. 0.5 mg/recipe) after the initial mixing of the ingredients andsamples were taken during the baking processes.
Sourdough bakingFor the sourdough breadmaking, the B12 compounds were added before the 16-h fermentation(Test 1) and after the fermentation to follow the effect of fermentation on the stability of CNCblor OHCbl (Test 2) (Figure 7). The typical sourdough baking process is shown in Figure 7. Theingredients (Table 4) and the details of the dough preparation can be found in Study IV.
4.5.2 Stability of in situ-produced B12Straight-dough and sourdough baking were investigated to study the stability of the in situ-produced B12 in the MEM by P. freudenreichii (Study IV). Water in the recipe (Table 4) wasreplaced by the fermented MEM before the 16-h fermentation. Two straight-dough bakingexperiments were performed, in triplicates, with fermented MEM (three biological replicatefermentations) containing low (190 ng/mL; Trial 1) and high (690 ng/mL; Trial 2) B12 contents.
1st mixing(Wheat flour, sugar, salt and water or
fermented MEM)
2nd mixing
Moulding(3 × 150 g)
Proofing(90 min; 36 °C)
Baking(20 min; 180 °C)
CNCbl or OHCbl
1st mixing(half of flour, baker’s yeast and water)
Pre-proofing(2 h; room temperature)
2nd mixingRemaining ingredients were added
Moulding(3 × 150 g)
Proofing(90 min; 36 °C)
Baking(20 min; 180 °C)
1st mixing(Sourdough starter, rye flour and water
or fermented MEM)
Fermentation(16 h; 30 °C)
2nd mixing and resting (60 min; 30 °C)Remaining rye flour and salt were added
Moulding(3 × 150 g)
Proofing(30 min; 30 °C)
Baking(70 min; 180 °C)
CNCbl or OHCbl (Trial 1)
CNCbl or OHCbl (Trial 2)
Straight-dough baking Sponge-dough baking Sourdough baking

34
4.6 B12 analysisThe B12 production by PAB in WBM is reported as volumetric yield (μg/mL) or cellular B12yield (μg/g fresh cells) after analysing the B12 contents in samples of the cell biomass that wasobtained. The B12 contents of fermented cereal matrices (wet weight basis) and bread samples(dry matter basis) are expressed as μg/g. The reported results are averages of three replicatefermentations, with each sample being analysed as a single replicate unless otherwise stated.
4.6.1 ExtractionB12 compounds in the cell pellets (Studies I, II, IV), fermented cereal matrices (Studies I, III),freeze-dried baking samples (Study IV) or in the reference and experimental samples in StudyI were extracted in their cyano form by heat extraction (100 °C; 30 min) with sodium cyanide.Cell pellets (0.1–0.2 g), fermented samples (1–5 g), baking samples (0.2–0.5 g) or BCR 487pig liver (0.1 g) were extracted to get the final extract volume of 25 mL, according to the methodexplained in Study I. For cereal samples, the sample suspensions were incubated (37 °C; 30min) with -amylase (50 mg) before the heat-extraction stage. The cell extracts were directlyanalysed with the UHPLC method, whereas other samples were first purified in theimmunoaffinity columns.
4.6.2 Immunoaffinity purification (Studies I, III, IV)The B12 extract (5–15 mL) was filtered (0.45 μm; Pall, USA) and loaded onto theimmunoaffinity column (R-Biopharma; Glasgow, UK) after the buffer filling the column wasdrained. After washing the column with MilliQ water (10 mL), the retentate was eluted withmethanol (3.5 mL) followed by evaporation under a stream of nitrogen at 50 °C. The residuewas recovered in 300 μL of MilliQ water and filtered (0.2 μm; Pall) into the LC vial (Waters).
4.6.3 Ultra-high performance liquid chromatography (Studies I–IV)For B12 analysis, a Water’s Acquity UPLC system (Waters Inc.; Milford, MA, USA) with aPDA detector (210–600 nm) was used. The chromatogram was recorded at 361 nm. The systemconsisted of a binary solvent manager, an autosampler maintained at 4 °C and a columnmanager operated at 30 °C. The solvent flow was a gradient mixture of MilliQ water (A) andacetonitrile (B) containing 0.025% trifluoroacetic acid (TFA): 0 0.5 min (95:5), 0.5 5 min(95:5 to 60:40), 5 6 min (60:40) and 6 10 min (60:40 to 95:5). The sample injection volumewas 5 15 uL. In each sample set, a new calibration curve was obtained by injecting CNCblstandards (0.015 0.75 ng/μL). To prepare a CNCbl stock solution (200 μg/mL), CNCbl wasdissolved in 25% ethanol/MilliQ water and its actual concentration was confirmed by thespectrophotometric method described by Indyk et al. (2002).
Ultra-high performance liquid chromatography method optimisation (Study I)
The effect of the solvent flow rate (0.320.50 mL/min) and the use of the reversed-phaseethylene bridged hybrid (BEH) or high-strength silica (HSS) T3 C18 columns with identicaldimensions (2.1 × 100 mm; 1.8 μm and 1.7 μm) were compared. The columns were evaluatedfor the linearity of the calibration curve, the peak resolution and height. The chromatographicmethod for the selected column was evaluated for the limit of detection (LOD; signal-to-noiseratio, S/N = 3) and quantitation (LOQ = 3 × LOD).

4 Materials and methods
35
Method validation (Study I)
The optimised method was validated by the recovery tests. Control rye and barley malt matrices(n = 3; 1.5 g) in Study I were spiked with two levels of a known amount of CNCbl (17.7 ng and53.1 ng). CNCbl was extracted, purified on an immunoaffinity column and analysed with theoptimised UHPLC method. The spiked B12 extraction buffer (17.7 ng) was also tested forrecovery following the immunoaffinity purification. The developed method was evaluated byanalysing the extract of the immunoaffinity purified reference material (BCR 487 pig liver) andthe experimental fermented matrices.
4.6.4 Mass spectrometry (Studies I III)In the first two studies (Studies I, II), the mass spectrometric confirmation of the active B12and its analogues was carried out on an ion-trap mass spectrometer (Bruker Daltonics, Bremen,Germany). In Study III, a high-resolution quadrupole time-of-flight (QTOF) mass spectrometer(Synapt G2-Si; Waters, Milford, MA, USA) was used. The ionization technique in bothmethods was an electrospray (ESI) operated in a positive ion mode interfaced to the WatersAcquity UPLC system. The sample injection volume was 1 2 μL. The mobile phase for MScontained 0.1% formic acid, replacing the 0.025% TFA used in UHPLC.
In ion-trap MS (Studies I, II), the m/z scan range was 900–1400 and the protonated target ionswere isolated and fragmented (tandem mass spectrometry (MS/MS)). For the QTOF MS (StudyIII), an m/z scanning range of 50–1500 was applied. Protonated doubly charged parent ionswere detected, isolated and fragmented. The instrument settings can be found in Studies I andIII.
4.6.5 Microbiological assay (Studies I, III, IV)The unpurified sample extracts were analysed by MBA using the assay organism L. delbrueckiiATCC 7830 and CNCbl as a calibrant on a 96-well microtiter plate (Corning, NY, USA). Acalibration curve based on the growth (turbidity measurement at 595 nm) for the calibrantamounts (0 8 pg/well) was used to determine the concentration of B12 in the extracts analysedin duplicates. The reference material BCR 487 (certified B12 content: 1120 ± 90 ng/g dm) wasalways included in each assay.
4.7 Analysis of other components and fermentation metabolites4.7.1 Riboflavin (Study II)An optimised UHPLC method based on the European standard HPLC method (EN 14152:2014)was used to measure the RF content of the unsupplemented control and fermented WBM (StudyII). B2 vitamers were extracted as RF following the heat (100 °C; 60 min) and enzymatic (Taka-diastase and -amylase) extraction (24 h at 37 °C). The analysis was performed on the WatersAcquity UPLC with an Acquity BEH C18 column (2.1 mm × 100 mm; 1.7-μm particles) byfluorescence detection (excitation 444 nm and emission 520 nm). The elution was the isocraticflow (0.2 mL/min) of 20 mM ammonium acetate in 30% aqueous methanol.

36
4.7.2 Sugars and organic acids (Studies II, III)Lactose and lactic acid in WBM (Study II), and glucose, fructose and maltose in the cerealmatrices (Study III) were measured in the control and fermented media. The production ofpropionic fermentation metabolites, propionic acid and acetic acid was determined in thefermented samples (Studies II, III). The sugars and acids were analysed following the samplepreparation in a Waters HPLC system with refractive index detection for sugars and UVdetection for acids (Hugenschmidt et al. 2010).
4.8 Statistical analysisThe statistical analyses were performed with SPSS versions 20 23 (IBM Inc., NY, USA) usingone-way analysis of variance (ANOVA) with a Tukey’s post hoc test whenever applicable. At-test was used for comparing the B12 results obtained by the UHPLC method and by MBA.The results were considered significantly different for a p value < 0.05.
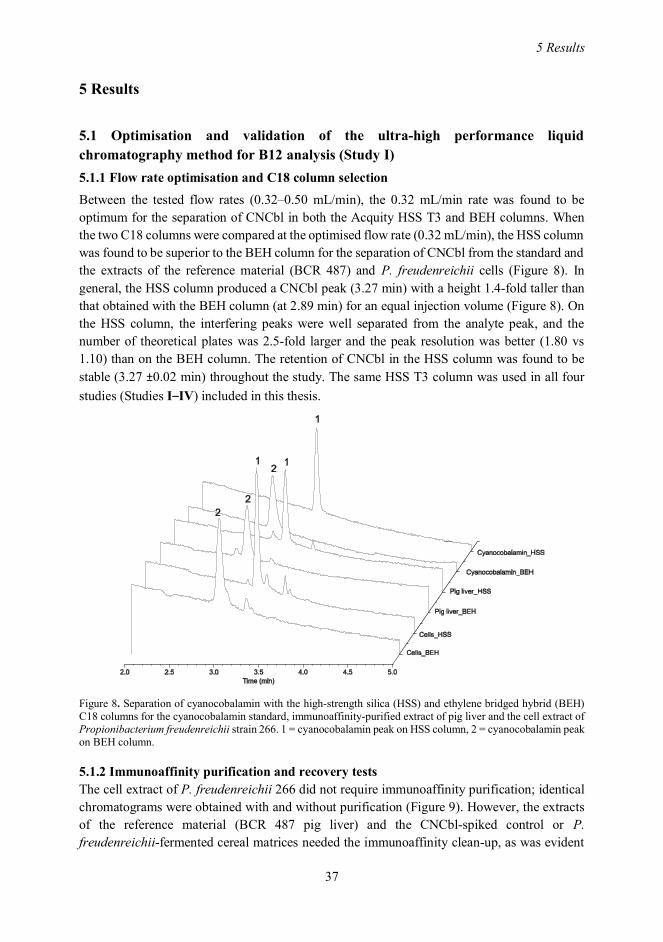
5 Results
37
5 Results
5.1 Optimisation and validation of the ultra-high performance liquidchromatography method for B12 analysis (Study I)5.1.1 Flow rate optimisation and C18 column selectionBetween the tested flow rates (0.32 0.50 mL/min), the 0.32 mL/min rate was found to beoptimum for the separation of CNCbl in both the Acquity HSS T3 and BEH columns. Whenthe two C18 columns were compared at the optimised flow rate (0.32 mL/min), the HSS columnwas found to be superior to the BEH column for the separation of CNCbl from the standard andthe extracts of the reference material (BCR 487) and P. freudenreichii cells (Figure 8). Ingeneral, the HSS column produced a CNCbl peak (3.27 min) with a height 1.4-fold taller thanthat obtained with the BEH column (at 2.89 min) for an equal injection volume (Figure 8). Onthe HSS column, the interfering peaks were well separated from the analyte peak, and thenumber of theoretical plates was 2.5-fold larger and the peak resolution was better (1.80 vs1.10) than on the BEH column. The retention of CNCbl in the HSS column was found to bestable (3.27 ±0.02 min) throughout the study. The same HSS T3 column was used in all fourstudies (Studies I–IV) included in this thesis.
Figure 8. Separation of cyanocobalamin with the high-strength silica (HSS) and ethylene bridged hybrid (BEH)C18 columns for the cyanocobalamin standard, immunoaffinity-purified extract of pig liver and the cell extract ofPropionibacterium freudenreichii strain 266. 1 = cyanocobalamin peak on HSS column, 2 = cyanocobalamin peakon BEH column.
5.1.2 Immunoaffinity purification and recovery testsThe cell extract of P. freudenreichii 266 did not require immunoaffinity purification; identicalchromatograms were obtained with and without purification (Figure 9). However, the extractsof the reference material (BCR 487 pig liver) and the CNCbl-spiked control or P.freudenreichii-fermented cereal matrices needed the immunoaffinity clean-up, as was evident

38
from the chromatograms of the unpurified extracts (Figure 9). A cleaner chromatogram with awell-separated CNCbl peak and improved analytical sensitivity was obtained by introducingimmunoaffinity purification in the sample preparation.
Figure 9. Chromatograms of unpurified and immunoaffinity-purified extracts of BCR 487 pig liver,cyanocobalamin-spiked control malt matrix, fermented rye malt matrix and cells of Propionibacteriumfreudenreichii strain 266. Peak 1 = cyanocobalamin peak.
The mean recovery of CNCbl following the extraction and the immunoaffinity purification ofthe spiked-control rye matrix at two concentrations (17.7 ng and 53.1 ng/1.5 g matrix) wasapproximately 95% with a CV of < 5% (Table 5). Similar recoveries were obtained for thespiked B12-extraction buffer with CNCbl. The results also agreed with those obtained fromMBA without the purification step (Table 5).
Table 5. Recovery of the added cyanocobalamin by microbiological assay (MBA) and by ultra-high performanceliquid chromatography (UHPLC) after immunoaffinity purification. (Study I)
Sample Spikedamount (ng) Recovery, % (RSD, %)
Day 1 Day 2UHPLC MBA UHPLC MBA
0.0 ND ND ND NDRye malt matrix 17.7 97.2 (3.1)a 95.0 (0.9)a 93.8 (5.3)a 98.2 (4.3)a
53.1 96.8 (2.4)a 94.8 (3.7)a 91.2 (2.5)a 96.1 (5.7)a
ExtractionBuffer 17.7 94.6 (1.0)a 92.7 (5.7)a 97.4 (1.9) NA
ND = Not detected; NA = Not analysedValues with dissimilar superscript letters (a and b) along each row indicate a significant difference (p < 0.05).
The validated UHPLC method enabled a detection limit of 0.075 ng/inj (5 μL) andquantification limit of 0.22 ng/inj. Due to the improved sensitivity of the UHPLC system and

5 Results
39
use of immunoaffinity purification, it was possible to analyse samples with a B12 content aslow as 1 ng/g with good reproducibility.
5.1.3 Specificity of the developed ultra-high performance liquid chromatography methodThe reference material (BCR 487 pig liver) and three experimental samples (cell biomass,fermented rye and barley matrices) were analysed to test the applicability of the validatedUHPLC method in comparison to MBA (Table 6). In pig liver and the fermented cerealmatrices, significantly higher B12 contents (17 37%) were obtained with MBA than wereanalysed with the UHPLC method following immunoaffinity purification (p < 0.05). The B12content of the concentrated fermented malt extract (an experimental sample prepared byconcentrating barley malt extract fermented with strains of bacteria producing lactic andpropionic acids) according to the MBA method was 1200 ng/g; however, no CNCbl wasdetected when it was analysed with the UHPLC method (Table 6). Nevertheless, both methodsgave identical B12 contents in the WBM fermented with P. freudenreichii strain 266 (p >0.05).
Table 6. Analysis of B12 with the ultra-high performance liquid chromatography (UHPLC) method and themicrobiological assay (MBA) in reference material pig liver, fermented cereal matrices and the cell biomass ofPropionibacterium freudenreichii strain 266. (Study I)
Sample UHPLC (ng/g) MBA(ng/g)
UHPLC/MBA,%
BCR 487 pig liver (n = 8) 876 (±49)a* 1056 (±80)b* 82.9Fermented rye malt matrix (n = 2 × 2)‡ 19.3 (±1.5)a 28.8 (±2.4)b 67.0Fermented barley malt matrix (n = 2 ×2)‡ 15.7 (±2.4)a 25.0 (±2.3)b 62.8
Cell mass (from fermented WBM) (n = 3)
620 (±90)a#
(ng/mL)650 (±60)a#
(ng/mL)95.4
Concentrated fermented malt-extract(n = 3) ND 1196 ± 56 -
Values are means ± SD.*Dry matter basis; ‡Biological replicates = 2 and analytical replicates = 2; #Expressed per unit volume offermented mediumWBM = Whey-based medium; ND = Not detectedValues with different superscript letters (a and b) along the row indicate a significant difference (p < 0.05)
5.2 Ultra-high performance liquid chromatography–mass spectrometryidentification of the B12 compoundsIn Studies I and II, the identification of active B12 and its analogues was confirmed with theion-trap mass spectrometer. In Study III, a high-resolution QTOF mass spectrometer allowedfor the accurate identification of active B12 and its inactive forms in the cereal matricesfermented with P. freudenreichii strains.
5.2.1 Ultra-high performance liquid chromatography–ion-trap mass spectrometry(Studies I, II)The peak eluting at 3.27 min for the CNCbl standard and the pig liver (Figure 10) produced anion peak in the mass chromatogram when ions with an m/z of 1356 were detected andfragmented. The fragment ions (m/z 1209, 1124, 997, 912) were identical for the peak from theCNCbl standard (Figure 11A) and BCR 487 (Figure 11B). However, no CNCbl peak wasdetected in the immunoaffinity-purified extract of the concentrated fermented malt extract

40
(Figure 10). The peak appearing at 3.16 min had an identical PDA spectrum (210 600 nm) tothat of CNCbl. The MS/MS showed a fragment profile identical to that of CNCbl for molecularions with an m/z of 1345. The m/z 1345 value corresponds to the B12 analogue pseudovitaminB12 with adenine as the lower ligand. On the other hand, the WBM fermented with P.freudenreichii 266, where both the UHPLC and MBA results agreed (Table 6), showed onlythe CNCbl peak and mass spectra identical to those observed for the BCR 487 pig liver.
Figure 10. Ultra-high performance liquid chromatography (UHPLC) chromatograms of immunoaffinity-purifiedextracts of the fermented malt extract (A), BCR 487 pig liver (B) and the cyanocobalamin standard (C). The peaksfor CNCbl (TR = 3.27 min) and pseudovitamin B12 (TR = 3.16 min) are shown. (Study I)
Figure 11. Ion-trap tandem mass spectrometry (MS/MS) of the peaks (Figure 3) eluting at 3.27 min (A;cyanocobalamin) and at 3.16 min (B; pseudovitamin B12).
WBM fermented by 27 P. freudenreichii strains (Table 3) with or without DMBIsupplementation contained only active B12, as shown in the example chromatograms (Figure12A) and the mass spectra obtained with the ion-trap MS/MS (Figures 12C and D). The

5 Results
41
retention time, the PDA spectra (210 600 nm) and the mass spectra of the peaks were allidentical to those of the CNCbl standard. However, the WBM fermented with three P.acidipropionici strains did not contain any active B12. Instead, a peak appeared at 3.16 minwith the mass spectrum identical to that of pseudovitamin B12 when their cell extracts wereanalysed (data not shown).
Figure 12. Ultra-high performance liquid chromatography (UHPLC) chromatograms (A), and ion-trap tandemmass spectrometry (MS/MS) spectra of the cyanocobalamin standard (B) and the cell extracts ofPropionibacterium freudenreichii strain 256 grown in WBM without 5,6-dimethylbenzimidazole (DMBI) (C) andwith DMBI (D). (Study II)
5.2.2 Ultra-high performance liquid chromatography–quadrupole time-of-flight massspectrometry (Study III)With UHPLC–QTOF MS, the B12 compounds in three types of cereal matrices fermented withP. freudenreichii strains 256, 263 and 266 were identified. Similar to those shown in theexample chromatograms (Figure 13A) and QTOF mass spectra (Figure 13C), the matricesfermented with any of the three strains showed a CNCbl peak (3.27 min) in theirimmunoaffinity-purified extracts. The ions of the peaks showed an m/z of 678.2882, identicalwhen the CNCbl standard was run, and upon MS/MS of the parent ions, produced fragmentions having an m/z of 1209.4858, 1124.4423, 997.4788, 912.4494, 359.1023 and 147.0919(Figure 13C). These m/z values perfectly matched with the theoretical m/z of the CNCblfragments, including protonated DMBI (m/z 147.0919), clearly showing that the fermented

42
matrices contained active B12. In addition to active B12, BM supplemented with Co andfermented with P. freudenreichii strain 256 or 266 showed an additional peak at 3.16 min(Figure 13A) in their immunoaffinity-purified extracts. This peak was confirmed with QTOFMS/MS to be pseudovitamin B12 (m/z 672.7752), with adenine as the lower ligand (m/z136.0638) (Figure 13D).
Figure 13. Ultra-high performance liquid chromatography (UHPLC) chromatograms (A) and the quadrupole time-of-flight (QTOF) tandem mass spectrometry (MS/MS) spectra of the chromatographic peaks from thecyanocobalamin standard (B) and the extracts of the barley malt matrix (BM) fermented with Propionibacteriumfreudenreichii strain 256 or 266 with supplementation of cobalt (Co), and Co together with riboflavin (RF) andnicotinamide (NAM) (C and D). C = peak at 3.27 min and D = peak at 3.16 min. (Study III)
5.3 B12 production by Propionibacteria in whey-based medium5.3.1 B12 production without precursor supplementationThe B12 production capacity of 30 PAB strains in WBM without precursor supplementation isshown in Figure 14, reflecting a wide difference in the active B12 synthesis between the strains.

5 Results
43
The 27 P. freudenreichii strains produced a volumetric yield of B12 ranging from 0.45 μg/mL(281) up to 3.35 μg/mL (288). The level of B12 production by P. freudenreichii strains wasreflected in the corresponding RF consumption (Figure 15). More volumetric B12 productionwas achieved by a strain that also depleted the greatest amount of RF, thus producing asignificant positive correlation (p < 0.05; r = 0.84) between the consumption of RF (25 85%)and production of B12. However, the level of RF was similar to the control WBM whenfermented with the P. acidipropionici strains 278 280 (Figure 15), thus being in agreementwith the lack of any active B12 production in these strains (Figure 14). The growth variedwidely between the strains (OD600 1.2 17.8) and the pH changed accordingly (4.7 6.5) fromthe initial value of 6.4 (Figure 1 in Study II).
Figure 14. B12 production by 30 Propionibacteria (PAB) strains in whey-based medium (WBM). The values arethe average of three biological replicate fermentations. The error bars represent standard deviations.
Figure 15. Riboflavin (RF) consumption vs B12 production by 30 Propionibacteria (PAB) strains in whey-basedmedium (WBM). (Study II)
5.3.2 Effect of riboflavin and nicotinamide supplementation time on B12 productionSupplementation with RF and NAM on day 0 or day 3 in WBM produced 2.4-fold more B12by P. freudenreichii strain 266 compared to its production when supplementation was carried
0.0
0.5
1.0
1.5
2.0
2.5
3.0
3.5
4.0
256
257
258
259
260
261
262
263
264
265
266
274
275
276
277
278
279
280
281
282
283
284
285
286
287
288
289
290
291
292
B12
,μg/
mL
y = 1.5637x - 0.0882r = 0.84
-0.5
0.0
0.5
1.0
1.5
2.0
2.5
3.0
3.5
4.0
-0.5 0.0 0.5 1.0 1.5 2.0 2.5
B12
prod
uced
,μg/
mL
RF consumed, μg/mL

44
out on day 6 (Figure 16). However, P. freudenreichii strain 256 did not respond to the RF andNAM supplementation. The co-addition of RF and NAM on day 6 did not enhance B12production compared to the production in WBM without addition (Figure 16). Interestingly, theB12 production by strain 266 did not increase when the lower ligand DMBI was providedcompared to there being an 80% increase in the B12 yield by strain 256 with DMBIsupplementation (Figure 16). Based on these results, RF and NAM were supplemented at thebeginning of the fermentation.
Figure 16. The effect of time (day 0, 3 and 6) of co-supplementing riboflavin (RF) and nicotinamide (NAM) onB12 production in whey-based medium (WBM) by Propionibacterium freudenreichii strains 256 and 266. Thedata represents the average (and standard deviation) of three biological replicate fermentations. (Study II)
5.3.3 Effect of natural precursors vs 5,6-dimethylbenzimidazole on B12 productionThe response to the supplementation with DMBI or its replacement with natural precursors (RFand NAM) on B12 production by the 30 PAB strains was strain-dependent, in terms of both thevolumetric and cellular B12 yields (Figure 17). The supplementation with RF alone did notincrease the volumetric or cellular B12 yield in any of the studied strains. However, when RFwas co-supplemented with NAM, the volumetric B12 production (μg/mL) increasedsignificantly up to 4.2-fold in WBM fermented with 12 of the 27 P. freudenreichii strains(Figure 17A). The highest B12 production was achieved with strain 284 following RF andNAM supplementation, reaching up to 4.2 μg/mL. On the other hand, the greatest enhancement(4.2-fold) was observed for the P. freudenreichii subsp. shermanii type strain (281) followingRF and NAM supplementation, increasing the yield from 0.44 to 1.86 μg/mL. An increasedOD600 value was observed with RF and NAM supplementation in a few of these strains; the pH,however, did not decrease (Figure 1 in Study II). However, the volumetric B12 yield with fourstrains (274, 275, 276 and 286) and the P. freudenreichii subsp. freudenreichii type strain (282)was significantly reduced by supplementation with RF and NAM (p < 0.05). In six of the non-slime producing strains, the cellular B12 yield (μg/g wet cell mass) increased (up to 4-fold)following RF and NAM addition (Figure 17B).
0.0
0.5
1.0
1.5
2.0
2.5
3.0
256 266
B12
,μg/
mL
WBMWBM RF+NAM (0)WBM RF+NAM (3)WBM RF+NAM (6)WBM DMBI
aa
a
a
b
a
cc
aa

5 Re
sults
45
Figu
re 1
7. E
ffec
t of s
uppl
emen
tatio
n w
ith ri
bofla
vin
(RF)
, its
co-
supp
lem
enta
tion
with
nic
otin
amid
e (N
AM
) and
5,6
-dim
ethy
lben
zim
idaz
ole
(DM
BI) o
n vo
lum
etric
B12
yie
ld(A
) and
cel
lula
r B12
yie
ld (B
) by
30 P
ropi
onib
acte
ria (P
AB
) stra
ins i
n w
hey-
base
d m
ediu
m (W
BM
). (S
tudy
II)

46
Three strains (256, 288 and 290), which did not respond to the RF and NAM supplementation,produced more volumetric and cellular B12 yields with DMBI (Figure 17). For four strains(257, 281, 283 and 289), an equally enhanced B12 production was possible either with DMBIor with co-supplementation with RF and NAM (Figure 17A and B). Interestingly, seven of thestudied strains (261 264, 266, 284 and 285) produced significantly more B12 in WBMfollowing RF and NAM supplementation than they did with DMBI (Figure 17A). Three P.acidipropionici strains (278 280) produced a trace amount of B12 (< 0.20 μg/mL and < 15.5μg/g cells) only with DMBI supplementation.
5.4 B12 production in cereal matrices by Propionibacterium freudenreichii strainsThe B12 results presented here for cereal matrices were obtained with the UHPLC method. TheMBA results that are shown will later be compared with those from the UHPLC method inSection 5.6.2.
5.4.1 B12 production in barley malt matrixIn BM without any added precursors, P. freudenreichii strain 256 produced 37 ng/g of activeB12, while with strains 263 and 266, the B12 yield was 12 13 ng/g (Figure 18).Supplementation of BM with DMBI did not improve B12 production. However, when DMBIwas added together with Co, the production increased by 40-fold in strain 256 (1480 ng/g), 86-fold in strain 263 (943 ng/g) and 75-fold in strain 266 (1000 ng/g). The production with Coalone, studied only with strains 256 and 266, was 10-fold higher than their respective productionlevels in the basic matrices (Figure 18), and the highest production with Co was 430 ng/g instrain 256. When DMBI was replaced with RF and NAM, the B12 yield in Co-supplementedBM further increased compared to the production with Co only with both strains, achieving aB12 production level of 716 ng/g by strain 256 and 627 ng/g by strain 266 (Figure 18). Despitea large difference in B12 production, the final cell counts were similar in all of the 168-hfermented matrices (Table 1 in Study III).

5 Results
47
* The ultra-high performance liquid chromatography (UHPLC) and the microbiological assay (MBA) results weresignificantly different (p < 0.05).
Figure 18. B12 production by Propionibacterium freudenreichii strains (256, 263 and 266) in the malted barleymatrix (BM) without or with cobalt (Co), riboflavin (RF) and nicotinamide (NAM), or 5,6-dimethylbenzimidazole(DMBI). The results were obtained with UHPLC and MBA and are given as averages of three biological replicatefermentations (error bars represent standard deviations).
5.4.2 B12 production in barley flour and aleurone matricesIn BF fermented with strains 256, 263 or 266, a B12 level of ca. 9 ng/g was produced (Figure19). As in BM, the DMBI supplementation did not enhance B12 production in BF. When DMBIwas co-supplemented with Co, the production in BF by strain 256 increased ca. 9-fold (80 ng/g)and by 5-fold in strain 263 (47 ng/g). Supplementation of Co only improved the B12 yield inBF up to 39 ng/g. The B12 production in basic AM was similar to that in BF. However, the B12yield was considerably higher than in BF when AM supplemented with the precursors wasfermented with strain 256 or 266 (Figure 19). With DMBI and Co, the production of B12 inAM by strain 266 reached 257 ng/g from 10 ng/g in basic AM (a 24-fold rise), whereas withstrain 256, the yield only increased by 10-fold (101 ng/g). With RF and NAM together with Co,the yields were higher than that achieved only with Co addition in AM (Figure 19). However,the supplementation did not affect the final cell counts in BF and AM (Table 1 in Study III).
0
200
400
600
800
1000
1200
1400
1600
BM
BM
Co
BM
Co+
RF+
NA
M
BM
DM
BI
BM
DM
BI+
Co
BM
BM
DM
BI
BM
DM
BI+
Co
BM
BM
Co
BM
Co+
RF+
NA
M
BM
DM
BI
BM
DM
BI+
Co
256 263 266
B12
,ng/
gm
atrix
UHPLCMBA
*
*

48
* The ultra-high performance liquid chromatography (UHPLC) and the microbiological assay (MBA) results weresignificantly different (p < 0.05).
Figure 19. B12 production by Propionibacterium freudenreichii strains 256, 263 and 266 in barley flour matrix(BF) and aleurone matrix (AM) without or with supplementation of cobalt (Co), riboflavin (RF) and nicotinamide(NAM), or 5,6-dimethylbenzimidazole (DMBI). The results were obtained by UHPLC and MBA, and given asaverages of three biological replicate fermentations, with error bars representing the standard deviations.
5.5 Stability of B12 compounds during three breadmaking processesThe fate of added CNCbl, OHCbl or in situ-produced B12 during the breadmaking wasfollowed in different stages of the processes, as indicated in Figures 20 and 21 (straight- andsponge-dough) and in Figures 20 and 22 (sourdough). Results obtained with MBA and theUHPLC method are given; however, the stability of B12 compounds during the breadmakingprocess is followed based on the results from the UHPLC method only. The MBA results arecompared in Section 5.6.3.
5.5.1 Stability of cyanocobalamin and hydroxocobalaminStraight- and sponge-dough bakingIn straight-dough baking, the added CNCbl was not affected by the 1.5-h proofing or by thebaking step (Figure 20A). In sponge-dough breadmaking, the losses can be compared onlybetween the first mixing and after the 2-h pre-proofing, and after the second mixing and theremaining steps. CNCbl was also stable in the sponge-dough breadmaking process, apart fromthe reduced initial level after the second mixing due to dilution by the remaining flour (Figure20B). The additional 2-h pre-proofing step in the sponge-dough process, however, reduced theOHCbl level by 31% (Figure 20B) as compared to only a 21% loss in the straight-dough process(Figure 20A).
0
50
100
150
200
250
300
350
400
BF
BF
Co
BF
DM
BI
BF
DM
BI+
Co
BF
BF
DM
BI
BF
DM
BI+
Co
BF
BF
Co
BF
DM
BI
AM
AM
Co
AM
Co+
RF+
NA
M
AM
DM
BI+
Co
AM
AM
Co
AM
Co+
RF+
NA
M
AM
DM
BI+
Co
256 263 266 256 266
B12
,ng/
gm
atrix
UHPLCMBA
*
*

5 Results
49
Figure 20. Content of added CNCbl and OHCbl (μg/g, dm) in straight-dough samples (A), in sponge-doughsamples (B) and in sourdough samples (C added after 16-h fermentation; D added before 16-h fermentation)analysed by the microbiological assay (MBA) and ultra-high performance liquid chromatography (UHPLC)methods. Error bars represent the standard deviations of three independent baking trials (A) or the range of twoindependent trials (B). Sourdough experiments were performed once. In sponge-dough baking (B) sub-samplesafter 1.5-h proofing were not determined by the UHPLC method. The losses can only be compared for samplesbefore or after the second mixing step for B and D.
Sourdough bakingThe sourdough baking decreased the contents of both the added CNCbl and OHCbl (Figures20C and D). The total loss of CNCbl was 23% as compared to a 44% destruction of OHCblwhen these compounds were added after the 16-h fermentation (Figure 20C). The addition ofCNCbl or OHCbl before the 16-h fermentation, right at the first mixing step, did notsignificantly increase the total losses during the sourdough baking (Figure 20D) whencompared to the late addition. The losses, however, can only be compared between samplesbefore or after the 16-h fermentation due to the dilution following addition of the remainingflour. Overall, it was evident from Figures 20C and D that the losses in the sourdough processhappened mostly in the longer baking step (70 min at 180 °C).
5.5.2 Stability of in situ-produced B12 by Propionibacterium freudenreichiiStraight-dough bakingBoth at low (Trial 1; 0.114 μg/g dm) and high (Trial 2; 3.9-fold of Trial 1) initial levels, the insitu-produced B12 remained stable during the straight-dough breadmaking (p > 0.05; Figure

50
21). Neither the 1.5-h proofing nor the baking step (20 min at 180 °C) significantly reduced thetotal B12 content.
Figure 21. B12 content of straight-dough samples (μg/g, dm) baked in fermented malt-extract medium (MEM) inTrial 1 (low-vitamin content) and in Trial 2 (high-vitamin content) determined by the microbiological assay(MBA) and the ultra-high performance liquid chromatography (UHPLC) methods. Error bars represent standarddeviations of three separate baking processes with three biological replicates of fermented media. Sub-samplesafter 1.5-h proofing were not determined by the UHPLC method.
Sourdough bakingAs with CNCbl or OHCbl, the incorporated in situ-produced B12 by P. freudenreichii in thesourdough decreased significantly during the sourdough baking step by 29 ± 4% (Figure 22).A slight increase in the B12 content was found after the 16-h fermentation by the UHPLCmethod, in contrast to a 23% increase in the B12 level when analysed with MBA. No notablelosses of in situ-produced B12 were observed in other steps of sourdough breadmaking.
Figure 22. B12 content of sourdough samples (μg/g, dm) baked in fermented malt-extract medium (MEM) asdetermined by the microbiological assay (MBA) and ultra-high performance liquid chromatography (UHPLC)methods. Error bars represent the standard deviations of three separate baking processes with three biologicalreplicates of fermented media. The losses can only be compared for samples before or after the second mixingstep.
0
0.2
0.4
0.6
0.8
1
1.2
MBA UHPLC MBA UHPLC
Trial 1 Trial 2
conten
t,μg
/gdm
After mixingAfter 1.5-h proofingBaked bread
0
0.2
0.4
0.6
0.8
1
1.2
MBA UHPLC
conten
t,μg
/gdm
After 1st mixingAfter 16-h fermentationAfter 2nd mixingAfter 1.5-h proofingBaked bread

5 Results
51
5.6 Comparison of the B12 contents obtained by the ultra-high performance liquidchromatography method and by microbiological assayThe B12 contents obtained with the UHPLC method following immunoaffinity purificationwere compared with those obtained with MBA in the experimental samples (Study I),fermented cereal matrices (Study II) and baking samples (Study IV). In addition, the B12production in WBM by P. freudenreichii strains obtained using MBA and the UHPLC methodwithout the immunoaffinity-purification step were also evaluated (Tables 7 and 8).
5.6.1. Fermented whey-based medium (Study II and this thesis)Table 7 shows the B12 contents in WBM produced by 10 P. freudenreichii strains (256 266)with added DMBI by analysing the cell biomass with MBA and UHPLC. For all ten strainsgrown in WBM with DMBI supplementation, the MBA and UHPLC results were statisticallysimilar (p > 0.05) with a UHPLC to MBA ratio ranging from 90 110%.
Table 7. B12 contents obtained by ultra-high performance liquid chromatography (UHPLC) and microbiologicalassay (MBA) in the cell biomasses of 10 Propionibacterium freudenreichii strains grown in whey-based medium(WBM) with 5,6-dimethylbenzimidazole (DMBI) supplementation. The results are given as μg/mL of WBM.
Strain UHPLCa MBAa UHPLC/MBA, %
256 1.53 (0.34) 1.45 (0.36) 105.5
257 2.39 (0.40) 2.24 (0.23) 106.7
258 1.61 (0.05) 1.56 (0.05) 103.2
259 2.18 (0.08) 2.10 (0.06) 103.8
260 1.06 (0.02) 1.08 (0.01) 98.1
261 1.26 (0.32) 1.37 (0.25) 92.0
262 0.72 (0.03) 0.79 (0.03) 91.1
263 1.58 (0.31) 1.63 (0.23) 96.9
264 1.00 (0.07) 1.00 (0.07) 100.0
265 1.07 (0.13) 0.95 (0.11) 112.6
266 0.62 (0.06) 0.61 (0.06) 101.6a The UHPLC and MBA data along each row did not differ significantly (p > 0.05).
The UHPLC and MBA methods gave identical B12 contents (p > 0.05) in WBM fermented byP. freudenreichii strains 256 and 266 without or with Co, and RF and NAM co-supplementedeither on day 0, 3 or 6 (Table 8).

52
Table 8. B12 contents determined by ultra-high performance liquid chromatography (UHPLC) andmicrobiological assay (MBA) in the cell biomasses of strains 256 and 266 grown in whey-based medium (WBM)without cobalt (Co) and with co-addition of Co and 5,6-dimethylbenzimidazole (DMBI), or with riboflavin (RF)and nicotinamide (NAM) on a different day (0, 3 or 6). The results are expressed as μg/mL.
Medium + supplements256 266
UHPLC MBA UHPLC/MBA, % UHPLC MBA UHPLC/
MBA, %WBM without Co 0.19a
(0.01)0.21a
(0.01)90.5 0.24a
(0.01)0.25a
(0.01)96.0
WBM with Co 0.93a
(0.03)1.11a
(0.02)83.8 0.74a
(0.03)0.86a
(0.01)86.0
WBM RF+NAM (0) 1.12a
(0.08)1.28a
(0.05)87.5 2.20a
(0.10)2.34a
(0.18)94.0
WBM RF+NAM (3) 1.05a
(0.07)1.13a
(0.04)92.9 2.12a
(0.07)2.20a
(0.07)96.4
WBM RF+NAM (6) 0.8 a
(0.02)0.88a
(0.03)92.0 1.10a
(0.17)1.18a
(0.04)93.2
a The UHPLC and MBA data along each row did not differ significantly (p > 0.05).
5.6.2 Fermented cereal matrices (Studies I, III)The B12 results from the UHPLC method for the 24-h fermented rye and barley malt matriceswith P. freudenreichii strain 266 (I) were 33 37% lower than those obtained with MBA (Table6).
The UHPLC and MBA results of the 7-day fermented cereal matrices with P. freudenreichiistrains 256, 263 or 266 (Study III) differed depending on the supplementation with theprecursor (Figures 18 and 19). In general, the UHPLC and MBA results were statisticallysimilar (p > 0.05) in the basic matrices as well as when DMBI or DMBI together with Co wereused as supplements. When BM was supplemented with Co, the UHPLC results of the BMfermented with strain 256 or 266 were ca. 40% lower compared to the results obtained withMBA (Figure 18). Likewise, the B12 contents of the fermented AM with Co supplementationwhen analysed by MBA were significantly higher than the results obtained with the UHPLCmethod were (p < 0.05; Figure 19). In Co-supplemented BF, both methods gave similar B12contents. In BM or AM with RF and NAM supplementation together with Co, the B12 resultsfrom both the MBA and UHPLC methods were identical (p > 0.05; Figures 18 and 19).
5.6.3 B12 Added or in situ-fortified samples during breadmaking (Study IV)In the straight- and sponge-dough breadmaking with added CNCbl or OHCbl, MBA andUHPLC gave identical B12 contents for the dough, proofed and baked samples (p > 0.05;Figures 20A and 20B). In the sourdough baking with added CNCbl, the B12 contents obtainedby these two methods in the samples from mixing to the baking step did not differ (p >0.05).Both methods produced similar B12 contents in OHCbl-fortified sourdough samples, exceptfor the doughs after a 16-h fermentation and the breads. For these samples, MBA gave 27%higher B12 contents than the UHPLC method did (Figure 20D).
The B12 contents given by MBA for the dough and bread samples in the straight-doughbreadmaking with the fermented MEM containing in situ-produced B12 (in both Trial 1 andTrial 2) were 11 33% higher compared to the values from the UHPLC method (p > 0.05; Figure21). During sourdough breadmaking with the in situ-produced B12, the B12 content of the 16-

5 Results
53
h fermented dough significantly increased (24 ± 14%; p < 0.05) according to MBA. Incomparison to the UHPLC results, MBA gave 33% more B12 contents in the 16-h fermentedsourdough (Figure 22). Overall, during the sourdough processes with MEM containing in situ-produced B12, MBA resulted in 19 47% higher B12 contents than their respective values asdetermined by the UHPLC method (Figure 22).

54
6 Discussion
6.1 Sensitivity and selectivity of the developed ultra-high performance liquidchromatography methodSeparation and method performanceThe HSS T3 C18 column was found to be superior to the BEH C18 column for the peakresolution, the peak sharpness and in terms of avoiding the co-elution of the analyte and theinterfering substances (Figure 7). The solvent flow rate of 0.32 mL/min in the gradient mode(water and acetonitrile acidified with 0.025% TFA) was found to be optimum in this study andhas been previously applied for UHPLC separation of cobalamins in cell culture media (Owenet al. 2011) and in HPLC analysis of B12 in PAB cells grown in supplemented whey permeate(Hugenschmidt et al. 2010). The UHPLC method with immunoaffinity purificationdemonstrated excellent inter-day recovery (ca. 95%) with the residual standard deviation (RSD)being < 5% when control cereal matrices fortified with CNCbl (at two levels) were analysed(Table 5). The stable retention of the CNCbl peak (a 30-day average of 3.27 min ± 0.02) usingthe HSS T3 column throughout the study period showed the reliability and the robustness ofthe developed method. A clear separation of pseudovitamin B12 (retained at 3.16 min) fromthe CNCbl (at 3.27 min) enabled accurate quantitation of active B12 in the studied samples(Studies I IV).
The developed and validated UHPLC method reported in Study I allowed for the quantitationof the B12 content in a variety of samples, directly after extraction for cell biomass (Study II)and after immunoaffinity purification for the fermented cereal matrices (Studies I and III) andthe samples from the breadmaking processes (Study IV). The considerably low quantitationlimit of 0.225 ng B12/inj made the analysis of B12 in the wet cell biomass of PAB (as low as0.4 μg/g) possible without the immunoaffinity-purification step. Additionally, due to the lowerdetection level of the UPLC system when combined with the sample clean-up and theconcentration potential provided by immunoaffinity purification, a B12 content ofapproximately 1 ng/g can be measured. The detection limit of 0.075 ng/15 μL-inj by the currentmethod was several-fold more sensitive than the 1.5 3.3 ng/inj reported for the HPLC–UVmethods that also required larger sample injections (50 100 μL) (Heudi et al. 2006; Chen et al.2009; Marley et al. 2009; Guggisberg et al. 2012). Unlike the larger samples needed for theHPLC methods, the analysis with the current UHPLC method can be accomplished with smallsamples (< 5 g). In addition, the run time was shorter (10 min) with the UHPLC methodcompared to the 30 40 min required for analysing B12 with the HPLC methods. Furthermore,the UHPLC method is much quicker than the time-consuming and labour-intensive MBA forthe determination of B12 in food products (Ball 2006; Sych et al. 2016).
Need and usefulness of immunoaffinity purification for B12 analysisAnalysis of B12 in the samples with less interfering substances and a detectable amount of B12,such as washed P. freudenreichii cells, did not require immunoaffinity purification (Figure 9).However, to analyse B12 from samples containing a low level of B12 and sample matrices ascomplex as the lyophilised pig liver (BCR 487) or cereal matrices, the use of immunoaffinity

6 Discussion
55
purification not only removed the background chromatographic noise but also allowed for theselective concentration of the analyte (Figure 9). Both the clean-up and analyte enrichment ofthe sample extracts enabled the clear separation and selective quantitation of the active B12 inthe certified reference material, the fermented cereal matrices and baking samples (Studies I,III, IV). The usefulness of introducing immunoaffinity sample preparation for HPLCdeterminations of B12 was shown previously in other food matrices such as fortified foods(Heudi et al. 2006; Marley et al. 2009) and meat products (Guggisberg et al. 2012). However,one drawback of immunoaffinity purification is that the B12 needs to be in the cyano form, forexample CNCbl, for good recovery (Marley et al. 2009). The recovery of OHCbl was only upto 75%, whereas the affinity of AdoCbl and MeCbl to antibodies is quite low (Marley et al.2009). Besides, AdoCbl and MeCbl are highly unstable in light, converting instantly to OHCblon exposure to light. Thus, for the B12 analysis in this study, the native B12 forms in thesamples were converted into their cyano forms by reacting them with a sufficient and testedamount of NaCN (100 μL of 1% solution/sample) before the heat-extraction process (Study I).Apart from the excellent retention of CNCbl, the pseudovitamin B12 present in a few sampleswas also retained by the immunoaffinity column (Figure 10; Figure 13A). The affinity ofpseudovitamin B12 to the immunoaffinity antibodies, however, has not yet been tested, aspseudovitamin B12 is not currently available commercially (Santos et al. 2007). Therefore, inthis study, we did not quantify the pseudovitamin B12 contents detected in the samples withthe UHPLC method. The MBA results likely reflect its level when the results are comparedwith those obtained by the UHPLC method.
6.2 Ultra-high performance liquid chromatography–mass spectrometry confirmsthe production of active B12 or its inactive form in whey-based medium and cerealmatrices by PropionibacteriaSeveral sample types were included to confirm the identification of the B12 compound, rangingfrom a certified reference material (BCR 487 pig liver) which is known to contain active B12to the cereal matrices fermented with P. freudenreichii, the cell biomasses of P. freudenreichiiand P. acidipropionici grown in WBM, and the baking samples with added B12 compounds orB12 produced in situ in MEM with P. freudenreichii. As our study focused on the fortificationof food matrices with active B12, the accurate identification of the B12 form is necessary.Consequently, UHPLC identification, based on the retention time and the PDA spectrum, wasfurther confirmed with MS. In the first two studies (Studies I, II), the confirmation was carriedout with the ion-trap MS. High-resolution QTOF MS allowed for the precise identification ofB12 compounds in cereal matrices fermented with strains of food-grade P. freudenreichii inStudy III.Analysis with the ion-trap MS confirmed the production of active B12 forms, extracted asCNCbl, in the experimental rye and barley malt matrices fermented with P. freudenreichii strain266, similar to those identified in the reference material (BCR 487 pig liver). The CNCbl peakshowed mass spectra (Figure 11B) with fragments that confirmed the presence of DMBI in thelower ligand (146 Da; [M 1210]+) when the ions of protonated CNCbl were isolated andfragmented (Study I). MBA showed a B12 content of ca. 1200 ng/g in the concentrated malt

56
extract fermented with lactic and propionic acid bacteria (Table 6); however, the ion-trapMS/MS did not detect any CNCbl in its immunoaffinity-purified B12 extract. Instead, thefermented malt extract was confirmed to contain pseudovitamin B12 with adenine as the lowerligand (Figures 10A and 11C), which possibly was measured as B12 by MBA with the testorganism L. delbrueckii ATCC 7830, as seen in the study by Tanioka et al. (2009).
The ion-trap MS analysis of the cell extracts of representative strains from 30 PAB strains(Table 3) grown in WBM with or without added precursor showed that all 27 P. freudenreichiistrains exclusively produced active B12 with DMBI as the lower ligand (Figure 12). Theanalysis of the cell extracts of three P. acidipropionici strains confirmed that they did notproduce active B12 except when WBM was supplemented with DMBI. Without DMBI, a peakseen at 3.16 min was identified as pseudovitamin B12 with the MS/MS mass spectra identicalto those found for the B12 compound detected in the lactic and propionic acid bacteriafermented and concentrated malt extract (Figure 11B). Even with DMBI supplementation,pseudovitamin B12 was still detected together with active B12.
After the confirmation that the P. freudenreichii strains produce active B12 in WBM (StudyII), we showed with the high-resolution QTOF MS that each of the three P. freudenreichiistrains (256, 263 and 266) also produced active B12 in the cereal matrices studied (Figure 13;Study III). Unlike in the ion-trap MS, the analysis with QTOF MS allowed for the detection ofthe molecular ions as well as the major fragment ions during the MS/MS procedure (Figure13C), including the detection of the protonated DMBI fragment (m/z 147.0919). In BM andAM with Co supplementation, a small peak confirmed as pseudovitamin B12 with adenine asthe lower ligand (m/z 136.0638) was observed. When sufficient in vivo DMBI synthesis wasnot possible, a small level of pseudovitamin B12 is also produced by P. freudenreichii(Vorobjeva 1999; Deptula et al. 2015). The synthesis of DMBI in PAB is species-dependent.P. freudenreichii is capable of synthesising it from reduced FMN (Deptula et al. 2015), whereasP. acidipropionici lacks the BluB/CobT2 fusion gene responsible for the synthesis of DMBI(Parizzi et al. 2012). The synthesis of DMBI by P. freudenreichii is dependent on theavailability of oxygen during growth, producing exclusively (but a small amount of)pseudovitamin B12 when grown under complete anaerobic conditions (Deptula et al. 2015).
6.3 The ultra-high performance liquid chromatography method is more selectivethan the microbiological assay for measuring active B12 in fermented foodmatricesThe possibility of measuring only active B12 levels with the developed and validated UHPLCmethod in a variety of samples studied (Studies I IV) demonstrates its superiority over MBA.Except in Study II, the B12 contents of all other samples were measured with MBA byconsidering it as a reference method. The B12 results determined with MBA for the cellbiomasses of P. freudenreichii strains grown in WBM (Tables 7 and 8) are also included in thisthesis, although they were not included in the original publications. In general, MBA showedB12 contents that were identical to the results produced by the UHPLC method. However, forcertain samples, the B12 contents determined by MBA were higher than those obtained withthe UHPLC method.

6 Discussion
57
Identical B12 results obtained by the UHPLC method and by MBA for WBM with added DMBIwhen fermented with P. freudenreichii strains (Table 7) indicate that the UHPLC method wasable to show that the synthesised compounds were the active B12 forms. Likewise, the similarB12 yields by P. freudenreichii strains 256 and 266 in WBM with RF and NAM co-supplementation given by the UHPLC and MBA methods (Table 8) suggest that P.freudenreichii strains produce active B12 when a sufficient amount of the lower ligandprecursor is available. When DMBI or its natural precursors RF and NAM were supplementedin cereal matrices with added Co, the identical results obtained in the matrices fermented withP. freudenreichii strain 256 or 266 by both UHPLC and MBA (Figures 18 and 19) confirmedthat the availability of DMBI or RF and NAM ensures the production of active B12. Similarresults obtained by both methods for WBM without added Co (Table 8) show that P.freudenreichii strains could use the RF available in the medium (2.5 μg/mL) for the biosynthesisof DMBI required for the production of active B12 (0.19 0.24 μg/mL).
However, the higher B12 contents in the 24-h fermented experimental rye and barley maltmatrices with P. freudenreichii 266 (33 37%) (Table 6), and in BM and AM with Cosupplementation (20 40%) (Figures 18 and 19) found by MBA compared to the UHPLCmethod indicate that the matrices might contain inactive B12 analogues, such as pseudovitaminB12 identified in fermented BM with added Co (Figure 13). When the synthesis of sufficientDMBI is not possible, P. freudenreichii also produces a small amount of pseudovitamin B12 inaddition to active B12 (Vorobjeva 1999; Deptula et al. 2015). On the other hand, no differenceswere found in the B12 contents in the dough and bread samples fortified with CNCbl or OHCblin the straight-dough and sponge-dough breadmaking methods. MBA gave higher B12 contentresults than the UHPLC method did for some intermediate dough samples from the sourdoughprocess with added OHCbl (27%) or when fortified with in situ-produced B12 (19 47%). Theresults indicate that during the 16-h sourdough fermentation, lactic acid bacteria or P.freudenreichii (with in situ-produced B12) might have synthesised B12 compounds other thanactive B12, which were not accounted for in the UHPLC method but were included in the resultsfrom MBA. Lactic acid bacteria such as L. reuteri are known to synthesise pseudovitamin B12(Santos et al. 2007; Molina et al. 2009), which enables the growth of the assay organism usedin MBA (Herbert 1988; Ball 2006). In fact, only pseudovitamin B12 was detected in theconcentrated fermented malt extract sample (Table 3; Figure 3A) analysed in Study I in contrastto a B12 content of approximately 1200 ng/g found via MBA.
In conclusion, MBA gives results that are equivalent to those determined by the UHPLCmethod in food samples containing active B12 forms. Otherwise, it might result in B12 contentsgreater than the results obtained with UHPLC. Therefore, for the fermented food materials thatlikely contain inactive B12 analogues and/or other compounds promoting the growth of theassay organism, MBA is not a suitable method for the measurement of active B12 contents.Despite the poor specificity, MBA could still be used to analyse B12 contents in foods knownto contain active B12 and it does not require immunoaffinity purification. More sensitive andspecific analytical methods such as the developed UHPLC method allow for the accuratequantitation of active B12 in fermented food materials intended for B12 fortification. Thus, theB12 results presented and discussed in this thesis were based on the B12 contents obtained withthe UHPLC method.

58
6.4 Active B12 production in whey-based medium and cereal matrices byPropionibacterium freudenreichiiTo the best of our knowledge, the use of P. freudenreichii in cereal matrices for B12 productionhas not been reported previously. An active B12 production of 15.7 19.3 ng/g in theexperimental rye and barley malt matrices by P. freudenreichii strain 266 within 24 h offermentation (Study I) indicated that PAB could be utilised for the natural B12 fortification ofcereal matrices. The increased B12 production (0.74 0.93 μg/mL) in WBM with Co by strains256 and 266 compared to the lower B12 yields (0.19 0.24 μg/mL) without Co supplementation(Table 8) showed that Co is one of the key factors regulating the ability of the strain to produceB12. The produced B12 level in WBM with Co, however, was higher than the B12 yield (0.44μg/mL) produced by P. freudenreichii DF13 in supplemented whey permeate for the same Coaddition level (Hugenschmidt et al. 2011). As discussed in the literature review, Co is insertedin the early stage of B12 biosynthesis in PAB (Friedman and Cagen 1970; Moore and Warren2012); its availability in the fermenting medium limits the level of B12 production (Bullermanand Berry 1966; Hugenschmidt et al. 2011). Besides Co, DMBI is essential for the productionof active B12 (Martens et al. 2002; Crofts et al. 2013). In commercial B12 manufacturing,DMBI is supplemented to increase B12 yields (Martens et al. 2002). For B12 production infood matrices, DMBI should come from de novo synthesis. An enhanced active in situ B12production in food matrices is thus possible only with strains synthesising DMBI in an efficientmanner. We, therefore, first studied 27 P. freudenreichii and 3 P. acidipropionici strains (Table3) isolated from dairy and cereal environments for their active B12 production in WBM (StudyII) and then used 3 of the P. freudenreichii strains (256, 263 and 266) to study active B12production in cereal matrices (Study III).
6.4.1 Active B12 production without supplementation of 5,6-dimethylbenzimidazole or itsprecursorsThe confirmation that all 27 P. freudenreichii strains studied produced active B12 in WBMwithout DMBI supplementation clearly demonstrated that these food-grade strains synthesiseDMBI de novo for the production of active B12. A B12 yield ranging from 0.45 μg/mL to 3.45μg/mL (Figure 14) suggests that the strains differed in their ability to synthesise B12. The yieldcould have been affected by the growth (OD600 1.2 17.8) (Figure 1A in Study II) and the finalpH of the medium (6.5 4.7) (Figure 1B in Study II), because higher cellular B12 yields (Figure17B) were observed for the strains growing to lower final OD600 values, with the final pH being> 6 and producing smaller amounts of propionic and acetic acids (Supplemental Figure 1 inStudy II).
Earlier investigations have focused mostly on studying B12 production of natural strains withadded DMBI (Hugenschmidt et al. 2010) or in a pH-controlled fermentation (Bullerman andBerry 1966; Marwaha et al. 1983; Quesada-Chanto, Schmid-Meyer, Schroeder, Fuchter, et al.1998). In a pH-maintained (at 6.5) fermentation, the B12 yield of 2.7 μg/mL in corn-steep liquormedium with the same type strain 282 (P. freudenreichii DSM 20271) used in the current study(Quesada-Chanto et al. 1998b) was comparable to its production in WBM (2.5 μg/mL) withoutthe pH adjustment. The low-medium pH (< 6) is detrimental to growth and to B12 biosynthesisin PAB (Hsu and Yang 1991; Vorobjeva 1999). The pH of the growth medium is, therefore,

6 Discussion
59
usually maintained at around 7 in industrial B12 production (Martens et al. 2002). However,regulating medium pH nearer to a neutral value by adding an alkali agent is not practised infood fermentation. The lower pH of the fermented products, instead, is beneficial for improvingthe storage life of the products (Suomalainen and Mäyrä-Makinen 1999; Tinzl-Malang et al.2015).
A good significant correlation between the B12 production and the corresponding depletion ofRF from the WBM (Figure 15) confirms that the DMBI part of the B12 was derived from RF.The equivalent level of RF in WBM fermented by the P. acidipropionici strains and the controlmedium corresponded with their inability to produce active B12 as these strains lack the DMBI-synthesising gene, BluB/CobT2 (Parizzi et al. 2012). By studying several strains originatingfrom different environments, these results further confirm the current understanding that flavincompounds are the substrates for DMBI biosynthesis in P. freudenreichii (Renz andWeyhenmeyer 1972; Hörig and Renz 1977; Deptula et al. 2015).
P. freudenreichii strains 256, 263 and 266, which varied in B12 production in WBM (0.731.80 μg/mL), were investigated for B12 production in the cereal matrices (Study III).Compared to the higher B12 yields in WBM which contained added Co, the B12 productionwith these strains in the cereal matrices supplemented with Co was lower (Figures 18 and 19).Among the cereal matrices, the highest level of B12 (430 ng/g) was produced in BM with addedCo by P. freudenreichii strain 256. Apart from the other differences in medium compositionbetween WBM and BM that might have influenced the B12 production, the WBM was bufferedwith 0.1 M potassium phosphate with a higher initial pH (6.4) compared to unbuffered BM withan initial pH of 5.6. Through Co supplementation, AM allowed for production of up to 114 ng/gby strain 266 whereas 39 ng/g was produced by strain 256 in BF. Still the produced level in thecereal matrices by strains 256, 263 and 266 was lower than the yield obtained in MEM (0.69μg/mL) by P. freudenreichii 282 (type strain). MEM was a buffered medium (pH 6.4) and itwas supplemented with yeast extract and a protein source (tryptone). In addition, theconsiderably higher level of RF in WBM (2.5 μg/mL) compared to the RF contents in the cerealmatrices (estimated levels: 0.03 0.5 μg/g) may also explain the higher B12 yields in WBM.
Although evaluation of the B12 produced in the studied cereal matrices by P. freudenreichiistrains with literature values is not possible due to the lack of related studies, the B12 contentsachieved in the fermented matrices, however, can be compared with the values reported forother fermented plant-based foods. A good amount of B12 was found in sauerkraut (70 ng/g)prepared with a Propionibacterium jensenii strain compared to 20 ng/g in the control sauerkraut(Babuchowski et al. 1999). As B12 was analysed with MBA using L. delbrueckii ATCC 7830,the actual level of active B12 could be different. The reported B12 contained in tempeh variesconsiderably ranging from 1.6 ng/g to 80 ng/g (Mo et al. 2013; Watanabe et al. 2013),influenced by the fermentation process (Denter and Bisping 1994) and type of tempeh culturesused (Keuth and Bisping 1994). Gu et al. (2015) reported B12 content of 180 ng/mL in soyyoghurt prepared with L. reuteri strain ZJ03, which was also measured with MBA.
In the cereal matrices, the active B12 production of 9 37 ng/g (i.e. 0.9 3.7 μg/100 g) achievedwithout any supplementation (Figures 18 and 19) by fermenting with P. freudenreichii strainsis already nutritionally relevant when considering the RDA value for B12 of 2 2.4 μg/day for

60
adults (Institute of Medicine 1998; Nordic Nutrition Recommendations 2012 2013). Thedifference in B12 production between the matrices was expected as BM contained the greatestproportion of flour (33% w/v) compared to 15% w/v in AM and 6% w/v in BF. Cereals andcereal fractions differ in the natural amount of Co they contain (Varo et al. 1980; Ekholm et al.2007; Kabata-Pendias and Mukherjee 2007), with the Co content found to be higher in wholegrain flours and their bran fractions. Also, the RF contents of the flours used in these matricesdiffered, with malted barley flour containing 2.3 μg/g in comparison to 3.1 μg/g in wheataleurone and 0.5 μg/g in barley flour. Besides, the higher level of fermentable sugars in BMwas reflected in the better growth of P. freudenreichii strains in BM than in the other twomatrices (Table 1 in Study III). The current level of in situ B12 production in cereal matricescan further be improved by using cereal materials rich in natural Co content, e.g. certainAustralian or Egyptian wheats (Kabata-Pendias and Mukherjee 2007) or cereal fractions thatare normally higher in Co and RF contents, and by further optimising the composition of thematrices.
6.4.2 Potential to increase B12 production by co-supplementation with riboflavin andnicotinamideUnlike RF and NAM supplementation on day 6 similar to what is practised for DMBI additionin commercial production, our study showed that an early addition of RF and NAM (on day 0or day 3) was more effective at increasing B12 production in certain P. freudenreichii strains(Figure 16). As RF and niacin found in food matrices are available from the beginning of thefermentation and early availability of these vitamins is beneficial, this important finding couldbe exploited to improve in situ B12 production with P. freudenreichii. In contrast, earlysupplementation of DMBI was reported to decrease the B12 yield (Marwaha et al. 1983) andits addition at the late stage of fermentation is a common practice in industrial B12 production(Martens et al. 2002).
In general, the growth of the strains in both WBM (Figure 1A in Study II) and in cereal matrices(Figure 1 in Study III) was not affected by supplementation. The similar growth rates meanthat the increased B12 production was dependent on the type of supplement. The results fromStudy II showed that B12 production by certain P. freudenreichii strains could be significantlyincreased by co-supplementation with RF and NAM. The addition of RF alone did not increasethe B12 production in WBM by any of the strains; its co-supplementation with NAM, however,increased the volumetric B12 yields up to 4-fold with 12 of the 27 P. freudenreichii strainsstudied (Figure 17A). Interestingly, for some strains the co-addition of RF and NAM was moreeffective at enhancing the B12 yield than DMBI was, suggesting that added DMBI was notbeneficial in terms of enhancing B12 production in WBM. Instead, the natural precursors (RFand NAM) may be more suitable for increasing in situ B12 production with a strain thatresponds to them. An enhanced B12 production in cereal matrices was also obtained by co-supplementation with RF and NAM (Figures 18 and 19) compared to the production withoutthese food-grade DMBI precursors. For example, supplementation with RF and NAM in BMincreased the B12 yield with P. freudenreichii strain 256 from 430 ng/g to 716 ng/g and from112 ng/g to 627 ng/g with strain 266. The enhancing effect of RF and NAM on B12 productionwas also found in AM, thus improving the active B12 contents in the fermented AM. The loweryields with RF and NAM supplementation compared to B12 production with DMBI

6 Discussion
61
supplementation in BM (975 1480 ng/g) could be due to the low pH affecting the de novobiosynthesis of DMBI, which needs to be investigated in further studies.
The B12 production in WBM with RF and NAM co-supplementation by some of the strains inthis study was higher than the yields reported for 100 natural PAB strains in supplemented wheypermeate with DMBI supplementation (Hugenschmidt et al. 2010). The maximum B12 yieldobtained on screening the large number of PAB strains was 2.5 μg/mL (Hugenschmidt et al.2010). P. freudenreichii strain 288 with DMBI supplementation produced approximately 2-foldthe reported yield (5.3 μg/mL). A maximum B12 yield of 4.2 μg/mL was achieved with a P.freudenreichii strain (284) with RF and NAM co-supplementation.
In this study, we demonstrated with live P. freudenreichii cells that an improved production ofactive B12 in WBM as well as in cereal matrices was possible through co-supplementation withRF and NAM. The increased production was likely due to the enhanced DMBI biosynthesisand its activation into the nucleotide, thus being ready for incorporation to complete thebiosynthesis of active B12. This important finding in our study confirms the earlier observationin cell homogenates of P. freudenreichii that DMBI biosynthesis was stimulated by 27 mMNAM incubated under aerobic conditions (Hörig and Renz 1980). The added NAM was foundto be converted into NA, as was found in the study by Hörig and Renz (1980), confirming NAas the actual stimulant of DMBI biosynthesis in P. freudenreichii. The exact mechanism behindthis stimulation is not known. It is hypothesised that NA or its coenzyme form NaMN mightallosterically regulate the DMBI-synthesising BluB/CobT2 enzyme (Chen et al. 1995).Additionally, sufficient availability of NA could be utilised for an enhanced biosynthesis ofNaMN, which is involved in the activation of DMBI into -ribazole phosphate so that it is readyfor incorporation into the incomplete adenosylcobinamide (Friedmann and Harris 1965;Deptula et al. 2015).
6.5 In situ-produced B12 is stable during breadmakingBread is an attractive food to fortify with B12. Knowledge regarding its stability during variousbreadmaking processes, however, is limited. Only wheat bread fortified with CNCbl has beenstudied so far. In this study, we investigated the retention of in situ-produced B12 duringstraight-dough and sourdough breadmaking as compared to that of added CNCbl and OHCbl.In addition, the stability of the added compounds was also investigated during sponge-doughbaking.The added CNCbl remained protected in the straight-dough and sponge-dough processes, whilethe initial level of OHCbl decreased during breadmaking for both processes (by 21% and 31%,respectively) (Figure 20). The sponge-dough method differs from the straight-dough methoddue to a 1.5-h pre-proofing step; the higher loss of OHCbl in sponge-dough baking could beattributed to the pre-proofing stage. Unlike the significant loss of supplemented OHCbl (Figure13B), the in situ-produced B12 remained stable (at both levels; 114 ng/g dm and 466 ng/g dm)similarly to CNCbl in the straight-dough breadmaking process (Figures 20A and 21).
Compared to the retention of added CNCbl and in situ-produced B12 in the straight-doughmethod of breadmaking, the sourdough process, however, caused a loss of 23% of the added

62
CNCbl content and 29% of in situ-produced B12 (Figures 20C, 20D and 22). OHCbl destructionincreased by 2-fold (44%) in sourdough breadmaking compared to its loss during the straight-dough process (21%). Due to the dilution of the B12 contents in the dough by the addition ofthe remaining flour, the losses in the sourdough breadmaking were compared separately beforeand after the 16-h fermentation. The results clearly showed that the destruction of B12 happenedduring the longer baking step of the sourdough process (70 min) compared to no loss of vitamins(except for a 21% loss of OHCbl) in the shorter baking period in straight-dough breadmaking(20 min).
As pointed out earlier (Section 2.9), the retention of B12 during processing has been studiedmostly in animal-based foods. In breadmaking, only the straight-dough process has beenstudied for the retention of fortified CNCbl (Czernichow et al. 2003; Winkels et al. 2008).Contrary to 19 23% losses found by Winkels et al. (2008) and 45% losses reported byCzernichow et al. (2003) during the preparation of wheat bread, added CNCbl was found to bestable in the straight-dough breadmaking process in our study. The higher destruction of addedOHCbl in the baking processes agrees with the considerable losses reported for B12 contentsin animal-based products. Losses were as high as 22 49% when cooking, roasting or grillingof beef (Bennink and Ono 1982; Czerwonka et al. 2014), 30 40% when microwaving beef,pork and milk (Watanabe et al. 1998) and 41 59% in typical grilling, boiling, steaming andmicrowaving of herring (Nishioka et al. 2011). In agreement with these studies, the lowerstability of CNCbl or in situ-produced B12 in the sourdough process could be the result ofbaking for a longer duration at a higher temperature. Besides, the drop in pH (from 6.4 to 3.8)during the sourdough fermentation could have affected the stability of the B12 compounds, inaddition to the possible destabilisation due to reactive compounds (e.g. RF and NAM) andreducing agents such as ascorbic acid (Ahmad et al. 2003; Ahmad 2012; Juzeniene andNizauskaite 2013; Ahmad et al. 2014).
Overall, the active B12 incorporated in dough using the fermented MEM during breadmakingwas more stable than the added OHCbl and it was retained comparably to CNCbl, which isregarded as the most stable B12 form. As the B12 is accumulated in cells during thebiosynthesis of B12 in P. freudenreichii (Martens et al. 2002; Warren et al. 2002), native formsare likely protected, to some extent, from the exposure to light, heat and pH compared to theadded pure compounds. The better retention could be due to the higher pH of the final dough(approximately 5) in in situ-produced B12 compared to a pH of approximately 3.8 4.2 in thesourdough with the added compounds (Table 2 in Study IV). Nevertheless, the level of B12retained in the breads (0.23 μg/g fw) prepared from the MEM fermented with P. freudenreichiistrain 282 was 3-fold the RDA when simply consuming one slice of the bread (30 g). The focusof this study was to understand the stability of microbiologically produced active B12 duringbaking processes, the B12 content, and the baking and sensory quality of the breads, however,can be further adjusted by optimising the composition of the MEM medium and thefermentation conditions.

7 Conclusions
63
7 Conclusions
Plant-based foods do not contain B12, which means vegetarians, vegans and people who cannotafford animal-based products or those who do not consume meat for various reasons aregenerally at higher risk of B12 deficiency globally. In addition, the current recommendationemphasises reducing meat consumption by increasing plant proteins in the diet. The focus ofthis study was to explore the potential of in situ production of active B12 in food matrices usingstrains of food-grade P. freudenreichii to fortify foods with B12 naturally. Another primaryobjective was to develop sensitive and selective methods to analyse active B12 accurately inthe fermented products.The developed and validated UHPLC method with UV/Vis detection allows for a clearseparation and sensitive quantitation of active B12 in fermented cereal matrices and bakingsamples fortified with added or in situ-produced B12 after purification on immunoaffinitycolumns. The determination of active B12 content in cell biomasses of PAB with the UHPLCmethod does not require immunoaffinity sample purification. Analysis with an ion-trap or high-resolution QTOF mass spectrometer confirmed production of active B12 in WBM and cerealmatrices by P. freudenreichii, whereas P. acidipropionici strains (studied only in WBM)produced pseudovitamin B12 unless supplemented with DMBI. MBA usually gave B12contents higher than those obtained with the UHPLC method, showing that the measurementof active B12 in fermented foods with MBA needs additional confirmation with more specificmethods, such as UHPLC.
The considerable variation in B12 yields in WBM (0.45 3.35 μg/mL) by the 27 P.freudenreichii strains and their varied response to supplementation with DMBI or its food-gradeprecursors RF and NAM on enhancing B12 production showed that the efficiency of B12biosynthesis in P. freudenreichii is strain-dependent. Among 27 P. freudenreichii strains, 12 ofthem produced more active B12 (up to 4-fold) with RF and NAM co-supplementation,sometimes even exceeding the yields obtained with DMBI addition. The highest B12 yieldachieved in WBM with RF and NAM co-supplementation was 4.2 μg/mL. The significantpositive correlation between RF consumption and B12 production in WBM clearly shows thatDMBI is synthesised from RF and guided to B12 biosynthesis. When RF and NAM were co-added to BM and AM supplemented with Co, the B12 production by the three studied P.freudenreichii strains increased up to 5.5-fold. These results confirmed that RF and NAM arecapable of increasing active B12 production in food matrices where the use of DMBI is notpossible.
The active B12 produced in three cereal matrices (BM, BF and AM) without anysupplementation ranged from 9 ng to 37 ng /g (or 0.9 3.7 μg/100 g); the B12 levels producedin these matrices can easily fulfil the RDA of 2 2.4 μg/day (for adults). Already in WBMwithout Co addition, the produced level is nutritionally relevant (190 240 ng/mL). With food-grade RF and NAM co-supplementation, the production of active B12 in the cereal matriceswas shown to increase many-fold, reaching approximately to 700 ng/g with the studied P.freudenreichii strains. B12 produced in situ in MEM by P. freudenreichii was found to be asstable as the chemically modified CNCbl during commonly used breadmaking processes

64
(straight-dough, sponge-dough and sourdough), being retained in the final product better thanthe added OHCbl.
In conclusion, this study showed that P. freudenreichii can be used for the natural fortificationof active B12 in plant-based foods and that UHPLC–UV–MS methods are reliable analyticaltools for ensuring the determination of active B12 in fermented foods. Further studies couldfocus on optimising the composition of the cereal matrices (for the levels of sugars, Co, RF andNAM) to increase active B12 production with P. freudenreichii strains.

8 References
65
8 ReferencesAOAC official method 986.23. 2006. Cobalamin in milk-based infant formula. AOAC International.
Ahmad I. 2012. Effect of riboflavin on the photolysis of cyanocobolamin in aqueous solution. Open Anal. Chem.J. 6:22–27.
Ahmad I, Ansari I., Ismail T. 2003. Effect of nicotinamide on the photolysis of cyanocobalamin in aqueoussolution. J. Pharm. Biomed. Anal. 31:369–374.
Ahmad I, Qadeer K, Zahid S, Sheraz MA, Ismail T, Hussain W, Ansari IA. 2014. Effect of ascorbic acid on thedegradation of cyanocobalamin and hydroxocobalamin in aqueous solution: A kinetic study. AAPS PharmSciTech15:1324–1333.
Allen LH. 2009. How common is vitamin B-12 deficiency? Am. J. Clin. Nutr. 89:693S.
Anderson PJ, Lango J, Carkeet C, Britten A, Kräutler B, Hammock BD, Roth JR. 2008. One pathway canincorporate either adenine or dimethylbenzimidazole as an -axial ligand of B12 cofactors in Salmonella enterica.J. Bacteriol. 190:1160–1171.
Anderson W., Slaughter D, Laffey C, Lardner C. 2010. Reduction of folic acid during baking and implications formandatory fortification of bread. Int. J. Food Sci. Technol. 45:1104–1110.
Babuchowski A, Laniewska-Moroz L, Warminska-Radyko. 1999. Propionibacteria in fermented vegetables. Lait79:113–124.
Ball GFM. 2006. Vitamins in foods: Analysis, bioavailability, and stability. Boca Raton, FL: CRC Press.
Bennink M, Ono K. 1982. Vitamin B12, E and D content of raw and cooked beef. J. Food Sci. 47:1786–1792.
Berman D, Yacowitz H, Weiser HH. 1956. A differential microbiological assay for vitamin B12 andpseudovitamin B12. Appl. Microbiol. 4:49–52.
Bito T, Ohishi N, Hatanaka Y, Takenaka S, Nishihara E, Yabuta Y, Watanabe F. 2013. Production andcharacterization of cyanocobalamin-enriched lettuce (Lactuca sativa L.) grown using hydroponics. J. Agric. FoodChem. 61:3852–3858.
Bullerman LB, Berry EC. 1966. Use of cheese whey for vitamin B12 production. II. Cobalt, precursor, and aerationlevels. Appl. Microbiol. 14:358–360.
Burgess CM, Smid EJ, Rutten G, van Sinderen D. 2006. A general method for selection of riboflavin-overproducing food grade micro-organisms. Microb. Cell Fact. 5:24.
Burgess CM, Smid EJ, van Sinderen D. 2009. Bacterial vitamin B2, B11 and B12 overproduction: An overview.Int. J. Food Microbiol. 133:1–7.
Campos-Gi enez E, Fontannaz P, Trisconi MJ, Kilinc T, Gimenez C, Andrieux P. 2008. Determination of vitaminB12 in food products by liquid chromatography/UV detection with immunoafflnity extraction: Single-laboratoryvalidation. J. AOAC Int. 91:786–793.
Campos-Gi enez E, Fontannaz P, Trisconi M-J, Kilinc T, Gimenez C, Andrieux P, Nelson M. 2012.Determination of vitamin B12 in infant formula and adult nutritionals by liquid chromatography/UV detectionwith immunoaffinity extraction: First action 2011.08. J. AOAC Int. 95:307–312.
Capozzi V, Russo P, Dueñas MT, López P, Spano G. 2012. Lactic acid bacteria producing B-group vitamins: Agreat potential for functional cereals products. Appl. Microbiol. Biotechnol. 96:1383–1394.
Chan CH, Newmister S a., Talyor K, Claas KR, Rayment I, Escalante-Semerena JC. 2014. Dissecting cobamidediversity through structural and functional analyses of the base-activating CobT enzyme of Salmonella enterica.Biochim. Biophys. Acta 1840:464–475.
Chen P, Ailion M, Weyand N, Roth J. 1995. The end of the cob operon: Evidence that the last gene (cobT) catalyzessynthesis of the lower ligand of vitamin B12, dimethylbenzimidazole. J. Bacteriol. 177:1461–1469.
Chen P, Atkinson R, Wolf WR. 2009. Single-laboratory validation of a high-performance liquid chromatographic-diode array detector-fluorescence detector/mass spectrometric method for simultaneous determination of water-soluble vitamins in multivitamin dietary tablets. J. AOAC Int. 92:680–689.
Chen P, Wolf WR, Castanheira I, Sanches-Silva A. 2010. A LC/UV/Vis method for determination of

66
cyanocobalamin (VB12) in multivitamin dietary supplements with on-line sample clean-up. Anal. Methods2:1171–1175.
Crofts TS, Seth EC, Hazra AB, Taga ME. 2013. Cobamide structure depends on both lower ligand availability andCobT substrate specificity. Chem. Biol. 20:1265–1274.
Czernichow S, Blacher J, Ducimetiere P, editors. 2003. Enrichissement da la farine vitamines B en Franceproposition d’un programme-pilote. France: Agence Fracaise de securite sanitaire des aliments.
Czerwonka M, Szterk A, Waszkiewicz-Robak B. 2014. Vitamin B12 content in raw and cooked beef. Meat Sci.96:1371–1375.
Denter J, Bisping B. 1994. Formation of B-vitamins by bacteria during the soaking process of soybeans for tempefermentation. Int. J. Food Microbiol. 22:23–31.
Deptula P, Kylli P, Chamlagain B, Holm L, Kostiainen R, Piironen V, Savijoki K, Varmanen P. 2015. BluB/CobT2fusion enzyme activity reveals mechanisms responsible for production of active form of vitamin B12 byPropionibacterium freudenreichii. Microb. Cell Fact. 14:186.
Ekholm P, Reinivuo H, Mattila P, Pakkala H, Koponen J, Happonen A, Hellström J, Ovaskainen M-L. 2007.Changes in the mineral and trace element contents of cereals, fruits and vegetables in Finland. J. Food Compos.Anal. 20:487–495.
Elmadfa I, Singer I. 2009. Vitamin B-12 and homocysteine status among vegetarians: A global perspective. Am.J. Clin. Nutr. 89:1693–1698.
Emery WB, Lees KA, Tootill JPR. 1951. The assay of vitamin B12: Part IV*. The microbiological estimation withLactobacillus leichmannii 313 by the turbidimetric procedure. Analyst 76:141–146.
Elorinne A-L, Alfthan G, Erlund I, Kivimäki H, Paju A, Salminen I, Turpeinen U, Voutilainen S, Laakso J. 2016.Food and nutrient intake and nutritional status of Finnish vegans and non-vegetarians. PLoS One 11:e0148235.
Falentin H, Deutsch SM, Jan G, Loux V, Thierry A, Parayre S, Maillard MB, Dherbécourt J, Cousin FJ, Jardin J,et al. 2010. The complete genome of Propionibacterium freudenreichii CIRM-BIA1T, a hardy actinobacteriumwith food and probiotic applications. PLoS One 5:e11748.
Fisher RA. 1953. Rapid spectrophotometric determination of vitamin B12 in microbial material. J. Agric. FoodChem. 1:951–953.
Ford JE. 1952. The microbiological assay of vitamin B12. Br. J. Nutr. 6:324–330.
Ford JE. 1953. The microbiological assay of vitamin B12. The specificity of the requirement of Ochromonasmalhamensis for cyanocobalamin. Br. J. Nutr. 7:299–306.
de Freitas R, Madec M-N, Chuat V, Maillard M-B, Mukdsi MCA, Falentin H, de Carvalho AF, Valence F, ThierryA. 2015. New insights about phenotypic heterogeneity within Propionibacterium freudenreichii argue against itsdivision into subspecies. Dairy Sci. Technol. 4:465–477.
Friedman HC, Cagen LM. 1970. Microbial biosynthesis of B12-like compounds. Annu. Rev. Microbiol. 24:159–208.
Friedmann HC, Harris DL. 1965. The formation of -glycosidic 5’-nucleotides by a single displacement trans-N-glycosidase. J. Biol. Chem. 240:406–412.
Gentili A, Caretti F. 2013. Analysis of vitamins by liquid chromatography. In: Fanali S, Haddad PR, Poole CF,Schoenmakers P, Lloyd D, eds. Liquid Chromatography. Amsterdam: Elsevier. p. 477–517.
Giménez EC. 2014. Improved AOAC first action 2011.08 for the analysis of vitamin B12 in infant formula andadult/pediatric formulas: First action 2014.02. J. AOAC Int. 97:1397–1402.
Girard C, Berthiaume R, Stabler S, Allen R. 2009. Identification of cobalamin and cobalamin analogues along thegastrointestinal tract of dairy cows. Arch. Anim. Nutr. 63:379–388.
Gray MJ, Escalante-Semerena JC. 2007. Single-enzyme conversion of FMNH2 to 5,6-dimethylbenzimidazole, thelower ligand of B12. Proc. Natl. Acad. Sci. U. S. A. 104:2921–2926.
Green R, Miller JW. 2014. Vitamin B12. In: Zempleni J, Suttie JW, Gregory JF, Stover PJ, eds. Handbook ofVitamins. 5th ed. Boca Raton, FL: CRC Press. p. 448–489.
Gu Q, Zhang C, Song D, Li P, Zhu X. 2015. Enhancing vitamin B12 content in soy-yogurt by Lactobacillus reuteri.Int. J. Food Microbiol. 206:56–59.

8 References
67
Guggisberg D, Risse MC, Hadorn R. 2012. Determination of Vitamin B12 in meat products by RP-HPLC afterenrichment and purification on an immunoaffinity column. Meat Sci. 90:279–283.
Gujska E, Majewska K. 2005. Effect of baking process on added folic acid and endogenous folates stability inwheat and rye breads. Plant Foods Hum. Nutr. 60:37–42.
Hashimoto E, Yabuta Y, Takenaka S, Yamaguchi Y, Takenaka H, Watanabe F. 2012. Characterization of corrinoidcompounds from edible cyanobacterium Nostochopsis sp. J. Nutr. Sci. Vitaminol. 58:50–53.
Hazra AB, Tran JLA, Crofts TS, Taga ME. 2013. Analysis of substrate specificity in CobT homologs revealswidespread preference for DMB, the lower axial ligand of vitamin B12. Chem. Biol. 20:1275–1285.
Herbert V. 1988. Vitamin B-12: plant sources, requirements, and assay. Am. J. Clin. Nutr. 48:852–858.
Hettinga DH, Reinbold GW. 1972. Propionic-acid bacteria- a review. 1. Growth. J. Milk Food Technol. 35:295–301.
Heudi O, Kilinç T, Fontannaz P, Marley E. 2006. Determination of vitamin B12 in food products and in premixesby reversed-phase high performance liquid chromatography and immunoaffinity extraction. J. Chromatogr. A1101:63–68.
Hoffmann CE, Stokstad ELR, Hutchings BL, Dornbush AC, Jukes TH. 1949. The microbiological assay of vitaminB12 with Lactobacillus leichmannii. J. Biol. Chem. 181:635–644.
Hokin B, Adams M, Ashton J, Louie H. 2004. Analysis of the cobalt content in Australian foods. Asia Pac. J. Clin.Nutr. 13:284–288.
Hörig JA, Renz P. 1980. Biosynthesis of vitamin B12: Some properties of the 5,6-dimethylbenzimidazole-formingsystem of Propionibacteirum freudenreichii and Propionibacterium shermanii. Eur. J. Biochem. 105:587–592.
Hörig JA, Renz P, Heckmann G. 1978. Riboflavin as precursor in the biosynthesis of the 5,6-dimethylbenzimidazole moiety of vitamin B12. J. Biol. Chem. 253:7410–7414.
Hörig J, Renz P. 1977. Biosynthesis of vitamin B12: Formation of free 5,6-dimethylbenzimidazole and alpha-ribazole from riboflavin by Propionibacterium freudenreichii. FEBS Lett. 80:337–339.
Hsu S-T, Yang S-T. 1991. Propionic acid fermentation of lactose by Propionibacterium acidipropionici: Effectsof pH. Biotechnol. Bioeng. 38:571–578.
Hugenholtz J. 2013. Traditional biotechnology for new foods and beverages. Curr. Opin. Biotechnol. 24:155–159.
Hugenholtz J, Hunik J, Santos H, Smid E. 2002. Nutraceutical production by propionibacteria. Lait 82:103–112.
Hugenholtz J, Smid EJ. 2002. Nutraceutical production with food-grade microorganisms. Curr. Opin. Biotechnol.13:497–507.
Hugenschmidt S, Schwenninger SM, Gnehm N, Lacroix C. 2010. Screening of a natural biodiversity of lactic andpropionic acid bacteria for folate and vitamin B12 production in supplemented whey permeate. Int. Dairy J.20:852–857.
Hugenschmidt S, Schwenninger SM, Lacroix C. 2011. Concurrent high production of natural folate and vitaminB12 using a co-culture process with Lactobacillus plantarum SM39 and Propionibacterium freudenreichii DF13.Process Biochem. 46:1063–1070.
Indyk HE, Persson BS, Caselunghe MCB, Moberg A, Filonzi EL, Woollard DC. 2002. Determination of vitaminB12 in milk products and selected foods by optical biosensor protein-binding assay: Method comparison. J. AOACInt. 85:72–81.
Institute of Medicine. 1998. Washington, DC: National Academy of Sciences.
Juzeniene A, Nizauskaite Z. 2013. Photodegradation of cobalamins in aqueous solutions and in human blood. J.Photochem. Photobiol. B Biol. 122:7–14.
Kabata-Pendias A, Mukherjee AB. 2007. Trace elements from soil to human. Berlin: Springer.
Kariluoto S, Edelmann M, Nyström L, Sontag-Strohm T, Salovaara H, Kivelä R, Herranen M, Korhola M, PiironenV. 2014. In situ enrichment of folate by microorganisms in beta-glucan rich oat and barley matrices. Int. J. FoodMicrobiol. 176:38–48.
Keck B, Renz P. 2000. Salmonella typhimurium forms adenylcobamide and 2-methyladenylcobamide, but no

68
detectable cobalamin during strictly anaerobic growth. Arch. Microbiol. 173:76–77.
Kelleher BP, Broin SDO. 1991. Microbiological assay for vitamin B12 performed in 96-well microtitre plates. J.Clin. Pathol. 44:592–595.
Kelly RJ, Gruner TM, Sykes AR. 2005. Development of a method for the separation of corrinoids in ovine tissuesby HPLC. Biomed. Chromatogr. 19:329–333.
Keuth S, Bisping B. 1994. Vitamin B12 production by Citrobacter freundii or Klebsiella pneumoniae duringtempeh fermentation and proof of enterotoxin absence by PCR. Appl. Environ. Microbiol. 60:1495–1499.
Kirchner U, Degenhardt K, Raffler G. 2012. Determination of vitamin B12 in infant formula and adult nutritionalsusing HPLC after purification on an immunoaffinity column: First action 2011.09. J. AOAC Int. 95:933–936.
Koskinen P, Deptula P, Smolander O-P, Tamene F, Kammonen J, Savijoki K, Paulin L, Piironen V, Auvinen P,Varmanen P. 2015. Complete genome sequence of Propionibacterium freudenreichii DSM 20271T. Stand.Genomic Sci. 10:83.
Koyyalamudi SR, Jeong SC, Yip Cho K a I, Pang G. 2009. Vitamin B12 is the active corrinoid produced incultivated white button mushrooms (Agaricus bisporus). J. Agric. Food Chem. 57:6327–6333.
Kumar SS, Chouhan RS, Thakur MS. 2010. Trends in analysis of vitamin B12. Anal. Biochem. 398:139–149.
LeBlanc JG, Taranto MP, Molina V, Sesma F. 2010. B-group vitamins production by probiotic lactic acid bacteria.In: Biotechnology of Lactic Acid Bacteria: Novel Applications. p. 211–232.
Lešková E, Kubíková J, Ková iková E, Košická M, Porubská J, Hol íková K. 2006. Vitamin losses: Retentionduring heat treatment and continual changes expressed by mathematical models. J. Food Compos. Anal. 19:252–276.
Li KT, Liu DH, Chu J, Wang YH, Zhuang YP, Zhang SL. 2008. An effective and simplified pH-stat controlstrategy for the industrial fermentation of vitamin B12 by Pseudomonas denitrificans. Bioprocess Biosyst. Eng.31:605–610.
Lingens B, Schild TA, Vogler B, Renz P. 1992. Biosynthesis of vitamin B12: Transformation of riboflavin 2H-labeled in the 1’R position or 1’S position into 5,6-dimethylbenzimidazole. Eur. J. Biochem. 207:981–985.
Loux V, Mariadassou M, Almeida S, Chiapello H, Hammani A, Buratti J, Gendrault A, Barbe V, Aury J-M,Deutsch S-M, et al. 2015. Mutations and genomic islands can explain the strain dependency of sugar utilization in21 strains of Propionibacterium freudenreichii. BMC Genomics 16:1–19.
Lu B, Ren Y, Huang B, Liao W, Cai Z, Tie X. 2008. Simultaneous determination of four water-soluble vitaminsin fortified infant foods by ultra-performance liquid chromatography coupled with triple quadrupole massspectrometry. J. Chromatogr. Sci. 46:225–232.
Luo X, Chen B, Ding L, Tang F, Yao S. 2006. HPLC-ESI-MS analysis of Vitamin B12 in food products and inmultivitamins-multimineral tablets. Anal. Chim. Acta 562:185–189.
Maggio-Hall LA, Escalante-Semerena JC. 1999. In vitro synthesis of the nucleotide loop of cobalamin bySalmonella typhimurium enzymes. Proc. Natl. Acad. Sci. 96:11798–11803.
Marley EC, Mackay E, Young G. 2009. Characterisation of vitamin B12 immunoaffinity columns and methoddevelopment for determination of vitamin B12 in a range of foods, juices and pharmaceutical products usingimmunoaffinity clean-up and high performance liquid chromatography with UV detecti. Food Addit. Contam. PartA 26:282–288.
Marsh K, Zeuschner C, Saunders A. 2012. Health implications of a vegetarian diet: A review. Am. J. LifestyleMed. 6:250–267.
Martens JH, Barg H, Warren MJ, Jahn D. 2002. Microbial production of vitamin B12. Appl. Microbiol. Biotechnol.58:275–285.
Marwaha SS, Sethi RP, Kennedy JF. 1983. Influence of 5,6-dimethylbenzimidazole (DMB) on vitamin B12biosynthesis by strains of Propionibacterium. Enzyme Microb. Technol. 5:361–364.
Miyamoto E, Tanioka Y, Nakao T, Barla F, Inui H, Fujita T, Watanabe F, Nakano Y. 2006. Purification andcharacterization of a corrinoid-compound in an edible cyanobacterium Aphanizomenon flos-aquae as a nutritionalsupplementary food. J. Agric. Food Chem. 54:9604–9607.
Mo H, Kariluoto S, Piironen V, Zhu Y, Sanders MG, Vincken JP, Wolkers-Rooijackers J, Nout MJR. 2013. Effect

8 References
69
of soybean processing on content and bioaccessibility of folate, vitamin B12 and isoflavones in tofu and tempe.Food Chem. 141:2418–2425.
Molina V, Médici M, de Valdez FG, Taranto MP. 2012. Soybean-based functional food with vitamin B12-producing lactic acid bacteria. J. Funct. Foods 4:831–836.
Molina VC, Médici M, Taranto MP, de Valdez GF. 2009. Lactobacillus reuteri CRL 1098 prevents side effectsproduced by a nutritional vitamin B12 deficiency. J. Appl. Microbiol. 106:467–473.
Moore SJ, Warren MJ. 2012. The anaerobic biosynthesis of vitamin B12. Biochem. Soc. Trans. 40:581–6.
Nielsen MJ, Rasmussen MR, Andersen CBF, Nexø E, Moestrup SK. 2012. Vitamin B12 transport from food tothe body’s cells—a sophisticated, multistep pathway. Nat. Rev. Gastroenterol. Hepatol. 9:345–354.
Nishioka M, Kanosue F, Yabuta Y, Watanabe F. 2011. Loss of vitamin B12 in fish (round herring) meats duringvarious cooking treatments. J. Nutr. Sci. Vitaminol. 57:432–436.
Nordic Nutrition Recommendations 2012. 2013. Copenhagen: Nordic Council of Ministers.
Obeid R, Fedosov SN, Nexo E. 2015. Cobalamin coenzyme forms are not likely to be superior to cyano- andhydroxyl-cobalamin in prevention or treatment of cobalamin deficiency. Mol. Nutr. Food Res.:1–9.
Owen SC, Lee M, Grissom CB. 2011. Ultra-performance liquid chromatographic separation and massspectrometric quantitation of physiologic cobalamins. J. Chromatogr. Sci. 49:228–233.
Pakin C, Bergaentzlé M, Aoudé-Werner D, Hasselmann C. 2005. -Ribazole, a fluorescent marker for the liquidchromatographic determination of vitamin B12 in foodstuffs. J. Chromatogr. A 1081:182–189.
Parizzi LP, Grassi MCB, Llerena LA, Carazzolle MF, Queiroz VL, Lunardi I, Zeidler AF, Teixeira PJ,Mieczkowski P, Rincones J, et al. 2012. The genome sequence of Propionibacterium acidipropionici providesinsights into its biotechnological and industrial potential. BMC Genomics 13:562.
Pawlak R, James PS, Raj S, Cullum-Dugan D, Lucus D. 2013. Understanding Vitamin B 12. Am. J. Lifestyle Med.7:60–65.
Pawlak R, Lester SE, Babatunde T. 2014. The prevalence of cobalamin deficiency among vegetarians assessed byserum vitamin B12: a review of literature. Eur. J. Clin. Nutr. 68:541–548.
Piveteau P. 1999. Metabolism of lactate and sugars by dairy propionibacteria: A review. Lait 79:23–41.
Quesada-Chanto A, Schmid-Meyer AC, Schroeder AG, Carvalho-Jonas MF, Blanco I, Jonas R. 1998a. Effect ofoxygen supply on biomass, organic acids and vitamin B12 production by Propionibacterium shermanii. World J.Microbiol. Biotechnol. 14:843–846.
Quesada-Chanto A, Schmid-Meyer AC, Schroeder AG, Fuchter A, Carvalho-Jonas MF, Koehntopp PI, Jonas R.1998b. Comparison of methods for determination of vitamin B12 in microbial material. Biotechnol. Tech. 12:75–77.
Raux E, Schubert HL, Warren MJ. 2000. Biosynthesis of cobalamin (vitamin B12): a bacterial conundrum. Cell.Mol. Life Sci. 57:1880–1893.
Renz P. 1970. Riboflavin as precursor in the biosynthesis of the 5,6-Dimethylbenzimidazole-moiety of vitaminB12. FEBS Lett. 6:187–189.
Renz P. 1999. Biosynthesis of the 5,6-dimethylbenzimidazole moiety of cobalamin and of the other bases foundin natural corrinoids. In: Banerjee R, ed. Chemistry and Biochemistry of B12. New York: Jhon Wiley & Sons Inc.p. 557–575.
Renz P, Weyhenmeyer R. 1972. Biosynthesis of 5,6-dimethylbenzimidazole from riboflavin: Transformation ofC-1’ of riboflavin into C-2 of 5,6-dimethylbenzimidazole. FEBS Lett. 22:124–126.
Roth JR, Lawrence JG, Bobik T a. 1996. Cobalamin (coenzyme B12): synthesis and biological significance. Annu.Rev. Microbiol. 50:137–181.
Salovaara H, Simonson L. 2004. Fermented cereal-based functional foods. In: Hui YH, Meunier-Goddik L, HansenAS, Josephsen J, Nip W-K, Stanfield PS, Toldra F, eds. Handbook of Food and Beverage FermentationTechnology. New York: Marcel Dekker.
Santos F, Vera JL, Lamosa P, de Valdez GF, de Vos WM, Santos H, Sesma F, Hugenholtz J. 2007. PseudovitaminB12 is the corrinoid produced by Lactobacillus reuteri CRL1098 under anaerobic conditions. FEBS Lett.

70
581:4865–4870.
Sato K, Kudo Y, Muramatsu K. 2004. Incorporation of a high level of vitamin B12 into a vegetable, kaiwaredaikon (Japanese radish sprout), by the absorption from its seeds. Biochim. Biophys. Acta 1672:135–137.
Schimpf K, Spiegel R, Thompson L. 2012. Determination of vitamin B12 in infant formula and adult nutritionalsby HPLC: First action 2011.10. J. AOAC Int. 95:313–318.
Selhub J, Paul L. 2011. Folic acid fortification: Why not vitamin B12 also? Biofactors 37:269–271.
enyuva HZ, Gilbert J. 2010. Immunoaffinity column clean-up techniques in food analysis: A review. J.Chromatogr. B 878:115–132.
Shaw W, Bessell C. 1960. The determination of vitamin B12. Analyst 85:389–409.
Skeggs HR, Nepple HM, Valentik KA, Huff JW, Wright LD. 1950. Observations on the use of Lactobacillusleichmannii 4797 in the microbiological assay of vitamin B12. J. Biol. Chem. 184:211–221.
Stabler SP, Allen RH. 2004. Vitamin B12 deficiency as a worldwide problem. Annu. Rev. Nutr. 24:299–326.
Stupperich E, Nexø E. 1991. Effect of the cobalt-N coordination on the cobamide recognition by the humanvitamin B12 binding proteins intrinsic factor, transcobalamin and haptocorrin. Eur. J. Biochem. 199:299–303.
Suomalainen TH, Mäyrä-Makinen AM. 1999. Propionic acid bacteria as protective cultures in fermented milksand breads. Lait 79:165–174.
Swartz ME. 2005. UPLCTM: An introduction and review. J. Liq. Chromatogr. Relat. Technol. 28:1253–1263.
Sych JM, Lacroix C, Stevens MJA. 2016. Vitamin B 12 – Physiology , production and application. In: VandammeEJ, Revuelta JL, eds. Industrial biotechnology of vitamins, biopigments, and antioxidants. Weinheim, Germany:Wiley. p. 129–159.
Szterk A, Roszko M, Ma ek K, Czerwonka M, Waszkiewicz-Robak B. 2012. Application of the SPE reversedphase HPLC/MS technique to determine vitamin B12 bio-active forms in beef. Meat Sci. 91:408–413.
Taga ME, Larsen NA, Howard-Jones AR, Walsh CT, Walker GC. 2007. BluB cannibalizes flavin to form thelower ligand of vitamin B12. Nature 446:449–453.
Taga ME, Walker GC. 2008. Pseudo-B12 joins the cofactor family. J. Bacteriol. 190:1157–1159.
Tanioka Y, Yabuta Y, Yamaji R, Shigeoka S, Nakano Y, Watanabe F, Inui H. 2009. Occurrence of pseudovitaminB12 and its possible function as the cofactor of cobalamin-dependent methionine synthase in a cyanobacteriumSynechocystis sp. PCC6803. J. Nutr. Sci. Vitaminol. 55:518–521.
Taranto MP, Hugenholtz J, De Valdez GF, Sesma F. 2003. Lactobacillus reuteri CRL1098 produces cobalamin.J. Bacteriol. 185:5643–5647.
Teng F, Tanioka Y, Hamaguchi N, Bito T, Takenaka S, Yabuta Y, Watanabe F. 2015. Determination andcharacterization of vitamin B12 compounds in edible sea snails, ivory shell Babylonia japonica and turban shellTurdo Batillus cornutus. Fish. Sci. 81:1105–1111.
Thierry A, Deutsch SM, Falentin H, Dalmasso M, Cousin FJ, Jan G. 2011. New insights into physiology andmetabolism of Propionibacterium freudenreichii. Int. J. Food Microbiol. 149:19–27.
Tinzl-Malang SK, Rast P, Grattepanche F, Sych J, Lacroix C. 2015. Exopolysaccharides from co-cultures ofWeissella confusa 11GU-1 and Propionibacterium freudenreichii JS15 act synergistically on wheat dough andbread texture. Int. J. Food Microbiol. 214:91–101.
Truswell AS. 2007. Vitamin B12. Nutr. Diet. 64:S120–S125.
Varmanen P, Deptula P, Chamlagain B, Piironen V. 2016. Letter to the editor on “Enhancing vitamin B12 contentin soy-yogurt by Lactobacillus reuteri, IJFM. 206:56–59.” Int. J. Food Microbiol. 228:33.
Varo P, Nuurtamo M, Saari E, Koivistoinen P. 1980. Mineral element composition of Finnish foods. IV. Floursand bakery products. In: Koivistoinen P, ed. Acta Agriculturae Scandinavica, Suppl. 22. Uppsala: Almqvist &Wiksell. p. 37–55.
Vorobjeva LI. 1999. Propionibacteria. Dordrecht, The Netherlands: Kluwer Academic Publishers.
Wang P, Zhang Z, Jiao Y, Liu S, Wang Y. 2015. Improved propionic acid and 5,6-dimethylbenzimidazole controlstrategy for vitamin B12 fermentation by Propionibacterium freudenreichii. J. Biotechnol. 193:123–129.

71
Warren MJ, Raux E, Schubert HL, Escalante-Semerena JC. 2002. The biosynthesis of adenosylcobalamin (vitaminB12). Nat. Prod. Rep. 19:390–412.
Watanabe F. 2007. Vitamin B12 sources and bioavailability. Exp. Biol. Med. 232:1266–1274.
Watanabe F, Abe K, Fujita T, Goto M, Hiemori M, Nakano Y. 1998. Effects of microwave heating on the loss ofvitamin B12 in foods. J. Agric. Food Chem. 46:206–210.
Watanabe F, Schwarz J, Takenaka S, Miyamoto E, Ohishi N, Nelle E, Hochstrasser R, Yabuta Y. 2012.Characterization of vitamin B12 compounds in the wild edible mushrooms black trumpet (Craterelluscornucopioides) and golden chanterelle (Cantharellus cibarius). J. Nutr. Sci. Vitaminol. 58:438–441.
Watanabe F, Takenaka S, Abe K, Tamura Y, Nakano Y. 1998. Comparison of a microbiological assay and a fullyautomated chemiluminescent system for the determination of vitamin B12 in food. J. Agric. Food Chem. 46:1433–1436.
Watanabe F, Takenaka S, Kittaka-Katsura H, Ebara S, Miyamoto E. 2002. Characterization and bioavailability ofvitamin B12-compounds from edible algae. J. Nutr. Sci. Vitaminol. (Tokyo). 48:325–331.
Watanabe F, Yabuta Y, Bito T, Teng F. 2014. Vitamin B12-containing plant food sources for vegetarians.Nutrients 6:1861–1873.
Watanabe F, Yabuta Y, Tanioka Y, Bito T. 2013. Biologically active vitamin B12 compounds in foods forpreventing deficiency among vegetarians and elderly subjects. J. Agric. Food Chem. 61:6769–6775.
WHO. 2008. Conclusions of a WHO technical consultation on folate and vitamin B12 deficiencies. Food Nutr.Bull. 29:S238–S244.
Winkels RM, Brouwer IA, Clarke R, Katan MB, Verhoef P. 2008. Bread cofortified with folic acid and vitaminB-12 improves the folate and vitamin B-12 status of healthy older people: a randomized controlled trial. Am. J.Clin. Nutr. 88:348–355.
Van Wyk J, Britz TJ. 2010. A rapid HPLC method for the extraction and quantification of vitamin B12 in dairyproducts and cultures of Propionibacterium freudenreichii. Dairy Sci. Technol. 90:509–520.
Van Wyk J, Witthuhn RC, Britz TJ. 2011. Optimisation of vitamin B12 and folate production byPropionibacterium freudenreichii strains in kefir. Int. Dairy J. 21:69–74.
Ye K, Shijo M, Jin S, Shimizu K. 1996. Efficient production of vitamin B12 from propionic acid bacteria underperiodic variation of dissolved oxygen concentration. J. Ferment. Bioeng. 82:484–491.
Zhang Y, Liu J-Z, Huang J-S, Mao Z-W. 2010. Genome shuffling of Propionibacterium shermanii for improvingvitamin B12 production and comparative proteome analysis. J. Biotechnol. 148:139–143.
Zironi E, Gazzotti T, Barbarossa A, Devicienti C, Scardilli M, Pagliuca G. 2013. Development and validation ofa method using ultra performance liquid chromatography coupled with tandem mass spectrometry fordetermination of vitamin B12 concentrations in milk and dairy products. J. Dairy Sci. 96:2832–2836.
Zironi E, Gazzotti T, Barbarossa A, Farabegoli F, Serraino A, Pagliuca G. 2014. Determination of vitamin B12 indairy products by ultra performance liquid chromatography-tandem mass spectrometry. Ital. J. Food Saf. 3:254–255.
