ferenc peták informatics 2018 - szote.u-szeged.hu file10/8/2018 1 data processing in life sciences...
TRANSCRIPT

10/8/2018
1
Data processing in life sciencesMicrosoft Excel 2016
Lecture 2
Ferenc PetákDepartment of Medical Physics and
Informatics2018
Lecture bonus with Mentimeter
New bonus system
Two bonus points (1%) canbe awarded in each lecture if:
1. Providing a valid full name at the Mentimeter test2. >3 correct answers out of the 4 online test questions
Participation:• Mobile devices with installed Mentimeter
application• Online device with internet access http://www.menti.com

10/8/2018
2
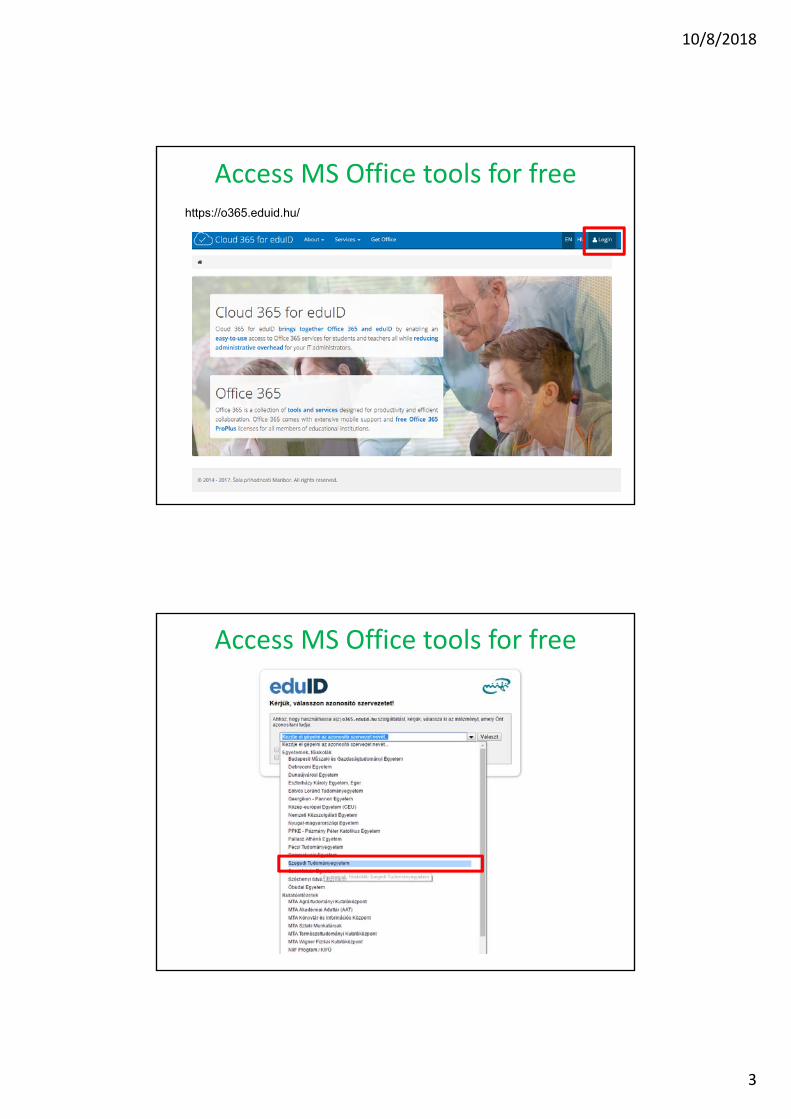
Access MS Office tools for free
https://www.eduid.u-szeged.hu/en
Access MS Office tools for free
https://www.eduid.u-szeged.hu/reg/en
10/8/2018
3
https://o365.eduid.hu/
Access MS Office tools for free
Access MS Office tools for free
Chose: Szegedi Tudományegyetem

10/8/2018
4
Access MS Office tools for free
Access MS Office tools for free

10/8/2018
5
1. Formula, reference types
2. Fill handle
3. Excel functions
4. Sorting and filtering
5. Charts
6. Pivot table, pivot chart
Main topics
Entering formula – arithmetic operations
• The formula is a mathematical expression that calculates a value
• Formulas always begin with „=„ sign• The order of precedence is a set of
predefined rules – in accordance with elementary mathematics
• Operator symbols:– Arithmetic: + - * / ^ ( )– Comparison: = > >= < <= <>– Text concatenate: &
"Those who can, do. Those who cannot, teach. Those who cannot teach, develop spreadsheets." 10
10/8/2018
6
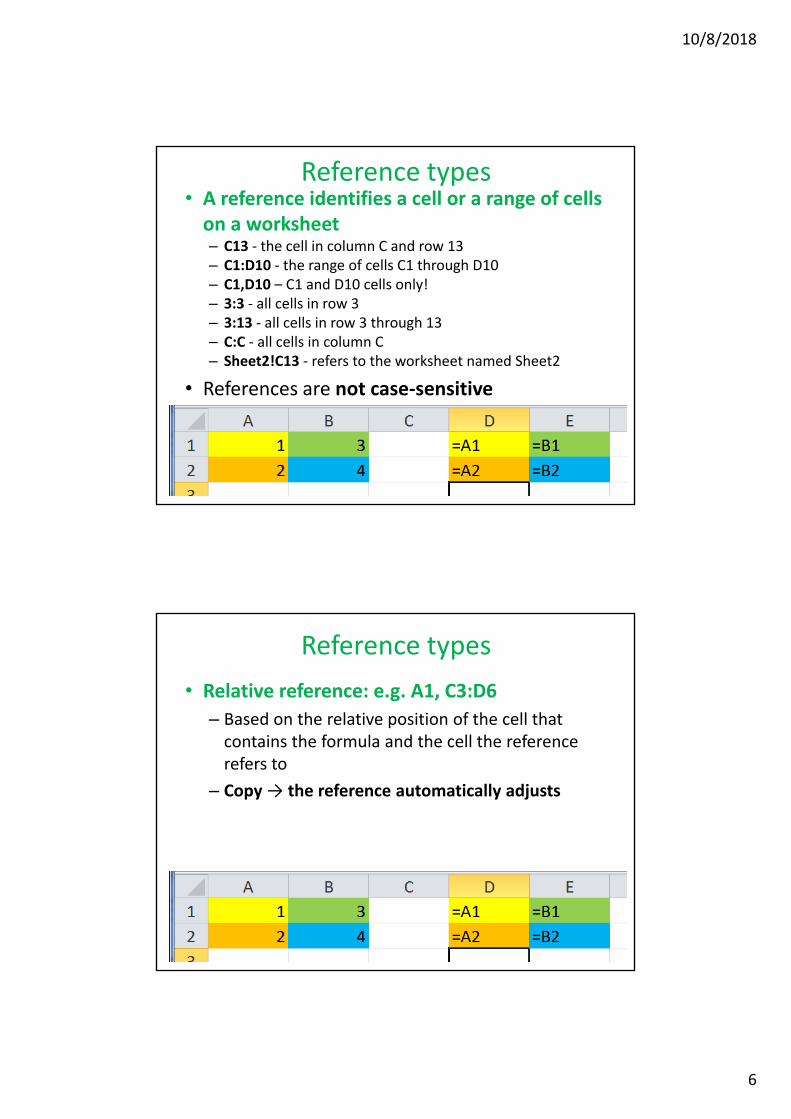
Reference types• A reference identifies a cell or a range of cells on a worksheet– C13 ‐ the cell in column C and row 13– C1:D10 ‐ the range of cells C1 through D10– C1,D10 – C1 and D10 cells only!– 3:3 ‐ all cells in row 3– 3:13 ‐ all cells in row 3 through 13– C:C ‐ all cells in column C– Sheet2!C13 ‐ refers to the worksheet named Sheet2
• References are not case‐sensitive
Reference types
• Relative reference: e.g. A1, C3:D6
– Based on the relative position of the cell that contains the formula and the cell the reference refers to
– Copy→ the reference automatically adjusts
10/8/2018
7
Reference types
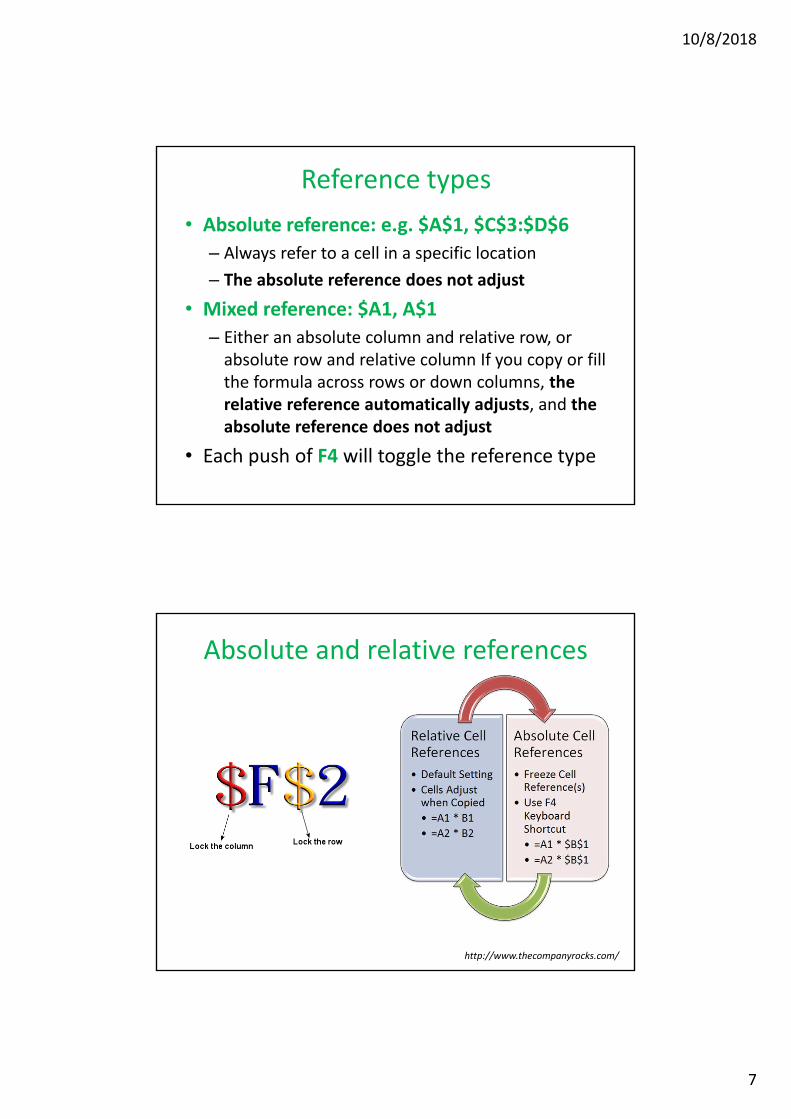
• Absolute reference: e.g. $A$1, $C$3:$D$6
– Always refer to a cell in a specific location
– The absolute reference does not adjust
• Mixed reference: $A1, A$1
– Either an absolute column and relative row, or absolute row and relative column If you copy or fill the formula across rows or down columns, the relative reference automatically adjusts, and the absolute reference does not adjust
• Each push of F4 will toggle the reference type
Absolute and relative references
http://www.thecompanyrocks.com/

10/8/2018
8
The fill handle• Small black dot or square in the
bottom right corner of the active cell
• The use of the fill handle depends on the active cell content:– If the active cell content is a number or text
• Auto Fill other selected cells with the next items in the series
– If the active cell content is a formula or function
• Copy cell content to adjacent cells
• Use: click on it with the mouse pointer to drag select adjacent cells.
• Special use:– Double click: fill until the last cell on the left
Use Excel functions
• The Excel function is a predefined (built‐in) formula for commonly used data processing
• General syntax of the Excel function:
=FunctDef(argument1, argument2 … argumentn)
Defines the function has to be performede.g. =average
=count=stdev
Numbers, text, cell references used by the functionSome arguments are optionalSome functions has no arguments
„There are two ways to develop error‐free spreadsheets. Only the third one works. „

10/8/2018
9
• Excel supplies more than 350 functions organized into 10 categories– Database, Date and Time, Engineering, Financial, Information, Logical, Lookup, Math, Text and Data and Statistical
• Entering a function:– Manual (typing) – risk for a mistake– Insert function button on the Formula bar
– Furmulas tab – Function library group
Use Excel functions
Recommended to avoid mistakes andhave description
Formula barInsert function
Functionlibrary
Use Excel functions
After selecting the appropriate function
Argument required
Argument optional
Preliminary result
Final result

10/8/2018
10
Why sorting?• Easier to follow the
sorted data• Easier to find a specific
information (name, group,treatment, outlier data, etc)
• Helps discovering data entry errors
• Excel help sorting in ascending (increasing) or descending (decreasing) orders
Sorting, ranking
SortingBefore sorting: make sure: all data are selected, or a cell is selected within a continuous table!Tip: a continuous table is sorted based on the category of the selected cell
Made in 2 steps:1. Select data in the
worksheet to be sorted(sorting will be basedon the current column)
2. Data/Sort and Filter• Ascending• Descending order

10/8/2018
11
Filtering
• Working with a subset of data selected form the original data base
• A filtered range displays only the rows that meet the criteria
• Unlike sorting, filtering does not rearrange the data
• Temporarily hides the rows that are not intended to display
Filtering ‐ Autofilter
• Find and work with a subset of data
• After filtering• reapply a filter to get up‐to‐date results
• clear a filter to redisplay all of the data.
Active filters
Current filter options
Subset of data
10/8/2018
12
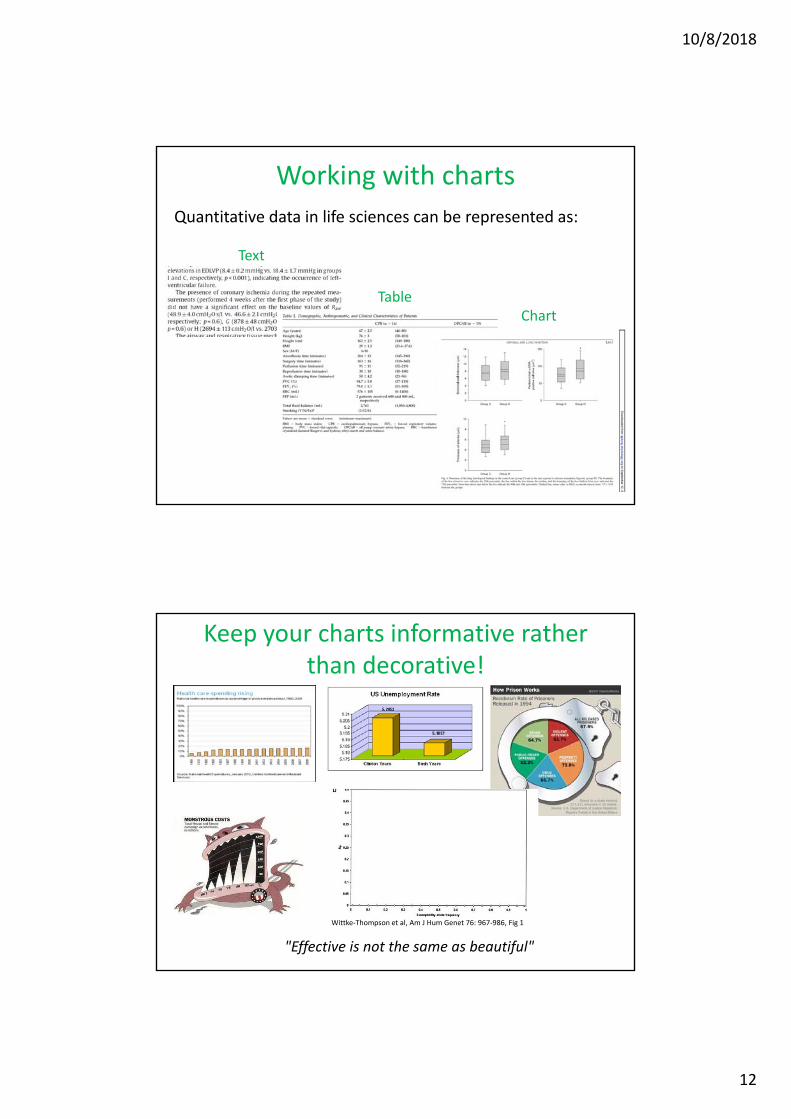
Quantitative data in life sciences can be represented as:
Text
TableChart
Working with charts
Keep your charts informative rather than decorative!
"Effective is not the same as beautiful"
Wittke‐Thompson et al, Am J Hum Genet 76: 967‐986, Fig 1

10/8/2018
13
Working with charts• A chart can be embedded in an existing worksheet
or can be created on a separate worksheet• Access: Insert tab/Charts
• Steps to create a chart:0. Think and plan!1. Select the data range (data series)2. Select chart type3. Insert chart at the specified location4. Choose chat options („Layout” and „Design” tabs)5. Change chart style, location, size
Working with chartsTrend and regression analyses if often performed in life sciencesAdding trendline:• Linear regression• Best fit line• Regression coefficient
• Curve fitting

10/8/2018
14
Pivot table• Summarization tool found in data visualization programs such as spreadsheets or business intelligence software.
• To analyze numerical data in depth and to answer unanticipated questions– Lists data in categories
– Computes summary statistics for those categories
– Pivot chart to display output
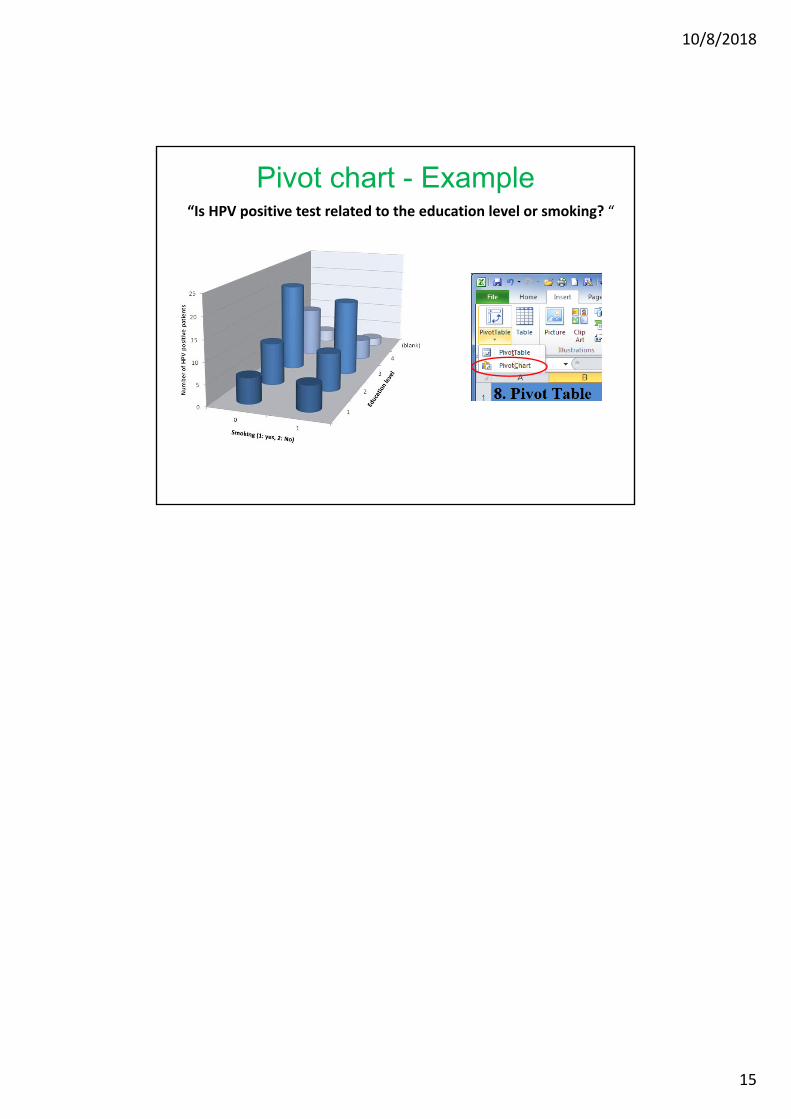
Pivot table - Example“Is HPV positive test related to the education level or smoking? “
No smokingSmoking
Education level
Number of patients
10/8/2018
15
Pivot chart - Example“Is HPV positive test related to the education level or smoking? “