female headed households and poverty in lac: what are we
TRANSCRIPT

1
Female Headed Households and Poverty in LAC: What are we measuring? Authors: Tami Aritomi, Analia Olgiati and Maria Beatriz Orlando
I. INTRODUCTION
Despite its wide usage and acceptance as a well-being proxy, the “self-reported”
head definition has started to increasingly generate debate regarding what this variable is actually measuring. Demographic, cultural, and economic changes have transformed the traditional household head notion, and in particular the female headship concept. Commonly, female headship has been linked to unfavorable circumstances, such as family dissolutions, single/adolescent parenthood, or social/cultural constraints (Whitehead, 1978; Handa, 1996b). As a consequence, female headed households have been largely considered a vulnerable and at risk of poverty group, both among the academic and policy making spheres.
Numerous poverty reduction policy implementations, particularly in Latin America, have targeted these consensually considered “disadvantaged” households. However, recent investigations evidence large variability within this group. Also, important demographic and cultural changes are affecting the typical household structure and its intra-household allocation dynamics. These changes are rapidly raising questions regarding the relevance and accurate interpretation of the self-reported head measure. Analyzing this issue is particularly important because of its implications on poverty reduction policy targeting, and its focus on female headed households.
Originally, the household head had only the purpose of avoiding double counting household members during data collection. Although no intrinsic attribute was granted to the self-reported household head, researchers and later policy makers increasingly assigned a normative authority and income generating responsibility to this member (Barros et. al., 1997). More recently, studies are increasingly criticizing this widespread assumption, indicating that the self-reported household head is not necessarily the breadwinner nor the main decision maker. Cultural biases normally confer the head attribute to the household’s older man.
In order to diminish this bias, alternative headship measures have emerged, aiming at reducing the ambiguity behind the self-reported head measure (Quisumbing et al., 2001; Chant, 2003). Earnings and hours worked-based, as well as asset ownership, participation in social programs, and actual resource allocation-based measures emerge as potentially better capturing the multidimensionality of the headship concept. Unfortunately, the lack of available and particularly comparable data limits these measures’ larger exploration across countries.
This study’s main objectives are twofold, first to explore what various household head measures are actually capturing, particularly focusing on self-reported, earnings-based, and working hours-based measures. Second, to investigate the relationship between these different headship measures and poverty. Analyses use comparative household survey data of 19 Latin American countries from the Socio-Economic Database for Latin America and the Caribbean (SEDLAC) database.
Preliminary results evidence large variability across countries regarding the availability of alternative headship measures. Although the self-reported, earnings-based and hours worked-based definitions are available for all countries, alternative definitions

2
such asset ownership, participation in social programs, and actual resource allocation are less likely to be available. The three available head measures available for all countries are compared. Exploratory principal-component - factor analyses indicate that the self-reported measure has a lower explanatory value compared to the working-head and earning-based head measures. These differences are greater when only female heads are analyzed, and remain consistent across the three countries analyzed (Dominican Republic, Guatemala, and Peru).
Poverty levels differ across head definitions among female headed households. Significant variability is also observed across countries. Comparing female and male headed households (FHH and MHH) using the self-reported head definition, preliminary results indicate that FHH are no more likely to earn less (and potentially being poorer) than MHH. Using non-parametric stochastic dominance analyses, no first-order dominance is observed in most cases when comparing FHHs and MHHs’ per capita income. This result remains analogous when analyses are made by marital status.
II. LITERATURE REVIEW
II.1. Empirical Review: Female Headship and Poverty in Latin America
The relationship between female headship and poverty has been analyzed extensively in the Latin American region. In general, studies rely on self-reported head measures. However, academic research and World Bank Poverty Assessment documents show non-conclusive results regarding this relationship. Discrepancies across studies are even greater when alternative measures are utilized and female heads are categorized by marital status, area of residency, family structure, among other characteristics.
Figure 1: Female Headship and Poverty: Review of World Bank Poverty
Assessments.
By GDP per capita groups
Low Income Middle Income High Income
No Mixed Evidence Yes
Source: Socio-Economic Database for Latin America and the Caribbean (SEDLAC) Notes: 21 countries are included. Low Income (2000 GDP pc <$1500): Bolivia, Ecuador, Guyana,
Honduras, Jamaica, Nicaragua, Paraguay. Middle Income (2000 GDP pc: $1500 - $3000): Colombia, Dom. Rep., Guatemala, Jamaica, Peru, El Salvador. High Income (2000 GDP pc > $3000): Argentina, Brazil, Chile, Costa Rica, Mexico, Panama, Peru, Trin. y Tobago, Uruguay, Venezuela
Indeed, a review of the latest World Bank Poverty Assessment (WB-PA)
documents from 21 Latin American countries confirms the previous statement. Table A1

3
presents a description of all PAs revised (see Annex 1). Results show that in 7 PAs there is a positive effect of female headship and poverty, whereas in 9 PAs, there is no significant effect. The remaining 5 PAs evidence a significant relationship but only for some groups (e.g. only Costal rural residents in Peru or urban residents in Ecuador). These results are more interestingly if countries are grouped by GDP per capita levels (see Figure 1).
Academic studies also evidence large variance regarding this relationship. Buvinic and Gupta (1994) reviewed 61 studies examining the relationship between female headship and poverty in selected developing countries all around the world, covering the 1978-1993 period. Among the 32 Latin-American studies reviewed, 21 illustrate female headed households over-represented among the poor, 8 show some association, and 3 indicate no significant relationship.1 Although the authors conclude that female headship is an important criterion for targeting antipoverty interventions, careful consideration is critical given the large variability within this group.
More recent studies show greater inconsistencies regarding this relationship. Gammage (1998) finds that among 14 Latin American countries under study, only six had female-headed households overrepresented among the poor.2 Quisumbing, et al. (1995) presents a similar result analyzing 10 developing countries in Sub-Saharan Africa, Asia and Central America (Honduras). Although outcomes indicate that poverty among female-headed households is higher, more rigorous tests show less robust results. Indeed, stochastic dominance tests reveal that in only two countries (rural Ghana and Bangladesh), female-headed households have consistently higher poverty levels than male headed households.
Even greater variance is observed if different head measures are considered and different FHH types (e.g. by marital status, age, household structure) are analyzed. Rogers (1995) and Handa (1995) observe differences when alternative head measures are evaluated for the Dominican Republic and Jamaica, respectively. Their results indicate that FHH appear to be better-off when the economic-based measure is utilized, rather than the self-reported one. Similar outcomes are observed in Mexican studies (Cortes, 1997; Echarri, 1995; Gomez de Leon and Parker, 2001). In sharp contrast, Rosenhouse (1989) finds that working-based FHH in Peru tended to have higher headcount poverty ratios than self-reported FHHs.
Fuwa (2000) finds that the headcount poverty ratio among self-reported FHH is 29%, compared to 40% among MHH. However, although these results remain similar when alternative head measures (earnings and hour worked-based) were used, differences by groups are captured. Among the self-reported FHH, those with cohabitant, widows, and indigenous heads experience over-representation among the poor. Similarly, Dréze and Srinivasan (1998) explore widow-headed households. Their findings suggest greater disadvantages among this group compare to other FHH categories.
These results suggest a critical need for a more careful examination of the relationship between female headship and poverty, placing special attention to alternative head measures and various FHH groups. Additionally, temporal and inter-generational
1 Most of the studies utilized the “self-reported” headship definitions although a few had de facto disaggregations, as defined in those cases were a man was not physically present. 2 The six countries are Brazil, Costa Rica, Ecuador, El Salvador and Paraguay, while the rest of countries are Argentina, Bolivia, Chile, Colombia, Dominican Republic, Mexico, Nicaragua and Peru)
4
issues need to be considered. Studies indicate that demographic, economic, and cultural changes are likely to affect the FHH’s poverty risks. Anríquez and Buvinic (1997) show that from 1987 to 1994, Chilean FHH moved from being more likely to be poor than MHH to being less likely. Indeed, FHHs even exhibited per capital incomes 4 percent greater than their male headed counterparts.
Findings exploring the female headship inter-generational effect on children, evidence interesting outcomes. Comparing budget allocation between MHH and FHH, Handa (1996) finds that children in FHH are not worse (and for some specification even better) than MHH, regarding education and heath outcomes. The author explains these results stating that Jamaican women’s headship represents an active decision to live and to raise their children alone. Social and economic conditions, rather than cultural circumstances, motivate this behavior.3
II.2. Theoretical Review: Headship Measures
The household head notion was initially conceptualized in surveys and censuses with the main goal of reducing double counting problems among household members (Rosenhouse, 1994). The household head was defined as the “reference person”, to whom other household members have a specific relationship with, either by blood, marriage/union, adoption, work-related (domestic service), or tenancy. As a result, survey managers regularly started to define the household head as the person who other household members recognize as such (Rosenhouse, 1994). Mainly because of cultural reasons, older male members have normally been designated as self-reported household heads. Recently, some debate has surfaced regarding this definition’s usefulness, particularly because of its value for policy design purposes.
Although the headship definition was not originally intended to grant any intrinsic economic or decision making power characteristic to the designated member, numerous studies have used it as a household’s well-being proxy. More recently, several household head definitions have been utilized to better capture the headship concept. A commonly utilized household head definition is the single or dominant earner and decision maker, who has regular presence in the household (Lampietti, 2000; Rosenhouse, 1994; Varley, 1996). Despite its wide utilization, this definition presents some problems, mainly because, frequently no one sole person actually fulfills all these roles in the household (Lampietti, 2000).
Alternative definitions are presented for correcting some of these issues. Rosenhouse (1989, 1994) proposes a working household head definition based on the number of working hours, potentially more functional for policy purposes. The working head is defined as the household member contributing with the larger number of hours in the labor market. Similarly, the maintained-based household head definition uses the hours worked, but restricts them to those performed for pay (Lloyd and Gage-Brandon, 1991). The household head is, under this definition, the person who works more than fifty
3 An interesting feature of this study is the endogeneity attribute granted to the head variable. Unobserved characteristics are, hence, considered to reduce heterogeneity affecting expenditure decisions. In particular, female heads’ large decision power and their greater preferences for children, potentially increase the household’s resource allocation toward children and family goods. Once these unobserved characteristics are controlled for, the headship effect becomes non-significant on the food and cooking fuel equations.

5
percent of the total household hours worked for earnings. Joint headship is considered when two or more members share the primary work role, contributing with the same maximum proportion of working hours.4
By using the actual number of hours worked, these definitions control both for potential cultural biases (reporting the oldest men as the default head) (Lampietti, 2000), as well as for differentiated labor returns (commonly lower among women) (Varley, 1996). Also, it reduces the large variability among self-reported female head characteristics (e.g. family size, age, marital status, and education) (Lampietti, 2000; Varley, 1996).
Other potential definitions utilize attributes such as the decision power allocation; the ownership of assets; access to labor, financial, or land markets; and social program participation. These definitions are likely to better capture the multidimensionality of poverty, incorporating vulnerability, overall well-being, mental health, and intra-household bargaining power issues.5 Considering these factors is particularly important when exploring poverty risks, typically associated with female headship.
Research has increasingly questioned the usage of the headship variable as a household well-being measure, and particularly the linkages between female headship and high poverty risks (Rosenhouse, 1994; Quisumbing et al., 2001; Chant, 2003). Chant (2003) presents a comprehensive discussion identifying several factors (both “factual” and “fictional”) that had influenced the establishment of this debatable stereotype. Overall, although self-reported heads are more likely to generate debates, other head definitions could also be questioned as appropriate headship concept proxies.
A strong stigma over the female headship status is obvious both at the academic and policy levels (Quisumbing et al., 2001; Chant, 2003, McLanahan and Kelly, 2006). However, recent studies presenting less conclusive effects on poverty risk, lead to certain suspicion not only about the actual relationship, but also regarding what the headship variable is actually measuring. These issues suggest a clear need for better specifying a more comprehensive household head variable, as well as for understanding the actual meaning of the already existing variables.
Cultural biases make self-reported heads more likely to be older men. Barros (1997) argues the self-reported head is the result of household norms, rather than his/her relative economic importance. Indeed, false negatives have been documented, leading to up to 50 percent under-report of female heads (Rosenhouse, 1989; Buvinic, 1978). Typically, this under-report happens when the person answering the first question is reluctant to admit he/she is not the head (or does not know who the head is). Also, according to a report by the United Nations (1995), women are normally not considered the head if a male is present in the household. These issues are even more complicated among multi-family dwellings and households with co-resident extended families.
As a consequence, self-reported female heads tend to be unmarried, divorced, or separated women, commonly living with young children. Although this variable has been largely associated with poverty risk and vulnerability, evidence shows a large diversity
4 Allowing for shared headship provides important information regarding the allocation of financial responsibilities within the household, and their potential associations with household resiliency and coping mechanisms against poverty risks. 5 See Chant (2003) for a more detailed list of studies exploring these issues.
6
within this group (Chant, 2003).6 Considering this variability is fundamental when designing female headed household targeted policies. Evidently, different types of female headed households require different poverty reduction interventions, given their very dissimilar poverty risks, vulnerability levels, as well as access to resilient and coping mechanisms.
In addition, what this self-reported variable is actually capturing is not clear. This head not necessarily has control over resources, nor power over resource allocation or non-financial decisions. Also, this member does not necessarily contribute financially to the household, nor performs household chores, and although has ownership over several assets (such as house or land), his/her effective control over these assets could be negligible.
Definitions based on earnings and working hours are likely to better capture the person’s access to resources. However, some discussion emerges arguing some inherent partiality against women. In general, women tend to have lower labor market participation rates, and to earn less than men (Varley, 1996; Rosenhouse, 1994).7 Also, they are more likely to be part-time and unpaid workers, as well as to have greater housework responsibilities. Defining headship using these criteria is likely to grant a priori certain characteristics to the head that could lead to erroneous conclusions.
Additionally, although largely assumed, these definitions do not necessarily are capturing the head’s potential decision-making power regarding intra-household resource allocations. Evidence indicates that factors such as domestic violence or poor self-confidence, could jeopardize women’s control over financial resources or household decisions (Macmillan and Gartner, 1999, McCloskey, 1996). Indeed, domestic violence is a major response to male partners’ loosing breadwinner power. Recently, increasing male unemployment has been an important factor affecting earning-based female heads’ actual decision power.
Moreover, using these definitions without considering de jure and de facto headship might bias certain results (Lampietti and Stalker, 2000). Households have de jure female heads when they have no male partner present, with no role supporting the household. On the contrary, households have de facto female heads when although no male partner is present, he still has a role supporting the household. These differences are important during periods of economic crises when migration processes are higher.
III. RESULTS
III.1. Methodology: Definitions, Principal-Component Factor Analysis, and Stochastic Dominance.
This investigation’s main purposes are first, to explore what is behind the
household headship concept, and second, to examine the relationship between female
6 For example, studies show that divorced and widowed female headed households have higher per-capital income than their male counterparts (DeGraff and Bilsborrow, 1992). Also, among the more educated, female headed households face similar poverty risks as male headed households. 7 Also, these groups are more likely to experience disadvantages on networking, and decision making capacity within the household.

7
headship and poverty. Principal component- factor analysis is used, comparing differences and similarities between various household head measures. Also, stochastic dominance analyses are utilized for analyzing FHH’s poverty experiences, compared to MHH.
Data come from the Socio-Economic Database for Latin America and the Caribbean (SEDLAC), compiled and managed by CEDLAS (Universidad Nacional de La Plata, Argentina) and the World Bank’s LAC poverty group. Analyses use the most recent available years. An advantage of using the SEDLAC dataset is that it provides comparable and harmonized micro-level data from most Latin American and Caribbean household surveys. This database includes 21 countries (although we will only use 19, excluding Haiti and Suriname), representing more than 92% of the region’s total population.
Exploratory factor analyses are utilized to find the headship variable’s unobserved or latent structure, assuming no a priori theory. The “latent structure” represents the unobservable dimension that clusters several characteristics or factors into a more comprehensive or principal component. This principal component captures the common variance of all the variables (or factors) utilized. Analyses use three household head measures:
• Head 1: the self-reported head, defined as the household member recognized by other household members as the head. This is the definition most commonly utilized in surveys and censuses.
• Head 2: the working hours-based head, defined as the most committed person providing the greater efforts on behalf of the household (i.e. working the greater number of hours) (Rosenhouse, 1994; Lloyd and Gage-Brandon, 1991).
• Head 3: the earnings-based head, defined as the dominant earner in the household (Barros, Fox, & Mendonca, 1997). The Head 1 variable is constructed using the reported information from surveys.
The second definition, Head 2, uses information from hours worked in the main economic activity (both paid and unpaid). The head is the individual working the largest number of hours in the household. Head 3 is generated using information from the main occupation’s total earnings per hour. The head is the person contributing with the greater hourly earnings.
Those cases where joint headship is observed in the household were adjusted using additional information (total hours worked in all occupations, education, and potential experience). The few cases where joint headship remained were removed from the sample. Additionally, heads 15 and younger were also eliminated from the sample.
Stochastic dominance tests follow Quisumbing’s (2001) study, comparing MHHs and FHHs, using the self-reported head measure. Additional analyses are to be developed for the other two alternative head measures. Although this test is main descriptive, this methodology’s main advantages are its flexibility of a non-parametric analysis and its rigorousness for hypothesis testing.
The stochastic dominance test considers two distributions of welfare indicators with cumulative distribution functions, FA and FB. If FA is found to be above FB when evaluated at every point of the support (non-negative real numbers up to a predefined x),

8
then distribution A is said to (strictly) first order dominate distribution B. In terms of welfare, A has a better distribution than B for any welfare function, up to poverty line x, both increasing in the welfare variable (e.g expenditure or income) or “anonymous”.8 First order dominance implies that poverty as measured by P0 is lower for distribution A than for distribution B, regardless of the poverty line chosen. If the two distributions cross within the range of poverty lines considered relevant, the first order dominance does not hold, since different poverty lines and measures will rank the distributions differently.
Dominance results can be considered up to a maximum allowable poverty line if we are not concerned with relative changes in the upper end of the distribution. In this sense, x should be interpreted as the upper bound on the set of reasonable poverty lines.9 Specifying this upper bound implies that redistribution among the very rich will not affect poverty comparisons.10 Similar to Quisumbing (2001), these analyses use a 33 percentile poverty line, considering the overall population’s household income per capita distribution. This bound is usually used as a moderate poverty line in many studies In using this 33-percentile poverty line, we are therefore in the domain of relative poverty comparisons within countries, not cross-country comparisons of absolute poverty.
To perform the comparison, each income distribution is equally divided into 50 points. A t-statistic is computed to test the null hypothesis (i.e. the difference between each point is zero). To avoid problems with the potentially ill-defined lower tails, the computation starts with the second to lowest point. All observations in which the household’s income per capita is zero are eliminated. Poverty is analyzed comparing male and female heads, as well as heads by marital status. III.2 Household Head Measures
The household head concept has been utilized as a regular reference to capture the
overall household well-being level. Traditionally, the self-reported head definition has been the most commonly used across studies. More recently, alternative household head definitions have been increasingly utilized including working head, earning-based head, resource control-based head, decision power-based head, among others. Although they have been used as substitutes, evidence indicates that different household head definitions are likely to lead to different conclusions regarding the effects on poverty alleviation and vulnerability.
Conceptually, different definitions capture different attributes of the general headship concept. They include cultural values; actual financial and non-financial resource control; negotiating and decision power; overall empowerment level; access to labor, credit, or land markets; among others. Although these definitions could potentially describe the same individual within the household, they could as well be identifying very different household members.
8 This is, that there is particular concern if one particular person’s welfare falls, as long as another rises enough to compensate this individual’s fall. 9 However, even if the precise poverty line is unknown, analyses should not exceed x 10 A lower bound can also be specified. This lower bound is equivalent to specifying the lower limit to the range of minimum poverty lines. Below this bound, transfers within the group of the poorest no longer have an effect on the ranking. In this case, a higher than zero cutoff is usually specified because it may not make sense to have poverty lines that are so low that the poor are incorrectly identified as non-poor.
9
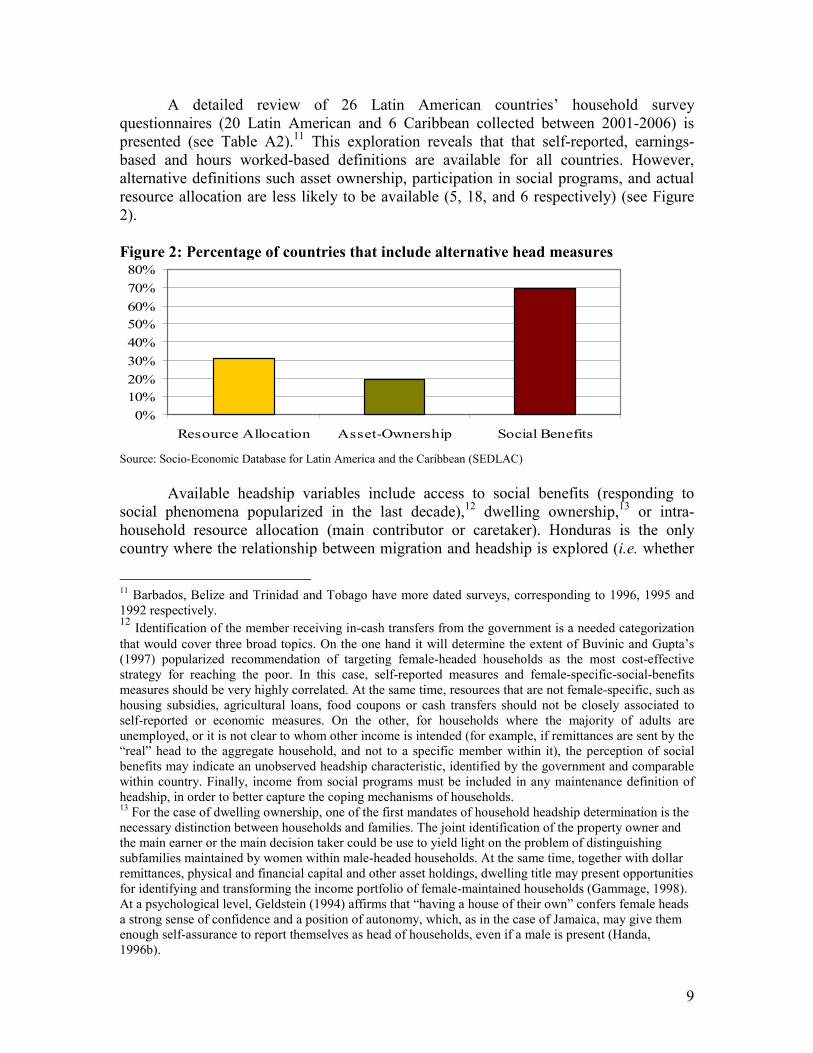
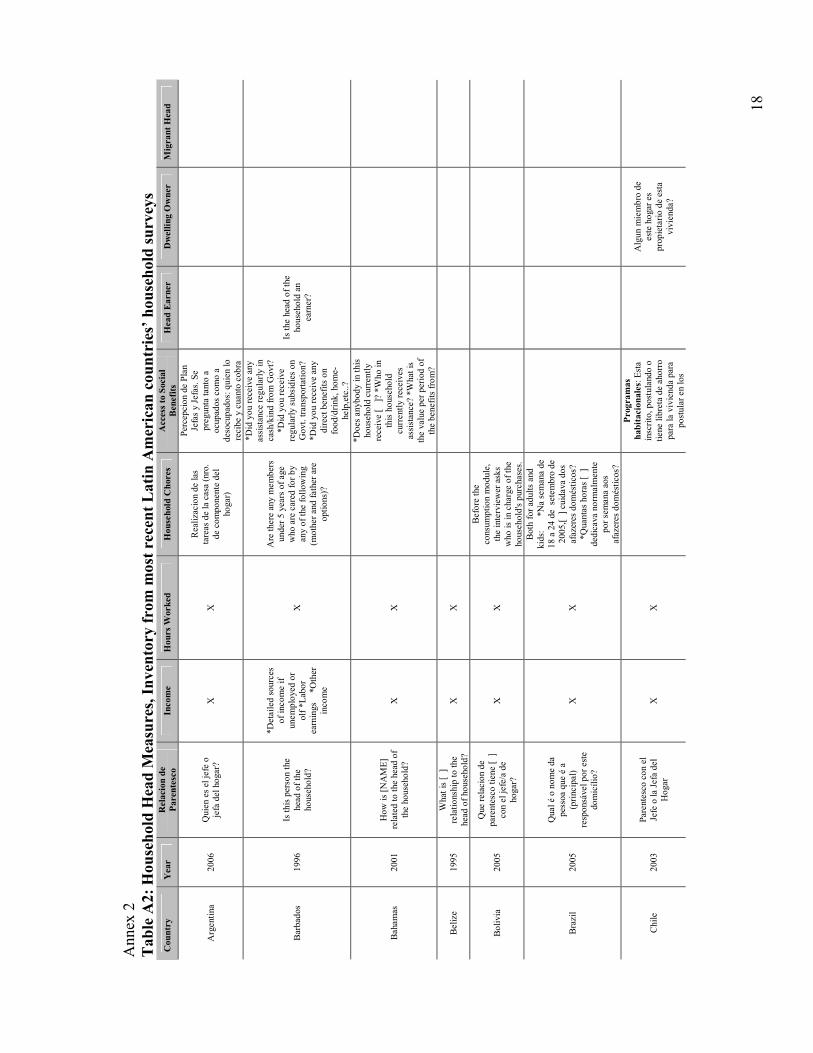
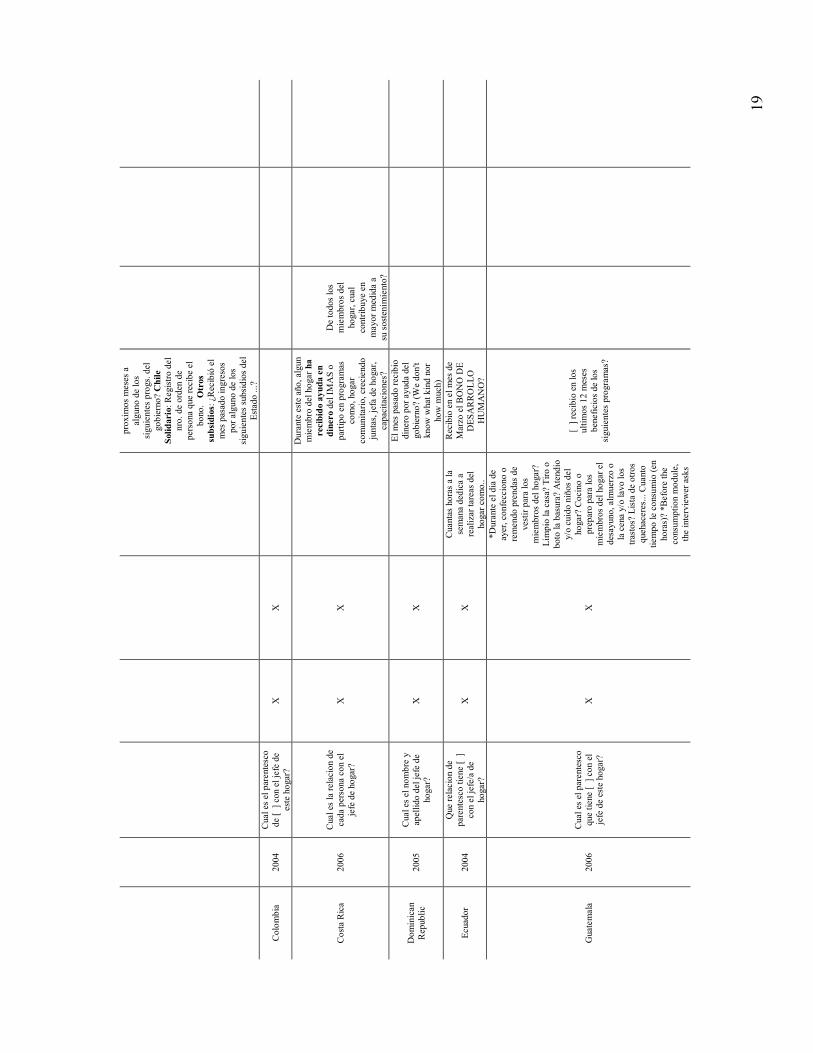
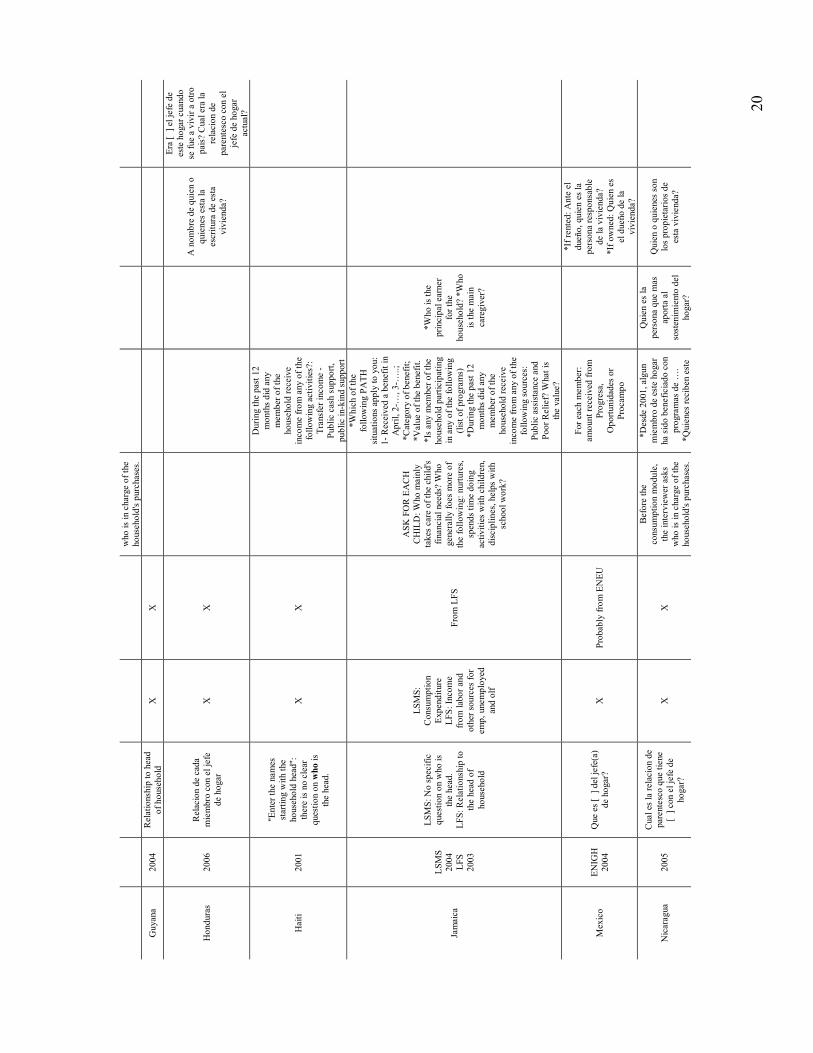
A detailed review of 26 Latin American countries’ household survey questionnaires (20 Latin American and 6 Caribbean collected between 2001-2006) is presented (see Table A2).11 This exploration reveals that that self-reported, earnings-based and hours worked-based definitions are available for all countries. However, alternative definitions such asset ownership, participation in social programs, and actual resource allocation are less likely to be available (5, 18, and 6 respectively) (see Figure 2).
Figure 2: Percentage of countries that include alternative head measures
0%
10%
20%
30%
40%
50%
60%
70%
80%
Resource Allocation Asset-Ownership Social Benefits
Source: Socio-Economic Database for Latin America and the Caribbean (SEDLAC)
Available headship variables include access to social benefits (responding to
social phenomena popularized in the last decade),12 dwelling ownership,13 or intra-household resource allocation (main contributor or caretaker). Honduras is the only country where the relationship between migration and headship is explored (i.e. whether
11 Barbados, Belize and Trinidad and Tobago have more dated surveys, corresponding to 1996, 1995 and 1992 respectively. 12 Identification of the member receiving in-cash transfers from the government is a needed categorization
that would cover three broad topics. On the one hand it will determine the extent of Buvinic and Gupta’s (1997) popularized recommendation of targeting female-headed households as the most cost-effective strategy for reaching the poor. In this case, self-reported measures and female-specific-social-benefits measures should be very highly correlated. At the same time, resources that are not female-specific, such as housing subsidies, agricultural loans, food coupons or cash transfers should not be closely associated to self-reported or economic measures. On the other, for households where the majority of adults are unemployed, or it is not clear to whom other income is intended (for example, if remittances are sent by the “real” head to the aggregate household, and not to a specific member within it), the perception of social benefits may indicate an unobserved headship characteristic, identified by the government and comparable within country. Finally, income from social programs must be included in any maintenance definition of headship, in order to better capture the coping mechanisms of households. 13 For the case of dwelling ownership, one of the first mandates of household headship determination is the necessary distinction between households and families. The joint identification of the property owner and the main earner or the main decision taker could be use to yield light on the problem of distinguishing subfamilies maintained by women within male-headed households. At the same time, together with dollar remittances, physical and financial capital and other asset holdings, dwelling title may present opportunities for identifying and transforming the income portfolio of female-maintained households (Gammage, 1998). At a psychological level, Geldstein (1994) affirms that “having a house of their own” confers female heads a strong sense of confidence and a position of autonomy, which, as in the case of Jamaica, may give them enough self-assurance to report themselves as head of households, even if a male is present (Handa, 1996b).

10
a former head is currently in another country and what is the relationship between the present head and the former one).14 Important consideration on whether the household is actually female or male maintained among households with migrant members is crucial. Income sustainability could largely depend on the residency status of remitting individuals in the host countries as well as their duration of residency (Gammage, 1998).
Exploratory factor analyses are performed to further examine the importance of the three head measures available for all countries. Only three countries are analyzed for the purpose of this specific exercise, Dominican Republic, Guatemala, and Peru.15 Using principal components’ factor analysis, a household head “latent structure” is explored including these three definitions.16
Table 1: Factor Analysis- Principal Component Analysis
Full Sample
Dominican Republic
Guatemala Peru
Total Population Eigenvalue 2.07 2.10 2.11 2.03 Factor loading Head 1 0.78 0.76 0.81 0.78 Head 2 0.82 0.85 0.83 0.81 Head 3 0.88 0.89 0.87 0.88 Female Heads Only Eigenvalue 1.79 1.86 1.78 1.76 Factor loading Head 1 0.66 0.68 0.68 0.64 Head 2 0.79 0.80 0.78 0.80 Head 3 0.85 0.88 0.83 0.85
Source: Socio-Economic Database for Latin America and the Caribbean (SEDLAC) Sample: Population 15 years and older
Overall, outcomes suggest that different definitions are capturing different
components of the household head concept. The principal component analysis suggests that only one factor can be kept.17 In addition, results evidence that, despite their more frequent usage, the self-reported head variable has a lower explanatory value (factor loading equal to 0.78) compared to the working-head (0.82) and earning-based head (0.88) variables. These differences are greater when only female heads are analyzed (0.66 vs. 0.79 and 0.85 respectively).
14 Unfortunately, despite its recognized importance, the lack of data has made the migration-based head
analysis scarce. 15 Analyses will be also later developed for all remaining countries. 16 The “latent structure” represents the unobservable dimension that clusters several characteristics or factors into a more comprehensive concept or component that could capture the common variance of all the variables or factors utilized. 17 Only eigenvalues of the first component are reported. Values of the other factors are smaller than 1. Eigenvalues measure the explored factor’s variance in relation to the total sample variance (from all variables used). Low eigenvalues represent small contributions of the analyzed variables to explaining a principal component.

11
III.3 Female Headship and Poverty Descriptive results support the idea that a narrow classification overlooks the
significant diversity of household heads (Chant, 2003; Rosenhouse, 1994; Varley, 1996). These findings reveal that the headship allocation is conferred to different household members, depending on the definition used. Also, some differences are observed across countries, particularly among female headed households.
Figure 3: Poverty Level
All households vs. Female headed households
11.8%
28.5%
24.7%
8.4%
28.4%
25.4%
11.9%
28.3%
25.3%
0%
5%
10%
15%
20%
25%
30%
35%
40%
Dominican Republic Guatemala Peru
Pro
por
tion
of p
oor
Head 1 Head 2 Head 3
9.2%
23.1%24.8%
15.7%
24.1%
17.9%16.6%
36.0%
19.0%
0%
5%
10%
15%
20%
25%
30%
35%
40%
Dominican Republic Guatemala Peru
Pro
port
ion
of p
oor
Head 1 Head 2 Head 3
Source: Socio-Economic Database for Latin America and the Caribbean (SEDLAC) Sample: Population 15 years and older
Figure 4: Proportion of married/in a union
All households vs. Female headed households
7.0
4.3
7.58.0
4.8
8.3
7.7
4.9
8.5
0
1
2
3
4
5
6
7
8
9
Dominican Republic Guatemala Peru
Yea
rs o
f ed
uca
tio
n
Head 1 Head 2 Head 3
63.2%
78.9%
72.5%
62.8%
73.5%
66.5%
58.6%
73.9%68.3%
0%
10%
20%
30%
40%
50%
60%
70%
80%
90%
Dominican Republic Guatemala Peru
Pro
port
ion
of
hea
ds
in u
nio
n
Head 1 Head 2 Head 3
21.9% 22.9%
12.4%
37.3%40.1%
46.7%
30.2%
48.2%
36.9%
0%
10%
20%
30%
40%
50%
60%
70%
80%
90%
Dominican Republic Guatemala Peru
Pro
por
tio
n of
hea
ds
in u
nion
Head 1 Head 2 Head 3 Source: Socio-Economic Database for Latin America and the Caribbean (SEDLAC) Sample: Population 15 years and older
Results indicate that self reported heads (Head 1) are more likely to be male (with
the exception of Dominican Republic), older, less educated, and married than the other two head definitions (see Table A3). However, these probabilities differ when female heads are solely analyzed. For instance, poverty levels, proportions of married or in a union heads are relatively homogeneous across household head definitions. However, when female heads are analyzed separately, poverty levels and married or in a union percentages show greater variation (see Figure 3 and 4).
Also, Figure 5 indicates that households headed by women, particularly those with working hours-based and earnings-based heads, hold greater proportions of employed members, compared to the average household. This result suggests the existence of a potential protective mechanism against unexpected shocks, among female

12
headed households. This issue is particularly important when analyzing vulnerability risks.
Figure 5: Proportion of employed members
All households vs. Female headed households
7.0
4.3
7.58.0
4.8
8.3
7.7
4.9
8.5
0
1
2
3
4
5
6
7
8
9
Dominican Republic Guatemala Peru
Yea
rs o
f ed
uca
tio
n
Head 1 Head 2 Head 3
41.5%43.2%
49.7%48.8%45.4%
52.8%
41.4%44.7%
53.0%
0%
10%
20%
30%
40%
50%
60%
Dominican Republic Guatemala Peru
Pro
port
ion
of
hea
ds
in u
nio
n
Head 1 Head 2 Head 3
35.5%
42.8%
49.8%50.7%52.6%
55.8%
34.5%
46.9%
56.0%
0%
10%
20%
30%
40%
50%
60%
Dominican Republic Guatemala Peru
Pro
port
ion
of
hea
ds in
uni
on
Head 1 Head 2 Head 3 Source: Socio-Economic Database for Latin America and the Caribbean (SEDLAC) Sample: Population 15 years and older
Stochastic dominance analyses further explore the relationship between FHH and
poverty (see Table A4). Using 70 different comparisons,18 findings indicate that only 7 cases report MHH significantly dominating FHH and 8 where the reverse is true. All of the other cases show no dominance in the strict sense (the uncertain category corresponds to those cases where the lines crossed at the first or the last evaluated point). Clearly, the predominance of “No Dominance” is staggering. These results remained similar for both levels of dissaggregation (see Figure 6).
Figure 6: Stochastic Dominance, Male vs. Female Headed Households and FHH by
Marital Status
MHH vs. FHH
-4
-2
0
2
4
6
8
10
12
14
Aggregate Single Married Divorced
Male dom. Female dom. No Dominance Uncertain
Among FHHs
-6
-4
-2
0
2
4
6
8
10
12
14
Single Married Divorced
Other cat. dom. -Order 1 No Dominance Uncertain
Source: Socio-Economic Database for Latin America and the Caribbean (SEDLAC)
When focusing on female-headed households, comparisons between singles vs.
non-single, married vs. non-married, and divorced vs. non-divorced yield to similar results. The majority of the 51 comparisons were non significant (28) or uncertain (4). Cases where there is dominance, the specific categories (single, married and divorced) significantly dominated (first order) the comparison categories. Results for married women (the men fulfills its traditional role of principal breadwinner) are similar to those in previous studies.
18 This is, comparing MHH and FHH for 19 countries, and breaking these comparisons by marital status for the 17 countries where information was available.

13
However, somewhat surprising are findings for single and divorced women, reporting lower poverty ratios than their non-single and non-divorced counterparts in more countries. The countries were single female heads are less poor are Bolivia, El Salvador, Guatemala and Honduras and divorced female head reveal lower poverty in Bolivia, El Salvador, Guatemala, Jamaica and Paraguay. This could suggest a voluntary decision into those states (conditional on being heads), where an economic support is available for those deciding to remain single or to get divorced. Multivariate analyses are clearly needed to actually understand the relationship between FHH and poverty. IV. CONCLUSIONS
This investigation advances the existing literature, providing grounds for new and
improved measurements of the headship definition. Preliminary results suggest that not only theoretical, but also policy-oriented applied issues should be carefully considered. Although the current situation is far from optimal, it seems plausible that a set of best practices can be developed and put in practice, in part, using the current questionnaires as comparable scenarios. Clearly, statistical offices need to move forward toward including additional questions and modules to better capture the female headship concept.
Preliminary findings provide some guidance for future studies aimed at better understanding alternative headship measures. Clearly, the self-reported head measure requires greater in-depth exploration, not only compared to alternative measures, but also across different countries. In addition, greater poverty risks among particular groups (e.g. single teen mothers) must be considered when designing and targeting anti-poverty policies.
Policy implications are two-fold, first, greater caution needs to be given to the female headship as a mainstream poverty reduction policy targeting tool. Policy implications are likely to differ if alternative head measures are utilized and no consideration of contextual and socioeconomic conditions are taken. Clearly, these problems will lead to ineffective and poorly targeted policy implementations. Second, policy makers and researchers should consider alternative headship measures that could better capture the multidimensionality of the concept. A headship measure able to capture not only the circumstances of becoming a head (either by chance or choice), but also decision making power, resource allocation and control, access to markets, and asset ownership issues, is likely to be a more powerful tool for poverty alleviation policies. Considering these factors is crucial not only for understanding poverty, but also for identifying the vulnerability causes in a more dynamic way.

14
Annex 1
Table A1: Female Headship and Poverty, Review of World Bank Poverty
Assessment Documents
Country Year Measurement Approach Conclusions FHH Poor?
Argentina 2003 Self-reported Descriptive poverty
profile of urban poor
FHH are 24% of Indigent, 22.8 of the Moderate Poor and 32.1 of the non-poor (the overall proportion is 28.1) ==> FHH are less poor than MHH
No
Bolivia 2005 Self-reported
*Descriptive analysis of migration and
poverty (by gender and head/non-head, but not jointly) and
objective and subjective poverty. *Probit estimates of the determinants of
income and self-rated poverty among head
of households
*FHH self-rate themselves as poorer than males (0.50 vs 0.47),
but are less poor in terms of objective poverty (0.53 vs. 0.55).
*In the probit regressions, gender is not a significant determinant of
subjective poverty.
No
Brazil 2006 Self-reported Descriptive poverty
profile
FHH are almost as likely to be poor as individuals from MHH (0.207 vs.
0.217). Thus, gender of the household head does not appear to be a good predictor of the poverty
status of an individual.
No
Chile 2001 Self-reported /
de facto
Reduced emphasis on poverty. Main focus on income per capita
and labor market conditions
FHH have a level of per capita income about 10 percent below that
of MHH Yes (?)
Colombia 2002 Self-reported
Descriptive and estimated (probit - probability of being
poor) poverty profile
Female-headed households do consistently worse than male-headed ones. Contrary to the
descriptive statistics (incidence rates are nearly identical among men and women over the entire period),
when controlling for other household characteristics, the
multivariate analysis shows that female-headed households are
more vulnerable than male-headed ones. In 1988 and 1995, all
female-headed households were facing higher risks than their male
counterparts, and this risk had been increasing, nearly doubling from 18
to 31 percent for the youngest women. In 1999, the risks
decreased, but still remained higher than 1978 risks. This evolution is presumably associated with the
gains on gender wage differentials over the 1995-99 interval (see
section on inequality). The fact that unconditional risk of poverty is
smaller than conditional risk reveals some compensatory effect in terms of income-generating factors (either larger education endowments, lower
Yes

15
dependency ratio, and/or larger employment ratio).
Costa Rica 1997 Self-reported Descriptive poverty
profile of urban poor
32.7% of the (urban) structural poor are FHH; 25.4% of the PL
poor are FHH; 17.6% of the UBN poor and 26.7% of the Non-Poor ==> The poor are often found
among the FHH
Yes
Dominican Republic
2001 Self-reported Probit on the
probability of being poor
Female-headed households are more likely to be poor, particularly
in urban areas, after excluding those that receive remittances. This could
be attributed to the absence of adequate family planning programs
and childcare centers.
Yes
*Descriptive poverty profile of urban poor
*Probit on the probability of being
poor
Ecuador 2004
Self-reported, but emphasize the idea that
the head is the main earner.
*Contradicting results depending on methodology: Urban FHH are more
likely to be poor in Ch. 3 (probit) and less likely in Chapter 2
(descriptive). Four factors can potentially explain this difference:
(i)the use of different datasets, (ii)the use of different poverty
measures (income based here and consumption based in Chapter 2, (iii)the differences in the periods
covered (1997- 2002 here and only 1999 in Chapter2), iv) Controls! *Rural FHH are not statistically
significantly poorer than rural MHH
Some
El Salvador 2005 Self-reported
Reduced enphasis on poverty. Main focus on income per capita
and labor market conditions
In general, the income penalty associated with living in a female-
headed household in 1991 had disappeared by 2002. An exception was among households in the upper
quintiles, who experienced a smaller, but still significant income
penalty (5-9 percent) in 2002, compared to identical male-headed
households.
Some
Guatemala 2003 Self-reported
*Descriptive poverty profile of urban poor
*Probit on the probability of being
poor
MHH have slightly higher poverty rates than those headed by women.
Controlling for other factors, multivariate regressions show no
significant difference between male and female household heads in
determining poverty status (factors, multivariate regressions show no
significant difference between male and female household heads in
determining poverty status.
No
Guyana 1994 Self-reported Descriptive poverty
profile of urban poor
Levels of poverty are similar among male and female-headed
households. No
Haiti 1999 ?
Focus is on remittances reception
and demographic characteristics of
heads: No analysis of income by gender
Unknown ?
Honduras 2006 Self-reported *Descriptive poverty profile of urban poor
*Probit on the
FHH consumption levels tend to be higher. This is at least in part
explained by the fact that female-No

16
probability of being poor
headed households are more likely to be located in urban areas, to have
migrants abroad, and receive remittances. The evidence indicates that female-headed households are not economically better or worse off than other households when holding these and other factors
constant.
Jamaica 1994 Self-reported
*Descriptive poverty profile of urban poor
*Probit on the probability of being
poor
The 1991 SLC data reveal only a weak relationship between headship and level of consumption. Targeting
female heads for programs to alleviate poverty would be less effective than targeting rural
families. Using consumption per adult equivalent, which accounts for
economies of scale in larger families, male-headed households are only 15 percent wealthier in
Jamaica and 28 percent wealthier in Kingstont has female-headed ones. Multivariate regression analysis that
accounts for these and other household characteristics, such as
the education of the head, supports the conclusion that female headship
is only weakly linked to poverty.
Weak Yes
Mexico 2005 ?
Focus is on Social Protection and CCTs.
There is only a regression on the determinants of log(real income)
Female-headed households have 13% more real income than MHH
No
Nicaragua 2003 Self-reported
*Probit on the probability of being
poor *Heckman selection-
corrected income regressions
Overall poverty as well as poverty in urban and rural areas, is consistently
influenced by the following most relevant factors: low education
(female more significant than male), large family size, number of children
under five, and lack of access to electricity (Not gender!). Wage salary is higher for poor female
heads of household earning agro wages both in urban and rural areas,
lower for non-poor urban female head earning non-agro wages and
insignificant in all other cases.
No
Panama 1999
Self-reported, economic and demographic (male absent)
*Probit on the probability of being
poor
Contrary to conventional wisdom, poverty is not higher among
households headed by women than those headed by men. Overall,
female-headed households are not over-represented among the poor in Panama, regardless of the method
used to define household headship.
No
Paraguay 1994 Self-reported
*Descriptive poverty profile of urban poor
*Probit on the probability of being
poor does not include female head
dummy
Female-headed households make up a higher proportion of the very
poor and poor compared to their share in the total population.
Reason: women contribute less than men to household income, even
when they have the same education
Yes

17
*Multivariate analysis is done for labor earnings, where is found that female
earn less.
level.
Peru 2005 Self-reported
*Descriptive poverty profile of urban poor
*Probit on the probability of being
poor
*FHH do not appear to be more likely to be poor than MHH.
Reasons: FHH are more likely to choose strategies that include
participation in the non-agricultural sector; that is, strategies that yield
higher income levels and thus lower poverty.
*In the probit regression FHH have higher probabilities of being poor
only in one rural area (Costa), which is strong enough to make them
significantly poorer at the national level.
Some
Trinidad y Tobago
1995 Self-reported
*Descriptive poverty profile of urban poor *Multivariate analysis
is done for labor earnings, where is found that female
earn less.
The subgroups among the poor include the unemployed, those with low levels of education, and female-
headed households. This can be largely accounted for by the lower labor force participation rates, high unemployment, and lower wages
among women. In addition, women in female headed households have child care responsibilities, which
presents a time constraint that limits their availability for income-generating activities. Also, in
Trinidad and Tobago, the level of remittances is generally low.
Yes
Uruguay 2001 Self-reported
*Descriptive poverty profile of urban poor
*Probit on the probability of being
poor
The characteristics of the poor include individuals with low
education levels, large families, and single female headed households
with children. It is particularly difficult for them to access labor
markets, and for those women who work, their incomes are generally
low making it difficult for them to support their families. These
findings are robust to multivariate analysis.
Yes
Venezuela 2000 Self-reported
*Main focus on labor market conditions *Simple descriptive
poverty profile of the poor
Characteristics of the households that belong to the lowest 40 percent
of the income distribution are: headed by women, uneducated
unemployed and inactive, employed in the informal sector and living in
rural areas
Yes
18
Annex 2
Table A2: Household Head Measures, Inventory from most recent Latin American countries’ household surveys
Country
Year
Relacion de
Parentesco
Income
Hours Worked
Household Chores
Access to Social
Benefits
Head Earner
Dwelling Owner
Migrant Head
Argentina
2006
Quien es el jefe o
jefa del hogar?
X
X
Realizacion de las
tareas de la casa (nro.
de componente del
hogar)
Percepcion de Plan
Jefas y Jefas. Se
pregunta tanto a
ocupados como a
desocupados: quien lo
recibe y cuanto cobra
Barbados
1996
Is this person the
head of the
household?
*Detailed sources
of income if
unemployed or
olf *Labor
earnings *Other
income
X
Are there any m
embers
under 5 years of age
who are cared for by
any of the following
(mother and father are
options)?
*Did you receive any
assistance regularly in
cash/kind from Govt?
*Did you receive
regularly subsidies on
Govt. transportation?
*Did you receive any
direct benefits on
food/drink, home-
help,etc..?
Is the head of the
household an
earner?
Baham
as
2001
How is [N
AME]
related to the head of
the household?
X
X
*Does anybody in this
household currently
receive [ ]? *Who in
this household
currently receives
assistance? *What is
the value per period of
the benefits from?
Belize
1995
What is [ ]
relationship to the
head of household?
X
X
Bolivia
2005
Que relacion de
parentesco tiene [ ]
con el jefe/a de
hogar?
X
X
Before the
consumption m
odule,
the interviewer asks
who is in charge of the
household's purchases.
Brazil
2005
Qual é o nome da
pessoa que é a
(principal)
responsável por este
domicílio?
X
X
Both for adults and
kids: *N
a semana de
18 a 24 de setem
bro de
2005,[ ] cuidava dos
afazeres domésticos?
*Quantas horas [ ]
dedicava norm
almente
por semana aos
afazeres domésticos?
Chile
2003
Parentesco con el
Jefe o la Jefa del
Hogar
X
X
Programas
habitacionales: Esta
inscrito, postulando o
tiene libreta de ahorro
para la vivienda para
postular en los
Algun m
iembro de
este hogar es
propietario de esta
vivienda?
19
proxim
os meses a
alguno de los
siguientes progs. del
gobierno? Chile
Solidario: Registro del
nro. de orden de
persona que recibe el
bono. Otros
subsidios: ¿Recibió el
mes pasado ingresos
por alguno de los
siguientes subsidios del
Estado ...?
Colombia
2004
Cual es el parentesco
de [ ] con el jefe de
este hogar?
X
X
Costa Rica
2006
Cual es la relacion de
cada persona con el
jefe de hogar?
X
X
Durante este año, algun
miembro del hogar ha
recibido ayuda en
dinero del IMAS o
partipo en programas
como, hogar
comunitario, creciendo
juntas, jefa de hogar,
capacitaciones?
De todos los
miembros del
hogar, cual
contribuye en
mayor medida a
su sostenim
iento?
Dominican
Republic
2005
Cual es el nombre y
apellido del jefe de
hogar?
X
X
El mes pasado recibio
dinero por ayuda del
gobierno? (W
e don't
know what kind nor
how m
uch)
Ecuador
2004
Que relacion de
parentesco tiene [ ]
con el jefe/a de
hogar?
X
X
Cuantas horas a la
semana dedica a
realizar tareas del
hogar como..
Recibio en el mes de
Marzo el BONO DE
DESARROLLO
HUMANO?
Guatemala
2006
Cual es el parentesco
que tiene [ ] con el
jefe de este hogar?
X
X
*Durante el dia de
ayer, confecciono o
remendo prendas de
vestir para los
miembros del hogar?
Lim
pio la casa? Tiro o
boto la basura? Atendio
y/o cuido niños del
hogar? Cocino o
preparo para los
miembros del hogar el
desayuno, almuerzo o
la cena y/o lavo los
trastos? Lista de otros
quehaceres... Cuanto
tiempo le consumio (en
horas)? *Before the
consumption m
odule,
the interviewer asks
[ ] recibio en los
ultim
os 12 m
eses
beneficios de los
siguientes programas?
20
who is in charge of the
household's purchases.
Guyana
2004
Relationship to head
of household
X
X
Honduras
2006
Relacion de cada
miembro con el jefe
de hogar
X
X
A nombre de quien o
quienes esta la
escritura de esta
vivienda?
Era [ ] el jefe de
este hogar cuando
se fue a vivir a otro
pais? Cual era la
relacion de
parentesco con el
jefe de hogar
actual?
Haiti
2001
"Enter the nam
es
starting with the
household head":
there is no clear
question on who is
the head.
X
X
During the past 12
months did any
member of the
household receive
income from any of the
following activities?:
Transfer income -
Public cash support,
public in-kind support
Jamaica
LSMS
2004
LFS
2003
LSMS: No specific
question on who is
the head.
LFS: Relationship to
the head of
household
LSMS:
Consumption
Expenditure
LFS: Income
from labor and
other sources for
emp, unem
ployed
and olf
From LFS
ASK FOR EACH
CHILD: Who m
ainly
takes care of the child's
financial needs? W
ho
generally foes m
ore of
the following: nurtures,
spends time doing
activities with children,
disciplines, helps with
school work?
*Which of the
following PATH
situations apply to you:
1- Received a benefit in
April, 2-…
, 3-…
..;
*Category of benefit;
*Value of the benefit.
*Is any m
ember of the
household participating
in any of the following
(list of programs)
*During the past 12
months did any
member of the
household receive
income from any of the
following sources:
Public assistance and
Poor Relief? W
hat is
the value?
*Who is the
principal earner
for the
household? *Who
is the main
caregiver?
Mexico
ENIG
H
2004
Que es [ ] del jefe(a)
de hogar?
X
Probably from ENEU
For each m
ember:
amount received from
Progresa,
Oportunidades or
Procampo
*If rented: Ante el
dueño, quien es la
persona responsable
de la vivienda?
*If owned: Quien es
el dueño de la
vivienda?
Nicaragua
2005
Cual es la relacion de
parentesco que tiene
[ ] con el jefe de
hogar?
X
X
Before the
consumption m
odule,
the interviewer asks
who is in charge of the
household's purchases.
*Desde 2001, algun
miembro de este hogar
ha sido beneficiado con
programas de ….
*Quienes reciben este
Quien es la
persona que mas
aporta al
sostenim
iento del
hogar?
Quien o quienes son
los propietarios de
esta vivienda?

21
beneficio?
Panam
a 2006
Que parentesco o
relacion tiene con el
jefe o la jefa del
hogar?
X
X
A todos los miembros:
Recibio usted ingresos
el m
es pasado por: g)
Subsidios? (Parvis-
Asistencia
Habitacional-O
tro)
Peru
2006
Cual es la relacion de
parentesco con el jefe
de hogar?
X
X
*Quienes recibieron la
ayuda alim
entaria?
*Que programas
sociales de ayuda
alim
entaria recibio?
Paraguay
2005
Relacion de
Parentesco
X
X
El Salvador
2006
Que relacion de
parentesco tiene [ ]
con el jefe/a de
hogar?
X
X
Que otros ingresos ha
tenido durante los
ultim
os 12 m
eses? 06.
Ayuda del gobierno en
efectivo (no sabem
os
cual)
Nro. de orden del
propietario de la
vivienda
Suriname
2001
Position as family
member in relation to
the household head
X
Amount of welfare
benefit for each
member
Trinidad y
Tobago
1992
What is the
relationship of [ ] to
the head of
household?
X
X
*Did [ ] ever apply for
any of the following
form
s of Government
Assistance? *Did [ ]
receive any of those
benefits?
Uruguay
2005
Relacion de
Parentesco
X
X
Venezuela
2005
Parentesco
X
X
Tiene [ ] subsidio
familiar?
Source: Socio-Economic Database for Latin America and the Caribbean (SEDLAC)

22
Annex 3 Table A3.1: Demographic Characteristics
Dominican Republic
Guatemala Peru
Definition Head 1 Percentage of men 68.9% 81.0% 79.3% Mean age 47.38 44.97 48.80 Mean education (years) 6.97 4.29 7.51 Percentage of married 63.2% 78.9% 72.5% Percentage of divorced/separated 20.2% 6.4% 10.3% Household size average 3.74 4.97 4.40 Proportion of dependants 37% 45% 40% Proportion of children under 5 years 9% 15% 10% Proportion of employed 42% 43% 50% Average number of hours worked (main occupation) 43.17 44.83 43.71 Average total family income 16009.4 3097.9 1497.0 Average total family labor income 5165.2 767.9 422.4 Proportion of poor 11.8% 28.5% 24.7% Definition Head 2 Percentage of men 74.3% 76.3% 67.3% Mean age 39.67 37.98 40.74 Mean education (years) 8.04 5.11 8.45 Percentage of married 61.4% 72.1% 65.7% Percentage of divorced/separated 18.1% 5.9% 8.4% Household size average 3.87 4.84 4.45 Proportion of dependants 34.7% 43.7% 39.0% Proportion of children under 5 years 9.8% 16.0% 10.3% Proportion of employed 48.0% 44.8% 52.5% Average number of hours worked (main occupation) 45.13 48.51 49.85 Average total family income 16516.8 3130.9 1494.5 Average total family labor income 5182.9 786.5 403.6 Proportion of poor 8.8% 27.2% 24.7% Definition Head 3 Percentage of men 72.1% 74.6% 74.6% Mean age 41.49 39.43 41.84 Mean education (years) 7.94 4.94 8.54 Percentage of married 59.0% 73.7% 68.2% Percentage of divorced/separated 19.0% 5.7% 8.4% Household size average 3.74 5.01 4.51 Proportion of dependants 36.3% 44.1% 38.8% Proportion of children under 5 years 9.5% 15.6% 10.1% Proportion of employed 43.7% 44.7% 53.0% Average number of hours worked (main occupation) 43.31 45.57 44.82 Average total family income 16394.76 3126.0 1496.0 Average total family labor income 5299.99 767.0 398.8 Proportion of poor 10.2% 28.4% 25.3%
Source: Socio-Economic Database for Latin America and the Caribbean (SEDLAC) Sample: Population 15 years and older

23
Table A3.2: Demographic Characteristics Female Head
Dominican Republic
Guatemala Peru
Definition Head 1 Mean age 49.75 49.94 53.76 Mean education (years) 6.77 3.75 5.94 Percentage of married 21.9% 22.9% 12.4% Percentage of divorced/separated 45.1% 25.5% 36.5% Household size average 3.38 3.86 3.60 Proportion of dependants 39% 45% 41% Proportion of children under 5 years 8% 11% 7% Proportion of employed 36% 43% 50% Average number of hours worked (main occupation) 38.25 37.86 37.80 Average total family income 13382.76 2830.87 1398.60 Average total family labor income 4824.20 872.79 472.29 Proportion of poor 15.7% 24.1% 17.9% Definition Head 2 Mean age 38.58 38.11 40.37 Mean education (years) 9.30 5.60 7.64 Percentage of married 37.5% 42.2% 47.2% Percentage of divorced/separated 38.9% 15.8% 16.9% Household size average 3.74 4.51 4.30 Proportion of dependants 35.2% 41.5% 40.2% Proportion of children under 5 years 8.7% 11.6% 9.2% Proportion of employed 50.2% 52.5% 55.6% Average number of hours worked (main occupation) 43.07 48.57 48.28 Average total family income 17240.1 3436.3 1421.7 Average total family labor income 5508.6 900.8 377.9 Proportion of poor 9.4% 22.8% 24.8% Definition Head 3 Mean age 42.24 41.12 41.74 Mean education (years) 9.06 4.71 8.31 Percentage of married 32.3% 48.3% 37.0% Percentage of divorced/separated 39.6% 15.2% 22.0% Household size average 3.35 4.58 4.09 Proportion of dependants 40.3% 43.8% 38.5% Proportion of children under 5 years 9.0% 12.5% 7.8% Proportion of employed 38.2% 46.8% 56.0% Average number of hours worked (main occupation) 39.44 40.09 41.85 Average total family income 15157.9 2706.1 1546.0 Average total family labor income 5447.2 735.5 418.2 Proportion of poor 13.6% 36.0% 19.0%
Source: Socio-Economic Database for Latin America and the Caribbean (SEDLAC) Sample: Population 15 years and older

24
Annex 4: Table A4.1: Stochastic Dominance
Male vs. Female Headed Households
Aggregate Single Married Divorced
Argentina Order 1*** Order 1* Order 1 except at very low levels Order 1*
Bolivia -- Order 1*** -- Order 1*** -- Order 1***
--Order 2*** --Order 1 except at 33.3% poverty line
Brazil Order 2*** n.a. n.a. n.a.
Chile Order 1*** Order 1*** Dom.not achieved up to Order 3 Order 1***
Colombia
Dom not achieved up to Order 3
Dom not achieved up to Order 3
Dom not achieved up to Order 3
Domnot achieved up to Order 3
Costa Rica
Dom not achieved up to Order 3
Dom not achieved up to Order 3
Dom not achieved up to Order 3 Order 1***
Rep. Dom Order 2* Order 2* Dom not achieved up to Order 3
Dom not achieved up to Order 3
Ecuador -- Order 2*** n.a. n.a. n.a.
El
Salvador -- Order 1*** -- Order 1* Dom not achieved up to Order 3
Dom not achieved up to Order 3
Guatemala -- Order 1*** -- Order 1*** -- Order 1** Dom not achieved up to Order 3
Honduras
Dom not achieved up to Order 3
Dom not achieved up to Order 3
Dom not achieved up to Order 3
Dom not achieved up to Order 3
Jamaica
--Order 1 except at initial point (t-stat:
1.63) Dom not achieved up to Order 3
Dom not achieved up to Order 3
Dom not achieved up to Order 3
Mexico
Dom not achieved up to Order 3
Dom not achieved up to Order 3
Dom not achieved up to Order 3
Dom not achieved up to Order 3
Nicaragua
Dom not achieved up to Order 3
Dom not achieved up to Order 3
Dom not achieved up to Order 3
Dom not achieved up to Order 3
Panama
Dom not achieved up to Order 3
Dom not achieved up to Order 3
Dom not achieved up to Order 3
Dom not achieved up to Order 3
Paraguay
Dom not achieved up to Order 3
Dom not achieved up to Order 3
Dom not achieved up to Order 3
Dom not achieved up to Order 3
Peru
--Order 1 except at initial point (t-stat:
0.33)
--Order 1 except at initial point (t-stat:
0.33)
--Order 1 except at initial point (t-stat:
0.33) Dom not achieved up to Order 3
Uruguay
Dom not achieved up to Order 3
Dom not achieved up to Order 3
Dom not achieved up to Order 3
Dom not achieved up to Order 3
Venezuela
Order 2 except at one point
Dom not achieved up to Order 3
Order 3 except at one point
Dom not achieved up to Order 3
Source: Socio-Economic Database for Latin America and the Caribbean (SEDLAC)

25
Table A4.2: Stochastic Dominance
Female Headed Households by Marital Status
Single Married Divorced
Argentina
--Order 2** --Order 1 except at one
point Dom not achieved up to
Order 3 Dom not achieved up
to Order 3 Bolivia -- Order 1*** -- Order 1* -- Order 1** Brazil n.a. n.a. n.a.
Chile Order 1*** Order 2 except at one
point Order 1***
Colombia Order 2** Order 3* Dom not achieved up
to Order 3
Costa Rica Dom not achieved up to
Order 3 Dom not achieved up to
Order 3 Dom not achieved up
to Order 3
Rep. Dom Dom not achieved up to
Order 3 Dom not achieved up to
Order 3 Dom not achieved up
to Order 3 Ecuador n.a. n.a. n.a. El Salvador -- Order 1*** -- Order 1* -- Order 1*** Guatemala -- Order 1*** -- Order 1*** -- Order 1***
Honduras -- Order 1** Dom not achieved up to
Order 3 Dom not achieved up
to Order 3 Jamaica -- Order 2** Order 2** -- Order 1*
Mexico Dom not achieved up
to Order 3 Dom not achieved up to
Order 3 Dom not achieved
up to Order 3
Nicaragua --Order 1** except at
intial point (t-stat: 1.61) Dom not achieved up to
Order 3 --Order 1* except at
one point
Panama -- Order 2* Dom not achieved up to
Order 3 Dom not achieved
up to Order 3
Paraguay Dom not achieved up
to Order 3 Dom not achieved up to
Order 3 -- Order 1***
Peru Dom not achieved up
to Order 3 Dom not achieved up to
Order 3
--Order 1* except at intial point (t-stat:
1.40)
Uruguay Dom not achieved up
to Order 3 Dom not achieved up to
Order 3 Dom not achieved
up to Order 3
Venezuela Dom not achieved up
to Order 3 Dom not achieved up to
Order 3 Dom not achieved
up to Order 3 Source: Socio-Economic Database for Latin America and the Caribbean (SEDLAC)