feedlot iowa
TRANSCRIPT
8/6/2019 Feedlot Iowa
http://slidepdf.com/reader/full/feedlot-iowa 1/32
Beef FeedlotSystems Manual

8/6/2019 Feedlot Iowa
http://slidepdf.com/reader/full/feedlot-iowa 2/32

8/6/2019 Feedlot Iowa
http://slidepdf.com/reader/full/feedlot-iowa 3/32
Prepared by:
John Lawrence, ISU professor of Economics
Shawn Shouse, ISU Extension Ag Engineer
William Edwards, ISU professor of Economics
Dan Loy, ISU professor of Animal Science
Joe Lally, ISU program coordinator
Rachel E. Martin, former Iowa Beef Center communications specialist
table of contents
Introduction ...............................................................................2
Iowa Cattle Feeding Economics .............................................. 3
Beef Cattle Feedlot Systems .................................................... 6
Manure Management .............................................................. 9
Feedlot Performance and Facility Type ................................. 13
Feed Storage ........................................................................... 15
Feedlot Systems Cost Analysis ............................................ 16
Feedlot Systems Summary ...................................................17
Appendix .........................................................................19 - 27
1

8/6/2019 Feedlot Iowa
http://slidepdf.com/reader/full/feedlot-iowa 4/32
Beef Feedlot Systems ManualIowa’s cattle feeding industry is an important part of the state and local economy. More importantly, it is asignificant enterprise on several thousand Iowa farms.Cattle feeding adds value to corn and forages; more
fully employs farm resources such as labor, facilities,and machinery; and provides profit opportunities forskillful managers. Iowa producers also are reinvest-ing in feedlots to modernize, improve environmentalperformance, and expand their businesses to captureemerging opportunities. Growth of ethanol produc-tion is creating opportunities for cornbelt cattlefeeders and consumer demand for beef has turned thecorner after a long downward trend -- moving cattleprices to a new level.
Iowa is the leading state in ethanol production, whichhas important implications for Iowa’s cattle feed-ing sector. Each bushel of corn converted to ethanolproduces approximately 17 pounds (air dry basis) of distillers grains and solubles (DGS), a high qualityfeedstuff for cattle. DGS works particularly well infeedlot rations and has a higher feed value wet thandry, resulting in a win-win situation for ethanol plantsand nearby cattle feeders. Inclusion rates of DGS to20-40% or more of the dry matter in the ration cansignificantly reduce cost of gain for feedlots. While
early in the transformation, bio-renewable productionwill have a significant impact on Iowa by increasingthe demand for corn. It also creates a significant op-portunity for cattle feeders near ethanol plants.
Demand for high quality beef has fueled value-basedmarketing systems that reward the type of cattleIowans produce. As a result, innovative marketingprograms and alliances have emerged, giving Iowafeeders more choices as to where and how to sell theircattle. Value-based, or grid marketing is rewardingcattle with superior quality grade.
At the same time that the cattle feeding sector ispoised for growth, there is increasing environmental
scrutiny of agriculture in general and open feedlots inparticular. Concerns raised by citizens and organizedgroups about ground and surface water quality areforcing regulatory agencies such as the Environmen-tal Protection Agency (EPA) to step up enforcementof existing laws and consider new ones. Many of the regulations date back to the Clean Water Act of 1972 or major revisions to Iowa’s laws in 1987. The2003 revisions to the Concentrated Animal FeedingOperations (CAFO) regulations will require nutrientmanagement plans and greater public input to thepermit process for CAFOs. While all Iowa producersmust work to protect the waters of the state, feedlotswith more than 1,000 head of capacity must nowadhere to specific regulations regarding runoff controland manure nutrient application. Feedlots consider-ing expansion or new construction must be aware of 1) the environmental regulations and 2) how facilitydesign will impact which regulations apply and theirresulting costs.
This publication describes and evaluates five alter-native feedlot designs at three different size levels.The designs incorporate necessary environmentalcontrol features appropriate for each feedlot sizeunder the regulations at the date of publication.
The analysis incorporates differences in animalperformance, initial investment costs, annualoperating cost, and cost of gain.
As with any modeling analysis, the results dependheavily on the assumptions, and we will explainthe assumptions and the reasoning behind them aswe proceed. Also note that this analysis is based onnew construction, including overhead items such asfeed storage, cattle handling facilities, and feedingequipment. Existing feedlots may already have madethese investments. The analysis assumes a high
enough level of management to meet the performancegoals stated.
2

8/6/2019 Feedlot Iowa
http://slidepdf.com/reader/full/feedlot-iowa 5/32
Iowa Cattle Feeding EconomicsRegional Advantage
Table 1. Average Live Cattle, 1994-2003 for Iowa and Leading Feedlot States
Texas Colorado Kansas Nebraska Iowa
Shrink .................................................. 4% .................. 4% ................. 4% ................. 3% .................. 3%
Average Price ...................................$68.73 ........... $68.71 ........... $68.71 ........... $68.43 ........... $68.52
Shrink adjusted live price .............. $65.95 ........... $65.96 ........... $65.96 ........... $66.38 ........... $66.45
Table 2. Regional BenchMark Steer Data, 2004-2006ADG F/G COG VM PR+CAB Choice Outs
Region lbs ratio $/lbs $/head % % %
Central Plains ............ 3.26 ............ 6.31 ............ 0.55 ............ 13.85 ........... 5.89 ............ 41.56 .......... 11.32
High Plains ................ 3.02 ............ 6.38 ............ 0.56 ............ 13.27 ........... 3.80 ............ 42.31 ........... 9.43
Midwest ...................... 3.18 ............ 7.10 ............ 0.51 ............ 13.28 ........... 9.68 ............ 56.01 .......... 19.52
North Plains ............... 3.28 ............ 6.58 ............ 0.52 ............ 13.82 ........... 9.34 ............ 49.19 .......... 12.31
Source: VetLife, BenchMark, Outs include YG 4 & 5 and Heavy and Light Carcasses
As producers evaluate the alternative facility designsthey must keep in mind the need to:
• create a cattle environment to achieve the targetperformance,
• protect water quality and be neighbor friendly,
• recognize that soil type, rainfall, slope, drainage,
etc., are site specific and affect choices,
• facilitate and encourage proper observation,movement, and management of cattle to assurethat they perform well and people stay safe whenworking cattle.
These objectives can be achieved in a variety of ways in any of the designs considered. Likewise,improper management of even the best designedfacilities will produce unsatisfactory results fromthe cattle and facility.
Iowa has several cattle feeding advantages. The mostobvious is the availability and price of corn and cornprocessing coproducts. During the period 1994-2003,Iowa corn prices averaged from as little as $0.10/buunder southwest Nebraska prices, to as much as$0.35/bu less than in parts of the Texas cattle feedingregion. One concern often raised about feeding cattlein Iowa is that of competition for fed cattle from pack-ers, relative to other regions. During the same 1994-2003 period, Iowa fed cattle prices averaged more thanother regions on a shrink adjusted live price (Table 1).
It is often thought that much of the corn price ad-vantage is given back in poorer performance relatedto Iowa’s weather. However, feedlot closeout analysisindicates that Midwest feedlots have comparable per-formance, superior quality grade, and a cost of gainadvantage over the Central and High Plains (Table 2).Midwest feedlots tend to use more feed per pound of gain and have more Yield Grade 4 and 5 and Heavycarcasses. To achieve this level of performance, feed-lots must be well designed and managed.
3

8/6/2019 Feedlot Iowa
http://slidepdf.com/reader/full/feedlot-iowa 6/32
Yearlings Calves
1996 1997 1998 1999 2000 2001 2002 2003 2004 2005 Average1996-2005
$250
$200
$150
$100
$50
$0
-$50
-$100
Figure 1. Estimated returns per head feeding steer calves and yearlings in Iowa
Figure 2. Average estimated return per head by selling month, 1996-2005
Yearlings Calves
$70
$60
$50$40
$30
$20
$10
$0
-$10Jan Feb Mar Apr May Jun Jul Aug Sep Oct Nov Dec
Historical Perspective
Feeding cattle in Iowa generally has been profitableduring the most recent 10 years. On average, steercalves made a profit of $31 per head over all costs
and yearlings averaged $28 per head over the sameperiod (Figure 1). These averages were influencedby exceptional profits in 2003. More typical profitsare closer to $20/head for a 6 month feeding periodand require approximately $150-200/head equityinvestment. There is a strong seasonal pattern toprofitability (Figure 2). Calves sold during the first sixmonths of the year produced larger average returnsthan sales in the second half of the year. Yearlingsare generally less profitable when sold in the summermonths and more profitable sold in the fall. Naturally,
there are exceptions to these seasonal patterns.
Cattle feeding returns are not without their riskand there are tools available to help producersmanage this risk. Live cattle futures is one
tool to reduce price risk. For the 1990-2005period, futures could be used to hedge a profitin feeding yearling cattle in 65 percent of thetrading days during the feeding period( www.econ.iastate.edu/outreach/agriculture/ periodicals/ifo/IFO_2006/ifo061506.pdf ).In addition to futures and options on futures,Livestock Revenue Protection and LivestockGross Margin Insurance are two relatively newproducts to reduce price risk.
4

8/6/2019 Feedlot Iowa
http://slidepdf.com/reader/full/feedlot-iowa 7/32
A New Strategy for a New Agriculture
Increasing ethanol production is significantlychanging Iowa agriculture. Cattle feeders shouldevaluate their current business in the light of this
new environment.
A traditional view of cattle feeding is as a cornmarketing strategy. Prorating the profits and lossesfrom the Estimated Returns Series for yearling cattleback on a per-bushel-of-corn-fed basis reveals whatmany Iowa cattle feeders have known all along.Feeding cattle adds value to the corn they raise.
For the 15 years, 1988-2003, the average cornprice at north central Iowa elevators in Octoberwas $2.17/bu. Selling equal amounts of corn
each month averaged $2.26 and selling at thehighest monthly average price each year averaged$2.55. If the producer prices the corn into thecattle each month and sells cattle each monththe average value of corn through cattle was$2.58/bu. Marketed through cattle corn price washigher than the October price in 11 of 15 yearsand higher than the highest monthly price in 9 of the 15 years ( www.iowabeefcenter.org/content/ MarketingCornThroughCattleStillWorks.pdf ).Cattle feeding has more upside potential for corn
prices, but cattle feeders need to manage cattleprice risk.
With the rapid increase in ethanol production, cornfarmers are less concerned about adding value tocorn via cattle feeding and are more interested in
the profit advantage of feeding the corn coproductsto cattle. Depending on the distance the feedlot isfrom the ethanol plant and the relative price of wetdistillers grains (WDG) to dry corn in the ration, theprofit increase from feeding WDG is significant.
One strategy is for Iowa farmers to benefit from sellinghigher priced corn to ethanol processors and buyingand feeding the increasingly plentiful distillers grains tocattle. Because of the proximity to ethanol production,Iowa feedlots have a competitive advantage over
regions with higher cost distillers grains.A second strategy is for farmers to produce the sameamount of corn as before, but increase the numberof cattle fed by 20-40 percent by purchasing corncoproducts to add to the ration.
Increasing ethanol production and its demandfor corn is changing agriculture. Feedlot cattlecan use corn coproducts better than other speciesand producers located near the plants will havegreater access to these products at lower costs
than will other cattle feeding regions. Expandingor upgrading feedlot capacity may be a methodto effectively capture opportunities that thebioeconomy is creating.
5

8/6/2019 Feedlot Iowa
http://slidepdf.com/reader/full/feedlot-iowa 8/32
Open lot
W i n d b r e a k f e n c e S e t t l
i n g b a
s i n
D e t e n
t i o n
b a s i n
Beef Cattle Feedlot SystemsFeedlots in Iowa are many and varied. Beef feedingin Iowa has not undergone the consolidation that hasoccurred in other species or other parts of the United
States. Many small feedlots still exist. Althoughthere is a wide range of facility types in the state,most feedlots in Iowa can be classified into one of five different feedlot systems: 1) earthen lot withwindbreak, 2) earthen lot with shed, 3) concrete lotwith shed, 4) complete confinement building with
Overall assumptions for all systems include the following:• Each pen contains 150 head.• One foot of bunk space per head for all systems.• Earthen lots have 16-foot wide concrete aprons under the feedbunks.
• Outdoor lots under 1,000 AU have settling basins designed for a 2.5 inch storm.• Outdoor lots over 1,000 AU have settling and detention basins designed for a 5.2 inch storm.• No cost estimates were made for water supplies; consult local experts for water supply issues.• Manure hauling expenses are based on commercial rates.• All lots assume fence and gates at $10 per foot.
solid floor, and 5) complete confinement buildingwith slatted floor. Facilities may vary greatly fromfeedlot to feedlot particularly as they relate to shelter
and feedlot layout. Each of these systems will havedifferent investment costs and will lead to differentlevels of animal performance. The facilities examinedhere are based on a number of general assumptions inorder to assign costs.
Earthen Lot with Windbreak
In this system, cattle are fed in an open earthen lotwith no shelter. An 8-foot high windbreak fenceprovides some protection against adverse weather.The open lot allows 250 square feet of space peranimal. Thirty square feet per head of mound spaceis provided as a dry resting area. Permanent solidfencing surrounds the lot and a gravel drive liesadjacent to the fence-line feedbunk. Diversions on theupper side of the feedlot direct runoff away from the
lot so only what falls on the lot must be handled. Asettling basin located on the lower side of the feedlot
removes solids from lot runoff and releases the settledliquid to a grassed filter area for lots of less than1,000 AU or to an engineered detention basin for lotsof more than 1,000 AU. The settling and detentionbasins meet current state and federal pollutioncontrol standards. A 16-foot wide concrete apron isused along the feedbunk.
Figure 3. Earthen Lot with Windbreak
6

8/6/2019 Feedlot Iowa
http://slidepdf.com/reader/full/feedlot-iowa 9/32
Earthen Lot with Shed
This system uses a shed that provides 25 square feetper head inside and an earthen lot that provides anadditional 225 square feet per head outside. The shedis a 42-foot wide post frame, uninsulated buildingwith a concrete floor that extends 12 feet outside the
building posts. It is open on the feedlot side with a
ventilation curtain on the back side. Rain gutters keeproof water out of the feedlot. The feedbunk is locatedinside the building along with a 14-foot wide feedalley. Mounds are included as a resting area for thecattle and are sized for 30 square feet per head. Water
diversion and manure management are similar to theearthen lot with windbreak.
Concrete Lot with Shed
This system uses a shed that provides 20 square
feet per head inside and a paved lot that providesan additional 50 square feet per head outside. Theshed is a 36-foot wide post frame, uninsulatedbuilding with a concrete floor. It is open on thefeedlot side with a ventilation curtain on the backside. Rain gutters keep roof water out of the feedlot.
The feedbunk is located inside the building along
with a 14-foot wide feed alley. Because these pensare relatively small, manure must be scraped often,at least weekly. A concrete settling alley below thepens settles solids from runoff and serves as a sortingand handling alley. Water diversion and manuremanagement are similar to the earthen lots. Beddingis not generally used in this system.
Figure 4. Earthen Lot with Shed
Figure 5. Concrete Lot with Shed
Open lot
S e t t l
i n g b a s i n
D e t e n
t i o n
b a s i n
S e t t l i n
g b a s i n
D e t e n t i o
n
b a s i n
P a v e d l
o t
7

8/6/2019 Feedlot Iowa
http://slidepdf.com/reader/full/feedlot-iowa 10/32
Complete Confinement Buildingwith Solid Floor
This system uses an uninsulated buildingapproximately 100 feet wide, with two sets of fence-line feedbunks. One bunk is filled from a drivewayinside the north wall of the building, the other
bunk is filled from outside the south wall of thebuilding. The building provides 40 square feet of pen space per animal. The concrete floor is beddedto create a manure-bedding pack in the middle
of the pens. Some wet manure may be removedweekly from the areas along the feedbunk. The highopen wall on the south and a ventilation curtainalong the north provide natural ventilation. All
manure is handled as a solid. Space is provided inthe building for manure storage between haulingperiods. Narrower buildings with a single row of bunk can be built at similar cost.
Complete Confinement Buildingwith Slatted Floor
Cattle fed in this typical deep-pit facility are
Figure 6. Complete Confinement Building with Solid Floor
Figure 7. Complete Confinement Building with Slatted Floor
Drive-thrufeed alley
Fenceline bunk
Slatted floor
Manurestorage
OpenSide
Feed bunkVentilationcurtain
Concrete floor
8

8/6/2019 Feedlot Iowa
http://slidepdf.com/reader/full/feedlot-iowa 11/32
Manure Management
The change in commercial fertilizer costs since 2001,especially nitrogen and phosphorus, has renewed in-terest in using manure nutrients in crop production.In fact, manure plans now are created to show thesupply of manure nutrients and the crop acres thatare in greatest demand for those nutrients. Manureplans are an agronomic management tool that pro-tects the environment when implemented correctly.
All cattle feedlots of more than 1,000 head are re-quired to have a National Pollution Discharge Elimi-nation System (NPDES) permit issued by the Depart-ment of Natural Resources (DNR) and implement aNutrient Management Plan (NMP) by the summer
of 2007. Smaller cattle feedlot operations will followstate-specific rules and regulations regarding manurecontrol, storage, and nutrient management plans.In Iowa these regulations are minimal. Even if notrequired by regulations, nutrient planning and landapplication have important agronomic considerations.
Regulated NMPs must meet specific criteria outlinedin state law and rules. This includes incorporatingcrop needs with application rates, identifying the spe-
cific land where manure will be applied, and specify-ing planned application methods and timing. Nutri-ent Management Plans (NMPs) must now includethe Natural Resources Conservation Service (NRCS)Phosphorus Index (P Index) rating for each field. TheP Index estimates the potential for P losses from afield based on landscape features, soil test P, and soilconservation and nutrient management practices. Thespecific regulations differ by state, but for Iowa whenanimal manure or other organic byproducts are ap-plied, NMPs must be developed using a crop removal
rate based on either nitrogen or phosphorus. Whetherthe planning process uses nitrogen or phosphorusdepends on several conditions including soil test P,crop rotation, crop yields, P Index rating, manureanalysis, manure application rates, and the field landtreatments and conservation practices.
9

8/6/2019 Feedlot Iowa
http://slidepdf.com/reader/full/feedlot-iowa 12/32
Most nutrient management plans are Nitrogen
utilization plans:
• Manure may be applied to all crops at a rateequal to the nitrogen removal rate (calculated byan approved method) by the harvested crop.
• Applying manure for multiple crop years is ac-ceptable for phosphorous only. This is an accept-ed practice as long as the nitrogen does not exceedthe application year’s crop nitrogen demand.
It is important to access correct manure nutrients andcharacteristics to develop accurate and realistic site-specific nutrient management plans. Understandingthe supply of nutrients available for crop demandin manure teamed up with accurate application andincorporation of the manure will ensure full use of themanure’s value.
The following (Table 3) are estimates of nutrientsexcreted in beef feedlot manure on a per headproduced basis according to PM 1811, ISU(1999).
N P205 K20
Solid, bedded manure from open lots (scraped)/Ton 1 22.......... 16 ..........14
Solid manure from Confinement solid floor/space/yr 2 84.......... 54 ..........78
Liquid manure from deep pit/space/yr3 95.......... 59 ..........83
Liquid runoff from open earthen lots/space/yr3 5............ 2 ..........11
The P Index identifies the risk of nutrients reachingwaters of the state. Depending on the risk categoryof the field, the farmer may apply manure at a ni-trogen rate (lower risk categories), on a phosphorusrate (higher risk categories), or not at all on very highcategories. See Table 4 for risk category criteria forphosphorus.
Operations with an NPDES permit must applymanure based on the DNR P Index Risk Categories.Operations that are not permitted by DNR, but fol-low a Comprehensive Nutrient Management Plan(CNMP) from NRCS must follow the NRCS P IndexRisk Categories. The NRCS procedures are good rec-ommendations to follow to protect water quality foroperations not required to have an NMP or CNMP.
1 based on an estimate of 3 Tons of manure produced per head per year
Due to the extreme variation of manure nutrients from excretion to field application, eachfeedlot should establish a site specific, 3 year history of manure analysis by sampling freshfeedlot manure scrapings in early winter, early spring, and summer stockpile, plus manureaccumulated in sediment control structures (at time of cleanout), and runoff control pondsprior to irrigation. Significant ration changes will create a need to re-sample manures.
A recent 10 year study of open feedlot manure analysis at the University of Nebraska found0.14 pounds of harvested manure nitrogen per head per day, and 0.07 pounds of phosphorusper head per day (2006 Nebraska Beef Report)
2 Small sampling of actual manure analysis
3 PM 1811, ISU
Table 3. Estimated Manure Nutrients lbs
10

8/6/2019 Feedlot Iowa
http://slidepdf.com/reader/full/feedlot-iowa 13/32
Department of Natural Resources (DNR)P Index Risk Categories:
Very Low, 0-1Manure shall not be applied in excess of a
nitrogen-based rate.
Low, >1-2Manure shall not be applied in excess of anitrogen-based rate.
Medium, >2-5Manure may be applied at a nitrogen-based rate if current or planned soil conservation and phosphorusmanagement practices predict the rating of the fieldto be not greater than 5 for the next determination of the phosphorus index. Manure shall not be appliedin excess of two times the phosphorus removed withcrop harvest over the period of the crop rotation.
High, >5-15Manure shall not be applied on a field with a ratinggreater than 5 and less than or equal to 15 until
practices are adopted that reduce the phosphorusindex to at least the medium risk category. However,prior to December 31, 2008, fields with a phosphorusindex greater than 5 and less than or equal to 10 mayreceive manure at a phosphorus-based rate if practices will be adopted to reduce the phosphorusindex to the medium risk category.
Very High, >15Manure shall not be applied on a field with a ratinggreater than 15.
For more informationhttp://www.iowadnr.com/afo/mmp.html#phosphorus
Table 4. Risk Category Criteria for Phosphorus
Natural Resources Conservation Service (NRCS)P Index Risk Categories:
Very Low, 0-1A field in which movement of P off-site will be very
low. If soil conservation and P management practicesare maintained at current levels, impacts on surfacewaters from P losses from the field will be small.
Low, >1-2A field in which movement of P off-site will be low.Although the P delivery to surface water bodies isgreater than from a field with a very low rating, cur-rent soil conservation and P management practiceskeep water quality impairment low.
Medium, >2-5A field in which movement of P off-site will bemedium. Impacts on surface water resources will behigher than for the field with a low rating, and the Pdelivery potential may produce some water qualityimpairment. Careful consideration should be given tofurther soil conservation and P management practicesthat do not increase P delivery to surface water.
High, >5-15A field in which movement of P off-site will be high. Water quality impairment will be large. Remedial
action is required to reduce P movement to surfacewater bodies. New soil and water conservationand/or P management practices are necessary toreduce off-site P movement and water qualitydegradation.
Very High, >15A field in which movement of P off-site will bevery high. Impacts on surface water resources areextreme. Remedial action is required to reduce P
delivery to surface water. All necessary soil and waterconservation practices plus a P management plan,which may require discontinuing P applications, mustbe put in place to reduce water quality impairment.
For more informationhttp://www.ia.nrcs.usda.gov/technical/Phosphorus/ phosphorusstandard.html
11

8/6/2019 Feedlot Iowa
http://slidepdf.com/reader/full/feedlot-iowa 14/32
Increased use of ethanol byproduct feed ingredientsin livestock rations has changed the traditionalassumptions of manure nutrients. A comparisonis listed in Table 5 that illustrates a range from acorn and forage base ration to rations that replaced10 percent, 20 percent, 30 percent, and 40 percentof the corn with byproduct from ethanol production.
Analyses also were performed increasing the dietcrude protein and phosphorous concurrently as
Manure applied on 2-year P removal basisContinuous Corn Corn-Soybean
P % in diet base diet 10% 20% 30% 40% base diet 10% 20% 30% 40%
(DM basis) ...................... 0.29.......0.34 ......0.39 ......0.44 .... 0.49 ..........0.29 .....0.34.......0.39 ......0.44 ..... 0.49
Tons/A .............................12.0.........9.8 ........8.3 ........7.2 ...... 6.4 ............9.2 ....... 7.5.........6.4 ........5.5 ........4.9acres ...................................500 ..... 620 ..... 730 .......840 ..... 950 ...........660 ......810........950 .... 1100 ....1250
Cost of manure/hd ...... $3.40.... $3.60 ....$3.90 ...$4.10 ...$4.40 .......$3.70 ...$4.10.... $4.40 ...$4.70 ...$5.10
Net value manure/hd ...$2.90.... $3.70 ....$4.70 ...$5.70 ...$6.70 .......$1.80 ...$2.50.... $3.40 ...$4.20 ...$5.00
*excerpts from 2006 Nebraska Beef Report
Table 5. Impact of Corn Coproducts on Manure Application
The 3 factors that influence the actual plant availablenutrients following animal excretion are:
• Manure handling/storage/application management• Time between excretion and field application• Environmental factors (temperature, moisture,
wind speed, etc.)
Hauling manure to the field within 7 days of excretionwill provide the highest nitrogen content to the crop.Composting manure within 7 days of excretion willproduce the next most valuable manure productin terms of nitrogen content. Handling manure bycleaning the pen once a year contributes to thegreatest nitrogen loss from manure.
Site specific manure production, quantities handled/ applied coupled with accurate manure analysis, good
crop production yield records, and calibrated ma-nure application equipment will help ensure that theNutrient Management Plan outlined will reward thefeedlot with lower cost of production and improvedenvironmental stewardship.
Sample feedlot record keeping forms that will trackthe National Pollution Discharge Elimination System(NPDES) requirements as well as the operationalmanagement needs can be downloaded at:
www.heartlandwq.iastate/manure
Iowa NRCS P Index can be found at:
www.ia.nrcs.usda.gov/technical/ Phosphorus/phosphorusstandard.html
byproduct use increased. Scenarios were developedfor 2-year application rates for P with various crudeprotein and phosphorous levels. All these variableswere compared for continuous corn (CC) and corn-soybean (C-SB) crop rotations to analyze the croprotation effect. Nutrient values were set at $0.19/lbfor N, and $0.26/lb P for a 2,500 head lot capacity
case study. Assume manure applied to fields that canassimilate all nutrients in the manure.
12

8/6/2019 Feedlot Iowa
http://slidepdf.com/reader/full/feedlot-iowa 15/32
Facility design that improves animal comfort alsomay improve cattle performance. A considerableamount of research was conducted, primarily in the
1970s, that evaluates cattle performance and facilitytype. A summary of this research is shown in table 6.
Considerable variation exists in these studies. Howev-er, there appear to be certain consistent trends. Thoseinclude reduced feed intake in total confinement andimproved efficiency in open lots when shelter is pro-vided. The more recent 10-year analysis of 1,836 Iowacloseouts showed similar confinement and shelter ef-fects on feedlot performance. Based on the early stud-ies, it was assumed that cattle fed in open lots withshelter would be 5 percent more efficient than cattle
fed in open lots without shelter. It also was assumedthat confinement cattle consume 5 percent less feed,
Feedlot Performance and Facility Typebut are 2-3 percent more efficient than cattle fedin open lots. Average performance assumptions forcalves and yearlings were based on recent closeouts
summarized in the State of Iowa Summaries (Wilsonand Loy, various issues). The average performancewas then adjusted for facility type based on the previ-ously stated assumptions.
Limited experimental data exist on the relative per-formance of cattle fed in solid-floor total-confinementsystems. It was assumed that cattle performance inthese systems would be similar to the open lot withshelter system, based on closeouts from systemsin South Dakota and early research from Iowa StateUniversity and South Dakota State University. The per-
formance assumptions for steer calves and yearlings foreach of the facility types is shown in table 7.
Feeding Trials % Change
Feed RequiredConfinement vs. open lots w/o shelter Feed Intake Per Lb. Gain
Iowa State (Allee, 1970-75) ....................................... -7.90 .......................... -6.80Iowa State (Allee, 1978-83) ....................................... -9.10 ........................... 2.10Minnesota (Morris, 1970-76) .................................... -0.60 .......................... -4.50Minnesota (Morris, 1977-78) ..................................... 6.00 ..........................-5.10Nebraska (1974-75) .................................................. -3.50 .......................... -1.00Missouri (Commercial feedlot, 1974-82) ............... -12.00 ..........................-1.00Iowa State (Closeout summaries, 1988-97) .............. -6.00 ..........................-1.00
Feed RequiredShelter vs. no shelter in open lots Per Lb. Gain
Iowa State (Allee, 1970-75) .......................................................................... -9.20Iowa State (1978-83) .................................................................................... -5.50Minnesota (Morris, 1970-76) ....................................................................... -2.40
Minnesota (Morris, 1977-78) ....................................................................... -6.70Henderson & Geasler, 13-study summary ................................................... -5.00Iowa State (Closeout summaries, 1988-97) ................................................. -3.00
Table 6. Feeding Trial Summaries Confinement and Shelter Effects
on Feed Intake and Feed Efficiency
13

8/6/2019 Feedlot Iowa
http://slidepdf.com/reader/full/feedlot-iowa 16/32
storage, including silage bunkers, additional costsshould be assumed. The rations used in this analysis
included dry rolled corn, tub ground hay, modifieddistillers grains (MDG, 50 percent of dry matter) andsupplement (vitamin-mineral premix). Obviously,many other feedstuffs and successful feedlot rationsexist. This one is somewhat common statewide andincludes flexibility. The total feed requirements forsteer calves and yearlings by facility-type assumed inthe economic analysis are shown in table 8.
Yearling Steers Steer Calves
Sheltered ShelteredOpen Lots Open Lots
Open Lots Partial Confine. Total Open Lots Partial Confine. Total(no shelter) Solid-floor Confine. Confine. (no shelter) Solid-floor Confine. Confine.
Corn (bu.) ................................ 47.70 .............. 45.60 ............. 46.80 ............ 49.30 ............ 47.10 ........... 47.80
Hay (ton) .................................. 0.213 .............. 0.204 ............. 0.210 ............ 0.362 ............ 0.346 ........... 0.350
Distillers Grain (50% dm-ton) ........ 0.906 .............. 0.866 ............. 0.890 ............ 1.025 ............ 0.980 ........... 0.994
Supplement (lb.) ............................ 97 .................... 92 ................... 95 ............... 128 ............... 122 .............. 124
Table 7. Feed Usage Assumptions of Yearling Steers and Steer Calves Fedin Differing Facility Types
Feedstuffs used for feedlot rations are quite variablein Iowa. Many feeders harvest the majority of their
feedstuffs from their own grain operations. Therequired type of storage ranges from dry commoditystorage to fermented feeds including silage and highmoisture corn. Other feeders rely more heavily onpurchased feeds, including byproducts and othercommodities. In this analysis the system that allowsthe most flexibility and incorporates only 2 to3 weeks storage of processed feeds was chosen.If the producer chooses to incorporate longer-term
Yearling Steers Steer Calves
Sheltered ShelteredOpen Lots Open Lots
Open Lots Partial Confine. Total Open Lots Partial Confine. Total(no shelter) Solid-floor Confine. Confine. (no shelter) Solid-floor Confine. Confine.
Ave. Daily Gain (lbs) .......... 3.14 ................... 3.29 .............. 3.05 ............. 2.95 ................... 2.95 ................ 2.72
Feed/gain, Dry Matter ........ 7.25 ................... 6.90 .............. 6.90 ............. 6.85 ................... 6.50 ................ 6.65
Dry Matter intake (lbs) ......22.80 ................ 22.80 ............ 22.80 ........... 20.20 ................. 20.20 ............. 19.20
Days on Feed ....................... 159 .................... 152 ............... 164 .............. 203 .................... 194 ................. 207
Table 8. Feed Requirements for Yearling Steers and Steer Calves Fedin Differing Facility Types
14

8/6/2019 Feedlot Iowa
http://slidepdf.com/reader/full/feedlot-iowa 17/32
Feed StorageCommodity feed storage is needed for holding corn,ground hay, MDG, and supplement. The followingassumptions were made to calculate the price. The
shed was a monoslope building with bins that were12 feet wide, 36 feet deep with a wall height of five feet.Corn and coproducts were stored to a height of five feet.Ground hay was blown in, to a height of 10 feet.
Construction cost was $9 per square foot. Supplementwas stored in a steel bulk bin.
Table 9. Estimated Feed Storage Facility Costs
The following feed delivery assumptions were used tocalculate prices. Corn and coproducts were deliveredonce per week for the 750 and 1,500 head feedlots,
and twice per week for the 5,000 head feedlot. Haywas ground and blown into the shed once every twoweeks for all the operations. Supplement would bedelivered every two weeks for all operations. Thesummary of estimated feed storage costs by storagefacility is shown in table 9.
Operation Size
750 Head 1,500 Head 5,000 Head
Corn Bins ................................................. 1 ........................ 2 ......................... 4
Ground Hay Bins ..................................... 1 ........................ 2 ......................... 7
Coproducts Bins ........................................1 ........................ 2 ......................... 3
Commodity Shed Bins .................. $9,750 ............ $19,500 ............ $50,000
Supplement Bulk Bin (tons) ................... 3 ........................ 6 ...................... 20
Bulk Bin Cost ................................... $1,260 .............. $1,910 ............... $5,040
Total Cost ..................................... $11,010 ............ $21,410 ............ $55,040
15
8/6/2019 Feedlot Iowa
http://slidepdf.com/reader/full/feedlot-iowa 18/32
The initial investment required to construct eachof the five feedlot systems described earlier issummarized in tables 10-14 (pages 19-23). For each
system, the cost of a facility with a one-time capacityof 750 head, 1,500 head, and 5,000 head is shown.All systems are designed to meet EPA guidelines.
It was assumed that the land was already owned;hence, no investment cost is shown for land.However, if a site for the feedlot must be acquired,this investment cost should be added. The estimatednumber of acres needed for the feedlot and theenvironmental structures is shown for each systemand capacity. Also, well capacity and cost are site
specific and are not included here.All other items reflect a new purchase or constructioncost, including design fees. For many feeders, some of the items listed already may be available.
Tables 10-14 also show the annual cost of owningand maintaining each feedlot. In table 15 (page24) the assumed depreciable life is shown for eachcomponent. With proper care, however, most of thecomponents should be functional for a considerablylonger period.
A capital recovery charge based on the expectedlife and an annual interest charge of 6 percent onthe value of the investment was included. Annualinsurance costs and property taxes were estimated at1.5 percent of the initial investment. A rental chargeor opportunity cost for land of $125 per acre per yearalso was included.
The assumed repair-cost rates also are shown intable 15. These indicate expected annual repairand maintenance costs as a percent of the initial
investment. No maintenance for earthwork moundsin the earthen lots is shown. Rather, it was assumedthat they would be rebuilt every five years.
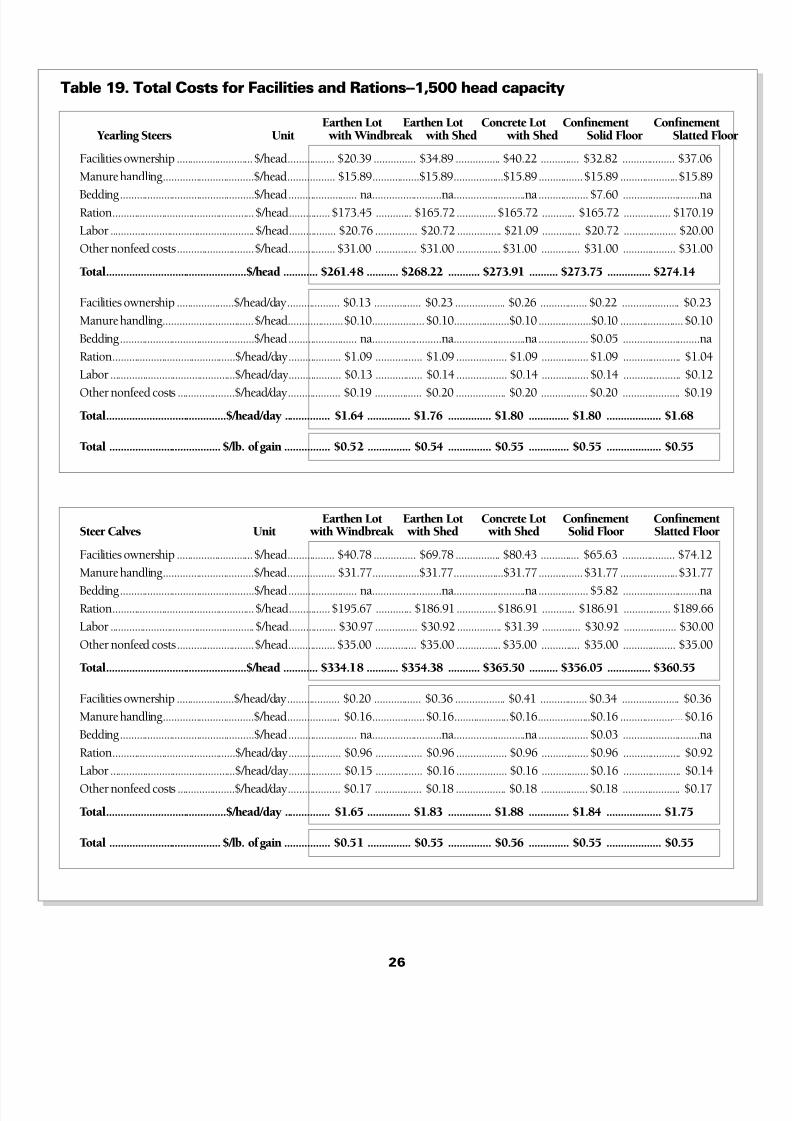
Besides the annual ownership costs, each system hasdifferent costs for manure handling, labor, and feedrations. The estimated costs for moving both solid
Feedlot Systems Cost Analysis
and liquid manure are shown in tables 18-20. Thesewere based on custom handling charges of $1.50 perton for solid manure and $0.01 per gallon for liquid
manure. Labor costs were charged at a rate of $10.00per hour. An average labor requirement of two hoursper head for yearling steers and three hours per headfor steer calves was assumed.
The time required to scrape lots or buildings for each150-head pen was assumed to be 0.50 hours per weekfor the two earthen lot systems; 0.75 hours per weekfor the concrete lot with shed; and 0.50 hours per weekfor the solid floor confinement system plus a beddingcost of 5 pounds per head per day was used at one cent
per pound. For the confinement building with slattedfloors, no labor for scraping was included. The systemshave different manure quantities and handling costs,but when put on a per head per day basis they areidentical when rounded to the whole cent.
Feed usage assumptions for each system and foryearling steers and steer calves are summarizedin table 7. To estimate the cost of each ration thefollowing feed prices were used:
Corn ...................................... $2.30 per bushel
Hay......................................... $60 per tonModified Distillers Grains... $39.10 per ton
Supplement ........................... $0.16 per pound
These values reflect average prices over the past decade.
Other non-feed costs are summarized in table 16(page 24). These were assumed to be the same foreach of the five systems analyzed.
Tables 18, 19, and 20 (pages 25-27) summarize thetotal costs of gain for each of the systems, at three
different capacities. For yearling steers, two turns of cattle per year were assumed, while for steer calvesonly one turn was assumed. Costs for each componentof the systems for each type of cattle are calculated perhead, per head per day, and per pound of gain.
16

8/6/2019 Feedlot Iowa
http://slidepdf.com/reader/full/feedlot-iowa 19/32
Feedlot Systems SummaryPerhaps the best way to compare the differentfeedlot designs is at the bottom line. Each designincludes the initial investment, operating costs,
and animal performance and they all meet currentenvironmental requirements. Where shouldproducers invest their money?
Figure 8 compares the initial investment perhead across the systems. Note that there is littledifference between the 750 and 5,000 head lotson a per head basis. The 1,500 head investmentis higher because of the additional environmentalcost that the 750 does not have. The 5,000 headfeedlot is able to spread these costs over morecattle, reducing the per head costs. Adding the shedto the earthen lot more than doubles the initialinvestment for the 750 head lot and increases it80 to 90 percent in the larger lots.
The earthen lot is approximately one-third thecost of total confinement with slatted floors. Theearthen lot with shed and concrete lot with shed
have comparable initial investment. The concrete lothas higher animal density and less runoff to controlthan the earthen lot, and thus has a lower cost of environmental compliance.
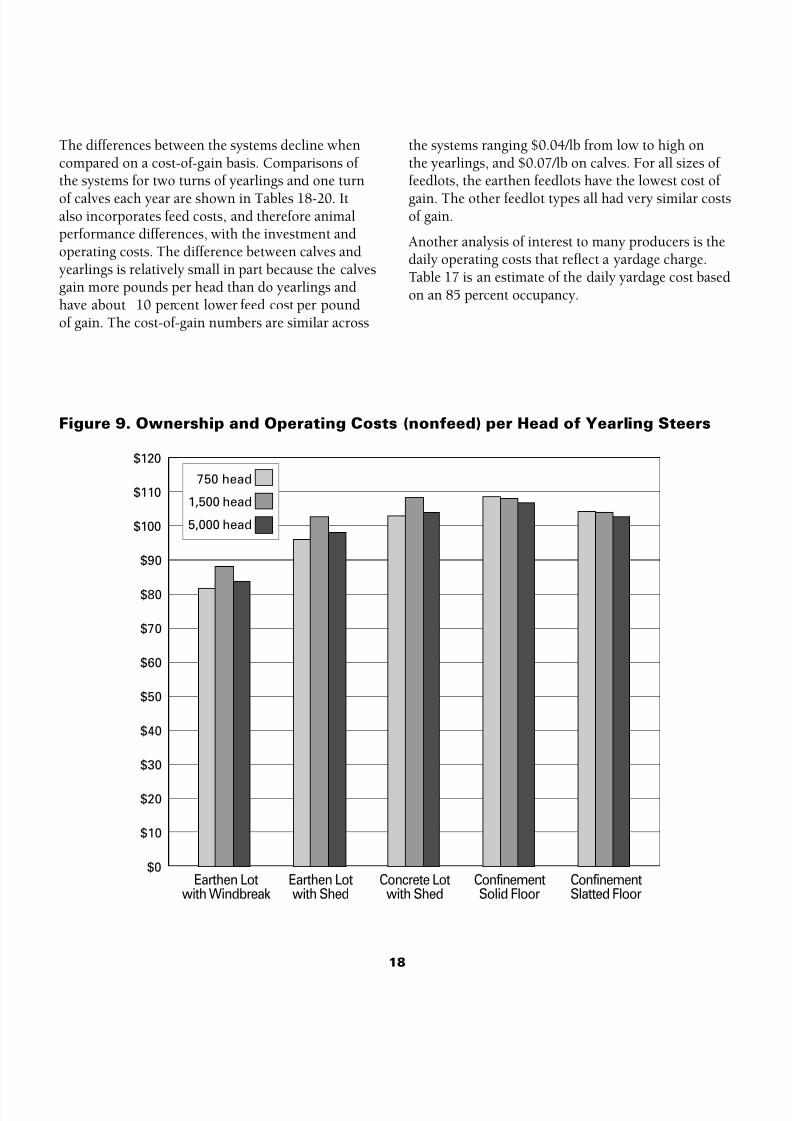
Ownership and operating costs including the facility,bedding, manure hauling, fuel and utilities, health,marketing, and labor are summarized in figure 9(page 17) for yearling steers assuming two turns ayear. The costs range from $81.44 for the earthenlot with windbreak to $108.37 for solid floorconfinement.
Figure 8. Initial Investment per Head by System and Size
750 head
1,500 head
5,000 head
$800
$700
$600
$500
$400
$300
$200
$100
$0Earthen Lot
with Windbreak
Earthen Lot
with Shed
Concrete Lot
with Shed
Confinement
Solid Floor
Confinement
Slatted Floor
17
8/6/2019 Feedlot Iowa
http://slidepdf.com/reader/full/feedlot-iowa 20/32
Figure 9. Ownership and Operating Costs (nonfeed) per Head of Yearling Steers
$120
$110
$100
$90
$80
$70
$60
$50
$40
$30
$20
$10
$0Earthen Lot
with Windbreak
Earthen Lot
with Shed
Concrete Lot
with Shed
Confinement
Solid Floor
Confinement
Slatted Floor
750 head
1,500 head
5,000 head
The differences between the systems decline whencompared on a cost-of-gain basis. Comparisons of the systems for two turns of yearlings and one turn
of calves each year are shown in Tables 18-20. Italso incorporates feed costs, and therefore animalperformance differences, with the investment andoperating costs. The difference between calves andyearlings is relatively small in part because the calvesgain more pounds per head than do yearlings andhave about 10 percent lower feed cost per poundof gain. The cost-of-gain numbers are similar across
the systems ranging $0.04/lb from low to high onthe yearlings, and $0.07/lb on calves. For all sizes of feedlots, the earthen feedlots have the lowest cost of
gain. The other feedlot types all had very similar costsof gain.
Another analysis of interest to many producers is thedaily operating costs that reflect a yardage charge.Table 17 is an estimate of the daily yardage cost basedon an 85 percent occupancy.
18

8/6/2019 Feedlot Iowa
http://slidepdf.com/reader/full/feedlot-iowa 21/32
Appendix
Table 10. Initial Investment for System 1, Earthen Lot with Windbreak
Investment Annual Cost
Facilities and Equipment 750 Head 1,500 Head 5,000 Head 750 Head 1,500 Head 5,000 Head
Land (acres)......................................................... 5.7 ................... 13.1 ................... 43.6 ............................... $717 ............... $1,636 ............... $5,452
Building ....................................................................0 ........................0 ...........................0 ........................................0 ....................... 0 ....................... 0
Concrete ..................................................... $69,000 .......... $135,000 .......... $450,000 ............................ $6,778 ............. $13,261 ............. $44,202
Feed bunks ................................................. $11,250 ............ $22,500 ............. $75,000 ............................ $1,262 ............... $2,524 ............... $8,414
Fencing ....................................................... $37,500 ............ $67,500 .......... $212,500 ............................ $4,582 ............... $8,247 ............. $25,964
Site preparation ............................................ $7,500 ............ $15,000 ............. $50,000 ............................... $699 ............... $1,398 ............... $4,661
Windbreaks .................................................. $9,000 ............ $18,000 ............. $60,000 ............................ $1,100 ............... $2,199 ............... $7,331Commodity storage sheds ......................... $9,750 ............ $19,500 ............. $50,000 ............................ $1,104 ............... $2,208 ............... $5,661
Bulk bin for supplement ............................. $1,260 ............... $1,910 ............... $5,040 ............................... $143 .................. $216 .................. $571
Cattle handling equipment ........................ $9,000 ............ $15,000 ............. $17,500 ............................ $1,280 ............... $2,133 ............... $2,488
Feed handling equipment ........................ $16,500 ............ $38,500 ............. $77,000 ............................ $1,521 ............... $3,549 ............... $7,098
Subtotal .............................................. $170,760 ......... $332,910 ........ $997,040 ...................... $19,185 ........... $37,372 ........ $111,843
Environmental Structures 750 Head 1,500 Head 5,000 Head 750 Head 1,500 Head 5,000 Head
Engineering costs ........................................ $5,000 ............. $50,000 ............. $50,000 ............................... $466 ............... $4,661 ............... $4,661
Construction costs .................................... $11,250 ............ $90,000 .......... $300,000 ............................ $1,049 ............... $8,390 ............. $27,968
Irrigation system .................................................... 0 .......... $75,000 .......... $100,000 ...................................... 0 ........... $10,742 ............. $14,323
Subtotal ................................................ $16,250 ......... $215,000 ........ $450,000 ........................ $1,515 ........... $23,794 .......... $46,952
Total ....................................... $187,010 $547,910 $1,447,040 ................ $20,699 $61,165 $158,795
$ per head of capacity ................ $249 ........... $365 ............ $289 ........................ $28 .............. $41 ............. $32
19

8/6/2019 Feedlot Iowa
http://slidepdf.com/reader/full/feedlot-iowa 22/32
Table 11. Initial Investment for System 2, Earthen Lot with Shed
Investment Annual Cost
Facilities and Equipment 750 Head 1,500 Head 5,000 Head 750 Head 1,500 Head 5,000 Head
Land (acres) ............................................. 5.7 ............... 13.1 ............... 43.6 ......................... $717 ........... $1,636 ........... $5,452Building ...........................................$187,500 ....... $375,000 .... $1,250,000 .................... $21,230 ......... $42,460 ....... $141,533
Concrete ........................................... $87,000 ....... $168,000 ....... $550,000 ...................... $8,546 ......... $16,502 ......... $54,025
Feed bunks ....................................... $11,250 ......... $22,500 ......... $75,000 ...................... $1,262 ........... $2,524 ........... $8,414
Fencing ............................................ $37,500 ......... $67,500 ....... $212,500 ...................... $4,582 ........... $8,247 ......... $25,964
Site preparation .................................. $7,500 ......... $15,000 ......... $50,000 ......................... $699 ........... $1,398 ........... $4,661
Windbreaks ............................................... $0 .................. $0 .................. $0 ............................. $0 ................... $0 ................... $0
Commodity storage sheds ................ $9,750 ......... $19,500 ......... $50,000 ...................... $1,104 ........... $2,208 ........... $5,661
Bulk bin for supplement .................... $1,260 ........... $1,910 ........... $5,040 ......................... $143 .............. $216 .............. $571
Cattle handling equipment ................ $9,000 ......... $15,000 ......... $17,500 ...................... $1,280 ........... $2,133 ........... $2,488
Feed handling equipment ................ $16,500 ......... $38,500 ......... $77,000 ...................... $1,521 ........... $3,549 ........... $7,098
Subtotal .................................... $367,260 ..... $722,910 .. $2,287,040 ................. $41,083 ........ $80,874 ..... $255,868
Environmental Structures 750 Head 1,500 Head 5,000 Head 750 Head 1,500 Head 5,000 Head
Engineering costs ............................... $5,000 .......... $50,000 ......... $50,000 ......................... $466 ........... $4,661 ........... $4,661
Construction costs ........................... $11,250 ......... $90,000 ....... $300,000 ...................... $1,049 ........... $8,390 ......... $27,968
Irrigation system ......................................... 0 ....... $75,000 ....... $100,000 ................................ 0 ....... $10,742 ......... $14,323
Subtotal ...................................... $16,250 ..... $215,000 ..... $450,000 ................... $1,515 ........ $23,794 ....... $46,952
Total ....................................... $383,510 $937,910 $2,737, 040 .............. $42,598 $104,668 $302,820
$ per head of capacity .......... $511 ......... $625 ......... $547 ................... $57 .......... $70 ........... $61
20

8/6/2019 Feedlot Iowa
http://slidepdf.com/reader/full/feedlot-iowa 23/32
Table 12. Initial Investment for System 3, Concrete Lot with Shed
Investment Annual Cost
Facilities and Equipment 750 Head 1,500 Head 5,000 Head 750 Head 1,500 Head 5,000 Head
Land (acres)......................................................... 1.9 ................. 4.1 ............... 13.5 ......................... $239 .............. $508 ........... $1,693Building ....................................................$187,500 ....... $375,000 .... $1,250,000 .................... $21,230 ......... $42,460 ....... $141,533
Concrete ................................................. $208,500 ....... $411,000 .... $1,360,000 .................... $20,480 ......... $40,371 ....... $133,588
Feed bunks ................................................. $11,250 ............ $22,500 ............. $75,000 ............................ $1,262 ............... $2,524 ............... $8,414
Fencing ...................................................... $26,250 ......... $46,500 ....... $150,000 ...................... $3,207 ........... $5,682 ......... $18,328
Site preparation ............................................ $7,500 ............ $15,000 ............. $50,000 ............................... $699 ............... $1,398 ............... $4,661
Windbreaks .......................................................... $0 ...................... $0 ...................... $0 .................................... $0 ....................... $0 ....................... $0
Commodity storage sheds ......................... $9,750 ............ $19,500 ............. $50,000 ............................ $1,104 ............... $2,208 ............... $5,661
Bulk bin for supplement ............................. $1,260 ............... $1,910 ............... $5,040 ............................... $143 .................. $216 .................. $571
Cattle handling equipment ........................ $9,000 ............ $15,000 ............. $17,500 ............................ $1,280 ............... $2,133 ............... $2,488
Feed handling equipment ........................ $16,500 ............ $38,500 ............. $77,000 ............................ $1,521 ............... $3,549 ............... $7,098
Subtotal ..............................................$477,510 ..... $944,910 .... $3,034,540 ............... $51,165 ...... $101,049 ..... $324,036
Environmental Structures 750 Head 1,500 Head 5,000 Head 750 Head 1,500 Head 5,000 Head
Engineering costs ........................................ $5,000 ............. $50,000 ............. $50,000 ............................... $466 ............... $4,661 ............... $4,661
Construction costs ..................................... $5,625 ......... $45,000 ....... $150,000 ......................... $524 ........... $4,195 ......... $13,984
Irrigation system .................................................... 0 .......... $75,000 .......... $100,000 ...................................... 0 ........... $10,742 ............. $14,323
Subtotal ............................................... $10,625 ..... $170,000 ..... $300,000 ...................... $991 ........ $19,599 ....... $32,968
Total ....................................... $488,135 $1,114,910 $3,334,540 ............. $52,156 $120,648 $357,004
$ per head of capacity ................ $651 ......... $743 ......... $667 ................... $70 .......... $80 ........... $71
21

8/6/2019 Feedlot Iowa
http://slidepdf.com/reader/full/feedlot-iowa 24/32
Table 13. Initial Investment for System 4, Complete Confinement with Solid Floor
Investment Annual Cost
Facilities and Equipment 750 Head 1,500 Head 5,000 Head 750 Head 1,500 Head 5,000 Head
Land (acres)......................................................... 1.4 ................. 2.6 ................. 8.0 ......................... $172 .............. $323 ........... $1,004Building .................................................... $225,000 ....... $450,000 .... $1,500,000 .................... $25,476 ......... $50,952 ....... $169,840
Concrete ................................................. $178,500 ....... $351,000 .... $1,160,000 .................... $17,533 ......... $34,478 ....... $113,943
Feed bunks ................................................. $11,250 ............ $22,500 ............. $75,000 ............................ $1,262 ............... $2,524 ............... $8,414
Fencing ...................................................... $10,500 ......... $15,000 ......... $40,000 ...................... $1,283 ........... $1,833 ........... $4,887
Site preparation ........................................... $1,500 ........... $3,000 ......... $10,000 ......................... $140 .............. $280 .............. $932
Windbreaks .......................................................... $0 ...................... $0 ...................... $0 .................................... $0 ....................... $0 ....................... $0
Commodity storage sheds ......................... $9,750 ............ $19,500 ............. $50,000 ............................ $1,104 ............... $2,208 ............... $5,661
Bulk bin for supplement ............................. $1,260 ............... $1,910 ............... $5,040 ............................... $143 .................. $216 .................. $571
Cattle handling equipment ........................ $9,000 ............ $15,000 ............. $17,500 ............................ $1,280 ............... $2,133 ............... $2,488
Feed handling equipment ........................ $16,500 ............ $38,500 ............. $77,000 ............................ $1,521 ............... $3,549 ............... $7,098
Building engineering costs ............................ $0 ............... $3,000 ............... $3,000 .................................... $0 .................. $277 .................. $277
Total ....................................... $463,260 $919,410 $2,937,540 ............... $49,742 $98,449 $314,112
$ per head of capacity ................ $618 ......... $613 ......... $588 ................... $66 .......... $66 ........... $63
22

8/6/2019 Feedlot Iowa
http://slidepdf.com/reader/full/feedlot-iowa 25/32
Table 14. Initial Investment for System 5, Complete Confinement with Slatted Floor
Investment Annual Cost
Facilities and Equipment 750 Head 1,500 Head 5,000 Head 750 Head 1,500 Head 5,000 Head
Land (acres)......................................................... 0.9 ................. 1.7 ................. 5.2 ......................... $172 .............. $323 ........... $1,004Building ....................................................$187,500 ....... $375,000 .... $1,250,000 .................... $21,230 ......... $42,460 ....... $141,533
Manure containment ......................... $277,500 ....... $555,000 .... $1,850,000 .................... $27,258 ......... $54,516 ....... $181,719
Feed bunks ................................................. $11,250 ............ $22,500 ............. $75,000 ............................ $1,262 ............... $2,524 ............... $8,414
Fencing ...................................................... $15,750 ......... $24,750 ......... $70,000 ...................... $1,924 ........... $3,024 ........... $8,553
Site preparation ........................................... $1,500 ........... $3,000 ......... $10,000 ......................... $140 .............. $280 .............. $932
Windbreaks .......................................................... $0 ...................... $0 ...................... $0 .................................... $0 ....................... $0 ....................... $0
Commodity storage sheds ......................... $9,750 ............ $19,500 ............. $50,000 ............................ $1,104 ............... $2,208 ............... $5,661
Bulk bin for supplement ............................. $1,260 ............... $1,910 ............... $5,040 ............................... $143 .................. $216 .................. $571
Cattle handling equipment ........................ $9,000 ............ $15,000 ............. $17,500 ............................ $1,280 ............... $2,133 ............... $2,488
Feed handling equipment ........................ $16,500 ............ $38,500 ............. $77,000 ............................ $1,521 ............... $3,549 ............... $7,098
Building engineering costs ............................ $0 ............... $3,000 ............... $3,000 .................................... $0 .................. $277 .................. $277
Total ....................................... $530,010 $1,058,160 $3,407,540 .............. $55,862 $111,186 $357,247
$ per head of capacity ................ $707 ......... $705 ......... $682 ................... $74 .......... $74 ........... $71
23

8/6/2019 Feedlot Iowa
http://slidepdf.com/reader/full/feedlot-iowa 26/32
Table 15. Depreciation Life and Repairs Rate
Depreciation RepairsLife–years Rate
Facilities and Equipment
Building .................................................. 25 ..................2.0%
Concrete ................................................. 25 ..................0.5%
Feed bunks ............................................. 20 ..................1.0%Fencing .................................................. 20 ..................2.0%
Site preparation ...................................... 25 ..................0.0%
Windbreaks ............................................ 20 ..................2.0%
Commodity storage sheds .................... 25 ..................2.0%
Bulk bin for supplement ........................ 25 ..................2.0%
Cattle handling equipment .................... 20 ..................5.0%
Feed handling equipment ...................... 20 ..................5.0%
Engineering costs for building .............. 20 ..................0.0%
Environmental StructuresEngineering costs ................................... 25 ..................0.0%
Construction costs ................................. 25 ..................0.0%
Irrigation system .................................... 25 ..................5.0%
Yearlings Calves
Veterinary and health.......................... $8.00 .......... $10.00
Machinery and equipment ................. $7.00 .......... $11.00
Marketing and miscellaneous ........... $16.00 .......... $14.00
Total $31.00 $35.00
Table 16. Other Nonfeed Costs, per Head
Earthen Lot Earthen Lot Concrete Lot Confinement Confinement
Capacity with Windbreak with Shed with Shed Solid Floor Slatted Floor
750 .......................... $0.48 .................. $0.64 ................. $0.69 .................. $0.73 ................ $0.65
1,500 .......................... $0.53 .................. $0.66 ................. $0.71 .................. $0.70 ................ $0.62
5,000 .......................... $0.49 .................. $0.63 ................. $0.67 .................. $0.69 ................ $0.62
Table 17. Yardage Cost Assuming 85% Occupancy Rate ($/Head/Day)
24

8/6/2019 Feedlot Iowa
http://slidepdf.com/reader/full/feedlot-iowa 27/32
Earthen Lot Earthen Lot Concrete Lot Confinement ConfinementSteer Calves Unit with Windbreak with Shed with Shed Solid Floor Slatted Floor
Facilities ownership ............................$/head ................. $27.60 ............... $56.80 ................ $69.54 .............. $66.32 ................... $74.48
Manure handling .................................$/head ................. $31.77 .................$31.77 ..................$31.77 ................$31.77 .....................$31.77
Bedding .................................................$/head ......................... na .........................na ..........................na .................. $5.82 ............................naRation ....................................................$/head ............... $195.67 ............. $186.91 .............. $186.91 ............ $186.91 ................. $189.66
Labor .....................................................$/head ................. $30.97 ............... $30.92 ................ $31.39 .............. $30.92 ................... $30.00
Other nonfeed costs ............................$/head ................. $35.00 ............... $35.00 ................ $35.00 .............. $35.00 ................... $35.00
Total .................................................$/head ............ $321.00 ........... $341.40 ........... $354.61 .......... $356.74 ............... $360.91
Facilities ownership .....................$/head/day ................... $0.14 ................. $0.29 .................. $0.36 ................. $0.34 ..................... $0.36
Manure handling ..........................$/head/day ................... $0.16 ...................$0.16 ....................$0.16 ...................$0.16 .......................$0.16
Bedding .................................................$/head ......................... na .........................na ..........................na .................. $0.03 ............................na
Ration .............................................$/head/day ................... $0.96 ................. $0.96 .................. $0.96 ................. $0.96 ..................... $0.92
Labor ..............................................$/head/day ................... $0.15 ................. $0.16 .................. $0.16 ................. $0.16 ..................... $0.14
Other nonfeed costs .....................$/head/day ................... $0.17 ................. $0.18 .................. $0.18 ................. $0.18 ..................... $0.17
Total ..........................................$/head/day ................ $1.58 ............... $1.76 ............... $1.83 .............. $1.84 ................... $1.74
Total ....................................... $/lb. of gain ................ $0.49 ................$0.53 ................ $0.55 .............. $0.55 ................... $0.56
Earthen Lot Earthen Lot Concrete Lot Confinement Confinement Yearling Steers Unit with Windbreak with Shed with Shed Solid Floor Slatted Floor
Facilities ownership ............................$/head ................. $13.80 ............... $28.40 ................ $34.77 .............. $33.16 ................... $37.24
Manure handling .................................$/head ..................$15.89 .................$15.89 ..................$15.89 ................$15.89 .....................$15.89
Bedding .................................................$/head ......................... na .........................na ..........................na .................. $7.60 ............................naRation ....................................................$/head ............... $173.45 ............. $165.72 .............. $165.72 ............ $165.72 ................. $170.19
Labor .....................................................$/head ................. $20.76 ............... $20.72 ................ $21.09 .............. $20.72 ................... $20.00
Other nonfeed costs ............................$/head ................. $31.00 ............... $31.00 ................ $31.00 .............. $31.00 ................... $31.00
Total .................................................$/head ............ $254.90 ........... $261.73 ........... $268.46 .......... $274.09 ............... $274.32
Facilities ownership .....................$/head/day ................... $0.09 ................. $0.19 .................. $0.23 ................. $0.22 ..................... $0.23
Manure handling ..........................$/head/day ................... $0.10 ...................$0.10 ....................$0.10 ...................$0.10 .......................$0.10
Bedding .................................................$/head ......................... na .........................na ..........................na .................. $0.05 ............................na
Ration .............................................$/head/day ................... $1.09 ................. $1.09 .................. $1.09 ................. $1.09 ..................... $1.04
Labor ..............................................$/head/day ................... $0.13 ................. $0.14 .................. $0.14 ................. $0.14 ..................... $0.12
Other nonfeed costs .....................$/head/day ................... $0.19 ................. $0.20 .................. $0.20 ................. $0.20 ..................... $0.19
Total ..........................................$/head/day ................ $1.60 ............... $1.72 ............... $1.76 .............. $1.80 ................... $1.67
Total .......................................$/lb. of gain ................ $0.51 ............... $0.52 ............... $0.54 .............. $0.55 ................... $0.55
Table 18. Total Costs for Facilities and Rations--750 head capacity
25
8/6/2019 Feedlot Iowa
http://slidepdf.com/reader/full/feedlot-iowa 28/32
Earthen Lot Earthen Lot Concrete Lot Confinement ConfinementSteer Calves Unit with Windbreak with Shed with Shed Solid Floor Slatted Floor
Facilities ownership ............................$/head ................. $40.78 ............... $69.78 ................ $80.43 .............. $65.63 ................... $74.12
Manure handling .................................$/head ................. $31.77 .................$31.77 ..................$31.77 ................$31.77 .....................$31.77
Bedding .................................................$/head ......................... na .........................na ..........................na .................. $5.82 ............................naRation ....................................................$/head ............... $195.67 ............. $186.91 .............. $186.91 ............ $186.91 ................. $189.66
Labor .....................................................$/head ................. $30.97 ............... $30.92 ................ $31.39 .............. $30.92 ................... $30.00
Other nonfeed costs ............................$/head ................. $35.00 ............... $35.00 ................ $35.00 .............. $35.00 ................... $35.00
Total .................................................$/head ............ $334.18 ........... $354.38 ........... $365.50 .......... $356.05 ............... $360.55
Facilities ownership .....................$/head/day ................... $0.20 ................. $0.36 .................. $0.41 ................. $0.34 ..................... $0.36
Manure handling .................................$/head ................... $0.16 ...................$0.16 ....................$0.16 ...................$0.16 .......................$0.16
Bedding .................................................$/head ......................... na .........................na ..........................na .................. $0.03 ............................na
Ration .............................................$/head/day ................... $0.96 ................. $0.96 .................. $0.96 ................. $0.96 ..................... $0.92
Labor ..............................................$/head/day ................... $0.15 ................. $0.16 .................. $0.16 ................. $0.16 ..................... $0.14
Other nonfeed costs .....................$/head/day ................... $0.17 ................. $0.18 .................. $0.18 ................. $0.18 ..................... $0.17
Total ..........................................$/head/day ................ $1.65 ............... $1.83 ............... $1.88 .............. $1.84 ................... $1.75
Total .......................................$/lb. of gain ................ $0.51 ............... $0.55 ............... $0.56 .............. $0.55 ................... $0.55
Earthen Lot Earthen Lot Concrete Lot Confinement Confinement Yearling Steers Unit with Windbreak with Shed with Shed Solid Floor Slatted Floor
Facilities ownership ............................$/head ................. $20.39 ............... $34.89 ................ $40.22 .............. $32.82 ................... $37.06
Manure handling .................................$/head ................. $15.89 .................$15.89 ..................$15.89 ................$15.89 .....................$15.89
Bedding .................................................$/head ......................... na .........................na ..........................na .................. $7.60 ............................naRation ....................................................$/head ............... $173.45 ............. $165.72 .............. $165.72 ............ $165.72 ................. $170.19
Labor .....................................................$/head ................. $20.76 ............... $20.72 ................ $21.09 .............. $20.72 ................... $20.00
Other nonfeed costs ............................$/head ................. $31.00 ............... $31.00 ................ $31.00 .............. $31.00 ................... $31.00
Total .................................................$/head ............ $261.48 ........... $268.22 ........... $273.91 .......... $273.75 ............... $274.14
Facilities ownership .....................$/head/day ................... $0.13 ................. $0.23 .................. $0.26 ................. $0.22 ..................... $0.23
Manure handling .................................$/head ....................$0.10 ...................$0.10 ....................$0.10 ...................$0.10 .......................$0.10
Bedding .................................................$/head ......................... na .........................na ..........................na .................. $0.05 ............................na
Ration .............................................$/head/day ................... $1.09 ................. $1.09 .................. $1.09 ................. $1.09 ..................... $1.04
Labor ..............................................$/head/day ................... $0.13 ................. $0.14 .................. $0.14 ................. $0.14 ..................... $0.12
Other nonfeed costs .....................$/head/day ................... $0.19 ................. $0.20 .................. $0.20 ................. $0.20 ..................... $0.19
Total ..........................................$/head/day ................ $1.64 ............... $1.76 ............... $1.80 .............. $1.80 ................... $1.68
Total .......................................$/lb. of gain ................ $0.52 ............... $0.54 ............... $0.55 .............. $0.55 ................... $0.55
Table 19. Total Costs for Facilities and Rations--1,500 head capacity
26

8/6/2019 Feedlot Iowa
http://slidepdf.com/reader/full/feedlot-iowa 29/32
Earthen Lot Earthen Lot Concrete Lot Confinement ConfinementSteer Calves Unit with Windbreak with Shed with Shed Solid Floor Slatted Floor
Facilities ownership ............................$/head ................. $31.76 ............... $60.56 ................ $71.40 .............. $62.82 ................... $71.45
Manure handling .................................$/head ................. $31.77 .................$31.77 ..................$31.77 ................$31.77 .....................$31.77
Bedding .................................................$/head ......................... na .........................na ..........................na .................. $5.82 ............................naRation ....................................................$/head ............... $195.67 ............. $186.91 .............. $186.91 ............ $186.91 ................. $189.66
Labor .....................................................$/head ................. $30.97 ............... $30.92 ................ $31.39 .............. $30.92 ................... $30.00
Other nonfeed costs ............................$/head ................. $35.00 ............... $35.00 ................ $35.00 .............. $35.00 ................... $35.00
Total .................................................$/head ........... $325.16 ........... $345.17 ........... $356.46 .......... $353.24 ............... $357.88
Facilities ownership .....................$/head/day ................... $0.16 ................. $0.31 .................. $0.37 ................. $0.32 ..................... $0.35
Manure handling .................................$/head ................... $0.16 ...................$0.16 ....................$0.16 ...................$0.16 .......................$0.16
Bedding .................................................$/head ......................... na .........................na ..........................na .................. $0.03 ............................na
Ration .............................................$/head/day ................... $0.96 ................. $0.96 .................. $0.96 ................. $0.96 ..................... $0.92
Labor ..............................................$/head/day ................... $0.15 ................. $0.16 .................. $0.16 ................. $0.16 ..................... $0.14
Other nonfeed costs .....................$/head/day ................... $0.17 ................. $0.18 .................. $0.18 ................. $0.18 ..................... $0.17
Total ..........................................$/head/day ................ $1.60 ............... $1.78 ............... $1.84 .............. $1.82 ................... $1.74
Total .......................................$/lb. of gain ................ $0.50 ............... $0.53 ............... $0.55 .............. $0.54 ................... $0.55
Earthen Lot Earthen Lot Concrete Lot Confinement Confinement Yearling Steers Unit with Windbreak with Shed with Shed Solid Floor Slatted Floor
Facilities ownership ............................$/head ................. $15.88 ............... $30.28 ................ $35.70 .............. $31.41 ................... $35.72
Manure handling .................................$/head ................. $15.89 .................$15.89 ..................$15.89 ................$15.89 .....................$15.89
Bedding .................................................$/head ......................... na .........................na ..........................na .................. $7.60 ............................naRation ....................................................$/head ............... $173.45 ............. $165.72 .............. $165.72 ............ $165.72 ................. $170.19
Labor .....................................................$/head ................. $20.76 ............... $20.72 ................ $21.09 .............. $20.72 ................... $20.00
Other nonfeed costs ............................$/head ................. $31.00 ............... $31.00 ................ $31.00 .............. $31.00 ................... $31.00
Total .................................................$/head ........... $256.98 ........... $263.61 ........... $269.39 .......... $272.34 ............... $272.80
Facilities ownership .....................$/head/day ................... $0.10 ................. $0.20 .................. $0.23 ................. $0.21 ..................... $0.22
Manure handling .................................$/head ................... $0.10 ...................$0.10 ....................$0.10 ...................$0.10 .......................$0.10
Bedding .................................................$/head ......................... na .........................na ..........................na .................. $0.05 ............................na
Ration .............................................$/head/day ................... $1.09 ................. $1.09 .................. $1.09 ................. $1.09 ..................... $1.04
Labor ..............................................$/head/day ................... $0.13 ................. $0.14 .................. $0.14 ................. $0.14 ..................... $0.12
Other nonfeed costs .....................$/head/day ................... $0.19 ................. $0.20 .................. $0.20 ................. $0.20 ..................... $0.19
Total ..........................................$/head/day ................ $1.62 ............... $1.73 ............... $1.77 .............. $1.79 ................... $1.67
Total ....................................... $/lb. of gain .............. $0.51 ............... $0.53 ............... $0.54 .............. $0.54 ................... $0.55
Table 20. Total Costs for Facilities and Rations--5,000 head capacity
27

8/6/2019 Feedlot Iowa
http://slidepdf.com/reader/full/feedlot-iowa 30/32
Notes
28

8/6/2019 Feedlot Iowa
http://slidepdf.com/reader/full/feedlot-iowa 31/32

8/6/2019 Feedlot Iowa
http://slidepdf.com/reader/full/feedlot-iowa 32/32
The U.S. Department of Agriculture (USDA) prohibits discrimination in all its programs and activities on the basis of race, color,
national origin, gender, religion, age, disability, political beliefs, sexual orientation, and marital or family status. (Not all prohibited
bases apply to all programs.) Many materials can be made available in alternative formats for ADA clients. To file a complaint of
discrimination, write USDA, Office of Civil Rights, Room 326-W, Whitten Building, 14th and Independence Avenue, SW, Washington,
DC 20250-9410 or call 202-720-5964.
Issued in furtherance of Cooperative Extension work, Acts of May 8 and June 30, 1914, in cooperation with the U.S. Department of
A i l J k M P di C i E i S i I S U i i f S i d T h l A I