feeding-time minimization and the territorial behavior …
TRANSCRIPT
FEEDING-TIME MINIMIZATION AND THE TERRITORIAL
BEHAVIOR OF THE WILLOW FLYCATCHER
(EMPIDONAX TRAILLII)
DAVID R. C. PRESCOTT AND ALEX L. A. MIDDLETON
Department of Zoology, College of Biological Science, University of Guelph, Guelph, Ontario N1G 2W1, Canada
ABSTRACT.--We studied breeding male Willow Flycatchers (Empidonax traillii) to test a model of optimal territorial behavior for feeding-time minimizers proposed by Hixon (1980). Specific predictions were that feeding time, defense time, and territory size should decrease with increasing food availability and increase with increased pressure from both conspecific and heterospecific competitors.
The constant reproductive output of 4 and 3 eggs for first and second clutches, respectively, and the large component of uncommitted (sitting) time (62.6 + 3.2%) over the breeding season confirmed that the Willow Flycatcher conformed to a time-minimization strategy. Data analyzed over three stages of the breeding cycle, and over all stages, however, showed that only 5 of the 36 possible relationships were significant as predicted by the model. In general, food availability and competitor pressure were not important influences on the territorial behavior of these birds. Variations in territory size could not be attributed to constraints on feeding time, but correlated closely with the energetic requirements of all birds occupying the territory.
We believe that breeding insectivorous passerines, including Willow Flycatchers, maintain a large component of uncommitted time, as well as a larger than necessary territory, to minimize the impact of short-term variations in competitor pressure and food supply. Such birds need not conform to the predictions of models that optimize foraging time. Received I December 1986, accepted 16 July 1987.
SINCE the concept of economic defendability was introduced to the study of territoriality (Brown 1964), numerous models, based on costs and benefits accrued to the territory holder, have been proposed to account for variations in the size of the area defended by territorial animals (Carpenter and MacMillen 1976, Dill 1978, Ko- dric-Brown and Brown 1978, MacLean and Sea- stedt 1979, Tullock 1979, Ebersole 1980, Hixon
1980, Wittenberger 1981, Schoener 1983). In an- imals that defend exclusive feeding areas, cost- benefit ratios are most often thought to be prox- imately influenced by food availability. This is supported by an inverse relationship between territory size and food abundance for a variety of vertebrate predators (e.g. Stenger 1958, Smith 1968, Holmes 1970, Slaney and Northcote 1974, Simon 1975, Dill et al. 1981, Davis 1982). Com- petitor pressure also may exert an effect on ter- ritory size (Yeaton and Cody 1974, Myers et al. 1979, Ewald et al. 1980, Norton et al. 1982), al- though the presence of territorial intruders need not be independent of food availability (Myers et al. 1979, Norton et al. 1982, Schoener 1983). Both food and intruders apparently influence territoriality by causing changes in the alloca-
17
tion of time and energy by the territory holder to various territorial activities. Territorial be-
havior then can be viewed as a consequence of the balance between the time (or energy) spent acquiring benefits (e.g. food) from the territory versus the time allocated to territorial defense.
Hence, models that predict changes in territory size based on proximate constraints on energy acquisition are also capable of predicting con- comitant changes in the allocation of feeding and defense times by the territory holder (e.g. Hixon 1980, Schoener 1983).
Schoener (1971) identified alternative strat- egies in the allocation of time and energy by foraging animals. Foragers that realize no re- productive gain by increasing foraging effort (i.e. have a fixed reproductive output) Schoener termed feeding-time minimizers. Animals whose fecundity is enhanced by energy gain were termed energy maximizers. These con- cepts have been integrated into models of ter- ritorial behavior (Dill 1978, Pyke 1979, Ebersole 1980, Hixon 1980, Schoener 1983). Predictions of territorial dynamics and time allocation for energy maximizers have often been contradic- tory (Schoener 1983). However, Hixon (1980)
The Auk 105: 17-28. January 1988

18 PRESCOTT AND MIDDLETON [Auk, Vol. 105
and Schoener (1983) predicted that for time minimizers, territory size, feeding time, and de- fense time should decrease with increased food
availability, increase with increased pressure from conspecific intruders against which the territory is defended (intruders that do not sup- press food abundance), and increase with in- creasing pressure from heterospecific intruders that forage on the territory and hence reduce food availability. At present empirical tests for the specific predictions of the time-minimiza- tion models are lacking.
We studied the territorial behavior of the Wil-
low Flycatcher (Empidonax traillii) to test the above predictions. Previous time and energy budget analyses of breeding Willow Flycatchers led Ettinger and King (1980) to classify this species as a feeding-time minimizer. Several as- pects of the ecology of the Willow Flycatcher are consistent with assumptions of the model and render it a convenient species for testing the models (see Hixon 1980 and Schoener 1983 for discussion of assumptions). First, it occupies a relatively open and homogeneous habitat (King 1955, Walkinshaw 1966) such that prey items are presumably evenly distributed and behavioral observations facilitated. Second, like
other Empidonax flycatchers, it confines its ac- tivities to a small feeding territory defended vigorously against conspecific intruders (Davis 1954, 1959; Davis et al. 1963). Finally, it feeds almost exclusively on invertebrate prey (Bent 1942) that are readily quantified in the field.
STUDY AREA AND METHODS
Most data were collected from Willow Flycatcher territories in the Badenoch Swamp, 14 km southeast of Guelph, Ontario (43ø32'N, 80ø13'W). The study area consisted primarily of dense thickets of 3-4 m high willow (Salix sp.), interspersed with grassy clearings and sparse secondary growth (< 1.5 m height) of red- osier dogwood (Cornus stolonifera), hawthorn (Cratae- gus sp.), and trembling aspen (Populus tremuloides) sap- lings. White elm (Ulmus americana) and black ash (Fraxinus nigra) up to 25 m in height were scattered throughout the wetter areas of the swamp. Areas of standing water supported stands of dense cattail (Ty- pha sp.). During the breeding seasons of 1984 and 1985, 9-11 pairs of Willow Flycatchers were present at the Badenoch site.
During 1984 additional observations were made at a site 5 km northeast of Guelph. This site ("Guelph Lake") had vegetation similar to Badenoch but con- tained only 3-4 breeding pairs of Willow Flycatchers. This site was abandoned by the flycatchers in the
following season, apparently because of agricultural development of the peripheral areas. Therefore, an additional site at Sayer's Mills, 19 km east of Guelph, was chosen for study in 1985. This was the driest of the three study areas, with standing water restricted to a small ephemeral creek on the western side of the site. Three pairs of Willow Flycatchers were present at Sayer's Mills in 1985.
An assumption of the model of optimal feeding territoriality is that territories are noncontiguous (Hixon 1980, Schoener 1983). We considered only ter- ritories where < 50% of the boundary was shared with conspecifics and that bordered on suitable, unoccu- pied habitat (to permit territorial expansion). During late May (territory-establishment stage) in 1984 and 1985, 5 territories were selected for observation at Badenoch. In 1984, 2 additional territories were cho-
sen at Guelph Lake and, in 1985, 2 at Sayer's Mills. Although 3 territorial males were color-banded early in the 1984 season, efforts to mark birds were soon
abandoned when it became apparent that individual birds confined their activities to well-defined areas
and could be distinguished readily from their neigh- bors. Each territory was visited randomly at least 4 times during each breeding season (May-August). Each visit was considered an independent repetition. Abandonment of territories by the flycatchers early in the season (twice in 1985) occasionally prevented repeated observations on a specific territory. In such cases additional noncontiguous territories were found as replacements; data from the new territories and the ones they replaced were treated separately. The se- quence of observation of these territories followed the order previously determined for the abandoned territories.
Observations on all territories were made between
0700 and 1200 from a 2.5-m portable stepladder. Be- cause weather factors probably influence the foraging behavior of insectivorous birds (Lederer 1972, Grubb 1979), as well as the distribution and availability of invertebrate prey (Digby 1958, Taylor 1963), data were collected only on rainless mornings with little or no wind (< 15 km/h) and seasonal temperatures.
Territory size.--Territory size was determined by re- cording the position of singing perches, flight paths, and territorial disputes of both male and female Wil- low Flycatchers on 5-m grid maps of each study area constructed by ground mapping with compass and tape. The position of foraging bouts was also used to determine territory boundaries, although birds ap- parently never fed beyond the limits imposed by ad- vertising perches. In September 1985 aerial photo- graphs were taken of each study area from an approximate altitude of 1,000 m. The exact scale of each photograph was determined from ground-mea- sured distances between prominent physiognomic features of the habitat. Field data were then super- imposed on the photographs, and territory size was calculated as the minimum area enclosed by a poly-

January 1988] Flycatcher Territorial Behavior 19
gon connecting the outermost plotted points (Odum and Kuenzler 1955, Southwood 1971).
Intruder pressure.--Intruders that do not decrease food supplies on the flycatcher territory (INTR) were assessed by counting the number of territorial male flycatchers adjacent to the territory under observa- tion. Such intruders were generally conspecifics, but also included the Alder Flycatcher (E. alnorum), a sib- ling species (Mayr 1964: 116) with which E. traillii is interspecifically territorial in areas of sympatry (Pres- cott 1987). Because territorial disputes between adjacent Empidonax flycatchers were infrequent, we considered a neighboring male to be a potential in- truder if it used display perches less than 8 m outside the territory under observation.
The impact of intruders that decrease the food sup- ply available to the territory holder was assessed by constructing an index of food overlap (COMP) that considered both the spatial and dietary overlap of heterospecific (nonexcluded) individuals on each fly- catcher territory:
(% spatial overlap). (% insectivory overlap)
COMP = • 1 + I difference in body mass l ' where % spatial overlap was estimated for each in- truding species by plotting its movements on the field maps (see above), and calculating the percentage of the observed flycatcher territory occupied. Percent- age insectivory overlap with the Willow Flycatcher was obtained for each species from literature accounts of summer diets. Although Beal (1912) found Willow Flycatchers to be 96% insectivorous, a value of 100% was assumed here for ease of calculation. The denom-
inator of the index attempts to correct for differences in prey-size overlap between coexisting species. Be- cause differences in prey size selected by insectivo- rous birds are more closely related to differences in the bird's body mass than its bill size (Hespenheide 1971), we used the former measure. We added 1 to the denominator to prevent the calculated values from approaching infinity for potential competitors of sim- ilar body mass. Values of body mass for each heter- ospecific competitor were obtained from the litera- ture.
Food availability.--Three trapping methods were employed to provide as unbiased an assessment as possible of the invertebrate food potentially available to Willow Flycatchers. One Malaise trap (Townes 1972) and one flight-intercept trap (Masner and Goulet 1981) were positioned at random (determined on field maps) along willow-grass interfaces within each territory for a period of 23 + 1 h ("one day") beginning around noon of the day preceding the observation period. At the conclusion of each observation period, samples were collected from the traps and 50 sweeps, using a 40-cm-wide sweep net, were taken along 3-4 ran- domly chosen transects through the territory. The direction of each transect was chosen by spinning a
pointer from a central location within the territory. Samples obtained by each trapping method were cleaned of plant debris, combined into a single sam- ple, and frozen for later analysis. Insects were sorted to order (adults and larvae separately) according to Borrer et al. (1976) and grouped into 2-mm size classes based on body length, excluding appendages. Each size class was oven dried at 100øC to constant mass
(predetermined to be about 14 h), and immediately weighed (+0.0001 g) on a digital Sartorius © balance. After weighing all size classes were recombined, re- dried for 45-60 min, and reweighed. The combined mass was considered as an index of total insect abun-
dance on each territory. The relatively small Willow Flycatcher is unlikely
to feed on all of the species and sizes of insects iden- tified in the trap samples. We performed a dietary analysis of the Willow Flycatcher to assess the bio- mass of insects on each territory that was potentially available to the birds. Neck ligatures (Johnson et al. 1980) were placed on nestling flycatchers, and the size and taxonomic composition of food items deliv- ered by the parents were recorded. Insects were col- lected on all territories where behavioral observations
were made. The maximum length of preserved adults and larvae of each insect taxon found in all samples was assumed to be the maximum size also consumed
by the parents. Taxa absent from the nestling samples were considered to be avoided by adult birds. Of course, adult birds may consume insects of a different size than those provided to the young. An analysis of 7 gut samples of adult flycatchers collected during the breeding season, however, suggested that adults generally consumed smaller prey items than those found in the nestling samples, and they were never known to take larger items (Prescott unpubl. data). Therefore, the use of nestling food samples to identify the largest insects of each order consumed seems jus- tified. Following dietary analysis, the biomass of all size classes and types of insects found in the trap samples but lacking in the diet were subtracted from the total insect abundance. The resultant biomass was
our index of food availability on each territory. Time budgets.--Because male flycatchers establish and
defend the breeding territory, time budgets were de- termined only for birds identified as males on the basis of behavior. Time spent in a specific activity was recorded by stopwatch for a minimum of 30 min (usu- ally continuous) during each hour of the morning. The percentage of the time spent in each activity was calculated, based on the total time the male bird was
in view during the observation period. Activities con- sidered were: (1) Sitting (SIT), time spent perched away from the nest (see 7, below), including preening and nonterritorial vocalization (see 6). (2) Foraging (FOR), time spent in pursuit of insect prey. Pauses of < 10 s between foraging bouts were included as feed- ing time. (3) Flying (FLY), all flights not associated with feeding or courtship displays. (4) Defense (DEF),

20 PRESCOTT AND MIDDLETON
TABLE 1. Locations, sample sizes, and means (_+SE) of territorial characteristics catchers studied near Guelph, Ontario. a
[Auk, Vol. 105
for breeding Willow Fly-
Territory Site b n FOOD (g/day) COMP INTR TSIZE (m 2) 1984
84-1 B 4 1.53 2,758.7 3.00 2,410 (0.31) (505.3) (0.00) (369)
84-2 B 3 1.04 3,806.2 1.67 1,438 (0.57) (226.7) (0.33) (245)
84-3 B 6 1.05 1,802.4 1.33 2,361 (0.24) (332.7) (0.56) (342)
84-4 B 4 0.77 2,434.3 1.50 1,052 (0.16) (313.0) (0.29) (256)
84-5 B 3 0.44 2,462.9 2.67 1,906 (0.13) (417.9) (1.45) (545)
84-6 GL 4 0.89 3,363.0 1.75 3,444 (0.16) (276.7) (0.48) (378)
84-7 GL 4 0.40 1,627.6 1.25 4,194 (0.23) (385.1) (0.25) (241)
1985
85-1 B 4 0.65 2,802.9 2.25 2,698 (0.24) (145.4) (0.25) (340)
85-2 B 7 1.15 2,327.5 1.43 3,566 (0.24) (317.1) (0.20) (385)
85-3 B 5 1.06 2,887.2 1.00 4,674 (0.24) (263.5) (0.00) (538)
85-4 B 6 1.08 1,936.3 2.33 3,190 (0.14) (452.5) (0.33) (225)
85-5 B 1 1.04 3,621.5 3.00 3,365
85-6 SM 3 0.83 3,382.8 0.33 2,936 (0.16) (283.1) (0.33) (471)
85-7 SM 2 1.86 3,049.1 0.00 2,408 (0.26) (153.2) (0.00) (28)
85-8 B 5 1.26 2,150.8 1.60 3,545 (0.12) (206.5) (0.25) (471)
• FOOD = invertebrate prey availability, COMP - impact of heterospecific intruders, INTR territory size.
b B = Badenoch Swamp, GL Guelph Lake, SM = Sayer's Mills.
- number of neighboring conspecifics, TSIZE =
time spent chasing intruders. (5) Courtship (COURT), all aerial interactions with the female. (6) Singing (SING), time spent in territorial song, excluding call notes. Pauses of < 10 s between individual songs were considered to be singing time. (7) Nesting (NEST), time spent at the nest and with fledged young.
We found that territorial defense in the Willow
Flycatcher was accomplished primarily by singing, rather than through overt aggression (see also Stein 1958). Hence, singing and defense time were com- bined (SINGDEF) and used as a measure of territorial defense investment.
Data analysis.--The allocation of time to various ter- ritorial activities can differ with the stage of the breed- ing cycle (e.g. Wolf 1975). We analyzed data at each of 3 breeding stages and over all stages. Stage 1 (ter- ritory establishment) included all phases from the arrival of the male to the initiation of nest building
by the female. Stage 2 comprised the nest-building, egg-laying, and incubation periods, and Stage 3 the nestling and fledgling stages. Because females arrive on the breeding grounds 5-7 days later than males (pers. obs.), territory size and time budgets might differ between the "prefemale" and "postfemale" phases of Stage 1. The limited number of observations before female arrival, and the need to generate suf- ficient sample sizes for analysis within a given breed- ing stage, prevented our separation of these phases. Similarly, space and time requirements might differ between the nestling and fledgling stages (e.g. Was- serman 1980). We gathered data for the fledgling pe- riod only during the 3-4 days following nest depar- ture by the young. After this time territorial boundaries tended to disintegrate, and observations were ter- minated. We combined the nestling and fledgling phases into a single breeding stage (Stage 3).

January 1988] Flycatcher Territorial Behavior 21
TAI•LE 2. Interspecific competitors and their frequency of occurrence on Willow Flycatcher territories. Values for body mass and % insectivory are incorporated into the competitive overlap index for each species, and ultimately in the calculation of COMP for a given territory (see text).
Competi- % of Mean % spatial Body % tive terri- overlap/terri- mass insec- overlap
Species tories tory (+SE) (g)a tivoryb index c
Black-billed Cuckoo (Coccyzus erythropthalmus) 1.7 0.17 + 0.17 51.1 100 2.53X Downy Woodpecker (Picoides pubescens) 6.7 0.50 + 0.28 27.0 86 5.58X Hairy Woodpecker (P. villosus) 6.7 0.50 + 0.28 67.8 82 1.46X Eastern Kingbird (Tyrannus tyrannus) 25.0 3.50 + 1.65 39.5 82 2.94X Eastern Phoebe (Sayornis phoebe) 1.7 0.08 + 0.08 19.8 95 11.59X Willow Flycatcher (Empidonax traillii) -- -- 12.6 a 96 e -- Black-capped Chickadee (Parus atricapillus) 6.7 0.50 + 0.28 10.8 91 32.50X Veery (Cartharus fuscescens) 1.7 0.08 + 0.08 31.2 63 3.21X American Robin (Turdus migratorius) 16.7 3.67 + 1.96 77.3 40 0.61X Gray Catbird (Dumetella carolinensis) 73.3 29.17 + 5.30 36.9 40 1.58X Cedar Waxwing (Bombycilla cedrorum) 28.3 5.42 + 2.34 32.5 20 0.96X Golden-winged Warbler (Vermivora chrysoptera) 1.7 0.17 + 0.17 8.8 100 f 20.80X Yellow Warbler (Dendroica petechia) 96.7 67.42 + 6.24 9.5 100 f 24.39X Common Yellowthroat (Geothlypis trichas) 75.0 16.15 + 2.49 10.1 100 f 28.57X Song Sparrow (Melospiza melodia) 60.0 21.00 ñ 3.71 20.8 40 4.35X Swamp Sparrow (M. georgiana) 91.7 45.67 + 5.52 17.0 16 2.96X Red-winged Blackbird (Agelaius phoeniceus) 70.0 19.50 + 3.91 53.4 50 1.20X Northern Oriole (Icterus galbula) 6.7 0.83 + 0.48 33.7 80 3.62X American Goldfinch (Carduelis tristis) 80.0 28.92 + 2.86 13.0 4 2.86X
From Dunning (1984) except where noted. Values represent weighted means of male and female if given separately. From Martin et al. (I95I) except where noted. Values represent summer diets wherever possible. See text. X represents the percentage of spatial overlap of each competitor on a given flycatcher terrritory, Ettinger and King (1980). Mean mass of breeding male and female. Beal (1912).
• Estimated from accounts by Bent (1953).
One-tailed Pearson product moment correlations (Sokal and Rohlf 1981) were used to test for the pre- dicted negative relationships of food availability (FOOD) with territory size (TSIZE), foraging time (FOR), and defense time (SINGDEF) and positive re- lationships of conspecific intruder pressure (INTR) and heterospecific competitor pressure (COMP) with TSIZE, FOR, and SINGDEF. Although simple bivar- iate correlations were employed in analyses involv- ing FOOD, an increase in food availability could cause an increase in both COMP and INTR (Myers et al. 1979, Norton et al. 1982). Thus, for tests involving COMP and INTR, we used partial correlations to hold constant the effect of FOOD.
RESULTS
Fifteen different breeding territories were ob- served a total of 61 times during 1984 and 1985 (Table 1). Breeding activities occasionally were completed before 4 random visits could be made to each territory. Some other territories re- mained active later in the season because of
renesting attempts and were visited up to 7 times. Body mass, degree of insectivory, and frequency of occurrence of each heterospecific
competitor observed on Willow Flycatcher ter- ritories are provided in Table 2.
The Willow Flycatcher as a time minimizer.--De- spite a fourfold difference in mean food avail- ability among study territories (considering only territories visited at least 4 times; Table 1), 13 of 14 female flycatchers produced a first clutch of 4 eggs. For the one female that laid a 3-egg clutch (territory 85-2), we suspect that the lay- ing was interrupted by observer disturbance. Three replacement (second) clutches contained 3 eggs each. In one polygynous mating (terri- tory 85-2) two females successfully raised 6 young without a larger-than-average territory (Prescott 1986) or a higher food availability (one- tailed Mann-Whitney U-test, n = 4, 15; U = 51, P > 0.05) than on other territories during Stage 3. Evidently, increased food abundance did not contribute to increased reproductive output in this population of Willow Flycatchers. Male fly- catchers spent 62.6 _+ 3.2% of their available time sitting during the breeding season; only 4.9 _+ 0.5% was allocated to foraging (Table 3). Thus, the foraging behavior of the Willow Fly-
22 PRESCOTT AND MIDDLETON [Auk, Vol. 105
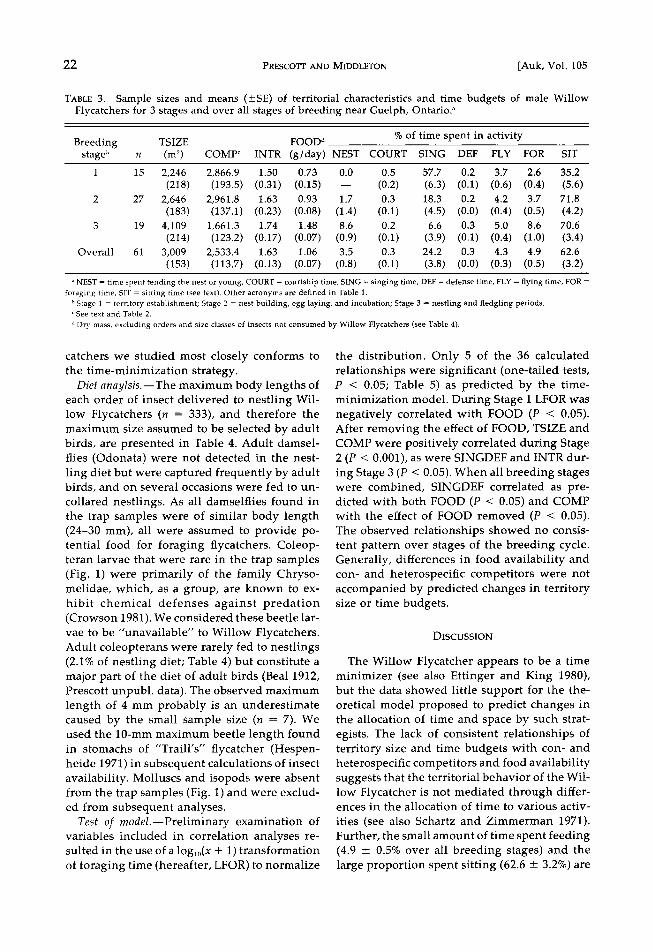
TABLE 3. Sample sizes and means (+SE) of territorial characteristics and time budgets of male Willow Flycatchers for 3 stages and over all stages of breeding near Guelph, Ontario. a
% of time spent in activity Breeding TSIZE FOOD d
stage b n (m 2) COMP c INTR (g/day) NEST COURT SING DEF FLY FOR SIT
1 15 2,246 2,866.9 1.50 0.73 0.0 0.5 57.7 0.2 3.7 2.6 35.2 (218) (193.5) (0.31) (0.15) -- (0.2) (6.3) (0.1) (0.6) (0.4) (5.6)
2 27 2,646 2,961.8 1.63 0.93 1.7 0.3 18.3 0.2 4.2 3.7 71.8 (183) (137.1) (0.23) (0.08) (1.4) (0.1) (4.5) (0.0) (0.4) (0.5) (4.2)
3 19 4,109 1,661.3 1.74 1.48 8.6 0.2 6.6 0.3 5.0 8.6 70.6 (214) (123.2) (0.17) (0.07) (0.9) (0.1) (3.9) (0.1) (0.4) (1.0) (3.4)
Overall 61 3,009 2,533.4 1.63 1.06 3.5 0.3 24.2 0.3 4.3 4.9 62.6 (153) (113.7) (0.13) (0.07) (0.8) (0.1) (3.8) (0.0) (0.3) (0.5) (3.2)
• NEST = time spent tending the nest or young, COURT = courtship time, SING = singing time, DEF = defense time, FLY = flying time, FOR = foraging time, SIT = sitting tim• (see text). Other acronyms are defined in Table 1.
b Stage 1 = territory establishment; Stage 2 = nest building, egg laying, and incubation; Stage 3 = nestling and fledgling periods. c See text and Table 2.
a Dry mass, excluding orders and size classes of insects not consumed by Willow Flycatchers (see Table 4).
catchers we studied most closely conforms to the time-minimization strategy.
Diet anaylsis.--The maximum body lengths of each order of insect delivered to nestling Wil- low Flycatchers (n = 333), and therefore the maximum size assumed to be selected by adult birds, are presented in Table 4. Adult damsel- flies (Odonata) were not detected in the nest- ling diet but were captured frequently by adult birds, and on several occasions were fed to un-
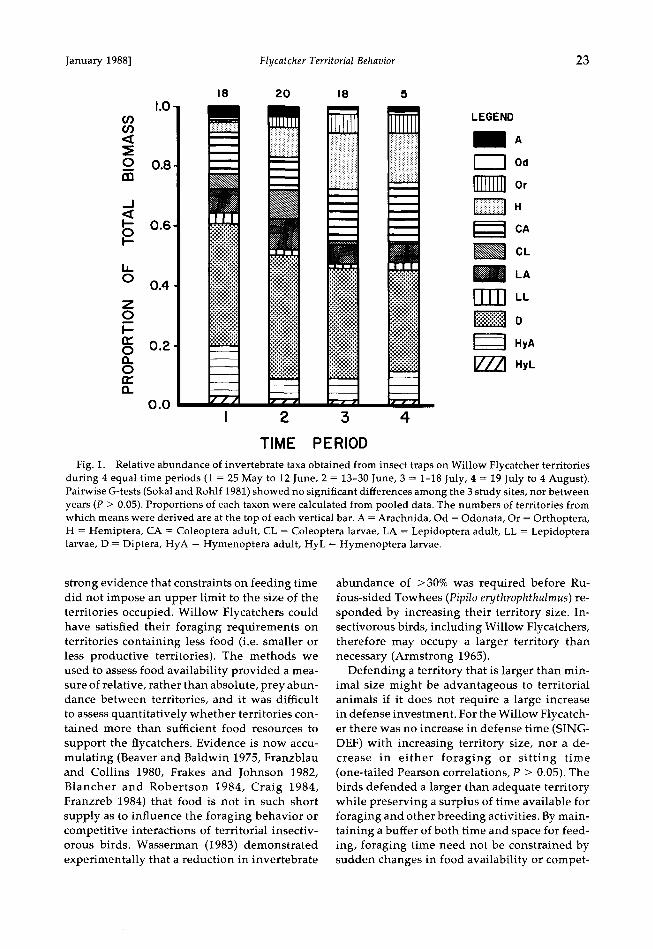
collared nestlings. As all damselflies found in the trap samples were of similar body length (24-30 mm), all were assumed to provide po- tential food for foraging flycatchers. Coleop- teran larvae that were rare in the trap samples (Fig. 1) were primarily of the family Chryso- melidae, which, as a group, are known to ex- hibit chemical defenses against predation (Crowson 1981). We considered these beetle lar- vae to be "unavailable" to Willow Flycatchers. Adult coleopterans were rarely fed to nestlings (2.1% of nestling diet; Table 4) but constitute a major part of the diet of adult birds (Beal 1912, Prescott unpubl. data). The observed maximum length of 4 mm probably is an underestimate caused by the small sample size (n = 7). We used the 10-mm maximum beetle length found in stomachs of "Traill's" flycatcher (Hespen- heide 1971) in subsequent calculations of insect availability. Molluscs and isopods were absent from the trap samples (Fig. 1) and were exclud- ed from subsequent analyses.
Test of modeL--Preliminary examination of variables included in correlation analyses re- suited in the use of a log•0(x + 1) transformation of foraging time (hereafter, LFOR) to normalize
the distribution. Only 5 of the 36 calculated relationships were significant (one-tailed tests, P < 0.05; Table 5) as predicted by the time- minimization model. During Stage 1 LFOR was negatively correlated with FOOD (P < 0.05). After removing the effect of FOOD, TSIZE and COMP were positively correlated during Stage 2 (P < 0.001), as were SINGDEF and INTR dur- ing Stage 3 (P < 0.05). When all breeding stages were combined, SINGDEF correlated as pre- dicted with both FOOD (P < 0.05) and COMP with the effect of FOOD removed (P < 0.05). The observed relationships showed no consis- tent pattern over stages of the breeding cycle. Generally, differences in food availability and con- and heterospecific competitors were not accompanied by predicted changes in territory size or time budgets.
DISCUSSION
The Willow Flycatcher appears to be a time minimizer (see also Ettinger and King 1980), but the data showed little support for the the- oretical model proposed to predict changes in the allocation of time and space by such strat- egists. The lack of consistent relationships of territory size and time budgets with con- and heterospecific competitors and food availability suggests that the territorial behavior of the Wil- low Flycatcher is not mediated through differ- ences in the allocation of time to various activ-
ities (see also Schartz and Zimmerman 1971). Further, the small amount of time spent feeding (4.9 + 0.5% over all breeding stages) and the large proportion spent sitting (62.6 + 3.2%) are
January 1988] Flycatcher Territorial Behavior 23
Z
o
o
1.0- 18 20 18
LEGEND
0.8 • Od Or
0.6 •=1 CA CL
• LA
0.4 r]T• LL D
0.• • HyA [77'• HyL
0.0 I 2 3 4
TIME PERIOD
Fig. 1. Relative abundance of invertebrate taxa obtained from insect traps on Willow Flycatcher territories during 4 equal time periods (1 = 25 May to 12 June, 2 = 13-30 June, 3 = 1-18 July, 4 = 19 July to 4 August). Pairwise G-tests (Sokal and Rohlf 1981) showed no significant differences among the 3 study sites, nor between years (P > 0.05). Proportions of each taxon were calculated from pooled data. The numbers of territories from which means were derived are at the top of each vertical bar. A = Arachnida, Od = Odonata, Or = Orthoptera, H = I-Iemiptera, CA = Coleoptera adult, CL = Coleoptera larvae, LA = Lepidoptera adult, LL = Lepidoptera larvae, D = Diptera, I-IyA = I-Iymenoptera adult, HyL = I-Iymenoptera larvae.
strong evidence that constraints on feeding time did not impose an upper limit to the size of the territories occupied. Willow Flycatchers could have satisfied their foraging requirements on territories containing less food (i.e. smaller or less productive territories). The methods we used to assess food availability provided a mea- sure of relative, rather than absolute, prey abun- dance between territories, and it was difficult
to assess quantitatively whether territories con- tained more than sufficient food resources to
support the flycatchers. Evidence is now accu- mulating (Beaver and Baldwin 1975, Franzblau and Collins 1980, Frakes and Johnson 1982, Blancher and Robertson 1984, Craig 1984, Franzreb 1984) that food is not in such short supply as to influence the foraging behavior or competitive interactions of territorial insectiv- orous birds. Wasserman (1983) demonstrated experimentally that a reduction in invertebrate
abundance of >30% was required before Ru- fous-sided Towhees (Pipilo erythrophthalmus) re- sponded by increasing their territory size. In- sectivorous birds, including Willow Flycatchers, therefore may occupy a larger territory than necessary (Armstrong 1965).
Defending a territory that is larger than min- imal size might be advantageous to territorial animals if it does not require a large increase in defense investment. For the Willow Flycatch- er there was no increase in defense time (SING- DEF) with increasing territory size, nor a de- crease in either foraging or sitting time (one-tailed Pearson correlations, P > 0.05). The birds defended a larger than adequate territory while preserving a surplus of time available for foraging and other breeding activities. By main- taining a buffer of both time and space for feed- ing, foraging time need not be constrained by sudden changes in food availability or compet-

24 PRESCOTT AND MIDDLETON [Auk, Vol. 105
TABLE 4. Composition of the nestling diet and max- imum length of each invertebrate taxon obtained from ligatured nestlings.
Maximum
Invertebrate taxon n length (mm)
Mollusca 4 6 Arachnida 19 12
Isopoda 4 11 Orthoptera 15 17 Hemiptera a 56 9 Coleoptera adult 7 4 Lepidoptera adult 20 17 Lepidoptera larvae 10 28 Diptera adult 188 16 Hymenoptera adult 9 10 Hymenoptera larvae 1 22
Includes Homoptera and Heteroptera.
itor pressure (Ettinger and King 1980, Herbers 1981). Insectivorous birds such as flycatchers may be especially susceptible to environmental variability, as the emergence and activity of their prey is weather dependent. It follows that ter- ritory size in insectivorous birds presumably evolved in response to ultimate rather than proximate levels of resource abundance (Orians 1971, Seastedt and MacLean 1979, Franzblau and Collins 1980; see also Myers et al. 1981). During years of average insect availability, food nor- mally would not be limiting, and excess space and time would be available. This was probably the situation during the summers of 1984 and
1985 near Guelph. During years of low insect abundance or high competitor density, con- straints on foraging time could be sufficient that the territorial behavior of male Willow Fly- catchers better conforms to the predictions of the model. If the presence of competitors and food abundance do not determine the territory size or time budgets of Willow Flycatchers, then an alternative explanation is required to ac- count for the observed variation in territory size. One explanation is that males adjust ter- ritory size in response to seasonal and individ- ual differences in the energy requirements as- sociated with different breeding activities. For example, the defended territory must be suffi- ciently large to provide the resources necessary to meet the energy expenditure of the parents and, when present, the growth and mainte- nance of the nestlings. The observation that ter- ritory size is related to interspecific difference in body size, and therefore metabolic require-. ment, among species of mammals (McNab 1963, Mace and Harvey 1983) and birds (Schoener 1968, Mace and Harvey 1983) is consistent with this idea.
To test this hypothesis we calculated three types of energy budgets to which territory size could potentially be adjusted or correlated. We hypothesized that male flycatchers might adjust the size of the defended area to the male's en-
ergy expenditure (MEE); to the male's energy requirement (MER), which includes the pro-
TABLE 5. Correlation coefficients, one-tailed significance tests, and predicted relationships of territorial re- sponses (TSIZE, LFOR, and SINGDEF) with FOOD, INTR, and COMP for 3 stages, and over all breeding stages of the Willow Flycatcher. a Correlations involving FOOD represent simple bivariate correlations; those including INTR or COMP are partial correlations controlling for food availability. Sample sizes and definitions of abbreviations are given in Tables 1 and 3.
Predicted
Breeding stage TSIZE LFOR b SINGDEF relationship FOOD 1 +0.2022 -0.5874* +0.3339
2 -0.1500 +0.1131 -0.2433 3 +0.1910 -0.1999 +0.3175 Negative
Overall + 0.3916 + 0.2958 - 0.2822'
INTR c 1 + 0.1105 - 0.3746 - 0.3475 2 +0.0735 -0.1759 +0.2593
Positive 3 0.6567 + 0.0834 + 0.4035'
Overall + 0.0068 + 0.0322 - 0.0288
COMP c 1 +0.0721 - 0.5650 - 0.0759 2 +0.4751'* -0.1138 +0.3022
Positive 3 + 0.0604 - 0.3046 - 0.1657
Overall -0.2110 -0.5622 +0.2786*
* = P < 0.05, ** = P < 0.001.
log•0(FOR + 1). Partial correlation coefficients, removing the effect of food.

January 1988] Flycatcher Territorial Behavior 25
portion of energy to be supplied by the male for nestling growth; or to the total energy re- quirement of all the birds on the territory (TER). The latter included MER, the energy expendi- ture of the female, and the female's share of the
nestling expenditures. Calculations are provid- ed in the Appendix, and rank correlations wi. th territory size in Table 6. Duri. ng breeding Stages 1 and 2 there were no significant relationships between either of the three energy budgets and territory size (P > 0.05). MER and TER both correlated positively with territory size during Stage 3 (P < 0.05). When all breeding stages were considered together, territory size corre- lated positively with MEE (P < 0.01) and more strongly with MER and TER (P < 0.0001). Ter- ritory size in the Willow Flycatcher therefore appears to be adjusted by the male in response to the energy demands of all of the territory's occupants, particularly when nestlings and fledglings are present (Stage 3). Such a rela- tionship might constitute evidence that terri- tory size is adjusted in direct proportion to en- ergy demand (i.e. only sufficient resources defended) during the period of nestling growth. If this were true, then feeding time would be expected to show a positive relationship with territory size during Stage 3, which was not the case (Table 5). Territory size may be expanded in response to energy requirements, but it prob- ably is maintained at a size that still supplies more than sufficient resources for the territorial
birds.
We believe that models based on optimal for- aging time are not strictly applicable to Willow Flycatchers or to other insectivorous passerines that defend territories in the breeding season. The model tested here was formulated origi- nally for nonbreeding indi.viduals. Hi. xon (1980) argued that for feeding territories defended in any season, factors that affect energy acquisition should be the most important determinants of terri. tory size. Other defendable resources that are unique to the breeding season (e.g. mates, young, nest sites), however, i. mpose conflicting pressures on the birds that could influence ter- ritory size, and feeding time need not be the sole behavior optimized. Willow Flycatchers apparently minimi. ze the time spent i.n main- tenance activities by adopting a "sit and wait" foraging strategy. Birds can simultaneously en- gage in vigilance, food searching and capture, territorial advertisement, and resting (Ettinger and King 1980). Feeding and defense need not
TABLE 6. Rank correlation coefficients of male en-
ergy expenditure (MEE), male energy requirement (MER), and total energy requirement (TER) of the territory with territory size for Willow Flycatchers during the breeding season. • See Appendix for cal- culation of energy budgets. Sample sizes are given in Table 3.
Breeding stage MEE MER TER
I -0.0593 -0.0593 0.2308
2 -0.1002 0.1002 -0.0899 3 -0.0134 +0.4551' +0.5294*
Overall +0.3393** +0.5210'** +0.4786***
• * = P < 0.05, ** = P < 0.01, *** = P < 0.0001.
be mutually exclusive components of the ti. me budget, and theoretical optima for time invest- ment in any one activi. ty may be difficult to predi. ct. The extent to which the territorial be- havi. or of other time-mini. mizing species con- forms to the predictions of the model depends on species ecology and the previ. ously identi.- fled constraints on foraging behavi. or. Opti- mality models provide an operational frame- work for i. nvesti. gati. ng the proximate determinants of territori. al behavior, and war-
rant further testing on a wide variety of species.
ACKNOWLEDGMENTS
We thank L. Beattie, D. Graham, D. Jolly, and M. Vindum for assistance in the field and M. Cadman
for locating the Sayer's Mills study site. Equipment donations or loans by V. G. Thomas and M. Sears are gratefully acknowledged. S. A. Marshall provided ex- pertise on entomological problems and techniques. Comments and criticisms by T. D. Nudds, S. A. Mar- shall, L. Beattie, J. L. Beacham, F. E. Wasserman, and members of the Ecology and Evolutionary Biology Discussion Group at the University of Guelph greatly improved the quality of the manuscript. The work was supported by a Natural Sciences and Engineering Research Council operating grant (#A6495) to A.L.A.M.
LITERATURE CITED
ARMSTRONG, J.T. 1965. Breeding home range in the nighthawk and other birds; its evolutionary and ecological significance. Ecology 46: 619-629.
BEAL, F. E. L. 1912. Food of our more important flycatchers. U.S. Dept. Agric. Biol. Surv. Bull. 44.
BEAVER, D. L., & P. H. BALDWIN. 1975. Ecological overlap and the problem of competition and sym- patty in the Western and Hammond's flycatchers. Condor 77: 1-13.

26 PRESCOTT AND MIDDLETON [Auk, Vol. 105
BENT, A. C. 1942. Life histories of North American
flycatchers, larks, swallows and their allies. U.S. Natl. Mus. Bull. 179.
--. 1953. Life histories of North American wood
warblers. U.S. Natl. Mus. Bull. 203.
BLANCHER, P. J., & R. J. ROBERTSON. 1984. Resource
use by sympatric kingbirds. Condor 86: 305-313. BORRER, D. J., D. M. DELONG, & C. A. TRIPLEHORN.
1976. An introduction to the study of insects. New York, Holt, Rinehart & Winston.
BROWN, J. L. 1964. The evolution of diversity in arian territorial systems. Wilson Bull. 76: 160- 169.
CARPENTER, F. L., & R. E. MACMILLEN. 1976. Thresh-
old model of feeding territoriality and test with a Hawaiian honeycreeper. Science 194: 639-642.
CRAIG, R.J. 1984. Comparative foraging ecology of Louisiana and Northern waterthrushes. Wilson
Bull. 96: 173-183.
CROWSON, R.A. 1981. The biology of the Coleoptera. New York, Academic Press.
DAVIS, D. E. 1954. The breeding biology of Ham- mond's Flycatcher. Auk 71: 164-171.
1959. Observations on territorial behavior
of Least Flycatchers. Wilson Bull. 71: 73-85. DAvis, J., G. F. FISLER, & B. S. DAVIS. 1963. The breed-
ing biology of the Western Flycatcher. Condor 65: 337-382.
DAVIS, W.J. 1982. Territory size in Megaceryle alcyon along a stream habitat. Auk 99: 353-362.
DIGSY, P.S. B. 1958. Flight activity in the blow fly, Calliphora erythrocephala, in relation to wind speed, with special reference to adaptation. J. Exp. Biol. 35: 776-795.
DILL, L.M. 1978. An energy-based model of optimal feeding-territory size. Theor. Pop. Biol. 14: 396- 429.
--, R. C. YDENBERG, & g. H. G. FRASER. 1981.
Food abundance and territory size in juvenile coho salmon (Oncorhynchus kisutch). Can. J. Zool. 59: 1801-1809.
DUNNING, J. B., JR. 1984. Body weights of 686 species of North American birds. West. Bird Banding As- soc. Monogr. No. 1.
EBERSOLE, J.P. 1980. Food density and territory size: an alternative model and a test on the reef fish
Eupomacentrus leucostictus. Am. Nat. 115: 492-509. ETTINGER, A. O., & J. R. KING. 1980. Time and energy
budgets of the Willow Flycatcher (Empidonax traillii) during the breeding season. Auk 97: 533- 546.
EWALD, P. W., G. L. HUNT JR., & M. WARNER. 1980. Territory size in Western Gulls: importance of intrusion pressure, defense investments, and vegetation structure. Ecology 61: 80-87.
FRAKES, R. A., & R. E. JOHNSON. 1982. Niche con- vergence in Empidonax flycatchers. Condor 84: 286-291.
FRANZBLAU, M. A., & J.P. COLLINS. 1980. Test of a hypothesis of territory regulation in an insectiv-
orous bird by experimentally increasing prey abundance. Oecologia 46: 164-170.
FRANZREB, K. E. 1984. Foraging habits of Ruby- crowned and Golden-crowned kinglets in an Ar- izona montane forest. Condor 86: 139-145.
GRUBB, T. C., JR. 1979. Factors controlling foraging strategies of insectivorous birds. Pp. 119-135 in The role of insectivorous birds in forest ecosys- tems (J. G. Dickson, R. N. Connor, R. R. Fleet, J. A. Jackson, and J. C. Kroll, Eds.). New York, Ac- ademic Press.
HERBERS, J.g. 1981. Time resources and laziness in animals. Oecologia 49: 252-262.
HESPENHEIDE, H. g. 1971. Food preference and the extent of overlap in some insectivorous birds, with special reference to the Tyrannidae. Ibis 113: 59-72.
HIXON, M.A. 1980. Food production and competitor density as the determinants of feeding territory size. Am. Nat. 115: 510-530.
HOLMES, R. T. 1970. Differences in population den- sity, territoriality and food supply of Dunlin on arctic and subarctic tundra. Pp. 303-319 in Animal populations in relation to their food supply (A. Watson, Ed.). Oxford, Blackwell Scientific Publ.
JOHNSON, E. J., L. B. B•ST, & P. A. HF•GY. 1980. Food
sampling biases associated with the "ligature method." Condor 82: 186-192.
KING, J.R. 1955. Notes on the life history of Traill's Flycatcher (Empidonax traillii) in southeastern Washington. Auk 72: 148-173.
KODRIC-BROWN, A., & J. H. BROWN. 1978. Influence of economics, interspecific aggression, and sexual dimorphism on territoriality of migrant Rufous Hummingbirds. Ecology 59: 285-296.
LEDERER, R. J. 1972. Foraging behavior and niche overlap in seven species of North American fly- catchers (Tyrannidae). Ph.D. dissertation, Ur- bana-Champaign, Univ. Illinois.
MACE, G. M., & P. H. HARVEY. 1983. Energetic con- straints on home-range size. Am. Nat. 121: 120- 132.
MAcLF•N, S. F., & T. R. $EASTEDT. 1979. Arian ter-
ritoriality: sufficient resources or interference competition? Am. Nat. 114: 308-312.
MARTIN, A. C., H. S. ZIM, & A. L. NELSON. 1951.
American wildlife and plants. New York, Mc- Graw-Hill.
MASNER, L., & H. GOULET. 1981. A new model of
flight interception trap for some hymenopterous insects. Entomol. News 92: 199-202.
MAYR, E. 1964. Systematics and the origin of species. New York, Dover.
MCNAB, B. K. 1963. Bioenergetics and the deter- mination of home range size. Am. Nat. 97: 133- 140.
MUMFORD, R. E. 1964. The breeding biology of the Acadian Flycatcher. Univ. Michigan Mus. Zool. Misc. Publ. No. 125.
MYERS, J.P., P. G. CONNORS, & F. A. PITELKA. 1979.

January 1988] Flycatcher Territorial Behavior 27
Territory size in wintering Sanderlings: the ef- fects of prey abundance and intruder density. Auk 96: 551-561.
--, & --. 1981. Optimal territory size and the Sanderling: compromises in a vari- able environment. Pp. 135-158 in Foraging be- havior: ecological, ethological and pyschological approaches (A. C. Kamil and T. D. Sargent, Eds.). New York, Garland Press.
NORTON, M. E., P. ARCESE, & P. W. EWALD. 1982.
Effect of intrusion pressure on territory size in Black-chinned Hummingbirds (Archilochus alex- andri). Auk 99: 761-764.
ODUM, E. P., & E. J. KUENZLER. 1955. Measurement of territory and home range size in birds. Auk 72: 128-137.
ORIANS, G. H. 1971. Ecological aspects of behavior. Pp. 513-546 in Avian biology, vol. ! (D. S. Farner and J. R. King, Eds.). New York, Academic Press.
PRESCOTT, D. R. C. 1986. Polygyny in the Willow Flycatcher. Condor 88: 385-386.
1987. Territorial responses to song playback in allopatric and sympatric populations of the Alder (Ernpidonax alnorurn) and Willow (E. trailIll) flycatchers. Wilson Bull. 99: in press.
PYKE, G. H. 1979. The economics of territory size and time budget in the Golden-winged Sunbird. Am. Nat. 114: 131-145.
SCHARTZ, R. L., & J. L. ZIMMERMAN. 1971. The time and energy budget of the male Dickcissel (Spiza americana). Condor 73: 65-76.
SCHOENER, t. W. 1968. Sizes of feeding territories among birds. Ecology 49: 123-141.
1971. Theory of feeding strategies. Annu. Rev. Ecol. Syst. 2: 369-404.
1983. Simple models of optimal feeding- territory size: a reconciliation. Am. Nat. 121: 608- 629.
SEASTEDT, T. R., & S. F. MACLEAN. 1979. Territory size and composition in relation to resource abundance in Lapland Longspurs breeding in arctic Alaska. Auk 96: 131-142.
SIMON, C.A. 1975. The influence of food abundance
on territory size in the iguanid lizard Sceloporus jarrovi. Ecology 56: 993-998.
SLANEY, P. A., & T. G. NORTHCOTE. 1974. Effects of
prey abundance on density and territorial be- havior of young rainbow trout (Salrno gairdneri) in laboratory stream channels. J. Fish. Res. Board Can. 31: 1201-1209.
SMITH, C. C. 1968. The adaptive nature of social organization in the genus of three squirrels Tam- iasciurus. Ecol. Monogr. 38: 31-63.
SOKAL, R., & F. ROHLF. 1981. Biometry. San Francis- co, Freeman.
SOUTHWOOD, T. R.E. 1971. Ecological methods, with special reference to the study of insect popula- tions. London, Methuen & Co.
STEIN, R. C. 1958. The behavioral, ecological and morphological characteristics of two populations
of the Alder Flycatcher, Ernpidonax traillii (Au- dubon). New York State Mus. Sci. Serv. Bull. No. 371.
STINGER, J.A. 1958. Food habits and available food of Ovenbirds in relation to territory size. Auk 75: 335-346.
TAYLOR, L. R. 1963. Analysis of the effect of tem- perature on insects in flight. J. Anita. Ecol. 32: 99-117.
TOWNES, H. 1972. A light weight Malaise trap. Ento- tool. News 83: 239-247.
TULLOCK, G. 1979. On the adaptive significance of territoriality: comment. Am. Nat. 113: 772-775.
WAL•CINSHAW, L.H. 1966. Summer biology of Traill's Flycatcher. Wilson Bull. 78: 31-46.
WALSBERG, G.E. 1983. Arian ecological energetics. Pp. 161-220 in Arian biology, vol. 7 (D. S. Farner, J. R. King, and K. C. Parkes, Eds.). New York, Academic Press.
--, & J. R. KING. 1978. The energetic conse- quences of incubation for two passefine species. Auk 95: 644-655.
WASSERMAN, F.E. 1980. Territorialbehavior in a pair of White-throated Sparrows. Wilson Bull. 92: 74- 87.
1983. Territories of Rufous-sided Towhees
contain more than minimal food resources. Wil-
son Bull. 95: 664-667.
W1TTENBERGER, J. F. 1981. Animal social behavior. Boston, Duxbury Press.
WOLF, L. L. 1975. Energy intake and expenditures in a nectar-feeding sunbird. Ecology 56: 92-104.
YEATON, R. I., & g. L. CODY. 1974. Competitive re- lease in island Song Sparrow populations. Theor. Pop. Biol. 5: 42-58.
APPENDIX. Calculation of energy budgets.
Male energy expenditure (MEE).--Energetic equivalents of activities included in time-budget analyses were used to calculate the energy expenditure of the male Willow Flycatcher. A basal metabolic rate (BMR) of 0.79 kJ/h (Ettinger and King 1980) was assumed. Sitting was assigned a value of 1.66 kJ/h (2.1 x BMR), singing a value of 1.83 kJ/h (1.1 x sitting), and flying a value of 7.13 kJ/h (Ettinger and King 1980). Foraging flights, which were generally more vigorous than forward flight, were assumed to consume 7.5 kJ/h; flights associated with de- fense and courtship were assigned an energetic equivalent of 8.0 kJ/h. The time spent at the nest tending young was considered more costly than perching and was estimated to require 3.0 kJ/h. Activity costs were summed over an 18-h period (Ettinger and King 1980). We as- sumed that the time allocated during the morning observation period was representative of activities over the entire day. Nighttime costs ("sleep") were estimated to require 1.36 kJ/h (18% less than sitting cost; Walsberg and King 1978) over 6 h.
Male energy requirement (MER).--The male requirement represents the energy expenditure of the male flycatcher (MEE, see above), and the proportion of the nestlings' requirements that the male must pro- vide. We assumed that both parents feed the young equally, as is typical of Empidonax flycatchers (Bent 1942, Mum ford 1964). The cost of nestling growth (E•) was calculated from the average nestling requirement (Walsberg 1983) as:
In En - In 14.05 + 0.440 In M•,
where Mb = adult body mass (12.6 g; Table 2). Of the estimated 42.84 kJ/day required per nestling, the male supplies half, or 21.42 kJ-nest-

28 PRESCOTT AND MIDDLETON [Auk, Vol.
ling -•. day -:. For fledglings, the maximum energy expenditure of nest- ling growth (Walsberg 1983) was employed:
In E• = In I3.40 + 0.528 In Mb,
or 25.53 kJ.fledgling-•.day -• for each parent. The added cost of the requirement of the young is accrued only during breeding Stage 3; for Stages I and 2, MEE equals MER.
Total energy requirement of the territory (TER).--TER includes the total energy requirement of the female plus the male MER (as above). Because time budgets for females were not recorded, we used the mean energy expenditure values of females for each stage of breeding calculated by Ettinger and King (1980: table 3). These are prenesting (breeding Stage I), 65.2 kJ/day; incubation, 51.7 kJ/day; and for the nestling and fledg- ling periods (Stage 3), 53.1 kJ /day. For the nest-building and incubation stages, Ettinger and King's (1980: table 5) values for female expenditures (58.0 kJ/day) include an estimated cost of egg production (4.6 kJ/day), calculated based on a clutch size of 3 eggs. Female Willow Flycatchers near Guelph typically produce a 4-egg clutch, and we added 1.53 kJ/ day (V3 of 4.6 k]/day) to the daily energy expenditure to account for the added energy cost. The female's share of the nestling and fledgling expenditures (21.42 and 25.53 kJ.young •.day -•, respectively) were then added to all Stage 3 territories, and the total female expenditures added to those of the male (MER), to derive the value of TER for each territory.