feeding ecology of greenland halibut and sandeel larvae off west
TRANSCRIPT

RESEARCH ARTICLE
C. S. Simonsen Æ P. Munk Æ A. FolkvordS. A. Pedersen
Feeding ecology of Greenland halibut and sandeel larvaeoff West Greenland
Received: 2 March 2005 / Accepted: 1 November 2005 / Published online: 25 February 2006� Springer-Verlag 2006
Abstract Feeding ecology of Greenland halibut(Gr. halibut) (Reinhardtius hippoglossoides) and sandeel(Ammodytes sp.) larvae on the West Greenland shelf wasstudied during the main part of the productive season(May, June and July). Copepods were the main preyitem for larval Gr. halibut and sandeel, constitutingbetween 88 and 99% of the ingested prey biomass. Forboth species, absolute size of preferred prey increasedduring ontogeny. However, preferred copepod size inrelation to larval length differed markedly. In Gr. hali-but, the relative size of the prey declined during growthof the larvae, while it remained constant for sandeel at alevel of 2.7% of larval length. This led to a reduction inprey niche overlap between the two species. The avail-able prey copepod biomass differed distinctly across theshelf area. In May, the prey density of Gr. halibut wasthe highest in the off-shelf area in Davis Strait. In Juneand July, the prey-rich areas for both species weremainly located at the slopes of the banks and at the shelfbreak area. Gut fullness was higher in these areas than in
neighbouring areas, suggesting that the larval food re-source could be scarce. The feeding ecology of Gr. hal-ibut and sandeel could explain why larval abundanceindices of the two species have historically shownopposite responses to yearly environmental conditionsand total zooplankton occurrence.
Introduction
Off West Greenland, larvae of both the Greenland hal-ibut (Reinhardtius hippoglossoides Walbum), in the fol-lowing named as Gr. halibut, and sandeels (Ammodytessp.) are sympatric and occur during the same period ofthe year (Pedersen and Rice 2002; Munk et al. 2003).The historic time series of larval abundance of these twospecies show opposite responses to yearly environmentalconditions and zooplankton densities (Pedersen andRice 2002). The reason for this inverse correlation re-mains unresolved but nonetheless seems to be importantfor an understanding of the population dynamics ofboth species. Since the maintenance of viable stocksdepends on survival and growth of the larvae, detailedknowledge about the feeding ecology of the sympatriclarval stages of Gr. halibut and sandeel is important fora better understanding of parent stock recruitmentprocesses. It is evident that larvae can only ingestorganisms smaller than their mouth size, but in additionthe larvae must throughout its ontogenetic developmentbe able to detect and catch the prey (Munk 1992; Hartand Gill 1993). The progressive changes in prey size andtype during larval ontogeny have been studied in sandeel(e.g. Monteleone and Peterson 1986; Pearre 1986;McGurk et al. 1992) but never in Gr. halibut. A singlestudy on the diet of Gr. halibut has been carried out inthe eastern Norwegian and Barents Seas but this did notreport on the size of the prey items (Haug et al. 1989).There is therefore a need for improved knowledge of thelarval feeding biology of these two species in WestGreenland waters and information on the potential preycompetition between them.
Communicated by M. Kuhl, Helsingør
C. S. Simonsen (&) Æ S. A. PedersenGreenland Institute of Natural Resources,P.O. Box 570, 3900, Nuuk, GreenlandE-mail: [email protected].: +45-33-963300Fax: +45-33-963434
Present address: C. S. SimonsenDanish Institute of Fisheries Research,Charlottenlund Castle, 2920, Charlottenlund, Denmark
P. MunkDanish Institute of Fisheries Research, Charlottenlund Castle,2920, Charlottenlund, Denmark
A. FolkvordDepartment of Biology, Bergen High Technology Center,University of Bergen, P.O. Box 7800, 5020, Bergen, Norway
Present address: S. A. PedersenJCES, H. C. Andersens Boulevard 44-46, 1553,Copenhagen V, Denmark
Marine Biology (2006) 149: 937–952DOI 10.1007/s00227-005-0172-5

The waters off West Greenland show marked vari-ability in hydrographical and biological conditions. Thearea includes both polar and temperate regimes, which isreflected in the species composition and communitystructures (Møller and Nielsen 2000; Pedersen and Rice2002; Munk et al. 2003; Pedersen et al. 2005). In thecross-shelf variability of zooplankton abundance, highabundances are often found over the slopes of the banks,and plankton distribution is apparently related tohydrographic fronts between along-shelf flowing currentstructures (Pedersen et al. 2005). Likewise, the distri-bution of fish larvae seems to show patterns relatedto shelf topography and water mass characteristics(Pedersen and Rice 2002; Munk et al. 2003).
The objective of this study is to analyse and comparethe feeding ecology of co-occurring Gr. halibut andsandeel larvae in West Greenland waters. Diet analysisand prey preference considerations will be used to assessspatial variation in prey availability and feeding. Po-tential niche overlap and competition for prey will beevaluated from prey availability and larval gut contents.Our primary goal is to analyse seasonal and cross-shelfvariability in prey availability of Gr. halibut and sandeelin the area, hypothesizing that feeding conditions areoptimal in central areas of fish larval distribution, andthat timing of larval emergence is synchronised withprey availability.
Materials and methods
Fish larvae
Samples of larval Gr. halibut, sandeel and zooplanktonwere obtained during three surveys in May (2000), June(1999) and July (2000) covering the sea off West Green-land between 63�20¢N and 66�20¢N (Fig. 1). Except forthree stations positioned in Davis Strait during the surveyin May, stations were located along East–West transectscrossing the shelf banks. Transect 3 was sampled both inJune 1999 and May 2000 while transects 4 and 5 weresampled in July 2000 only. Sampling on all surveys tookplace within the period sunrise to sunset. Gr. halibut andsandeel larvae were collected with two types of ring nets.InMay we used a Bongo net with a diameter of 0.6 m anda mesh size of 500 lm, while in June and July a ring net(MIK) with 2 m diameter and 1,000 lm mesh size wasused. The nets were changed because the Bongo net(500 lm) is more efficient for catching smaller larvaecommon in May while the MIK net (1,000 lm) is moreefficient in sampling larger larvae more prevalent later inthe season (P. Munk, unpublished results). Oblique haulswith the Bongo or MIK net from the surface to 200 m ofdepth or 5 m above the seafloor were carried out while theship’s speed was three knots. A flow meter in the netopening recorded the filtered water volume.
Larvae were immediately sorted from the otherplankton in the samples and transferred to 96% ethanol,or frozen after net retrieval. The remaining plankton
sample was preserved in 4–8% formaldehyde solutionand later checked for missed larvae. Larval standardlength (SL) was measured to 1 mm below and the lengthof the lower jaw was measured from the joint with themaxilla bone to the tip of the mouth were measured withthe aid of a microscope. Samples containing more than80 larvae per station were sub-sampled for SL while jawlength was measured on a representative size range of allthe sampled larvae. Jaw length is proportional to gapesize (Shirota 1970). Larval shrinkage was adjusted byshrinkage corrections given by Fey (1999) and Hjorle-ifsson and Klein-MacPhee (1992).
Prey environment
Micro- and mesozooplankton were sampled in May andJune with a WP-2 net (diameter 0.58 m, mesh size50 lm) and in July by a submersible zooplankton pump(900 l min�1, equipped with a 50 lm conical net). WP-2net and pump sampling of zooplankton affords com-parable density estimates (Pillar 1984). Vertical haultaken was from bottom (or max 200 m) to surface atregular intervals along the transect lines in order to givedepth-integrated information on regional zooplanktondistribution. In addition, zooplankton was sampled atdiscrete depth intervals on selected stations during theMay and July surveys. During the May survey, thedepth intervals were 0–100 m; 100–200 m; 200–400 and400–800 m; and in July, 0–13 m; 13–25 m; 25–40 m and40–100 m. Detailed descriptions of the sampling andprocessing protocols for zooplankton are given by Pe-dersen et al. (2002).
A total of 202 Gr. halibut and 348 sandeel larvaecovering the entire larval size spectrum were selected forprey analysis. For Gr. halibut, larvae from May, Juneand July surveys were included in order to cover the sizespectrum while for sandeel it was only necessary to in-clude larvae from the May and July surveys. The gutswere extracted and prey items identified and counted.For copepods, we measured the length and width of theprosome, while in other prey items only the maximumlength-width distance. Measurements were made withthe aid of a microscope and a video analysing system.When more than 40 prey items of the same type werepresent in one larva, measurements were performed onlyon a sub-sample. Information on taxa, abundance andlength of the prey items were used for estimation ofcarbon biomass content using the live length-weight keysgiven by Pedersen et al. (2002).
Carbon weight of fish larvae was estimated fromlength to dry weight (DW) relationships assuming acarbon to dry weight factor of 0.45 (Kiørboe et al. 1987).Dry weights were obtained by regressing individuallength against individual dry weight (60�C for 72 h) afterremoval of the gut, otoliths and extraction of lipids inchloroform methanol for 48 h. The otolith and lipidextraction was carried out for a study not reported here.The larval length to DW relationships were:
938

Gr. halibut DW ðSLÞ ¼ 6:12� 10�2 � SL3:47;
r2 ¼ 0:90;
N ¼ 53; SL interval 12:9--36:2mm
Sandeel DW ðSLÞ ¼ 7:61� 10�2 � SL2:61; r2 ¼ 0:90;
N ¼ 147; SL interval 9:5–36:8mm
where SL was in mm and DW in lg. The relative gutfullness was calculated as carbon content of ingestedprey divided by larval carbon weight.
Prey size preference of Gr. halibut and sandeel wasascertained from the relative frequency of prey size intheir diet in relation to the relative frequencies in theenvironment. The zooplankton and prey items weregrouped into log10 spaced intervals in order to ensurethat an adequate number of observations were presentalso for the larger-sized items. The log10 interval stepwas 0.1 from �1 (log10 to 0.1 mm). The size prey pref-erence was calculated by the Chesson prey preferenceindex a (Chesson 1978):
ai ¼ ðai=niÞX
aj=nj
� ��1ðj ¼ 1::::mÞ;
where ai and ni are the abundance of prey items of theith size interval in the gut and the environment,
respectively, and m is the number of intervals consid-ered. The a value was calculated for each larval sizeinterval on each station. Gr. halibut and sandeel weregrouped in 4 mm length intervals for larvae up to 16and 2 mm intervals for larger larvae (in order to ensurea reasonable number of prey items in each interval).The frequency distribution of a is assumed to be nor-mally distributed and the mean of this frequency dis-tribution thus indicates the prey size of maximalpreference. Prey niche breadth was described by thestandard deviation of the maximum prey size prefer-ence (equal to the SLH index presented by Pearre1986). The obtained estimates of prey niche breadthand maximum preference for the average size Gr. hal-ibut and sandeel larvae during each survey were usedto estimate the relative preference (p) for the ith sizeinterval from the normal distribution of p:
pðiÞ ¼ qðiÞ=Pm
j¼1qðiÞ ðj ¼ 1; ::::;mÞ;
where qðiÞ ¼ ðexpðlogðiÞ � logðpreymaxÞÞ2Þ=ð�2=r2Þ ;
where i is the size interval, preymax is the prey size ofmaximal preference for a given fish larvae length, r is thestandard deviation of the maximum prey size preference.The available prey (preyavailable) for a given fish larvae
Fig. 1 The area of investigationoff western Greenland.Bathymetry is shown by shadedcontour lines for 100, 250, 500,1,000 and 2,000 m depths.Stations for this study wereplaced along three transects.Transect 3 in June 1999 andMay 2000, transects 4 and 5 inJuly 2000 (same nomenclaturefor transect as in Pedersen et al.(2002). The star symbol showsadditional stations were depth-stratified zooplankton samplingwas performed—white starsstations in May 2000; blackstars stations in July 2000
939

size was estimated from the relative preference on sizeintervals of zooplankton biomass:
preyavaliable ¼Xm
j¼1pðiÞ�a
iðj ¼ 1::::mÞ;
where p(i) is the relative preference for the ith sizeinterval.
All statistical analyses were performed in the SAS/STAT software Version 9 of the SAS System for PC,SAS Institute Inc., Cary, NC, USA. The followingabbreviations were used for statistical tests: analysis ofvariance (ANOVA); analysis of covariance (ANCOVA);general linear model (GLM).
Results
Fish larvae
The average standard length (SL) of both Gr. halibutand sandeel larvae increased between the surveys in May(mean SL Gr. halibut 17.6 mm; sandeel 9.0 mm) andJuly 2000 (mean SL Gr. halibut 31.0 mm; sandeel25.5 mm), while larvae sampled in June 1999 were of anintermediate size (mean SL Gr. halibut 23.5 mm; san-deel 17.3 mm) (Fig. 2). Gape size increased significantlywith larval length both in absolute terms and relative tolarval length in both species (GLM, P<0.001). Theslopes of the relative jaw length to larval length were
similar for Gr. halibut and sandeel (homogeneity ofslopes test, P=0.73), but since Gr. halibut generally hada larger relative gape size, the curves are significantlydisplaced (ANCOVA, P=0.002) (Fig. 3).
Fish larval prey
Overall, 97% of the Gr. halibut and 85% of the sandeellarvae contained prey items. These prey items were frommore than 13 different taxonomic groups. In biomass,the copepods were the dominant prey for both Gr.halibut and sandeel in all sampling periods (Table 1).The copepods constituted between 88 and 99% of totalgut content in all sampled periods. In July, relativelymore of the prey items were bivalves and gastropodlarvae, eggs and appendicularians. This was especiallynoticeable for sandeel in the size intervals 25–30 and 30–35 mm. In terms of biomass, however, they comprisedless than 13% of the total gut content.
Prey environment
The small plankton (<200 lm) were dominated bycopepod eggs or eggsacks and bivalvia larvae whilelarger-sized plankton were mainly nauplii and copepo-dite stages of copepods (Fig. 4). The most abundantcopepods were Pseudocalanus sp. nauplii in May andOithona sp. copepodites in June and July. They were
Fig. 2 Length distribution (standard length, corrected for shrinkage) for Greenland halibut (R. hippoglossoides) and sandeel (Ammodytessp.) larvae on the surveys in May 12–21 2000, June 21–30 1999 and July 11–23 2000. Mean size for halibut: May 17.6 mm; June 23.5 mm;July 31 mm. Sandeel: May 9.0 mm; June 17.3 mm; July 25.5 mm
940

especially abundant in the length intervals from 200 to634 lm. Calanus sp. copepodites were also observed inhigh numbers, especially in June and July. Calanus sp.were most abundant in intervals from 800 lm. In termsof weight, Pseudocalanus sp. made up 25% of the totalcopepod biomass in May, while in June and July Cal-anus sp. constituted more than 50% of the total biomass.
Vertical distribution
In May, the vertical distribution of plankton was similarat the three stations examined (ANOVA, P>0.3). Formost groups, the density was highest in the 0–100 mdepth interval and gradually decreased with depth(Fig. 5). Except for Oithona sp. copepodites andeuphausiid eggs, most of their respective biomass wasdistributed here. Oithona sp. copepodites and euphausideggs were mainly found in the 100–200 m depth interval.In the deeper 200–400 and 400–800 m intervals, abun-dance and biomass was low for all groups. There was nosignificant difference in size distribution within theplankton groups at the different vertical depth strata(ANOVA, P>0.3) or for all plankton groups together(ANOVA, P=0.68).
In July, depth-stratified sampling at three stations onthe shelf (Fig. 1) showed similar vertical distributionpatterns (ANOVA, P>0.12). The highest density wasfound in the depth intervals 0–13 and 13–25 m fornauplii and copepodites from the groups Oithona sp.and ‘‘other copepoda species’’, while Calanus sp. andPseudocalanus sp. were mainly in the 25–40 and 40–100 m depth intervals (Fig. 6). Eggs from both eup-hausiids and copepods had the highest occurrence in the25–40 m interval, but their distribution pattern differed.
While euphausiid eggs also were distributed in relativelyhigh numbers in the shallower 13–25 m interval, thedistribution pattern of copepod eggs included the deeper40–100 m interval. The size distribution within the dif-ferent plankton groups did not change significantly withdepth (ANOVA, P>0.19) or for all plankton groupstogether (ANOVA, P=0.18) even though there was atendency to an increase in biomass for the larger sizeintervals at the deeper depth strata (Fig. 6).
Prey size
The log-scaled size of the main prey items (cf. Table 1)found in sandeel guts generally increased significantlywith larval length (GLM, P<0.05) (Fig. 7a–d) except inthe cases of gastropod larvae (GLM, P=0.64) and ap-pendicularians (GLM, P=0.41). In contrast, only a veryslight increase in width and length of prey items wasobserved with increasing size of Gr. halibut larvae. Onlyfor eggs (GLM, P=0.05) and copepod width (GLM,P=0.02) (Fig. 7a) did prey size increase significantly.Comparisons of prey size within prey item groups indi-cate that Gr. halibut and sandeel fed on the same size ofappendicularians (ANCOVA P=0.70) and bivalvia(ANCOVA, P=0.13) but on different sizes of eggs andcopepods (ANCOVA, P<0.0001). In sandeel, eateneggs were generally smaller compared to those found inGr. halibut (Fig. 7b). Smaller Gr. halibut larvae(<20 mm) generally ate larger copepods than sandeel ofsimilar length, while the pattern was reversed for largerlarvae (Fig. 7a).
Prey size preference
Prey size preferences in Gr. halibut and sandeel weresignificantly different (ANCOVA, P=0.003) (Fig. 8).The relative size of preferred prey (RSPP) declined sig-nificantly for Gr. halibut by a rate of �4.49·104 SL(GLM, P<0.001) while RSPP was constant for sandeelat approximately 2.7% of larval length (GLM, P=0.43).The prey size niche breadth was constant for both Gr.halibut and sandeel throughout larval ontogeny (GLM,P>0.20) but significantly different among them (AN-COVA, P<0.001). The Gr. halibut preferred preywithin a narrower size range (prey size niche breadth0.10) than sandeel (prey size niche breadth 0.13).
The prey size preference in the three periods studiedshowed that inMay, Gr. halibut preferred almost twice aslarge a prey as sandeel (highest preference for 420 versus240 lm) (Fig. 9). In June, Gr. halibut and sandeel pre-ferred almost identical sizes of prey (highest preferencefor, respectively, 498 and 462 lm). Their preferred sizeranges were between 200 and 700 lm, which in terms ofcopepodites were the most abundant size classes (Fig. 9).In July, Gr. halibut larvae preferred almost the same preysize as in June (highest preference for 554 lm), whilesandeel had increased its preference towards larger prey
Fig. 3 Relative gape size in percent of larvae length for halibut(R. hippoglossoides) and sandeel (Ammodytes sp.). Linear regres-sion: sandeel f(x)=0.18x+0.61; halibut f(x)=0.17x+1.73
941

sizes (highest preference for 682 lm) (Fig. 9). The sizepreference for Gr. halibut was thus on or close to sizeintervals with highest copepod abundance while that forsandeels was on size intervals larger in terms of biomass.A consequence of the different prey size preference forGr.halibut and sandeel was that the available copepod preybiomass differed inMay and July. InMay, Gr. halibut onaverage had access to a three-fold larger prey biomassthan sandeel (163 mg C m�2 for Gr. halibut versus50 mg C m�2 for sandeel) while in July, the available preybiomass for sandeel was about 1.5 times larger than forGr. halibut (43 mg C m�2 for sandeel, 30 mg C m�2 forGr. halibut).
The vertical distribution of available prey biomass inMay showed that almost all prey biomass for both Gr.halibut (81%) and sandeel (87%) was located in the 0–
100 m depth interval with only little biomass at greaterdepth intervals (Fig. 10a). In July, prey densities werehighest for Gr. halibut in depth intervals 13–25 m (41%)and 25–40 m (39%), while for sandeel, prey density washighest at the 25–40 m interval (41%) (Fig. 10b).
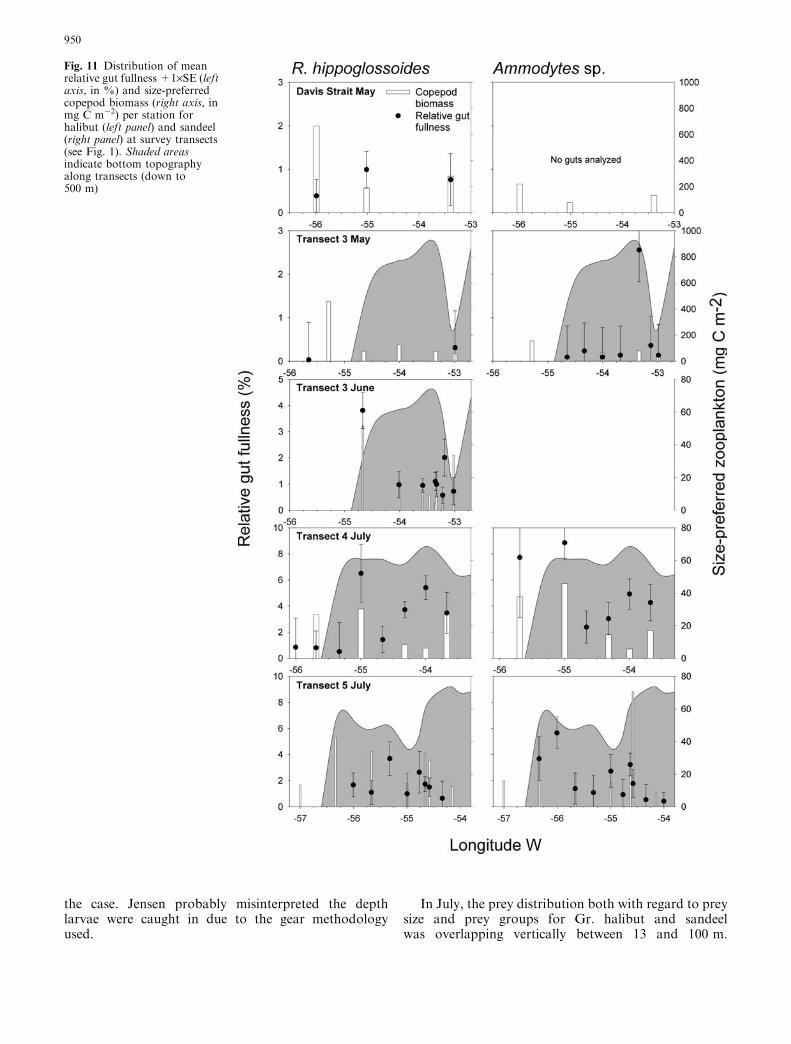
The variation in available copepod biomass and therelative larval gut fullness across transects was large(Fig. 11). In May, the available prey biomass for Gr.halibut was higher at the stations offshore in Davis Straitand West of the bank than at other stations. Relative gutfullness was also generally higher on the offshore stationsin Davis Strait. The difference in available copepod bio-mass for sandeel was less marked but gut fullness peakedon the shallow part of the bank. In June, the largestprey biomass for Gr. halibut was in the shelf break area,which coincided with highest relative gut fullness. On the
Table 1 Individual average stomach/gut content per 5 mm length interval in number and estimated corresponding weight in lg carbon
Period Species Length (mm) Obs (N) Copepoda Bivalvia Gastropoda Eggs Appendicularia Other Total
May 2000 Sandeel 5 19 N 1.7 – – 0.2 – 0.1 2lg C 1.27 – – 0.01 – 0.0 1
10 58 N 2.0 – – 0.4 – – 2lg C 0.31 – – 0.01 – – 0
20 1 N – – – 3.0 – – 3lg C – – – 0.07 – – 0
Halibut 10 4 N 23.0 – – – – 23lg C 47.32 – – – – 47
15 20 N 1.5 – – 0.2 – – 2lg C 1.98 – – 0.06 – – 2
June 1999 Halibut 15 1 N 9.0 – – – – – 9lg C 15.03 – – – – – 15
20 20 N 7.6 0.1 – – – – 8lg C 28.22 0.02 – – – – 28
25 19 N 13.9 – – – – 0.1 14lg C 21.47 – – – – 0.38 22
40 1 N 13.0 – – – – – 13lg C 251.06 – – – – – 251
July 2000 Sandeel 10 1 N 2.0 1.0 – 3.0 4.0 – 10lg C 0.53 0.08 – 0.09 0.19 – 1
15 18 N 1.6 0.7 0.1 3.4 0.4 0.8 7lg C 1.00 0.09 0.01 0.26 0.02 0.07 1
20 38 N 3.7 2.0 0.6 3.5 2.0 0.3 12lg C 29.33 0.25 0.07 0.28 0.17 0.10 30
25 80 N 9.9 7.2 1.2 37.7 7.2 0.8 64lg C 29.90 0.89 0.11 2.06 0.46 0.80 34
30 123 N 15.3 9.3 1.2 35.7 6.1 1.0 69lg C 106.09 1.29 0.11 7.57 0.38 1.61 117
35 9 N 41.2 20.3 0.8 1.3 3.0 0.1 67lg C 278.68 3.25 0.11 0.11 0.20 0.06 282
40 1 N 38.0 – – 1.0 – 4.0 43lg C 162.56 – – 0.04 – 1.69 164
Halibut 20 1 N 3.0 – – – – – 3lg C 0.03 – – – – – 0
25 79 N 34.2 – – 0.6 – 0.3 35lg C 62.19 – – 0.33 – 0.02 63
30 55 N 41.3 0.5 – 4.1 0.3 0.7 47lg C 61.99 0.06 – 13.62 0.01 0.08 76
35 2 N 39.0 – – 51.5 – 0.5 91lg C 46.71 – – 188.31 – 0.66 236
The category Copepoda includes nauplii and copepodite stages, Bivalvia and Gastropoda include larval stages only, Eggs includes copepodand euphausiid eggs. Appendicularia includes various pelagic tunicates, Other includes annelids, egg sacs, different malacostraca larvae,different species in the Ostracoda group, phytoplankton (mostly diatoms) and protozoa. All constituting less than 1% in either number orweight of the average stomach content are excluded
942

shallower part of the banks, the available biomass wasless than half the amount available at the shelf break. InJuly, the general tendency was higher copepod biomassfor both Gr. halibut and sandeel at the shelf break area orat neighbouring stations which also were the areas where
highest relative gut fullness for both species was found.However, the pattern was not unambiguous. Eventhough high gut fullness only was observed at stationswith high prey availability, there were cases of low gutfullness in areas of high prey availability.
Fig. 4 Mean abundance (upper panel, individuals m�2·103) anddensity (lower panel, mg C m�2) of zooplankton in 0.1 log10 spacedintervals (lm) in May, June and July surveys. Midpoints ofintervals were 50, 63, 79, 100, 126, 159, 200, 252, 317, 400, 503, 634,799, 1,007, 1,268, 1,598, 2,013, 2,536, 3,194, 4,024, 5,070, and
6,387 lm. Copepod species in the category ‘‘COPEPODA otherspecies’’ were of the genera Acartia, Bradyidius, Candacia,Centropages, Coryceus, Cyclopoida, Euchaeta, Harpacticoida, Met-ridia, Microcalanus, Microsetella, Monacilla, Oncaea, Paraeuchae-ta, Scolecithricella Spinocalanus and Temora
943

Fig. 5 Vertical distribution of zooplankton in mean abundance (upper panel, individuals m�3) and density (lower panel, mg C m�3) in theMay survey (for location of stations see Fig. 1) in log10 spaced intervals (lm). Midpoints of intervals, zooplankton categories and legendsare as in Fig. 4. Depth intervals are indicated on each plot
944
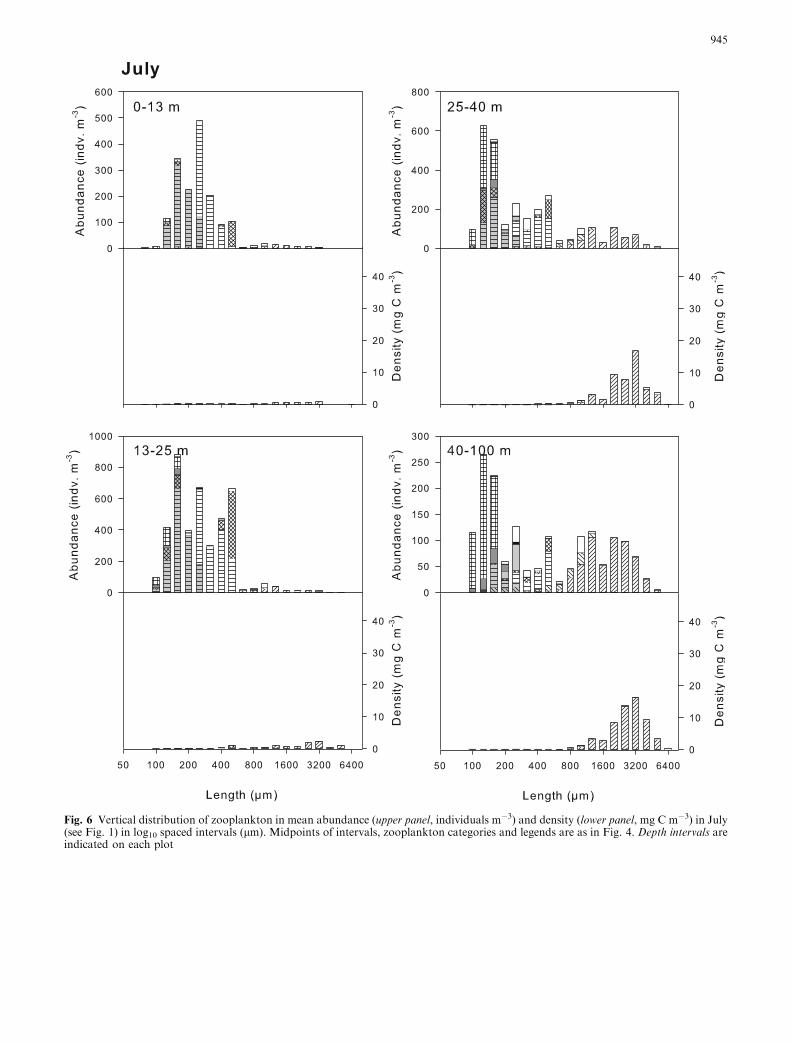
Fig. 6 Vertical distribution of zooplankton in mean abundance (upper panel, individuals m�3) and density (lower panel, mg C m�3) in July(see Fig. 1) in log10 spaced intervals (lm). Midpoints of intervals, zooplankton categories and legends are as in Fig. 4. Depth intervals areindicated on each plot
945

a
b
c
d
Fig. 7 Size (lm, axis log10scaled) of the main prey itemslisted in Table 1 (except thegroups Appendicularia andother) versus sandeel(Ammodytes sp.) and halibut(R. hippoglossoides) standardlength (mm). a Copepoda(nauplii and copepodite stages),sandeel (ANOVA, P<0.0001),halibut (P=0.09). b Eggs,sandeel P<0.0001, halibutP=0.05 c Bivalvia larvae,sandeel P=0.04, halibutP=0.62. d Gastropod larvae,sandeel P=0.62, halibut noobservations
946

Discussion and conclusion
General feeding ecology
The study shows marked differences in the feedingecology of Gr. halibut and sandeel larvae in the sea offWest Greenland. While sandeel increased its preferredprey size during ontogeny, Gr. halibut had an almostconstant prey size preference throughout the investi-gated size range. Consequently, the RSPP was constantfor sandeel while declining for Gr. halibut. The RSPP of2.7% for sandeel was identical to estimates on sandeel(Ammodytes hexapterus) from the study by Pearre (1986;Fig. 2). Often the preferred prey size for fish larvae iswithin the range of 2–8% of larval length (Pearre 1986;Munk 1997; Østergaard et al. 2005). The steady RSPPhave been suggested to reflect that predator and preyimprove their attack and escape abilities with the samerate through ontogeny (Folkvord and Hunter 1986;Munk 1992). One hypothesis to explain the difference insize preference could thus be a hunting capabilitieshypothesis; Gr. halibut do not improve their huntingcapabilities at a rate that allows them to keep up theprey’s avoidance skills. We will return to this andalternative hypotheses later in the discussion.
Larval diet
Greenland halibut and sandeel differ not only in pre-ferred prey size, but also in preferred prey type. Forlarge sandeels, eggs, bivalvia and gastropod larvae weremore important in the diet than for Gr. halibut. Hence,
sandeel appear as more opportunistic predators than Gr.halibut. However, it should be noted that nauplii andcopepodites still constituted between 88 and 99% of thegut content biomass for all sizes of both sandeel and Gr.halibut. The prevalence of copepods in the diet of thesandeel diet is in agreement with earlier reports on theirfeeding. For example, data from Monteleone and Pet-erson (1986) show that >97% of the food items insandeel (A. americanus, 8–24 mm) were nauplii or co-pepodites. The diet of Gr. halibut larvae have only beendescribed in a study from the eastern Norwegian andBarents Seas (Haug et al. 1989). In this study, calanoidcopepods were the main prey.
Based on the size of the prey items and the size andabundance of sympatric plankton, it was likely that therelatively small eggs (>200 lm) in sandeel stomachs werecopepod eggs while the larger eggs found in Gr. halibutwere euphausiid eggs. As for the copepod prey items, itwas likely that for sandeel it was nauplii of Pseuodcalanussp. in May and the early copepodite stages of Calanus sp.in July. Copepods of the genus Pseuodcalanus were re-ported to be preferred by sandeel (A. tobianus) at a lengthof about 24 mmwhile larger larvae preferred copepoditesof the genera Temora and Calanus (O’Connell and Fives1995). The size composition in the diet of Gr. halibutindicated that the prey were nauplii of Pseuodcalanus sp.andCalanus sp. inMay and copepodites ofOithona sp. inJune and July. Many other fish larvae (cod, haddock,herring, walleye, pollock and redfish) seem to avoidOithona copepods (Cohen and Lough 1983; Kane 1984;Anderson 1994; Napp et al. 2000). Apparently, fish larvaehave problems catching Oithona copepods due to theirhigh evasion speed and, if captured, their large and
Fig. 8 Copepod size (lm, axis log10 scaled) preference versus length (mm) of halibut (R. hippoglossoides) and sandeel (Ammodytes sp.).Regression lines including 95% confidence limits are shown for each species (halibut P=0.0007, r2=0.15; sandeel P=<0.0001, r2=0.37)
947

extended antenna makes them difficult to handle (Kane1984). If Gr. halibut has a species preference forOithona,then the earlier mentioned hunting capabilities hypothe-sis has to be rejected. An alternative hypothesis we putforward is the reduction in prey niche overlap hypothesis;in an environment where other abundant sympatric fishlarvae exploit gradually increasing prey sizes duringontogeny, it can be advantageous for Gr. halibut tocontinue to exploit a constant prey size thereby reducingthe prey niche overlap and thus competition for food.Evidence for such a hypothesis has been found in otherstudies (Kane 1984; Pepin and Penney 2000). For exam-ple, Kane (1984) found that for co-existing cod (Gadusmorhua) and haddock (Melanogrammus aeglefinus) lar-vae, haddock larvae during certain periods utilized a
different prey size than cod in order to minimize inter-specific food competition. It could be the same mecha-nism observed in the present study for Gr. halibut andsandeel in July. The preference for sandeel in July was, asmentioned earlier, probably the genus Calanus. Calanussp. is one of the key food items for fish larvae in general(Skjoldal et al. 1992; Anderson 1994; Sundby 2000) andthe cumulated predation pressure on this genus couldthus be high. The size preference by Gr. halibut couldtherefore be an avoidance of niche overlap thereby less-ening interspecific food competition. A prerequisite forthe reduction in prey niche overlap hypothesis to be validis that a competition among predators for the same preysizes has taken place. Before this is studied, the hypothesiscan neither be confirmed nor rejected.
Fig. 9 Total available copepodite and nauplii stages of copepods innumbers (upper panel, individuals m�2·103), biomass (middle panel,mg C m�2) and larval prey size preference (lower panel, prey size
preference in percent) for mean size halibut and sandeel larvae (seeFig. 2) in May, June and July surveys. The maximum preferred sizeindicated next to size preference curves
948

Vertical distribution
Sampling resolution was very coarse in May but gen-erally food for Gr. halibut and sandeel was distributedonly in the upper 100 m of the water column. As thelarvae were active-feeding, they were expected to bedistributed together with their food resources. This wasconfirmed for Gr. halibut from data on vertical distri-bution in the May cruise presented by Simonsen(unpublished data). Vertical distribution of Gr. halibutwas also studied by Jensen (1935). Jensen stated that10–18 mm long Gr. halibut larvae were distributed
between 600 and 1,000 m depth. He furthermorereported that many of the larvae still had yolk sacattached which was interpreted as that they were notactive-feeding. This is not in agreement with thepresent study were prey was found in the gut oflarvae as small as 12.5 mm and most larvae between 12and 16 mm were feeding. Remains of the yolk sac wereobserved in some larvae, but all larvae had apparentlyfunctional mouth and digestive apparatus. In the studyby Jensen (1935), the Gr. halibut could have beenin an earlier ontogenetic stage than in the presentstudy, but judged from larval length this was not
a
b
Fig. 10 The relative verticaldistribution of available preybiomass in May (a) and July(b) surveys for halibut(R. hippoglossoides) and sandeel(Ammodytes sp.)
949
the case. Jensen probably misinterpreted the depthlarvae were caught in due to the gear methodologyused.
In July, the prey distribution both with regard to preysize and prey groups for Gr. halibut and sandeelwas overlapping vertically between 13 and 100 m.
Fig. 11 Distribution of meanrelative gut fullness +1·SE (leftaxis, in %) and size-preferredcopepod biomass (right axis, inmg C m�2) per station forhalibut (left panel) and sandeel(right panel) at survey transects(see Fig. 1). Shaded areasindicate bottom topographyalong transects (down to500 m)
950

A difference in the vertical distribution of Gr. halibutand sandeel would therefore not result in exposure todifferent prey size niches. This could be a thirdhypothesis to explain the different size preference amongthe two species in July. However, even though Gr. hal-ibut and sandeel prey were vertically overlapping, therewas a tendency for both the Gr. halibut prey (availablecopepod biomass and euphausiid eggs which were foundonly in Gr. halibut stomachs) to be partly displaced tothe upper water column compared that of sandeel prey(available copepod biomass and copepod eggs whichwere mainly found in sandeel stomachs). This couldindicate a shallower distribution for Gr. halibut com-pared to sandeel, but further studies using a highervertical resolution of both prey and fish larvae are nee-ded to firmly establish this. Studies on vertical distri-bution of Gr. halibut and sandeel larvae from the Julycruise showed large variation in Gr. halibut and sandeellarval abundance within the specific depth strata, and nosignificant difference in vertical distribution pattern wasfound Simonsen (unpublished data).
Transect distribution
Specific sections of the cross-shelf transects showed en-hanced prey abundance to Gr. halibut and sandeel inparallel with increase in gut content of the larvae.Apparently, the offshore area west of the bank was animportant feeding area for Gr. halibut in May. Forsandeel, the important feeding area was the central partof the bank. In June and July, the feeding area for bothGr. halibut and sandeel had apparently shifted to theshelf break area. Prey abundance and gut content weregenerally higher here compared to other areas due to anincreased biological production and/or an aggregationof the plankton. It is likely that production was en-hanced since the phytoplankton community in June wasin a post-bloom situation with general nutrient depletionin the upper water column (Poulsen and Reuss 2002). Arecent study from West Greenland showed that the shelfbreak area was characterized by frequent upwellingevents (Pedersen et al. 2005). Upwelling would providesuch a mechanism for nutrient transport that would leadto increased biological production. Also, accumulationof plankton might take place while retention of particlesin this area has been evidenced by drift simulations anddeployment of drift buoys (Pedersen et al. 2005). Thesefindings of higher abundance of zooplankton prey onthe shelf break area agreed with studies on cross-shelfbiological variability from other marine ecosystemswhere abundances of plankton to fish larvae generallywere higher at the break (e.g. Richardson 1985; Loch-mann et al. 1997; Munk et al. 2004). Highest mean gutcontent of the larvae was in all cases but one observedon stations with high prey availability. This indicatesthat prey abundance at other stations were sub-optimal.The observed cross-shelf variability in prey thereforeprobably lead to differentiated survival chances for Gr.
halibut and sandeel. In May, the feeding conditions weremost favourable for Gr. halibut in the offshore area.This coincided with the area where newly hatched larvaeemerge in April–May (Jensen 1935; Smidt 1969). In Juneand July, the most favourable area for both Gr. halibutand sandeel was the slopes of the banks and at the shelfbreak area. These were the same areas where Munk et al.(2003) and Simonsen (unpublished data) found higherlarval abundance.
In conclusion, the relative prey size declined duringGr. halibut larval growth, while it remained constant forsandeel. Of the three hypotheses suggested to explainthis difference, ‘‘the hunting capabilities hypothesis’’ wasrejected while ‘‘the reduction in prey niche overlaphypothesis’’ and ‘‘the vertical distribution hypothesis’’both needed further studies to be confirmed or rejected.Irrespective of the background, different prey size pref-erence for Gr. halibut and sandeels resulted in differen-tiation in the available copepod prey biomass both inabsolute terms and in spatial availability. In May, Gr.halibut prey density was highest in the off-shelf area inDavis Strait. In June and July, the prey-rich areas forboth species were mainly located at the slopes of thebanks and at the shelf break area. In these areas, gutfullness was higher than in neighbouring areas, sug-gesting that the larval food resource may be scarce inother areas.
The different prey size niches of Gr. halibut andsandeels in May and July make it plausible that theirdiet in these months were based on different copepodspecies. Unless their prey size niches were a result ofinterspecific competition for prey, their feeding founda-tion thus depends on population dynamics of differentcopepod species. Absence or low occurrence of theserespective copepod species in the plankton environmentcould therefore reduce the feeding foundation and havesevere complication for the recruitment success of Gr.halibut or sandeel. This mutual independence could ex-plain why abundance indices of Gr. halibut and sandeellarvae in West Greenland waters historically have shownopposite responses to yearly environmental conditionsand total zooplankton occurrence.
Acknowledgements Thanks to the crew of RV ‘‘Adolf Jensen’’ forthree successful cruises, to DIFRES, Dept. of Marine Ecology andAquaculture for providing an office and excellent working atmo-sphere for CSS during this study. Also, thanks to Dr. B. Bergstromand two anonymous reviewers who gave valuable comments andsuggestions on an earlier version of the paper. The work wasfinancially supported by the Greenland Research Council (KIIIP,J. nr 05.19.00/03 to CSS) and the Danish National ResearchCouncil (project no. 9803018 to SAP).
References
Anderson JT (1994) Feeding ecology and condition of larval andpelagic juvenile redfish Sebastes spp. Mar Ecol Prog Ser104:211–226
Chesson J (1978) Measuring preference in selective predation.Ecology 59:211–215
951

Cohen RE, Lough RG (1983) Prey field of larval herring Clupeaharengus on a continental shelf spawning area. Mar Ecol ProgSer 10:211–222
Fey DP (1999) Effects of preservation technique on the length oflarval fish: methods of correcting estimates and their implica-tion for studying growth rates. Arch Fish Mar Res 47:17–29
Folkvord A, Hunter JR (1986) Size-specific vulnerability ofnorthern anchovy, Engraulis mordax, larvae to predation byfishes. Fish Bull 84:859–869
Hart PJB, Gill AB (1993) Choosing prey size: a comparison ofstatic and dynamic foraging models for predicting prey choiceby fish. Mar Behav Physiol 23:91–104
Haug T, Bjoerke H, Falk-Petersen I-B (1989) The distribution, sizecomposition, and feeding of larval Greenland halibut (Rein-hardtius hippoglossoides Walbaum) in the eastern Norwegianand Barents seas. Rapp P -v Reun Cons Int Explor Mer191:226–232
Hjorleifsson E, Klein-MacPhee G (1992) Estimation of live stan-dard length of winter flounder Pleuronectes americanus larvaefrom formalin-preserved, ethanol-preserved and frozen speci-mens. Mar Ecol Prog Ser 82:13–19
Jensen AS (1935) The Greenland halibut (Reinhardtius hippo-glossoides, its development and migrations. D Kgl Danske Vi-densk Selsk Skrifter, Nat Mater VI:35
Kane J (1984) The feeding habits of co-occurring cod and haddocklarvae from Georges Bank. Mar Ecol Prog Ser 16:9–20
Kiørboe T, Munk P, Richardson K (1987) Respiration and growthof larval herring Clupea harengus: Relation between specific dy-namic action and growth efficiency. Mar Ecol Prog Ser 40:1–10
Lochmann SE, Taggart CT, Griffin DA, Thompson KR, MailletGL (1997) Abundance and condition of larval cod (Gadusmorhua) at a convergent front on Western Bank, Scotian Shelf.Can J Fish Aquat Sci 54:1461–1479
McGurk MD, Warburton HD, Galbraith M, Kusser WC (1992)RNA-DNA ratio of herring and sand lance larvae from PortMoller, Alaska: Comparison with prey concentration andtemperature. Fish Oceanogr 1:193–207
Møller EF, Nielsen TG (2000) Plankton community structure andcarbon cycling off the western coast of Greenland, withemphasis on sources of DOM for the bacterial community. MarEcol Prog Ser 22:13–25
Monteleone DM, Peterson WT (1986) Feeding ecology of Ameri-can sand lance Ammodytes americanus larvae from Long IslandSound. Mar Ecol Prog Ser 30:133–143
Munk P (1992) Foraging behavior and prey size spectra of larvalherring Clupea harengus. Mar Ecol Prog Ser 80:149–158
Munk P (1997) Prey size spectra and prey availability of larval andsmall juvenile cod. J Fish Biol 51:340–351
Munk P, Bjørnsen PK, Boonruang P, Fryd M, Hansen PJ, Jane-karn, Vudhichai, Limtrakulvong V, Nielsen TG, Hansen OS,Satapoomin S, Sawangarreruks S, Thomsen HA, Østergaard JB(2004) Assemblages of fish larvae and mesozooplankton across
the continental shelf and shelf slope of the Andaman Sea (NEIndian Ocean). Mar Ecol Prog Ser 274:87–97
Munk P, Hansen BW, Nielsen TG, Thomsen HA (2003) Changesin plankton and fish larvae communities across hydrographicfronts off West Greenland. J Plankton Res 25:815–830
Napp JM, Kendall AW, Schumacher JD (2000) A synthesis ofbiological and physical processes affecting the feeding envi-ronment of larval walleye pollock (Theragra chalcogramma) inthe eastern Bering Sea. Fish Oceanogr 9:147–162
O’Connell M, Fives JM (1995) The biology of the lesser Sand-eelAmmodytes tobianus in the Galway Bay area. Biol Environ95:87–98
Østergaard P, Munk P, Janekarn V (2005) Contrasting feedingpatterns among species of fish larvae from the tropical And-aman Sea. Mar Biol 146:595–606
Pearre S (1986) Ratio-based trophic niche breadths of fish, theSheldon spectrum, and size-efficiency hypothesis. Mar EcolProg Ser 27:299–314
Pedersen SA, Ribergaard MH, Simonsen CS (2005) Micro- andmesozooplankton in Southwest Greenland waters in relation toenvironmental factors. J Mar Syst 56:85–112
Pedersen SA, Rice JC (2002) Dynamics of fish larvae, zooplanktonand hydrographical characteristics in the West Greenland largemarine ecosystem 1950–1984. In: Sherman KS, Skjoldal HR(eds) Large marine ecosystems of the North Atlantic changingstate and sustainability, Chap 5. Elsevier Science, pp151–193
Pedersen SA, Simonsen CS, Storm L (2002) Northern shrimp(Pandalus borealis) recruitment in West Greenland waters. Part1. Distribution of Panadlus shrimp larvae i relation tohydrography and plankton. J Northwest Atl Sci 30:1–28
Pepin P, Penney R (2000) Feeding by a larval fish community:impact on zooplankton. Mar Ecol Prog Ser 204:199–212
Pillar SC (1984) A comparison of the performance of four zoo-plankton samplers. S Afr J Mar Sci 2:1–18
Poulsen LK, Reuss N (2002) The plankton community on Suk-kertop and Fylla Banks off West Greenland during a springbloom and post-bloom period: hydrography, phytoplankton,and protozooplankton. Ophelia 56:69–85
Richardson K (1985) Plankton distribution and activity in theNorth Sea/Skagerrak-Kattegat frontal area in April 1984. MarEcol Prog Ser 26:233–244
Shirota A (1970) Studies on the mouth size of fish larvae. Bull JpnSoc Sci Fish 36:353–368
Skjoldal HR, Gjoesaeter H, Loeng H (1992) The Barents Seaecosystem in the 1980s: ocean climate, plankton, and capelingrowth. ICES Mar Sci Symp 195:278–290
Smidt ELB (1969) The Greenland halibut, Reinhardtius hippo-glossoides, biology and exploitation in Greenland waters.Meddr Danm Fisk Havunders 6:79–148
Sundby S (2000) Recruitment of Atlantic cod stocks in relation totemperature and advection of copepod populations. Sarsia85:277–298
952