feed-in tariff (fit): annual report 2011-12 - ofgem
TRANSCRIPT

The Office of Gas and Electricity Markets www.ofgem.gov.uk
Promoting choice and value
for all gas and electricity customers
Feed-in Tariff (FIT): Annual Report 2011-12
Annual Report to the Secretary of State for Energy and Climate Change
Reference: 175/12 Contact: FIT Compliance
Publication date: 19 December 2012 Team: Environmental Programmes
Email: [email protected]
Overview: On 1 April 2010 the Government introduced the Feed-in Tariffs (FITs) scheme. The scheme is
intended to encourage the uptake of small scale renewable and low-carbon technologies up to a
Total Installed Capacity of 5MW located in Great Britain. The scheme creates an obligation for
certain Licensed Electricity Suppliers to make tariff payments to eligible installations for the
generation and export of renewable and low carbon electricity.
This report provides information in respect of the second year of the scheme (1 April 2011 to 31
March 2012). It includes information relating to how Licensed Electricity Suppliers have complied
with their obligations in this period, and provides detailed information regarding FIT payments that
have been made to generators. In addition, the report references and provides comparisons
against the first year of the scheme‟s operation (1 April 2010 to 31 March 2011).
Over the period 1 April 2011 to 31 March 2012 a total of 217,741 installations were registered
under the scheme, in total generating almost 500GWh of electricity. This compares to 30,210
installations registered under the scheme during the perioid 1 April 2010 to 31 March 2011
generating a total of 68.6GWh of electricity.
A total of almost £136 million generation payments and a little over £3 million of deemed export
payments were made to eligible generators by FIT Licensees during the period 1 April 2011 to 1
April 2012, with the amount levelised during the period totalling nearly £151 million.
Feed-in Tariff (FIT): Annual Report 2011-12
2
Context
The Secretary of State for Energy and Climate Change exercised enabling powers contained in the
Energy Act 2008 to introduce a Feed-in Tariff scheme in Great Britain. The Feed-in Tariffs
(Specified Maximum Capacity and Functions) Order 2010 and modifications to Conditions 33 and
34 of the Standard Conditions of Electricity Supply Licences became effective from 1 April 2010.
On 1 December 2012 this Order was revoked and replaced by the Feed-in Tariff Order 2012 which
consolidated existing and incorporated further amendments to the administration of the scheme
following reviews.
Under a duty specified in the Feed-in Tariffs (Specified Maximum Capacity and Functions) Order
2012 Ofgem is required to present to the Secretary of State for Energy and Climate Change an
annual report covering the preceding FIT year.
The report is intended to provide the Secretary of State with information relating to Licensed
Electricity Suppliers compliance with obligations placed upon them under Standard Licence
Conditions 33 and 34, as well as provide headline and detailed data regarding FIT scheme costs
and other information over the annual report period.
The Order requires that the report be presented to the Secretary of State no later than 31st
December after the end of each FIT year.
Associated documents
Modifications to Conditions 33 and 34 of the Standard Conditions of Electricity Supply Licences:
http://www.decc.gov.uk/assets/decc/what%20we%20do/uk%20energy%20supply/energy%20mix
/renewable%20energy/policy/fits/1_20100331172153_e_@@_fitlicencemodification.pdf
The Feed-in Tariffs (Specified Maximum Capacity and Functions) Order 2012:
http://www.decc.gov.uk/assets/decc/what%20we%20do/uk%20energy%20supply/energy%20mix
/renewable%20energy/policy/fits/1_20100331172153_e_@@_fitlicencemodification.pdf
Feed-in Tariff Scheme: Guidance for Electricity Suppliers Version 5 (draft published 30 November
2012):
http://www.ofgem.gov.uk/Pages/MoreInformation.aspx?docid=23&refer=Sustainability/Environme
nt/fits/Info
Central FIT Register User Guide December 2012:
http://www.ofgem.gov.uk/Pages/MoreInformation.aspx?docid=40&refer=Sustainability/Environme
nt/fits

Feed-in Tariff (FIT): Annual Report 2011-12
3
Contents
Executive Summary 4 Generators accredited under the FIT scheme 4 Licensed Electricity Supplier Compliance 5
1. Compliance of Licensed Electricity Suppliers 6 Mandatory FIT Licensees 7 Voluntary FIT Licensees 8 Non-FIT Licensees 9 Compliance with Conditions 33 and 34 of the Standard Conditions of Electricity
Supply Licences 11 Periodic and Annual Levelisation 11 Late submission of either Periodic or Annual Levelisation data to Ofgem for the
period 1 April 2011 - 31 March 2012 11 Supplier audits 12
2. Accredited FIT Installations 13 Eligible technologies 13 Number of accredited installations 13 Total Installed Capacity 15 Yearly update overview 15 Great Britain regional overview 16 Total installations and Total Installed Capacity by installation type 20 Electricity generated and exported 21 Migration from the Renewables Obligation 22
3. Feed-in Tariff Scheme Cost 23 Ofgem levelisation process 1 April 2011 to 31 March 2012 23 FIT scheme cost yearly comparison 24 Total payments by FIT Licensee 25
4. Comprehensive Review of the FIT Scheme 27 FIT Scheme Changes Announced During 1 April 2011 - 31 March 2012 27 Fast Track Review 27 Comprehensive Review Phase 1 27 FIT Scheme Changes announced after 1 April 2012 28 Comprehensive Review Phase 2A 28 Revisions to Ofgem‟s “Guidance for Licensed Electricity Suppliers” 29
5. Appendices Index 30
Appendix 1: Non-Compliant Licensed Electricity Suppliers 31
Appendix 2: Quarterly Payments to FIT Generators by FIT Licensees 34
Appendix 3: FIT Registered Installations by GB Region 38
Appendix 4: FIT Tariff Tables 41
Appendix 5: Glossary 44
Appendix 6: Feedback Questionnaire 48

Feed-in Tariff (FIT): Annual Report 2011-12
4
Executive Summary
This document provides a summary of activity within the Feed-in Tariff (FIT) scheme during the
second year of operation (1 April 2011 to 31 March 2012) and reviews the deployment of FIT
eligible renewable technologies since commencement of the scheme on 1 April 2010. This report
fulfils the Authority‟s annual reporting duty to the Secretary of State for Energy and Climate
Change as specified under Part 7 (Administrative functions of the Authority) article 33 of the Feed-in Tariffs (Specified Maximum Capacity and Functions) Order 2012.
Generators accredited under the FIT scheme
As at 31 March 2012 a total of 247,951 renewable installations were accredited under the FIT
scheme. This figure consists of 217,741 installations registered during the second year of the
scheme from 1 April 2011 to 31 March 2012 and 30,2101 installations registered during the first
year of the scheme from 1 April 2010 to 31 March 2011.
Figure E1 provides a breakdown of the number of installations registered by month, with a cross
comparison between FIT years. This illustrates the substantial increase in the number of
installations registered during the second year of the scheme‟s operation.
Figure E1: Accredited installations registered by month and year
The Total Installed Capacity of all installations accredited under the scheme at 31 March 2012 was
just under 1.1GW. This figure is inclusive of 982.4MW of Total Installed Capacity installed during 1
April 2011 to 31 March 2012 and 108.4MW Total Installed Capacity accredited during the first year
of the scheme from 1 April 2010 to 31 March 2011. Of the total number of installations and Total
1 This figure is represents an adjustment from 30,201 installations referenced in the Feed-in Tariff (FIT) Annual Report
2010-11 as some installations were delayed in receiving a Confirmation Date.
0
5
10
15
20
25
30
35
40
Num
ber
of In
sta
llations (
thousands)
1 April 2010 - 31 March 2011 1 April 2011 - 31 March 2012

Feed-in Tariff (FIT): Annual Report 2011-12
5
Installed Capacity as at 31 March 2012 the most prevalent accredited technology was solar
photovoltaic (PV). Of all accredited installations 244,844, or a little under 99 percent, were solar
PV, with just over 90 percent of Total Installed Capacity, or just under 1GW, provided by solar PV
installations.
From 1 April 2011 to 31 March 2012 a total of 498.2GWh of electricity was generated and
104.4GWh was exported by accredited FIT installations. This compares to a total of 68.6GWh of
electricity generated and 14.9GWh exported by accredited FIT installations during the first year of
the scheme.
Scheme Cost
The Periodic and Annual Levelisation processes are administered by Ofgem and ensure an equal
distribution of the total cost of the scheme across all Licensed Electricity Suppliers, based on their
respective market share of the Great Britain electricity supply market and any FIT payments made
to generators.
During the 1 April 2011 to 31 March 2012 annual period, a total of almost £151 million was
levelised across all Licensed Electricity Suppliers. This figure represents the total cost of the
scheme for the period and includes nearly £136 million of generation payments and a little over £3
million of deemed export payments paid to FIT generators by FIT Licensees and a little under £16
million in administration costs allocated to FIT Licensees (the total levelised for the period is
calculated through summation of total generation and export payments and qualifying costs minus
the value of net deemed export, which was just over £4 million).
Licensed Electricity Supplier Compliance
In respect of the 1 April 2011 to 31 March 2012 period all Licensed Electricity Suppliers, including
those designated either Mandatory or Voluntary FIT Licensees, satisfied their financial obligations under the scheme, although some were non-compliant with data reporting obligations to Ofgem.
Changes to the FIT Scheme
On 7 February 2011, the Department of Energy and Climate Change (DECC) announced that it
would undertake a “Comprehensive Review” of the FIT scheme. The Comprehensive Review was
being undertaken in two phases and would consider a broad number of areas including tariff levels,
energy efficiency requirements, cost control mechanisms and wider scheme administration issues.
Both phases of the review were implemented during FIT Year 3, and the impact and influence on
the scheme will be expanded upon in the subsequent FIT Annual Report. Phase 1 of the
Comprehensive Review was implemented on 1 April 2012, while implementation of Phases 2A and
2B occurred on 1 August 2012 and 1 December 2012 respectively.
Alongside the Comprehensive Review DECC also commenced a “Fast-Track Review” of tariffs for
large-scale and stand-alone solar PV projects and farm-scale anaerobic digestion (AD) projects.
The related consultation on the Fast-Track Review was published on 18 March and ran until 6 May
2011. The outcome of the “Fast Track Review” saw changes made to the scheme during the annual
period covered by this report.
In addition, on 27 July 2011 DECC announced a consultation on the treatment of extensions to
installations in the FIT scheme that led to a change to the extension rules with effect from 18
October 2011.

Feed-in Tariff (FIT): Annual Report 2011-12
6
1. Compliance of Licensed Electricity Suppliers
Chapter Summary
Chapter 1 provides information in relation to the compliance of all Licensed Electricity Suppliers
against their obligations contained within Conditions 33 and 34 of the Standard Conditions of
Electricity Supply Licenses during the period 1 April 2011 to 31 March 2012. The chapter also
provides a summary of Feed-in Tariff costs borne by each Licensed Electricity Supplier.
1.1. Through Licence Condition 33 all Licensed Electricity Suppliers are obligated to participate in
both the Periodic and Annual Levelisation reconciliation administered by Ofgem. Levelisation
is a fundamental element of the Feed-in Tariff scheme. It allows for the total cost of the
scheme to be distributed across all Licensed Electricity Suppliers, ensuring that all share a
proportionate burden of the costs, based on their respective market size. The process
principally occurs on a quarterly basis (Periodic Levelisation), in addition to an annual
reconciliation (Annual Levelisation) at the end of each FIT Year.
1.2. The Periodic Levelisation process requires FIT Licensees to report to Ofgem payments they
have made to FIT generators over a quarter. This information, together with data that all
Licensed Electricity Suppliers must also provide relating to their market share of the Great
Britain electricity supply market, determines whether a FIT licensee has paid out its share of
total FIT payments, based on its respective size in the electricity market, and also determines
what contribution non-FIT participating Licensed Electricity Suppliers are required to make to
the Levelisation Fund. For those suppliers which have paid less than their share they will be
liable to make a payment into the Levelisation Fund, while those that have paid more than
their share will be owed from the fund.
1.3. Annual Levelisation commences at the end of each FIT year. Its aim to reconcile all data and
associated costs included in each of the four Periodic Levelisation procedures that have taken
place during the FIT year. This enables any discrepancies to be resolved, any late payments
into the Levelisation Fund to be redistributed and for the most accurate information to be reported to Ofgem from Licensed Electricity Suppliers.
Annual FIT Notification
1.4. Through Licence Condition 33 Licensed Electricity Suppliers, who by virtue of the number of
domestic customers to which they supply electricity at 31 December of the preceding FIT
year are not mandated to participate in the FIT scheme, can elect to become a FIT Licensee.
Those Licensed Electricity Suppliers who are obligated to participate in the scheme are known
as Mandatory FIT Licensee, whilst those who elect to participate are known as Voluntary FIT
Licensees.
1.5. All FIT Licensees (Mandatory and Voluntary) are required to register and make payments to
FIT eligible generators under the Feed-in Tariff scheme based on renewable generation
and/or electricity exported. Specifically they are responsible for:
a. Taking all reasonable steps to verify that a FIT applicant‟s installation is eligible for the
FIT scheme and information provided by the FIT applicant is accurate,

Feed-in Tariff (FIT): Annual Report 2011-12
7
b. Registering eligible installations (both MCS FIT accredited and ROO-FIT accredited) onto
the Central FIT Register (CFR),
c. Taking all reasonable steps to ensure that data recorded on the CFR is accurate, and, if
necessary, updating and amending the CFR with new information,
d. Acquiring generation and/or export meter readings, taking all reasonable steps to satisfy
themselves that these generation and/or export meter readings are reasonable and
within expected tolerances for that particular installation,
e. Verifying generation and/or export meter readings at least once every two years,
f. Calculating and making FIT payments in accordance with information held on the CFR
and ensuring that FIT generators and nominated recipients only receive FIT payments for
which they are eligible,
g. Assisting FIT applicants to participate in the FIT scheme and providing a reasonable level
of customer service, and
h. Ensuring that FIT generators registered with the FIT licensee for both their electricity
supply and FIT payments are not discriminated against unreasonably in terms of
switching electricity supplier or the price paid for electricity supply.
Mandatory FIT Licensees
1.6. For the 1 April 2011 - 31 March 2012 obligation period Licensed Electricity Suppliers
(including affiliates) whom had a minimum of 50,000 domestic electricity supply customers at
31 December 2010 were obligated to participate in the Feed-in Tariff scheme as a Mandatory
FIT Licensee.
1.7. The responsibilities of a Mandatory FIT Licensee include the following:
To register and make FIT payments to eligible installations for which the Mandatory FIT
Licensee is the electricity supplier,
To register and make FIT payments to eligible generators who are customers of another
Licensed Electricity Supplier that is not a Mandatory FIT Licensee, and
To register and make FIT payments to eligible generators whose installation is sited off
grid.
1.8. Notwithstanding its obligations as outlined above, a Mandatory FIT licensee is able to register
and make FIT payments to any eligible generator it chooses to offer FIT services to.
1.9. Mandatory FIT Licensees must remain within the FIT scheme for the duration of the FIT year
(1 April - 31 March), even if during the FIT year they cease to meet the requirements of
obligated participation in the scheme as a Mandatory FIT Licensee.
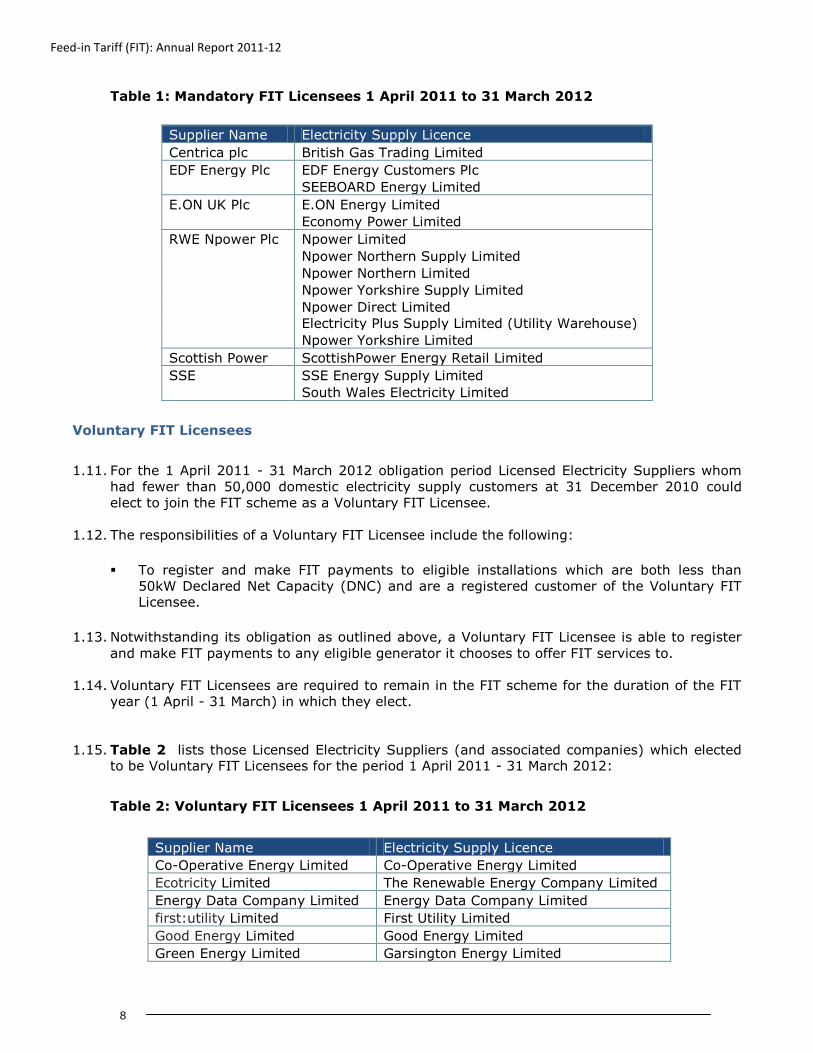
1.10. Table 1 lists those Licensed Electricity Suppliers (and associated companies) who were
Mandatory FIT Licensees for the period 1 April 2011 to 31 March 2012:
Feed-in Tariff (FIT): Annual Report 2011-12
8
Table 1: Mandatory FIT Licensees 1 April 2011 to 31 March 2012
Supplier Name Electricity Supply Licence
Centrica plc British Gas Trading Limited
EDF Energy Plc EDF Energy Customers Plc
SEEBOARD Energy Limited
E.ON UK Plc E.ON Energy Limited
Economy Power Limited
RWE Npower Plc Npower Limited
Npower Northern Supply Limited
Npower Northern Limited
Npower Yorkshire Supply Limited
Npower Direct Limited
Electricity Plus Supply Limited (Utility Warehouse)
Npower Yorkshire Limited
Scottish Power ScottishPower Energy Retail Limited
SSE SSE Energy Supply Limited
South Wales Electricity Limited
Voluntary FIT Licensees
1.11. For the 1 April 2011 - 31 March 2012 obligation period Licensed Electricity Suppliers whom
had fewer than 50,000 domestic electricity supply customers at 31 December 2010 could
elect to join the FIT scheme as a Voluntary FIT Licensee.
1.12. The responsibilities of a Voluntary FIT Licensee include the following:
To register and make FIT payments to eligible installations which are both less than
50kW Declared Net Capacity (DNC) and are a registered customer of the Voluntary FIT Licensee.
1.13. Notwithstanding its obligation as outlined above, a Voluntary FIT Licensee is able to register
and make FIT payments to any eligible generator it chooses to offer FIT services to.
1.14. Voluntary FIT Licensees are required to remain in the FIT scheme for the duration of the FIT
year (1 April - 31 March) in which they elect.
1.15. Table 2 lists those Licensed Electricity Suppliers (and associated companies) which elected to be Voluntary FIT Licensees for the period 1 April 2011 - 31 March 2012:
Table 2: Voluntary FIT Licensees 1 April 2011 to 31 March 2012
Supplier Name Electricity Supply Licence
Co-Operative Energy Limited Co-Operative Energy Limited
Ecotricity Limited The Renewable Energy Company Limited
Energy Data Company Limited Energy Data Company Limited
first:utility Limited First Utility Limited
Good Energy Limited Good Energy Limited
Green Energy Limited Garsington Energy Limited

Feed-in Tariff (FIT): Annual Report 2011-12
9
Supplier Name (cont.) Electricity Supply Licence (cont.)
iSupply Energy Limited Energy 2 Sell Limited
Energy COOP Limited
Opus Energy Limited Opus Energy Limited
Opus Energy (Corporate) Limited
Reuben Power Supply Limited Reuben Power Supply Limited
Smartest Energy Limited Smartest Energy Limited
Statkraft UK Limited Statkraft Markets GmbH
Tradelink Limited Tradelink Solutions Limited
Utilita Electricity Limited Utilita Electricity Limited
Non-FIT Licensees
1.16. Where a Licensed Electricity Supplier is neither mandated nor elects to become a FIT
Licensee, they are known as non-FIT licensees.
1.17. Non-FIT Licensees (as holders of an Electricity Supply Licence) are still required to participate
in elements of the FIT scheme, including Periodic and Annual Levelisation where they must
supply information and fulfil their financial liabilities as determined by Ofgem.
1.18. Those Licensed Electricity Suppliers that operated as a Non-FIT Licensee during the period 1
April 2011 - March 2012 are shown in Table 3 below. Where an Electricity Supply Licence
has been revoked this became effective within the period 1 April 2011 - 31 March 2012.
Table 3: Non-FIT Licensees 1 April 2011 to 31 March 2012
Supplier Name Electricity Supply Licence Notes
Abacus Finance Limited Abacus Finance Limited
AMRECS LLC AMRECS LLC
Axis Telecom Limited Axis Telecom Limited
BES Commercial Electricity
Limited
BES Commercial Electricity Limited
Business Energy Solutions Limited
Licence revoked
Licence revoked
Better Business Energy Limited Better Business Energy Limited
Better Energy Supply Limited Better Energy Supply Limited
Blizzard Utilities Limited Blizzard Utilities Limited
BP Trading Limited BP Power Trading Limited
Brilliant Energy Limited Brilliant Energy Limited
Centrica plc Electricity Direct (UK) Limited
Dual Energy Direct Limited Dual Energy Direct Limited
E.ON UK Plc E.ON UK Plc
Economy Energy Trading Limited Economy Energy Trading Limited
Ecotrade Solutions Limited Ecotrade Solutions Limited
EDF Energy Plc British Energy Direct Limited
Eneco energy Trade BV Eneco energy Trade BV
Energetix Group Circuit Energy Supply Limited
ETUL Limited ETUL Limited
Finotec Trading UK Limited Finotec Trading (Cyprus) Limited Licence revoked
Finotec Trading UK Limited Licence revoked
FIT Energy Supply Limited FIT Energy Supply Limited

Feed-in Tariff (FIT): Annual Report 2011-12
10
Supplier Name (cont.) Electricity Supply Licence (cont.) Notes (cont.)
Gazprom Marketing & Trading
Retail Limited
Gazprom Marketing & Trading Retail
Limited
GDF Suez Marketing Limited IPM Energy Retail Limited
GDF Suez Marketing Limited
Haven Power Limited Haven Power Limited
Home Counties Energy Plc Home Counties Energy Plc
Hudson Energy Supply UK Limited Hudson Energy Supply UK Limited
Immingham CHP LLP Immingham CHP LLP
iSupply Energy Limited I Supply Electricity 2 Limited
I Supply Electricity 3 Limited
I Supply Electricity Limited
I Supply Energy Limited
Supply Energy Limited
J.P. Morgan Energy Europe J.P. Morgan Energy Europe Limited Licence revoked
The Royal Bank of Scotland Plc Licence revoked
KO Brokers Limited KO Brokers Limited Licence revoked
Lourdes Associates Limited Lourdes Associates Limited
Lovely Energy Limited Lovely Energy Limited Licence revoked
MA Energy Limited MA Energy Limited
Metonomi Limited Metonomi Limited
Morgan Stanley Limited Morgan Stanley Capital Group Inc
Nationwide Electricity Limited Nationwide Electricity Limited
Open4Energy Limited Open4Energy Limited
Opus Energy Limited Donnington Energy Limited
Evenlode Energy Limited
Farmoor Energy Limited
OVO Electricity Limited OVO Electricity Limited
Pan-Utility Limited Pan-Utility Limited
R Electric Limited R Electric Limited
Rocpower Rocpower Limited Licence revoked
S. C. Isramart SRL S. C. Isramart SRL
Spark Energy Supply Limited Spark Energy Supply Limited
Team Gas and Electricity Limited Team Gas and Electricity Limited
Texas Retail Energy, LLC Power 4 All Limited
The Nuclear Decommissioning
Authority
The Nuclear Decommissioning
Authority
The Utilities Intermediaries
Association
The Utilities Intermediaries
Association
Licence revoked
Total Gas and Power Limited Total Gas & Power Limited
UK Healthcare Corporation Limited UK Healthcare Corporation Limited
Universal Bioenergy Limited Universal Bioenergy Limited
Utilisoft Limited Candela Energy Supply Limited
Lumen Energy Supply Limited
Magnetic Energy Supply Limited
Coulomb Energy Supply Limited
Utility Partnership Limited Utility Partnership Limited
UTTILY (UK) Limited UTTILY (UK) Limited
Wilton Energy Limited Wilton Energy Limited
Winnington Networks Limited Winnington Networks Limited

Feed-in Tariff (FIT): Annual Report 2011-12
11
Compliance with Conditions 33 and 34 of the Standard Conditions of Electricity Supply
Licences
1.19. During the 1 April 2011 to 31 March 2012 obligation period there were a total of 20 FIT Licensees, incorporating 29 Electricity Supply Licences.
1.20. Of the total number of FIT Licensees, 7 Licensees were classified as Mandatory FIT Licensees, while the remaining 13 were classified as Voluntary FIT Licenses.
1.21. During the annual FIT period the majority of Licensed Electricity Suppliers, including those
who were participating in the scheme as either a Mandatory of Voluntary FIT Licensee, were
compliant under their obligations as specified in Conditions 33 and 34 of the Standard
Conditions of Electricity Supply Licences. Nevertheless, there were a small, but significant
number of instances of both single and more persistent non-compliant issues that occurred
over the period. Further details of these instances are provided below.
Periodic and Annual Levelisation
1.22. For the period 1 April 2011 to 31 March 2012 a number of Licensed Electricity Suppliers failed
to meet their statutory obligations as they did not submit data to Ofgem during one (or
more) of the Periodic Levelisation periods or the Annual Levelisation final reconciliation. This
was despite, in a number of cases, repeated attempts by Ofgem to request this information.
These Licensed Electricity Suppliers are shown in Table A1 of Appendix 1.
1.23. Through requesting electricity supply information held by Elexon Ofgem was able to
determine that in each instance of non-compliance through non-reporting these Licensed
Electricity Suppliers supplied no electricity and therefore had no market share. As a result all
active Licensed Electricity Suppliers participated in Periodic and Annual Levelisation and there
was no financial impact on the scheme due to this non-compliance.
Late submission of either Periodic or Annual Levelisation data to Ofgem for the period 1 April 2011 - 31 March 2012
1.24. In addition to the non-submission of data from a number of Licensed Electricity Suppliers
there were a small number of instances of late reporting of data as part of one (or more) of
the Periodic Levelisation periods and/or the Annual Levelisation reconciliation. These Licensed
Electricity Suppliers are set out in Table A2 of Appendix 1.
1.25. However, these late submissions were successfully managed by Ofgem and they did not
delay completion of any Periodic Levelisation or the Annual Levelisation, with all funds being redistributed among Licensed Electricity Suppliers by all published deadlines.
Late payments into the Levelisation Fund by Licensed Electricity Suppliers for the period 1 April 2011 - 31 March 2012
1.27. As part of the Periodic Levelisation process a small number of Licensed Electricity Suppliers
did not submit cleared funds to fulfil their liability into the Levelisation Fund until after the
scheduled deadlines. These Licensed Electricity Suppliers are detailed in Table A3 of Appendix 1.
1.28. However, these late payments did not delay completion of any Periodic Levelisation or the
Annual Levelisation processes by Ofgem, with all funds being redistributed among Licensed
Electricity Suppliers by all published deadlines.

Feed-in Tariff (FIT): Annual Report 2011-12
12
Ofgem’s enforcement powers
1.29. Given that compliance with the Standard Conditions of Electricity Supply Licences is a
relevant requirement of an Electricity Supply Licence, the Authority may use its enforcement
powers in a similar manner that it can in respect of breaches of other licence conditions. In
some instances of non-compliance it is not necessary to take any enforcement action as the
issues are resolved quickly and there are mitigating factors. Decisions on whether or not to
consider and commence enforcement action are made on a case-by-case basis and are
guided by Ofgem‟s Enforcement Guidelines. In the cases of late provision of data and late payments described above, no enforcement action was taken.
Annual Notification of FIT Status
1.30. As set out in Licence Condition 33 all Licensed Electricity Suppliers are required to notify
Ofgem of their intention to become a Mandatory or Voluntary FIT Licensee (where applicable) or to remain as a non-FIT Licensee for the FIT year beginning on 1 April.
1.31. For the 1 April 2011 to 31 March 2012 period the following Electricity Supply Licence holders
did not submit the required Annual Notification of FIT Status by the deadline of 14 February 2012:
Abacus Finance Limited
AMRECS LLC
Better Business Energy Limited
Caboodle Energy Limited
Ecotrade Solutions Limited
Finotec Trading (Cyprus) Limited
Finotec Trading UK Limited
KO Brokers Limited
Team Gas and Electricity Limited
The Nuclear Decommissioning Authority
Winnington Networks Limited
1.32. As none of the aforementioned Licensed Electricity Suppliers exceeded the threshold for
participation in the FIT scheme as a Mandatory FIT Licensee by the FIT Notification deadline,
nor notified Ofgem of their intention to become a Voluntary FIT Licensee, they were listed as
Non-FIT Licensees for the annual period. This had no adverse affect on the scheme‟s
operation.
Supplier audits
1.33. A number of FIT Licensee audits were completed in March 2012 and covered the period 1
April 2011 to 31 March 2012. The results of the audits found that FIT Licensees were broadly
complying with their obligations. No major non-conformances or fundamental issues were
found. The relative success in operating the scheme well reflects positively on those FIT
Licensees audited.

Feed-in Tariff (FIT): Annual Report 2011-12
13
2. Accredited FIT Installations
Chapter Summary
This chapter provides an analysis of the number of installations accredited under the Feed-in Tariff
and a breakdown of these figures by capacity, installation type and region.
Eligible technologies
2.1. To apply for accreditation under the FIT scheme participants must install one of the following
eligible sources of low carbon energy or technology:
Anaerobic digestion (AD)
Hydro generating station
Micro combined heat and power (micro-CHP) with an electrical capacity of 2kW or less (up
to a maximum of 30,000 eligible installations)
Solar photovoltaic (PV)
Wind
2.2. The specified maximum capacity of eligible installations under the FIT scheme is set at 5MW
Total Installed Capacity (2kW for Micro CHP). It is permissible to install up to 5MW of Total
Installed Capacity generation from the same low-carbon energy source on any defined site.
2.3. Eligible micro-CHP (<2kW) installations can join the FIT scheme on a pilot scheme basis; only
the first 30,000 micro-CHP installations added to the CFR will be eligible. DECC will review
the pilot once the 12,000th installation is completed.
Number of accredited installations
2.4. For the purpose of this report all statistics referring to the date of an installation are based on
its Confirmation Date. This reflects the date an installation is added onto Ofgem‟s Central FIT
Register and is not reflective of the Eligibility Date2 of the installation, which is the date from
which an installation‟s FIT payments commence.
2.5. At 31 March 2012, a total of 247,951 installations had been registered under the FIT scheme
since 1 April 2010. Figure 1 illustrates the breakdown of this total by individual technology
type and demonstrates that solar PV installations constitute the overwhelming majority of
installations, with around 99 percent of the total. All other FIT eligible technologies make up
the remaining 1 percent.
2 The Eligibility Date is determined to be the later of either the commissioning date or the date a FIT application is
received by a FIT Licensee.

Feed-in Tariff (FIT): Annual Report 2011-12
14
Figure 1: Total number of installations registered by technology type
2.6. The monthly registration of FIT eligible installations together with the cumulative total of
installations held on the CFR over the first two years of the scheme‟s operation is highlighted
in Figure 2.
Figure 2: Total installations registered by month
<1% <1% <1%
99%
1% 1%
Anaerobic digestion
Hydro
Micro CHP
Photovoltaic
Wind
0
25
50
75
100
125
150
175
200
225
250
0
5
10
15
20
25
30
35
40
45
50
Apr-
10
May-1
0
Jun-1
0
Jul-
10
Aug-1
0
Sep-1
0
Oct-
10
Nov-1
0
Dec-1
0
Jan-1
1
Feb-1
1
Mar-
11
Apr-
11
May-1
1
Jun-1
1
Jul-
11
Aug-1
1
Sep-1
1
Oct-
11
Nov-1
1
Dec-1
1
Jan-1
2
Feb-1
2
Mar-
12
Tota
l Num
ber o
f Insta
llatio
ns (th
ousands)
Month
ly N
um
ber
of In
sta
llations (
thousands)
Monthly Installations Total Installations

Feed-in Tariff (FIT): Annual Report 2011-12
15
2.7. Figure 2 clearly illustrates the marked disparity in the registration of new installations
between the first fifteen months of the scheme, where the progressive increase is marginal,
and the remaining nine months to March 2012 where the number of new installations
registered increased significantly.
2.8. In addition to the increase in installations recorded onto the Central FIT Register during the
second half of the FIT Year, Figure 2 indicates pronounced increases in the number of
registered new installations during both December 2011 and March 2012. This is explained by
the substantial increase of new installations applying for the FIT scheme before the published
deadline for reduction of solar PV tariffs in 12 December 2011. As the tariff reduction did not
occur until 3 March 2012 there was a further spike in the registration of new installations
immediately before this date. Due to the length of time between applying for the scheme and
being registered onto the CFR, the respective peaks in installations applying are shown in
subsequent months.
Total Installed Capacity
2.9. The Total Installed Capacity of all installations by technology type that were registered on the
CFR as at 31 March 2012 is illustrated in Figure 3. Of the 1.1GW of Total Installed Capacity,
roughly 92 percent (1GW) is attributed to solar PV installations, highlighting the clear
dominance of this technology, while wind consists of approximately 5 percent (54.6MW) of
the total. Other technologies make up the remaining 3 percent of capacity.
Figure 3: Total Installed Capacity by technology
Yearly update overview
2.10. A breakdown of registered installations added onto the CFR by individual technology is set
out in Table 4. As is evidenced July 2011 represents the first month of the substantial
increase in registered new installations, which extends through to 2012. This increase is
primarily driven by a rise in registrations of photovoltaic installations, while other
technologies remain relatively small in number throughout the period.
Anaerobic digestion
Hydro
Micro CHP
Photovoltaic
Wind
92%
5%
1% 2%

Feed-in Tariff (FIT): Annual Report 2011-12
16
Table 4: Monthly scheme uptake by technology type
Technology Type
AD Hydro Micro-CHP Photovoltaic Wind
2011 April 0 5 18 3,597 57
May 1 4 21 5,427 65
June 1 4 19 5,505 64
July 4 5 39 8,223 87
2011 August 0 5 29 11,351 107
September 1 7 29 15,844 132
October 3 5 24 13,997 66
November 0 3 20 22,562 77
December 1 7 23 29,475 96
2012 January 0 8 12 38,928 91
2012 February 0 6 16 25,552 110
March 2 10 6 35,829 161
Total
13 69 256 216,290 1,113
2.11. The peak months of registering new installations during the 1 April 2011 - 31 March 2012
period were January and March 2012, and are reflective of the anticipated policy change in
December 2011 and the subsequent change in tariff rates for small scale PV installations that became effective in early March 2012.
Great Britain regional overview
2.12. Figure 4 illustrates the registration of new FIT eligible installations by region in the first and
second years of FIT scheme operation. The increase in installations during the second year of
the scheme is prominent across all regions of Great Britain. This is true in particular for the
South West and the South East regions, as these regions are responsible for the largest
increase of installations during the April 2011 to March 2012 period.
Figure 4: National and Regional growth in installation numbers
0
5
10
15
20
25
30
35
40
East
Midlands
East of
England
London North
East
North
West
Scotland South
East
South
West
Wales West
Midlands
Yorkshire
& the
Humber
Num
ber
of In
sta
llations (
thousands)
1 April 2010 - 31 March 2011 1 April 2011 - 31 March 2012

Feed-in Tariff (FIT): Annual Report 2011-12
17
2.13. An overview of the cumulative quarterly registration of new installations by region is detailed
in Figure 5. This chart shows the total of installations from 1 April 2010 to 31 March 2012
across all regions and demonstrates the substantial increase in total numbers during the
second year.
2.14. In addition Figure 5 illustrates the relative disparity of the number of registered installations
between regions and how this has increased over time.
Figure 5: Cumulative quarterly installation numbers by region
0
5
10
15
20
25
30
35
40
45
Apr - Jun 2010
Jul - Sep 2010
Oct - Dec 2010
Jan - Mar 2011
Apr - Jun 2011
Jul - Sep 2011
Oct - Dec 2011
Jan - Mar 2012
Tota
l N
um
ber
of In
sta
llations (
thousannds)
East Midlands East of England London
North East North West Scotland
South East South West Wales
West Midlands Yorkshire and the Humber

Feed-in Tariff (FIT): Annual Report 2011-12
18
2.15. Figure 6 illustrates the breakdown of Total Installed Capacity by Great Britain region, in
addition to the percentage of Total Installed Capacity by technology. From this it is evident to
observe that PV installations constitute the vast majority of the capacity in all regions, in fact
more than 90 percent in each region, with the only exception being Scotland with PV
installations consisting of 51 percent Total Installed Capacity, while both Wind and Hydro
installations comprise the remaining capacity.
2.16. Micro-CHP installations represent approximately 0.03 percent of Total Installed Capacity
under the scheme as at 31 March 2012. Due to the very low percentage of this technology,
micro-CHP capacity has been removed from the regional breakdowns in Figure 8.
Figure 6: Regional breakdown of Total Installed Capacity by technology (MW)

Feed-in Tariff (FIT): Annual Report 2011-12
19
2.17. An overview of the total number of registered new installations by region and the percentage
of total installations across Great Britain is shown in Figure 7. This highlights the breakdown
of installations across Great Britain and how the majority installations are concentrated in the
South East and South West regions. These two regions contain more than a third (34
percent) of all installations within the scheme as at 31 March 2012.
Figure 7: Regional Breakdown of share of number of installations
2.18. Further information on the regional breakdown of installations is included in Appendix 3,
including details of installation uptake by technology and by quarter from 1 April 2010 to 31
March 2012.

Feed-in Tariff (FIT): Annual Report 2011-12
20
Total installations and Total Installed Capacity by installation type
2.19. During the registration of new installations on the CFR by FIT Licensees they are prompted to
categorise the installation (i.e. a domestic or community installation). It is important to note
however that the installation type, particularly for „community‟ installations, does not relate
to the defined „community organisation‟ as set out under the Feed-in Tariff Order 2012 as the
categorisation is a subjective assessment and not determined through reference to any
Ofgem published guidance.
2.20. Figure 8 illustrates the breakdown of all installations by their installation type that were
registered under the scheme as at 31 March 2012. The overwhelming majority (97 percent)
of all installations are defined as domestic, while the remaining 3 percent constitute
commercial, community and industrial installations.
Figure 8: Percentage of installations by assigned category
2.21. The Total Installed Capacity by assigned category of installations registered on the CFR as at
31 March 2012 is shown in Figure 9.
Figure 9: Total Installed Capacity of installations by installed type
2.22. While domestic installations remain the largest overall percentage (at 69 percent), this is
significantly lower than the percentage in Figure 9 for the total number of installations
categorised as domestic.
Community
Domestic
Non Domestic (Commercial)
Non Domestic (Industrial)
97%
2%
1%
Community
Domestic
Non Domestic (Commercial)
Non Domestic (Industrial)
26%
69%
4% 1%

Feed-in Tariff (FIT): Annual Report 2011-12
21
2.23. Commercial installations constitute around 26 percent of the Total Installed Capacity of all
installations, while they account for only 2 percent of the total number of installations in
Figure 8. This disparity highlights the different average size of each installation type.
Average Total Installed Capacity per installation by technology type
2.24. By analysing all accredited installations under the Feed-in Tariff scheme as of 31 March 2012,
the average Total Installed Capacity of each installation type can be determined. Table 5
displays these averages, and highlights the significant difference between the average
capacities of each installation type.
2.25. By reviewing Table 5, the variation in the average size of each installation type by FIT Year
can be seen. With the exception of community, all other installation types saw their average
size increase in the April 2011 to March 2012 period. This can be explained by lower capital
costs per kW installed, particularly for photovoltaic installations, during the 1 April 2011 to 31
March 2012 period.
Table 5: Average Total Installed Capacity per installation by technology type
Installation Type Average capacity
per installation
(kW) 2010-11
Average capacity
per installation
(kW) 2011-12
Community 12.5 11.6
Domestic 2.8 3.1
Non Domestic (Commercial) 40.0 51.7
Non Domestic (Industrial) 33.1 103.4
Electricity generated and exported
2.26. During the second year of the FIT scheme from 1 April 2011 to 31 March 2012 FIT Licensees
reported total generation of 498.2GWh of electricity and 104.4GWh of total export by
accredited installations. Figure 10 provides a breakdown of total generation by technology
type. It demonstrates that photovoltaic installations contribute the largest proportion of total
generation across all technologies, though this is a markedly lower percentage than evidenced
in Figures 1 and 3, for total number of installations and Total Installed Capacity respectively.
Figure 10: Total electricity generated and exported during 1 April 2011 - 31 March
2012 by technology
Anaerobic Digestion
Hydro
Micro CHP
Photovoltaic
Wind
RO
57%
17%
5%
12%
9%
<1%

Feed-in Tariff (FIT): Annual Report 2011-12
22
2.27. A more detailed breakdown of total electricity reported by FIT Licensees to have been
generated and exported by technology type, during the second year of the FIT scheme is
shown in Table 6. All generation detailed in the table is based on metered generation, while
export is a combination of both metered and deemed export3.
Table 6: Electricity generated and exported during the period 1 April 2011 - 31
March 2012 by technology
Technology Electricity
Generated
(MWh)
Electricity
Exported
(MWh)
Total
Electricity
Generated
and Exported
(MWh)
AD 71,607.2 222.2 71,829.3
Hydro 52,197.6 2,049.4 54,246.9
Micro-CHP 241.9 114.5 356.4
Photovoltaic 259,198.0 82,459.5 341,657.5
Wind 93,510.6 11,123.9 104,634.5
RO 21,424.2 8,391.9 29,816.0
Total 498,179.4 104,361.3 602,541
2.28. As illustrated by Table 6 there are significant differences between the ratios of electricity
generated to electricity exported across technology types. With micro-CHP for example,
exported electricity constitutes around 50 percent of electricity generated, while for AD this is
only around 0.3 percent of the generation figure. This can be explained primarily by a
number of larger installations opting out of reporting and receiving export payments under
the scheme, due to the opportunity for greater financial income for export outside of the
scheme. This impacts more significantly on those technologies which have a larger average
Total Installed Capacity, in particular AD, hydro and wind.
Migration from the Renewables Obligation
2.29. Provisions within FIT legislation were included to enable the transfer of all existing renewable
generators of 50kW capacity or less previously accredited under the Renewables Obligation scheme (RO), upon commencement of the FIT scheme on 1 April 2010.
2.30. This migration process was undertaken by Ofgem from April 2010 and the vast majority
transferred toward the end of March 2012. During this process more than 5,173 installations previously accredited under the RO were successfully transferred across to the FIT scheme.
3 For the FIT Year 2 period deemed export determined at 50 percent of metered generation for all technologies except
hydro, in which is deemed at 75 percent.

Feed-in Tariff (FIT): Annual Report 2011-12
23
3. Feed-in Tariff Scheme Cost
Chapter Summary
This chapter provides an analysis of the cost of the Feed-in Tariff scheme during the period 1 April
2011 to 31 March 2012 and in addition provides a comparison of scheme costs against the
previous and first year of the scheme (1 April 2010 - 31 March 2011).
3.1. Periodic and Annual Levelisation are the principle mechanisms that enable the cost of the
Feed-in Tariff scheme to be distributed across all Licensed Electricity Suppliers, ensuring
equal burden of costs based on their respective market size and that accredited generators
receive payment for renewable electricity generated and exported.
Ofgem levelisation process 1 April 2011 to 31 March 2012
3.2. All four Periodic Levelisation procedures and the Annual Levelisation reconciliation for the
second year of the FIT scheme (1 April 2011 - 31 March 2012) were successfully completed,
with all active Licensed Electricity Suppliers submitting information to Ofgem.
3.3. All liabilities with regard to payments into the Levelisation Fund were made by all Licensed
Electricity Suppliers, enabling Ofgem to redistribute scheme costs with no shortfall in the
redistribution of costs and no late payment re-calculation or reconciliation necessary at
Annual Levelisation.
3.4. An overview of the total costs of the Feed-in Tariff scheme for the annual period 1 April 2011
to 31 March 2012 is shown in Table 7:
Table 7: Total FIT Payments by payment type 1 April 2011 to 31 March 2012
Cost Total Description
FIT generation
payments
£135,937,391.51 This figure sets out the total cost in payments made
to accredited generators, based on renewable
generation.
Total FIT export
payments4
£3,529,269.05 This figure sets out the total payments made to
accredited generators based on both metered and
deemed export of electricity.
Value of net
deemed export
£4,146,228.99 The total value of net deemed export is defined as
the amount of electricity deemed to have been
exported by all accredited FIT installations multiplied
by the System Sell Price (SSP) for the annual period.
Qualifying FIT
costs
£15,827,255.00 This figure sets out the total administration costs
allocated to FIT Licensees under the scheme. The
administration costs are determined annually by the
Secretary of State and are published on the DECC
website.
4 The deemed element of this figure, which is used to calculate the levelisation fund, is £3,137,646.06

Feed-in Tariff (FIT): Annual Report 2011-12
24
Cost (cont.) Total (cont.) Description (cont.)
Levelisation
fund
£150,756,063.58 This figure represents the cost of the scheme over
the year and includes generation payments, deemed
export payments, and qualifying administration costs
minus the value of deemed export to licensed
electricity suppliers.
Total costs
reconciled
£70,437,681.00
This figure sets out the amount of money that was
redistributed to and from the Levelisation Fund over
the yearly period. This figure includes
£55,692,347.16 of Periodic Levelisation payments
and £14,745,333.84 of Annual Levelisation
payments.
FIT scheme cost yearly comparison
3.5. As is shown in Figures 11 and 12 the overall cost of the FIT scheme has increased
significantly between the first year and second year of its operation. These charts also
provide a breakdown of the total cost by individual payment type. These charts indicate that
the overall cost of the scheme has increased extensively over the first two years, whilst the
individual cost breakdowns have remained relatively proportional.
Figure 11: Breakdown of FIT Scheme Costs 2010-11
Figure 12: Breakdown of FIT Scheme Costs 2011-12
£12,487,028.83
£448,250.99
£2,044,560.00
£453,717.14
FIT generation payments
Total FIT export payments
FIT Qualifying costs
Value of net deemed export
£135,937,391.51
£3,529,269.05
£15,827,255.00
£4,146,228.99 FIT generation payments
Total FIT export payments
FIT Qualifying costs
Value of net deemed export
Feed-in Tariff (FIT): Annual Report 2011-12
25
3.6. As expected, and as in the first year of the scheme‟s operation, generation payments to
accredited generators continued to represent the largest proportion of total FIT costs in the
second year. This share of the total cost has increased slightly during the second year, and
can largely be attributed to a reduction in the proportion of FIT qualifying costs to FIT
Licensees over the same period. The reduction in qualifying costs can be explained due to the
decrease in the individual qualifying costs, as set by the Secretary of State per new
installation, for this annual period5.
Total payments by FIT Licensee
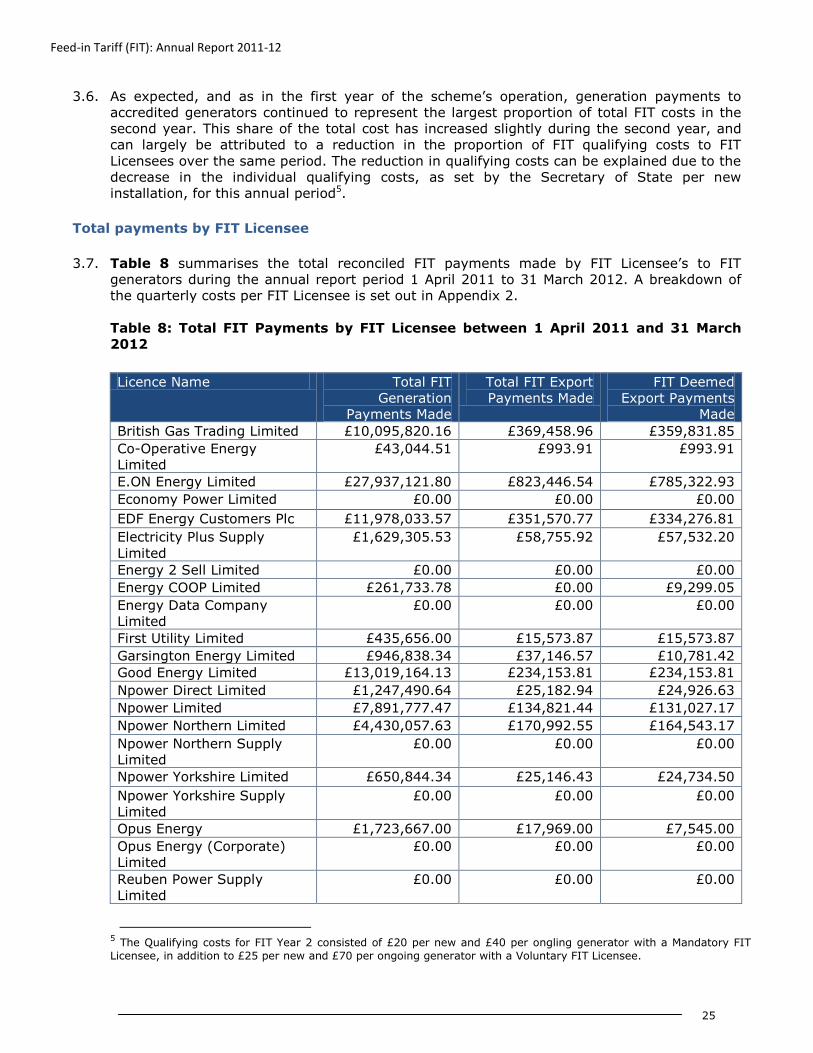
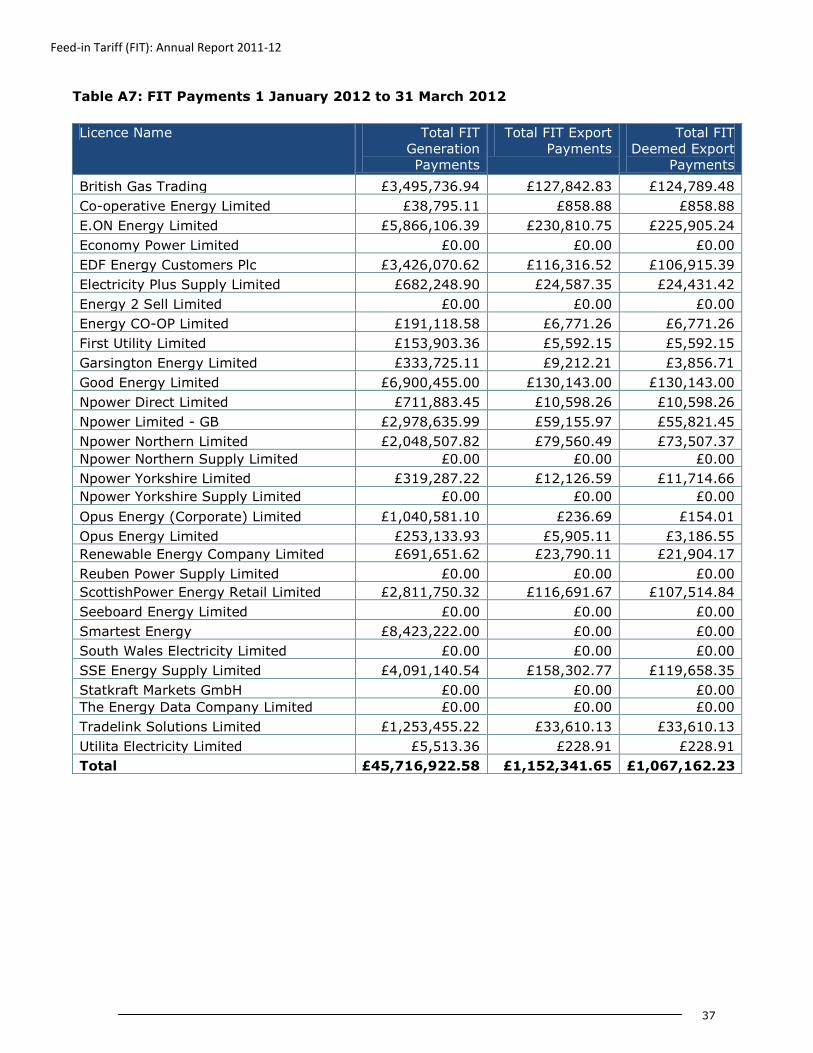
3.7. Table 8 summarises the total reconciled FIT payments made by FIT Licensee‟s to FIT
generators during the annual report period 1 April 2011 to 31 March 2012. A breakdown of
the quarterly costs per FIT Licensee is set out in Appendix 2.
Table 8: Total FIT Payments by FIT Licensee between 1 April 2011 and 31 March
2012
Licence Name Total FIT
Generation
Payments Made
Total FIT Export
Payments Made
FIT Deemed
Export Payments
Made
British Gas Trading Limited £10,095,820.16 £369,458.96 £359,831.85
Co-Operative Energy
Limited
£43,044.51 £993.91 £993.91
E.ON Energy Limited £27,937,121.80 £823,446.54 £785,322.93
Economy Power Limited £0.00 £0.00 £0.00
EDF Energy Customers Plc £11,978,033.57 £351,570.77 £334,276.81
Electricity Plus Supply
Limited
£1,629,305.53 £58,755.92 £57,532.20
Energy 2 Sell Limited £0.00 £0.00 £0.00
Energy COOP Limited £261,733.78 £0.00 £9,299.05
Energy Data Company
Limited
£0.00 £0.00 £0.00
First Utility Limited £435,656.00 £15,573.87 £15,573.87
Garsington Energy Limited £946,838.34 £37,146.57 £10,781.42
Good Energy Limited £13,019,164.13 £234,153.81 £234,153.81
Npower Direct Limited £1,247,490.64 £25,182.94 £24,926.63
Npower Limited £7,891,777.47 £134,821.44 £131,027.17
Npower Northern Limited £4,430,057.63 £170,992.55 £164,543.17
Npower Northern Supply
Limited
£0.00 £0.00 £0.00
Npower Yorkshire Limited £650,844.34 £25,146.43 £24,734.50
Npower Yorkshire Supply
Limited
£0.00 £0.00 £0.00
Opus Energy £1,723,667.00 £17,969.00 £7,545.00
Opus Energy (Corporate)
Limited
£0.00 £0.00 £0.00
Reuben Power Supply
Limited
£0.00 £0.00 £0.00
5 The Qualifying costs for FIT Year 2 consisted of £20 per new and £40 per ongling generator with a Mandatory FIT
Licensee, in addition to £25 per new and £70 per ongoing generator with a Voluntary FIT Licensee.

Feed-in Tariff (FIT): Annual Report 2011-12
26
Licence Name (cont.) Total FIT Generation
Payments Made
(cont.)
Total FIT Export
Payments Made
(cont.)
FIT Deemed
Export Payments
Made (cont.)
ScottishPower Energy Retail
Limited
£8,934,977.06 £370,423.65 £331,794.49
SEEBOARD Energy Limited £0.00 £0.00 £0.00
SmartestEnergy Limited £18,951,391.05 £0.00 £0.00
South Wales Electricity
Limited
£0.00 £0.00 £0.00
SSE Energy Supply Limited £21,721,721.14 £784,895.50 £545,880.70
Statkraft Markets GmbH £0.00 £0.00 £0.00
The Renewable Energy
Company Limited
£1,850,708.23 £73,207.11 £64,205.80
Tradelink Solutions Limited £2,182,802.81 £35,302.04 £34,994.71
Utilita Electricity Limited £5,236.32 £228.04 £228.04
Total £135,937,391.51 £3,529,269.05 £3,137,646.06

Feed-in Tariff (FIT): Annual Report 2011-12
27
4. Comprehensive Review of the FIT Scheme
Chapter Summary
The Feed-in Tariff scheme has been subject to a number of significant amendments since its
introduction on 1 April 2010. This chapter summarises the key changes that were instituted during
the period 1 April 2011 - 31 March 2012 and outlines some of the key scheme amendments that
have or will become effective in the period 1 April 2012 - 31 March 2013.
FIT Scheme Changes Announced During 1 April 2011 - 31 March 2012
4.1. On 7 February 2011 DECC announced that it would undertake a “comprehensive review” of
the Feed-in Tariff (FIT) scheme. The comprehensive review was to be undertaken in two
phases. The review would consider a broad number of themes including tariff levels, energy
efficiency requirements for FIT eligible installations, cost control mechanisms and wider
scheme administration issues.
4.2. The FIT tariff tables applicable at the end of FIT Year 2 are detailed in Appendix 4.
Fast Track Review
4.3. Alongside the comprehensive review DECC would also undertake a “fast-track review” of
tariffs for large-scale and stand-alone solar PV projects and farm-scale anaerobic digestion
(AD) projects.
4.4. The related consultation took place from 18 March to 6 May 2011. The Government‟s
response to the consultation was published on 9 June 2011 and confirmed that generation
tariff rates for larger scale (over 50kW) and stand alone PV projects would be reduced for
installations with an eligibility date on or after 1 August 2011. The response also announced
an increase to the generation tariff rate of farm-scale (up to and including 500kW) AD
projects from 30 September 2011 (following state aid approval).
Consultation on a change to the rules on the treatment of extensions to installations
under the Feed-in Tariffs scheme
4.5. In addition, on 27 July 2011 DECC announced a consultation on the treatment of extensions
to installations under the FIT scheme that led to a change to extension rules with effect from
18 October 2011.
Comprehensive Review Phase 1
4.6. The DECC consultation on “Comprehensive Review Phase 1 - Tariffs for solar PV” ran between
31 October and 23 December 2011.
4.7. On 9 February 2012 DECC published the government‟s response to the consultation,
confirming a number of amendments that would affect solar PV installations:
Reduced Tariffs for all PV with a Total Installed Capacity of 250kW or less. These tariffs
would be introduced from 1 April 2012 and affect all electricity generated from solar PV
installations with an eligibility date on or after 3 March 2012. Those with an eligibility
date before 3 March 2012 inclusive would continue to receive higher tariff.

Feed-in Tariff (FIT): Annual Report 2011-12
28
The introduction of an energy efficiency requirement and multi-installation tariff. To be
eligible for a higher generation tariff rate, new solar PV installations with a Total Installed
Capacity of up to and including 250kW, including extensions, with an eligibility date on or
after 1 April 2012 would be required to meet a minimum energy efficiency requirement
(this would not apply to stand alone installations).
From 1 April 2012 a new multi-installation tariff would apply to any solar PV installation
where the FIT generator or nominated recipient already owns or receives FIT payments
from 25 or more other solar PV installations, which are located on distinct sites.
FIT Scheme Changes announced after 1 April 2012
4.8. Phase 2 of the DECC comprehensive review was further split into two phases - Phase 2A and
Phase 2B. Both related consultations opened on 9 February 2012 and closed on 3 April 2012 and 26 April 2012 respectively.
Comprehensive Review Phase 2A
4.9. On 24 May 2012 DECC published the government‟s response to the consultation
“Comprehensive Review Phase 2A: Solar PV cost control‟. The response confirmed a number
of changes to the scheme, including:
A reduction to the generation tariff rates for new solar PV installations and extensions
with an eligibility date on or after 1 August 2012.
A reduction in the tariff lifetime for new PV installations and extensions with an eligibility
date on or after 1 August 2012 from 25 years to 20 years.
The introduction of a cost control mechanism that will reduce generation tariff rates for
new solar PV installations on a quarterly basis, based on PV deployment.
An increase to the tariff rate for exported electricity for new PV installations and
extensions with an eligibility date on or after 1 August 2012.
A change to the domestic customer threshold for mandatory participation in the FITs scheme by Licensed Electricity Suppliers from 50,000 to 250,000.
Comprehensive Review Phase 2B
4.10. On 20 July 2012 DECC published the government‟s response to the consultation
“Comprehensive Review Phase 2B: Tariffs for non-PV technologies and scheme administration
issues”. The response confirmed a number of changes to the scheme that would affect
installations with an eligibility date on or after 1 December 2012. The changes included:
Revised generation tariff rates for AD, wind, hydro and micro-CHP technologies.
An increase to the tariff rate for exported electricity for new non-PV installations.
A degression mechanism for non-PV technologies which will come in to effect from April
2014.
A process of preliminary accreditation for all ROO-FIT accredited installations (i.e. wind
and solar with a DNC over 50kW and all AD and hydro technologies).
New measures to assist „community organisations‟ to participate in the scheme,
including:
- A relaxation of the minimum energy efficiency requirement; and

Feed-in Tariff (FIT): Annual Report 2011-12
29
- A „tariff guarantee‟ enabling these organisations to confirm a tariff rate in
advance of commissioning their installation.
A new measure to help education providers with a relaxation of the energy efficiency
requirement for school installations.
Revisions to Ofgem’s “Guidance for Licensed Electricity Suppliers”
4.11. On 26 November 2011 Ofgem published a revision of the document “Feed-in Tariff Guidance
for Licensed Electricity Suppliers”. This „Version 2‟ document took account of FIT scheme
amendments resulting from both the Fast Track Review and the Consultation on a change to
the rules on the treatment of extensions to installations under the Feed-in Tariffs scheme in
addition to feedback and responses received from Ofgem‟s consultation on published
guidance that opened on 1 February 2011 and closed on 15 March 2011.
4.12. In response to amendments to the FIT scheme as a consequence of Comprehensive Review
Phase 1 the “Guidance for Licensed Electricity Suppliers” underwent a second revision and a „version 3‟ of the document was published on 30 March 2012.

Feed-in Tariff (FIT): Annual Report 2011-12
30
5. Appendices Index
Appendix Name of Appendix Page
Number
1 Non-Compliant Licensed Electricity Suppliers 31
2 Quarterly Payments to FIT Generators by FIT Licensees 34
3 FIT Accredited Installations by GB Region 38
4 FIT Tariff Tables 41
5 Glossary 44
6 Feedback 48

Feed-in Tariff (FIT): Annual Report 2011-12
31
Appendix 1: Non-Compliant Licensed Electricity Suppliers
Licensed Electricity Suppliers highlighted in bold in the following tables were either a
Mandatory FIT Licensee or elected to become a Voluntary FIT Licensee for the period 1
April 2011 to 31 March 2012.
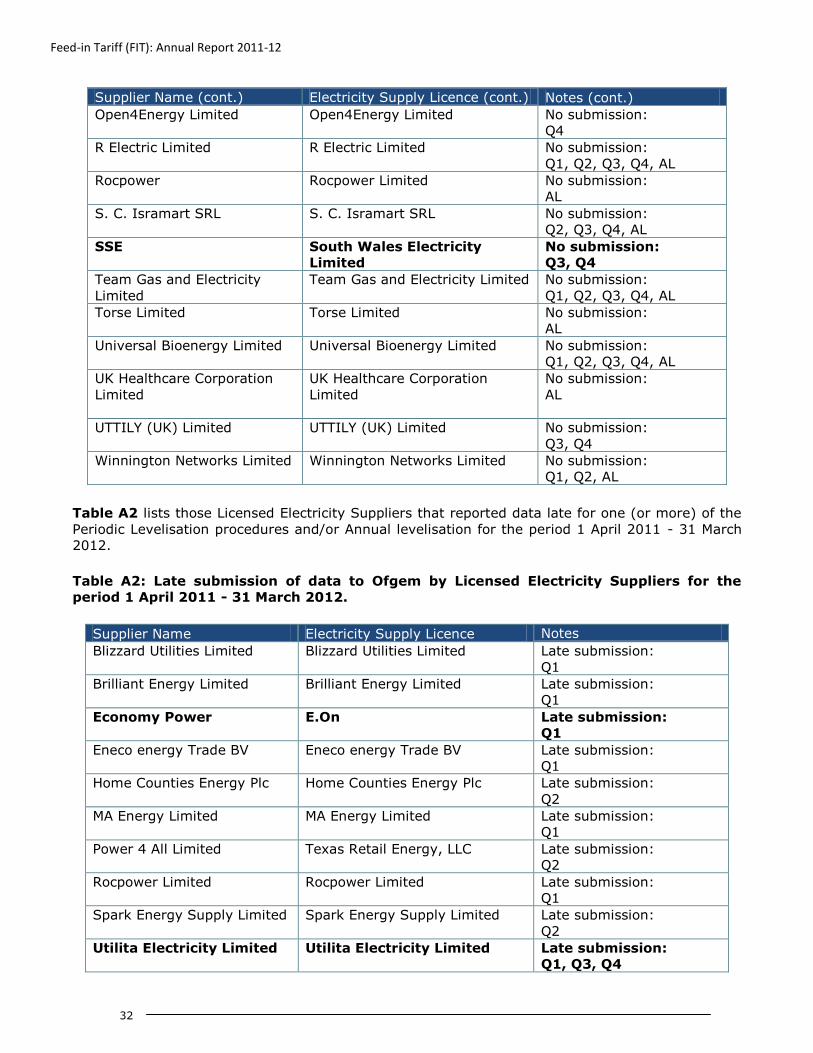
Table A1 lists those Licensed Electricity Suppliers that did not supply data for one (or more) of the
Periodic Levelisation procedures and/or Annual levelisation for the period 1 April 2011 - 31 March
2012. The revocation of Electricity Supply Licences that became effective within the period 1 April
2011 - 31 March 2012 has also been included.
Table A1: Non-Compliant Licensed Electricity Suppliers in respect of data supplied to
Ofgem for the period 1 April 2011 - 31 March 2012.
Supplier Name Electricity Supply Licence Notes
Abacus Finance Limited Abacus Finance Limited No submission:
Q16, Q2, Q3, Q4, AL7
AMRECS LLC AMRECS LLC No submission:
Q1, Q2, Q3, Q4, AL
Better Business Energy
Limited
Better Business Energy Limited No submission:
Q1, Q2, Q3, Q4, AL
Brilliant Energy Limited Brilliant Energy Limited No submission:
Q2, Q3, Q4, AL
Economy Energy Trading
Limited
Economy Energy Trading Limited No submission:
Q1, Q2, Q3, Q4, AL
Ecotrade Solutions Limited Ecotrade Solutions Limited No submission:
Q1, Q2, Q3, Q4, AL
Finotec Trading UK Limited Finotec Trading (Cyprus) Limited Licence revoked
Finotec Trading UK Limited Licence revoked
FIT Energy Supply Limited
FIT Energy Supply Limited
No submission:
AL
Home Counties Energy Plc Home Counties Energy Plc No submission:
Q1
Hudson Energy
Hudson Energy
No submission:
AL
iSupply Energy Limited I Supply Electricity 2 Limited No submissions:
I Supply Electricity 3 Limited Q2
I Supply Electricity Limited
I Supply Energy Limited
Supply Energy Limited
J.P. Morgan Energy Europe J.P. Morgan Energy Europe Licence revoked
The Royal Bank of Scotland Plc Licence revoked
Lourdes Associates Limited Lourdes Associates Limited No submission:
Q2, Q3, Q4
Morgan Stanley International
Limited
Morgan Stanley Capital Group
Inc
No submission:
Q1, Q2, AL
6 Refers to Periodic Levelisation period
7 Refers to Annual Levelisation
Feed-in Tariff (FIT): Annual Report 2011-12
32
Supplier Name (cont.) Electricity Supply Licence (cont.) Notes (cont.)
Open4Energy Limited Open4Energy Limited No submission:
Q4
R Electric Limited R Electric Limited No submission:
Q1, Q2, Q3, Q4, AL
Rocpower Rocpower Limited No submission:
AL
S. C. Isramart SRL S. C. Isramart SRL No submission:
Q2, Q3, Q4, AL
SSE South Wales Electricity
Limited
No submission:
Q3, Q4
Team Gas and Electricity
Limited
Team Gas and Electricity Limited No submission:
Q1, Q2, Q3, Q4, AL
Torse Limited
Torse Limited
No submission:
AL
Universal Bioenergy Limited Universal Bioenergy Limited No submission:
Q1, Q2, Q3, Q4, AL
UK Healthcare Corporation
Limited
UK Healthcare Corporation
Limited
No submission:
AL
UTTILY (UK) Limited UTTILY (UK) Limited No submission:
Q3, Q4
Winnington Networks Limited Winnington Networks Limited No submission:
Q1, Q2, AL
Table A2 lists those Licensed Electricity Suppliers that reported data late for one (or more) of the
Periodic Levelisation procedures and/or Annual levelisation for the period 1 April 2011 - 31 March
2012.
Table A2: Late submission of data to Ofgem by Licensed Electricity Suppliers for the
period 1 April 2011 - 31 March 2012.
Supplier Name Electricity Supply Licence Notes
Blizzard Utilities Limited Blizzard Utilities Limited Late submission:
Q1
Brilliant Energy Limited Brilliant Energy Limited Late submission:
Q1
Economy Power E.On Late submission:
Q1
Eneco energy Trade BV Eneco energy Trade BV Late submission:
Q1
Home Counties Energy Plc Home Counties Energy Plc Late submission:
Q2
MA Energy Limited MA Energy Limited Late submission:
Q1
Power 4 All Limited Texas Retail Energy, LLC Late submission:
Q2
Rocpower Limited Rocpower Limited Late submission:
Q1
Spark Energy Supply Limited Spark Energy Supply Limited Late submission:
Q2
Utilita Electricity Limited Utilita Electricity Limited Late submission:
Q1, Q3, Q4

Feed-in Tariff (FIT): Annual Report 2011-12
33
Supplier Name (cont.) Electricity Supply Licence (cont.) Notes (cont.)
Uttily (UK) Limited Uttily (UK) Limited Late submission:
Q1
Wilton Energy Limited Wilton Energy Limited Late submission:
Q1, Q2
Table A3 lists those Licensed Electricity Suppliers that did not submit cleared funds to fulfil their
liability into the Levelisation Fund until after the scheduled deadlines during the period 1 April 2011
- 31 March 2012.
Table A3: Late payments by Licensed Electricity Suppliers into the Levelisation Fund for
the period 1 April 2011 - 31 March 2012.
Supplier Name Electricity Supply Licence Notes
Gazprom Marketing & Trading
Retail Limited
Gazprom Marketing & Trading
Retail Limited
Late payment:
Q1, Q2, Q3
Npower Direct Limited RWE Npower Plc Late payment:
Q1
Spark Energy Supply Limited Spark Energy Supply Limited Late payment:
Q2

Feed-in Tariff (FIT): Annual Report 2011-12
34
Appendix 2: Quarterly Payments to FIT Generators by FIT
Licensees
The following tables provide data on the pre-reconciled total value of payments made to FIT
generators that were reported to Ofgem by all FIT Licensees as part of the Periodic Levelisation
process. The total reconciled payment figures for the whole year are set out in Table 11.
Table A4: FIT Payments 1 April 2011 to 30 June 2011
Licence Name Total FIT
Generation
Payments
Total FIT Export
Payments
Total FIT
Deemed Export
Payments
British Gas Trading £1,005,755.86 £38,032.76 £36,480.18
Co-operative Energy Limited £0.00 £0.00 £0.00
E.ON Energy Limited £1,862,982.25 £68,552.91 £58,160.34
Economy Power Limited £0.00 £0.00 £0.00
EDF Energy Customers Plc £2,320,275.37 £52,341.79 £52,341.79
Electricity Plus Supply Limited £258,280.80 £9,442.12 £9,019.50
Energy 2 Sell Limited £0.00 £0.00 £0.00
Energy CO-OP Limited £0.00 £0.00 £0.00
First Utility Limited £78,747.73 £2,879.11 £2,879.11
Garsington Energy Limited £96,287.96 £7,048.86 £2,632.45
Good Energy Limited £754,153.37 £23,129.27 £23,129.27
Npower Direct Limited £70,318.46 £3,799.88 £3,674.38
Npower Limited - GB £713,786.39 £20,913.84 £20,750.71
Npower Northern Limited £503,985.54 £22,228.20 £21,873.07
Npower Northern Supply Limited £0.00 £0.00 £0.00
Npower Yorkshire Limited £67,906.22 £3,087.82 £3,087.82
Npower Yorkshire Supply Limited £0.00 £0.00 £0.00
Opus Energy (Corporate) Limited £0.00 £0.00 £0.00
Opus Energy Limited £56,827.83 £1,674.60 £899.94
Renewable Energy Company Limited £351,896.63 £14,755.29 £12,417.75
Reuben Power Supply Limited £0.00 £0.00 £0.00
ScottishPower Energy Retail Limited £838,581.09 £35,505.85 £33,214.58
Seeboard Energy Limited £0.00 £0.00 £0.00
Smartest Energy £548,943.57 £0.00 £0.00
South Wales Electricity Limited £0.00 £0.00 £0.00
SSE Energy Supply Limited £1,230.46 £94.54 £28.35
Statkraft Markets GmbH £0.00 £0.00 £0.00
The Energy Data Company Limited £0.00 £0.00 £0.00
Tradelink Solutions Limited £267,940.01 £206.88 £206.88
Utilita Electricity Limited £0.00 £0.00 £0.00
Total £9,797,899.54 £303,693.72 £280,796.12

Feed-in Tariff (FIT): Annual Report 2011-12
35
Table A5: FIT Payments 1 July 2011 to 30 September 2011
Licence Name Total FIT
Generation
Payments
Total FIT Export
Payments
Total FIT
Deemed Export
Payments
British Gas Trading £2,592,390.40 £94,746.86 £92,473.24
Co-operative Energy Limited £0.00 £0.00 £0.00
E.ON Energy Limited £5,613,611.92 £210,055.85 £204,031.36
Economy Power Limited £0.00 £0.00 £0.00
EDF Energy Customers Plc £2,900,121.13 £93,731.54 £91,654.49
Electricity Plus Supply Limited £405,207.68 £14,641.99 £14,163.40
Energy 2 Sell Limited £0.00 £0.00 £0.00
Energy CO-OP Limited £0.00 £0.00 £0.00
First Utility Limited £125,886.42 £4,590.09 £4,590.09
Garsington Energy Limited £78,006.12 £3,867.55 £1,781.02
Good Energy Limited £2,775,607.28 £41,625.70 £41,625.70
Npower Direct Limited £284,604.03 £4,777.74 £4,777.74
Npower Limited - GB £1,015,334.72 £31,116.74 £30,925.84
Npower Northern Limited £976,145.16 £36,083.47 £35,978.82
Npower Northern Supply Limited £0.00 £0.00 £0.00
Npower Yorkshire Limited £116,780.84 £4,315.28 £4,315.28
Npower Yorkshire Supply Limited £0.00 £0.00 £0.00
Opus Energy (Corporate) Limited £0.00 £0.00 £0.00
Opus Energy Limited £82,833.03 £2,568.31 £1,317.98
Renewable Energy Company Limited £441,286.17 £17,996.52 £15,530.09
Reuben Power Supply Limited £0.00 £0.00 £0.00
ScottishPower Energy Retail Limited £2,224,793.10 £90,749.81 £84,674.51
Seeboard Energy Limited £0.00 £0.00 £0.00
Smartest Energy £1,255,609.72 £0.00 £0.00
South Wales Electricity Limited £0.00 £0.00 £0.00
SSE Energy Supply Limited £2,525,661.78 £191,345.49 £71,178.47
Statkraft Markets GmbH £0.00 £0.00 £0.00
The Energy Data Company Limited £0.00 £0.00 £0.00
Tradelink Solutions Limited £320,523.39 £86.29 £86.29
Utilita Electricity Limited £0.00 £0.00 £0.00
Total £23,734,402.89 £842,299.23 £699,104.32

Feed-in Tariff (FIT): Annual Report 2011-12
36
Table A6: FIT Payments 1 October to 31 December 2011
Licence Name Total FIT
Generation
Payments
Total FIT Export
Payments
Total FIT
Deemed Export
Payments
British Gas Trading £3,393,886.99 £122,736.72 £120,501.23
Co-operative Energy Limited £4,386.57 £139.94 £139.94
E.ON Energy Limited £5,631,786.22 £220,322.79 £197,333.79
Economy Power Limited £0.00 £0.00 £0.00
EDF Energy Customers Plc £2,887,571.76 £89,442.39 £80,041.26
Electricity Plus Supply Limited £284,735.56 £10,126.21 £9,959.63
Energy 2 Sell Limited £0.00 £0.00 £0.00
Energy CO-OP Limited £70,615.20 £2,527.79 £2,527.79
First Utility Limited £78,638.34 £2,870.48 £2,870.48
Garsington Energy Limited £440,935.30 £15,907.03 £2,373.02
Good Energy Limited £2,588,955.72 £39,249.02 £39,249.02
Npower Direct Limited £295,855.06 £6,677.63 £6,539.21
Npower Limited - GB £1,358,440.30 £32,239.62 £31,818.73
Npower Northern Limited £997,257.35 £37,995.35 £37,808.44
Npower Northern Supply Limited £0.00 £0.00 £0.00
Npower Yorkshire Limited £173,588.11 £7,153.23 £6,741.30
Npower Yorkshire Supply Limited £0.00 £0.00 £0.00
Opus Energy (Corporate) Limited £95,824.82 £128.80 £66.55
Opus Energy Limited £115,821.85 £4,528.22 £1,039.16
Renewable Energy Company Limited £347,858.27 £13,350.89 £11,415.70
Reuben Power Supply Limited £0.00 £0.00 £0.00
ScottishPower Energy Retail Limited £2,483,802.97 £96,775.58 £92,628.30
Seeboard Energy Limited £0.00 £0.00 £0.00
Smartest Energy £7,617,684.13 £0.00 £0.00
South Wales Electricity Limited £0.00 £0.00 £0.00
SSE Energy Supply Limited £5,520,508.66 £504,719.96 £172,219.75
Statkraft Markets GmbH £0.00 £0.00 £0.00
The Energy Data Company Limited £0.00 £0.00 £0.00
Tradelink Solutions Limited £341,265.66 £1,220.37 £1,220.37
Utilita Electricity Limited £0.00 £0.00 £0.00
Total £34,729,418.84 £1,208,112.02 £816,493.67
Feed-in Tariff (FIT): Annual Report 2011-12
37
Table A7: FIT Payments 1 January 2012 to 31 March 2012
Licence Name Total FIT
Generation
Payments
Total FIT Export
Payments
Total FIT
Deemed Export
Payments
British Gas Trading £3,495,736.94 £127,842.83 £124,789.48
Co-operative Energy Limited £38,795.11 £858.88 £858.88
E.ON Energy Limited £5,866,106.39 £230,810.75 £225,905.24
Economy Power Limited £0.00 £0.00 £0.00
EDF Energy Customers Plc £3,426,070.62 £116,316.52 £106,915.39
Electricity Plus Supply Limited £682,248.90 £24,587.35 £24,431.42
Energy 2 Sell Limited £0.00 £0.00 £0.00
Energy CO-OP Limited £191,118.58 £6,771.26 £6,771.26
First Utility Limited £153,903.36 £5,592.15 £5,592.15
Garsington Energy Limited £333,725.11 £9,212.21 £3,856.71
Good Energy Limited £6,900,455.00 £130,143.00 £130,143.00
Npower Direct Limited £711,883.45 £10,598.26 £10,598.26
Npower Limited - GB £2,978,635.99 £59,155.97 £55,821.45
Npower Northern Limited £2,048,507.82 £79,560.49 £73,507.37
Npower Northern Supply Limited £0.00 £0.00 £0.00
Npower Yorkshire Limited £319,287.22 £12,126.59 £11,714.66
Npower Yorkshire Supply Limited £0.00 £0.00 £0.00
Opus Energy (Corporate) Limited £1,040,581.10 £236.69 £154.01
Opus Energy Limited £253,133.93 £5,905.11 £3,186.55
Renewable Energy Company Limited £691,651.62 £23,790.11 £21,904.17
Reuben Power Supply Limited £0.00 £0.00 £0.00
ScottishPower Energy Retail Limited £2,811,750.32 £116,691.67 £107,514.84
Seeboard Energy Limited £0.00 £0.00 £0.00
Smartest Energy £8,423,222.00 £0.00 £0.00
South Wales Electricity Limited £0.00 £0.00 £0.00
SSE Energy Supply Limited £4,091,140.54 £158,302.77 £119,658.35
Statkraft Markets GmbH £0.00 £0.00 £0.00
The Energy Data Company Limited £0.00 £0.00 £0.00
Tradelink Solutions Limited £1,253,455.22 £33,610.13 £33,610.13
Utilita Electricity Limited £5,513.36 £228.91 £228.91
Total £45,716,922.58 £1,152,341.65 £1,067,162.23
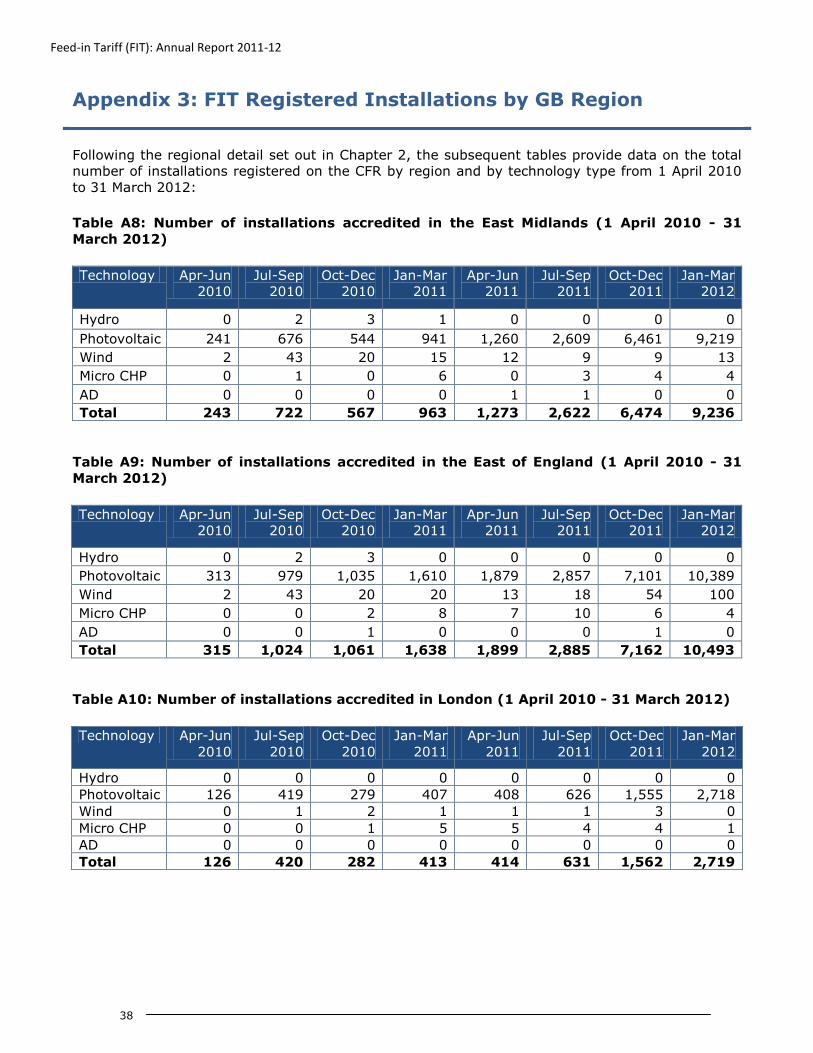
Feed-in Tariff (FIT): Annual Report 2011-12
38
Appendix 3: FIT Registered Installations by GB Region
Following the regional detail set out in Chapter 2, the subsequent tables provide data on the total
number of installations registered on the CFR by region and by technology type from 1 April 2010
to 31 March 2012:
Table A8: Number of installations accredited in the East Midlands (1 April 2010 - 31
March 2012)
Technology Apr-Jun
2010
Jul-Sep
2010
Oct-Dec
2010
Jan-Mar
2011
Apr-Jun
2011
Jul-Sep
2011
Oct-Dec
2011
Jan-Mar
2012
Hydro 0 2 3 1 0 0 0 0
Photovoltaic 241 676 544 941 1,260 2,609 6,461 9,219
Wind 2 43 20 15 12 9 9 13
Micro CHP 0 1 0 6 0 3 4 4
AD 0 0 0 0 1 1 0 0
Total 243 722 567 963 1,273 2,622 6,474 9,236
Table A9: Number of installations accredited in the East of England (1 April 2010 - 31
March 2012)
Technology Apr-Jun
2010
Jul-Sep
2010
Oct-Dec
2010
Jan-Mar
2011
Apr-Jun
2011
Jul-Sep
2011
Oct-Dec
2011
Jan-Mar
2012
Hydro 0 2 3 0 0 0 0 0
Photovoltaic 313 979 1,035 1,610 1,879 2,857 7,101 10,389
Wind 2 43 20 20 13 18 54 100
Micro CHP 0 0 2 8 7 10 6 4
AD 0 0 1 0 0 0 1 0
Total 315 1,024 1,061 1,638 1,899 2,885 7,162 10,493
Table A10: Number of installations accredited in London (1 April 2010 - 31 March 2012)
Technology Apr-Jun
2010
Jul-Sep
2010
Oct-Dec
2010
Jan-Mar
2011
Apr-Jun
2011
Jul-Sep
2011
Oct-Dec
2011
Jan-Mar
2012
Hydro 0 0 0 0 0 0 0 0
Photovoltaic 126 419 279 407 408 626 1,555 2,718
Wind 0 1 2 1 1 1 3 0
Micro CHP 0 0 1 5 5 4 4 1
AD 0 0 0 0 0 0 0 0
Total 126 420 282 413 414 631 1,562 2,719

Feed-in Tariff (FIT): Annual Report 2011-12
39
Table A11: Number of installations accredited in the North East (1 April 2010 - 31 March
2012)
Technology Apr-Jun
2010
Jul-Sep
2010
Oct-Dec
2010
Jan-Mar
2011
Apr-Jun
2011
Jul-Sep
2011
Oct-Dec
2011
Jan-Mar
2012
Hydro 0 3 0 1 0 0 2 0
Photovoltaic 69 122 114 237 268 598 2,514 4,815
Wind 2 19 12 10 7 15 4 13
Micro CHP 0 0 0 2 1 3 1 1
AD 0 0 0 0 0 0 0 0
Total 71 144 126 250 276 616 2,521 4,829
Table A12: Number of installations accredited in the North West (1 April 2010 - 31 March
2012)
Technology Apr-Jun
2010
Jul-Sep
2010
Oct-Dec
2010
Jan-Mar
2011
Apr-Jun
2011
Jul-Sep
2011
Oct-Dec
2011
Jan-Mar
2012
Hydro 0 7 5 4 0 1 2 1
Photovoltaic 147 324 370 725 1,100 1,968 5,100 10,348
Wind 4 48 24 18 10 10 11 10
Micro CHP 0 1 4 3 6 9 4 3
AD 0 0 0 0 0 1 0 0
Total 151 380 403 750 1,116 1,989 5,117 10,362
Table A13: Number of installations accredited in Scotland (1 April 2010 - 31 March 2012)
Technology Apr-Jun
2010
Jul-Sep
2010
Oct-Dec
2010
Jan-Mar
2011
Apr-Jun
2011
Jul-Sep
2011
Oct-Dec
2011
Jan-Mar
2012
Hydro 3 37 12 17 6 5 5 7
Photovoltaic 74 211 154 390 777 2,680 4,467 5,809
Wind 33 203 114 138 71 149 78 131
Micro CHP 0 0 0 5 7 3 6 0
AD 0 0 0 0 0 0 0 0
Total 110 451 280 550 861 2,837 4,556 5,947
Table A14: Number of installations accredited in the South East (1 April 2010 - 31 March
2012)
Technology Apr-Jun
2010
Jul-Sep
2010
Oct-Dec
2010
Jan-Mar
2011
Apr-Jun
2011
Jul-Sep
2011
Oct-Dec
2011
Jan-Mar
2012
Hydro 0 3 1 3 0 0 0 1
Photovoltaic 584 1,920 1,191 2,342 2,500 4,935 10,188 13,503
Wind 1 19 15 12 3 4 4 2
Micro CHP 0 2 5 23 11 13 25 7
AD 0 0 0 0 0 0 0 0
Total 585 1,944 1,212 2,380 2,514 4,952 10,217 13,513

Feed-in Tariff (FIT): Annual Report 2011-12
40
Table A15: Number of installations accredited in the South West (1 April 2010 - 31 March
2012)
Technology Apr-Jun
2010
Jul-Sep
2010
Oct-Dec
2010
Jan-Mar
2011
Apr-Jun
2011
Jul-Sep
2011
Oct-Dec
2011
Jan-Mar
2012
Hydro 0 23 14 7 2 2 2 2
Photovoltaic 528 1,591 1,084 2,153 2,601 5,090 12,352 17,202
Wind 4 90 39 44 23 14 20 33
Micro CHP 0 0 1 9 6 4 5 6
AD 0 0 1 1 0 0 1 1
Total 532 1,704 1,139 2,214 2,632 5,110 12,380 17,244
Table A16: Number of installations accredited in Wales (1 April 2010 - 31 March 2012)
Technology Apr-Jun
2010
Jul-Sep
2010
Oct-Dec
2010
Jan-Mar
2011
Apr-Jun
2011
Jul-Sep
2011
Oct-Dec
2011
Jan-Mar
2012
Hydro 0 24 7 8 3 1 2 5
Photovoltaic 86 310 271 504 777 2,681 4,472 5,810
Wind 3 53 22 17 69 147 74 125
Micro CHP 0 0 1 4 2 1 4 2
AD 0 0 0 0 0 0 0 1
Total 89 387 301 533 851 2,830 4,552 5,943
Table A17: Number of installations accredited in the West Midlands (1 April 2010 - 31
March 2012)
Technology Apr-Jun
2010
Jul-Sep
2010
Oct-Dec
2010
Jan-Mar
2011
Apr-Jun
2011
Jul-Sep
2011
Oct-Dec
2011
Jan-Mar
2012
Hydro 0 3 0 1 0 1 0 0
Photovoltaic 155 454 519 817 1,092 1,950 4,556 6,480
Wind 3 21 20 7 7 6 6 5
Micro CHP 0 1 0 8 6 2 5 2
AD 0 0 0 0 0 0 1 0
Total 158 479 539 833 1,105 1,959 4,568 6,487
Table A18: Number of installations accredited in the Yorkshire and the Humber (1 April
2010 - 31 March 2012)
Technology Apr-Jun
2010
Jul-Sep
2010
Oct-Dec
2010
Jan-Mar
2011
Apr-Jun
2011
Jul-Sep
2011
Oct-Dec
2011
Jan-Mar
2012
Hydro 1 4 2 2 0 0 0 1
Photovoltaic 375 808 1,104 1,253 1,778 2,445 5,588 8,235
Wind 7 91 42 35 27 19 21 29
Micro CHP 0 0 3 5 5 8 2 2
AD 0 0 0 0 1 1 1 0
Total 383 903 1,151 1,295 1,811 2,473 5,612 8,267

Feed-in Tariff (FIT): Annual Report 2011-12
41
Appendix 4: FIT Tariff Tables
Table A19: Feed-in Tariff Payment Rate Table for Photovoltaic Eligible Installations for
FIT Year 3 (2012/13)
The FIT payment rate for an Eligible Installation of a description specified in the first column with
an Eligibility Date on or after 1 April 2010 and before 1 April 2012 is the applicable rate specified in
the corresponding entry in the column for the FIT Year in which the installation‟s Eligibility Date
falls. All rates are in p/kWh.
Description
FIT Year in which the Eligibility Date of an
Eligible Installation falls
FIT Year 1
2010/11
FIT Year 2
2011/12
Anaerobic digestion with Total
Installed Capacity of 250kW or less 12.7
If Eligibility Date is before
30th September 2011 12.7
If Eligibility Date is on or after
30th September 2011 14.7
Anaerobic digestion with Total
Installed Capacity greater than
250kW but not exceeding 500kW
12.7
If Eligibility Date is before
30th September 2011 12.7
If Eligibility Date is on or after
30th September 2011 13.6
Anaerobic digestion with Total
Installed Capacity greater than
500kW
9.9 9.9
Hydro generating station with Total
Installed Capacity of 15kW or less 21.9 21.9
Hydro generating station with Total
Installed Capacity greater than
15kW but not exceeding 100kW
19.6 19.6
Hydro generating station with Total
Installed Capacity greater than
100kW but not exceeding 2MW
12.1 12.1
Hydro generating station with Total
Installed Capacity greater than 2MW 4.9 4.9
Combined Heat and Power with total
installed electrical capacity of 2kW
or less (Tariff available only for
30,000 units)
11.0 11.0
Solar photovoltaic with Total
Installed Capacity of 4kW or less, 39.6
If Eligibility Date is before
3rd March 2012 39.6

Feed-in Tariff (FIT): Annual Report 2011-12
42
Description
FIT Year in which the Eligibility Date of an
Eligible Installation falls
FIT Year 1
2010/11
FIT Year 2
2011/12
where attached to or wired to
provide electricity to a new building
before first occupation
If Eligibility Date is on or
after 3rd March 2012 21.0
Solar photovoltaic with Total
Installed Capacity of 4kW or less,
where attached to or wired to
provide electricity to a building
which is already occupied
45.4
If Eligibility Date is before
3rd March 2012 45.4
If Eligibility Date is on or
after 3rd March 2012 21.0
Solar photovoltaic (other than
stand-alone) with Total Installed
Capacity greater than 4kW but not
exceeding 10kW
39.6
If Eligibility Date is before
3rd March 2012 39.6
If Eligibility Date is on or
after 3rd March 2012 16.8
Solar photovoltaic (other than
stand-alone) with Total Installed
Capacity greater than 10kW but not
exceeding 50kW
34.5
If Eligibility Date is before
3rd March 2012 34.5
If Eligibility Date is on or
after 3rd March 2012 15.2
Solar photovoltaic (other than
stand-alone) with Total Installed
Capacity greater than 50kW but not
exceeding 100kW
34.5
If Eligibility Date is before
1st August 2011 34.5
If Eligibility Date is on or after
1st August 2011 and before
3rd March 2012 19.9
If Eligibility Date is on or
after 3rd March 2012 12.9
Solar photovoltaic (other than
stand-alone) with Total Installed
Capacity greater than 100kW but
not exceeding 150kW
32.2
If Eligibility Date is before
1st August 2011 32.2
If Eligibility Date is on or after
1st August 2011 and before
3rd March 2012 19.9
If Eligibility Date is on or
after 3rd March 2012 12.9
Solar photovoltaic (other than
stand-alone) with Total Installed
Capacity greater than 150kW but
not exceeding 250kW
32.2
If Eligibility Date is before
1st August 2011 32.2
If Eligibility Date is on or after
1st August 2011 and before
3rd March 2012 15.7
If Eligibility Date is on or
after 3rd March 2012 12.9
Solar photovoltaic (other than
stand-alone) with Total Installed 32.2
If Eligibility Date is before
1st August 2011 32.2

Feed-in Tariff (FIT): Annual Report 2011-12
43
Description
FIT Year in which the Eligibility Date of an
Eligible Installation falls
FIT Year 1
2010/11
FIT Year 2
2011/12
Capacity greater than 250kW If Eligibility Date is on or
after 1st August 2011 8.9
Stand-alone (autonomous) solar
photovoltaic (not attached to a
building and not wired to provide
electricity to an occupied building)
32.2
If Eligibility Date is before
1st August 2011 32.2
If Eligibility Date is on or
after 1st August 2011 8.9
Wind with Total Installed Capacity of
1.5kW or less 37.9 37.9
Wind with Total Installed Capacity
greater than 1.5kW but not
exceeding 15 kW
29.3 29.3
Wind with Total Installed Capacity
greater than 15kW but not
exceeding 100kW
26.5 26.5
Wind with Total Installed Capacity
greater than 100kW but not
exceeding 500kW
20.6 20.6
Wind with Total Installed Capacity
greater than 500kW but not
exceeding 1.5MW
10.4 10.4
Wind with Total Installed Capacity
greater than 1.5MW 4.9 4.9
Eligible Installations with a declared
net capacity of 50kW or less
Commissioned on or before 14th
July 2009 and accredited under the
ROO on or before 31st March 2010
9.9 9.9
EXPORT TARIFF 3.2 3.2
All FIT payment rates are pence per kilowatt hour at 2012/13 values.

Feed-in Tariff (FIT): Annual Report 2011-12
44
Appendix 5: Glossary
“Accredited FIT Installation” means an Eligible Installation which the Authority has both
determined is suitable for participation in the FITs and
entered onto the Central FITs Register in accordance with the
FITs Order 2012;
“Anaerobic Digestion”
“Central FIT Register”
means the bacterial fermentation of organic material in the
absence of free oxygen (as defined under the Renewables
Obligation Order 2009);
means the register kept and maintained by the Authority for
the purpose of recording details of FITs Generators, FITs
Installations and other such matters relating to the FITs;
“Commissioned” means, in relation to an Eligible Installation, the completion of
such procedures and tests as constitute, at the time they are
undertaken, the usual industry standards and practices for
commissioning that type of Eligible Installation in order to
demonstrate it is capable of operation;
“Confirmation Date” means the date on which the FITs Generator is entered onto
the Central FITs Register by the Authority, such that its
Eligible Installation becomes an Accredited FITs Installation;
“Deemed Export” means Export from an Accredited FITs Installation which may
be deemed to be a percentage of the equivalent Generation
Meter Reading from the same Accredited FITs Installation and
period, in the event it is not possible or practical to measure it
by way of Export Meter Readings, to be determined in
accordance with the methodology determined by the
Secretary of State as set out in the FITs Order 2012;
“Eligibility Date” means the date as regards a particular Eligible Installation
from which eligibility for FITs Payments commences which
shall be the later of the date:
(a) as applicable, of
(i) receipt by the Authority of a FITs Generator‟s written
request for ROO-FITs Accreditation in a form acceptable
to the Authority; or
(ii) receipt by a FIT Licensee of a FITs Generator‟s
written request for MCS-certified Registration;
(b) on which the Eligible Installation is Commissioned; or
(c) of Implementation;

Feed-in Tariff (FIT): Annual Report 2011-12
45
“Eligible Installation” means, on a Site, any Installation owned by a FITs Generator
capable of producing Small-scale Low-carbon Generation from
the same type of Eligible Low-carbon Energy Source, the
Total Installed Capacity of which does not exceed the
specified maximum Declared Net Capacity;
“Eligible Low-carbon Energy
Source”
means the following sources of energy or technology:
(a) anaerobic digestion, as defined in the ROO;
(b) hydro generating station, as defined in the ROO;
(c) combined heat and power with an electrical capacity of
2kW or less;
(d) solar photovoltaic;
(e) wind,
which may be amended from time to time by the Secretary of
State insofar as the scope remains consistent with the
sources of energy and technologies identified in s.41(5) EA08;
“Export”
means the flow of electricity at any instant in time from an
Eligible Installation onto a distribution system or transmission
system and, if the FIT Licensee so elects, accounted for in
settlement in accordance with the BSC, and Export used as a
verb shall be construed accordingly;
“Export Payment” means the sum paid to the FITs Generator or Nominated
Recipient, as applicable, by a FIT Licensee, for FITs Export in
any period, calculated by reference to the Export Tariff and
Export Meter Reading or Deemed Export Reading;
“Export Tariff” means the payment rate per kilowatt hour for FITs Export
from an Accredited FITs Installation as set out in the FITs
Payment Rate Table at Annex 2 of Schedule A to Standard
Condition 33 of the Electricity Supply Licence;
“Extension” means a modification to an Accredited FITs Installation to
increase its Total Installed Capacity from the same Eligible
Low-carbon Energy Source, and Extend as a verb shall be
construed accordingly;
“FIT Licensee” means the collective term for Mandatory FIT Licensees and
Voluntary FIT Licensees;
“FITs Order” means an order made in accordance with sections 43(3) and
41(1) EA08;
“FITs Payments” means, as applicable, the Generation Payments and/or Export
Payments;

Feed-in Tariff (FIT): Annual Report 2011-12
46
“FITs Scheme” means the scheme for feed-in tariffs introduced in accordance
with sections 41 to 43 EA08, as set out in Standard Condition
33 of the Electricity Supply Licence, and Schedule A to
Standard Condition 33 of the Electricity Supply Licence;
“FITs Year” means the year commencing on 1st April and ending on 31st
March numbered sequentially from FITs Year 1 (being 1st
April 2010 to 31st March 2011);
“Generation Payment” means the sum paid to the FITs Generator or Nominated
Recipient, as applicable, by a FIT Licensee, for the electricity
generated by Accredited FITs Installations in any period,
calculated by reference to the Generation Tariff and
Generation Meter Readings;
“Hydro-Generating Station”
“Levelisation Payment”
means a generating station driven by water (other than a
generating station driven by tidal flows, waves, ocean
currents or geothermal sources) and includes all turbines
supplied with water by or from the same civil works, except
any turbine driven by a compensation flow supplied by or
from those civil works in a natural water course where there
is a statutory obligation to maintain that compensation flow in
that water course (in which case that turbine and associated
infrastructure is to be regarded as a separate hydro
generating station (as defined under the Renewables
Obligation Order 2009);
means the payment required to be made by a FIT Licensee to
the Authority or by the Authority to the FIT Licensee, in
accordance with the Levelisation Process as determined in the
FITs Order 2012;
“Levelisation Process” means the process by which the total cost of the FITs Order
2012 Scheme is allocated between Licensed Electricity
Suppliers in proportion to the size of their share in the
electricity supply market of Great Britain, as determined in
accordance with the FITs Order 2012;
“Mandatory FIT Licensee”
For the purpose of FITs Year 2 (1 April 2011 to 31 March
2012) means a Licensed Electricity Supplier which either:
supplies electricity to at least 50,000 domestic customers;
or
together with its Affiliates jointly supplies electricity to at least
50,000 domestic customers,
as at 31 December before the start of each FITs Year; and
effective on and from the 1 April of the current FITs Year;
“MCS-certified Installation” means an Eligible Installation using an MCS-FITs Technology
which has been recognised by MCS or equivalent as satisfying
relevant equipment and installation standards;

Feed-in Tariff (FIT): Annual Report 2011-12
47
“Owner” means, in relation to any Installation which is the subject of a
hire purchase agreement, a conditional sale agreement or any
agreement of a similar nature, the person in possession of the
Plant under that agreement, and in all other contexts it shall
bear its ordinary meaning, Owned as a verb shall be
construed accordingly;
“Site” means the premises to which are attached one or more
Accredited FITs Installations or Eligible Installations in close
geographical proximity to each other, to be determined as
required by the Authority by reference to:
the relevant Meter Point Administration Number (MPAN) for
electricity supply;
Installation Location address including postcode; or
OS grid reference;
and any other factors which the Authority at its discretion
views as relevant;
“Small-scale Low-carbon
Generation”
means the use, for the generation of electricity, of any Plant:
which, in generating electricity, relies wholly or mainly on an
Eligible Low-carbon Energy Source; and
the Total Installed Capacity of which does not exceed the
specified maximum Declared Net Capacity;
“Specified Maximum Capacity” means the maximum capacity specified in the FITs Order
2012;
“Total Installed Capacity” means the maximum capacity at which an Eligible Installation
could be operated for a sustained period without causing
damage to it (assuming the Eligible Low-carbon Energy
Source was available to it without interruption), a declaration
of which is submitted as part of the processes of ROO-FITs
Accreditation and MCS-certified Registration;
“Voluntary FIT Licensee”
means a licensee which is not a Mandatory FIT Licensee but
which voluntarily elects to participate in making FITs
Payments under the FITs.

Feed-in Tariff (FIT): Annual Report 2011-12
48
Appendix 6: Feedback Questionnaire
We would welcome your feedback on this report, including the length of the document and the
content. Please address your feedback to [email protected]. You may wish to respond to
the following questions in giving your feedback.
Overall
Is the report too long, or too short?
Is the report easy to read and understand? If not, can you please tell us what you would like to
change?
Is the report structured in a way that you can easily find what you are looking for. If not, what
can we do to improve this?
Main document
What part of this report do you find most helpful?
What part of this report do you find least helpful?
Do you think the charts convey information clearly, or not? If not, what do you dislike about the
charts? What can we do to improve our charts?
Appendices
Do you think the appendices contain too much information, or too little?
If too much, which elements are least helpful?
If too little, what other information would you like to see contained in the appendices?
How we will deal with your feedback
This Annual Report is published under the requirements set out in the FIT legislation. It contains
information that we are required to publish. It also contains information that we believe
stakeholders will find useful.
We will endeavour to incorporate all comments into the report. However, we must ensure the
content of the report meets the requirements of the FIT legislation. As such, we may not be able to
incorporate all comments.
Freedom of Information Act 2000
As a public authority, Ofgem is subject to the provisions of the Freedom of Information Act 2000.
Accordingly, any information submitted to a public authority may need to be disclosed under the
Act. If you consider that any of the information you provide is commercially sensitive, please mark it
as such and explain what harm may result from its disclosure. Please be aware that Ofgem may be
obliged under the Act to release information marked as commercially sensitive.

Feed-in Tariff (FIT): Annual Report 2011-12
49