fee negotiation tips and techniques panel discussion
TRANSCRIPT

Provider #: A022
Fee Negotiation Tips and Techniques Panel Discussion
Course Number: CN17FNT

Credit(s) earned on completion of this course will be reported to AIA CES for AIA members. Certificates of Completion for both AIA members and non-AIA members are available upon request.
This course is registered with AIA CES for continuing professional education. As such, it does not include content that may be deemed or construed to be an approval or endorsement by the AIA of any material of construction or any method or manner ofhandling, using, distributing, or dealing in any material or product._______________________________________
Questions related to specific materials, methods, and services will be addressed at the conclusion of this presentation.

Inform and discuss the various methods available in providing architectural/engineering services for the client. Inform and discuss various methods of applying fee structures for the services provided. Discuss the importance of defining the Scope of services.
CourseDescription

LearningObjectives
• Discuss the importance of defining the Scope of Services• Discuss the different types of services provided by the
Architect/Engineers.• Methods of establishing fees for projects. Types of contracts
available for various projects Joint venture projects• Discuss the contractual phases of the project, i.e., pre-contract site
investigation, feasibility studies, conceptual phase, schematic design phase, design development phase, construction document phase, bidding phase, construction administration phase and post construction phase, LEED, etc. How to determine % of fee for each of the various phases of work to be performed. How to allocate fee into the various phases of work.
At the end of the this course, participants will be able to:

Bob’s Pretty Good Architectural Firm
G Neil Harper

Getting Started
On December 31, 2004, Bob opens a bank account, and deposits $10,000 to get his firm started.

Balance Sheet 12/31/04Assets
Cash 10,000Total Assets 10,000
Liabilities 0Net Worth
Shareholders’ Equity 10,000Total Liabilities & Net Worth 10,000

Setting Up Shop
1. Bob very quickly gets his first project: to design a luxury home (projected cost of $3 MM, with a 10% fee = $300,000).
2. He decides to pay himself $100,000 per year
3. In the first year he has been busy promoting his firm and getting his office set up. But he has been able to work 1248 hours on the project.

Chargeable Ratio:
Bob’s chargeable ratio = direct hours charged to project / total hours worked= 1248 / 2080 X 100 = 60%
Thus 60% of Bob’s salary is direct labor charged to project:= .60 X $100,000 = $60,000
Overhead Rate
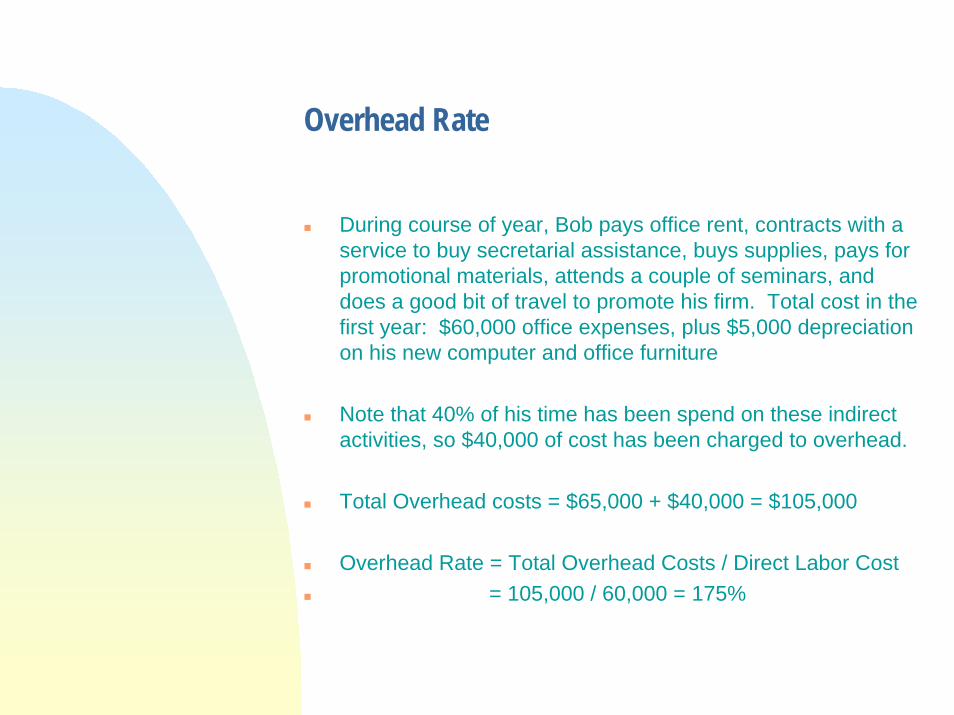
During course of year, Bob pays office rent, contracts with a service to buy secretarial assistance, buys supplies, pays for promotional materials, attends a couple of seminars, and does a good bit of travel to promote his firm. Total cost in the first year: $60,000 office expenses, plus $5,000 depreciation on his new computer and office furniture
Note that 40% of his time has been spend on these indirect activities, so $40,000 of cost has been charged to overhead.
Total Overhead costs = $65,000 + $40,000 = $105,000
Overhead Rate = Total Overhead Costs / Direct Labor Cost= 105,000 / 60,000 = 175%
Effective Multiplier
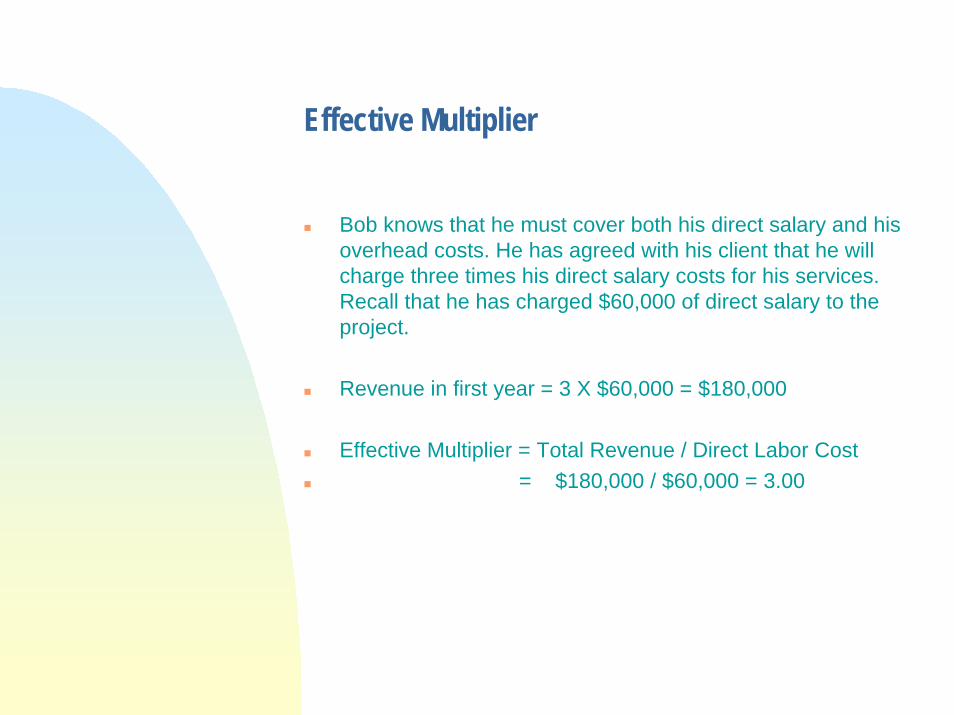
Bob knows that he must cover both his direct salary and his overhead costs. He has agreed with his client that he will charge three times his direct salary costs for his services. Recall that he has charged $60,000 of direct salary to the project.
Revenue in first year = 3 X $60,000 = $180,000
Effective Multiplier = Total Revenue / Direct Labor Cost= $180,000 / $60,000 = 3.00

Income Statementfor Period 1/1/05 - 12/31/05
Revenue 180,000
Direct ExpenseLabor 60,000
Indirect ExpenseLabor 40,000Office 60,000Depreciation 5,000
Total Indirect Expense 105,000
Profit 15,000

Additional Activities in First Year
1. To furnish his office, Bob bought a computer system, some office furniture, and made some leasehold improvements to his rented space. Total investment: $25,0002. To help finance these investments, he got a loan from his bank. Bank loan: $10,0003. At the end of the year, Bob’s client still owed him the lasttwo months’ invoices: Total outstanding: 30,0004. Because he was running low on cash, he was also holding some bills in his desk drawer for secretarial services, rent, and travel expenses. Total owed: $16,000

Balance SheetAs of 12/31/05AssetsCash 1,000Accounts Rec’ble 30,000Plant & Equip 25,000Less Depreciation -5,000Total Assets 51,000
LiabilitiesAccts Payable 16,000Bank Loan 10,000
Total Liabilities 26,000
Net WorthShareholders’ Eq 10,000Retained Earn 15,000
Total Net Worth 25,000
Total Liab & N.W. 51,000
As of 12/31/04Assets
Cash 10,000
Total Assets 10,000
Liabilities
Net WorthShareholders Eq 10,000
Total Liab & NW 10,000

What Happened to the Cash ?
At this point, Bob was happy. He had gotten his office started, and had a satisfied client. He had also turned a profit in his first year of operations.He started out the year with $10,000 of cash, and had made a profit of $15,000.But he was feeling pressed; he had only $1,000 in his checking account.What had happened to his cash?
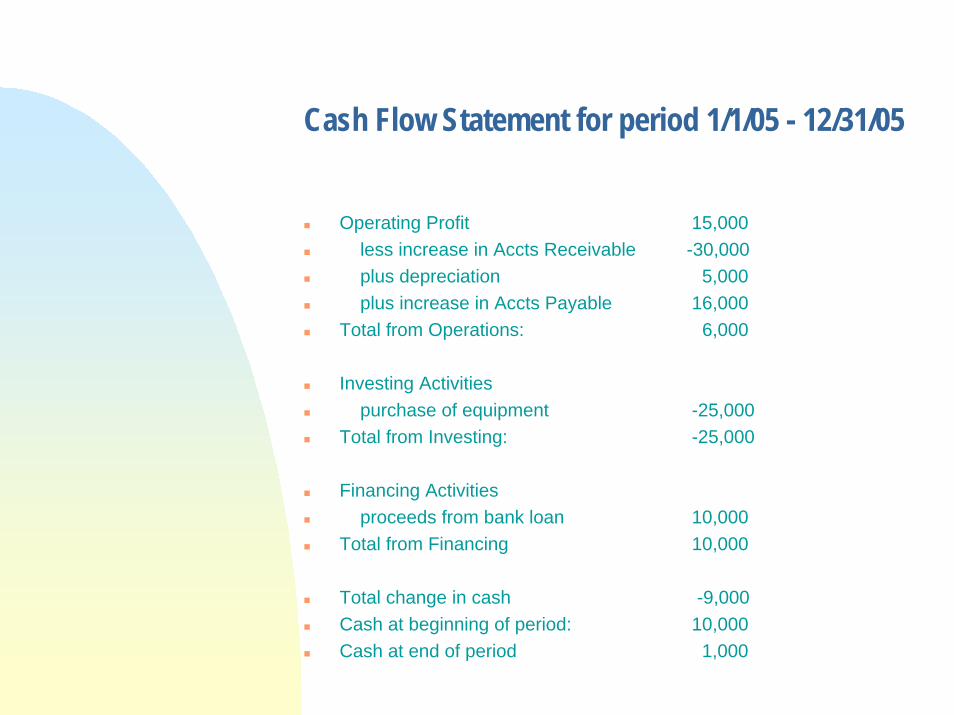
Cash Flow Statement for period 1/1/05 - 12/31/05
Operating Profit 15,000less increase in Accts Receivable -30,000plus depreciation 5,000plus increase in Accts Payable 16,000
Total from Operations: 6,000
Investing Activitiespurchase of equipment -25,000
Total from Investing: -25,000
Financing Activitiesproceeds from bank loan 10,000
Total from Financing 10,000
Total change in cash -9,000Cash at beginning of period: 10,000Cash at end of period 1,000

So What Has Bob Learned ?Bob now felt that he had a pretty good handle on how things were going. He had used and understood three critical indicators that are peculiar to architectural practice:
Chargeable RatioEffective MultiplierOverhead Rate
And he had also learned the importance of the three standard financial statements that every firm must have:
Balance SheetIncome StatementCash Flow Statement
But still, he wondered: Are there some other critical financialindicators that I should be monitoring as my young practice begins to grow? And he wondered how he compared to other firms in the profession.

8 Financial Indicators to Watch:
Bob’s 2005 Industry Survey
Chargeable Ratio % = Total Direct Hours / Total Hrs Worked
60 % 64 %Effective Multiplier = (Earned Revenue – (Reimb + Direct NonLabor Exp)) / Direct Labor
3.00 2.99Overhead Rate % = Total Indirect Expenses / Total Direct Labor
175% 152 %Direct Personnel Expense Factor % = Total cost of all employee benefits / Total cost of “hours worked”
132.6 %Pre-Tax Profit % = Profit before Tax / Gross Revenue
8.33 % 4.14 %Average Age of Accts Receivable (Days) = Accounts Receivable / Average Billing per Day
61 days 77 daysNet Revenue per Total Employee = (Earned Revenue – (Reimb + Direct NonLabor Exp)) / Total Number of Employees
$180,000 $103,000Capital Investment per Employee = Total Assets / Total Number of Employees $51,000 $47,210

BASEBUILDERSMakers of Smart Management Tools forArchitects and Engineers
Accounting Mistake Made by ManyArchitecture and Engineering Firms
Executive OverviewFew of us have taken any accounting courses and even fewer have taken the time to earn an MBA. So when it comes to the accounting side of running our business it most likely is not our strong suit. We also tend to rely on our accounting software to do the dirty work for us.
Since the huge majority of AE firms are small businesses they have chosen to use the number one small business accounting software, QuickBooks. According to surveys done by PSMJ nearly 80% of AE firms in the United States are using QuickBooks.
When QuickBooks creates the accounts for a new company using the template for Architects and Engineers it fails to set up what is needed and the mistake is already made. Read on to discover what the mistake is, why you should care, and how to correct it.
Only One Account for Payroll ExpensesWhen QuickBooks sets up the Chart of Accounts it creates a single expense account for all of your payroll expenses. The challenge with this is you can’t separate your direct costs from your indirect costs (overhead).
With this set up there is no way to calculate three critical factors:
• Overhead Rate - the number of dollars of overhead for every dollar of direct labor.
• Billing Multiplier - net revenues divided by direct labor
• Utilization Rate - direct labor divided by total labor
Second Account for Overhead PayrollYou will need to create a second expense account to track indirect labor payroll costs. These include all of the other payroll expenses including Taxes, Benefits, Holiday, Vacation, PTO, Medical, etc.
But don’t stop there. You also need to include overhead labor for Marketing, Business Development, Continuing Education, Accounting, Administration, etc. The labor costs for these activities are overhead. Once you have a second account set up you will be able to generate your critical factors.
Depending upon how you manage your fees and whether or not you have sub-consultants you may elect to have your Direct Labor be a Cost of Goods Sold rather than an Expense.
™

The Importance of Net FeeCalculating and utilizing your net fee enables you to measure all of your projects on an even playing field. It also allows you to look at national averages and compare your firm to others regardless of discipline.
You see, if you have sub-consultants for most of your projects as part of your gross fee and you calculate your profit as a percentage of the gross fee you are misleading yourself to believe that your profit percentage is rather low. Then you have a project where the sub-consultants contract directly with the owner so your gross fee is much less and you will see a much higher net profit percentage.
By removing the sub-consultants and reimbursable items from the equation you get a much more accurate view of your performance.
This also allows for firms who have a great number of sub-consultants to compare their ratios to firms who have few sub-consultants or none at all.
Overhead Rate and Why It Is ImportantYour Overhead Rate is a very simple calculation. Add your Indirect Labor and General Expenses together. This is your total indirect or overhead cost. Then divide this number by your Direct Labor to get your Overhead Rate.
The national average in the United States is around $1.53. So for every dollar of direct labor that is charged to a project, a $1.53 in overhead is also attributed.
Caution!When you calculate your Indirect Rate, or any other value for that matter, you must use 12 months of data. This enables your annual expenses to get evenly distributed. Any running 12 month period will do, you are not limited to a calendar year. In fact it is best to use the previous 12 months.
Getting to Your Net Fee and Profit
There are at least a couple of opinions about what your net fee equals. For the purpose of this document we will use the following:
! Gross Revenue! (your billings or fees)! - Reimbursables! (subtract these expenses)! - Sub Consultants! (not your money)! Net Fee! (also known as Net Revenue)! - Direct Expenses! (printing, postage, travel, etc.)! - Direct Labor! (cost to do the work)! Gross Profit! (a starting point)! - Indirect Labor! (admin, marketing, etc.)! - General Expenses! (cost to keep doors open)! Operating Profit! (What you made)
Others methods will have you move the Direct Expenses above the Net Fee. I personally like to look at my profits as a percentage of Net Fee to measure our success. In other words, of the money that is ours to work with, what percentage is reaching our bottom line.

Here is where using the overhead factor gets to be fun. With this number you can now calculate the Net Profit for any given project. You can also categorize your projects in summary reports to identify where your best performers lie. Take a look at the insert to the left.
QuickBooks along with many other accounting software packages does not have a way to account for overhead. So QuickBooks can not tell you what your net profits are for a give project or category of projects.
The calculation to the left can and should also be ran on groups of projects. You should look at your project in several different categories such as building type, occupancy, fee structure, location or region, delivery method (design-build vs. plan spec.), private versus public, etc.
With this information you can knowingly target the projects that generate the highest profits for your firm.
Billing MultiplierLike the Overhead Rate in the previous section this is an
important number to use when evaluating the health of your firm and success of your projects. This number is a simple calculation of your Net Fee divided by your Direct Labor. The national average for this number is between a little below to a little above 3. So for every dollar of direct labor there should be around three dollars of Net Fee.
Using this number you can calculate your earned value, or supposed earned value for a project. If a project has $1,000 in direct labor charged to it, then around $3,000 of fee has been earned. Not for it to be earned you would have had to have made progress on the project. If this project has a total fee of $10,000 then you would need to be 30% complete to be on schedule and on target.
Just like I encouraged you to do with your Overhead Rate, you need to calculate your Billing Multiplier for all of your project segments. Armed with this information you will know exactly where to target your marketing and which clients or project types must be avoided.
Utilization RateHere is another number that is a simple to calculate. Take your Direct Labor and divide it by your Total Labor (Direct Labor plus Indirect Labor). This will tell you what percentage of your labor costs are going to generating revenue. How effective your team is.
Now, this can not be calculated for projects because we are comparing project direct costs to overhead costs. But you can use this to compare divisions or studios. Since I have targeted this
It all comes full circleIf your overhead rate is 1.5 and your profit target is 20% then what does your Billing Multiplier need to be? Take your direct rate of 1 and add your overhead rate of 1.5 then divide by 80% (100% - 20%). This gives you 2.5 ÷ .80 = 3.125
Quick Calculation for a Project
! Project Fee! $100,000! - Reimbursables! $2,000! - Sub Consultants! $40,000! Net Fee! $68,000! - Direct Expenses! $3,000! - Direct Labor! $22,900! Gross Profit ! $42,100! - Overhead Factor! $35,000! Project Net Profit ! $7,100
This project might look great if all you see is the Gross Profit, but once you subtract the Overhead Factor you end up with a Net Profits of only $7,100 which is a Net Percentage of only 10.4%.

paper towards small firms you may not have the various groups to measure. But you can measure your firm as a whole and you can look at individuals to see how they are spending their time.
In my experience, healthy firms run between 65% and 75%. This means that the majority of their labor costs are attributed to production. If they fall below these numbers they are in danger of becoming non-profitable.
Having a utilization rate above 80% usually means that not enough time is being dedicated to marketing, education, and other administrative tasks. Note that it is impossible to hit 100% because of holidays, vacations, and other benefits.
You may have a group of production personal who are in the 80’s but you will also have administrative staff in the low teens.
ConclusionNone of these very important indicators can be calculated if you have only one payroll expense account. These numbers are the life blood of your firms and should be studied carefully and often. Keep your project managers in the know so they are aware of where their projects stand.
To stay up on these reports you will need to routinely export your numbers out of QuickBooks and into a spreadsheet where you can run the calculations. While this can become tedious, it is necessary.
Our practice and project management software, Praesto AE, integrates with QuickBooks does this work for you. For more information about our solutions we can be reached as noted below.
About Base BuildersFounded in 2002, Base Builders is the company that brings you innovative Practice and Project Management software solutions. Our goal is to simplify your operational management, increase project management effectiveness, improve profitability and enhance client relations. For more information about our products, please visit www.basebuilders.com.
Base Builders, LLC550 W Plumb Lane, Suite 520Reno, NV 89509Domestic (866) 852-3030International +1 (775) 852-3000www.basebuilders.com
Copyright © 2009, Base Builders, LLC. All Rights Reserved.

Arch 482/582/S02 Services and Compensation Handbook 9.2
November 6, 2002 Page 1
Change over time • from state supported, • to patron supported, • to percentage of construction cost, • to cost-based fees History: Why Architects Don’t Charge Enough 1861 5% of construction cost established as fee, resulting from Richard Morris Hunt lawsuit Set precedent separating architecture as profession from construction trades 1866 5% set as fee on AIA’s “Schedule of Charges” 1888 Hubert v. Aitken: Technical knowledge is a reasonable requirement of an architect 1889 Coombs v. Beede: In addition to technical skill, architects have to possess the aesthetic sense
and capacity to make decisions on the client’s behalf 1908 AIA raises standard fee to 6% 1928 “The strange timidity that Architects display in informing clients of their charges and their
willingness to go forward without any understanding whatever, are disreputable to them as men of affairs. Such conduct leads to misunderstandings, disputes, and litigation.”
1951 Local AIA Chapters publish fee schedules 1966 AIA study: “The Economics of Architectural Practice”, “the average architect loses money
on one job out of four”. 4/5 of firms used % of construction cost fees
1972 Consent Decree: Antitrust Led to move to cost-based compensation 1984 AIA Chicago issued compensation and fee policy statement 1990 Second Consent Decree 1999 AIArchitect study: “Over a quarter of firms indicated that only about half the time do fees
reflect the actual amount of work actually expended.” Context 3 primary reasons for architects unwillingness or inability to obtain good fees
1. Unwilling to walk away from a great commission 2. Lack business training, negotiating skills, or an understanding of real costs 3. Have difficulty explaining the value of what we do
• Traditional emphasis on cost-based compensation has contributed to low profitability • Architects undersell their services • Stiff competition often lowers fees • Firms need to overcome being seen as a commodity service • Architects bring value to projects, and should be paid based on that value Trends • Architects are recognizing the importance of maintaining long-term client accounts, thus flexible
compensation terms are devised to cover many different services, projects, and locations • Alternative delivery methods require new combinations of architectural services and fees • Different service approaches present different risks, which compensation should reward • Client’s needs do not begin with programming and end with construction • Diversification of services has led to increased complexity of definition and pricing of services

Arch 482/582/S02 Services and Compensation Handbook 9.2
November 6, 2002 Page 2
Fixed Fee Continues, (1999) to be Most Popular Contracting Method for Design Services
Percentage of construction costs19%
Hourly rate not to exceed agreed sum14%
Hourly rate10%
Fee plus reimbursable expenses15%
Fixed fee37%
Fee per square foot3%
Percentage of construction costs not to exceed fixed sum
2%
Compared to 1993: How 100 surveyed structured their contracts: (Architectural Record, July 1993) Slightly less than 1/2 of firms: Used only % of const. cost Hourly rates Low Ave. High Houses $30 75 120 Commercial 45 60 90 Educational 40 65 120 Industrial 45 55 70 % of Construction Costs for full services Low Ave. High Houses 6% 10 15 Commercial 3.5 5 8 Educational 4 6 10 Industrial 3 4 6

Arch 482/582/S02 Services and Compensation Handbook 9.2
November 6, 2002 Page 3
STEPS IN DETERMINING COMPENSATION 1. Consult with the client about needs and priorities Client-generated work scope Detailed service requirements as part of a RFP Usual for repetitive or standard assignments Detailed RFP’s may specify program requirements, site conditions, service expectations, required deliverables, and schedules Owner-architect agreements Standard service agreements are useful for defining architectural services Primarily for traditional design and construction projects Owner and Architect can "select from menu", B141 Owner and Architect can agree to "package" of services, B141 Customized work plans and scope descriptions For a set of special services, it is up to the architect to create a custom definition Common Elements: Client goals and objectives for the architect’s services Service tasks and expected work products Key review and decision milestones Schedules of tasks, phases, and milestone dates Requirements for information or services provided by others Allowances for changes or events outside the architect’s control Exclusion and additional services available if needed 2. Identify service strategy, team, and work scope Multiple services over time, or one-time project specific services What services, by whom? What consultants and outside resources will be necessary? 3. Estimate the cost of providing the services Prepare a project budget Compensation worksheets/programs are useful tools Who, what, when, where, how,…..and how much will it cost? 4. Evaluate risk factors and apply an appropriate contingency Fundamental risk: Misunderstanding what is included in the architect’s services Specific risks • Client decision-making and approvals • Scope changes • Third-party project managements • Fast-tracking and construction-driven delivery schedules • Construction cost responsibility and contingency structure • Expected standard of care in design and technical coordination • Financial resources and payment terms

Arch 482/582/S02 Services and Compensation Handbook 9.2
November 6, 2002 Page 4
5. Assess the firms’ value position and add the appropriate profit terms Value positions (Think back to Sparks model) Design preeminence Building type expertise and experience Project leadership capability Unique service methods and tools Some possible valuable contributions Increased sales in a retail environment Decreased occupancy costs Increase leases Increased membership, usage, visitors Increased productivity • Plan for at least a minimum profit target • Know the firm’s competitive position and price accordingly • Assess the value of the project to the firm 6. Compare the proposal with the firm’s past experience Most firms take an early educated guess about basic design service fees based on % of const. Cost Firms should track history of fee earnings and profitability as resource 7. Written Proposal • Description of services covered by proposal • Time schedule for the proposed services • Identification of key tema members • Proposed compensation terms • Assumptions and qualifications upon which the proposal is based • Proposed form of agreement for client’s review and approval 8. Negotiate Negotiate from the client’s point of view 9. Billing and Collection Understand client’s administrative and accounting practices Establish appropriate invoicing and payment terms for services

Arch 482/582/S02 Services and Compensation Handbook 9.2
November 6, 2002 Page 5
COMPENSATION OPTIONS, (How architect will be compensated) Stipulated or Lump Sum Fixed amount related to a specific scope of service Over half of 1999 compensation (Fixed Fee: 37%; Fee plus Reimburseable: 15%) Clients like: Know price up front Large dollar amount up front may be difficult for client to accept Can encourage efficiencies in Arch. office,...Also big losses Most typical for commercial/industrial and institutional For Arch.: Greatest potential of profit and loss of all methods Appropriate: Project scope and quality are well defined Hourly billing rates and fee multipliers, (Cost plus) Time and expenses+profit, (quoted as either multiples or flat rates) 24% of 1999 compensation (Hourly: 10%; Hourly with not to exceed: 14%) Often includes an upset figure, (upper limit) Multiples: 1) Multiple of DSE or DPE, (hourly x multiplier) 2) Hourly or daily billing rates (everything figured in) Useful when there are many unknowns Most typical for residential Owners don't like open-ended nature Owner only pays for what is requested No incentive to arch. for efficient time use For Architect: Guards against losses, limits profit, direct income/work relation Cost plus fixed fee Hourly fee to cover costs, plus a fee for profit Useful when a client doesn’t want a completely open-ended fee arrangement Limits architects’ profit potential, but guards against losses Unit Costs Cost/building or s.f. or repetitive unit, (bed) 3% of 1999 compensation Requires accurate data on costs of providing services Percentage of Construction Cost Ties compensation to construction cost, (rather than scope or services) 21% of 1999 compensation Sometimes includes a "not to exceed" agreed sum Easy for client to budget Common method in institutional work For architect: Income generally well related to work, (based on historical data) Assumes cost of services is related to cost of construction Allows const. market conditions to effect fee Penalizes arch. who reduces const. cost, rewards for increasing const. cost Level of compensation is unknown for a long time Arch. has no incentive to keep construction cost down Compensation methods are often combined, depending on services, within a project

Arch 482/582/S02 Services and Compensation Handbook 9.2
November 6, 2002 Page 6
ARCHITECT'S PRACTICE MANAGE. CONSIDERATIONS Stip
ulat
ed o
r lum
p su
m
Cos
t plu
s w
ithou
t ups
et
Cos
t plu
s w
ith u
pset
Perc
ent c
onst
. cos
t
Uni
t cos
ts
Encourages internal budgeting
Keeps records confidential
Fee adjusts automatically for scope changes
Invoicing is easily understood
Allows for greatest profit but also carries greatest risk
Allows for base profit but protects against loss
Allows for quickest start without negotiation
Permits the firm to guard against "scope creep"
Needs greatest definition of project prior to start-up
Does not penalize architect for project cost savings

Arch 482/582/S02 Services and Compensation Handbook 9.2
November 6, 2002 Page 7
CLIENT NEEDS AND CHARACTERISTICS Stip
ulat
ed o
r lum
p su
m
Cos
t plu
s w
ithou
t ups
et
Cos
t plu
s w
ith u
pset
Perc
ent c
onst
. cos
t
Uni
t cos
ts
Client requires quick start without complete project definition
Client requires accounting detail
Client must have total fee prior to starting project
Client has numerous decision makers
Client has extensive experience in the project type
Client is oriented to lowest fee
Client is developing prototype for many locations

Arch 482/582/S02 Services and Compensation Handbook 9.2
November 6, 2002 Page 8
PROJECT TYPE AND SERVICES Stip
ulat
ed o
r lum
p su
m
Cos
t plu
s w
ithou
t ups
et
Cos
t plu
s w
ith u
pset
Perc
ent c
onst
. cos
t
Uni
t cos
ts
Well defined scope and schedule
Prototype with scope/schedule not well defined
Front-end work required for project definition
Franchise restaurants, (etc.), where scope is clear
Hotel, hospital, or other unit-based project
Facility surveys, int. design, and others on a piece basis
Site adaptation of a prototypical design
Permitting services
Construction contract administration services only

Setting Your Billable RatePOSTED IN TIME TRACKING (HTTPS://GETBRIC.COM/CATEGORY/TIME-TRACKING/)
Calculating your billable rate is both important and challenging. As a professional service 埍�rm you sell an inventory of hours and skills.However you bill your clients — at the end of the day you sell time. You need to make sure that your inventory is properly priced.
Your goal: get the most return for your inventory of time and skills. Set your billable rate too high, you won’t sell enough inventory. Toolow, you won’t generate the revenue you need to cover your costs, grow your business, and generate pro埍�t.
A good place to start is using the average range of $100 to $175 per hour for creative work. However, billable rates are diퟳ�erent based onyour market, specialization, and experience. Let’s explore methods you can use to analyze your billable rates so they are “just right” —maximizing demand and pro埍�ts.
There are several methods for 埍�nding your billable rate. We are going to look at three diퟳ�erent methods that you can use to calculateyour billable rate: billable rate survey, salary multiplies, and trial-and-error.
Billable Rate Survey. One of the best ways to quickly set your billable rates is to conduct a billable rate survey — interviewing peopleabout how much they charge or how much they are willing to pay. Best of all, you can focus your interviews on agencies and clients thatreퟫ�ect your specialization, experience, and market.
However, this method presents some ethical challenges. Competitors don’t want you to know their rates. In fact, most agencies havenon-disclosure agreements with employees and clients that prevent anyone sharing their billable rates. Unless agency owners arewilling to share billable rates, employees and clients can’t help.
Also, asking prospective clients how much they have or would pay puts them in an awkward position. They have an obligation to getthe best deal possible. Even if they provide you with a number, it probably will not represent their true threshold to pay for yourservices. Remember, a survey is only useful if you can trust the results.
So how do you ethically collect billable rates.
Third-party Surveys. The best place to start is using a third-party Billable Rate Survey. For most industries a quick Google Searchwill produce great results. However, you might need to/want to purchase a third-party billable rate survey. For example, 4A’spublishes a great annual billable rate survey (http://www.aaaa.org/news/bulletins/pages/billrate15_06302015.aspx) of the top advertisingagencies in the United States. Even if you end up purchasing a billable rate survey it will be cheaper than conducting your own.
Join a Peer Group. It is common for Industry Associations or business coaches to put together groups of business executives that

Join a Peer Group. It is common for Industry Associations or business coaches to put together groups of business executives thatare in same industry, similar size, and market; and don’t compete against each other. This allow them to share experiences andknowledge without the threat of competition — including billable rates.
Neutral Parties. If you do conduct a survey, you need to 埍�nd people that are neutral. Survey people that don’t compete with youragency, and they aren’t planning to hire your agency. Yet, can provide relevant information about your market, experiencelevel, and specialization. Without biases, they should be able to provide you with an accurate survey of billable rates.
Salaries Multiples. You can also set your billable rate by multiplying salaries divided by employee utilization rate(http://getbric.com/calculating-employee-utilization/). This is an eퟳ�ective method because it ties your billable rates to your clients’ cost ofhiring a full-time person. The multiple is your “reward” for providing your client with ퟫ�exibility, managing the employee, and beingable to recruit and train highly skilled workers.
Another bene埍�t is stability. While salaries will vary based on market, multiples are fairly consistent. This means if your agency spansmultiple markets, you can quickly adjust your billable rates based on adjustments to market salaries — adjustments for the cost ofliving and local competition.
According to AIGA the average salary multiple for Graphic Designers (http://www.aiga.org/setting-rates-for-a-韙�irm/) is between 3.5 to 4.00. It isimportant to note that salary multiples will vary within your creative agency. Typically, agencies can charge higher salary multiples formore junior employees, and lower salary multiples for senior employees. Here are AIGA’s recommendations:
Principal: 2.50
Senior designer: 3.00
Designer: 3.50
Production: 4.00
Student Intern: 4.50
Average for team: 3.50
To 埍�nd billable rates using the salary multiplier use the following formula:
Billable Rate = (Annual Salary/Target Billable Hours (http://getbric.com/calculating-employee-utilization/))*Industry Multiplier
When using salary multiples it is important to be consistent in how you calculate annual salary and target billable hours.
Trial and Error. While you can use industry standards to set your billable rates, you will always need to re埍�ne them. Your creativeagency is not the industry. Your agency is unique. There are two rule of thumbs that indicate that you need to adjust your billing rates— up or down.
Billing Rate Too High. Your billable rates are too high if you are constantly discounting your rates. As much as possible, your billable ratesneed to represent reality. Too many agency owners set their billable rates based on ego, and not what they can actually charge theirclients. This leads a variance between billable time and chargeable time — what they actually invoice.
They might invest 20 billable hours at $250 on a project, and only charge the client for 10 at $150 per hour. They act as if the project is$5,000, while it is only invoicing for $1,500. However, they feel good about billing an above average rate, because they do above averagework. Their clients agree they do great work. Unfortunately, no one is willing to pay their above average rates. Don’t let your ego setyour billable rates.
Billing Rates Too Low. If clients don’t have to think about your proposals — they immediately accept — then you might need to increaseyour billing rates. When thinking about pricing economists use a tool called marginal value versus marginal price. This requires thatthe buyer has to think about if the value of the project is higher than the price. The price isn’t low enough for the answer to be obvious.
There are some ethical issues with Trial and Error. Don’t change your pricing o적ten. This can be seen as manipulating prices, or pricediscrimination — changing prices depending on how much people are willing to pay. While, price discrimination is an economicallysound practice — it allows companies to extract the maximum value from customers — it is societally frowned upon.
In conclusion, your billable rate is the 埍�rst step to running a successful creative agency. It determines the types of client you will workwith — volume and quality, the salaries you can oퟳ�er employees, and whether or not you will have pro埍�ts to reinvest in building theagency of your dreams. Spend some time every year analyzing your billable rates to make sure they are both competitive in the market,and can support your business/dreams.

Call us at 402-679-8398 (tel:4026798398) or send us an email (mailto:[email protected]).© 2017 Bric, all rights reserved. Bric branding and site design by Oxide Design Co (http://oxidedesign.com/).