federally qualified health centers (fqhcs) & medicaid: increasing access, reducing cost,...
TRANSCRIPT

Federally Qualified Health Centers (FQHCs) & Medicaid:
Increasing Access, Reducing Cost, Sustaining Quality
and Improving Health Outcomes
Regan Crump, MSN, DrPHU.S. Department of Health and Human ServicesHealth Resources and Services Administration Office of Planning and EvaluationHealth Systems and Financing Group
Fall 2004 Annual MeetingNational Association of State Medicaid Directors
November 18, 2004

2
The FQHC & Medicaid Partnership
Working together to provide health care for vulnerable populations!
A partnership that generates an outstanding return for State Medicaid Agencies (SMAs)!

3
The FQHC & Medicaid Shared Mission
Improve access to cost effective services for vulnerable populations.
Improve quality of care and health outcomes for Medicaid beneficiaries, including the elimination of health disparities.

4
Eight Facts Supporting the Outstanding Return from FQHCs
Health Centers*…
1. Are a major source of care for Medicaid beneficiaries;
2. Are cost efficient;
*All Section 330-funded health centers are FQHCs.

5
Health Centers*…3. Tailor services to the needs
of the populations and communities you serve;
4. Coordinate care with other providers in the community;
Eight Facts Supporting the Outstanding Return from FQHCs

6
Health Centers…5. Reduce risk and improve
health outcomes for vulnerable populations;
6. Provide high quality care for patients with multiple chronic conditions;
Eight Facts Supporting the Outstanding Return from FQHCs

7
Health Centers*…7. Are strengthened by
technical assistance from linkages at the National, State and local levels;
8. Stand ready to serve Medicaid beneficiaries as your provider of choice.
*All Section 330-funded health centers are FQHCs.
Eight Facts Supporting the Outstanding Return from FQHCs

Health CentersFact #1
Health centers are a major source of care for Medicaid beneficiaries,
serving 4.4 million beneficiaries.
9
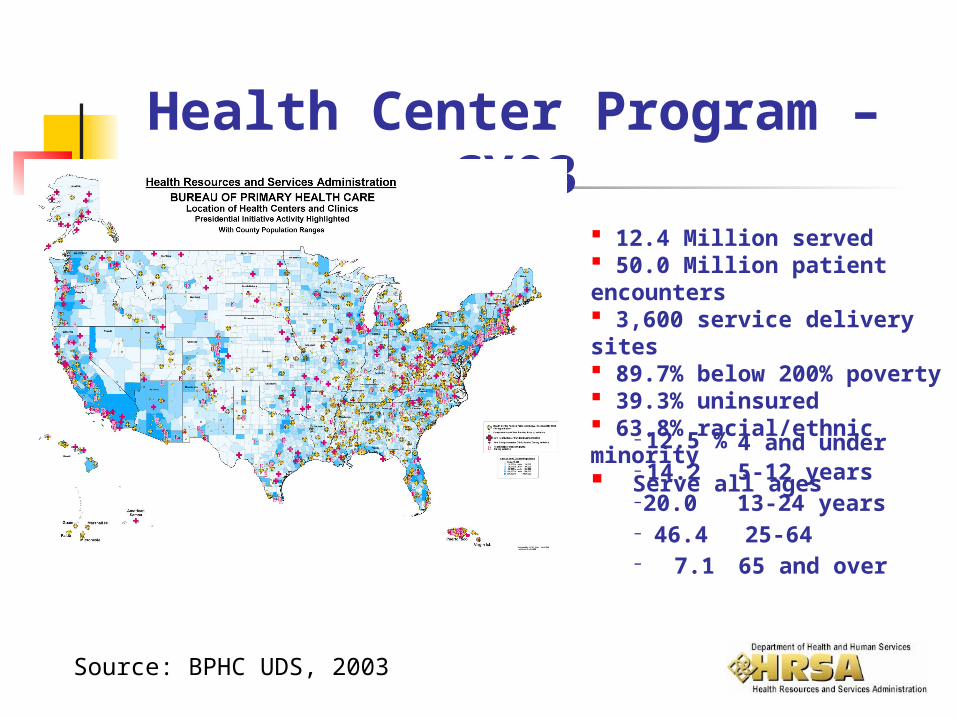
12.4 Million served 50.0 Million patient encounters 3,600 service delivery sites 89.7% below 200% poverty 39.3% uninsured 63.8% racial/ethnic minority Serve all ages
–
12.5 % 4 and under–
14.2 5-12 years–
20.0 13-24 years–
46.4 25-64–
7.1 65 and over
Health Center Program – CY03
Source: BPHC UDS, 2003

10
Health Centers serve:
1 out of 10 Medicaid beneficiaries
1 out of 20 SCHIP beneficiaries
1 out of 7 migrant farmworkers
1 out of 5 homeless persons
Source: BPHC UDS, 2003

11
Medicaid Beneficiaries in Health Centers
Medicaid beneficiaries seen in health centers tripled between 1980 and 2001.1
4.4 million Medicaid beneficiaries were seen in health centers in 2003.2
The number of Medicaid beneficiaries seen in health centers continues to grow.Sources: 1Kaiser Family Foundation
2 BPHC UDS Data, 2003

Health CentersFact #2
Health centers are cost-efficient providers of
care.
13
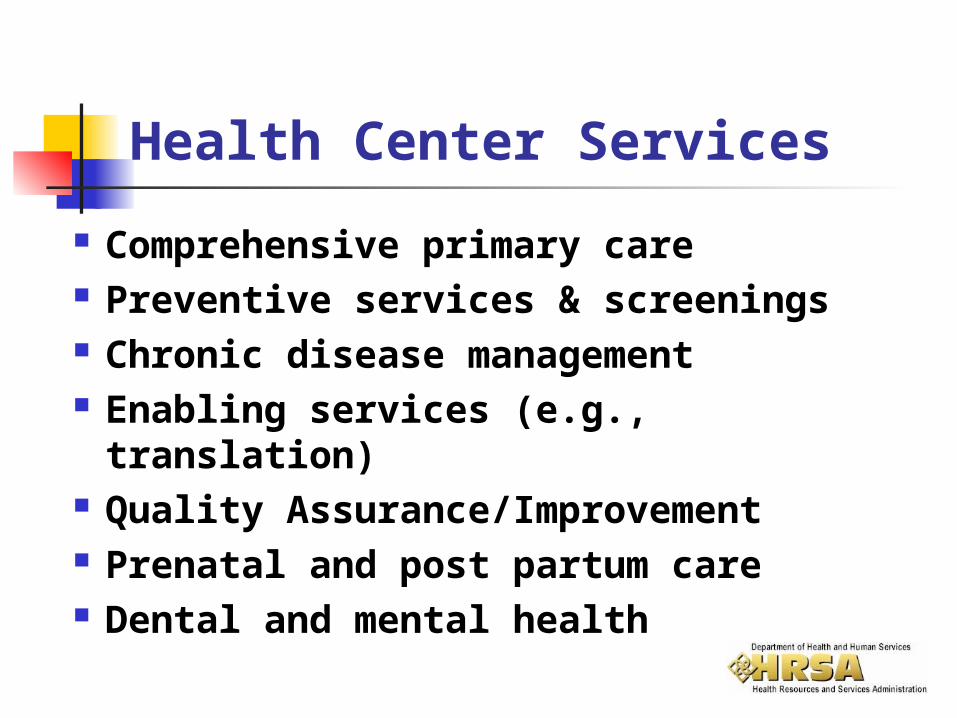
Health Center Services
Comprehensive primary care Preventive services & screenings Chronic disease management Enabling services (e.g., translation) Quality Assurance/Improvement Prenatal and post partum care Dental and mental health

14
Health Centers Provide High Quality Cost-Efficient Care
Cost of treating Health Center Medicaid patients is 30-34% less than cost for those receiving care elsewhere; 26-40% lower for prescription costs; 35% lower for diabetics; 20% lower for asthmatics. Center for Health Policy Studies. Final Report; November 1994.
Health Center Medicaid patients are 22% less likely to be hospitalized for potentially avoidable conditions than those obtaining care elsewhere. Health Center Medicaid patients are less likely to use the ER and less likely to be hospitalized for potentially avoidable conditions than those with a usual source of care who obtained care elsewhere. Falik et al. Medical Care Vol. 39, No 6; 2001.

15
Health Center Medicaid Savings, 2002
1Health Center Medicaid
PatientsIf They Had Gone Elsewhere
$2.4 B
$1.8 B
$600 M
Source: Center for Health Policy Studies, 1994

16
Medicaid Savings through Health Centers
Lower prescription drug costs (340B Drug Pricing Program)
Lower medical costs due to effective chronic disease management
Avoidable hospitalizations prevented

Health CentersFact #3
Health centers tailor services to the needs of
the populations and communities you serve.
18
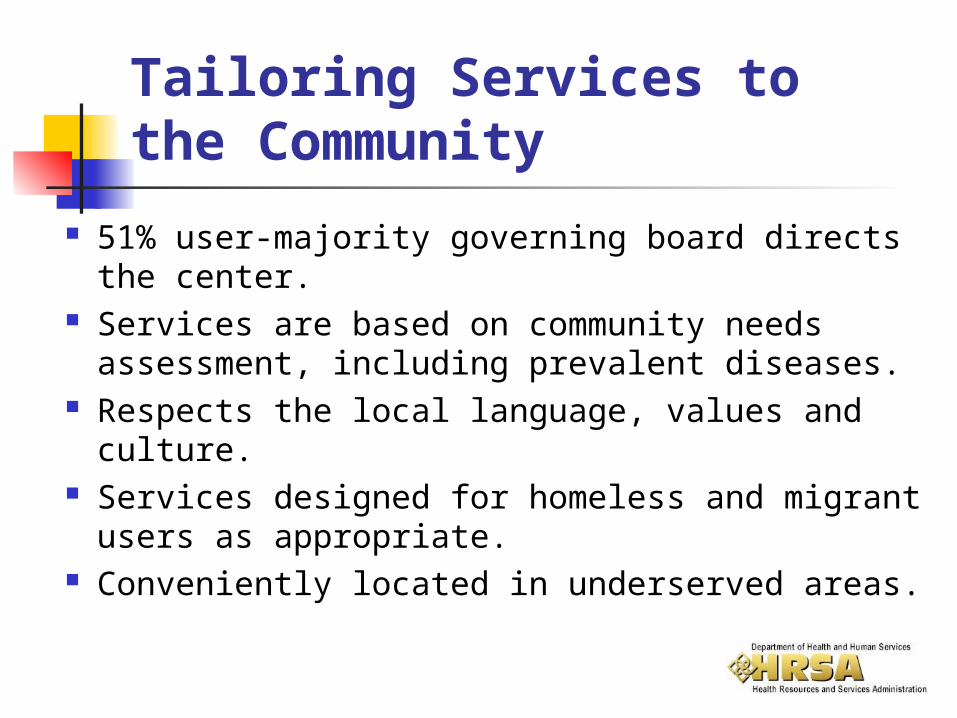
Tailoring Services to the Community
51% user-majority governing board directs the center.
Services are based on community needs assessment, including prevalent diseases.
Respects the local language, values and culture.
Services designed for homeless and migrant users as appropriate.
Conveniently located in underserved areas.

19Sources: BPHC UDS, 2003
U.S. Census, 2000

Health CentersFact #4
Health centers coordinate with other providers in the
community.

21
Health Centers are in Networks
Integrated Service Delivery Initiative (ISDI) Shared, Integrated Management Information
System (SIMIS) Information and Communication
Technology (ICT) Programs Electronic Health Record (EHR) Networks

22
Healthy Communities Access Program (HCAP) networks include Health Centers
Coordinates horizontal and vertical integration
Improves chronic care coordination
Builds information technology systems
Strengthen local safety net infrastructure Strengthen local emphasis on health care for
underserved

23Source: BPHC, KDay June, 2003

Health CentersFact #5
Health centers reduce risk and improve health
outcomes for vulnerable populations.

25
Health Center Plans Outperform Nationin Most Medicaid Preventive Services
0.0%
10.0%
20.0%
30.0%
40.0%
50.0%
60.0%
70.0%
80.0%
90.0%
Childh
ood im
muniz
ation
com
binatio
n 1
Adoles
cent
well c
are
visits
Cervic
al ca
ncer s
cree
ning
Check
ups
afte
r del
ivery
Well-c
hild
visits
, 3-6
yea
r old
s.
Prena
tal c
are in
the fir
st tri
mes
ter
Eye e
xam
s fo
r per
sons
with
dia
bete
s
Childr
en's
acce
ss to
car
e - 1
2-24
mon
ths
Childr
en's
acce
ss to
car
e - 2
5 m
onth
s-6
years
Childr
en's
acce
ss to
car
e - 7
-11 ye
ars
Measures
Per
cen
tag
e
National Medicaid Mean Health Center Mean
Source: 1999 Health Plan Employer Data and Information Set (HEDIS), Partridge, et. al. Based on Performance of Nine Health Center-Based Plans
26
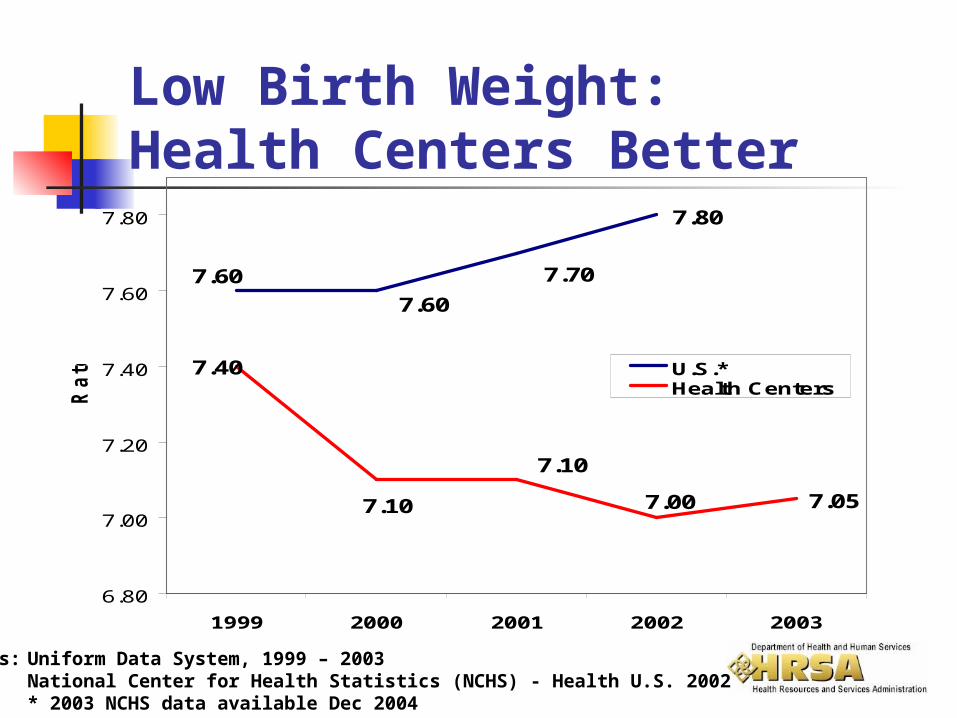
Low Birth Weight: Health Centers Better
Sources: Uniform Data System, 1999 – 2003National Center for Health Statistics (NCHS) - Health U.S. 2002* 2003 NCHS data available Dec 2004
7.80
7.05
7.707.60
7.60
7.00
7.40
7.10
7.10
6.80
7.00
7.20
7.40
7.60
7.80
1999 2000 2001 2002 2003
Ra
te U.S.*Health Centers

27
79
6773
85
55
46
6266
0102030405060708090
Medicaid Uninsured AfricanAmerican
Hispanic
Pro
portio
n o
f P
atie
nts
Scr
eened
Health Center
U.S. Population
Mammography: Health Centers Better
Mammography Screenings Among Health Center Females Remain Higher Than Females Below 200% FPL in the Nation
HP2010 Goal: 70%
For age 40 and over
Sources: 2002 User Visit Survey2000 National Health Interview Survey

28
92
83
9291
84
78
84
78
40
50
60
70
80
90
100
Medicaid Uninsured African American Hispanic
Pro
portio
n of
Fem
ales
Scr
eene
d
Health Center
U.S. Population
Pap Smears: Health Centers Better
Pap Tests Among Health Center Females Remain Higher Than Females Below 200% FLP in the Nation
HP2010 Goal: 90%
For age 18 and over
Sources: 2002 User Visit Survey2000 National Health Interview Survey
Health CentersFact #6
Health centers provide high quality care for patients
with multiple chronic conditions.
30
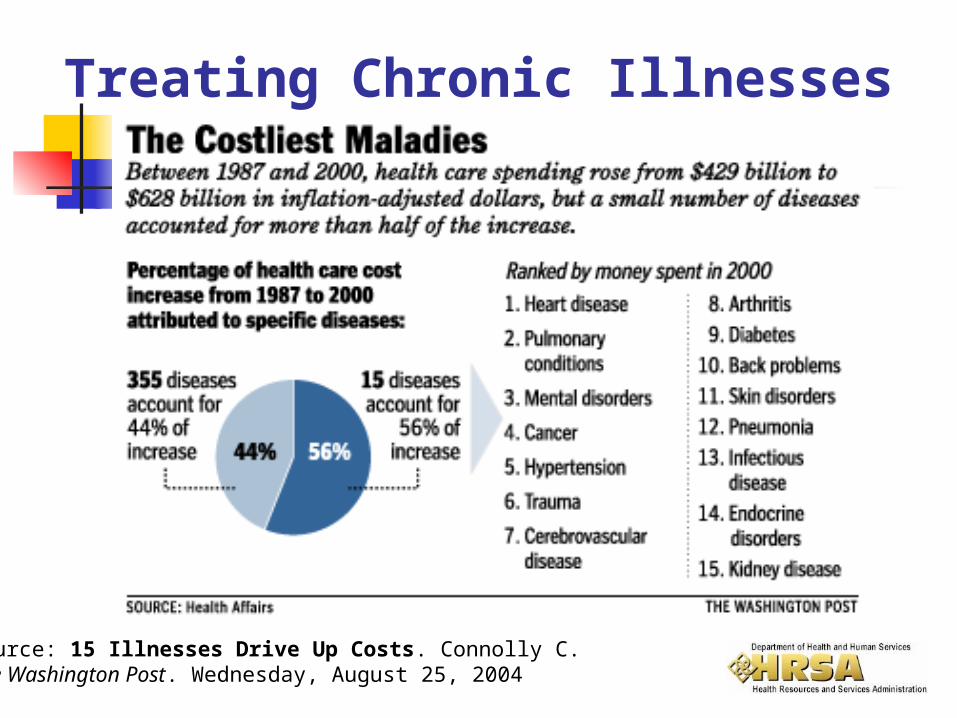
Treating Chronic Illnesses
Source: 15 Illnesses Drive Up Costs. Connolly C. The Washington Post. Wednesday, August 25, 2004

31
Health Centers Provide Leadership in Evidence-based Disease Management
More than half of health centers have participated in at least one Chronic Disease Management Collaborative: Cancer Diabetes Depression Asthma Prevention Perinatal

32
Health Center Chronic Disease Management
3.3
1
0
0.5
1
1.5
2
2.5
3
3.5
Od
ds
Ra
tio
Health CenterPatients
Comparable Group
African Americans & Hispanics with Hypertension at Health Centers are 3 Times as Likely to Report Blood Pressure Under Control as NHIS
Comparable Group
Source: National Health Interview Survey - Measure is 140/90 and hypertension control is self-reported.

33
Collaboratives: A Success in Health Centers
“With federally funded health centers having fully embraced the (Disease Management Collaborative) model…this has become arguably the largest, most important health care quality improvement initiative in the country.
It’s exactly what the health care system needs right now – a demonstration that it is possible both to improve care dramatically and even reduce health care costs.”
Tracy Orleans, Ph.D., senior scientist at the Robert Wood Johnson Foundation Advances Online, Robert Wood Johnson Foundation Newsletter, October 2002

34
Total Registry Size for All DM Collaboratives
0
20000
40000
60000
80000
100000
120000
numb
er of
ptsRegistry Growth – Diabetes Collaboratives
Feb 1999-October 2003
Source: HRSA/BPHC/IHI Contact: Jerry Langley
Email: [email protected]
1,685 PatientsMarch 1999
139,295 PatientsOctober 2003

35
Source: HRSA/BPHC/IHI Contact: Jerry Langley
Email: [email protected]
Summary Measures: Diabetes CollaborativesFeb 2000-Oct 2003
Average HbA1c for DM Patients
8.0
8.1
8.2
8.3
8.4
8.5
8.6
8.7
8.8
aver
age
DM1 teams did not submit until Jun 2000
92,472 PatientsOctober 2003
21,561 Patients
4,343 Patients
36
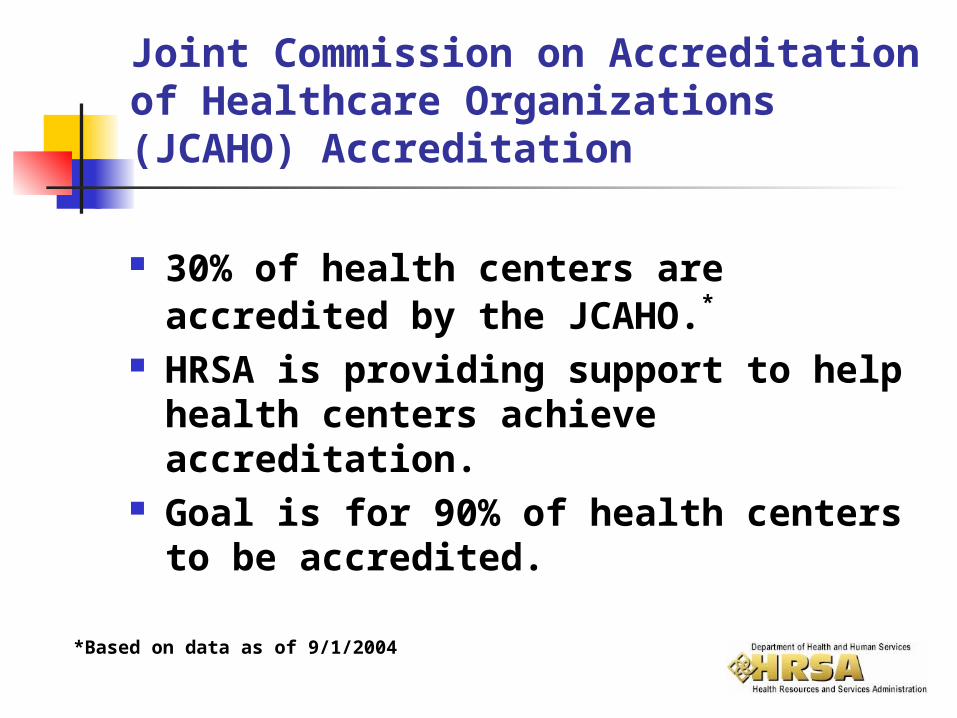
Joint Commission on Accreditation of Healthcare Organizations (JCAHO) Accreditation
30% of health centers are accredited by the JCAHO.*
HRSA is providing support to help health centers achieve accreditation.
Goal is for 90% of health centers to be accredited.
*Based on data as of 9/1/2004
37
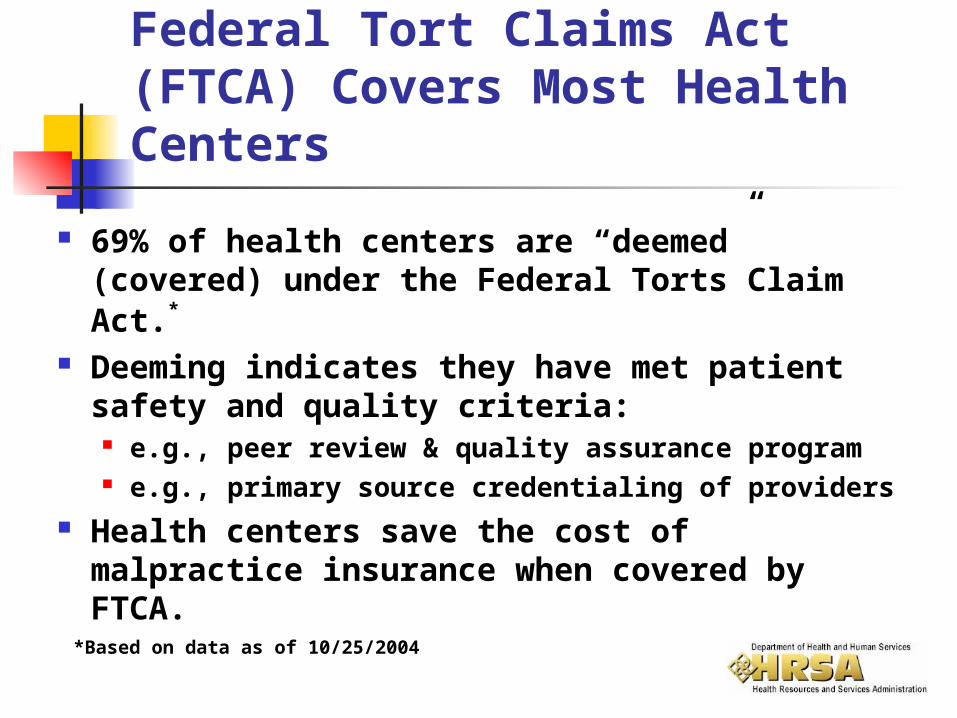
Federal Tort Claims Act (FTCA) Covers Most Health Centers
69% of health centers are “deemed” (covered) under the Federal Torts Claim Act.*
Deeming indicates they have met patient safety and quality criteria:
e.g., peer review & quality assurance program e.g., primary source credentialing of providers
Health centers save the cost of malpractice insurance when covered by FTCA.
*Based on data as of 10/25/2004

Health CentersFact #7
Health center operations are strengthened by technical assistance from linkages at
National, State and local levels.

39
National Linkages for FQHCs HRSA Bureau of Primary Health Care (BPHC)
National Association of Community Health Centers (NACHC)
National Health Care for the Homeless Council (NHCHC)
National Center for Farmworker Health (NCFH)
National Rural Health Association (NRHA)
White House – President’s Health Center Growth Initiative

40
State-Level Linkages for FQHCs
Primary Care Associations (PCAs) Workforce Recruitment Statewide Strategic Planning Emergency Preparedness
Primary Care Offices (PCOs)*
Shortage Area Designations
*Located in State Health Departments
41
Local Linkages for FQHCs
Local health departments
Local hospitals Other primary
care providers
Managed Care Organizations
Specialists Pharmacies
Collaborating with local providers:

42
Local Linkages for FQHCs
Schools & universities
Community-based programs
Medical society
Business groups Employers Faith-based
institutions

Health CentersFact #8
HRSA-funded health centers stand ready to
serve Medicaid beneficiaries as your provider of choice.

44
As Medicaid Providers of Choice, Health Centers…
help SMAs assure access and quality in local provider networks.
accept new Medicaid patients when other providers do not.
are opening new access points in areas of greatest need.

45
Why should SMAs partner with health centers?
They already serve a large number of Medicaid beneficiaries.
They have demonstrated cost-efficiency with drug purchasing, preventing avoidable hospitalizations, and managing chronic disease.

46
They tailor services to the beneficiaries you serve.
They coordinate with other providers in the community.
The quality of care they provide for Medicaid beneficiaries is very high.
Why should SMAs partner with health centers?

47
They improve the health of high risk and high cost populations using state of the art chronic disease management techniques.
The system of support for the health center system is strong – funded by HRSA and others at the national, state and local levels.
Why should SMAs partner with health centers?

48
They share and spread their quality improvement, disease management and cost saving strategies.
They can help you get the kind of return that your State needs.
Why should SMAs partner with health centers?

49
Next Steps to Improve the Value of Partnership with FQHCs
SMAs, health centers and PCAs address issues jointly.
SMAs partner with PCAs in developing Medicaid waiver applications.

50
HRSA, CMS and SMAs exchange pertinent data and information.
Share “best practices” in Medicaid-FQHC partnerships; in writing and in meetings.
Next Steps to Improve the Value of Partnership with FQHCs

51
AMERICA’S HEALTH CENTERSAMERICA’S HEALTH CENTERS
THETHE MODEL FOR PRIMARY HEALTH CARE IN THE UNITED STATES
Increasing Access, Reducing Cost, Sustaining Quality
and Improving Health Outcomes

52
Contact InformationRegan Crump, MSN, DrPH
U.S. Department of Health and Human ServicesHealth Resources and Services AdministrationOffice of Planning and EvaluationDirector, Health Systems and Financing Group5600 Fishers LaneParklawn Building, Room 10-29Rockville, Maryland 20857
Telephone: 301.443.1550Fax: 301.480.0773Email: [email protected]