federal national mortgage association - fannie...
TRANSCRIPT

UNITED STATES SECURITIES AND EXCHANGE COMMISSIONWashington, D.C. 20549
Form 10-QÍ QUARTERLY REPORT PURSUANT TO SECTION 13 OR 15(d) OF THE
SECURITIES EXCHANGE ACT OF 1934
For the quarterly period ended March 31, 2012
OR
‘ TRANSITION REPORT PURSUANT TO SECTION 13 OR 15(d) OF THESECURITIES EXCHANGE ACT OF 1934
For the transition period from to
Commission File No.: 0-50231
Federal National Mortgage Association(Exact name of registrant as specified in its charter)
Fannie Mae
Federally chartered corporation 52-0883107(State or other jurisdiction of
incorporation or organization)(I.R.S. Employer
Identification No.)
3900 Wisconsin Avenue, NWWashington, DC
20016(Zip Code)
(Address of principal executive offices)
Registrant’s telephone number, including area code:(202) 752-7000
Indicate by check mark whether the registrant (1) has filed all reports required to be filed by Section 13 or 15(d)of the Securities Exchange Act of 1934 during the preceding 12 months (or for such shorter period that theregistrant was required to file such reports), and (2) has been subject to such filing requirements for the past90 days. Yes Í No ‘
Indicate by check mark whether the registrant has submitted electronically and posted on its corporate Web site,if any, every Interactive Data File required to be submitted and posted pursuant to Rule 405 of Regulation S-T(§ 232.405 of this chapter) during the preceding 12 months (or for such shorter period that the registrant wasrequired to submit and post such files). Yes Í No ‘
Indicate by check mark whether the registrant is a large accelerated filer, an accelerated filer, a non-acceleratedfiler, or a smaller reporting company. See the definitions of “large accelerated filer,” “accelerated filer” and“smaller reporting company” in Rule 12b-2 of the Exchange Act.
Large accelerated filer ‘ Accelerated filer Í Non-accelerated filer ‘ Smaller reporting company ‘
(Do not check if a smaller reporting company)
Indicate by check mark whether the registrant is a shell company (as defined in Rule 12b-2 of the ExchangeAct). Yes ‘ No Í
As of March 31, 2012, there were 1,158,069,699 shares of common stock of the registrant outstanding.

TABLE OF CONTENTS
Part I—Financial Information . . . . . . . . . . . . . . . . . . . . . . . . . . . . . . . . . . . . . . . . . . . . . . . . . . . . . . . . . 1Item 1. Financial Statements
Condensed Consolidated Balance Sheets . . . . . . . . . . . . . . . . . . . . . . . . . . . . . . . . . . . . . . . . . . 84
Condensed Consolidated Statements of Operations and Comprehensive Income (Loss) . . . . . 85Condensed Consolidated Statements of Cash Flows . . . . . . . . . . . . . . . . . . . . . . . . . . . . . . . . . 86
Note 1—Summary of Significant Accounting Policies . . . . . . . . . . . . . . . . . . . . . . . . . . . . . 87
Note 2—Consolidations and Transfers of Financial Assets . . . . . . . . . . . . . . . . . . . . . . . . . . 91
Note 3—Mortgage Loans . . . . . . . . . . . . . . . . . . . . . . . . . . . . . . . . . . . . . . . . . . . . . . . . . . . . 94
Note 4—Allowance for Loan Losses . . . . . . . . . . . . . . . . . . . . . . . . . . . . . . . . . . . . . . . . . . . 101
Note 5—Investments in Securities . . . . . . . . . . . . . . . . . . . . . . . . . . . . . . . . . . . . . . . . . . . . . 105
Note 6—Financial Guarantees . . . . . . . . . . . . . . . . . . . . . . . . . . . . . . . . . . . . . . . . . . . . . . . . 112
Note 7—Acquired Property, Net . . . . . . . . . . . . . . . . . . . . . . . . . . . . . . . . . . . . . . . . . . . . . . 115
Note 8—Short-Term Borrowings and Long-Term Debt . . . . . . . . . . . . . . . . . . . . . . . . . . . . 116
Note 9—Derivative Instruments . . . . . . . . . . . . . . . . . . . . . . . . . . . . . . . . . . . . . . . . . . . . . . . 117
Note 10—Segment Reporting . . . . . . . . . . . . . . . . . . . . . . . . . . . . . . . . . . . . . . . . . . . . . . . . . 121
Note 11—Concentrations of Credit Risk . . . . . . . . . . . . . . . . . . . . . . . . . . . . . . . . . . . . . . . . 124
Note 12—Fair Value . . . . . . . . . . . . . . . . . . . . . . . . . . . . . . . . . . . . . . . . . . . . . . . . . . . . . . . . 125
Note 13—Commitments and Contingencies . . . . . . . . . . . . . . . . . . . . . . . . . . . . . . . . . . . . . 151
Item 2. Management’s Discussion and Analysis of Financial Condition and Results of Operations . . . 1
Introduction . . . . . . . . . . . . . . . . . . . . . . . . . . . . . . . . . . . . . . . . . . . . . . . . . . . . . . . . . . . . . . . . . 1
Executive Summary . . . . . . . . . . . . . . . . . . . . . . . . . . . . . . . . . . . . . . . . . . . . . . . . . . . . . . . . . . 1
Legislative and Regulatory Developments . . . . . . . . . . . . . . . . . . . . . . . . . . . . . . . . . . . . . . . . . 12
Critical Accounting Policies and Estimates . . . . . . . . . . . . . . . . . . . . . . . . . . . . . . . . . . . . . . . . 16
Consolidated Results of Operations . . . . . . . . . . . . . . . . . . . . . . . . . . . . . . . . . . . . . . . . . . . . . . 17
Business Segment Results . . . . . . . . . . . . . . . . . . . . . . . . . . . . . . . . . . . . . . . . . . . . . . . . . . . . . 28
Consolidated Balance Sheet Analysis . . . . . . . . . . . . . . . . . . . . . . . . . . . . . . . . . . . . . . . . . . . . . 36
Supplemental Non-GAAP Information—Fair Value Balance Sheets . . . . . . . . . . . . . . . . . . . . 40
Liquidity and Capital Management . . . . . . . . . . . . . . . . . . . . . . . . . . . . . . . . . . . . . . . . . . . . . . 44
Off-Balance Sheet Arrangements . . . . . . . . . . . . . . . . . . . . . . . . . . . . . . . . . . . . . . . . . . . . . . . . 52
Risk Management . . . . . . . . . . . . . . . . . . . . . . . . . . . . . . . . . . . . . . . . . . . . . . . . . . . . . . . . . . . . 52
Forward-Looking Statements . . . . . . . . . . . . . . . . . . . . . . . . . . . . . . . . . . . . . . . . . . . . . . . . . . . 79
Item 3. Quantitative and Qualitative Disclosures about Market Risk . . . . . . . . . . . . . . . . . . . . . . . . . . . 155
Item 4. Controls and Procedures . . . . . . . . . . . . . . . . . . . . . . . . . . . . . . . . . . . . . . . . . . . . . . . . . . . . . . . 155
PART II—Other Information . . . . . . . . . . . . . . . . . . . . . . . . . . . . . . . . . . . . . . . . . . . . . . . . . . . . . . . . . 158
Item 1. Legal Proceedings . . . . . . . . . . . . . . . . . . . . . . . . . . . . . . . . . . . . . . . . . . . . . . . . . . . . . . . . . . . . 158
Item 1A. Risk Factors . . . . . . . . . . . . . . . . . . . . . . . . . . . . . . . . . . . . . . . . . . . . . . . . . . . . . . . . . . . . . . . . 159
Item 2. Unregistered Sales of Equity Securities and Use of Proceeds . . . . . . . . . . . . . . . . . . . . . . . . . . 163
Item 3. Defaults Upon Senior Securities . . . . . . . . . . . . . . . . . . . . . . . . . . . . . . . . . . . . . . . . . . . . . . . . . 165
Item 4. Mine Safety Disclosures . . . . . . . . . . . . . . . . . . . . . . . . . . . . . . . . . . . . . . . . . . . . . . . . . . . . . . . 165
Item 5. Other Information . . . . . . . . . . . . . . . . . . . . . . . . . . . . . . . . . . . . . . . . . . . . . . . . . . . . . . . . . . . . 165Item 6. Exhibits . . . . . . . . . . . . . . . . . . . . . . . . . . . . . . . . . . . . . . . . . . . . . . . . . . . . . . . . . . . . . . . . . . . . 165
i
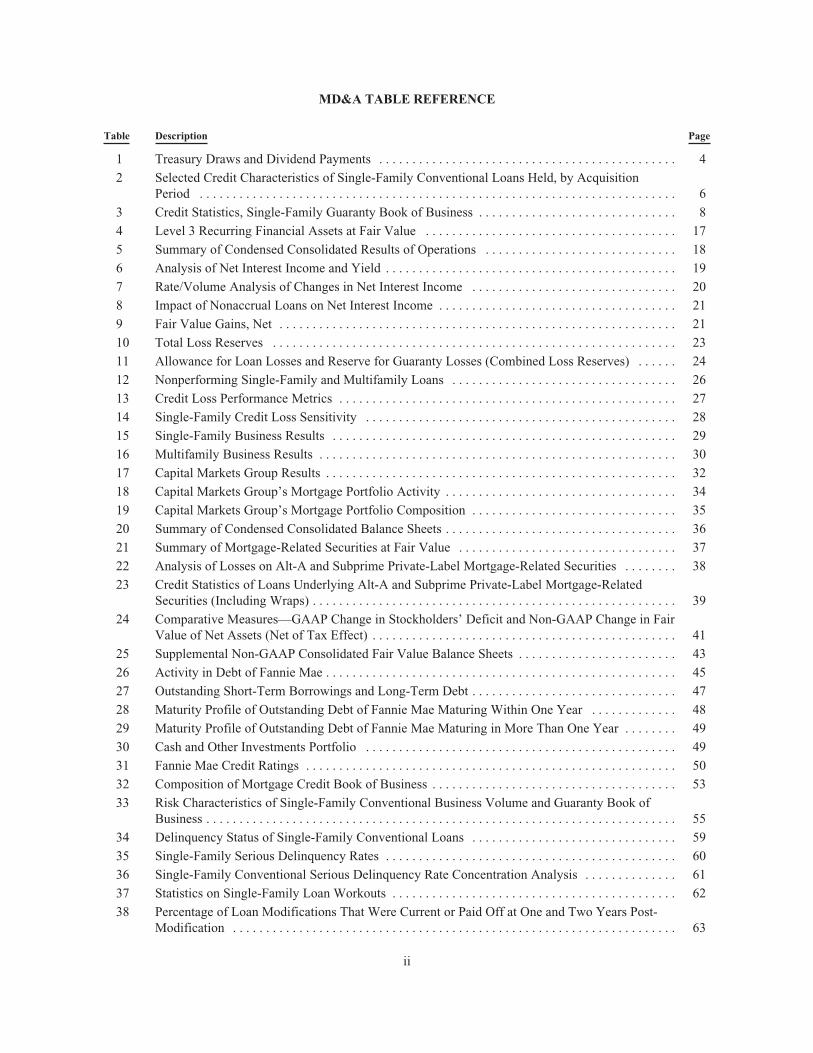
MD&A TABLE REFERENCE
Table Description Page
1 Treasury Draws and Dividend Payments . . . . . . . . . . . . . . . . . . . . . . . . . . . . . . . . . . . . . . . . . . . . . 4
2 Selected Credit Characteristics of Single-Family Conventional Loans Held, by AcquisitionPeriod . . . . . . . . . . . . . . . . . . . . . . . . . . . . . . . . . . . . . . . . . . . . . . . . . . . . . . . . . . . . . . . . . . . . . . . . 6
3 Credit Statistics, Single-Family Guaranty Book of Business . . . . . . . . . . . . . . . . . . . . . . . . . . . . . . 8
4 Level 3 Recurring Financial Assets at Fair Value . . . . . . . . . . . . . . . . . . . . . . . . . . . . . . . . . . . . . . 17
5 Summary of Condensed Consolidated Results of Operations . . . . . . . . . . . . . . . . . . . . . . . . . . . . . 18
6 Analysis of Net Interest Income and Yield . . . . . . . . . . . . . . . . . . . . . . . . . . . . . . . . . . . . . . . . . . . . 19
7 Rate/Volume Analysis of Changes in Net Interest Income . . . . . . . . . . . . . . . . . . . . . . . . . . . . . . . 20
8 Impact of Nonaccrual Loans on Net Interest Income . . . . . . . . . . . . . . . . . . . . . . . . . . . . . . . . . . . . 21
9 Fair Value Gains, Net . . . . . . . . . . . . . . . . . . . . . . . . . . . . . . . . . . . . . . . . . . . . . . . . . . . . . . . . . . . . 21
10 Total Loss Reserves . . . . . . . . . . . . . . . . . . . . . . . . . . . . . . . . . . . . . . . . . . . . . . . . . . . . . . . . . . . . . 23
11 Allowance for Loan Losses and Reserve for Guaranty Losses (Combined Loss Reserves) . . . . . . 24
12 Nonperforming Single-Family and Multifamily Loans . . . . . . . . . . . . . . . . . . . . . . . . . . . . . . . . . . 26
13 Credit Loss Performance Metrics . . . . . . . . . . . . . . . . . . . . . . . . . . . . . . . . . . . . . . . . . . . . . . . . . . . 27
14 Single-Family Credit Loss Sensitivity . . . . . . . . . . . . . . . . . . . . . . . . . . . . . . . . . . . . . . . . . . . . . . . 28
15 Single-Family Business Results . . . . . . . . . . . . . . . . . . . . . . . . . . . . . . . . . . . . . . . . . . . . . . . . . . . . 29
16 Multifamily Business Results . . . . . . . . . . . . . . . . . . . . . . . . . . . . . . . . . . . . . . . . . . . . . . . . . . . . . . 30
17 Capital Markets Group Results . . . . . . . . . . . . . . . . . . . . . . . . . . . . . . . . . . . . . . . . . . . . . . . . . . . . . 32
18 Capital Markets Group’s Mortgage Portfolio Activity . . . . . . . . . . . . . . . . . . . . . . . . . . . . . . . . . . . 34
19 Capital Markets Group’s Mortgage Portfolio Composition . . . . . . . . . . . . . . . . . . . . . . . . . . . . . . . 35
20 Summary of Condensed Consolidated Balance Sheets . . . . . . . . . . . . . . . . . . . . . . . . . . . . . . . . . . . 36
21 Summary of Mortgage-Related Securities at Fair Value . . . . . . . . . . . . . . . . . . . . . . . . . . . . . . . . . 37
22 Analysis of Losses on Alt-A and Subprime Private-Label Mortgage-Related Securities . . . . . . . . 38
23 Credit Statistics of Loans Underlying Alt-A and Subprime Private-Label Mortgage-RelatedSecurities (Including Wraps) . . . . . . . . . . . . . . . . . . . . . . . . . . . . . . . . . . . . . . . . . . . . . . . . . . . . . . . 39
24 Comparative Measures—GAAP Change in Stockholders’ Deficit and Non-GAAP Change in FairValue of Net Assets (Net of Tax Effect) . . . . . . . . . . . . . . . . . . . . . . . . . . . . . . . . . . . . . . . . . . . . . . 41
25 Supplemental Non-GAAP Consolidated Fair Value Balance Sheets . . . . . . . . . . . . . . . . . . . . . . . . 43
26 Activity in Debt of Fannie Mae . . . . . . . . . . . . . . . . . . . . . . . . . . . . . . . . . . . . . . . . . . . . . . . . . . . . . 45
27 Outstanding Short-Term Borrowings and Long-Term Debt . . . . . . . . . . . . . . . . . . . . . . . . . . . . . . . 47
28 Maturity Profile of Outstanding Debt of Fannie Mae Maturing Within One Year . . . . . . . . . . . . . 48
29 Maturity Profile of Outstanding Debt of Fannie Mae Maturing in More Than One Year . . . . . . . . 49
30 Cash and Other Investments Portfolio . . . . . . . . . . . . . . . . . . . . . . . . . . . . . . . . . . . . . . . . . . . . . . . 49
31 Fannie Mae Credit Ratings . . . . . . . . . . . . . . . . . . . . . . . . . . . . . . . . . . . . . . . . . . . . . . . . . . . . . . . . 50
32 Composition of Mortgage Credit Book of Business . . . . . . . . . . . . . . . . . . . . . . . . . . . . . . . . . . . . . 53
33 Risk Characteristics of Single-Family Conventional Business Volume and Guaranty Book ofBusiness . . . . . . . . . . . . . . . . . . . . . . . . . . . . . . . . . . . . . . . . . . . . . . . . . . . . . . . . . . . . . . . . . . . . . . . 55
34 Delinquency Status of Single-Family Conventional Loans . . . . . . . . . . . . . . . . . . . . . . . . . . . . . . . 59
35 Single-Family Serious Delinquency Rates . . . . . . . . . . . . . . . . . . . . . . . . . . . . . . . . . . . . . . . . . . . . 60
36 Single-Family Conventional Serious Delinquency Rate Concentration Analysis . . . . . . . . . . . . . . 61
37 Statistics on Single-Family Loan Workouts . . . . . . . . . . . . . . . . . . . . . . . . . . . . . . . . . . . . . . . . . . . 62
38 Percentage of Loan Modifications That Were Current or Paid Off at One and Two Years Post-Modification . . . . . . . . . . . . . . . . . . . . . . . . . . . . . . . . . . . . . . . . . . . . . . . . . . . . . . . . . . . . . . . . . . . 63
ii

Table Description Page
39 Single-Family Foreclosed Properties . . . . . . . . . . . . . . . . . . . . . . . . . . . . . . . . . . . . . . . . . . . . . . . . 64
40 Single-Family Foreclosed Property Status . . . . . . . . . . . . . . . . . . . . . . . . . . . . . . . . . . . . . . . . . . . . 65
41 Multifamily Lender Risk-Sharing . . . . . . . . . . . . . . . . . . . . . . . . . . . . . . . . . . . . . . . . . . . . . . . . . . . 66
42 Multifamily Guaranty Book of Business Key Risk Characteristics . . . . . . . . . . . . . . . . . . . . . . . . . 66
43 Multifamily Concentration Analysis . . . . . . . . . . . . . . . . . . . . . . . . . . . . . . . . . . . . . . . . . . . . . . . . . 67
44 Multifamily Foreclosed Properties . . . . . . . . . . . . . . . . . . . . . . . . . . . . . . . . . . . . . . . . . . . . . . . . . . 68
45 Repurchase Request Activity . . . . . . . . . . . . . . . . . . . . . . . . . . . . . . . . . . . . . . . . . . . . . . . . . . . . . . 70
46 Outstanding Repurchase Requests . . . . . . . . . . . . . . . . . . . . . . . . . . . . . . . . . . . . . . . . . . . . . . . . . . 70
47 Mortgage Insurance Coverage . . . . . . . . . . . . . . . . . . . . . . . . . . . . . . . . . . . . . . . . . . . . . . . . . . . . . 72
48 Rescission Rates of Mortgage Insurance Claims . . . . . . . . . . . . . . . . . . . . . . . . . . . . . . . . . . . . . . . 73
49 Estimated Mortgage Insurance Benefit . . . . . . . . . . . . . . . . . . . . . . . . . . . . . . . . . . . . . . . . . . . . . . . 74
50 Unpaid Principal Balance of Financial Guarantees . . . . . . . . . . . . . . . . . . . . . . . . . . . . . . . . . . . . . 74
51 Interest Rate Sensitivity of Net Portfolio to Changes in Interest Rate Level and Slope of YieldCurve . . . . . . . . . . . . . . . . . . . . . . . . . . . . . . . . . . . . . . . . . . . . . . . . . . . . . . . . . . . . . . . . . . . . . . . . . 78
52 Derivative Impact on Interest Rate Risk (50 Basis Points) . . . . . . . . . . . . . . . . . . . . . . . . . . . . . . . . 79
iii

PART I—FINANCIAL INFORMATION
Item 2. Management’s Discussion and Analysis of Financial Condition and Results of Operations
We have been under conservatorship, with the Federal Housing Finance Agency (“FHFA”) acting asconservator, since September 6, 2008. As conservator, FHFA succeeded to all rights, titles, powers andprivileges of the company, and of any shareholder, officer or director of the company with respect to thecompany and its assets. The conservator has since delegated specified authorities to our Board of Directorsand has delegated to management the authority to conduct our day-to-day operations. Our directors do nothave any duties to any person or entity except to the conservator and, accordingly, are not obligated toconsider the interests of the company, the holders of our equity or debt securities or the holders of FannieMae MBS unless specifically directed to do so by the conservator. We describe the rights and powers of theconservator, key provisions of our agreements with the U.S. Department of the Treasury (“Treasury”), andtheir impact on shareholders in our Annual Report on Form 10-K for the year ended December 31, 2011(“2011 Form 10-K”) in “Business—Conservatorship and Treasury Agreements.”
You should read this Management’s Discussion and Analysis of Financial Condition and Results of Operations(“MD&A”) in conjunction with our unaudited condensed consolidated financial statements and related notesand the more detailed information in our 2011 Form 10-K.
This report contains forward-looking statements that are based on management’s current expectations and aresubject to significant uncertainties and changes in circumstances. Please review “Forward-Looking Statements”for more information on the forward-looking statements in this report. Our actual results may differ materiallyfrom those reflected in these forward-looking statements due to a variety of factors including, but not limited to,those described in “Risk Factors” and elsewhere in this report and in “Risk Factors” in our 2011 Form 10-K.
You can find a “Glossary of Terms Used in This Report” in the “MD&A” of our 2011 Form 10-K.
INTRODUCTION
Fannie Mae is a government-sponsored enterprise (“GSE”) that was chartered by Congress in 1938. Our publicmission is to support liquidity and stability in the secondary mortgage market, where existing mortgage-relatedassets are purchased and sold, and increase the supply of affordable housing. Our charter does not permit us tooriginate loans and lend money directly to consumers in the primary mortgage market. Our most significantactivity is securitizing mortgage loans originated by lenders into Fannie Mae mortgage-backed securities that weguarantee, which we refer to as Fannie Mae MBS. We also purchase mortgage loans and mortgage-relatedsecurities for our mortgage portfolio. We use the term “acquire” in this report to refer to both our guarantees andour purchases of mortgage loans. We obtain funds to support our business activities by issuing a variety of debtsecurities in the domestic and international capital markets.
We are a corporation chartered by the U.S. Congress. Our conservator, FHFA, is a U.S. government agency.Treasury owns our senior preferred stock and a warrant to purchase 79.9% of our common stock. Moreover,Treasury has made a commitment under a senior preferred stock purchase agreement to provide us with fundsunder specified conditions and, after 2012, up to a maximum amount, to maintain a positive net worth. The U.S.government does not guarantee our securities or other obligations.
Our common stock is traded in the over-the-counter market and quoted on the OTC Bulletin Board under thesymbol “FNMA.” Our debt securities are actively traded in the over-the-counter market.
EXECUTIVE SUMMARY
The actions we have been taking since 2009 to provide liquidity and support to the market, grow a strong newbook of business and minimize losses on loans we acquired prior to 2009 are having a positive impact on ourbusiness and our performance:
• Financial Results. Despite ongoing weakness in the housing and mortgage markets, we experiencedsignificant improvement in our financial results for the first quarter of 2012, as compared with the first
1
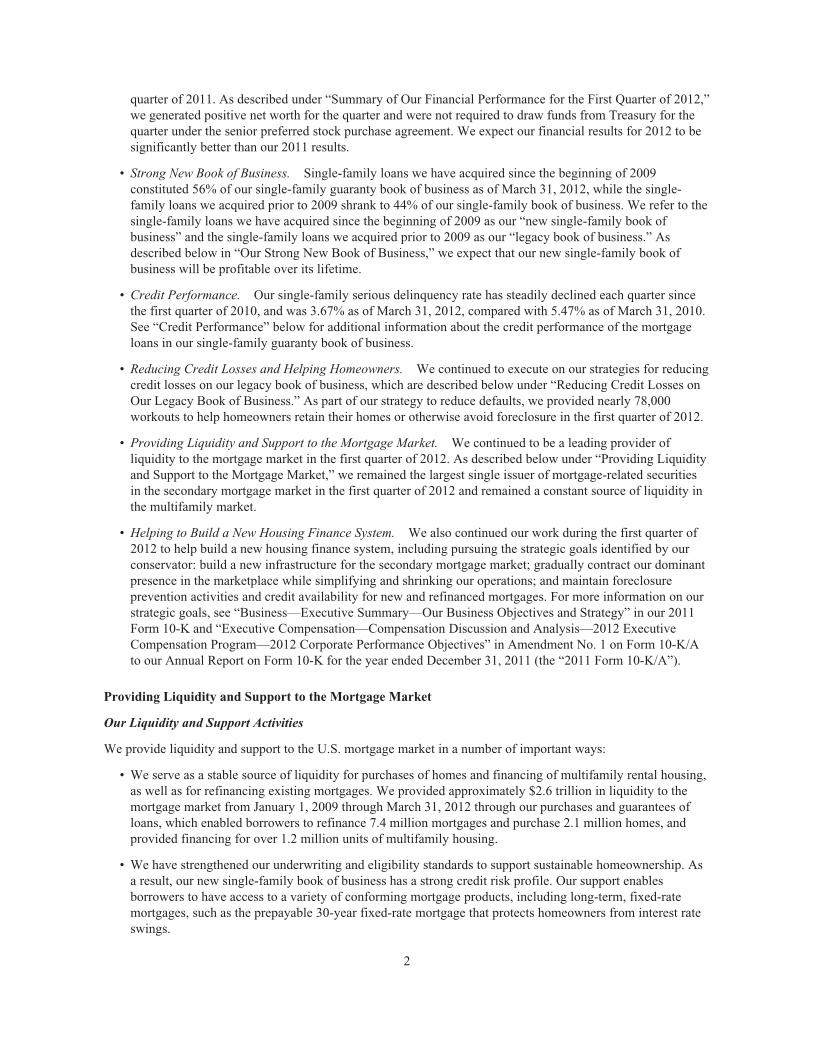
quarter of 2011. As described under “Summary of Our Financial Performance for the First Quarter of 2012,”we generated positive net worth for the quarter and were not required to draw funds from Treasury for thequarter under the senior preferred stock purchase agreement. We expect our financial results for 2012 to besignificantly better than our 2011 results.
• Strong New Book of Business. Single-family loans we have acquired since the beginning of 2009constituted 56% of our single-family guaranty book of business as of March 31, 2012, while the single-family loans we acquired prior to 2009 shrank to 44% of our single-family book of business. We refer to thesingle-family loans we have acquired since the beginning of 2009 as our “new single-family book ofbusiness” and the single-family loans we acquired prior to 2009 as our “legacy book of business.” Asdescribed below in “Our Strong New Book of Business,” we expect that our new single-family book ofbusiness will be profitable over its lifetime.
• Credit Performance. Our single-family serious delinquency rate has steadily declined each quarter sincethe first quarter of 2010, and was 3.67% as of March 31, 2012, compared with 5.47% as of March 31, 2010.See “Credit Performance” below for additional information about the credit performance of the mortgageloans in our single-family guaranty book of business.
• Reducing Credit Losses and Helping Homeowners. We continued to execute on our strategies for reducingcredit losses on our legacy book of business, which are described below under “Reducing Credit Losses onOur Legacy Book of Business.” As part of our strategy to reduce defaults, we provided nearly 78,000workouts to help homeowners retain their homes or otherwise avoid foreclosure in the first quarter of 2012.
• Providing Liquidity and Support to the Mortgage Market. We continued to be a leading provider ofliquidity to the mortgage market in the first quarter of 2012. As described below under “Providing Liquidityand Support to the Mortgage Market,” we remained the largest single issuer of mortgage-related securitiesin the secondary mortgage market in the first quarter of 2012 and remained a constant source of liquidity inthe multifamily market.
• Helping to Build a New Housing Finance System. We also continued our work during the first quarter of2012 to help build a new housing finance system, including pursuing the strategic goals identified by ourconservator: build a new infrastructure for the secondary mortgage market; gradually contract our dominantpresence in the marketplace while simplifying and shrinking our operations; and maintain foreclosureprevention activities and credit availability for new and refinanced mortgages. For more information on ourstrategic goals, see “Business—Executive Summary—Our Business Objectives and Strategy” in our 2011Form 10-K and “Executive Compensation—Compensation Discussion and Analysis—2012 ExecutiveCompensation Program—2012 Corporate Performance Objectives” in Amendment No. 1 on Form 10-K/Ato our Annual Report on Form 10-K for the year ended December 31, 2011 (the “2011 Form 10-K/A”).
Providing Liquidity and Support to the Mortgage Market
Our Liquidity and Support Activities
We provide liquidity and support to the U.S. mortgage market in a number of important ways:
• We serve as a stable source of liquidity for purchases of homes and financing of multifamily rental housing,as well as for refinancing existing mortgages. We provided approximately $2.6 trillion in liquidity to themortgage market from January 1, 2009 through March 31, 2012 through our purchases and guarantees ofloans, which enabled borrowers to refinance 7.4 million mortgages and purchase 2.1 million homes, andprovided financing for over 1.2 million units of multifamily housing.
• We have strengthened our underwriting and eligibility standards to support sustainable homeownership. Asa result, our new single-family book of business has a strong credit risk profile. Our support enablesborrowers to have access to a variety of conforming mortgage products, including long-term, fixed-ratemortgages, such as the prepayable 30-year fixed-rate mortgage that protects homeowners from interest rateswings.
2

• We helped over 1,000,000 homeowners retain their homes or otherwise avoid foreclosure from January 1,2009 through March 31, 2012, which helped to support neighborhoods, home prices and the housing market.Moreover, borrowers’ ability to pay their modified loans has improved in recent periods as we haveenhanced the structure of our modifications. One year after modification, 74% of the modifications we madein the first quarter of 2011 were current or paid off, compared with 65% of the modifications we made in thefirst quarter of 2010.
• We helped borrowers refinance loans through our Refi Plus™ initiative, which includes loans refinancedunder the Obama Administration’s Home Affordable Refinance Program (“HARP”). The Refi Plus initiativeprovides expanded refinance opportunities for eligible Fannie Mae borrowers. From April 1, 2009, the datewe began accepting delivery of Refi Plus loans, through March 31, 2012, we have acquired approximately2,000,000 loans refinanced under our Refi Plus initiative. Refinances delivered to us through Refi Plus inthe first quarter of 2012 reduced borrowers’ monthly mortgage payments by an average of $191. Someborrowers’ monthly payments increased as they took advantage of the ability to refinance through Refi Plusto reduce the term of their loan, to switch from an adjustable-rate mortgage to a fixed rate mortgage, or toswitch from an interest-only mortgage to a fully amortizing mortgage.
• We support affordability in the multifamily rental market. Over 85% of the multifamily units we financedfrom 2009 through 2011 were affordable to families earning at or below the median income in their area.
• In addition to purchasing and guaranteeing loans, we provide funds to the mortgage market through short-term financing and other activities. These activities are described in more detail in our 2011 Form 10-K in“Business—Business Segments—Capital Markets.”
2012 Acquisitions and Market Share
In the first quarter of 2012, we purchased or guaranteed approximately $221 billion in loans, measured by unpaidprincipal balance, which includes $14.2 billion in delinquent loans we purchased from our single-family MBStrusts. These activities enabled our lender customers to finance approximately 934,000 single-familyconventional loans and loans for approximately 117,000 units in multifamily properties during the first quarter of2012.
We remained the largest single issuer of mortgage-related securities in the secondary market during the firstquarter of 2012, with an estimated market share of new single-family mortgage-related securities issuances of51%. Our estimated market share of new single-family mortgage-related securities issuances was 54% in thefourth quarter of 2011 and 49% in the first quarter of 2011.
We remained a constant source of liquidity in the multifamily market. We owned or guaranteed approximately21% of the outstanding debt on multifamily properties as of December 31, 2011 (the latest date for whichinformation was available).
Summary of Our Financial Performance for the First Quarter of 2012
We experienced a significant improvement in our financial results in the first quarter of 2012 compared with thefirst quarter of 2011, even though our results continued to be impacted by weakness in the housing and mortgagemarkets.
Total Comprehensive Income (Loss)
We recognized total comprehensive income of $3.1 billion in the first quarter of 2012, consisting of net incomeof $2.7 billion and other comprehensive income of $362 million. In comparison, we recognized a totalcomprehensive loss of $6.3 billion in the first quarter of 2011, consisting of a net loss of $6.5 billion and othercomprehensive income of $181 million.
The significant improvement in our financial results in the first quarter of 2012 compared with the first quarter of2011 was due to an $8.7 billion decrease in our credit-related expenses, primarily driven by: (1) a less significantdecline in home prices as the housing market continued to stabilize; we estimate that home prices declined by
3

0.8% in the first quarter of 2012 compared with a 2.0% decline in the first quarter of 2011, which representedover half of the 2011 home price decline; (2) a 25% decline in our inventory of single-family real-estate owned(“REO”) properties compared with the first quarter of 2011 coupled with improved sales prices on dispositionsof our REO properties resulting from strong demand in markets with limited REO supply; and (3) lower single-family serious delinquency rates, which declined to 3.67% as of the end of the first quarter of 2012 from 4.27%as of the end of the first quarter of 2011. We discuss below our expectations regarding our future credit-relatedexpenses and loss reserves.
See “Consolidated Results of Operations” for more information on our results.
Net Worth
Our net worth of $268 million as of March 31, 2012 reflects our total comprehensive income of $3.1 billionlargely offset by our payment to Treasury of $2.8 billion in senior preferred stock dividends during the firstquarter of 2012.
In the first quarter of 2012, we received $4.6 billion in funds from Treasury to eliminate our net worth deficit asof December 31, 2011. As a result of our positive net worth as of March 31, 2012, we will not request a draw thisquarter from Treasury under the senior preferred stock purchase agreement. The aggregate liquidation preferenceon the senior preferred stock remains at $117.1 billion, which requires an annualized dividend payment of $11.7billion. The amount of this dividend payment exceeds our reported annual net income for every year since ourinception. As of March 31, 2012, we have paid an aggregate of $22.6 billion to Treasury in dividends on thesenior preferred stock.
Table 1 below displays our senior preferred stock dividend payments to Treasury and Treasury draws sinceentering conservatorship on September 6, 2008.
Table 1: Treasury Draws and Dividend Payments
2008 2009 2010 20112012
(first quarter)Cumulative
Total
(Dollars in billions)
Treasury draws(1)(2) . . . . . . . . . . . . . . . . . . . . . . . . . . . . $15.2 $60.0 $15.0 $25.9 $ — $116.1Senior preferred stock dividends(3) . . . . . . . . . . . . . . . . — 2.5 7.7 9.6 2.8 22.6
Treasury draws less senior preferred stockdividends . . . . . . . . . . . . . . . . . . . . . . . . . . . . . . . . . $15.2 $57.5 $ 7.3 $16.3 $ (2.8) $ 93.5
Cumulative percentage of senior preferred stockdividends to Treasury draws . . . . . . . . . . . . . . . . . . 0.2% 3.3% 11.3% 17.1% 19.5% 19.5%
(1) Represents the total draws received from Treasury and / or being requested based on our quarterly net worth deficits forthe periods presented. Draw requests are funded in the quarter following each quarterly net worth deficit.
(2) Treasury draws do not include the initial $1.0 billion liquidation preference of the senior preferred stock, for which we didnot receive any cash proceeds.
(3) Represents total quarterly cash dividends paid to Treasury during the periods presented based on an annual rate of10% per year on the aggregate liquidation preference of the senior preferred stock.
Total Loss Reserves
Our total loss reserves consist of (1) our allowance for loan losses, (2) our allowance for accrued interestreceivable, (3) our allowance for preforeclosure property taxes and insurance receivables, and (4) our reserve forguaranty losses. Our total loss reserves, which reflect our estimate of the probable losses we have incurred in ourguaranty book of business, including concessions we granted borrowers upon modification of their loans,decreased to $74.6 billion as of March 31, 2012 from $76.9 billion as of December 31, 2011. Our total lossreserve coverage to total nonperforming loans was 30% as of March 31, 2012, compared with 31% as ofDecember 31, 2011.
4

Our Expectations Regarding Future Loss Reserves and Credit-Related Expenses
We expect the trends of stabilizing home prices and declining single-family serious delinquency rates tocontinue. As a result, we believe that our total loss reserves peaked as of December 31, 2011 and will notincrease above $76.9 billion in the foreseeable future. We also believe that our credit-related expenses will belower in 2012 than in 2011.
Although we expect these positive trends to continue, the amount of credit-related expenses we incur in futureperiods could vary significantly from period to period and may be affected by many different factors, such asthose described below. Moreover, although we believe that our total loss reserves peaked as of December 31,2011, we expect our loss reserves will remain significantly elevated relative to historical levels for an extendedperiod because (1) we expect future defaults on loans that we acquired prior to 2009 and the resulting charge-offswill occur over a period of years and (2) a significant portion of our reserves represents concessions granted toborrowers upon modification of their loans and will remain in our reserves until the loans are fully repaid ordefault.
Our expectations regarding our future credit-related expenses and loss reserves are based on our currentexpectations and assumptions about many factors that are subject to change. Factors that could result in highercredit-related expenses and loss reserves than we currently expect include: a drop in actual or expected homeprices; an increase in our serious delinquency rate; an increase in interest rates; an increase in unemploymentrates; future legislative or regulatory requirements that have a significant impact on our business, such as arequirement that we implement a principal forgiveness program; future updates to our models relating to our lossreserves, including the assumptions used by these models; future changes to accounting policies relating to ourloss reserves; significant changes in modification and foreclosure activity; changes in borrower behavior, such asan increasing number of underwater borrowers who strategically default on their mortgage loan; failures by ourmortgage seller/servicers to fulfill their repurchase obligations to us; and many other factors, including thosediscussed in “Outlook—Factors that Could Cause Actual Results to be Materially Different from Our Estimatesand Expectations” in this report and in “Risk Factors” in both this report and in our 2011 Form 10-K. Due to thelarge size of our guaranty book of business, even small changes in these factors could have a significant impacton our financial results for a particular period.
In addition, in April 2012, FHFA issued an Advisory Bulletin that could have an impact on the amount of ourfuture credit-related expenses and loss reserves; however, we are still assessing the impact of the AdvisoryBulletin. See “Legislative and Regulatory Developments—FHFA Advisory Bulletin Regarding Framework forAdversely Classifying Loans” for additional information.
Our Strong New Book of Business
Since 2009, we have seen the effect of actions we took, beginning in 2008, to significantly strengthen ourunderwriting and eligibility standards and change our pricing to promote sustainable homeownership andstability in the housing market. Given their strong credit risk profile and based on their performance so far, weexpect that the single-family loans we have acquired since the beginning of 2009, in the aggregate, will beprofitable over their lifetime, by which we mean that we expect our fee income on these loans to exceed ourcredit losses and administrative costs for them. In contrast, we expect that the single-family loans we acquiredfrom 2005 through 2008, in the aggregate, will not be profitable over their lifetime. Loans we have acquiredsince the beginning of 2009 comprised 56% of our single-family guaranty book of business as of March 31,2012. Our 2005 through 2008 acquisitions are becoming a smaller percentage of our single-family guaranty bookof business and, as shown in Table 2 below, have decreased to 29% of our single-family guaranty book ofbusiness as of March 31, 2012.
Our expectations regarding the ultimate performance of our loans are based on numerous expectations andassumptions, including those relating to expected changes in regional and national home prices, borrowerbehavior, public policy and other macroeconomic factors. If future conditions are more unfavorable than ourexpectations, the loans we acquired since the beginning of 2009 could become unprofitable. For example, homeprices are a key factor affecting the profitability we expect. As home prices decline, the loan-to-value (“LTV”)ratios on our loans increase, and both the probability of default and the estimated severity of loss increase. If
5

home prices decline significantly from March 2012 levels, the loans we acquired since the beginning of 2009could become unprofitable. See “Outlook—Home Price Declines” for our current expectations regarding homeprice declines. Also see “Outlook—Factors that Could Cause Actual Results to be Materially Different from OurEstimates and Expectations” in this report and “Risk Factors” in both this report and our 2011 Form 10-K for adiscussion of factors that could cause our expectations regarding the performance of the loans in our new single-family book of business to change.
Table 2 below displays information regarding the credit characteristics of the loans in our single-familyconventional guaranty book of business as of March 31, 2012 by acquisition period, which illustrates theimprovement in the credit risk profile of loans we acquired beginning in 2009 compared with loans we acquiredin 2005 through 2008.
Table 2: Selected Credit Characteristics of Single-Family Conventional Loans Held, by Acquisition Period
As of March 31, 2012
% ofSingle-FamilyConventional
Guaranty Bookof Business(1)
CurrentEstimated
Mark-to-MarketLTV Ratio(1)
CurrentMark-to-Market
LTV Ratio>100%(1)(2)
SeriousDelinquency
Rate(3)
Year of Acquisition:New Single-Family Book of Business:
2012 . . . . . . . . . . . . . . . . . . . . . . . . . . . . . . . . . 7% 70% 4% —2011 . . . . . . . . . . . . . . . . . . . . . . . . . . . . . . . . . 18 71 5 0.09%2010 . . . . . . . . . . . . . . . . . . . . . . . . . . . . . . . . . 16 73 7 0.362009 . . . . . . . . . . . . . . . . . . . . . . . . . . . . . . . . . 15 74 8 0.69
Total New Single-Family Book of Business . . . . 56 72 6 0.32Legacy Book of Business:
2005-2008 . . . . . . . . . . . . . . . . . . . . . . . . . . . . 29 105 48 9.252004 and prior . . . . . . . . . . . . . . . . . . . . . . . . . 15 61 9 3.31
Total Single-Family Book of Business . . . . . . . . 100% 80% 19% 3.67%
(1) Calculated based on the aggregate unpaid principal balance of single-family loans for each category divided by theaggregate unpaid principal balance of loans in our single-family conventional guaranty book of business as of March 31,2012.
(2) The majority of loans in our new single-family book of business as of March 31, 2012 with mark-to-market LTV ratiosover 100% were loans acquired under our Refi Plus initiative. See “Risk Management–Credit Risk Management–Single-Family Mortgage Credit Risk Management” for further information on Refi Plus.
(3) The serious delinquency rate of loans acquired in 2012 is zero because they were originated so recently that most of themcould not yet become seriously delinquent. The serious delinquency rates for loans acquired in more recent years will behigher after the loans have aged, but we do not expect them to approach the levels of the March 31, 2012 seriousdelinquency rates of loans in our legacy book of business.
The single-family loans that we acquired in the first quarter of 2012 had a weighted average FICO credit score atorigination of 763 and an average original LTV ratio of 70%. Of the single-family loans we acquired in the firstquarter of 2012, approximately 11% had an original LTV ratio greater than 90% and 1% had a FICO credit scoreat origination of less than 620. See Table 2 in our 2011 Form 10-K for information regarding the credit riskprofile of the single-family conventional loans we acquired during specified previous periods.
Since 2009, our acquisitions have included a significant number of loans refinanced under our Refi Plustm
initiative, which provides expanded refinance opportunities for eligible Fannie Mae borrowers. Our acquisitionsunder Refi Plus include our acquisitions under HARP, which was established by the Administration to helpborrowers who may otherwise be unable to refinance the mortgage loan on their primary residence due to adecline in home values. The approximately 239,000 loans we acquired under Refi Plus in the first quarter of 2012constituted approximately 22% of our total single-family acquisitions for the period, measured by unpaidprincipal balance, compared with approximately 24% of total single-family acquisitions in all of 2011. Under
6

Refi Plus we acquire refinancings of performing Fannie Mae loans that, in some cases, have higher LTV ratiosand/or lower FICO credit scores than we generally require. As a result, while it is too early to determine theultimate performance of these Refi Plus loans, they may not perform as well as the other loans we have acquiredsince the beginning of 2009. However, we expect Refi Plus loans will perform better than the loans they replacebecause Refi Plus loans reduce the borrowers’ monthly payments or otherwise should provide more stability thanthe borrowers’ old loans (for example, by refinancing into a mortgage with a fixed interest rate instead of anadjustable rate).
Whether the loans we acquire in the future will exhibit an overall credit profile similar to our more recentacquisitions will depend on a number of factors, including our future pricing and eligibility standards and thoseof mortgage insurers and the Federal Housing Administration (“FHA”), the percentage of loan originationsrepresenting refinancings, our future objectives, government policy, market and competitive conditions, and thevolume and characteristics of loans we acquire under HARP.
See “Business—Executive Summary—Our Strong New Book of Business and Expected Losses on our LegacyBook of Business—Building a Strong New Single-Family Book of Business” in our 2011 Form 10-K for a moredetailed discussion of the changes in the credit profile of our single-family acquisitions. In addition, see“MD&A—Risk Management—Credit Risk Management—Single-Family Mortgage Credit Risk Management”for more detail regarding the credit risk characteristics of our single-family guaranty book of business.
Reducing Credit Losses on Our Legacy Book of Business
To reduce the credit losses we ultimately incur on our legacy book of business, we have been focusing our effortson the following strategies:
• Helping underwater and other eligible Fannie Mae borrowers refinance to a more sustainable loan throughour Refi Plus initiative;
• Reducing defaults by offering borrowers solutions that enable them to keep their homes (“home retentionsolutions”);
• Pursuing “foreclosure alternatives,” which help borrowers avoid foreclosure and reduce the severity of thelosses we incur overall;
• Efficiently managing timelines for home retention solutions, foreclosure alternatives, and foreclosures;
• Improving servicing standards and servicers’ execution and consistency;
• Managing our REO inventory to minimize costs and maximize sales proceeds; and
• Pursuing contractual remedies from lenders, servicers and providers of credit enhancement.
See “Business—Executive Summary—Reducing Credit Losses on our Legacy Book of Business” in our 2011Form 10-K, as well as “Risk Management—Credit Risk Management—Single-Family Mortgage Credit RiskManagement” in both this report and our 2011 Form 10-K, for more information on the strategies and actions weare taking to minimize our credit losses.
Credit Performance
Table 3 presents information for each of the last five quarters about the credit performance of mortgage loans inour single-family guaranty book of business and our workouts. The term “workouts” refers to home retentionsolutions and foreclosure alternatives. The workout information in Table 3 does not reflect repayment plans andforbearances that have been initiated but not completed, nor does it reflect trial modifications that have notbecome permanent.
7

Table 3: Credit Statistics, Single-Family Guaranty Book of Business(1)
2012 2011
Q1FullYear Q4 Q3 Q2 Q1
(Dollars in millions)As of the end of each period:
Serious delinquency rate(2) . . . . . . . . . . . . . . . . . . 3.67% 3.91% 3.91% 4.00% 4.08% 4.27%Seriously delinquent loan count . . . . . . . . . . . . . . 650,918 690,911 690,911 708,847 729,772 767,161Nonperforming loans(3) . . . . . . . . . . . . . . . . . . . . . $243,981 $ 248,379 $248,379 $248,134 $245,848 $248,444Foreclosed property inventory:
Number of properties . . . . . . . . . . . . . . . . . . . . . 114,157 118,528 118,528 122,616 135,719 153,224Carrying value . . . . . . . . . . . . . . . . . . . . . . . . . . $ 9,721 $ 9,692 $ 9,692 $ 11,039 $ 12,480 $ 14,086
Combined loss reserves(4) . . . . . . . . . . . . . . . . . . . $ 69,633 $ 71,512 $ 71,512 $ 70,741 $ 68,887 $ 66,240Total loss reserves(5) . . . . . . . . . . . . . . . . . . . . . . . $ 73,119 $ 75,264 $ 75,264 $ 73,973 $ 73,116 $ 70,466
During the period:Foreclosed property (number of properties):
Acquisitions(6) . . . . . . . . . . . . . . . . . . . . . . . . . . 47,700 199,696 47,256 45,194 53,697 53,549Dispositions . . . . . . . . . . . . . . . . . . . . . . . . . . . . (52,071) (243,657) (51,344) (58,297) (71,202) (62,814)
Credit-related expenses(7) . . . . . . . . . . . . . . . . . . . $ 2,385 $ 27,218 $ 5,397 $ 4,782 $ 5,933 $ 11,106Credit losses(8) . . . . . . . . . . . . . . . . . . . . . . . . . . . . $ 4,955 $ 18,346 $ 4,548 $ 4,384 $ 3,810 $ 5,604
Loan workout activity (number of loans):Home retention loan workouts(9) . . . . . . . . . . . . . . 55,535 248,658 60,453 68,227 59,019 60,959Short sales and deeds-in-lieu of foreclosure . . . . . 22,213 79,833 22,231 19,306 21,176 17,120
Total loan workouts . . . . . . . . . . . . . . . . . . . . . . . . 77,748 328,491 82,684 87,533 80,195 78,079
Loan workouts as a percentage of delinquentloans in our guaranty book of business(10) . . . . . 28.85% 27.05% 27.24% 28.39% 25.71% 25.01%
(1) Our single-family guaranty book of business consists of (a) single-family mortgage loans held in our mortgage portfolio,(b) single-family mortgage loans underlying Fannie Mae MBS, and (c) other credit enhancements that we provide onsingle-family mortgage assets, such as long-term standby commitments. It excludes non-Fannie Mae mortgage-relatedsecurities held in our mortgage portfolio for which we do not provide a guaranty.
(2) Calculated based on the number of single-family conventional loans that are three or more months past due and loans thathave been referred to foreclosure but not yet foreclosed upon, divided by the number of loans in our single-familyconventional guaranty book of business. We include all of the single-family conventional loans that we own and those thatback Fannie Mae MBS in the calculation of the single-family serious delinquency rate.
(3) Represents the total amount of nonperforming loans including troubled debt restructurings. A troubled debt restructuringis a restructuring of a mortgage loan in which a concession is granted to a borrower experiencing financial difficulty. Wegenerally classify loans as nonperforming when the payment of principal or interest on the loan is two months or morepast due.
(4) Consists of the allowance for loan losses for loans recognized in our condensed consolidated balance sheets and thereserve for guaranty losses related to both single-family loans backing Fannie Mae MBS that we do not consolidate in ourcondensed consolidated balance sheets and single-family loans that we have guaranteed under long-term standbycommitments. For additional information on the change in our loss reserves see “Consolidated Results of Operations—Credit-Related Expenses—Provision for Credit Losses.”
(5) Consists of (a) the combined loss reserves, (b) allowance for accrued interest receivable, and (c) allowance forpreforeclosure property taxes and insurance receivables.
(6) Includes acquisitions through deeds-in-lieu of foreclosure.(7) Consists of (a) the provision (benefit) for credit losses and (b) foreclosed property expense (income).(8) Consists of (a) charge-offs, net of recoveries and (b) foreclosed property expense, adjusted to exclude the impact of fair
value losses resulting from credit-impaired loans acquired from MBS trusts.
8

(9) Consists of (a) modifications, which do not include trial modifications or repayment plans or forbearances that have beeninitiated but not completed and (b) repayment plans and forbearances completed. See “Table 37: Statistics on Single-Family Loan Workouts” in “Risk Management—Credit Risk Management–Single-Family Mortgage Credit RiskManagement–Problem Loan Management–Loan Workout Metrics” for additional information on our various types of loanworkouts.
(10) Calculated based on annualized problem loan workouts during the period as a percentage of delinquent loans in our single-family guaranty book of business as of the end of the period.
Our single-family serious delinquency rate has decreased each quarter since the first quarter of 2010. Thedecrease in our serious delinquency rate is primarily the result of home retention solutions, foreclosurealternatives and completed foreclosures, as well as our acquisition of loans with stronger credit profiles since thebeginning of 2009, as these loans are now 56% of our single-family guaranty book of business, resulting in asmaller percentage of our loans becoming seriously delinquent.
Although our single-family serious delinquency rate has decreased significantly since the first quarter of 2010,our serious delinquency rate and the period of time that loans remain seriously delinquent has been negativelyaffected in recent periods by the increase in the average number of days it is taking to complete a foreclosure. Asdescribed in “Business—Executive Summary—Reducing Credit Losses on Our Legacy Book of Business—Managing Timelines for Workouts and Foreclosures” in our 2011 Form 10-K, high levels of foreclosures,continuing issues in the servicer foreclosure process and changing legislative, regulatory and judicialrequirements have lengthened the time it takes to foreclose on a mortgage loan in many states. We expect seriousdelinquency rates will continue to be affected in the future by home price changes, changes in othermacroeconomic conditions, the length of the foreclosure process, the volume of loan modifications, and theextent to which borrowers with modified loans continue to make timely payments. We expect the number of oursingle-family loans that are seriously delinquent to remain well above pre-2008 levels for years. In addition,given the large anticipated supply of single-family homes in the market, we anticipate that it will take asignificant amount of time before our REO inventory is reduced to pre-2008 levels.
We provide additional information on our credit-related expenses in “Consolidated Results of Operations—Credit-Related Expenses” and on the credit performance of mortgage loans in our single-family book of businessand our loan workouts in “Risk Management—Credit Risk Management—Single-Family Mortgage Credit RiskManagement.”
Housing and Mortgage Market and Economic Conditions
Economic growth slowed in the first quarter of 2012 compared with the fourth quarter of 2011. The inflation-adjusted U.S. gross domestic product, or GDP, rose by 2.2% on an annualized basis in the first quarter of 2012,according to the Bureau of Economic Analysis advance estimate, compared with an increase of 3.0% in thefourth quarter of 2011. The overall economy gained an estimated 688,000 jobs in the first quarter. According tothe U.S. Bureau of Labor Statistics, over the past 12 months ending in March 2012, the economy created2.0 million non-farm jobs. The unemployment rate was 8.2% in March 2012, compared with 8.5% in December2011. We expect that housing will start to recover if the employment market continues to improve.
Housing activity showed some improvement during the first quarter of 2012. Total existing home sales averaged4.6 million units annualized in the first quarter of 2012, a 4.7% increase from the fourth quarter of 2011,according to data available through March 2012 from the National Association of REALTORS®. Sales offoreclosed homes and preforeclosure, or “short,” sales (together, “distressed sales”) accounted for 29% ofexisting home sales in March 2012, compared with 32% in December 2011 and 40% in March 2011. New single-family home sales strengthened during the quarter, averaging an annualized rate of 337,000 units, a 3.7%increase from the prior quarter.
The overall mortgage market serious delinquency rate, which has trended down since peaking in the fourthquarter of 2009, remained historically high at 7.7% as of December 31, 2011, according to the Mortgage BankersAssociation National Delinquency Survey. According to the National Association of REALTORS® April 2012Existing Home Sales Report, the months’ supply of existing unsold homes was 6.3 months as of March 31, 2012,compared with 6.4 months as of December 31, 2011 and 8.5 months as of March 31, 2011. Properties that are
9

vacant and held off the market, combined with a portion of properties backing seriously delinquent mortgagesnot currently listed for sale, represent a significant shadow inventory putting downward pressure on home prices.
We estimate that home prices on a national basis declined by 0.8% in the first quarter of 2012 and have declinedby 23.9% from their peak in the third quarter of 2006. Our home price estimates are based on preliminary dataand are subject to change as additional data become available. The decline in home prices over the past severalyears has left many homeowners with “negative equity” in their homes, which means their principal mortgagebalance exceeds the current market value of their home. This increases the likelihood that borrowers will walkaway from their mortgage obligations and that the loans will become delinquent and proceed to foreclosure.According to CoreLogic, approximately 11 million, or 23%, of all residential properties with mortgages were in anegative equity position in the fourth quarter of 2011. This potential supply also weighs on the supply/demandbalance putting downward pressure on both home prices and rents. See “Risk Factors” in our 2011 Form 10-Kfor a description of risks to our business associated with the weak economy and housing market.
During the first quarter of 2012, the multifamily sector remained fairly stable and continued to benefit fromongoing rental demand, positive job growth and limited new apartment supply. Preliminary third-party data forthe first quarter of 2012 indicates that the national multifamily vacancy rate for institutional investment-typeapartment properties decreased to an estimated 6.0% as of March 31, 2012, compared to an estimated 6.3% as ofDecember 31, 2011 and an estimated 7.0% as of March 31, 2011. In addition, asking rents increased in the firstquarter of 2012 by an estimated 1% on a national basis. As indicated by data from Axiometrics, multifamilyconcession rates, the rental discount rate as a percentage of asking rents, declined during the first quarter to-2.7% as of March 2012, after having increased slightly during fourth quarter of 2011 to end the year at -3.5%.The increase in rental demand is also reflected in an estimated positive net absorption, or increase in the numberof occupied rental units after deducting new supply added during the period, of more than 36,000 units during thefirst quarter, according to preliminary data from Reis, Inc.
Outlook
Overall Market Conditions. We expect weakness in the housing and mortgage markets to continue in 2012. Thehigh level of delinquent mortgage loans will ultimately result in high levels of foreclosures, which is likely to addto the excess housing inventory.
We expect that single-family default and severity rates will remain high in 2012, but will be lower than in 2011.Despite signs of multifamily sector improvement at the national level, we expect multifamily foreclosures in2012 to remain generally commensurate with 2011 levels as certain local markets and properties continue toexhibit weak fundamentals. Conditions may worsen if the unemployment rate increases on either a national orregional basis.
We expect that changes to HARP announced in October 2011 will result in our acquisition of more refinancingsin 2012 than we would have acquired in the absence of the changes; however, we expect fewer refinancingsoverall in 2012 than in 2011. For a description of the changes to HARP announced in October 2011, see“Business—Making Home Affordable Program—Changes to the Home Affordable Refinance Program” in our2011 Form 10-K. Our loan acquisitions also have been negatively affected by the decrease in the maximum sizeof loans we may acquire in specified high-cost areas from $729,750 to $625,500, which went into effect in thefourth quarter of 2011. As a result of these factors, we expect our loan acquisitions for 2012 will be lower than in2011.
We estimate that total originations in the U.S. single-family mortgage market in 2012 will decrease from 2011levels by approximately 8%, from an estimated $1.36 trillion to an estimated $1.26 trillion, and that the amountof originations in the U.S. single-family mortgage market that are refinancings will decline from approximately$900 billion to approximately $800 billion. Refinancings comprised approximately 83% of our single-familybusiness volume in the first quarter of 2012, compared with approximately 76% for all of 2011.
Home Price Declines. We estimate that U.S. home prices have declined by 23.9% from their peak in the thirdquarter of 2006. While the rate of decline in home prices has moderated in recent quarters, we expect that homeprices on a national basis will decline further before stabilizing in 2013. We currently expect a peak-to-troughhome price decline on a national basis ranging from 24% to 30%, but believe that it would take the occurrence of
10

an additional adverse economic event to reach the high end of the range. Future home price changes may be verydifferent from our estimates as a result of significant inherent uncertainty in the current market environment,including uncertainty about the effect of actions the federal government has taken and may take with respect totax policies, mortgage finance programs and policies, and housing finance reform; the management of theFederal Reserve’s MBS holdings; and the impact of those actions on home prices, unemployment and the generaleconomic and interest rate environment. Because of these uncertainties, the actual home price decline weexperience may differ significantly from these estimates. We also expect significant regional variation in homeprice declines and stabilization.
Our estimates of home price declines are based on our home price index, which is calculated differently from theS&P/Case-Shiller U.S. National Home Price Index and therefore results in different percentages for comparabledeclines. Our 24% to 30% peak-to-trough home price decline estimate corresponds to an approximate 34% to41% peak-to-trough decline using the S&P/Case-Shiller index method. Our estimates differ from the S&P/Case-Shiller index in two principal ways: (1) our estimates weight expectations by number of properties, whereas theS&P/Case-Shiller index weights expectations based on property value, causing home price changes on higherpriced homes to have a greater effect on the overall result; and (2) the S&P/Case-Shiller index includes sales offoreclosed homes while our estimates attempt to exclude foreclosed home sales, because we believe that differingmaintenance practices and the forced nature of the sales make foreclosed home prices less representative ofmarket values. We believe, however, that the impact of sales of foreclosed homes is indirectly reflected in ourestimates as a result of their impact on the pricing of non-distressed sales. We estimate S&P/Case-Shillercomparison numbers by adjusting our internal home price estimates to compensate for the differences betweenour method and the S&P/Case-Shiller index method. In addition to these differences, our estimates are based onour own internally available data combined with publicly available data, and are therefore based on datacollected nationwide, whereas the S&P/Case-Shiller index is based on publicly available data, which may belimited in certain geographic areas of the country. Our comparative calculations to the S&P/Case-Shiller indexprovided above are not adjusted to compensate for this data pool difference.
Credit-Related Expenses and Credit Losses. Our credit-related expenses, which include our provision for creditlosses, reflect our recognition of losses on our loans. Through our provision for credit losses, we recognize credit-related expenses on loans in the period in which we determine that we have incurred a probable loss on the loans asof the end of the period, or in which we have granted concessions to the borrowers. Accordingly, our credit-relatedexpenses in each period are affected by changes in actual and expected home prices, borrower payment behavior,the types and volumes of loss mitigation activities and foreclosures we complete, and estimated recoveries from ourlender and mortgage insurer counterparties. Our credit losses, which include our charge-offs, net of recoveries,reflect our realization of losses on our loans. We realize losses on loans, through our charge-offs, when foreclosuresales are completed or when we accept short sales or deeds-in-lieu of foreclosure.
We expect that our credit-related expenses will remain high in 2012 but that, overall, our credit-related expenseswill be lower in 2012 than in 2011. In addition, we expect our credit losses to remain high in 2012. To the extentdelays in foreclosures continue in 2012, our realization of some credit losses will be delayed. We further describeour outlook for credit-related expenses in “Summary of Our Financial Performance for the First Quarter of2012—Our Expectations Regarding Future Loss Reserves and Credit-Related Expenses.”
Uncertainty Regarding our Future Status and Long-Term Financial Sustainability. There is significantuncertainty in the current market environment, and any changes in the trends in macroeconomic factors that wecurrently anticipate, such as home prices and unemployment, may cause our future credit-related expenses andcredit losses to vary significantly from our current expectations. Although Treasury’s funds under the seniorpreferred stock purchase agreement permit us to remain solvent and avoid receivership, the resulting dividendpayments are substantial. We expect to request additional draws under the senior preferred stock purchaseagreement in future periods, which will further increase the dividends we owe to Treasury on the senior preferredstock. We expect that, over time, our dividend obligation to Treasury will increasingly drive our future drawsunder the senior preferred stock purchase agreement. Although we may experience period-to-period volatility inearnings and comprehensive income, we do not expect to generate net income or comprehensive income inexcess of our annual dividend obligation to Treasury over the long term. As a result of these factors, there issignificant uncertainty about our long-term financial sustainability.
11

In addition, there is significant uncertainty regarding the future of our company, including how long the companywill continue to be in its current form, the extent of our role in the market, what form we will have, and whatownership interest, if any, our current common and preferred stockholders will hold in us after theconservatorship is terminated. We expect this uncertainty to continue. In February 2011, Treasury and theDepartment of Housing and Urban Development (“HUD”) released a report to Congress on reforming America’shousing finance market. The report states that the Administration will work with FHFA to determine the bestway to responsibly wind down both Fannie Mae and Freddie Mac. The report emphasizes the importance ofproviding the necessary financial support to Fannie Mae and Freddie Mac during the transition period. InFebruary 2012, Treasury Secretary Geithner stated that the Administration intended to release new details in thespring of 2012 around approaches to housing finance reform, including winding down Fannie Mae and FreddieMac, and to work with Congressional leaders to explore options for legislation, but that he does not expecthousing finance reform legislation to be enacted in 2012.
We cannot predict the prospects for the enactment, timing or content of legislative proposals regarding long-termreform of the GSEs. See “Legislative and Regulatory Developments” in this report and “Business—Legislativeand Regulatory Developments” in our 2011 Form 10-K for discussions of recent legislative reform of thefinancial services industry and proposals for GSE reform that could affect our business. See “Risk Factors” in our2011 Form 10-K for a discussion of the risks to our business relating to the uncertain future of our company.
Factors that Could Cause Actual Results to be Materially Different from Our Estimates and Expectations. Wepresent a number of estimates and expectations in this executive summary, including estimates and expectationsregarding our future financial results, the profitability of single-family loans we have acquired, our single-familycredit losses, our loss reserves and credit-related expenses, and our draws from and dividends to be paid toTreasury. These estimates and expectations are forward-looking statements based on our current assumptionsregarding numerous factors, including future home prices and the future performance of our loans. Our futureestimates of our performance, as well as the actual amounts, may differ materially from our current estimates andexpectations as a result of: the timing and level of, as well as regional variation in, home price changes; changesin interest rates, unemployment rates and other macroeconomic variables; government policy; the length of timeit takes to complete foreclosures; changes in generally accepted accounting principles (“GAAP”); creditavailability; borrower behavior; the volume of loans we modify; the effectiveness of our loss mitigationstrategies, management of our REO inventory and pursuit of contractual remedies; whether our counterpartiesmeet their obligations to us; changes in the fair value of our assets and liabilities; impairments of our assets; andmany other factors, including those discussed in “Risk Factors,” “Forward-Looking Statements” and elsewhere inthis report, and in “Risk Factors” in our 2011 Form 10-K. For example, if the economy were to enter a deeprecession, we would expect actual outcomes to differ substantially from our current expectations.
LEGISLATIVE AND REGULATORY DEVELOPMENTS
The information in this section updates and supplements information regarding legislative and regulatorydevelopments set forth in “Business—Legislative and Regulatory Developments” and “Business—Our Charterand Regulation of Our Activities” in our 2011 Form 10-K.
GSE Reform
Policymakers and others have focused significant attention in recent years on how to reform the nation’s housingfinance system, including what role, if any, the GSEs should play. The Dodd-Frank Wall Street Reform andConsumer Protection Act (the “Dodd-Frank Act”), which was signed into law in July 2010, calls for enactment ofmeaningful structural reforms of Fannie Mae and Freddie Mac. The Dodd-Frank Act also required the TreasurySecretary to submit a report to Congress with recommendations for ending the conservatorships of Fannie Maeand Freddie Mac.
In February 2011, Treasury and HUD released their report to Congress on reforming America’s housing financemarket. The report provides that the Administration will work with FHFA to determine the best way toresponsibly reduce Fannie Mae’s and Freddie Mac’s role in the market and ultimately wind down bothinstitutions.
12

The report identifies a number of policy steps that could be used to wind down Fannie Mae and Freddie Mac,reduce the government’s role in housing finance and help bring private capital back to the mortgage market.These steps include (1) increasing guaranty fees, (2) gradually increasing the level of required down payments sothat any mortgages insured by Fannie Mae or Freddie Mac eventually have at least a 10% down payment,(3) reducing conforming loan limits to those established in the Federal Housing Finance Regulatory Reform Actof 2008 (the “2008 Reform Act”), (4) encouraging Fannie Mae and Freddie Mac to pursue additional credit lossprotection and (5) reducing Fannie Mae’s and Freddie Mac’s portfolios, consistent with Treasury’s seniorpreferred stock purchase agreements with the companies.
In addition, the report outlines three potential options for a new long-term structure for the housing financesystem following the wind-down of Fannie Mae and Freddie Mac. The first option would privatize housingfinance almost entirely. The second option would add a government guaranty mechanism that could scale upduring times of crisis. The third option would involve the government offering catastrophic reinsurance behindprivate mortgage guarantors. Each of these options assumes the continued presence of programs operated byFHA, the Department of Agriculture and the Veterans Administration to assist targeted groups of borrowers. Thereport does not state whether or how the existing infrastructure or human capital of Fannie Mae may be used inthe establishment of such a reformed system. The report emphasizes the importance of proceeding with a carefultransition plan and providing the necessary financial support to Fannie Mae and Freddie Mac during thetransition period. A copy of the report can be found on the Housing Finance Reform section of Treasury’s Website, www.Treasury.gov. We are providing Treasury’s Web site address solely for your information, andinformation appearing on Treasury’s Web site is not incorporated into this quarterly report on Form 10-Q.
In February 2012, Treasury Secretary Geithner stated that the Administration intended to release new details inthe spring of 2012 around approaches to housing finance reform, including winding down Fannie Mae andFreddie Mac, and to work with Congressional leaders to explore options for legislation, but that he does notexpect housing finance reform legislation to be enacted in 2012.
During 2011, Congress held hearings on the future status of Fannie Mae and Freddie Mac, and members ofCongress offered legislative proposals relating to the future status of the GSEs. We expect hearings on GSEreform to continue in 2012 and additional legislation to be considered and proposals to be discussed, includingproposals that would result in a substantial change to our business structure or that involve Fannie Mae’sliquidation or dissolution. Several bills have been introduced that would place the GSEs into receivership after aperiod of time and either grant federal charters to new entities to engage in activities similar to those currentlyengaged in by the GSEs or leave secondary mortgage market activities to entities in the private sector. Forexample, legislation has been introduced in both the House of Representatives and the Senate that would requireFHFA to make a determination within two years of enactment regarding whether the GSEs were financiallyviable and, if the GSEs were determined not to be financially viable, to place them into receivership. As drafted,these bills may upon enactment impair our ability to issue securities in the capital markets and therefore ourability to conduct our business, absent the federal government providing an explicit guarantee of our existing andfuture liabilities.
In addition to bills that seek to resolve the status of the GSEs, numerous bills have been introduced andconsidered that could constrain the current operations of the GSEs or alter the existing authority that FHFA orTreasury has over the enterprises. For example, the Subcommittee on Capital Markets and GovernmentSponsored Enterprises of the House Financial Services Committee has approved bills that would:
• suspend current compensation packages and apply a government pay scale for GSE employees;
• require the GSEs to increase guaranty fees;
• subject GSE loans to the risk retention standards in the Dodd-Frank Act;
• require a quicker reduction of GSE portfolios than required under the senior preferred stock purchaseagreement;
• require Treasury to pre-approve all GSE debt issuances;
• repeal the GSEs’ affordable housing goals;
13

• provide additional authority to FHFA’s Inspector General;
• prohibit FHFA from approving any new GSE products during conservatorship or receivership, with certainexceptions;
• prevent Treasury from amending the senior preferred stock purchase agreement to reduce the currentdividend rate on our senior preferred stock;
• abolish the Affordable Housing Trust Fund that the GSEs are required to fund except when suchcontributions have been temporarily suspended by FHFA;
• require FHFA to identify mission critical assets of the GSEs and require the GSEs to dispose of non-missioncritical assets;
• cap the maximum aggregate amount of funds Treasury or any other agency or entity of the federalgovernment can provide to the GSEs subject to certain qualifications;
• grant FHFA the authority to revoke the enterprises’ charters following receivership under certaincircumstances; and
• subject the GSEs to the Freedom of Information Act.
Of these bills that passed at a subcommittee level, the only one that has passed the full committee is the bill thatwould put GSE employees on a government pay scale. We expect additional legislation relating to the GSEs tobe introduced and considered by Congress in 2012. We cannot predict the prospects for the enactment, timing orcontent of legislative proposals concerning the future status of the GSEs, their regulation or operations.
In sum, there continues to be uncertainty regarding the future of our company, including how long the companywill continue to exist in its current form, the extent of our role in the market, what form we will have, and whatownership interest, if any, our current common and preferred stockholders will hold in us after theconservatorship is terminated. See “Risk Factors” in our 2011 Form 10-K for a discussion of the risks to ourbusiness relating to the uncertain future of our company. Also see “Risk Factors” in this report for a discussion ofhow the uncertain future of our company may adversely affect our ability to retain and recruit well-qualifiedemployees, including senior management.
Compensation
In April 2012, the Stop Trading on Congressional Knowledge Act (the “STOCK Act”) was enacted, whichincludes a provision that prohibits senior executives at Fannie Mae and Freddie Mac from receiving bonusesduring any period of conservatorship on or after the date of enactment of the law. Congress has also consideredother legislation that would alter the compensation for Fannie Mae and Freddie Mac employees. In 2011, theHouse Financial Services Committee passed a bill that would place all Fannie Mae and Freddie Mac employeeson a pay scale similar to that provided for federal government employees. Additional legislative proposals relatedto compensation for Fannie Mae and Freddie Mac employees may be considered by Congress in 2012.
If legislation is adopted that results in a significant reduction in compensation to our employees, it could cause asubstantial number of our most skilled and experienced employees to leave and significantly impede our abilityto retain and attract employees in a competitive marketplace, as we discuss in “Risk Factors.”
Enhanced Supervision and Prudential Standards under the Dodd-Frank Act
The Dodd-Frank Act established the Financial Stability Oversight Council (the “FSOC”), chaired by theSecretary of the Treasury, to ensure that all financial companies whose failure could pose a threat to the financialstability of the United States—not just banks—will be subject to strong oversight. Under the Dodd-Frank Act,the FSOC is responsible for designating systemically important nonbank financial companies, while the FederalReserve is to establish stricter prudential standards that will apply to certain bank holding companies and tosystemically important nonbank financial companies. The Federal Reserve must establish standards related torisk-based capital, leverage limits, liquidity, credit concentrations, resolution plans, reporting credit exposuresand other risk management measures. On December 20, 2011, the Board of Governors of the Federal Reserve
14

System issued proposed rules addressing a number of these enhanced prudential standards. The Federal Reservemay also impose other standards related to contingent capital, enhanced public disclosure, short-term debt limitsand other requirements as appropriate.
On April 11, 2012, the FSOC published a final rule and interpretive guidance describing the manner in which itintends to apply the statutory standards and procedures for determining whether a nonbank financial companywill be subject to supervision by, and the prudential standards of, the Federal Reserve Board. The rule outlinesthe evaluation process that the FSOC intends to use in making these determinations. In making itsdeterminations, factors the FSOC may consider include: company size, leverage, interconnectedness, liquidityrisk, maturity mismatch, importance to the economic system, and the extent to which a company is alreadyregulated.
Depending on the scope and final form of the Federal Reserve’s enhanced standards, and the extent to which theyapply to us if we are designated by the FSOC as a systemically important nonbank financial company, or toour customers and other counterparties, their adoption and application could increase our costs, pose operationalchallenges and adversely affect demand for our debt and Fannie Mae MBS.
FHFA Advisory Bulletin Regarding Framework for Adversely Classifying Loans
On April 9, 2012, FHFA issued an Advisory Bulletin, “Framework for Adversely Classifying Loans, Other RealEstate Owned, and Other Assets and Listing Assets for Special Mention,” which was effective upon issuance andis applicable to Fannie Mae, Freddie Mac and the Federal Home Loan Banks. The Advisory Bulletin establishesguidelines for adverse classification and identification of specified assets and off-balance sheet credit exposures.The Advisory Bulletin indicates that this guidance considers and is generally consistent with the Uniform RetailCredit Classification and Account Management Policy issued by the federal banking regulators in June 2000.
Among other requirements, the Advisory Bulletin requires that we classify the portion of an outstanding single-family loan balance in excess of the fair value of the underlying property, less costs to sell, as “loss” when theloan is no more than 180 days delinquent, except in certain specified circumstances (such as properly securedloans with an LTV ratio equal to or less than 60%), and charge off the portion of the loan classified as “loss.”The Advisory Bulletin also specifies that, if we subsequently receive full or partial payment of a previouslycharged-off loan, we may report a recovery of the amount, either through our loss reserves or as a reduction inour foreclosed property expenses.
The accounting methods outlined in FHFA’s Advisory Bulletin are different from our current methods ofaccounting for single-family loans that are 180 days or more delinquent. As described in “Risk Factors,” webelieve that implementation of these changes in our accounting methods present significant operationalchallenges for us. We have not yet determined when we will implement the accounting changes specified in theAdvisory Bulletin. We are currently assessing the impact of implementing these accounting changes on ourfuture financial results.
For additional information on legislative and regulatory matters affecting us, refer to “Business—Legislative andRegulatory Developments” and “Business—Our Charter and Regulation of Our Activities” in our 2011 Form10-K. Also see “Risk Factors” in this report and our 2011 Form 10-K for a discussion of risks relating to ourbusiness relating to legislative and regulatory matters.
15

CRITICAL ACCOUNTING POLICIES AND ESTIMATES
The preparation of financial statements in accordance with GAAP requires management to make a number ofjudgments, estimates and assumptions that affect the reported amount of assets, liabilities, income and expensesin the condensed consolidated financial statements. Understanding our accounting policies and the extent towhich we use management judgment and estimates in applying these policies is integral to understanding ourfinancial statements. We describe our most significant accounting policies in “Note 1, Summary of SignificantAccounting Policies” of this report and in our 2011 Form 10-K.
We evaluate our critical accounting estimates and judgments required by our policies on an ongoing basis andupdate them as necessary based on changing conditions. Management has discussed any significant changes injudgments and assumptions in applying our critical accounting policies with the Audit Committee of our Boardof Directors. We have identified three of our accounting policies as critical because they involve significantjudgments and assumptions about highly complex and inherently uncertain matters, and the use of reasonablydifferent estimates and assumptions could have a material impact on our reported results of operations orfinancial condition. These critical accounting policies and estimates are as follows:
• Fair Value Measurement
• Total Loss Reserves
• Other-Than-Temporary Impairment of Investment Securities
See “MD&A—Critical Accounting Policies and Estimates” in our 2011 Form 10-K for a detailed discussion ofthese critical accounting policies and estimates. We provide below information about our Level 3 assets andliabilities as of March 31, 2012 as compared with December 31, 2011.
Fair Value Measurement
The use of fair value to measure our assets and liabilities is fundamental to our financial statements and is acritical accounting estimate because we account for and record a portion of our assets and liabilities at fair value.In determining fair value, we use various valuation techniques. We describe the valuation techniques and inputsused to determine the fair value of our assets and liabilities and disclose their carrying value and fair value in“Note 12, Fair Value.”
Fair Value Hierarchy—Level 3 Assets and Liabilities
The assets and liabilities that we have classified as Level 3 consist primarily of financial instruments for whichthere is limited market activity and therefore little or no price transparency. As a result, the valuation techniquesthat we use to estimate the fair value of Level 3 instruments involve significant unobservable inputs, whichgenerally are more subjective and involve a high degree of management judgment and assumptions. Our Level 3assets and liabilities consist of certain mortgage-backed securities and residual interests, certain mortgage loans,certain acquired property, certain long-term debt arrangements and certain highly structured, complex derivativeinstruments.
Table 4 presents a comparison of the amount of financial assets carried in our condensed consolidated balancesheets at fair value on a recurring basis (“recurring assets”) that were classified as Level 3 as of March 31, 2012and December 31, 2011. The availability of observable market inputs to measure fair value varies based onchanges in market conditions, such as liquidity. As a result, we expect the amount of financial instrumentscarried at fair value on a recurring basis and classified as Level 3 to vary each period.
16

Table 4: Level 3 Recurring Financial Assets at Fair Value
As of
March 31, 2012 December 31, 2011
(Dollars in millions)
Trading securities . . . . . . . . . . . . . . . . . . . . . . . . . . . . . . . . . . . . . . . . . . . . . . . . . $ 2,756 $ 4,238
Available-for-sale securities . . . . . . . . . . . . . . . . . . . . . . . . . . . . . . . . . . . . . . . . 27,853 29,492
Mortgage loans . . . . . . . . . . . . . . . . . . . . . . . . . . . . . . . . . . . . . . . . . . . . . . . . . . . 2,271 2,319
Other assets . . . . . . . . . . . . . . . . . . . . . . . . . . . . . . . . . . . . . . . . . . . . . . . . . . . . . 203 238
Level 3 recurring assets . . . . . . . . . . . . . . . . . . . . . . . . . . . . . . . . . . . . . . . . . . . . $ 33,083 $ 36,287
Total assets . . . . . . . . . . . . . . . . . . . . . . . . . . . . . . . . . . . . . . . . . . . . . . . . . . . . . . $3,209,940 $3,211,484
Total recurring assets measured at fair value . . . . . . . . . . . . . . . . . . . . . . . . . . . . $ 157,492 $ 156,552
Level 3 recurring assets as a percentage of total assets . . . . . . . . . . . . . . . . . . . . 1% 1%
Level 3 recurring assets as a percentage of total recurring assets measured atfair value . . . . . . . . . . . . . . . . . . . . . . . . . . . . . . . . . . . . . . . . . . . . . . . . . . . . . . 21% 23%
Total recurring assets measured at fair value as a percentage of total assets . . . 5% 5%
Assets measured at fair value on a nonrecurring basis and classified as Level 3, which are not presented in thetable above, primarily include mortgage loans and acquired property. The fair value of Level 3 nonrecurringassets totaled $28.5 billion as of March 31, 2012 and $69.0 billion for the year ended December 31, 2011.
Financial liabilities measured at fair value on a recurring basis and classified as Level 3 consisted of long-termdebt with a fair value of $1.3 billion as of March 31, 2012 and $1.2 billion as of December 31, 2011, and otherliabilities with a fair value of $159 million as of March 31, 2012 and $173 million as of December 31, 2011.
CONSOLIDATED RESULTS OF OPERATIONS
The section below provides a discussion of our condensed consolidated results of operations for the periodsindicated and should be read together with our condensed consolidated financial statements, including theaccompanying notes.
Table 5 displays our condensed consolidated results of operations for the periods indicated.
17

Table 5: Summary of Condensed Consolidated Results of Operations
For the Three MonthsEnded March 31,
2012 2011 Variance
(Dollars in millions)
Net interest income . . . . . . . . . . . . . . . . . . . . . . . . . . . . . . . . . . . . . . . . . . . . . . . . . $ 5,197 $ 4,960 $ 237
Fee and other income . . . . . . . . . . . . . . . . . . . . . . . . . . . . . . . . . . . . . . . . . . . . . . . 375 237 138
Net revenues . . . . . . . . . . . . . . . . . . . . . . . . . . . . . . . . . . . . . . . . . . . . . . . . . . . . . . $ 5,572 $ 5,197 $ 375
Investment gains, net . . . . . . . . . . . . . . . . . . . . . . . . . . . . . . . . . . . . . . . . . . . . . . . . 116 75 41
Net other-than-temporary impairments . . . . . . . . . . . . . . . . . . . . . . . . . . . . . . . . . . (64) (44) (20)
Fair value gains, net . . . . . . . . . . . . . . . . . . . . . . . . . . . . . . . . . . . . . . . . . . . . . . . . 283 289 (6)
Administrative expenses . . . . . . . . . . . . . . . . . . . . . . . . . . . . . . . . . . . . . . . . . . . . . (564) (605) 41
Credit-related expenses
Provision for credit losses . . . . . . . . . . . . . . . . . . . . . . . . . . . . . . . . . . . . . . . . (2,000) (10,554) 8,554
Foreclosed property expense . . . . . . . . . . . . . . . . . . . . . . . . . . . . . . . . . . . . . . (339) (488) 149
Total credit-related expenses . . . . . . . . . . . . . . . . . . . . . . . . . . . . . . . . . (2,339) (11,042) 8,703
Other non-interest expenses(1) . . . . . . . . . . . . . . . . . . . . . . . . . . . . . . . . . . . . . . . . . (286) (339) 53
Income (loss) before federal income taxes . . . . . . . . . . . . . . . . . . . . . . . . . . . . . . . 2,718 (6,469) 9,187
Provision for federal income taxes . . . . . . . . . . . . . . . . . . . . . . . . . . . . . . . . . . . . . — (2) 2
Net income (loss) . . . . . . . . . . . . . . . . . . . . . . . . . . . . . . . . . . . . . . . . . . . . . . . . . . 2,718 (6,471) 9,189
Less: Net loss attributable to the noncontrolling interest . . . . . . . . . . . . . . . . . . . . 1 — 1
Net income (loss) attributable to Fannie Mae . . . . . . . . . . . . . . . . . . . . . . . . . . $ 2,719 $ (6,471) $9,190
Total comprehensive income (loss) attributable to Fannie Mae . . . . . . . . . . . . . . . $ 3,081 $ (6,290) $9,371
(1) Consists of debt extinguishment (losses) gains, net and other expenses.
Net Interest Income
Table 6 displays an analysis of our net interest income, average balances, and related yields earned on assets andincurred on liabilities for the periods indicated. For most components of the average balances, we use a dailyweighted average of amortized cost. When daily average balance information is not available, such as formortgage loans, we use monthly averages. Table 7 displays the change in our net interest income betweenperiods and the extent to which that variance is attributable to: (1) changes in the volume of our interest-earningassets and interest-bearing liabilities or (2) changes in the interest rates of these assets and liabilities.
18

Table 6: Analysis of Net Interest Income and Yield
For the Three Months Ended March 31,
2012 2011
Interest Average Interest AverageAverageBalance
Income/Expense
RatesEarned/Paid
AverageBalance
Income/Expense
RatesEarned/Paid
(Dollars in millions)
Interest-earning assets:Mortgage loans of Fannie Mae . . . . . . . . . . . $ 378,344 $ 3,569 3.77% $ 405,820 $ 3,725 3.67%Mortgage loans of consolidated trusts . . . . . . 2,600,221 29,001 4.46 2,598,508 31,865 4.91
Total mortgage loans . . . . . . . . . . . . . . . 2,978,565 32,570 4.37 3,004,328 35,590 4.74Mortgage-related securities . . . . . . . . . . . . . . 288,449 3,458 4.80 334,057 4,245 5.08Elimination of Fannie Mae MBS held in
portfolio . . . . . . . . . . . . . . . . . . . . . . . . . . . (186,214) (2,305) 4.95 (214,370) (2,793) 5.21
Total mortgage-related securities, net . . . . 102,235 1,153 4.51 119,687 1,452 4.85Non-mortgage securities(1) . . . . . . . . . . . . . . . 68,936 23 0.13 79,719 45 0.23Federal funds sold and securities purchased
under agreements to resell or similararrangements . . . . . . . . . . . . . . . . . . . . . . . 37,485 13 0.14 13,743 7 0.20
Advances to lenders . . . . . . . . . . . . . . . . . . . . 5,050 25 1.96 4,089 21 2.05
Total interest-earning assets . . . . . . . . . . . . . . . . $ 3,192,271 $ 33,784 4.23% $ 3,221,566 $ 37,115 4.61%
Interest-bearing liabilities:Short-term debt(2) . . . . . . . . . . . . . . . . . . . . . . $ 133,307 $ 41 0.12% $ 138,848 $ 104 0.30%Long-term debt . . . . . . . . . . . . . . . . . . . . . . . . 578,155 3,185 2.20 631,917 4,196 2.66
Total short-term and long-termfunding debt . . . . . . . . . . . . . . . . . . . . . . 711,462 3,226 1.81 770,765 4,300 2.23
Debt securities of consolidated trusts . . . . . . . 2,666,552 27,666 4.15 2,652,024 30,648 4.62Elimination of Fannie Mae MBS held in
portfolio . . . . . . . . . . . . . . . . . . . . . . . . . . . (186,214) (2,305) 4.95 (214,370) (2,793) 5.21
Total debt securities of consolidated trustsheld by third parties . . . . . . . . . . . . . . . . 2,480,338 25,361 4.09 2,437,654 27,855 4.57
Total interest-bearing liabilities . . . . . . . . . . . . . $ 3,191,800 $ 28,587 3.58% $ 3,208,419 $ 32,155 4.01%
Impact of net non-interest bearing funding . . . . $ 471 0.00% $ 13,147 0.02%
Net interest income/net interest yield . . . . . . . . . $ 5,197 0.65% $ 4,960 0.62%
Net interest income/net interest yield ofconsolidated trusts(3) . . . . . . . . . . . . . . . . . . . . $ 1,335 0.21% $ 1,217 0.19%
As of March 31,
Selected benchmark interest rates(4) 2012 2011
3-month LIBOR . . . . . . . . . . . . . . . . . . . . . . . . . . . . . . . . . . . . . . . . . . . . . . . . . . . . . . . . . . . . 0.47% 0.30%2-year swap rate . . . . . . . . . . . . . . . . . . . . . . . . . . . . . . . . . . . . . . . . . . . . . . . . . . . . . . . . . . . . 0.58 1.005-year swap rate . . . . . . . . . . . . . . . . . . . . . . . . . . . . . . . . . . . . . . . . . . . . . . . . . . . . . . . . . . . . 1.27 2.4730-year Fannie Mae MBS par coupon rate . . . . . . . . . . . . . . . . . . . . . . . . . . . . . . . . . . . . . . . . 3.06 4.30
(1) Includes cash equivalents.(2) Includes federal funds purchased and securities sold under agreements to repurchase.(3) Net interest income of consolidated trusts represents interest income from mortgage loans of consolidated trusts less
interest expense from debt securities of consolidated trusts. Net interest yield is calculated based on net interest incomefrom consolidated trusts divided by average balance of mortgage loans of consolidated trusts.
(4) Data from British Bankers’ Association, Thomson Reuters Indices and Bloomberg L.P.
19

Table 7: Rate/Volume Analysis of Changes in Net Interest IncomeFor the Three Months Ended
March 31, 2012 vs. 2011
TotalVariance
Variance Due to:(1)
Volume Rate
(Dollars in millions)Interest income:
Mortgage loans of Fannie Mae . . . . . . . . . . . . . . . . . . . . . . . . . . . . . . . . . . . . . . . . . $ (156) $(257) $ 101Mortgage loans of consolidated trusts . . . . . . . . . . . . . . . . . . . . . . . . . . . . . . . . . . . . (2,864) 21 (2,885)
Total mortgage loans . . . . . . . . . . . . . . . . . . . . . . . . . . . . . . . . . . . . . . . . . . . . . . . (3,020) (236) (2,784)Mortgage-related securities . . . . . . . . . . . . . . . . . . . . . . . . . . . . . . . . . . . . . . . . . . . . (787) (556) (231)Elimination of Fannie Mae MBS held in portfolio . . . . . . . . . . . . . . . . . . . . . . . . . . 488 354 134
Total mortgage-related securities, net . . . . . . . . . . . . . . . . . . . . . . . . . . . . . . . . . . (299) (202) (97)Non-mortgage securities(2) . . . . . . . . . . . . . . . . . . . . . . . . . . . . . . . . . . . . . . . . . . . . . (22) (5) (17)Federal funds sold and securities purchased under agreements to resell or similar
arrangements . . . . . . . . . . . . . . . . . . . . . . . . . . . . . . . . . . . . . . . . . . . . . . . . . . . . . 6 9 (3)Advances to lenders . . . . . . . . . . . . . . . . . . . . . . . . . . . . . . . . . . . . . . . . . . . . . . . . . 4 5 (1)
Total interest income . . . . . . . . . . . . . . . . . . . . . . . . . . . . . . . . . . . . . . . . . . . . . . . . . . . (3,331) (429) (2,902)
Interest expense:Short-term debt(3) . . . . . . . . . . . . . . . . . . . . . . . . . . . . . . . . . . . . . . . . . . . . . . . . . . . . (63) (4) (59)Long-term debt . . . . . . . . . . . . . . . . . . . . . . . . . . . . . . . . . . . . . . . . . . . . . . . . . . . . . (1,011) (337) (674)
Total short-term and long-term funding debt . . . . . . . . . . . . . . . . . . . . . . . . . . . . (1,074) (341) (733)Debt securities of consolidated trusts . . . . . . . . . . . . . . . . . . . . . . . . . . . . . . . . . . . . (2,982) 167 (3,149)Elimination of Fannie Mae MBS held in portfolio . . . . . . . . . . . . . . . . . . . . . . . . . . 488 354 134
Total debt securities of consolidated trusts held by third parties . . . . . . . . . . . . . (2,494) 521 (3,015)
Total interest expense . . . . . . . . . . . . . . . . . . . . . . . . . . . . . . . . . . . . . . . . . . . . . . . . . . (3,568) 180 (3,748)
Net interest income . . . . . . . . . . . . . . . . . . . . . . . . . . . . . . . . . . . . . . . . . . . . . . . . . . . . $ 237 $(609) $ 846
(1) Combined rate/volume variances are allocated to both rate and volume based on the relative size of each variance.(2) Includes cash equivalents.(3) Includes federal funds purchased and securities sold under agreements to repurchase.
Net interest income increased in the first quarter of 2012, as compared with the first quarter of 2011, primarilydue to lower interest expense on debt, which was partially offset by lower interest income on loans and securities.The primary drivers of these changes were:
• lower interest expense on funding debt due to lower funding needs and lower borrowing rates, whichallowed us to continue to replace higher-cost debt with lower-cost debt;
• lower interest income on mortgage securities due to lower interest rates and a decrease in the balance of ourmortgage securities, as we continue to manage our portfolio requirements; and
• lower interest income on mortgage loans we hold in our portfolio due to a decrease in average balance andnew business acquisitions which continued to replace higher-yielding loans with loans issued at lowermortgage rates. The reduction in interest income was partially offset by a reduction in the amount of interestincome not recognized for nonaccrual mortgage loans, due to a decline in the balance of nonaccrual loans inour condensed consolidated balance sheets as we continue to complete a high number of loan modificationsand foreclosures.
Additionally, our net interest income and net interest yield were higher than they would have otherwise been inthe first quarter of 2012 and 2011 because our debt funding needs were lower than would otherwise have beenrequired as a result of funds we received from Treasury under the senior preferred stock purchase agreement.Further, dividends paid to Treasury are not recognized as interest expense.
Table 8 displays the interest income not recognized for loans on nonaccrual status and the resulting reduction inour net interest yield on total interest earning assets for the periods indicated.
20

Table 8: Impact of Nonaccrual Loans on Net Interest Income
For the Three Months Ended March 31,
2012 2011
InterestIncome notRecognized
forNonaccrual
Loans(1)
Reductionin Net
InterestYield(2)
InterestIncome notRecognized
forNonaccrual
Loans(1)
Reductionin Net
InterestYield(2)
(Dollars in millions)
Mortgage loans of Fannie Mae . . . . . . . . . . . . . . . . . . . . . . . . . . . . $ (982) $(1,362)Mortgage loans of consolidated trusts . . . . . . . . . . . . . . . . . . . . . . . (180) (258)
Total mortgage loans . . . . . . . . . . . . . . . . . . . . . . . . . . . . . . . . . . . . $(1,162) (15)bp $(1,620) (20)bp
(1) Amount includes cash received for loans on nonaccrual status.(2) Calculated based on annualized interest income not recognized divided by total interest-earning assets, expressed in basis
points.
For a discussion of the interest income from the assets we have purchased and the interest expense from the debtwe have issued, see the discussion of our Capital Markets group’s net interest income in “Business SegmentResults.”
Fair Value Gains, Net
Table 9 displays the components of our fair value gains and losses.
Table 9: Fair Value Gains, Net
For the Three Months EndedMarch 31,
2012 2011
(Dollars in millions)
Risk management derivatives fair value gains (losses) attributable to:
Net contractual interest expense accruals on interest rate swaps . . . . . . . . . . . . . . . . $(374) $(635)
Net change in fair value during the period . . . . . . . . . . . . . . . . . . . . . . . . . . . . . . . . . 553 751
Total risk management derivatives fair value gains, net . . . . . . . . . . . . . . . . . . . . 179 116
Mortgage commitment derivatives fair value (losses) gains, net . . . . . . . . . . . . . . . . . . (205) 23
Total derivatives fair value (losses) gains, net . . . . . . . . . . . . . . . . . . . . . . . . . . . . . . . . (26) 139
Trading securities gains, net . . . . . . . . . . . . . . . . . . . . . . . . . . . . . . . . . . . . . . . . . . . . . . 284 225
Other, net(1) . . . . . . . . . . . . . . . . . . . . . . . . . . . . . . . . . . . . . . . . . . . . . . . . . . . . . . . . . . . 25 (75)
Fair value gains, net . . . . . . . . . . . . . . . . . . . . . . . . . . . . . . . . . . . . . . . . . . . . . . . . . . $ 283 $ 289
2012 2011
5-year swap rate:
As of January 1 . . . . . . . . . . . . . . . . . . . . . . . . . . . . . . . . . . . . . . . . . . . . . . . . . . . . . . 1.22% 2.18%
As of March 31 . . . . . . . . . . . . . . . . . . . . . . . . . . . . . . . . . . . . . . . . . . . . . . . . . . . . . . 1.27 2.47
(1) Consists of debt fair value gains (losses), net, debt foreign exchange gains (losses), net, and mortgage loans fair valuegains (losses), net.
We can expect high levels of period-to-period volatility in our results of operations and financial condition due tochanges in market conditions that result in periodic fluctuations in the estimated fair value of financialinstruments that we mark to market through our earnings. These instruments include trading securities andderivatives. The estimated fair value of our trading securities and derivatives may fluctuate substantially from
21
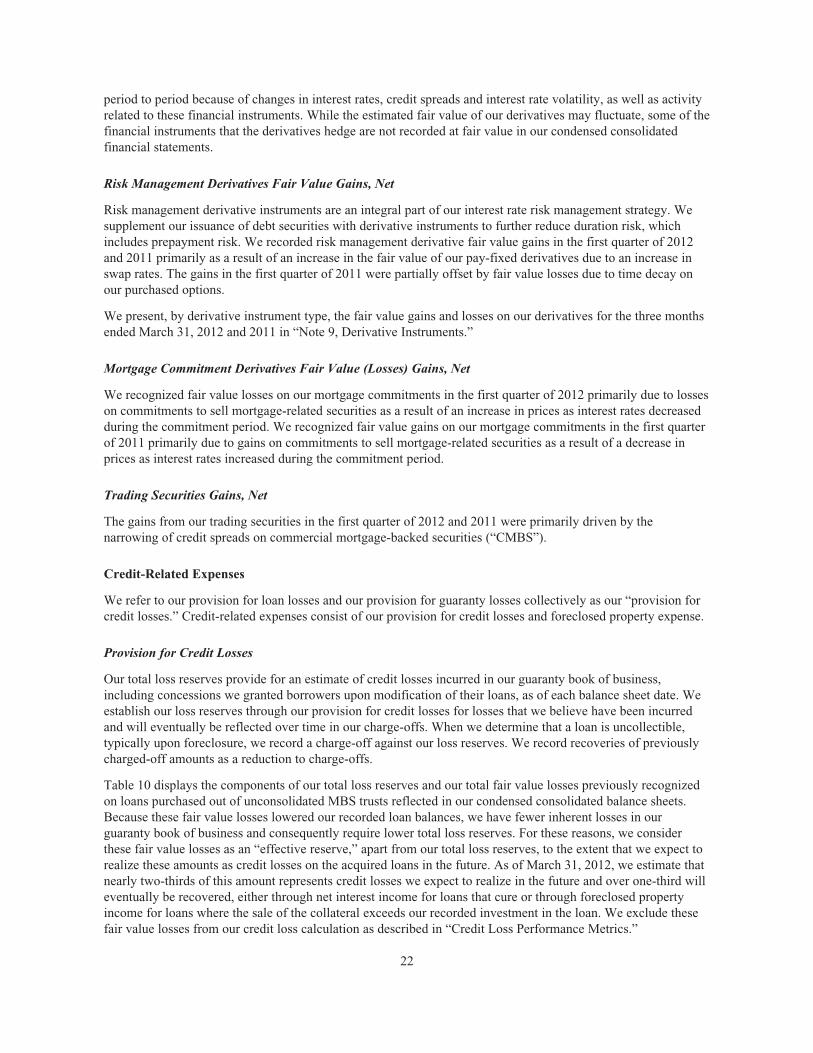
period to period because of changes in interest rates, credit spreads and interest rate volatility, as well as activityrelated to these financial instruments. While the estimated fair value of our derivatives may fluctuate, some of thefinancial instruments that the derivatives hedge are not recorded at fair value in our condensed consolidatedfinancial statements.
Risk Management Derivatives Fair Value Gains, Net
Risk management derivative instruments are an integral part of our interest rate risk management strategy. Wesupplement our issuance of debt securities with derivative instruments to further reduce duration risk, whichincludes prepayment risk. We recorded risk management derivative fair value gains in the first quarter of 2012and 2011 primarily as a result of an increase in the fair value of our pay-fixed derivatives due to an increase inswap rates. The gains in the first quarter of 2011 were partially offset by fair value losses due to time decay onour purchased options.
We present, by derivative instrument type, the fair value gains and losses on our derivatives for the three monthsended March 31, 2012 and 2011 in “Note 9, Derivative Instruments.”
Mortgage Commitment Derivatives Fair Value (Losses) Gains, Net
We recognized fair value losses on our mortgage commitments in the first quarter of 2012 primarily due to losseson commitments to sell mortgage-related securities as a result of an increase in prices as interest rates decreasedduring the commitment period. We recognized fair value gains on our mortgage commitments in the first quarterof 2011 primarily due to gains on commitments to sell mortgage-related securities as a result of a decrease inprices as interest rates increased during the commitment period.
Trading Securities Gains, Net
The gains from our trading securities in the first quarter of 2012 and 2011 were primarily driven by thenarrowing of credit spreads on commercial mortgage-backed securities (“CMBS”).
Credit-Related Expenses
We refer to our provision for loan losses and our provision for guaranty losses collectively as our “provision forcredit losses.” Credit-related expenses consist of our provision for credit losses and foreclosed property expense.
Provision for Credit Losses
Our total loss reserves provide for an estimate of credit losses incurred in our guaranty book of business,including concessions we granted borrowers upon modification of their loans, as of each balance sheet date. Weestablish our loss reserves through our provision for credit losses for losses that we believe have been incurredand will eventually be reflected over time in our charge-offs. When we determine that a loan is uncollectible,typically upon foreclosure, we record a charge-off against our loss reserves. We record recoveries of previouslycharged-off amounts as a reduction to charge-offs.
Table 10 displays the components of our total loss reserves and our total fair value losses previously recognizedon loans purchased out of unconsolidated MBS trusts reflected in our condensed consolidated balance sheets.Because these fair value losses lowered our recorded loan balances, we have fewer inherent losses in ourguaranty book of business and consequently require lower total loss reserves. For these reasons, we considerthese fair value losses as an “effective reserve,” apart from our total loss reserves, to the extent that we expect torealize these amounts as credit losses on the acquired loans in the future. As of March 31, 2012, we estimate thatnearly two-thirds of this amount represents credit losses we expect to realize in the future and over one-third willeventually be recovered, either through net interest income for loans that cure or through foreclosed propertyincome for loans where the sale of the collateral exceeds our recorded investment in the loan. We exclude thesefair value losses from our credit loss calculation as described in “Credit Loss Performance Metrics.”
22

Table 10: Total Loss Reserves
As of
March 31, 2012 December 31, 2011
(Dollars in millions)
Allowance for loan losses . . . . . . . . . . . . . . . . . . . . . . . . . . . . . . . . . . . . . . . . . . . . . . . . . $70,109 $72,156
Reserve for guaranty losses(1) . . . . . . . . . . . . . . . . . . . . . . . . . . . . . . . . . . . . . . . . . . . . . . . 997 994
Combined loss reserves . . . . . . . . . . . . . . . . . . . . . . . . . . . . . . . . . . . . . . . . . . . . . . . . . 71,106 73,150
Allowance for accrued interest receivable . . . . . . . . . . . . . . . . . . . . . . . . . . . . . . . . . . . . 2,223 2,496
Allowance for preforeclosure property taxes and insurance receivable(2) . . . . . . . . . . . . . 1,282 1,292
Total loss reserves . . . . . . . . . . . . . . . . . . . . . . . . . . . . . . . . . . . . . . . . . . . . . . . . . . . . . 74,611 76,938
Fair value losses previously recognized on acquired credit impaired loans(3) . . . . . . . . . . 15,609 16,273
Total loss reserves and fair value losses previously recognized on acquired credit-impaired loans . . . . . . . . . . . . . . . . . . . . . . . . . . . . . . . . . . . . . . . . . . . . . . . . . . . . . . $90,220 $93,211
(1) Amount included in “Other liabilities” in our condensed consolidated balance sheets.(2) Amount included in “Other assets” in our condensed consolidated balance sheets.(3) Represents the fair value losses on loans purchased out of previously unconsolidated MBS trusts reflected in our
condensed consolidated balance sheets.
23

The following table displays changes in the total allowance for loan losses, reserve for guaranty losses and thetotal combined loss reserves for the three months ended March 31, 2012 and 2011.
Table 11: Allowance for Loan Losses and Reserve for Guaranty Losses (Combined Loss Reserves)
For the Three Months Ended March 31,
2012 2011
OfFannie
Mae
OfConsolidated
Trusts Total
OfFannie
Mae
OfConsolidated
Trusts Total
(Dollars in millions)
Changes in combined loss reserves:Allowance for loan losses(1):
Beginning balance . . . . . . . . . . . . . . . . . . . . . . . . . . . . . . . $57,309 $14,847 $72,156 $48,530 $13,026 $61,556Provision for loan losses . . . . . . . . . . . . . . . . . . . . . . . . 1,383 597 1,980 7,159 3,428 10,587Charge-offs(2)(3) . . . . . . . . . . . . . . . . . . . . . . . . . . . . . . . . (4,533) (263) (4,796) (5,705) (448) (6,153)Recoveries . . . . . . . . . . . . . . . . . . . . . . . . . . . . . . . . . . . 421 65 486 530 952 1,482Transfers(4) . . . . . . . . . . . . . . . . . . . . . . . . . . . . . . . . . . . 2,201 (2,201) — 3,207 (3,207) —Other(5) . . . . . . . . . . . . . . . . . . . . . . . . . . . . . . . . . . . . . . 220 63 283 (13) 98 85
Ending balance(6) . . . . . . . . . . . . . . . . . . . . . . . . . . . . . . . . $57,001 $13,108 $70,109 $53,708 $13,849 $67,557
Reserve for guaranty losses:Beginning balance . . . . . . . . . . . . . . . . . . . . . . . . . . . . . . . $ 994 $ — $ 994 $ 323 $ — $ 323
Provision (benefit) for guaranty losses . . . . . . . . . . . . . 20 — 20 (33) — (33)Charge-offs . . . . . . . . . . . . . . . . . . . . . . . . . . . . . . . . . . (51) — (51) (35) — (35)Recoveries . . . . . . . . . . . . . . . . . . . . . . . . . . . . . . . . . . . 34 — 34 2 — 2
Ending balance . . . . . . . . . . . . . . . . . . . . . . . . . . . . . . . . . $ 997 $ — $ 997 $ 257 $ — $ 257
Combined loss reserves(1):Beginning balance . . . . . . . . . . . . . . . . . . . . . . . . . . . . . . . $58,303 $14,847 $73,150 $48,853 $13,026 $61,879
Total provision for credit losses . . . . . . . . . . . . . . . . . . 1,403 597 2,000 7,126 3,428 10,554Charge-offs(2)(3) . . . . . . . . . . . . . . . . . . . . . . . . . . . . . . . . (4,584) (263) (4,847) (5,740) (448) (6,188)Recoveries . . . . . . . . . . . . . . . . . . . . . . . . . . . . . . . . . . . 455 65 520 532 952 1,484Transfers(4) . . . . . . . . . . . . . . . . . . . . . . . . . . . . . . . . . . . 2,201 (2,201) — 3,207 (3,207) —Other(5) . . . . . . . . . . . . . . . . . . . . . . . . . . . . . . . . . . . . . . 220 63 283 (13) 98 85
Ending balance(6) . . . . . . . . . . . . . . . . . . . . . . . . . . . . . . . . $57,998 $13,108 $71,106 $53,965 $13,849 $67,814
As of
March 31,2012
December 31,2011
Allocation of combined loss reserves:Balance at end of each period attributable to:
Single-family . . . . . . . . . . . . . . . . . . . . . . . . . . . . . . . . . . . . . . . . . . . . . . . . . . . . . . . . . . . . . . . . . . . $69,633 $71,512Multifamily . . . . . . . . . . . . . . . . . . . . . . . . . . . . . . . . . . . . . . . . . . . . . . . . . . . . . . . . . . . . . . . . . . . . . 1,473 1,638
Total . . . . . . . . . . . . . . . . . . . . . . . . . . . . . . . . . . . . . . . . . . . . . . . . . . . . . . . . . . . . . . . . . . . . . . . . . . $71,106 $73,150
Single-family and multifamily combined loss reserves as a percentage of applicable guarantybook of business:Single-family . . . . . . . . . . . . . . . . . . . . . . . . . . . . . . . . . . . . . . . . . . . . . . . . . . . . . . . . . . . . . . . . . . . 2.44% 2.52%Multifamily . . . . . . . . . . . . . . . . . . . . . . . . . . . . . . . . . . . . . . . . . . . . . . . . . . . . . . . . . . . . . . . . . . . . 0.75 0.84
Combined loss reserves as a percentage of:Total guaranty book of business . . . . . . . . . . . . . . . . . . . . . . . . . . . . . . . . . . . . . . . . . . . . . . . . . . . . 2.33% 2.41%Recorded investment in nonperforming loans . . . . . . . . . . . . . . . . . . . . . . . . . . . . . . . . . . . . . . . . . . 28.79 29.03
24

(1) Includes an out-of-period adjustment of $548 million to increase the provision for loan losses for the three months endedMarch 31, 2012.
(2) Includes accrued interest of $273 million and $386 million for the three months ended March 31, 2012 and 2011,respectively.
(3) While we purchase the substantial majority of loans that are four or more months delinquent from our MBS trusts, we donot exercise this option to purchase loans during a forbearance period. Accordingly, charge-offs of consolidated trustsgenerally represent loans that remained in our consolidated trusts at the time of default.
(4) Includes transfers from trusts for delinquent loan purchases.(5) Amounts represent the net activity recorded in our allowances for accrued interest receivable and preforeclosure property
taxes and insurance receivable from borrowers. The provision for credit losses, charge-offs, recoveries and transferactivity included in this table reflects all changes for both the allowance for loan losses and the valuation allowances foraccrued interest and preforeclosure property taxes and insurance receivable that relate to the mortgage loans.
(6) Includes $353 million and $412 million as of March 31, 2012 and 2011, respectively, for acquired credit-impaired loans.
Our provision for credit losses continues to be a key driver of our results for each period presented. The amountof our provision for credit losses varies from period to period based on changes in actual and expected homeprices, borrower payment behavior, the types and volumes of loss mitigation activities and foreclosurescompleted, and actual and estimated recoveries from our lender and mortgage insurer counterparties. See “RiskManagement— Credit Risk Management—Institutional Counterparty Credit Risk Management” for informationon mortgage insurers and outstanding mortgage seller/servicer repurchase obligations. In addition, our provisionfor credit losses and our loss reserves can be impacted by updates to our allowance for loan loss models that weuse to estimate our loss reserves.
In April 2012, FHFA issued an Advisory Bulletin that could have an impact on our provision for credit losses inthe future; however, we are still assessing the impact of the Advisory Bulletin. See “Legislative and RegulatoryDevelopments—FHFA Advisory Bulletin Regarding Framework for Adversely Classifying Loans” for additionalinformation.
Our provision for credit losses significantly decreased in the first quarter of 2012 compared with the first quarterof 2011 primarily due to: (1) a less significant decline in home prices as the housing market continued tostabilize; we estimate that home prices declined by 0.8% in the first quarter of 2012 compared with a 2.0%decline in the first quarter of 2011, which represented over half of the 2011 home price decline; (2) improvedsales prices on dispositions of our REO inventory resulting from strong demand in markets with limited REOsupply; and (3) lower single-family serious delinquency rates, which declined to 3.67% as of the end of the firstquarter of 2012 from 4.27% as of the end of the first quarter of 2011. We discuss our expectations regarding ourfuture credit-related expenses and loss reserves in “Executive Summary—Summary of Our FinancialPerformance for the First Quarter of 2012—Our Expectations Regarding Future Loss Reserves and Credit-Related Expenses.”
We continue to experience high volumes of loan modifications involving concessions to borrowers, which areconsidered troubled debt restructurings (“TDRs”). Individual impairment for a TDR is based on the restructuredloan’s expected cash flows over the life of the loan, taking into account the effect of any concessions granted tothe borrower, discounted at the loan’s original effective interest rate. The allowance calculated for anindividually impaired loan has generally been greater than the allowance that would be calculated under thecollective reserve.
Nonperforming Loans
Our balance of nonperforming single-family loans remained high as of March 31, 2012 due to both high levels ofdelinquencies and an increase in TDRs. When a TDR occurs, the loan may return to a current status, but it willcontinue to be classified as a nonperforming loan as the loan is not performing in accordance with its originalterms. Table 12 displays the composition of our nonperforming loans, which includes our single-family andmultifamily held-for-investment and held-for-sale mortgage loans. For information on the impact of TDRs andother individually impaired loans on our allowance for loan losses, see “Note 3, Mortgage Loans.”
25
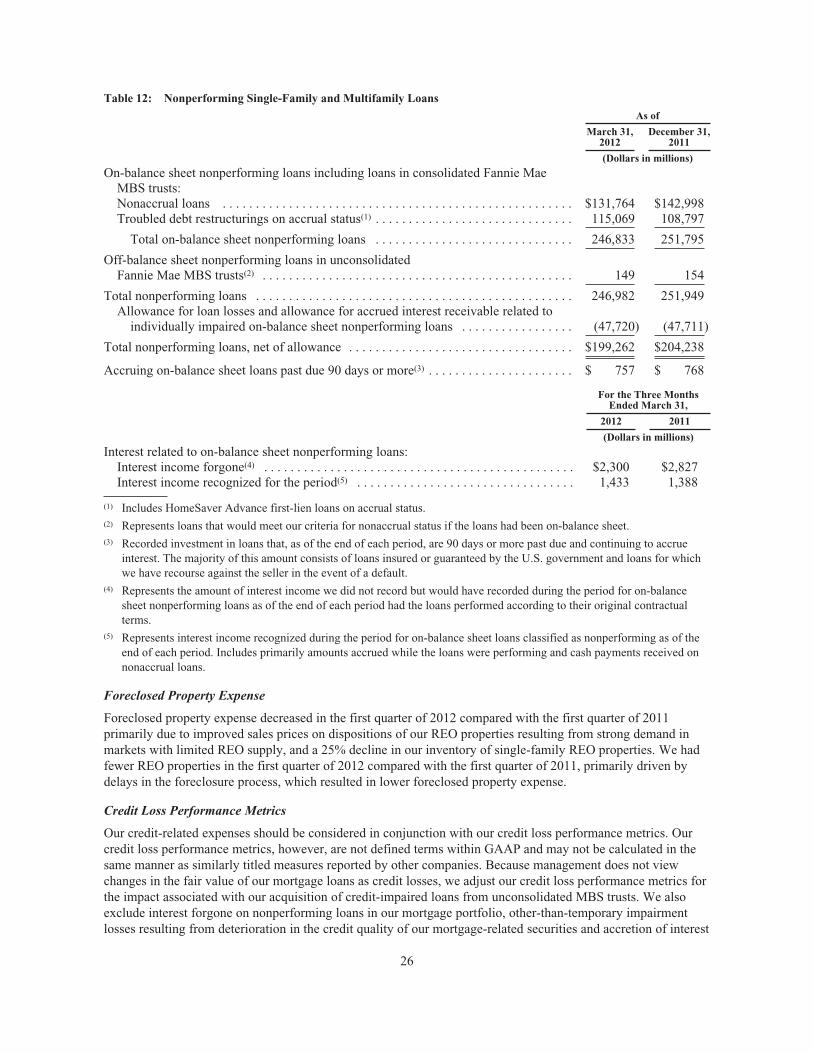
Table 12: Nonperforming Single-Family and Multifamily Loans
As of
March 31,2012
December 31,2011
(Dollars in millions)
On-balance sheet nonperforming loans including loans in consolidated Fannie MaeMBS trusts:Nonaccrual loans . . . . . . . . . . . . . . . . . . . . . . . . . . . . . . . . . . . . . . . . . . . . . . . . . . . . . $131,764 $142,998Troubled debt restructurings on accrual status(1) . . . . . . . . . . . . . . . . . . . . . . . . . . . . . . 115,069 108,797
Total on-balance sheet nonperforming loans . . . . . . . . . . . . . . . . . . . . . . . . . . . . . . 246,833 251,795
Off-balance sheet nonperforming loans in unconsolidatedFannie Mae MBS trusts(2) . . . . . . . . . . . . . . . . . . . . . . . . . . . . . . . . . . . . . . . . . . . . . . . 149 154
Total nonperforming loans . . . . . . . . . . . . . . . . . . . . . . . . . . . . . . . . . . . . . . . . . . . . . . . . 246,982 251,949Allowance for loan losses and allowance for accrued interest receivable related to
individually impaired on-balance sheet nonperforming loans . . . . . . . . . . . . . . . . . (47,720) (47,711)
Total nonperforming loans, net of allowance . . . . . . . . . . . . . . . . . . . . . . . . . . . . . . . . . . $199,262 $204,238
Accruing on-balance sheet loans past due 90 days or more(3) . . . . . . . . . . . . . . . . . . . . . . $ 757 $ 768
For the Three MonthsEnded March 31,
2012 2011
(Dollars in millions)
Interest related to on-balance sheet nonperforming loans:Interest income forgone(4) . . . . . . . . . . . . . . . . . . . . . . . . . . . . . . . . . . . . . . . . . . . . . . . $2,300 $2,827Interest income recognized for the period(5) . . . . . . . . . . . . . . . . . . . . . . . . . . . . . . . . . 1,433 1,388
(1) Includes HomeSaver Advance first-lien loans on accrual status.(2) Represents loans that would meet our criteria for nonaccrual status if the loans had been on-balance sheet.(3) Recorded investment in loans that, as of the end of each period, are 90 days or more past due and continuing to accrue
interest. The majority of this amount consists of loans insured or guaranteed by the U.S. government and loans for whichwe have recourse against the seller in the event of a default.
(4) Represents the amount of interest income we did not record but would have recorded during the period for on-balancesheet nonperforming loans as of the end of each period had the loans performed according to their original contractualterms.
(5) Represents interest income recognized during the period for on-balance sheet loans classified as nonperforming as of theend of each period. Includes primarily amounts accrued while the loans were performing and cash payments received onnonaccrual loans.
Foreclosed Property Expense
Foreclosed property expense decreased in the first quarter of 2012 compared with the first quarter of 2011primarily due to improved sales prices on dispositions of our REO properties resulting from strong demand inmarkets with limited REO supply, and a 25% decline in our inventory of single-family REO properties. We hadfewer REO properties in the first quarter of 2012 compared with the first quarter of 2011, primarily driven bydelays in the foreclosure process, which resulted in lower foreclosed property expense.
Credit Loss Performance Metrics
Our credit-related expenses should be considered in conjunction with our credit loss performance metrics. Ourcredit loss performance metrics, however, are not defined terms within GAAP and may not be calculated in thesame manner as similarly titled measures reported by other companies. Because management does not viewchanges in the fair value of our mortgage loans as credit losses, we adjust our credit loss performance metrics forthe impact associated with our acquisition of credit-impaired loans from unconsolidated MBS trusts. We alsoexclude interest forgone on nonperforming loans in our mortgage portfolio, other-than-temporary impairmentlosses resulting from deterioration in the credit quality of our mortgage-related securities and accretion of interest
26

income on acquired credit-impaired loans from credit losses. We believe that credit loss performance metricsmay be useful to investors as the losses are presented as a percentage of our book of business and havehistorically been used by analysts, investors and other companies within the financial services industry.Moreover, by presenting credit losses with and without the effect of fair value losses associated with theacquisition of credit-impaired loans, investors are able to evaluate our credit performance on a more consistentbasis among periods.
Table 13 displays the components of our credit loss performance metrics as well as our average single-family andmultifamily default rate and initial charge-off severity rate.
Table 13: Credit Loss Performance Metrics
For the Three Months Ended March 31,
2012 2011
Amount Ratio(1) Amount Ratio(1)
(Dollars in millions)
Charge-offs, net of recoveries . . . . . . . . . . . . . . . . . . . . . . . . . . . . . . . . . . . . . $4,327 56.8bp $4,704 61.2bpForeclosed property expense . . . . . . . . . . . . . . . . . . . . . . . . . . . . . . . . . . . . . . 339 4.5 488 6.4
Credit losses including the effect of fair value losses on acquiredcredit-impaired loans . . . . . . . . . . . . . . . . . . . . . . . . . . . . . . . . . . . . . . . . . 4,666 61.3 5,192 67.6
Plus: Impact of acquired credit-impaired loans on charge-offs, foreclosedproperty expense(2) . . . . . . . . . . . . . . . . . . . . . . . . . . . . . . . . . . . . . . . . . . . . 425 5.6 494 6.5
Credit losses and credit loss ratio . . . . . . . . . . . . . . . . . . . . . . . . . . . . . . . . . . $5,091 66.9bp $5,686 74.1bp
Credit losses attributable to:Single-family . . . . . . . . . . . . . . . . . . . . . . . . . . . . . . . . . . . . . . . . . . . . . . . $4,955 $5,604Multifamily . . . . . . . . . . . . . . . . . . . . . . . . . . . . . . . . . . . . . . . . . . . . . . . . . 136 82
Total . . . . . . . . . . . . . . . . . . . . . . . . . . . . . . . . . . . . . . . . . . . . . . . . . . . . . . $5,091 $5,686
Single-family default rate . . . . . . . . . . . . . . . . . . . . . . . . . . . . . . . . . . . . . . . . 0.41% 0.44%Single-family initial charge-off severity rate(3) . . . . . . . . . . . . . . . . . . . . . . . . 33.43% 35.93%Average multifamily default rate . . . . . . . . . . . . . . . . . . . . . . . . . . . . . . . . . . 0.15% 0.12%Average multifamily initial charge-off severity rate(3) . . . . . . . . . . . . . . . . . . 43.95% 36.85%
(1) Basis points are based on the annualized amount for each line item presented divided by the average guaranty book ofbusiness during the period.
(2) Includes fair value losses from acquired credit impaired loans.(3) Single-family and multifamily rates exclude fair value losses on credit-impaired loans acquired from MBS trusts and any
costs, gains or losses associated with REO after initial acquisition through final disposition; single-family rate excludescharge-offs from short sales.
Credit losses decreased in the first quarter of 2012 compared with the first quarter of 2011 primarily due to:(1) improved sales prices on dispositions of our REO property; and (2) lower REO acquisitions primarily due todelays in the foreclosure process.
Our 2009 through first quarter of 2012 vintages accounted for approximately 3% of our single-family creditlosses for the first quarter of 2012. Credit losses on mortgage loans typically do not peak until the third throughsixth years following origination; however, this range can vary based on many factors, including changes inmacroeconomic conditions and foreclosure timelines. We provide more detailed credit performance information,including serious delinquency rates by geographic region and foreclosure activity, in “Risk Management—CreditRisk Management—Mortgage Credit Risk Management.”
Regulatory Hypothetical Stress Test Scenario
Under a September 2005 agreement with FHFA’s predecessor, the Office of Federal Housing EnterpriseOversight, we are required to disclose on a quarterly basis the present value of the change in future expectedcredit losses from our existing single-family guaranty book of business from an immediate 5% decline in single-
27

family home prices for the entire United States followed by a return to the average of the possible growth ratepaths used in our internal credit pricing models. The sensitivity results represent the difference between futureexpected credit losses under our base case scenario, which is derived from our internal home price path forecast,and a scenario that assumes an instantaneous nationwide 5% decline in home prices.
Table 14 displays the credit loss sensitivities as of the dates indicated for first-lien single-family whole loans weown or that back Fannie Mae MBS, before and after consideration of projected credit risk sharing proceeds, suchas private mortgage insurance claims and other credit enhancements.
Table 14: Single-Family Credit Loss Sensitivity(1)
As of
March 31,2012
December 31,2011
(Dollars in millions)
Gross single-family credit loss sensitivity . . . . . . . . . . . . . . . . . . . . . . . . . . . . . . . . . . . $ 23,861 $ 21,922Less: Projected credit risk sharing proceeds . . . . . . . . . . . . . . . . . . . . . . . . . . . . . . . . . (1,787) (1,690)
Net single-family credit loss sensitivity . . . . . . . . . . . . . . . . . . . . . . . . . . . . . . . . . . . . . $ 22,074 $ 20,232
Outstanding single-family whole loans and loans underlying Fannie Mae MBS . . . . . $2,785,358 $2,769,454Single-family net credit loss sensitivity as a percentage of outstanding single-family
whole loans and Fannie Mae MBS . . . . . . . . . . . . . . . . . . . . . . . . . . . . . . . . . . . . . . . 0.79% 0.73%
(1) Represents total economic credit losses, which consist of credit losses and forgone interest. Calculations are based on 97%of our total single-family guaranty book of business as of March 31, 2012 and December 31, 2011. The mortgage loansand mortgage-related securities that are included in these estimates consist of: (a) single-family Fannie Mae MBS(whether held in our mortgage portfolio or held by third parties), excluding certain whole loan REMICs and private-labelwraps; (b) single-family mortgage loans, excluding mortgages secured only by second liens, manufactured housing chattelloans and reverse mortgages; and (c) long-term standby commitments. We expect the inclusion in our estimates of theexcluded products may impact the estimated sensitivities set forth in this table.
Because these sensitivities represent hypothetical scenarios, they should be used with caution. Our regulatorystress test scenario is limited in that it assumes an instantaneous uniform 5% nationwide decline in home prices,which is not representative of the historical pattern of changes in home prices. Changes in home prices generallyvary on a regional, as well as a local, basis. In addition, these stress test scenarios are calculated independentlywithout considering changes in other interrelated assumptions, such as unemployment rates or other economicfactors, which are likely to have a significant impact on our future expected credit losses.
BUSINESS SEGMENT RESULTS
Results of our three business segments are intended to reflect each segment as if it were a stand-alone business.Under our segment reporting structure, the sum of the results for our three business segments does not equal ourcondensed consolidated results of operations as we separate the activity related to our consolidated trusts fromthe results generated by our three segments. In addition, because we apply accounting methods that differ fromour condensed consolidated results for segment reporting purposes, we include an eliminations/adjustmentscategory to reconcile our business segment results and the activity related to our consolidated trusts to ourcondensed consolidated results of operations. We describe the management reporting and allocation process usedto generate our segment results in our 2011 Form 10-K in “Notes to Consolidated Financial Statements—Note14, Segment Reporting.” We are working on reorganizing our company by function rather than by business inorder to improve our operational efficiencies and effectiveness. In future periods, we may change some of ourmanagement reporting and how we report our business segment results.
In this section, we summarize our segment results for the first quarter of 2012 and 2011 in the tables below andprovide a comparative discussion of these results. This section should be read together with our comparativediscussion of our condensed consolidated results of operations in “Consolidated Results of Operations.” See“Note 10, Segment Reporting” of this report for a reconciliation of our segment results to our condensedconsolidated results.
28

Single-Family Business Results
Table 15 displays the financial results of our Single-Family business for the periods indicated. The primarysource of revenue for our Single-Family business is guaranty fee income. Expenses primarily include credit-related expenses, net interest loss and administrative expenses.
Table 15: Single-Family Business Results
For the Three Months Ended March 31,
2012 2011 Variance
(Dollars in millions)
Net interest loss . . . . . . . . . . . . . . . . . . . . . . . . . . . . . . . . . . . . . . . . . . . $ (379) $ (898) $ 519Guaranty fee income(1) . . . . . . . . . . . . . . . . . . . . . . . . . . . . . . . . . . . . . . 1,911 1,871 40Credit-related expenses(2) . . . . . . . . . . . . . . . . . . . . . . . . . . . . . . . . . . . . (2,385) (11,106) 8,721Other expenses(3) . . . . . . . . . . . . . . . . . . . . . . . . . . . . . . . . . . . . . . . . . . . (415) (586) 171
Loss before federal income taxes . . . . . . . . . . . . . . . . . . . . . . . . . . . . . (1,268) (10,719) 9,451Provision for federal income taxes . . . . . . . . . . . . . . . . . . . . . . . . . . . . — (2) 2
Net loss attributable to Fannie Mae . . . . . . . . . . . . . . . . . . . . . . . . . . . . $ (1,268) $ (10,721) $9,453
Single-family effective guaranty fee rate (in basis points)(4) . . . . . . . . . 26.8 26.0Single-family average charged guaranty fee on new acquisitions
(in basis points)(5) . . . . . . . . . . . . . . . . . . . . . . . . . . . . . . . . . . . . . . . . 28.9 26.1Average single-family guaranty book of business(6) . . . . . . . . . . . . . . . . $2,850,007 $2,881,300Single-family Fannie Mae MBS issuances(7) . . . . . . . . . . . . . . . . . . . . . $ 196,755 $ 166,673
(1) Guaranty fee income is included in fee and other income in our condensed consolidated statements of operations andcomprehensive income (loss).
(2) Consists of the provision for credit losses and foreclosed property expense.(3) Consists of investment gains, net, fair value losses, fee and other income, administrative expenses and other expenses.(4) Calculated based on annualized Single-Family segment guaranty fee income divided by the average single-family
guaranty book of business, expressed in basis points.(5) Calculated based on the average contractual fee rate for our single-family guaranty arrangements entered into during the
period plus the recognition of any upfront cash payments ratably over an estimated average life, expressed in basis points.(6) Consists of single-family mortgage loans held in our mortgage portfolio, single-family mortgage loans held by
consolidated trusts, single-family Fannie Mae MBS issued from unconsolidated trusts held by either third parties or withinour retained portfolio, and other credit enhancements that we provide on single-family mortgage assets. Excludesnon-Fannie Mae mortgage-related securities held in our investment portfolio for which we do not provide a guaranty.
(7) Reflects unpaid principal balance of Fannie Mae MBS issued and guaranteed by the Single-Family segment during theperiod.
Our average single-family guaranty book of business was relatively flat period over period despite our continuedhigh market share because of the decline in U.S. residential mortgage debt outstanding. Our estimated marketshare of new single-family mortgage-related securities issuances, which excludes previously securitizedmortgages, remained high at 51% for the first quarter of 2012 compared with 49% for the first quarter of 2011.
Net Interest Loss
Net interest loss for the Single-Family business segment primarily consists of: (1) the cost to reimburse theCapital Markets group for interest income not recognized for loans in our mortgage portfolio on nonaccrualstatus; (2) the cost to reimburse MBS trusts for interest income not recognized for loans in consolidated trusts onnonaccrual status; and (3) income from cash payments received on loans that have been placed on nonaccrualstatus.
29

Net interest loss decreased in the first quarter of 2012 compared with the first quarter of 2011 primarily due to asignificant decrease in interest income not recognized for loans on nonaccrual status as high loan workoutvolumes over the past several quarters have driven the decline in the number of loans on nonaccrual status.
Credit-Related Expenses
Credit-related expenses and credit losses in the Single-Family business represent the substantial majority of ourconsolidated totals. We provide a discussion of our credit-related expenses and credit losses in “ConsolidatedResults of Operations—Credit-Related Expenses.”
Multifamily Business Results
Multifamily business results primarily reflect our multifamily guaranty business. Our multifamily businessresults also include activity relating to our low income housing tax credit (“LIHTC”) and equity investments.Although we are no longer making new LIHTC or equity investments, we continue to make contractuallyrequired contributions for our legacy investments. Activity from multifamily products is also reflected in theCapital Markets group results, which include net interest income related to multifamily loans and securities,gains and losses from the sale of multifamily Fannie Mae MBS and re-securitizations, and other miscellaneousincome. Estimated net interest income earned on multifamily mortgage loans and multifamily Fannie Mae MBSin the Capital Markets group results was $204 million for the three months ended March 31, 2012 and $230million for the three months ended March 31, 2011.
Table 16 displays the financial results of our Multifamily business for the periods indicated. The primary sourcesof revenue for our Multifamily business are guaranty fee income and fee and other income. Expenses primarilyinclude administrative expenses.
Table 16: Multifamily Business Results
For the Three Months Ended March 31,
2012 2011 Variance
(Dollars in millions)
Guaranty fee income(1) . . . . . . . . . . . . . . . . . . . . . . . . . . . . . . . . . . . . . . . . . . $ 243 $ 209 $ 34Fee and other income . . . . . . . . . . . . . . . . . . . . . . . . . . . . . . . . . . . . . . . . . . 47 58 (11)Gains (losses) from partnership investments(2) . . . . . . . . . . . . . . . . . . . . . . . 11 (12) 23Credit-related income(3) . . . . . . . . . . . . . . . . . . . . . . . . . . . . . . . . . . . . . . . . . 46 64 (18)Other expenses(4) . . . . . . . . . . . . . . . . . . . . . . . . . . . . . . . . . . . . . . . . . . . . . . (68) (67) (1)
Income before federal income taxes . . . . . . . . . . . . . . . . . . . . . . . . . . . . . . . 279 252 27Provision for federal income taxes . . . . . . . . . . . . . . . . . . . . . . . . . . . . . . . . — (5) 5
Net income attributable to Fannie Mae . . . . . . . . . . . . . . . . . . . . . . . . . . . . . $ 279 $ 247 $ 32
Multifamily effective guaranty fee rate (in basis points)(5) . . . . . . . . . . . . . . 49.6 44.0
Multifamily credit loss performance ratio (in basis points)(6) . . . . . . . . . . . . 27.8 17.3Average multifamily guaranty book of business(7) . . . . . . . . . . . . . . . . . . . . $196,019 $190,012Multifamily new business volumes(8) . . . . . . . . . . . . . . . . . . . . . . . . . . . . . . $ 7,159 $ 5,024Multifamily units financed from new business volumes . . . . . . . . . . . . . . . 117,000 83,000Multifamily Fannie Mae MBS issuances(9) . . . . . . . . . . . . . . . . . . . . . . . . . . $ 8,851 $ 8,581Multifamily Fannie Mae structured securities issuances (issued by Capital
Markets group)(10) . . . . . . . . . . . . . . . . . . . . . . . . . . . . . . . . . . . . . . . . . . . $ 2,238 $ 1,400Additional net interest income earned on Fannie Mae multifamily mortgage
loans and MBS (included in Capital Markets Group's results)(11) . . . . . . . $ 204 $ 230Average Fannie Mae multifamily mortgage loans and MBS in Capital
Markets Group’s portfolio(12) . . . . . . . . . . . . . . . . . . . . . . . . . . . . . . . . . . $103,989 $114,375
30

As of
March 31,2012
December 31,2011
(Dollars in millions)
Multifamily serious delinquency rate . . . . . . . . . . . . . . . . . . . . . . . . . . . . . . . . . . . . . . . . 0.37% 0.59%Percentage of multifamily guaranty book of business with credit enhancement . . . . . . . 90% 90%Fannie Mae percentage of total multifamily mortgage debt outstanding(13) . . . . . . . . . . . 21.2% 21.0%Multifamily Fannie Mae MBS outstanding(14) . . . . . . . . . . . . . . . . . . . . . . . . . . . . . . . . . $107,868 $101,574
(1) Guaranty fee income is included in fee and other income in our condensed consolidated statements of operations andcomprehensive income (loss).
(2) Gains (losses) from partnership investments are included in other expenses in our condensed consolidated statements ofoperations and comprehensive income (loss). Gains (losses) from partnership investments are reported using the equitymethod of accounting. As a result, net income (loss) attributable to noncontrolling interest from partnership investments isnot included in income (loss) for the Multifamily segment.
(3) Consists of the benefit for credit losses and foreclosed property expense.(4) Consists of net interest loss, investment gains, administrative expenses, and other expenses.(5) Calculated based on annualized Multifamily segment guaranty fee income divided by the average multifamily guaranty
book of business, expressed in basis points.(6) Calculated based on the annualized Multifamily credit losses divided by the average multifamily guaranty book of
business, expressed in basis points.(7) Consists of multifamily mortgage loans held in our mortgage portfolio, multifamily mortgage loans held by consolidated
trusts, multifamily Fannie Mae MBS issued from unconsolidated trusts held by either third parties or within our retainedportfolio, and other credit enhancements that we provide on multifamily mortgage assets. Excludes non-Fannie Maemortgage-related securities held in our investment portfolio for which we do not provide a guaranty.
(8) Reflects unpaid principal balance of multifamily Fannie Mae MBS issued (excluding portfolio securitizations) andmultifamily loans purchased during the period.
(9) Reflects unpaid principal balance of multifamily Fannie Mae MBS issued during the period. Includes: (a) issuances ofnew MBS, (b) $1.6 billion and $3.5 billion of Fannie Mae portfolio securitization transactions for the three months endedMarch 31, 2012 and 2011, respectively, and (c) $163 million and $119 million of conversions of adjustable-rate loans tofixed-rate loans and discount MBS (“DMBS”) to MBS for the three months ended March 31, 2012 and 2011, respectively.
(10) Reflects original unpaid principal balance of out-of-portfolio multifamily structured securities issuances by our CapitalMarkets Group.
(11) Interest expense estimate based on allocated duration-matched funding costs. Net interest income was reduced by guarantyfees allocated to Multifamily from the Capital Markets Group on multifamily loans in Fannie Mae’s portfolio.
(12) Based on unpaid principal balance.(13) Includes mortgage loans and Fannie Mae MBS issued and guaranteed by the Multifamily segment. Information as of
March 31, 2012 is as of December 31, 2011 and is based on the Federal Reserve’s December 2011 mortgage debtoutstanding release, the latest date for which the Federal Reserve has estimated mortgage debt outstanding for multifamilyresidences. Information as of December 31, 2011 is as of September 30, 2011 and is based on the Federal Reserve’sSeptember 2011 mortgage debt outstanding release. Prior period amounts may have been changed to reflect revisedhistorical data from the Federal Reserve.
(14) Includes $29.3 billion and $28.3 billion of Fannie Mae multifamily MBS held in the mortgage portfolio, the vast majorityof which have been consolidated to loans in our condensed consolidated balance sheets, as of March 31, 2012 andDecember 31, 2011, respectively; and $1.4 billion of bonds issued by HFAs as of March 31, 2012 and December 31,2011.
Guaranty Fee Income
Multifamily guaranty fee income increased in the first quarter of 2012 compared with the first quarter of 2011primarily due to higher fees charged on new acquisitions. New acquisitions with higher guaranty fees havebecome an increasingly large part of our multifamily guaranty book of business.
Credit-Related Income
Multifamily credit-related income decreased in the first quarter of 2012 compared with the first quarter of 2011,primarily driven by a lower decrease in the reserve for guaranty losses than in the first quarter of 2011.
31

Multifamily credit losses, which consist of net charge-offs and foreclosed property expense, were $136 millionfor the first quarter of 2012 compared with $82 million for the first quarter of 2011. Although nationalmultifamily market fundamentals continued to improve in the first quarter of 2012, certain local markets andproperties continued to underperform compared to the rest of the nation.
Capital Markets Group Results
Table 17 displays the financial results of our Capital Markets group for the periods indicated. Following the tablewe discuss the Capital Markets group’s financial results and describe the Capital Markets group’s mortgageportfolio. For a discussion of the debt issued by the Capital Markets group to fund its investment activities, see“Liquidity and Capital Management.” For a discussion of the derivative instruments that Capital Markets uses tomanage interest rate risk, see “Consolidated Balance Sheet Analysis—Derivative Instruments” and “RiskManagement—Market Risk Management, Including Interest Rate Risk Management—Derivative Instruments”in our 2011 Form 10-K and “Notes to Consolidated Financial Statements—Note 9, Derivative Instruments” inboth this report and our 2011 Form 10-K. The primary sources of revenue for our Capital Markets group are netinterest income and fee and other income. Expenses and other items that impact income or loss primarily includefair value gains and losses, investment gains and losses, allocated guaranty fee expense, other-than-temporaryimpairments and administrative expenses.
Table 17: Capital Markets Group Results
For the Three Months Ended March 31,
2012 2011 Variance
(Dollars in millions)
Net interest income(1) . . . . . . . . . . . . . . . . . . . . . . . . . . . . . . . . . . . . . . . . . . . . $3,541 $3,710 $(169)
Investment gains, net(2) . . . . . . . . . . . . . . . . . . . . . . . . . . . . . . . . . . . . . . . . . . . 1,007 870 137
Net other-than-temporary impairments . . . . . . . . . . . . . . . . . . . . . . . . . . . . . . (64) (44) (20)
Fair value gains, net(3) . . . . . . . . . . . . . . . . . . . . . . . . . . . . . . . . . . . . . . . . . . . . 170 218 (48)
Fee and other income . . . . . . . . . . . . . . . . . . . . . . . . . . . . . . . . . . . . . . . . . . . 180 75 105
Other expenses(4) . . . . . . . . . . . . . . . . . . . . . . . . . . . . . . . . . . . . . . . . . . . . . . . (530) (553) 23
Income before federal income taxes . . . . . . . . . . . . . . . . . . . . . . . . . . . . . . . . 4,304 4,276 28
Benefit for federal income taxes . . . . . . . . . . . . . . . . . . . . . . . . . . . . . . . . . . . — 5 (5)
Net income attributable to Fannie Mae . . . . . . . . . . . . . . . . . . . . . . . . . . . . . . $4,304 $4,281 $ 23
(1) Includes contractual interest income, excluding recoveries, on nonaccrual loans received from the Single-Family segmentof $1.4 billion and $2.0 billion for the three months ended March 31, 2012 and 2011, respectively. Capital Markets netinterest income is reported based on the mortgage-related assets held in the segment’s portfolio and excludes interestincome on mortgage-related assets held by consolidated MBS trusts that are owned by third parties and the interestexpense on the corresponding debt of such trusts.
(2) We include the securities that we own regardless of whether the trust has been consolidated in reporting of gains andlosses on securitizations and sales of available-for-sale securities.
(3) Includes fair value gains or losses on derivatives and trading securities that we own, regardless of whether the trust hasbeen consolidated.
(4) Includes allocated guaranty fee expense, debt extinguishment losses, net, administrative expenses, and other expenses.Gains or losses related to the extinguishment of debt issued by consolidated trusts are excluded from the Capital Marketsgroup’s results because purchases of securities are recognized as such.
Net Interest Income
The Capital Markets group reports interest income and amortization of cost basis adjustments only on securitiesand loans that are held in our portfolio. For mortgage loans held in our mortgage portfolio, when interest incomeis no longer recognized in accordance with our nonaccrual accounting policy, the Capital Markets group
32

recognizes interest income reimbursements that the group receives, for the contractual interest due on nonaccrualloans from the Single-Family and Multifamily businesses. These reimbursements decreased in the first quarter of2012 due to the decrease of nonaccrual loans in our portfolio. The interest expense recognized on the CapitalMarkets group’s statement of operations primarily relates to the cost of our funding debt which is reported as“Debt of Fannie Mae” in our condensed consolidated balance sheets. Net interest income also includes a cost ofcapital charge allocated among the three business segments.
The Capital Markets group’s net interest income decreased in the first quarter of 2012 compared with the firstquarter of 2011 primarily due to a decrease in the balance of mortgage-related securities and lower interest rateson loans in our mortgage portfolio. This decrease in interest income on our interest earning assets was partiallyoffset by a decline in interest expense due to lower funding needs and lower borrowing rates, which allowed us tocontinue to replace higher-cost debt with lower-cost debt.
Our net interest income and net interest yield were higher than they would have otherwise been in the firstquarter of 2012 and 2011 because our debt funding needs were lower than would otherwise have been required asa result of funds we received from Treasury under the senior preferred stock purchase agreement. Further,dividends paid to Treasury are not recognized as interest expense.
We supplement our issuance of debt securities with derivative instruments to further reduce duration risk, whichincludes prepayment risk. The effect of these derivatives, in particular the periodic net interest expense accrualson interest rate swaps, is not reflected in Capital Markets’ net interest income but is included in our results as acomponent of “Fair value gains, net” and is displayed in “Table 9: Fair Value Gains, Net.” If we had included theeconomic impact of adding the net contractual interest accruals on our interest rate swaps in our Capital Markets’interest expense, Capital Markets’ net interest income would have decreased by $374 million in the first quarterof 2012 compared with a decrease of $635 million in the first quarter of 2011.
Investment Gains, Net
Investment gains increased in the first quarter of 2012 compared with the first quarter of 2011 due to a highervolume of securitizations and increased gains on sale of available-for-sale (“AFS”) securities.
Fair Value Gains, Net
The derivatives fair value gains and losses that are reported for the Capital Markets group are consistent with thesame gains and losses reported in our condensed consolidated results of operations. We discuss our derivativesfair value gains and losses in “Consolidated Results of Operations—Fair Value Gains, Net.”
The gains on our trading securities for the segment during the first quarter of 2012 and 2011 were attributable toa narrowing of credit spreads on CMBS, partially offset by losses on agency MBS due to an increase in interestrates during the periods.
The Capital Markets Group’s Mortgage Portfolio
The Capital Markets group’s mortgage portfolio consists of mortgage loans and mortgage-related securities thatwe own. Mortgage-related securities held by Capital Markets include Fannie Mae MBS and non-Fannie Maemortgage-related securities. The Fannie Mae MBS that we own are maintained as securities on the CapitalMarkets group’s balance sheet. Mortgage-related assets held by consolidated MBS trusts are not included in theCapital Markets group’s mortgage portfolio.
The amount of mortgage assets that we may own is restricted by our senior preferred stock purchase agreementwith Treasury. By December 31 of each year, we are required to reduce our mortgage assets to 90% of themaximum allowable amount that we were permitted to own as of December 31 of the immediately precedingcalendar year, until the amount of our mortgage assets reaches $250 billion. The maximum allowable amount ofmortgage assets we may own was reduced to $729 billion as of December 31, 2011 and will be reduced to $656.1billion as of December 31, 2012. As of March 31, 2012, we owned $691.7 billion in mortgage assets, comparedwith $708.4 billion as of December 31, 2011.
33

Table 18 displays our Capital Markets group’s mortgage portfolio activity for the periods indicated.
Table 18: Capital Markets Group’s Mortgage Portfolio Activity(1)
For the Three MonthsEnded March 31,
2012 2011
(Dollars in millions)
Mortgage loans:
Beginning balance . . . . . . . . . . . . . . . . . . . . . . . . . . . . . . . . . . . . . . . . . . . . . . . . . . . . . . $398,271 $427,074
Purchases . . . . . . . . . . . . . . . . . . . . . . . . . . . . . . . . . . . . . . . . . . . . . . . . . . . . . . . . . . . 53,925 38,074
Securitizations(2) . . . . . . . . . . . . . . . . . . . . . . . . . . . . . . . . . . . . . . . . . . . . . . . . . . . . . . (38,372) (23,983)
Liquidations(3) . . . . . . . . . . . . . . . . . . . . . . . . . . . . . . . . . . . . . . . . . . . . . . . . . . . . . . . . (19,047) (19,309)
Mortgage loans, ending balance . . . . . . . . . . . . . . . . . . . . . . . . . . . . . . . . . . . . . . . . . . . . 394,777 421,856
Mortgage securities:
Beginning balance . . . . . . . . . . . . . . . . . . . . . . . . . . . . . . . . . . . . . . . . . . . . . . . . . . . . . . 310,143 361,697
Purchases(4) . . . . . . . . . . . . . . . . . . . . . . . . . . . . . . . . . . . . . . . . . . . . . . . . . . . . . . . . . . 4,971 5,090
Securitizations(2) . . . . . . . . . . . . . . . . . . . . . . . . . . . . . . . . . . . . . . . . . . . . . . . . . . . . . . 38,372 23,983
Sales . . . . . . . . . . . . . . . . . . . . . . . . . . . . . . . . . . . . . . . . . . . . . . . . . . . . . . . . . . . . . . . (41,246) (35,426)
Liquidations(3) . . . . . . . . . . . . . . . . . . . . . . . . . . . . . . . . . . . . . . . . . . . . . . . . . . . . . . . . (15,354) (19,582)
Mortgage securities, ending balance . . . . . . . . . . . . . . . . . . . . . . . . . . . . . . . . . . . . . . . . 296,886 335,762
Total Capital Markets mortgage portfolio . . . . . . . . . . . . . . . . . . . . . . . . . . . . . . . . . . . . . . $691,663 $757,618
(1) Based on unpaid principal balance.(2) Includes portfolio securitization transactions that do not qualify for sale treatment under GAAP.(3) Includes scheduled repayments, prepayments, foreclosures and lender repurchases.(4) Includes purchases of Fannie Mae MBS issued by consolidated trusts.
34

Table 19 displays the composition of the Capital Markets group’s mortgage portfolio as of March 31, 2012 andDecember 31, 2011.
Table 19: Capital Markets Group’s Mortgage Portfolio Composition(1)
As of
March 31,2012
December 31,2011
(Dollars in millions)
Capital Markets group's mortgage loans:Single-family loans
Government insured or guaranteed . . . . . . . . . . . . . . . . . . . . . . . . . . . . . . . . . . . . . . . . $ 41,592 $ 41,555Conventional:
Long-term, fixed-rate . . . . . . . . . . . . . . . . . . . . . . . . . . . . . . . . . . . . . . . . . . . . . . . . 248,326 245,810Intermediate-term, fixed-rate . . . . . . . . . . . . . . . . . . . . . . . . . . . . . . . . . . . . . . . . . . 10,189 10,289Adjustable-rate . . . . . . . . . . . . . . . . . . . . . . . . . . . . . . . . . . . . . . . . . . . . . . . . . . . . . 21,990 23,490
Total single-family conventional . . . . . . . . . . . . . . . . . . . . . . . . . . . . . . . . . . . . . . . . . 280,505 279,589
Total single-family loans . . . . . . . . . . . . . . . . . . . . . . . . . . . . . . . . . . . . . . . . . . . . . . . . . 322,097 321,144
Multifamily loansGovernment insured or guaranteed . . . . . . . . . . . . . . . . . . . . . . . . . . . . . . . . . . . . . . . . 349 362Conventional:
Long-term, fixed-rate . . . . . . . . . . . . . . . . . . . . . . . . . . . . . . . . . . . . . . . . . . . . . . . . 3,512 3,629Intermediate-term, fixed-rate . . . . . . . . . . . . . . . . . . . . . . . . . . . . . . . . . . . . . . . . . . 55,281 58,885Adjustable-rate . . . . . . . . . . . . . . . . . . . . . . . . . . . . . . . . . . . . . . . . . . . . . . . . . . . . . 13,538 14,251
Total multifamily conventional . . . . . . . . . . . . . . . . . . . . . . . . . . . . . . . . . . . . . . . . . . 72,331 76,765
Total multifamily loans . . . . . . . . . . . . . . . . . . . . . . . . . . . . . . . . . . . . . . . . . . . . . . . . . . 72,680 77,127
Total Capital Markets group's mortgage loans . . . . . . . . . . . . . . . . . . . . . . . . . . . . . . . . . 394,777 398,271
Capital Markets group's mortgage-related securities:Fannie Mae . . . . . . . . . . . . . . . . . . . . . . . . . . . . . . . . . . . . . . . . . . . . . . . . . . . . . . . . . . 209,834 220,061Freddie Mac . . . . . . . . . . . . . . . . . . . . . . . . . . . . . . . . . . . . . . . . . . . . . . . . . . . . . . . . . 13,504 14,509Ginnie Mae . . . . . . . . . . . . . . . . . . . . . . . . . . . . . . . . . . . . . . . . . . . . . . . . . . . . . . . . . . 1,015 1,043Alt-A private-label securities . . . . . . . . . . . . . . . . . . . . . . . . . . . . . . . . . . . . . . . . . . . . 19,056 19,670Subprime private-label securities . . . . . . . . . . . . . . . . . . . . . . . . . . . . . . . . . . . . . . . . . 16,175 16,538CMBS . . . . . . . . . . . . . . . . . . . . . . . . . . . . . . . . . . . . . . . . . . . . . . . . . . . . . . . . . . . . . . 22,674 23,226Mortgage revenue bonds . . . . . . . . . . . . . . . . . . . . . . . . . . . . . . . . . . . . . . . . . . . . . . . 10,518 10,899Other mortgage-related securities . . . . . . . . . . . . . . . . . . . . . . . . . . . . . . . . . . . . . . . . . 4,110 4,197
Total Capital Markets group's mortgage-related securities(2) . . . . . . . . . . . . . . . . . . . . . . 296,886 310,143
Total Capital Markets group's mortgage portfolio . . . . . . . . . . . . . . . . . . . . . . . . . . . . . . $691,663 $708,414
(1) Based on unpaid principal balance.(2) The fair value of these mortgage-related securities was $303.8 billion and $316.5 billion as of March 31, 2012 and
December 31, 2011, respectively.
The Capital Markets group’s mortgage portfolio decreased as of March 31, 2012 compared with December 31,2011 primarily due to liquidations, partially offset by purchases of delinquent loans from MBS trusts. The totalunpaid principal balance of nonperforming loans in the Capital Markets group’s mortgage portfolio was $236.2billion as of March 31, 2012 and December 31, 2011. This population includes loans that have been modified andhave been classified as TDRs, as well as unmodified delinquent loans that are on nonaccrual status in ourcondensed consolidated financial statements.
35

We expect to continue to purchase loans from MBS trusts as they become four or more consecutive monthlypayments delinquent subject to market conditions, economic benefit, servicer capacity, and other factorsincluding the limit on the mortgage assets that we may own pursuant to the senior preferred stock purchaseagreement. We purchased approximately 84,900 delinquent loans with an unpaid principal balance of $14.2billion from our single-family MBS trusts in the first quarter of 2012. As of March 31, 2012, the total unpaidprincipal balance of all loans in single-family MBS trusts that were delinquent as to four or more consecutivemonthly payments was $4.6 billion.
CONSOLIDATED BALANCE SHEET ANALYSIS
The section below provides a discussion of our condensed consolidated balance sheets as of the dates indicatedand should be read together with our condensed consolidated financial statements, including the accompanyingnotes.
Table 20 displays a summary of our condensed consolidated balance sheets as of March 31, 2012 andDecember 31, 2011.
Table 20: Summary of Condensed Consolidated Balance SheetsAs of
March 31,2012
December 31,2011 Variance
(Dollars in millions)
AssetsCash and cash equivalents and federal funds sold and securities purchased
under agreements to resell or similar arrangements . . . . . . . . . . . . . . . . $ 37,049 $ 63,539 $(26,490)Restricted cash . . . . . . . . . . . . . . . . . . . . . . . . . . . . . . . . . . . . . . . . . . . . . . . 55,921 50,797 5,124Investments in securities(1) . . . . . . . . . . . . . . . . . . . . . . . . . . . . . . . . . . . . . . 149,585 151,780 (2,195)Mortgage loans:
Of Fannie Mae . . . . . . . . . . . . . . . . . . . . . . . . . . . . . . . . . . . . . . . . . . . . . 377,257 380,379 (3,122)Of consolidated trusts . . . . . . . . . . . . . . . . . . . . . . . . . . . . . . . . . . . . . . . . 2,616,577 2,590,398 26,179
Allowance for loan losses . . . . . . . . . . . . . . . . . . . . . . . . . . . . . . . . . . . . . . (70,109) (72,156) 2,047
Mortgage loans, net of allowance for loan losses . . . . . . . . . . . . . . . . . . 2,923,725 2,898,621 25,104Other assets(2) . . . . . . . . . . . . . . . . . . . . . . . . . . . . . . . . . . . . . . . . . . . . . . . . 43,660 46,747 (3,087)
Total assets . . . . . . . . . . . . . . . . . . . . . . . . . . . . . . . . . . . . . . . . . . . . . . . . $3,209,940 $3,211,484 $ (1,544)
Liabilities and equity (deficit)Debt:
Of Fannie Mae . . . . . . . . . . . . . . . . . . . . . . . . . . . . . . . . . . . . . . . . . . . . . $ 685,974 $ 732,444 $(46,470)Of consolidated trusts . . . . . . . . . . . . . . . . . . . . . . . . . . . . . . . . . . . . . . . . 2,498,233 2,457,428 40,805
Other liabilities(3) . . . . . . . . . . . . . . . . . . . . . . . . . . . . . . . . . . . . . . . . . . . . . 25,465 26,183 (718)
Total liabilities . . . . . . . . . . . . . . . . . . . . . . . . . . . . . . . . . . . . . . . . . . . . . 3,209,672 3,216,055 (6,383)
Senior preferred stock . . . . . . . . . . . . . . . . . . . . . . . . . . . . . . . . . . . . . . . . . 117,149 112,578 4,571Other deficit(4) . . . . . . . . . . . . . . . . . . . . . . . . . . . . . . . . . . . . . . . . . . . . . . . . (116,881) (117,149) 268
Total equity (deficit) . . . . . . . . . . . . . . . . . . . . . . . . . . . . . . . . . . . . . . . . 268 (4,571) 4,839
Total liabilities and equity (deficit) . . . . . . . . . . . . . . . . . . . . . . . . . . . . . . $3,209,940 $3,211,484 $ (1,544)
(1) Includes $51.9 billion as of March 31, 2012 and $49.8 billion as of December 31, 2011 of non-mortgage-related securitiesthat are included in our other investments portfolio, which we present in “Table 30: Cash and Other InvestmentsPortfolio.”
(2) Consists of accrued interest receivable, net; acquired property, net; and other assets.(3) Consists of accrued interest payable and other liabilities.(4) Consists of preferred stock, common stock, accumulated deficit, accumulated other comprehensive loss, treasury stock,
and noncontrolling interest.
36

Cash and Other Investments Portfolio
Our cash and other investments portfolio consists of cash and cash equivalents, federal funds sold and securitiespurchased under agreements to resell or similar arrangements, and investments in non-mortgage-relatedsecurities. See “Liquidity and Capital Management—Liquidity Management—Cash and Other InvestmentsPortfolio” for additional information on our cash and other investments portfolio.
Restricted Cash
Restricted cash primarily includes unscheduled borrower payments received by the servicer or consolidated trustsdue to be remitted to the MBS certificateholders in the subsequent month. Our restricted cash increased as ofMarch 31, 2012 compared with the balance as of December 31, 2011 primarily due to an increase in refinanceactivity, resulting in an increase in unscheduled payments received.
Investments in Mortgage-Related Securities
Our investments in mortgage-related securities are classified in our condensed consolidated balance sheets aseither trading or available-for-sale and are measured at fair value. Unrealized and realized gains and losses ontrading securities are included as a component of “Fair value gains, net” and unrealized gains and losses onavailable-for-sale securities are included in “Other comprehensive income” in our condensed consolidatedstatements of operations and comprehensive income (loss). Realized gains and losses on available-for-salesecurities are recognized when securities are sold in “Investment gains, net” in our condensed consolidatedstatements of operations and comprehensive income (loss). See “Note 5, Investments in Securities” for additionalinformation on our investments in mortgage-related securities, including the composition of our trading andavailable-for-sale securities at amortized cost and fair value and the gross unrealized gains and losses related toour available-for-sale securities as of March 31, 2012 and December 31, 2011.
Table 21 displays the fair value of our investments in mortgage-related securities, including trading andavailable-for-sale securities, as of the dates indicated.
Table 21: Summary of Mortgage-Related Securities at Fair Value
As of
March 31,2012
December 31,2011
(Dollars in millions)
Mortgage-related securities:
Fannie Mae . . . . . . . . . . . . . . . . . . . . . . . . . . . . . . . . . . . . . . . . . . . . . . . . . . . . . . . . . . . $21,793 $ 24,274
Freddie Mac . . . . . . . . . . . . . . . . . . . . . . . . . . . . . . . . . . . . . . . . . . . . . . . . . . . . . . . . . . 14,518 15,555
Ginnie Mae . . . . . . . . . . . . . . . . . . . . . . . . . . . . . . . . . . . . . . . . . . . . . . . . . . . . . . . . . . . 1,152 1,189
Alt-A private-label securities . . . . . . . . . . . . . . . . . . . . . . . . . . . . . . . . . . . . . . . . . . . . . 12,927 13,032
Subprime private-label securities . . . . . . . . . . . . . . . . . . . . . . . . . . . . . . . . . . . . . . . . . . 8,900 8,866
CMBS . . . . . . . . . . . . . . . . . . . . . . . . . . . . . . . . . . . . . . . . . . . . . . . . . . . . . . . . . . . . . . . 24,485 24,437
Mortgage revenue bonds . . . . . . . . . . . . . . . . . . . . . . . . . . . . . . . . . . . . . . . . . . . . . . . . 10,407 10,978
Other mortgage-related securities . . . . . . . . . . . . . . . . . . . . . . . . . . . . . . . . . . . . . . . . . . 3,477 3,601
Total . . . . . . . . . . . . . . . . . . . . . . . . . . . . . . . . . . . . . . . . . . . . . . . . . . . . . . . . . . . . . . $97,659 $101,932
Investments in Private-Label Mortgage-Related Securities
We classify private-label securities as Alt-A, subprime, multifamily or manufactured housing if the securitieswere labeled as such when issued. We have also invested in private-label subprime mortgage-related securitiesthat we have resecuritized to include our guaranty (“wraps”).
37

The continued negative impact of the current economic environment, including sustained weakness in thehousing market and high unemployment, has adversely affected the performance of our Alt-A and subprimeprivate-label securities. The unpaid principal balance of our investments in Alt-A and subprime securities was$35.2 billion as of March 31, 2012, of which $29.5 billion was rated below investment grade. Table 22 displaysthe unpaid principal balance and the fair value of our investments in Alt-A and subprime private-label securitiesalong with an analysis of the cumulative losses on these investments as of March 31, 2012. As of March 31, 2012and December 31, 2011, we had realized actual cumulative principal shortfalls of approximately 6% of the totalcumulative credit losses reported in this table and reflected in our condensed consolidated financial statements.
Table 22: Analysis of Losses on Alt-A and Subprime Private-Label Mortgage-Related Securities
As of March 31, 2012
UnpaidPrincipalBalance
FairValue
TotalCumulative
Losses(1)Noncredit
Component(2)Credit
Component(3)
(Dollars in millions)
Trading securities:(4)
Alt-A private-label securities . . . . . . . . . . . . . $ 2,629 $ 1,338 $ (1,251) $ (102) $ (1,149)
Subprime private-label securities . . . . . . . . . . 2,558 1,305 (1,252) (344) (908)
Total . . . . . . . . . . . . . . . . . . . . . . . . . . . . . . . . . 5,187 2,643 (2,503) (446) (2,057)
Available-for-sale securities:(4)
Alt-A private-label securities . . . . . . . . . . . . . 16,427 11,589 (5,409) (1,306) (4,103)
Subprime private-label securities . . . . . . . . . . 13,617 7,595 (6,061) (1,668) (4,393)
Total . . . . . . . . . . . . . . . . . . . . . . . . . . . . . . . . . 30,044 19,184 (11,470) (2,974) (8,496)
Grand Total . . . . . . . . . . . . . . . . . . . . . . . . . . . . . $35,231 $21,827 $(13,973) $(3,420) $(10,553)
(1) Amounts reflect the difference between the fair value and unpaid principal balance net of unamortized premiums,discounts and certain other cost basis adjustments.
(2) Represents the estimated portion of the total cumulative losses that is noncredit-related. We have calculated the creditcomponent based on the difference between the amortized cost basis of the securities and the present value of expectedfuture cash flows. The remaining difference between the fair value and the present value of expected future cash flows isclassified as noncredit-related.
(3) For securities classified as trading, amounts reflect the estimated portion of the total cumulative losses that is credit-related. For securities classified as available-for-sale, amounts reflect the estimated portion of total cumulative other-than-temporary credit impairment losses, net of accretion, that are recognized in our condensed consolidated statements ofoperations and comprehensive income (loss).
(4) Excludes resecuritizations, or wraps, of private-label securities backed by subprime loans that we have guaranteed andhold in our mortgage portfolio as Fannie Mae securities.
Table 23 displays the 60 days or more delinquency rates and average loss severities for the loans underlying ourAlt-A and subprime private-label mortgage-related securities for the most recent remittance period of the currentreporting quarter. The delinquency rates and average loss severities are based on available data provided by IntexSolutions, Inc. (“Intex”) and CoreLogic, LoanPerformance (“CoreLogic”). We also present the average creditenhancement and monoline financial guaranteed amount for these securities as of March 31, 2012. Based on thestressed condition of our non-governmental financial guarantors, we believe that all but one of thesecounterparties may not be able to fully meet their obligations to us in the future. See “Risk Management—CreditRisk Management—Institutional Counterparty Credit Risk Management—Financial Guarantors” for additionalinformation on our financial guarantor exposure and the counterparty risk associated with our financialguarantors.
38

Table 23: Credit Statistics of Loans Underlying Alt-A and Subprime Private-Label Mortgage-Related Securities(Including Wraps)
As of March 31, 2012
Unpaid Principal Balance
≥ 60 DaysDelinquent(2)(3)
AverageLoss
Severity(3)(4)
AverageCredit
Enhancement(3)(5)
MonolineFinancial
GuaranteedAmount(6)Trading
Available-for-Sale Wraps(1)
(Dollars in millions)
Private-label mortgage-related securities backed by:(7)
Alt-A mortgage loans:Option ARM Alt-A mortgage
loans:2004 and prior . . . . . . . . . . . $ — $ 469 $ — 30.0% 60.3% 15.3% $ —2005 . . . . . . . . . . . . . . . . . . . — 1,267 — 40.7 62.9 37.3 2412006 . . . . . . . . . . . . . . . . . . . — 1,136 — 43.4 68.2 25.5 852007 . . . . . . . . . . . . . . . . . . . 1,819 — — 44.3 65.2 54.7 602
Other Alt-A mortgage loans:2004 and prior . . . . . . . . . . . — 5,885 — 10.3 54.4 12.4 122005 . . . . . . . . . . . . . . . . . . . 82 3,911 108 21.7 60.3 5.4 —2006 . . . . . . . . . . . . . . . . . . . 60 3,646 — 26.3 60.9 0.6 —2007 . . . . . . . . . . . . . . . . . . . 668 — 162 39.4 71.7 32.9 2662008(8) . . . . . . . . . . . . . . . . . . — 113 — — — — —
Total Alt-A mortgage loans: . . . . 2,629 16,427 270 1,206
Subprime mortgage loans:2004 and prior . . . . . . . . . . . — 1,580 940 22.4 82.9 60.9 6012005(8) . . . . . . . . . . . . . . . . . . — 163 1,221 39.5 79.0 57.4 2232006 . . . . . . . . . . . . . . . . . . . — 11,283 — 46.3 81.7 17.3 522007 . . . . . . . . . . . . . . . . . . . 2,558 591 5,326 45.9 77.3 21.5 173
Total subprime mortgageloans: . . . . . . . . . . . . . . . . . . . . 2,558 13,617 7,487 1,049
Total Alt-A and subprimemortgage loans: . . . . . . . . . . . . $5,187 $30,044 $7,757 $2,255
(1) Represents our exposure to private-label Alt-A and subprime mortgage-related securities that have been resecuritized (orwrapped) to include our guarantee.
(2) Delinquency data provided by Intex, where available, for loans backing Alt-A and subprime private-label mortgage-related securities that we own or guarantee. The reported Intex delinquency data reflect information from March 2012remittances for February 2012 payments. For consistency purposes, we have adjusted the Intex delinquency data, whereappropriate, to include all bankruptcies, foreclosures and REO in the delinquency rates.
(3) The average delinquency, severity and credit enhancement metrics are calculated for each loan pool associated withsecurities where Fannie Mae has exposure and are weighted based on the unpaid principal balance of those securities.
(4) Severity data obtained from CoreLogic, where available, for loans backing Alt-A and subprime private-label mortgage-related securities that we own or guarantee. The CoreLogic severity data reflect information from March 2012 remittancesfor February 2012 payments. For consistency purposes, we have adjusted the severity data, where appropriate.
(5) Average credit enhancement percentage reflects both subordination and financial guarantees. Reflects the ratio of thecurrent amount of the securities that will incur losses in the securitization structure before any losses are allocated tosecurities that we own or guarantee. Percentage generally calculated based on the quotient of the total unpaid principalbalance of all credit enhancements in the form of subordination or financial guarantee of the security divided by the totalunpaid principal balance of all of the tranches of collateral pools from which credit support is drawn for the security thatwe own or guarantee. Beginning in March 2012, in calculating the weighted average credit enhancement percentage forbonds in the population that show negative credit enhancement in Intex due to under-collateralization, the negative creditenhancement amounts have been replaced with zero values.
(6) Reflects amount of unpaid principal balance supported by financial guarantees from monoline financial guarantors.
39

(7) Vintages are based on series date and not loan origination date.(8) The unpaid principal balance includes private-label Real Estate Mortgage Investment Conduit (“REMIC”) securities that
have been resecuritized totaling $113 million for the 2008 vintage of other Alt-A loans and $14 million for the 2005vintage of subprime loans. These securities are excluded from the delinquency, severity and credit enhancement statisticsreported in this table.
Mortgage Loans
The increase in mortgage loans, net of the allowance for loan losses, in the first quarter of 2012 was primarilydriven by securitization activity from our lender swap and portfolio securitization programs. For additionalinformation on our mortgage loans, see “Note 3, Mortgage Loans.” For additional information on the mortgageloan purchase and sale activities reported by our Capital Markets group, see “Business Segment Results—CapitalMarkets Group Results.”
Debt
Debt of Fannie Mae is the primary means of funding our mortgage investments. We provide a summary of theactivity of the debt of Fannie Mae and a comparison of the mix between our outstanding short-term and long-term debt in “Liquidity and Capital Management—Liquidity Management—Debt Funding.” Also see “Note 8,Short-Term Borrowings and Long-Term Debt” for additional information on our outstanding debt.
Debt of consolidated trusts represents the amount of Fannie Mae MBS issued from consolidated trusts and heldby third-party certificateholders. The increase in debt of consolidated trusts in the first quarter of 2012 wasprimarily driven by securitization activity from our lender swap and portfolio securitization programs.
SUPPLEMENTAL NON-GAAP INFORMATION—FAIR VALUE BALANCE SHEETS
As part of our disclosure requirements with FHFA, we disclose on a quarterly basis supplemental non-GAAPconsolidated fair value balance sheets, which reflect our assets and liabilities at estimated fair value.
Table 24 summarizes changes in our stockholders’ equity (deficit) reported in our GAAP condensed consolidatedbalance sheets and in the estimated fair value of our net assets in our non-GAAP consolidated fair value balancesheets for the three months ended March 31, 2012. The estimated fair value of our net assets is calculated basedon the difference between the fair value of our assets and the fair value of our liabilities, adjusted fornoncontrolling interests. We use various valuation techniques to estimate fair value, some of which incorporateinternal assumptions that are subjective and involve a high degree of management judgment. We describe thespecific valuation techniques used to determine fair value and disclose the carrying value and fair value of ourfinancial assets and liabilities in “Note 12, Fair Value.”
40

Table 24: Comparative Measures—GAAP Change in Stockholders’ Equity (Deficit) and Non-GAAP Change in FairValue of Net Assets (Net of Tax Effect)
For the Three Months EndedMarch 31, 2012
(Dollars in millions)
GAAP consolidated balance sheets:Fannie Mae stockholders’ deficit as of December 31, 2011(1) . . . . . . . . . . . . . . . . . . . . . . . . $ (4,624)Total comprehensive income . . . . . . . . . . . . . . . . . . . . . . . . . . . . . . . . . . . . . . . . . . . . . . . . . 3,080Capital transactions:(2)
Funds received from Treasury under the senior preferred stock purchase agreement . . . . 4,571Senior preferred stock dividends . . . . . . . . . . . . . . . . . . . . . . . . . . . . . . . . . . . . . . . . . . . . (2,819)
Capital transactions, net . . . . . . . . . . . . . . . . . . . . . . . . . . . . . . . . . . . . . . . . . . . . . . . . . . . . . 1,752Other . . . . . . . . . . . . . . . . . . . . . . . . . . . . . . . . . . . . . . . . . . . . . . . . . . . . . . . . . . . . . . . . . . . 2
Fannie Mae stockholders' equity as of March 31, 2012(1) . . . . . . . . . . . . . . . . . . . . . . . . . . . $ 210
Non-GAAP consolidated fair value balance sheets:Estimated fair value of net assets as of December 31, 2011 . . . . . . . . . . . . . . . . . . . . . . . . . $(127,848)Capital transactions, net . . . . . . . . . . . . . . . . . . . . . . . . . . . . . . . . . . . . . . . . . . . . . . . . . . . . . 1,752Change in estimated fair value of net assets, excluding capital transactions . . . . . . . . . . . . (11,549)
Decrease in estimated fair value of net assets, net . . . . . . . . . . . . . . . . . . . . . . . . . . . . . . . . (9,797)
Estimated fair value of net assets as of March 31, 2012 . . . . . . . . . . . . . . . . . . . . . . . . . . . . $(137,645)
(1) Our net worth, as defined under the senior preferred stock purchase agreement, is equivalent to the “Total equity (deficit)”amount reported in our condensed consolidated balance sheets. Our net worth, or total deficit, consists of “Total FannieMae’s stockholders’ equity (deficit)” and “Noncontrolling interest” reported in our condensed consolidated balance sheets.
(2) Represents capital transactions, which are reported in our condensed consolidated financial statements.
During the first quarter of 2012, the estimated fair value of our net assets, excluding capital transactions,decreased by $11.5 billion. We adopted ASU 2011-04, Amendments to Achieve Common Fair ValueMeasurements and Disclosure Requirements in U.S. GAAP and IFRS related to fair value measurement, whichresulted in our determination to reflect the fair value of modified loans and certain delinquent loans in theprincipal markets for whole loans versus the GSE securitization market. This adoption resulted in a net decreaseto fair value of $24.4 billion. This decrease was offset by an enhanced estimation process used to value HARPloans that resulted in an increase of $7.4 billion to the fair value of these loans.
Excluding the impact of the changes described above, the estimated fair value of our net assets, excluding capitaltransactions, increased primarily attributable to income from the spread between our mortgage assets andassociated debt and derivatives as well as a tightening of the option-adjusted spread levels. These increases in fairvalue were partially offset by credit-related items due to declining actual home prices and an increase in interestrates which increased the weighted average life of the guaranty book of business.
Cautionary Language Relating to Supplemental Non-GAAP Financial Measures
In reviewing our non-GAAP consolidated fair value balance sheets, there are a number of important factors andlimitations to consider. The estimated fair value of our net assets is calculated as of a particular point in timebased on our existing assets and liabilities. It does not incorporate other factors that may have a significantimpact on our long-term fair value, including revenues generated from future business activities in which weexpect to engage, the value from our foreclosure and loss mitigation efforts or the impact that legislation orpotential regulatory actions may have on us. As a result, the estimated fair value of our net assets presented in ournon-GAAP consolidated fair value balance sheets does not represent an estimate of our net realizable value,liquidation value or our market value as a whole. Amounts we ultimately realize from the disposition of assets orsettlement of liabilities may vary materially from the estimated fair values presented in our non-GAAPconsolidated fair value balance sheets.
41

In addition, the fair value of our net assets attributable to common stockholders presented in our fair valuebalance sheet does not represent an estimate of the value we expect to realize from operating the company orwhat we expect to draw from Treasury under the terms of our senior preferred stock purchase agreement,primarily because:
• The estimated fair value of our credit exposures significantly exceeds our projected credit losses as fairvalue takes into account certain assumptions about liquidity and required rates of return that a marketparticipant may demand in assuming a credit obligation. Because we do not generally intend to have otherparties assume the credit risk inherent in our book of business, and therefore would not be obligated to pay amarket premium for its assumption, we do not expect the current market premium portion of our currentestimate of fair value to impact future Treasury draws;
• The fair value balance sheet does not reflect amounts we expect to draw in the future to pay dividends onthe senior preferred stock; and
• The fair value of our net assets reflects a point in time estimate of the fair value of our existing assets andliabilities, and does not incorporate the value associated with new business that may be added in the future.
The fair value of our net assets is not a measure defined within GAAP and may not be comparable to similarlytitled measures reported by other companies.
Supplemental Non-GAAP Consolidated Fair Value Balance Sheets
We display our non-GAAP fair value balance sheets as of the dates indicated in Table 25.
42

Table 25: Supplemental Non-GAAP Consolidated Fair Value Balance Sheets
As of March 31, 2012 As of December 31, 2011
GAAPCarrying
ValueFair Value
Adjustment(1)EstimatedFair Value
GAAPCarrying
ValueFair Value
Adjustment(1)EstimatedFair Value
(Dollars in millions)Assets:Cash and cash equivalents . . . . . . . . . . . . . $ 77,970 $ — $ 77,970 $ 68,336 $ — $ 68,336Federal funds sold and securities purchased
under agreements to resell or similararrangements . . . . . . . . . . . . . . . . . . . . . . 15,000 — 15,000 46,000 — 46,000
Trading securities . . . . . . . . . . . . . . . . . . . . 75,806 — 75,806 74,198 — 74,198Available-for-sale securities . . . . . . . . . . . . 73,779 — 73,779 77,582 — 77,582Mortgage loans:
Mortgage loans held for sale . . . . . . . . . . 282 4 286 311 14 325Mortgage loans held for investment, net
of allowance for loan losses:Of Fannie Mae . . . . . . . . . . . . . . . . . . 320,032 (47,953) 272,079 322,825 (27,829) 294,996Of consolidated trusts . . . . . . . . . . . . . 2,603,411 69,620(2) 2,673,031(3) 2,575,485 76,540(2) 2,652,025(3)
Total mortgage loans . . . . . . . . . . . . . . . . 2,923,725 21,671 2,945,396(4) 2,898,621 48,725 2,947,346(4)
Advances to lenders . . . . . . . . . . . . . . . . . . 3,548 (89) 3,459(5)(6) 5,538 (118) 5,420(5)(6)
Derivative assets at fair value . . . . . . . . . . . 365 — 365(5)(6) 561 — 561(5)(6)
Guaranty assets and buy-ups, net . . . . . . . . 497 423 920(5)(6) 503 398 901(5)(6)
Total financial assets . . . . . . . . . . . . . . . . 3,170,690 22,005 3,192,695(7) 3,171,339 49,005 3,220,344(7)
Credit enhancements . . . . . . . . . . . . . . . . . . 453 2,396 2,849(5)(6) 455 2,550 3,005(5)(6)
Other assets . . . . . . . . . . . . . . . . . . . . . . . . . 38,797 (242) 38,555(5)(6) 39,690 (258) 39,432(5)(6)
Total assets . . . . . . . . . . . . . . . . . . . . . . . $3,209,940 $ 24,159 $3,234,099 $3,211,484 $ 51,297 $3,262,781
Liabilities:Short-term debt:
Of Fannie Mae . . . . . . . . . . . . . . . . . . . . $ 110,852 $ 13 $ 110,865 $ 146,752 $ 30 $ 146,782Of consolidated trusts . . . . . . . . . . . . . . . 4,495 — 4,495 4,973 — 4,973
Long-term debt:Of Fannie Mae . . . . . . . . . . . . . . . . . . . . 575,122(8) 25,370 600,492 585,692(8) 28,291 613,983Of consolidated trusts . . . . . . . . . . . . . . . 2,493,738(8) 134,754(2) 2,628,492 2,452,455(8) 144,202(2) 2,596,657
Derivative liabilities at fair value . . . . . . . . . 522 — 522(9)(10) 916 — 916(9)(10)
Guaranty obligations . . . . . . . . . . . . . . . . . . 799 3,016 3,815(9)(10) 811 3,133 3,944(9)(10)
Total financial liabilities . . . . . . . . . . . . . 3,185,528 163,153 3,348,681(7) 3,191,599 175,656 3,367,255(7)
Other liabilities . . . . . . . . . . . . . . . . . . . . . . 24,144 (1,139) 23,005(9)(10) 24,456 (1,135) 23,321(9)(10)
Total liabilities . . . . . . . . . . . . . . . . . . . . 3,209,672 162,014 3,371,686 3,216,055 174,521 3,390,576Equity (deficit):Fannie Mae stockholders' equity (deficit):Senior preferred(11) . . . . . . . . . . . . . . . . . . . . 117,149 — 117,149 112,578 — 112,578Preferred . . . . . . . . . . . . . . . . . . . . . . . . . . . 19,130 (18,252) 878 19,130 (18,163) 967Common . . . . . . . . . . . . . . . . . . . . . . . . . . . (136,069) (119,603) (255,672) (136,332) (105,061) (241,393)
Total Fannie Mae stockholders’ equity(deficit)/non-GAAP fair value of netassets . . . . . . . . . . . . . . . . . . . . . . . . . . $ 210 $(137,855) $ (137,645) $ (4,624) $(123,224) $ (127,848)
Noncontrolling interest . . . . . . . . . . . . . . 58 — 58 53 — 53
Total equity (deficit) . . . . . . . . . . . . . . . . 268 (137,855) (137,587) (4,571) (123,224) (127,795)
Total liabilities and equity (deficit) . . . . . $3,209,940 $ 24,159 $3,234,099 $3,211,484 $ 51,297 $3,262,781
Explanation and Reconciliation of Non-GAAP Measures to GAAP Measures(1) Each of the amounts listed as a “fair value adjustment” represents the difference between the carrying value included in our GAAP
condensed consolidated balance sheets and our best judgment of the estimated fair value of the listed item.(2) Fair value of consolidated loans is impacted by credit risk, which has no corresponding impact on the consolidated debt.(3) Includes certain mortgage loans that we elected to report at fair value in our GAAP condensed consolidated balance sheets of $4.3 billion
and $3.6 billion as of March 31, 2012 and December 31, 2011, respectively.(4) Performing loans had both a fair value and an unpaid principal balance of $2.8 trillion as of March 31, 2012 compared with a fair value of
$2.8 trillion and an unpaid principal balance of $2.7 trillion as of December 31, 2011. Nonperforming loans, which for the purposes of our
43

non-GAAP fair value balance sheets consists of loans that are delinquent by one or more payments, had a fair value of $121.0 billion andan unpaid principal balance of $220.5 billion as of March 31, 2012 compared with a fair value of $128.9 billion and an unpaid principalbalance of $226.5 billion as of December 31, 2011. See “Note 12, Fair Value” for additional information on valuation techniques forperforming and nonperforming loans.
(5) The following line items: (a) Advances to lenders; (b) Derivative assets at fair value; (c) Guaranty assets and buy-ups, net; (d) Creditenhancements; and (e) Other assets, together consist of the following assets presented in our GAAP condensed consolidated balancesheets: (a) Accrued interest receivable, net; (b) Acquired property, net; and (c) Other assets.
(6) “Other assets” include the following GAAP condensed consolidated balance sheets line items: (a) Accrued interest receivable, net and (b)Acquired property, net. The carrying value of these items in our GAAP condensed consolidated balance sheets totaled $20.6 billion and$21.4 billion as of March 31, 2012 and December 31, 2011, respectively. “Other assets” in our GAAP condensed consolidated balancesheets include the following: (a) Advances to lenders; (b) Derivative assets at fair value; (c) Guaranty assets and buy-ups, net; and (d)Credit enhancements. The carrying value of these items totaled $4.9 billion and $7.1 billion as of March 31, 2012 and December 31, 2011,respectively.
(7) We estimated the fair value of these financial instruments in accordance with the fair value accounting guidance as described in “Note 12,Fair Value.”
(8) Includes certain long-term debt instruments that we elected to report at fair value in our GAAP condensed consolidated balance sheets of$5.1 billion and $4.8 billion as of March 31, 2012 and December 31, 2011, respectively.
(9) The following line items: (a) Derivative liabilities at fair value; (b) Guaranty obligations; and (c) Other liabilities, consist of the followingliabilities presented in our GAAP condensed consolidated balance sheets: (a) Accrued interest payable and (b) Other liabilities.
(10) “Other liabilities” include Accrued interest payable in our GAAP condensed consolidated balance sheets. The carrying value of this itemin our GAAP condensed consolidated balance sheets totaled $12.4 billion and $12.6 billion as of March 31, 2012 and December 31, 2011,respectively. We assume that certain other liabilities, such as deferred revenues, have no fair value. Although we report the “Reserve forguaranty losses” as part of “Other liabilities” in our GAAP condensed consolidated balance sheets, it is incorporated into and reported aspart of the fair value of our guaranty obligations in our non-GAAP supplemental consolidated fair value balance sheets. “Other liabilities”in our GAAP condensed consolidated balance sheets include the following: (a) Derivative liabilities at fair value and (b) Guarantyobligations. The carrying value of these items totaled $1.3 billion and $1.7 billion as of March 31, 2012 and December 31, 2011,respectively.
(11) The amount included in “estimated fair value” of the senior preferred stock is the liquidation preference, which is the same as the GAAPcarrying value, and does not reflect fair value.
LIQUIDITY AND CAPITAL MANAGEMENT
Liquidity Management
Our business activities require that we maintain adequate liquidity to fund our operations. Our liquidity riskmanagement policy is designed to address our liquidity risk. Liquidity risk is the risk that we will not be able tomeet our funding obligations in a timely manner. Liquidity risk management involves forecasting fundingrequirements, maintaining sufficient capacity to meet our needs based on our ongoing assessment of financialmarket liquidity and adhering to our regulatory requirements.
Our treasury function resides within the Capital Markets group and is responsible for implementing our liquidityand contingency planning strategies. We conduct liquidity contingency planning to prepare for an event in whichour access to the unsecured debt markets becomes limited. We plan for alternative sources of liquidity that aredesigned to allow us to meet our cash obligations without relying upon the issuance of unsecured debt. While ourliquidity contingency planning attempts to address stressed market conditions and our status underconservatorship and Treasury support arrangements, we believe that our liquidity contingency plan may bedifficult or impossible to execute for a company of our size in our circumstances. See “Liquidity and CapitalManagement—Liquidity Management—Liquidity Risk Management Practices and Contingency Planning” in our2011 Form 10-K for a discussion of our liquidity contingency plans. Also see “Risk Factors” in our 2011 Form10-K for a description of the risks associated with our liquidity risk and liquidity contingency planning.
Our liquidity position could be adversely affected by many factors, both internal and external to our business,including: actions taken by our conservator, the Federal Reserve, U.S. Treasury or other government agencies;legislation relating to us or our business; a U.S. government payment default on its debt obligations; a downgradein the credit ratings of our senior unsecured debt or the U.S government’s debt from the major ratingsorganizations; a systemic event leading to the withdrawal of liquidity from the market; an extreme market-widewidening of credit spreads; public statements by key policy makers; a significant decline in our net worth;potential investor concerns about the adequacy of funding available to us under the senior preferred stock
44

purchase agreement after 2012; loss of demand for our debt, or certain types of our debt, from a major group ofinvestors; a significant credit event involving one of our major institutional counterparties; a sudden catastrophicoperational failure in the financial sector; or elimination of our GSE status.
Debt Funding
We fund our business primarily through the issuance of short-term and long-term debt securities in the domesticand international capital markets. Because debt issuance is our primary funding source, we are subject to “roll-over,” or refinancing, risk on our outstanding debt.
We have a diversified funding base of domestic and international investors. Purchasers of our debt securities aregeographically diversified and include fund managers, commercial banks, pension funds, insurance companies,foreign central banks, corporations, state and local governments, and other municipal authorities.
Although our funding needs may vary from quarter to quarter depending on market conditions, we currentlyexpect our debt funding needs will decline in future periods as we reduce the size of our mortgage portfolio incompliance with the requirement of the senior preferred stock purchase agreement that we reduce our mortgageportfolio 10% per year until it reaches $250 billion.
Fannie Mae Debt Funding Activity
Table 26 displays the activity in debt of Fannie Mae for the periods indicated. This activity excludes the debt ofconsolidated trusts and intraday loans. The reported amounts of debt issued and paid off during the periodrepresent the face amount of the debt at issuance and redemption, respectively. Activity for short-term debt ofFannie Mae relates to borrowings with an original contractual maturity of one year or less while activity for long-term debt of Fannie Mae relates to borrowings with an original contractual maturity of greater than one year.
Table 26: Activity in Debt of Fannie Mae
For the Three Months Ended March 31,
2012 2011
(Dollars in millions)Issued during the period:
Short-term:
Amount . . . . . . . . . . . . . . . . . . . . . . . . . . . . . . . . . . . . . . . . . . . . . . . . . . . . . . . . . . $ 45,594 $ 88,201
Weighted-average interest rate . . . . . . . . . . . . . . . . . . . . . . . . . . . . . . . . . . . . . . . . 0.11% 0.15%
Long-term:
Amount . . . . . . . . . . . . . . . . . . . . . . . . . . . . . . . . . . . . . . . . . . . . . . . . . . . . . . . . . . $ 59,464 $ 51,737
Weighted-average interest rate . . . . . . . . . . . . . . . . . . . . . . . . . . . . . . . . . . . . . . . . 1.45% 2.13%
Total issued:
Amount . . . . . . . . . . . . . . . . . . . . . . . . . . . . . . . . . . . . . . . . . . . . . . . . . . . . . . . . . . $105,058 $139,938
Weighted-average interest rate . . . . . . . . . . . . . . . . . . . . . . . . . . . . . . . . . . . . . . . . 0.87% 0.88%
Paid off during the period: (1)
Short-term:
Amount . . . . . . . . . . . . . . . . . . . . . . . . . . . . . . . . . . . . . . . . . . . . . . . . . . . . . . . . . . $ 81,506 $ 93,031
Weighted-average interest rate . . . . . . . . . . . . . . . . . . . . . . . . . . . . . . . . . . . . . . . . 0.12% 0.26%
Long-term:
Amount . . . . . . . . . . . . . . . . . . . . . . . . . . . . . . . . . . . . . . . . . . . . . . . . . . . . . . . . . . $ 71,310 $ 66,857
Weighted-average interest rate . . . . . . . . . . . . . . . . . . . . . . . . . . . . . . . . . . . . . . . . 2.51% 2.82%
Total paid off:
Amount . . . . . . . . . . . . . . . . . . . . . . . . . . . . . . . . . . . . . . . . . . . . . . . . . . . . . . . . . . $152,816 $159,888
Weighted-average interest rate . . . . . . . . . . . . . . . . . . . . . . . . . . . . . . . . . . . . . . . . 1.24% 1.33%
(1) Consists of all payments on debt, including regularly scheduled principal payments, payments at maturity, payments resulting from callsand payments for any other repurchases. Calls and repurchases of zero-coupon debt are reported at original face value, which does notequal the amount of actual cash payment.
45

Overall debt funding activity decreased in the first quarter of 2012 compared with the first quarter of 2011. Asinterest rates declined in the first quarter of 2012, we issued long-term debt with lower interest rates toreplace redemptions of long-term debt with higher interest rates. This long-term debt activity, however, was morethan offset by the decrease in our short-term debt activity as we redeemed more short-term debt than was issuedduring the quarter. Our debt funding activity is likely to continue to decline in future periods as the size of ourmortgage portfolio decreases.
We believe that continued federal government support of our business and the financial markets, as well as ourstatus as a GSE, are essential to maintaining our access to debt funding. Changes or perceived changes in thegovernment’s support could materially adversely affect our ability to refinance our debt as it becomes due, whichcould have a material adverse impact on our liquidity, financial condition and results of operations. In February2011, Treasury and HUD released a report to Congress on reforming America’s housing finance market. Thereport provides that the Administration will work with FHFA to determine the best way to responsibly winddown both Fannie Mae and Freddie Mac. The report emphasizes the importance of proceeding with a carefultransition plan and providing the necessary financial support to Fannie Mae and Freddie Mac during thetransition period. For more information on GSE reform, see “Legislative and Regulatory Developments—GSEReform” in this report and in our 2011 Form 10-K.
In addition, due to our reliance on the U.S. government’s support, our access to debt funding or the cost of ourdebt funding could be materially adversely affected by a change or perceived change in the creditworthiness ofthe U.S. government. A downgrade in our credit ratings could reduce demand for our debt securities and increaseour borrowing costs. See our discussion of credit ratings in “Risk Factors” in our 2011 Form 10-K forinformation about factors that may lead to the U.S. government’s long-term debt rating being lowered, and“Credit Ratings” for further discussion of our dependence on our credit ratings.
Future changes or disruptions in the financial markets could significantly change the amount, mix and cost offunds we obtain, which also could increase our liquidity and roll-over risk and have a material adverse impact onour liquidity, financial condition and results of operations. See “Risk Factors” in our 2011 Form 10-K for adiscussion of the risks we face relating to (1) the uncertain future of our company; (2) our reliance on theissuance of debt securities to obtain funds for our operations and the relative cost to obtain these funds; and(3) our liquidity contingency plans.
Outstanding Debt
Total outstanding debt of Fannie Mae includes short-term and long-term debt, excluding debt of consolidated trusts.
As of March 31, 2012, our outstanding short-term debt, based on its original contractual maturity, as a percentageof our total outstanding debt decreased to 16% from 20% as of December 31, 2011. For information on ouroutstanding debt maturing within one year, including the current portion of our long-term debt, as a percentage ofour total debt, see “Maturity Profile of Outstanding Debt of Fannie Mae.” In addition, the weighted-averageinterest rate on our long-term debt, based on its original contractual maturity, decreased to 2.32% as of March 31,2012 from 2.42% as of December 31, 2011.
Pursuant to the terms of the senior preferred stock purchase agreement, we are prohibited from issuing debt withoutthe prior consent of Treasury if it would result in our aggregate indebtedness exceeding our outstanding debt limit,which is 120% of the amount of mortgage assets we were allowed to own on December 31 of the immediatelypreceding calendar year. Our debt limit under the senior preferred stock purchase agreement was reduced to $874.8billion in 2012. As of March 31, 2012, our aggregate indebtedness totaled $694.5 billion, which was $180.3 billionbelow our debt limit. The calculation of our indebtedness for purposes of complying with our debt limit reflects theunpaid principal balance and excludes debt basis adjustments and debt of consolidated trusts. Because of our debtlimit, we may be restricted in the amount of debt we issue to fund our operations.
Table 27 displays information as of the dates indicated on our outstanding short-term and long-term debt basedon its original contractual terms.
46

Table 27: Outstanding Short-Term Borrowings and Long-Term Debt(1)
As of
March 31, 2012 December 31, 2011
Maturities Outstanding
Weighted-AverageInterest
Rate Maturities Outstanding
Weighted-AverageInterest
Rate
(Dollars in millions)
Short-term debt:Fixed-rate:
Discount notes . . . . . . . . . . . . . . . . . . . . . — $ 110,350 0.12% — $ 146,301 0.13%Foreign exchange discount notes . . . . . . — 422 2.05 — 371 1.88Other(2) . . . . . . . . . . . . . . . . . . . . . . . . . . . — 80 0.04 — 80 0.04
Total short-term debt of Fannie Mae(3) . . . . . . . 110,852 0.13 146,752 0.13Debt of consolidated trusts . . . . . . . . . . . . . . — 4,495 0.11 — 4,973 0.09
Total short-term debt . . . . . . . . . . . . . . . . . . . . $ 115,347 0.13% $ 151,725 0.13%
Long-term debt:Senior fixed:
Benchmark notes and bonds . . . . . . . . . . 2012 - 2030 $275,342 2.67% 2012 - 2030 $277,146 2.81%Medium-term notes(4) . . . . . . . . . . . . . . . . 2012 - 2022 170,219 1.55 2012 - 2021 176,886 1.61Foreign exchange notes and bonds . . . . . . 2021 - 2028 683 5.40 2021 - 2028 662 5.44Other(5)(6) . . . . . . . . . . . . . . . . . . . . . . . . . . 2012 - 2040 47,034 5.29 2012 -2040 50,912 5.29
Total senior fixed . . . . . . . . . . . . . . . . . 493,278 2.53 505,606 2.64Senior floating:
Medium-term notes(4) . . . . . . . . . . . . . . . . 2012 - 2019 73,187 0.32 2012 - 2016 71,855 0.32Other(5)(6) . . . . . . . . . . . . . . . . . . . . . . . . . . 2020 - 2037 364 8.18 2020 -2037 420 8.01
Total senior floating . . . . . . . . . . . . . . 73,551 0.36 72,275 0.35Subordinated fixed-rate:
Qualifying subordinated(7) . . . . . . . . . . . . 2012 - 2014 4,894 5.08 2012 - 2014 4,894 5.08Subordinated debentures . . . . . . . . . . . . . 2019 2,984 9.91 2019 2,917 9.91
Total subordinated fixed-rate . . . . . . . 7,878 6.91 7,811 6.88Secured borrowings(8) . . . . . . . . . . . . . . . . . . 2021 - 2022 415 1.87 — — —
Total long-term debt of Fannie Mae(9) . . . . . . . 575,122 2.32 585,692 2.42Debt of consolidated trusts(6) . . . . . . . . . . . . 2012 - 2052 2,493,738 4.04 2012 - 2051 2,452,455 4.18
Total long-term debt . . . . . . . . . . . . . . . . . . . . $3,068,860 3.71% $3,038,147 3.84%
Outstanding callable debt of Fannie Mae(10) . . $177,972 2.05% $187,937 2.17%
(1) Outstanding debt amounts and weighted-average interest rates reported in this table include the effect of unamortizeddiscounts, premiums and other cost basis adjustments. Reported amounts include fair value gains and losses associatedwith debt that we elected to carry at fair value. The unpaid principal balance of outstanding debt of Fannie Mae, whichexcludes unamortized discounts, premiums and other cost basis adjustments, and debt of consolidated trusts, totaled$693.8 billion and $741.6 billion as of March 31, 2012 and December 31, 2011, respectively.
(2) Includes foreign exchange discount notes denominated in U.S. dollars.(3) Short-term debt of Fannie Mae consists of borrowings with an original contractual maturity of one year or less and,
therefore, does not include the current portion of long-term debt. Reported amounts include a net discount and other costbasis adjustments of $40 million and $53 million as of March 31, 2012 and December 31, 2011, respectively.
47

(4) Includes long-term debt with an original contractual maturity of greater than 1 year and up to 10 years, excluding zero-coupon debt.
(5) Includes long-term debt that is not included in other debt categories.(6) Includes a portion of structured debt instruments that is reported at fair value.(7) Consists of subordinated debt with an interest deferral feature.(8) Represents remaining liability for transfer of financial assets from our condensed consolidated balance sheets that did not
qualify as a sale.(9) Long-term debt of Fannie Mae consists of borrowings with an original contractual maturity of greater than one year.
Reported amounts include the current portion of long-term debt that is due within one year, which totaled $140.6 billionand $134.3 billion as of March 31, 2012 and December 31, 2011, respectively. Reported amounts also includeunamortized discounts, premiums and other cost basis adjustments of $8.4 billion and $9.2 billion as of March 31, 2012and December 31, 2011, respectively. The unpaid principal balance of long-term debt of Fannie Mae, which excludesunamortized discounts, premiums, fair value adjustments and other cost basis adjustments and amounts related to debt ofconsolidated trusts, totaled $583.4 billion and $594.8 billion as of March 31, 2012 and December 31, 2011, respectively.
(10) Consists of long-term callable debt of Fannie Mae that can be paid off in whole or in part at our option or the option of theinvestor at any time on or after a specified date. Includes the unpaid principal balance, and excludes unamortizeddiscounts, premiums and other cost basis adjustments.
Maturity Profile of Outstanding Debt of Fannie Mae
Table 28 displays the maturity profile, as of March 31, 2012, of our outstanding debt maturing within one year,by month, including amounts we have announced for early redemption. Our outstanding debt maturing withinone year, including the current portion of our long-term debt, decreased as a percentage of our total outstandingdebt, excluding debt of consolidated trusts, to 37% as of March 31, 2012, compared with 38% as ofDecember 31, 2011. The weighted-average maturity of our outstanding debt that is maturing within one year was150 days as of March 31, 2012, compared with 158 days as of December 31, 2011.
Table 28: Maturity Profile of Outstanding Debt of Fannie Mae Maturing Within One Year(1)
$0
$10.9
$1.4
$17.9
$23.0
$13.2
$12.6$18.2$16.4$10.0$5.3
$6.1
$5.6
Apr-12 May-12 Jun-12 Ju1-12 Aug-12 Sep-12 Oct-12 Nov-12 Dec-12 Jan-13 Feb-13 Mar-13
$5
$10
$15
$20
$25
$30
$35
$40
$45
$50
(Dol
lars
in b
illio
ns)
$23.2 $19.4 $15.1 $7.9 $3.8 $9.3$3.0
$22.7$1.5 $5.0 $- $-
Long-TermShort-Term
(1) Includes unamortized discounts, premiums and other cost basis adjustments of $101 million as of March 31, 2012.Excludes debt of consolidated trusts maturing within one year of $7.4 billion as of March 31, 2012.
48
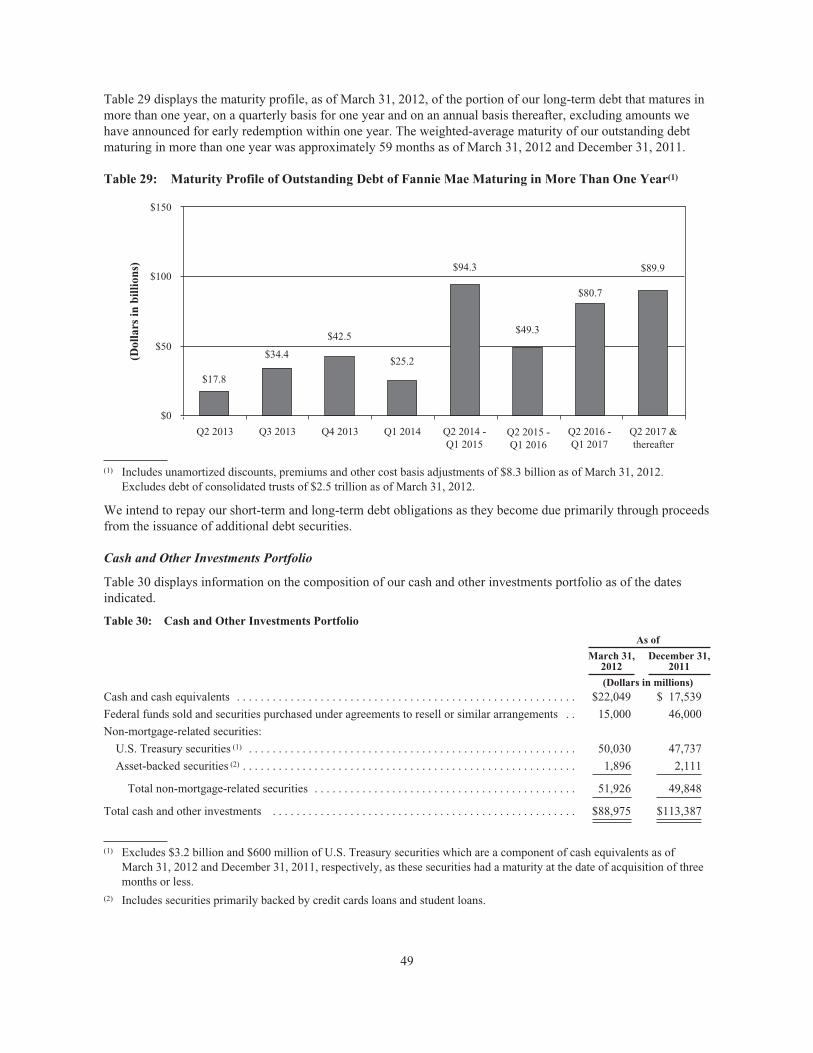
Table 29 displays the maturity profile, as of March 31, 2012, of the portion of our long-term debt that matures inmore than one year, on a quarterly basis for one year and on an annual basis thereafter, excluding amounts wehave announced for early redemption within one year. The weighted-average maturity of our outstanding debtmaturing in more than one year was approximately 59 months as of March 31, 2012 and December 31, 2011.
Table 29: Maturity Profile of Outstanding Debt of Fannie Mae Maturing in More Than One Year(1)
$0
$50
$100
(Dol
lars
in b
illio
ns)
$150
Q2 2013
$17.8
$34.4
$42.5
$25.2
$94.3
$49.3
$80.7
$89.9
Q3 2013 Q4 2013 Q1 2014 Q2 2014 -Q1 2015
Q2 2015 -Q1 2016
Q2 2016 -Q1 2017
Q2 2017 &thereafter
(1) Includes unamortized discounts, premiums and other cost basis adjustments of $8.3 billion as of March 31, 2012.Excludes debt of consolidated trusts of $2.5 trillion as of March 31, 2012.
We intend to repay our short-term and long-term debt obligations as they become due primarily through proceedsfrom the issuance of additional debt securities.
Cash and Other Investments Portfolio
Table 30 displays information on the composition of our cash and other investments portfolio as of the datesindicated.
Table 30: Cash and Other Investments Portfolio
As of
March 31,2012
December 31,2011
(Dollars in millions)Cash and cash equivalents . . . . . . . . . . . . . . . . . . . . . . . . . . . . . . . . . . . . . . . . . . . . . . . . . . . . . . . . . $22,049 $ 17,539
Federal funds sold and securities purchased under agreements to resell or similar arrangements . . 15,000 46,000
Non-mortgage-related securities:
U.S. Treasury securities (1) . . . . . . . . . . . . . . . . . . . . . . . . . . . . . . . . . . . . . . . . . . . . . . . . . . . . . . . 50,030 47,737
Asset-backed securities (2) . . . . . . . . . . . . . . . . . . . . . . . . . . . . . . . . . . . . . . . . . . . . . . . . . . . . . . . . 1,896 2,111
Total non-mortgage-related securities . . . . . . . . . . . . . . . . . . . . . . . . . . . . . . . . . . . . . . . . . . . . 51,926 49,848
Total cash and other investments . . . . . . . . . . . . . . . . . . . . . . . . . . . . . . . . . . . . . . . . . . . . . . . . . . . $88,975 $113,387
(1) Excludes $3.2 billion and $600 million of U.S. Treasury securities which are a component of cash equivalents as ofMarch 31, 2012 and December 31, 2011, respectively, as these securities had a maturity at the date of acquisition of threemonths or less.
(2) Includes securities primarily backed by credit cards loans and student loans.
49

Our cash and other investments portfolio decreased from December 31, 2011 to March 31, 2012. The balance ofour cash and other investments portfolio fluctuates based on changes in our cash flows, overall liquidity in thefixed income markets and our liquidity risk management policies and practices. See “Risk Management—CreditRisk Management—Institutional Counterparty Credit Risk Management—Issuers of Investments Held in ourCash and Other Investments Portfolio” for additional information on the risks associated with the assets in ourcash and other investments portfolio.
Credit Ratings
Our credit ratings from the major credit ratings organizations, as well as the credit ratings of the U.S.government, are primary factors that could affect our ability to access the capital markets and our cost of funds.In addition, our credit ratings are important when we seek to engage in certain long-term transactions, such asderivative transactions. Standard & Poor’s Ratings Services (“S&P”), Moody’s Investors Service (“Moody’s”)and Fitch Ratings Limited (“Fitch”) have all indicated that, if they were to lower the sovereign credit ratings onthe U.S, they would likely lower their ratings on the debt of Fannie Mae and certain other government-relatedentities. We cannot predict whether one or more of these ratings agencies will lower our debt ratings in thefuture. See “Risk Factors” in our 2011 Form 10-K for a discussion of the possibility of further downgrades andthe risks to our business relating to a decrease in our credit ratings, which could include an increase in ourborrowing costs, limits on our ability to issue debt, and additional collateral requirements under our derivativescontracts and other borrowing arrangements.
Table 31 displays the credit ratings issued by the three major credit rating agencies as of May 2, 2012.
Table 31: Fannie Mae Credit Ratings
As of May 2, 2012
S&P Moody’s Fitch
Long-term senior debt . . . . . . . . . . . . . . . . . AA+ Aaa AAAShort-term senior debt . . . . . . . . . . . . . . . . A-1+ P-1 F1+Qualifying subordinated debt . . . . . . . . . . . A Aa2 AA-Preferred stock . . . . . . . . . . . . . . . . . . . . . . C Ca C/RR6Bank financial strength rating . . . . . . . . . . . — E+ —Outlook . . . . . . . . . . . . . . . . . . . . . . . . . . . . Negative
(for Long TermSenior Debt and
QualifyingSubordinated Debt)
Negative(for Long TermSenior Debt and
QualifyingSubordinated Debt)
Negative(for AAA rated
Long Term IssuerDefault Rating)
Cash Flows
Three Months Ended March 31, 2012. Cash and cash equivalents increased from December 31, 2011 by $4.5billion to $22.0 billion as of March 31, 2012. Net cash generated from investing activities totaled $157.5 billion,resulting primarily from proceeds received from repayments of loans held for investment. These net cash inflowswere offset by net cash used in operating activities of $114 million and net cash used in financing activities of$152.9 billion primarily attributable to a significant amount of debt redemptions in excess of proceeds receivedfrom the issuance of debt as well as proceeds received from Treasury under the senior preferred stock purchaseagreement.
Three Months Ended March 31, 2011. Cash and cash equivalents increased from December 31, 2010 by $2.5billion to $19.8 billion as of March 31, 2011. Net cash generated from investing activities totaled $123.8 billion,resulting primarily from proceeds received from repayments of loans held for investment. Net cash fromoperating activities totaled $2.6 billion. These net cash inflows were partially offset by net cash used in financingactivities of $123.9 billion primarily attributable to a significant amount of debt redemptions in excess ofproceeds received from the issuances of debt as well as proceeds received from Treasury under the seniorpreferred stock purchase agreement.
50

Capital Management
Regulatory Capital
FHFA has announced that, during the conservatorship, our existing statutory and FHFA-directed regulatorycapital requirements will not be binding and that FHFA will not issue quarterly capital classifications. We submitcapital reports to FHFA and FHFA monitors our capital levels. The deficit of core capital over statutoryminimum capital was $147.8 billion as of March 31, 2012 and $148.4 billion as of December 31, 2011.
Senior Preferred Stock Purchase Agreement
As a result of the covenants under the senior preferred stock purchase agreement, Treasury’s ownership of thewarrant to purchase up to 79.9% of the total shares of our common stock outstanding and the uncertaintyregarding our future, we effectively no longer have access to equity funding except through draws under thesenior preferred stock purchase agreement.
Under the senior preferred stock purchase agreement, Treasury made a commitment to provide funding, undercertain conditions, to eliminate deficits in our net worth. We have received a total of $116.1 billion fromTreasury pursuant to the senior preferred stock purchase agreement as of March 31, 2012. The aggregateliquidation preference of the senior preferred stock, including the initial aggregate liquidation preference of $1.0billion, remains at $117.1 billion.
While we had a positive net worth as of March 31, 2012, in some future periods we expect to have a net worthdeficit and therefore will be required to obtain additional funding from Treasury pursuant to the senior preferredstock purchase agreement.
The senior preferred stock purchase agreement provides that the $200 billion maximum amount of thecommitment from Treasury will increase as necessary to accommodate any net worth deficiencies attributable toperiods during 2010, 2011 and 2012. If we do not have a positive net worth as of December 31, 2012, then theamount of funding available under the senior preferred stock purchase agreement after 2012 will be $124.8billion ($200 billion less $75.2 billion in cumulative draws for net worth deficiencies through December 31,2009).
In the event we have a positive net worth as of December 31, 2012, then the amount of funding available after2012 under the senior preferred stock purchase agreement will depend on the size of that positive net worthrelative to the cumulative draws for net worth deficiencies attributable to periods during 2010, 2011 and 2012, asfollows:
• If our positive net worth as of December 31, 2012 is less than the cumulative draws for net worthdeficiencies attributable to periods during 2010, 2011 and 2012, then the amount of available funding willbe $124.8 billion less our positive net worth as of December 31, 2012.
• If our positive net worth as of December 31, 2012 is greater than the cumulative draws for net worthdeficiencies attributable to periods during 2010, 2011 and 2012, then the amount of available funding willbe $124.8 billion less the cumulative draws attributable to periods during 2010, 2011 and 2012.
As of May 9, 2012, the amount of the quarterly commitment fee payable by us to Treasury under the seniorpreferred stock purchase agreement had not been established; however, Treasury has waived the quarterlycommitment fee under the senior preferred stock purchase agreement for each quarter of 2011 and the first andsecond quarters of 2012 due to the continued fragility of the U.S. mortgage market and Treasury’s belief thatimposing the commitment fee would not generate increased compensation for taxpayers. Treasury stated that itwill reevaluate the situation during the next calendar quarter to determine whether the quarterly commitment feeshould then be set.
Dividends
Our first quarter dividend of $2.8 billion was declared by the conservator and paid by us on March 30, 2012. Theannualized dividend on the senior preferred stock remains at $11.7 billion based on the 10% dividend rate. Thelevel of dividends on the senior preferred stock will increase in future periods if, as we expect, the conservatorrequests additional funds on our behalf from Treasury under the senior preferred stock purchase agreement.
51

OFF-BALANCE SHEET ARRANGEMENTS
Our maximum potential exposure to credit losses relating to our outstanding and unconsolidated Fannie MaeMBS and other financial guarantees is primarily represented by the unpaid principal balance of the mortgageloans underlying outstanding and unconsolidated Fannie Mae MBS and other financial guarantees of $61.5billion as of March 31, 2012 and $62.0 billion as of December 31, 2011.
We also provide assistance to housing finance agencies (“HFAs”) under the temporary credit and liquidityfacilities programs in which Treasury has purchased participation interests. For a description of these programs,see “MD&A—Off-Balance Sheet Arrangements—Treasury Housing Finance Agency Initiative” in our 2011Form 10-K.
RISK MANAGEMENT
Our business activities expose us to the following three major categories of financial risk: credit risk, market risk(including interest rate and liquidity risk) and operational risk. We seek to actively monitor and manage theserisks by using an established risk management framework. Our risk management framework is intended toprovide the basis for the principles that govern our risk management activities. In addition to these financialrisks, there is significant uncertainty regarding the future of our company, including how long we will continueto be in existence, which we discuss in more detail in “Legislative and Regulatory Developments—GSE Reform”in this report and in “Risk Factors” in our 2011 Form 10-K. We are also subject to a number of other risks thatcould adversely impact our business, financial condition, earnings and cash flow, including model, legal andreputational risks that may arise due to a failure to comply with laws, regulations or ethical standards and codesof conduct applicable to our business activities and functions.
In this section we provide an update on our management of our major risk categories. For a more completediscussion of the financial risks we face and how we manage credit risk, market risk and operational risk, see“MD&A—Risk Management” in our 2011 Form 10-K and “Risk Factors” in our 2011 Form 10-K and in thisreport.
Credit Risk Management
We are generally subject to two types of credit risk: mortgage credit risk and institutional counterparty creditrisk. Mortgage credit risk is the risk that a borrower will fail to make required mortgage payments. Institutionalcounterparty credit risk is the risk that our institutional counterparties may fail to fulfill their contractualobligations to us, including seller/servicers who are obligated to repurchase loans from us or reimburse us forlosses in certain circumstances.
Mortgage Credit Risk Management
We are exposed to credit risk on our mortgage credit book of business because we either hold mortgage assets,have issued a guaranty in connection with the creation of Fannie Mae MBS backed by mortgage assets orprovided other credit enhancements on mortgage assets. While our mortgage credit book of business includes allof our mortgage-related assets, both on- and off-balance sheet, our guaranty book of business excludesnon-Fannie Mae mortgage-related securities held in our portfolio for which we do not provide a guaranty. Weprovide information on the performance of non-Fannie Mae mortgage-related securities held in our portfolio,including the impairment that we have recognized on these securities, in “Consolidated Balance SheetAnalysis—Investments in Mortgage-Related Securities—Investments in Private-Label Mortgage-RelatedSecurities.”
Mortgage Credit Book of Business
Table 32 displays the composition of our entire mortgage credit book of business as of the dates indicated. Ourtotal single-family mortgage credit book of business accounted for 93% of our total mortgage credit book ofbusiness as of March 31, 2012 and December 31, 2011.
52

Table 32: Composition of Mortgage Credit Book of Business(1)
As of March 31, 2012 As of December 31, 2011
Single-Family Multifamily TotalSingle-Family Multifamily Total
(Dollars in millions)
Mortgage loans and Fannie Mae MBS(2) . . . . . . . . $2,814,217 $178,794 $2,993,011 $2,798,633 $176,898 $2,975,531
Unconsolidated Fannie Mae MBS, held by thirdparties(3) . . . . . . . . . . . . . . . . . . . . . . . . . . . . . . . 17,276 1,654 18,930 17,910 1,702 19,612
Other credit guarantees(4) . . . . . . . . . . . . . . . . . . . 26,154 16,407 42,561 25,824 16,582 42,406
Guaranty book of business . . . . . . . . . . . . . . . . $2,857,647 $196,855 $3,054,502 $2,842,367 $195,182 $3,037,549
Agency mortgage-related securities(5) . . . . . . . . . . 14,486 33 14,519 15,522 33 15,555
Other mortgage-related securities(6) . . . . . . . . . . . 41,829 30,704 72,533 43,019 31,511 74,530
Mortgage credit book of business . . . . . . . . . . . $2,913,962 $227,592 $3,141,554 $2,900,908 $226,726 $3,127,634
Guaranty Book of Business Detail:
Conventional Guaranty Book of Business(7) . . . $2,785,819 $194,560 $2,980,379 $2,769,919 $192,797 $2,962,716
Government Guaranty Book of Business(8) . . . . $ 71,828 $ 2,295 $ 74,123 $ 72,448 $ 2,385 $ 74,833
(1) Based on unpaid principal balance.(2) Consists of mortgage loans and Fannie Mae MBS recognized in our condensed consolidated balance sheets. The principal
balance of resecuritized Fannie Mae MBS is included only once in the reported amount.(3) Reflects unpaid principal balance of unconsolidated Fannie Mae MBS, held by third-party investors. The principal balance
of resecuritized Fannie Mae MBS is included only once in the reported amount.(4) Includes single-family and multifamily credit enhancements that we have provided and that are not otherwise reflected in
the table.(5) Consists of mortgage-related securities issued by Freddie Mac and Ginnie Mae.(6) Consists primarily of mortgage-revenue bonds, manufactured housing bonds and CMBS.(7) Refers to mortgage loans and mortgage-related securities that are not guaranteed or insured, in whole or in part, by the
U.S. government or one of its agencies.(8) Refers to mortgage loans and mortgage-related securities guaranteed or insured, in whole or in part, by the U.S.
government or one of its agencies.
In the following sections, we discuss the mortgage credit risk of the single-family and multifamily loans in ourguaranty book of business. The credit statistics reported below, unless otherwise noted, pertain generally to theportion of our guaranty book of business for which we have access to detailed loan-level information, whichconstituted approximately 99% of each of our single-family conventional guaranty book of business and ourmultifamily guaranty book of business, excluding defeased loans, as of March 31, 2012 and December 31, 2011.We typically obtain this data from the sellers or servicers of the mortgage loans in our guaranty book of businessand receive representations and warranties from them as to the accuracy of the information. While we performvarious quality assurance checks by sampling loans to assess compliance with our underwriting and eligibilitycriteria, we do not independently verify all reported information and we rely on lender representations regardingthe accuracy of the characteristics of loans in our guaranty book of business. See “Risk Factors” in our 2011Form 10-K for a discussion of the risk that we could experience mortgage fraud as a result of this reliance onlender representations.
53

Single-Family Mortgage Credit Risk Management
Our strategy in managing single-family mortgage credit risk consists of four primary components: (1) ouracquisition and servicing policies along with our underwriting and servicing standards, including the use of creditenhancements; (2) portfolio diversification and monitoring; (3) management of problem loans; and (4) REOmanagement. These strategies may increase our expenses and may not be effective in reducing our credit-relatedexpenses or credit losses. We provide information on our credit-related expenses and credit losses in“Consolidated Results of Operations—Credit-Related Expenses.”
In evaluating our single-family mortgage credit risk, we closely monitor changes in housing and economicconditions and the impact of those changes on the credit risk profile of our single-family mortgage credit book ofbusiness. We regularly review and provide updates to our underwriting standards and eligibility guidelines thattake into consideration changing market conditions. The credit risk profile of our single-family mortgage creditbook of business is influenced by, among other things, the credit profile of the borrower, features of the loan,loan product type, the type of property securing the loan and the housing market and general economy. We focusmore on loans that we believe pose a higher risk of default, which typically have been loans associated withhigher mark-to-market LTV ratios, loans to borrowers with lower FICO credit scores and certain higher risk loanproduct categories, such as Alt-A loans. These and other factors affect both the amount of expected credit loss ona given loan and the sensitivity of that loss to changes in the economic environment.
Because we believe we have limited credit exposure on our government loans, the single-family credit statisticswe focus on and report in the sections below generally relate to our single-family conventional guaranty book ofbusiness, which represents the substantial majority of our total single-family guaranty book of business.
Table 33 displays our single-family conventional business volumes and our single-family conventional guarantybook of business for the periods indicated, based on certain key risk characteristics that we use to evaluate therisk profile and credit quality of our single-family loans.
54

Table 33: Risk Characteristics of Single-Family Conventional Business Volume and Guaranty Book of Business(1)
Percent of Single-FamilyConventional Business Volume(2)
For the Three Months EndedMarch 31,
Percent of Single-FamilyConventional Guaranty
Book of Business(3)(4)
As of
2012 2011 March 31, 2012 December 31, 2011
Original LTV ratio:(5)
<= 60% . . . . . . . . . . . . . . . . . . . . . . . . . . . . . . 29% 30% 24% 24%60.01% to 70% . . . . . . . . . . . . . . . . . . . . . . . . 16 16 15 1670.01% to 80% . . . . . . . . . . . . . . . . . . . . . . . . 35 38 41 4080.01% to 90% (6) . . . . . . . . . . . . . . . . . . . . . . 9 8 10 1090.01% to 100% (6) . . . . . . . . . . . . . . . . . . . . . 7 6 9 9Greater than 100% (6) . . . . . . . . . . . . . . . . . . . . 4 2 1 1
Total . . . . . . . . . . . . . . . . . . . . . . . . . . . . . . 100% 100% 100% 100%
Weighted average . . . . . . . . . . . . . . . . . . . . 70% 69% 72% 71%Average loan amount . . . . . . . . . . . . . . . . . . . . . $214,216 $213,710 $156,697 $156,194Estimated mark-to-market LTV ratio:(7)
<= 60% . . . . . . . . . . . . . . . . . . . . . . . . . . . . . . 25% 26%60.01% to 70% . . . . . . . . . . . . . . . . . . . . . . . . 12 1270.01% to 80% . . . . . . . . . . . . . . . . . . . . . . . . 18 1880.01% to 90% . . . . . . . . . . . . . . . . . . . . . . . . 16 1690.01% to 100% . . . . . . . . . . . . . . . . . . . . . . . 10 10Greater than 100% . . . . . . . . . . . . . . . . . . . . . 19 18
Total . . . . . . . . . . . . . . . . . . . . . . . . . . . . . . 100% 100%
Weighted average . . . . . . . . . . . . . . . . . . . . 80% 79%Product type:
Fixed-rate:(8) . . . . . . . . . . . . . . . . . . . . . . . . . .Long-term . . . . . . . . . . . . . . . . . . . . . . . . . . 72% 68% 72% 73%Intermediate-term . . . . . . . . . . . . . . . . . . . . 24 25 16 15Interest-only . . . . . . . . . . . . . . . . . . . . . . . . * * 1 1
Total fixed-rate . . . . . . . . . . . . . . . . . . . . 96 93 89 89
Adjustable-rate: . . . . . . . . . . . . . . . . . . . . . . .Interest-only . . . . . . . . . . . . . . . . . . . . . . . . * 1 3 3Other ARMs . . . . . . . . . . . . . . . . . . . . . . . . 4 6 8 8
Total adjustable-rate . . . . . . . . . . . . . . . . 4 7 11 11
Total . . . . . . . . . . . . . . . . . . . . . . . . . . . . 100% 100% 100% 100%
Number of property units:1 unit . . . . . . . . . . . . . . . . . . . . . . . . . . . . . . . . 98% 98% 97% 97%2-4 units . . . . . . . . . . . . . . . . . . . . . . . . . . . . . 2 2 3 3
Total . . . . . . . . . . . . . . . . . . . . . . . . . . . . . . 100% 100% 100% 100%
Property type:Single-family homes . . . . . . . . . . . . . . . . . . . . 91% 91% 91% 91%Condo/Co-op . . . . . . . . . . . . . . . . . . . . . . . . . 9 9 9 9
Total . . . . . . . . . . . . . . . . . . . . . . . . . . . . . . 100% 100% 100% 100%
55

Percent of Single-FamilyConventional Business Volume(2)
For the Three Months EndedMarch 31,
Percent of Single-FamilyConventional Guaranty
Book of Business(3)(4)
As of
2012 2011 March 31, 2012 December 31, 2011
Occupancy type:Primary residence . . . . . . . . . . . . . . . . . . . . . . 89% 89% 89% 89%Second/vacation home . . . . . . . . . . . . . . . . . . 4 5 5 5Investor . . . . . . . . . . . . . . . . . . . . . . . . . . . . . . 7 6 6 6
Total . . . . . . . . . . . . . . . . . . . . . . . . . . . . . . 100% 100% 100% 100%
FICO credit score at origination:< 620 . . . . . . . . . . . . . . . . . . . . . . . . . . . . . . . . 1% *% 3% 3%620 to < 660 . . . . . . . . . . . . . . . . . . . . . . . . . . 2 2 7 7660 to < 700 . . . . . . . . . . . . . . . . . . . . . . . . . . 6 7 13 13700 to < 740 . . . . . . . . . . . . . . . . . . . . . . . . . . 15 17 20 20>= 740 . . . . . . . . . . . . . . . . . . . . . . . . . . . . . . . 76 74 57 57
Total . . . . . . . . . . . . . . . . . . . . . . . . . . . . . . 100% 100% 100% 100%
Weighted average . . . . . . . . . . . . . . . . . . . . 763 762 739 738Loan purpose:
Purchase . . . . . . . . . . . . . . . . . . . . . . . . . . . . . 17% 18% 30% 31%Cash-out refinance . . . . . . . . . . . . . . . . . . . . . 16 19 26 27Other refinance . . . . . . . . . . . . . . . . . . . . . . . . 67 63 44 42
Total . . . . . . . . . . . . . . . . . . . . . . . . . . . . . . 100% 100% 100% 100%
Geographic concentration:(9)
Midwest . . . . . . . . . . . . . . . . . . . . . . . . . . . . . 15% 15% 15% 15%Northeast . . . . . . . . . . . . . . . . . . . . . . . . . . . . . 19 20 19 19Southeast . . . . . . . . . . . . . . . . . . . . . . . . . . . . . 19 20 23 24Southwest . . . . . . . . . . . . . . . . . . . . . . . . . . . . 15 15 16 15West . . . . . . . . . . . . . . . . . . . . . . . . . . . . . . . . 32 30 27 27
Total . . . . . . . . . . . . . . . . . . . . . . . . . . . . . . 100% 100% 100% 100%
Origination year:<= 2001 . . . . . . . . . . . . . . . . . . . . . . . . . . . . . . 2% 2%2002 . . . . . . . . . . . . . . . . . . . . . . . . . . . . . . . . . 2 22003 . . . . . . . . . . . . . . . . . . . . . . . . . . . . . . . . . 8 92004 . . . . . . . . . . . . . . . . . . . . . . . . . . . . . . . . . 5 52005 . . . . . . . . . . . . . . . . . . . . . . . . . . . . . . . . . 7 72006 . . . . . . . . . . . . . . . . . . . . . . . . . . . . . . . . . 6 72007 . . . . . . . . . . . . . . . . . . . . . . . . . . . . . . . . . 9 102008 . . . . . . . . . . . . . . . . . . . . . . . . . . . . . . . . . 6 72009 . . . . . . . . . . . . . . . . . . . . . . . . . . . . . . . . . 15 172010 . . . . . . . . . . . . . . . . . . . . . . . . . . . . . . . . . 17 182011 . . . . . . . . . . . . . . . . . . . . . . . . . . . . . . . . . 18 162012 . . . . . . . . . . . . . . . . . . . . . . . . . . . . . . . . . 5 —
Total . . . . . . . . . . . . . . . . . . . . . . . . . . . . . . 100% 100%
* Represents less than 0.5% of single-family conventional business volume or book of business.(1) We reflect second lien mortgage loans in the original LTV ratio calculation only when we own both the first and second
lien mortgage loans or we own only the second lien mortgage loan. Second lien mortgage loans represented less than 0.5%
56
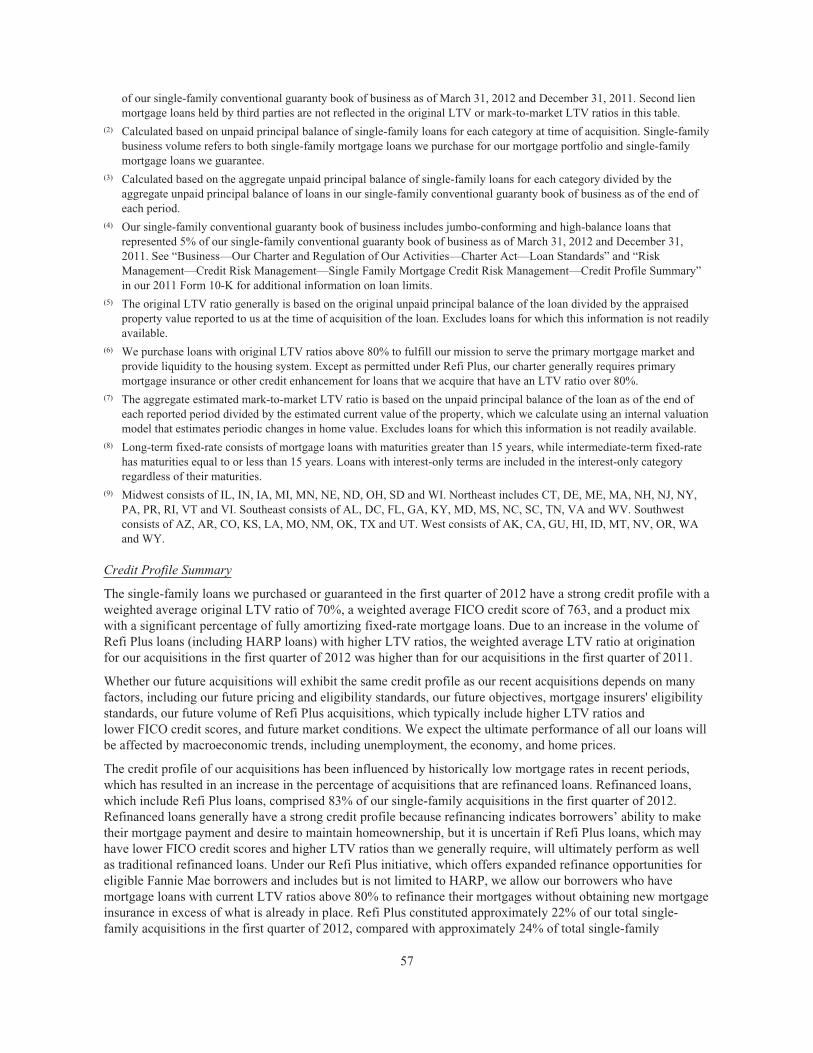
of our single-family conventional guaranty book of business as of March 31, 2012 and December 31, 2011. Second lienmortgage loans held by third parties are not reflected in the original LTV or mark-to-market LTV ratios in this table.
(2) Calculated based on unpaid principal balance of single-family loans for each category at time of acquisition. Single-familybusiness volume refers to both single-family mortgage loans we purchase for our mortgage portfolio and single-familymortgage loans we guarantee.
(3) Calculated based on the aggregate unpaid principal balance of single-family loans for each category divided by theaggregate unpaid principal balance of loans in our single-family conventional guaranty book of business as of the end ofeach period.
(4) Our single-family conventional guaranty book of business includes jumbo-conforming and high-balance loans thatrepresented 5% of our single-family conventional guaranty book of business as of March 31, 2012 and December 31,2011. See “Business—Our Charter and Regulation of Our Activities—Charter Act—Loan Standards” and “RiskManagement—Credit Risk Management—Single Family Mortgage Credit Risk Management—Credit Profile Summary”in our 2011 Form 10-K for additional information on loan limits.
(5) The original LTV ratio generally is based on the original unpaid principal balance of the loan divided by the appraisedproperty value reported to us at the time of acquisition of the loan. Excludes loans for which this information is not readilyavailable.
(6) We purchase loans with original LTV ratios above 80% to fulfill our mission to serve the primary mortgage market andprovide liquidity to the housing system. Except as permitted under Refi Plus, our charter generally requires primarymortgage insurance or other credit enhancement for loans that we acquire that have an LTV ratio over 80%.
(7) The aggregate estimated mark-to-market LTV ratio is based on the unpaid principal balance of the loan as of the end ofeach reported period divided by the estimated current value of the property, which we calculate using an internal valuationmodel that estimates periodic changes in home value. Excludes loans for which this information is not readily available.
(8) Long-term fixed-rate consists of mortgage loans with maturities greater than 15 years, while intermediate-term fixed-ratehas maturities equal to or less than 15 years. Loans with interest-only terms are included in the interest-only categoryregardless of their maturities.
(9) Midwest consists of IL, IN, IA, MI, MN, NE, ND, OH, SD and WI. Northeast includes CT, DE, ME, MA, NH, NJ, NY,PA, PR, RI, VT and VI. Southeast consists of AL, DC, FL, GA, KY, MD, MS, NC, SC, TN, VA and WV. Southwestconsists of AZ, AR, CO, KS, LA, MO, NM, OK, TX and UT. West consists of AK, CA, GU, HI, ID, MT, NV, OR, WAand WY.
Credit Profile Summary
The single-family loans we purchased or guaranteed in the first quarter of 2012 have a strong credit profile with aweighted average original LTV ratio of 70%, a weighted average FICO credit score of 763, and a product mixwith a significant percentage of fully amortizing fixed-rate mortgage loans. Due to an increase in the volume ofRefi Plus loans (including HARP loans) with higher LTV ratios, the weighted average LTV ratio at originationfor our acquisitions in the first quarter of 2012 was higher than for our acquisitions in the first quarter of 2011.
Whether our future acquisitions will exhibit the same credit profile as our recent acquisitions depends on manyfactors, including our future pricing and eligibility standards, our future objectives, mortgage insurers' eligibilitystandards, our future volume of Refi Plus acquisitions, which typically include higher LTV ratios andlower FICO credit scores, and future market conditions. We expect the ultimate performance of all our loans willbe affected by macroeconomic trends, including unemployment, the economy, and home prices.
The credit profile of our acquisitions has been influenced by historically low mortgage rates in recent periods,which has resulted in an increase in the percentage of acquisitions that are refinanced loans. Refinanced loans,which include Refi Plus loans, comprised 83% of our single-family acquisitions in the first quarter of 2012.Refinanced loans generally have a strong credit profile because refinancing indicates borrowers’ ability to maketheir mortgage payment and desire to maintain homeownership, but it is uncertain if Refi Plus loans, which mayhave lower FICO credit scores and higher LTV ratios than we generally require, will ultimately perform as wellas traditional refinanced loans. Under our Refi Plus initiative, which offers expanded refinance opportunities foreligible Fannie Mae borrowers and includes but is not limited to HARP, we allow our borrowers who havemortgage loans with current LTV ratios above 80% to refinance their mortgages without obtaining new mortgageinsurance in excess of what is already in place. Refi Plus constituted approximately 22% of our total single-family acquisitions in the first quarter of 2012, compared with approximately 24% of total single-family
57

acquisitions in all of 2011. It is too early to determine whether the ultimate performance of loans with higher riskcharacteristics refinanced under the Refi Plus program will be different than the performance of other refinancedloans; however, we do expect Refi Plus loans will perform better than the loans they replace because Refi Plusloans should reduce the borrowers’ monthly payments or otherwise provide more sustainability than theborrowers’ old loans (for example, by refinancing into a mortgage with a fixed interest rate instead of anadjustable rate). Approximately 20% of our total single-family conventional business volume for the first quarterof 2012 consisted of loans with LTV ratios higher than 80% at the time of purchase compared with 16% for thefirst quarter of 2011.
The prolonged and severe decline in home prices over the past several years has resulted in the overall estimatedweighted average mark-to-market LTV ratio of our single-family conventional guaranty book of business toremain high at 80% as of March 31, 2012, and 79% as of December 31, 2011. The portion of our single-familyconventional guaranty book of business with an estimated mark-to-market LTV ratio greater than 100% was 19%as of March 31, 2012, and 18% as of December 31, 2011. If home prices decline further, more loans may havemark-to-market LTV ratios greater than 100%, which increases the risk of delinquency and default.
Alt-A and Subprime Loans
Our exposure to Alt-A and subprime loans included in our single-family conventional guaranty book of business,as defined in this section, does not include (1) our investments in private-label mortgage-related securities backedby Alt-A and subprime loans or (2) resecuritizations, or wraps, of private-label mortgage-related securitiesbacked by Alt-A mortgage loans that we have guaranteed. See “Consolidated Balance Sheet Analysis—Investments in Mortgage-Related Securities—Investments in Private-Label Mortgage-Related Securities” for adiscussion of our exposure to private-label mortgage-related securities backed by Alt-A and subprime loans. As aresult of our decision to discontinue the purchase of newly originated Alt-A loans, except for those that representthe refinancing of an existing Fannie Mae loan, we expect our acquisitions of Alt-A mortgage loans to continueto be minimal in future periods and the percentage of the book of business attributable to Alt-A will continue todecrease over time. We are also not currently acquiring newly originated subprime loans.
We have classified a mortgage loan as Alt-A if the lender that delivered the loan to us classified the loan as Alt-Abased on documentation or other features. We have classified a mortgage loan as subprime if the loan wasoriginated by a lender specializing in subprime business or by a subprime division of a large lender; however, weexclude loans originated by these lenders from the subprime classification if we acquired the loans in accordancewith our standard underwriting criteria, which typically require compliance by the seller with our Selling Guide(including standard representations and warranties) and/or evaluation of the loans through our DesktopUnderwriter system. We apply our classification criteria in order to determine our Alt-A and subprime loanexposures; however, we have other loans with some features that are similar to Alt-A and subprime loans that wehave not classified as Alt-A or subprime because they do not meet our classification criteria. The unpaidprincipal balance of Alt-A loans included in our single-family conventional guaranty book of business of $175.9billion as of March 31, 2012, represented approximately 6.3% of our single-family conventional guaranty bookof business. The unpaid principal balance of subprime loans included in our single-family conventional guarantybook of business of $5.6 billion as of March 31, 2012, represented approximately 0.2% of our single-familyconventional guaranty book of business.
Problem Loan Management
Our problem loan management strategies are primarily focused on reducing defaults to avoid losses that wouldotherwise occur and pursuing foreclosure alternatives to attempt to minimize the severity of the losses we incur.If a borrower does not make required payments, or is in jeopardy of not making payments, we work with theservicers of our loans to offer workout solutions to minimize the likelihood of foreclosure as well as the severityof loss. Our loan workouts reflect our various types of home retention solutions, including loan modifications,repayment plans and forbearances, and foreclosure alternatives, including short sales and deeds-in-lieu offoreclosure. When appropriate, we seek to move to foreclosure expeditiously.
58
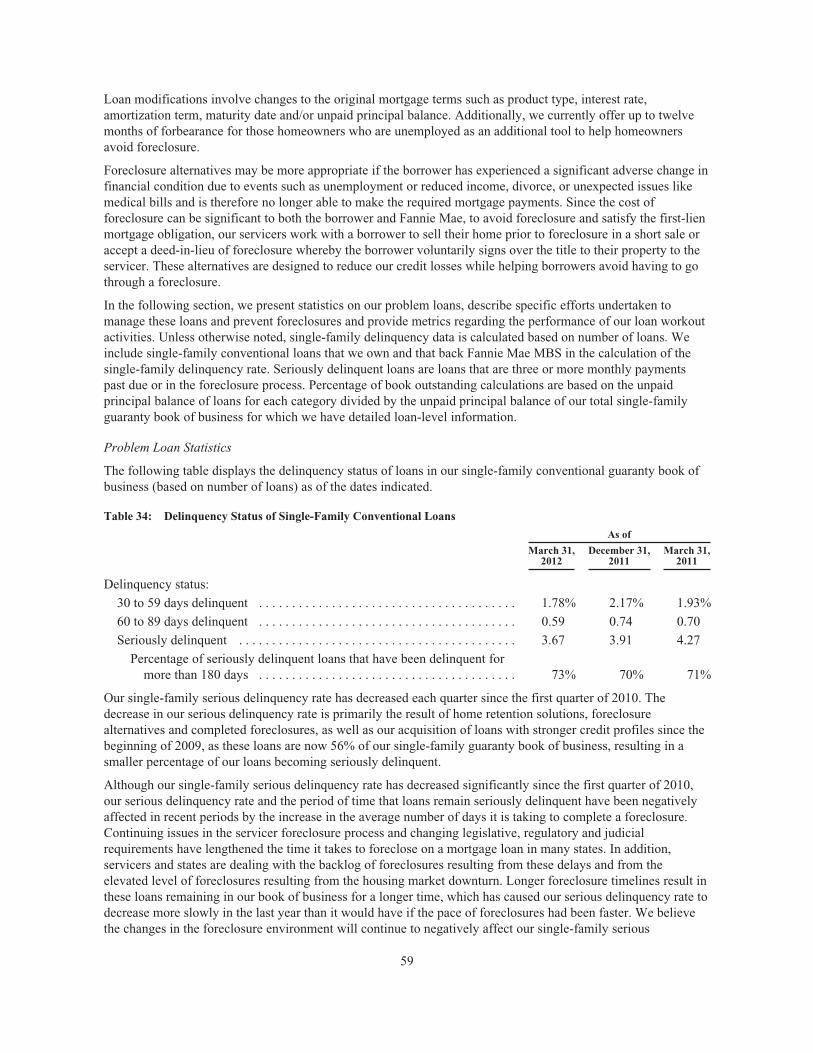
Loan modifications involve changes to the original mortgage terms such as product type, interest rate,amortization term, maturity date and/or unpaid principal balance. Additionally, we currently offer up to twelvemonths of forbearance for those homeowners who are unemployed as an additional tool to help homeownersavoid foreclosure.
Foreclosure alternatives may be more appropriate if the borrower has experienced a significant adverse change infinancial condition due to events such as unemployment or reduced income, divorce, or unexpected issues likemedical bills and is therefore no longer able to make the required mortgage payments. Since the cost offoreclosure can be significant to both the borrower and Fannie Mae, to avoid foreclosure and satisfy the first-lienmortgage obligation, our servicers work with a borrower to sell their home prior to foreclosure in a short sale oraccept a deed-in-lieu of foreclosure whereby the borrower voluntarily signs over the title to their property to theservicer. These alternatives are designed to reduce our credit losses while helping borrowers avoid having to gothrough a foreclosure.
In the following section, we present statistics on our problem loans, describe specific efforts undertaken tomanage these loans and prevent foreclosures and provide metrics regarding the performance of our loan workoutactivities. Unless otherwise noted, single-family delinquency data is calculated based on number of loans. Weinclude single-family conventional loans that we own and that back Fannie Mae MBS in the calculation of thesingle-family delinquency rate. Seriously delinquent loans are loans that are three or more monthly paymentspast due or in the foreclosure process. Percentage of book outstanding calculations are based on the unpaidprincipal balance of loans for each category divided by the unpaid principal balance of our total single-familyguaranty book of business for which we have detailed loan-level information.
Problem Loan Statistics
The following table displays the delinquency status of loans in our single-family conventional guaranty book ofbusiness (based on number of loans) as of the dates indicated.
Table 34: Delinquency Status of Single-Family Conventional Loans
As of
March 31,2012
December 31,2011
March 31,2011
Delinquency status:
30 to 59 days delinquent . . . . . . . . . . . . . . . . . . . . . . . . . . . . . . . . . . . . . . . 1.78% 2.17% 1.93%
60 to 89 days delinquent . . . . . . . . . . . . . . . . . . . . . . . . . . . . . . . . . . . . . . . 0.59 0.74 0.70
Seriously delinquent . . . . . . . . . . . . . . . . . . . . . . . . . . . . . . . . . . . . . . . . . . 3.67 3.91 4.27
Percentage of seriously delinquent loans that have been delinquent formore than 180 days . . . . . . . . . . . . . . . . . . . . . . . . . . . . . . . . . . . . . . . 73% 70% 71%
Our single-family serious delinquency rate has decreased each quarter since the first quarter of 2010. Thedecrease in our serious delinquency rate is primarily the result of home retention solutions, foreclosurealternatives and completed foreclosures, as well as our acquisition of loans with stronger credit profiles since thebeginning of 2009, as these loans are now 56% of our single-family guaranty book of business, resulting in asmaller percentage of our loans becoming seriously delinquent.
Although our single-family serious delinquency rate has decreased significantly since the first quarter of 2010,our serious delinquency rate and the period of time that loans remain seriously delinquent have been negativelyaffected in recent periods by the increase in the average number of days it is taking to complete a foreclosure.Continuing issues in the servicer foreclosure process and changing legislative, regulatory and judicialrequirements have lengthened the time it takes to foreclose on a mortgage loan in many states. In addition,servicers and states are dealing with the backlog of foreclosures resulting from these delays and from theelevated level of foreclosures resulting from the housing market downturn. Longer foreclosure timelines result inthese loans remaining in our book of business for a longer time, which has caused our serious delinquency rate todecrease more slowly in the last year than it would have if the pace of foreclosures had been faster. We believethe changes in the foreclosure environment will continue to negatively affect our single-family serious
59

delinquency rates, foreclosure timelines and credit-related expenses. We expect serious delinquency rates willcontinue to be affected in the future by home price changes, changes in other macroeconomic conditions, thelength of the foreclosure process, the volume of loan modifications and the extent to which borrowers withmodified loans continue to make timely payments. We expect the number of our single-family loans that areseriously delinquent to remain well above pre-2008 levels for years.
Table 35 displays a comparison, by geographic region and by loans with and without credit enhancement, of theserious delinquency rates as of the dates indicated for single-family conventional loans in our single-familyguaranty book of business. Serious delinquency rates vary by geographic region due to many factors includingregional home prices, unemployment, economic conditions and state foreclosure timelines.
Table 35: Single-Family Serious Delinquency Rates
As of
March 31, 2012 December 31, 2011 March 31, 2011
Percentage ofBook
Outstanding
SeriousDelinquency
Rate
Percentage ofBook
Outstanding
SeriousDelinquency
Rate
Percentage ofBook
Outstanding
SeriousDelinquency
Rate
Single-family conventionaldelinquency rates by geographicregion:(1)
Midwest . . . . . . . . . . . . . . . . . . . . . . 15% 3.39% 15% 3.73% 15% 3.99%
Northeast . . . . . . . . . . . . . . . . . . . . . 19 4.30 19 4.43 19 4.30
Southeast . . . . . . . . . . . . . . . . . . . . . 23 5.36 24 5.68 24 6.08
Southwest . . . . . . . . . . . . . . . . . . . . 16 2.10 15 2.30 15 2.73
West . . . . . . . . . . . . . . . . . . . . . . . . . 27 2.72 27 2.87 27 3.61
Total single-family conventionalloans . . . . . . . . . . . . . . . . . . . . . 100% 3.67% 100% 3.91% 100% 4.27%
Single-family conventional loans:
Credit enhanced . . . . . . . . . . . . . . . . 14% 8.35% 14% 9.10% 15% 10.13%
Non-credit enhanced . . . . . . . . . . . . 86 2.93 86 3.07 85 3.26
Total single-family conventionalloans . . . . . . . . . . . . . . . . . . . . . 100% 3.67% 100% 3.91% 100% 4.27%
(1) See footnote 9 to “Table 33: Risk Characteristics of Single-Family Conventional Business Volume and Guaranty Book ofBusiness” for states included in each geographic region.
While loans across our single-family guaranty book of business have been affected by the weak marketconditions, loans in certain states, certain higher-risk loan categories, such as Alt-A loans and loans with highermark-to-market LTVs, and our 2005 through 2008 loan vintages continue to exhibit higher than averagedelinquency rates and/or account for a disproportionate share of our credit losses. California, Florida, Arizona,Nevada and some states in the Midwest have experienced more significant declines in home prices coupled withunemployment rates that remain high.
Table 36 displays the serious delinquency rates and other financial information for our single-familyconventional loans with some of these higher-risk characteristics as of the dates indicated. The reportedcategories are not mutually exclusive.
60
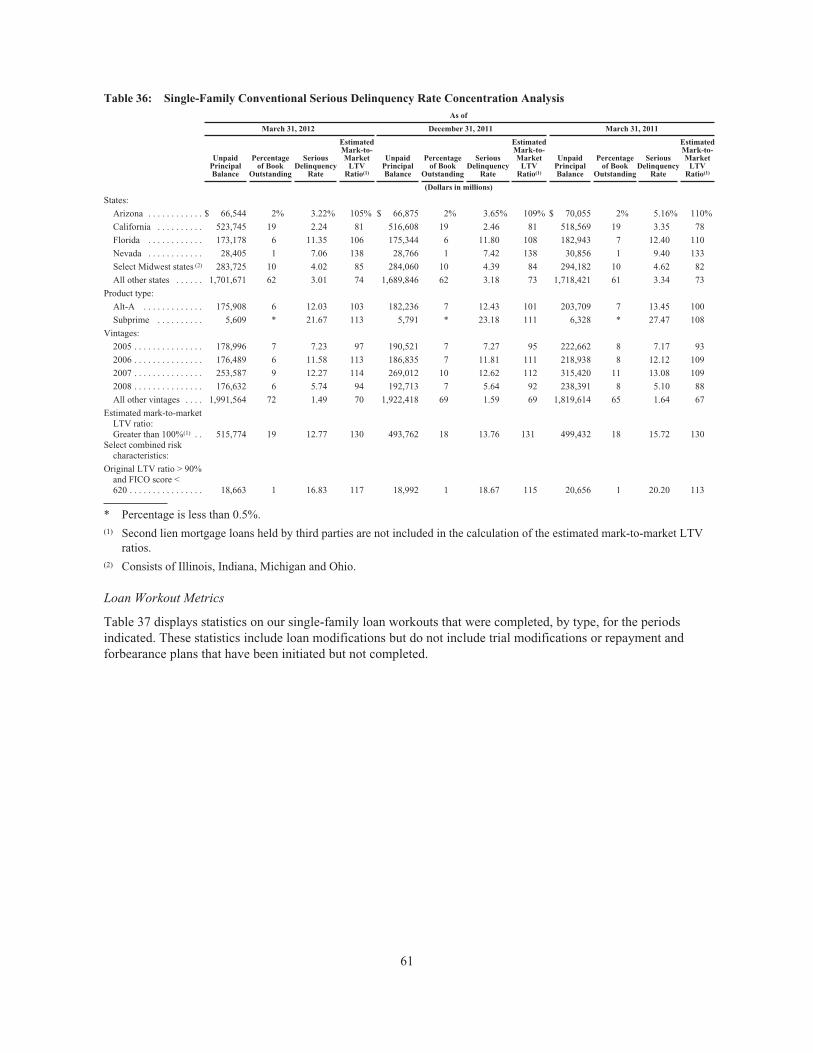
Table 36: Single-Family Conventional Serious Delinquency Rate Concentration AnalysisAs of
March 31, 2012 December 31, 2011 March 31, 2011
UnpaidPrincipalBalance
Percentageof Book
Outstanding
SeriousDelinquency
Rate
EstimatedMark-to-Market
LTVRatio(1)
UnpaidPrincipalBalance
Percentageof Book
Outstanding
SeriousDelinquency
Rate
EstimatedMark-to-Market
LTVRatio(1)
UnpaidPrincipalBalance
Percentageof Book
Outstanding
SeriousDelinquency
Rate
EstimatedMark-to-Market
LTVRatio(1)
(Dollars in millions)
States:
Arizona . . . . . . . . . . . . $ 66,544 2% 3.22% 105% $ 66,875 2% 3.65% 109% $ 70,055 2% 5.16% 110%
California . . . . . . . . . . 523,745 19 2.24 81 516,608 19 2.46 81 518,569 19 3.35 78
Florida . . . . . . . . . . . . 173,178 6 11.35 106 175,344 6 11.80 108 182,943 7 12.40 110
Nevada . . . . . . . . . . . . 28,405 1 7.06 138 28,766 1 7.42 138 30,856 1 9.40 133
Select Midwest states (2) 283,725 10 4.02 85 284,060 10 4.39 84 294,182 10 4.62 82
All other states . . . . . . 1,701,671 62 3.01 74 1,689,846 62 3.18 73 1,718,421 61 3.34 73
Product type:
Alt-A . . . . . . . . . . . . . 175,908 6 12.03 103 182,236 7 12.43 101 203,709 7 13.45 100
Subprime . . . . . . . . . . 5,609 * 21.67 113 5,791 * 23.18 111 6,328 * 27.47 108
Vintages:
2005 . . . . . . . . . . . . . . . 178,996 7 7.23 97 190,521 7 7.27 95 222,662 8 7.17 93
2006 . . . . . . . . . . . . . . . 176,489 6 11.58 113 186,835 7 11.81 111 218,938 8 12.12 109
2007 . . . . . . . . . . . . . . . 253,587 9 12.27 114 269,012 10 12.62 112 315,420 11 13.08 109
2008 . . . . . . . . . . . . . . . 176,632 6 5.74 94 192,713 7 5.64 92 238,391 8 5.10 88
All other vintages . . . . 1,991,564 72 1.49 70 1,922,418 69 1.59 69 1,819,614 65 1.64 67
Estimated mark-to-marketLTV ratio:Greater than 100%(1) . . 515,774 19 12.77 130 493,762 18 13.76 131 499,432 18 15.72 130
Select combined riskcharacteristics:
Original LTV ratio > 90%and FICO score <620 . . . . . . . . . . . . . . . . 18,663 1 16.83 117 18,992 1 18.67 115 20,656 1 20.20 113
* Percentage is less than 0.5%.(1) Second lien mortgage loans held by third parties are not included in the calculation of the estimated mark-to-market LTV
ratios.(2) Consists of Illinois, Indiana, Michigan and Ohio.
Loan Workout Metrics
Table 37 displays statistics on our single-family loan workouts that were completed, by type, for the periodsindicated. These statistics include loan modifications but do not include trial modifications or repayment andforbearance plans that have been initiated but not completed.
61

Table 37: Statistics on Single-Family Loan Workouts
For theThree Months Ended
March 31, 2012
For theThree Months Ended
March 31, 2011
UnpaidPrincipalBalance
Numberof Loans
UnpaidPrincipalBalance
Numberof Loans
(Dollars in millions)
Home retention solutions:
Modifications . . . . . . . . . . . . . . . . . . . . . . . . . . . . . . . . . . . . . . . . . . . . $ 8,881 46,671 $10,668 51,043
Repayment plans and forbearances completed(1) . . . . . . . . . . . . . . . . . 1,292 8,864 1,374 9,916
10,173 55,535 12,042 60,959
Foreclosure alternatives:
Short sales . . . . . . . . . . . . . . . . . . . . . . . . . . . . . . . . . . . . . . . . . . . . . . 4,009 18,614 3,415 15,344
Deeds-in-lieu of foreclosure . . . . . . . . . . . . . . . . . . . . . . . . . . . . . . . . . 613 3,599 318 1,776
4,622 22,213 3,733 17,120
Total loan workouts . . . . . . . . . . . . . . . . . . . . . . . . . . . . . . . . . . . . . . . . . $14,795 77,748 $15,775 78,079
Loan workouts as a percentage of single-family guaranty book ofbusiness(2) . . . . . . . . . . . . . . . . . . . . . . . . . . . . . . . . . . . . . . . . . . . . . . . 2.07% 1.75% 2.18% 1.73%
(1) Repayment plans reflect only those plans associated with loans that were 60 days or more delinquent. Forbearances reflectloans that were 90 days or more delinquent.
(2) Calculated based on annualized loan workouts during the period as a percentage of our single-family guaranty book ofbusiness as of the end of the period.
The volume of home retention solutions completed in the first quarter of 2012 decreased compared with the firstquarter of 2011, primarily due to a decline in the number of seriously delinquent loans in the first quarter of2012, compared with the first quarter of 2011.
During the first quarter of 2012, we initiated approximately 41,100 trial modifications, including HomeAffordable Modification Program (“HAMP”) and non-HAMP, compared with approximately 49,700 trialmodifications during the first quarter of 2011. We also initiated other types of workouts, such as repayment plansand forbearances. It is difficult to predict how many of these trial modifications and initiated plans will becompleted.
HAMP guidance directs servicers either to cancel or to convert trial modifications after three or four monthlypayments, depending on the borrower’s circumstances. As of March 31, 2012, 54% of our HAMP trialmodifications had been converted to permanent HAMP modifications since the inception of the program. Theconversion rate for HAMP modifications since June 1, 2010, when servicers were required to perform a fullverification of a borrower’s eligibility prior to offering a HAMP trial modification, was 85% as of March 31,2012. The average length of a trial period for HAMP modifications initiated after June 1, 2010 was four months.
In addition to our home retention solutions, we continue to focus on alternatives to foreclosure for borrowers whoare unable to retain their homes. The number of foreclosure alternatives we agreed to during the first quarter of2012 remained high as these are favorable solutions for a large number of borrowers. We expect the volume ofour home retention solutions and foreclosure alternatives to remain high throughout the remainder of 2012.
We continue to work with our servicers to implement our home retention and foreclosure prevention initiatives.Our approach to workouts continues to focus on the large number of borrowers facing financial hardships.Accordingly, the vast majority of loan modifications we have completed since 2009 have been concentrated ondeferring or lowering the borrowers’ monthly mortgage payments to allow borrowers to work through theirhardships.
62

Table 38 displays the percentage of our loan modifications completed during the first quarter of 2011, 2010 andthe second half of 2009 that were current or paid off one year after modification, as well as the percentage of ourloan modifications completed during the first quarter of 2010 and the second half of 2009 that were current orpaid off two years after modification. We implemented HAMP in early 2009, and thus did not complete asignificant number of modifications under this program until the third quarter of 2009.
Table 38: Percentage of Loan Modifications That Were Current or Paid Off at One and Two Years Post-Modification(1)
2011 2010 2009
Q1 Q4 Q3 Q2 Q1 Q4 Q3
One Year Post-Modification
HAMP Modifications . . . . . . . . . . . . . . . . . . . . . 77% 74% 74% 74% 76% 73% 71%
Non-HAMP Modifications . . . . . . . . . . . . . . . . 69 67 67 65 55 50 39
Total . . . . . . . . . . . . . . . . . . . . . . . . . . . . . . . . . . 74 69 70 70 65 58 42
Two Years Post-Modification
HAMP Modifications . . . . . . . . . . . . . . . . . . . . . 70% 67% 64%
Non-HAMP Modifications . . . . . . . . . . . . . . . . 52 48 37
Total . . . . . . . . . . . . . . . . . . . . . . . . . . . . . . . . . . 60 55 39
(1) Excludes loans that were classified as subprime ARMs that were modified into fixed rate mortgages and were current atthe time of modification. Modifications included permanent modifications, but do not reflect loans currently in trialmodifications.
We began changing the structure of our non-HAMP modifications in 2010 to lower borrowers' monthly mortgagepayments to a greater extent, which improved the performance of our non-HAMP modifications overall. Inaddition, because post-modification performance was greater for our HAMP modifications than for ournon-HAMP modifications, we began in September 2010 to include trial periods for our non-HAMPmodifications.
There is significant uncertainty regarding the ultimate long term success of our current modification efforts. Webelieve the performance of our workouts will be highly dependent on economic factors, such as unemploymentrates, household wealth and income, and home prices. Modifications, even those with reduced monthlypayments, may also not be sufficient to help borrowers with second liens and other significant non-mortgage debtobligations. FHFA, other agencies of the U.S. government or Congress may ask us to undertake new initiatives tosupport the housing and mortgage markets should our current modification efforts ultimately not perform in amanner that results in the stabilization of these markets. See “Risk Factors” in our 2011 Form 10-K for adiscussion of efforts we may be required or asked to undertake and their potential effect on us.
REO Management
Foreclosure and REO activity affect the amount of credit losses we realize in a given period. Table 39 displaysour foreclosure activity, by region, for the periods indicated. Regional REO acquisition and charge-off trendsgenerally follow a pattern that is similar to, but lags, that of regional delinquency trends.
63

Table 39: Single-Family Foreclosed Properties
For the Three MonthsEnded March 31,
2012 2011
Single-family foreclosed properties (number of properties):Beginning of period inventory of single-family foreclosed properties (REO)(1) . . . . . . . 118,528 162,489
Acquisitions by geographic area:(2)
Midwest . . . . . . . . . . . . . . . . . . . . . . . . . . . . . . . . . . . . . . . . . . . . . . . . . . . . . . . . . . 14,713 11,285Northeast . . . . . . . . . . . . . . . . . . . . . . . . . . . . . . . . . . . . . . . . . . . . . . . . . . . . . . . . . 3,219 2,004Southeast . . . . . . . . . . . . . . . . . . . . . . . . . . . . . . . . . . . . . . . . . . . . . . . . . . . . . . . . . 15,470 10,976Southwest . . . . . . . . . . . . . . . . . . . . . . . . . . . . . . . . . . . . . . . . . . . . . . . . . . . . . . . . . 7,946 13,666West . . . . . . . . . . . . . . . . . . . . . . . . . . . . . . . . . . . . . . . . . . . . . . . . . . . . . . . . . . . . . 6,352 15,618
Total properties acquired through foreclosure(1) . . . . . . . . . . . . . . . . . . . . . . . . . . . . . . 47,700 53,549Dispositions of REO . . . . . . . . . . . . . . . . . . . . . . . . . . . . . . . . . . . . . . . . . . . . . . . . . . . (52,071) (62,814)
End of period inventory of single-family foreclosed properties (REO)(1) . . . . . . . . . . . . 114,157 153,224
Carrying value of single-family foreclosed properties (dollars in millions)(3) . . . . . . . . . $ 9,721 $ 14,086
Single-family foreclosure rate(4) . . . . . . . . . . . . . . . . . . . . . . . . . . . . . . . . . . . . . . . . . . . . 1.07% 1.19%
(1) Includes acquisitions through deeds-in-lieu of foreclosure.(2) See footnote 9 to “Table 33: Risk Characteristics of Single-Family Conventional Business Volume and Guaranty Book of
Business” for states included in each geographic region.(3) Excludes foreclosed property claims receivables, which are reported in our condensed consolidated balance sheets as a
component of “Acquired property, net.”(4) Estimated based on the annualized total number of properties acquired through foreclosure or deeds-in-lieu of foreclosure
as a percentage of the total number of loans in our single-family guaranty book of business as of the end of each respectiveperiod.
The ongoing weak economy, as well as high unemployment rates, continues to result in a high level of mortgageloans that transition from delinquent to REO status, either through foreclosure or deed-in-lieu of foreclosure. Ourforeclosure rates remain high; however, foreclosure levels were lower than they would have been during the firstquarter of 2012 due to delays in the processing of foreclosures caused by continuing foreclosure process issuesencountered by our servicers and changing legislative, regulatory and judicial requirements. The delay inforeclosures, as well as an increase in the number of dispositions of REO properties, has resulted in a decrease inthe inventory of foreclosed properties since December 31, 2010.
We continue to manage our REO inventory to minimize costs and maximize sales proceeds. However, as we areunable to market and sell a higher portion of our inventory, the pace at which we can dispose of our propertiesslows, resulting in higher foreclosed property expenses related to costs associated with ensuring that the propertyis vacant and costs of maintaining the property.
Table 40 displays the current status of our single-family foreclosed property inventory, including the percentageof our inventory that we are unable to market, as of the dates indicated.
64

Table 40: Single-Family Foreclosed Property Status
Percent of Single-FamilyForeclosed Properties
As of
March 31, 2012 December 31, 2011
Available-for-sale . . . . . . . . . . . . . . . . . . . . . . . . . . . . . . . . . . . . . . . . . . . . . . . . 22% 28%Offer accepted(1) . . . . . . . . . . . . . . . . . . . . . . . . . . . . . . . . . . . . . . . . . . . . . . . . . . 20 17Appraisal stage(2) . . . . . . . . . . . . . . . . . . . . . . . . . . . . . . . . . . . . . . . . . . . . . . . . . 10 8Unable to market:
Redemption status(3) . . . . . . . . . . . . . . . . . . . . . . . . . . . . . . . . . . . . . . . . . . . . . 13 12Occupied status(4) . . . . . . . . . . . . . . . . . . . . . . . . . . . . . . . . . . . . . . . . . . . . . . . 14 15Rental property(5) . . . . . . . . . . . . . . . . . . . . . . . . . . . . . . . . . . . . . . . . . . . . . . . 8 7Properties being repaired . . . . . . . . . . . . . . . . . . . . . . . . . . . . . . . . . . . . . . . . . 5 6Other . . . . . . . . . . . . . . . . . . . . . . . . . . . . . . . . . . . . . . . . . . . . . . . . . . . . . . . . 8 7
Total unable to market . . . . . . . . . . . . . . . . . . . . . . . . . . . . . . . . . . . . . . . . . . . . 48 47
Total . . . . . . . . . . . . . . . . . . . . . . . . . . . . . . . . . . . . . . . . . . . . . . . . . . . . . . . . . . 100% 100%
(1) Properties for which an offer has been accepted, but the property has not yet been sold.(2) Properties that are pending appraisals and being prepared to be listed for sale.(3) Properties that are within the period during which state laws allows the former mortgagor and second lien holders to
redeem the property.(4) Properties that are still occupied, and for which the eviction process is not yet complete.(5) Properties with a tenant living in the home under our Tenant in Place or Deed for Lease programs.
In February 2012, FHFA announced the pilot of an REO initiative that will allow qualified investors to purchasepools of foreclosed properties from us with the requirement to rent the purchased properties for a specifiednumber of years. The pilot will involve the sale of pools of various types of assets including rental properties,vacant properties and nonperforming loans with a focus on the hardest-hit areas. The first pilot transaction willinvolve the sale of approximately 2,500 properties located in eight geographic areas, including Atlanta, Chicago,Las Vegas, Los Angeles, Phoenix, and parts of Florida. We do not yet know whether this initiative will have amaterial impact on our future REO sales and REO inventory levels.
Multifamily Mortgage Credit Risk Management
The credit risk profile of our multifamily mortgage credit book of business is influenced by the structure of thefinancing, the type and location of the property, the condition and value of the property, the financial strength ofthe borrower and lender, market and sub-market trends and growth, and the current and anticipated cash flowsfrom the property. These and other factors affect both the amount of expected credit loss on a given loan and thesensitivity of that loss to changes in the economic environment. We provide information on our credit-relatedexpenses and credit losses in “Business Segment Results—Multifamily Business Results.”
Multifamily Acquisition Policy and Underwriting Standards
Our Multifamily business, together with our Enterprise Risk Management division, which provides independentrisk oversight of the Multifamily business, is responsible for pricing and managing the credit risk on multifamilymortgage loans we purchase and on Fannie Mae MBS backed by multifamily loans (whether held in our portfolioor held by third parties). Our primary multifamily delivery channel is the Delegated Underwriting and Servicing,or DUS®, program, which is comprised of multiple lenders that span the spectrum from large financialinstitutions to smaller independent multifamily lenders. Multifamily loans that we purchase or that back FannieMae MBS are either underwritten by a Fannie Mae-approved lender or subject to our underwriting review priorto closing, depending on the product type and/or loan size. Loans delivered to us by DUS lenders and their
65

affiliates represented 86% of our multifamily guaranty book of business as of March 31, 2012 and December 31,2011.
We use various types of credit enhancement arrangements for our multifamily loans, including lender risk-sharing, lender repurchase agreements, pool insurance, subordinated participations in mortgage loans orstructured pools, cash and letter of credit collateral agreements, and cross-collateralization/cross-defaultprovisions. The most prevalent form of credit enhancement on multifamily loans is lender risk-sharing. Lendersin the DUS program typically share in loan-level credit losses in one of two ways: (1) they bear losses up to thefirst 5% of unpaid principal balance of the loan and share in remaining losses up to a prescribed limit; or (2) theyshare up to one-third of the credit losses on an equal basis with us. Non-DUS lenders typically share or absorbcredit losses based on a negotiated percentage of the loan or the pool balance.
Table 41 displays the percentage of the unpaid principal balance of loans in our multifamily guaranty book ofbusiness with lender risk-sharing and with no recourse to the lender as of the dates indicated.
Table 41: Multifamily Lender Risk-Sharing
As of
March 31,2012
December 31,2011
Lender risk-sharing
DUS . . . . . . . . . . . . . . . . . . . . . . . . . . . . . . . . . . . . . . . . . . . . . . . . . . . . . . . . . . . . . . . . 69% 68%
Non-DUS negotiated . . . . . . . . . . . . . . . . . . . . . . . . . . . . . . . . . . . . . . . . . . . . . . . . . . . 10 11
No recourse to the lender . . . . . . . . . . . . . . . . . . . . . . . . . . . . . . . . . . . . . . . . . . . . . . . . . . 21 21
At the time of our purchase or guarantee of multifamily mortgage loans, we and our lenders rely significantly onsound underwriting standards, which often include third-party appraisals and cash flow analysis. Our standardsfor multifamily loans specify maximum original LTV and minimum original debt service coverage ratio(“DSCR”) values that vary based on loan characteristics. Our experience has been that original LTV and DSCRvalues have been reliable indicators of future credit performance.
Table 42 displays original LTV and DSCR metrics for our multifamily guaranty book of business as of the datesindicated.
Table 42: Multifamily Guaranty Book of Business Key Risk Characteristics
As of
March 31,2012
December 31,2011
March 31,2011
Weighted average original LTV . . . . . . . . . . . . . . . . . . . . . . . . . . . . . . . . . . . 66% 66% 66%
Original LTV greater than 80% . . . . . . . . . . . . . . . . . . . . . . . . . . . . . . . . . . . . 4 5 5
Original DSCR less than or equal to 1.10 . . . . . . . . . . . . . . . . . . . . . . . . . . . . 8 8 9
Multifamily Portfolio Diversification and Monitoring
Diversification within our multifamily mortgage credit book of business by geographic concentration,term-to-maturity, interest rate structure, borrower concentration, and credit enhancement coverage is animportant factor that influences credit performance and helps reduce our credit risk.
We and our lenders monitor the performance and risk concentrations of our multifamily loans and the underlyingproperties on an ongoing basis throughout the life of the loan; at the loan, property, and portfolio level. Wemonitor loans with an estimated current DSCR below 1.0, as that is an indicator of heightened default risk. Thepercentage of loans in our multifamily guaranty book of business with a current DSCR ratio less than 1.0 wasapproximately 7% as of March 31, 2012 and December 31, 2011.
66

Problem Loan Management and Foreclosure Prevention
The number of multifamily loans at risk of becoming seriously delinquent has continued to decrease in the firstquarter of 2012, as early-stage delinquencies have decreased. Since delinquency rates are a lagging indicator, weexpect to continue to incur additional credit losses. We periodically refine our underwriting standards in responseto market conditions and enact proactive portfolio management and monitoring which are each designed to keepcredit losses to a low level relative to our multifamily guaranty book of business.
Problem Loan Statistics
We classify multifamily loans as seriously delinquent when payment is 60 days or more past due. We include theunpaid principal balance of multifamily loans that we own or that back Fannie Mae MBS and any housing bondsfor which we provide credit enhancement in the calculation of the multifamily serious delinquency rate.
Table 43 displays a comparison of our multifamily serious delinquency rates for loans acquired through DUSlenders versus loans acquired through non-DUS lenders and the percentage of total multifamily credit losses theyrepresent.
Table 43: Multifamily Concentration Analysis
As of
Percentage ofMultifamily
Credit LossesFor the
Three MonthsEnded
March 31,
March 31, 2012 December 31, 2011 March 31, 2011
Percentageof Book
Outstanding
SeriousDelinquency
Rate
Percentageof Book
Outstanding
SeriousDelinquency
Rate
Percentageof Book
Outstanding
SeriousDelinquency
Rate 2012 2011
DUS small balance loans(1) . . . . . . . . . . 8% 0.42% 8% 0.45% 8% 0.68% 4% 8%DUS non small balance loans(2) . . . . . . 73 0.25 72 0.51 70 0.48 88 70Non-DUS small balance loans(1) . . . . . . 8 1.22 9 1.38 10 1.41 8 15Non-DUS non small balance loans(2) . . 11 0.55 11 0.57 12 0.88 — 7
Total multifamily loans . . . . . . . . . . 100 0.37 100 0.59 100 0.64 100 100
(1) Loans with original unpaid principal balances up to $3 million as well as loans in high cost markets with original unpaidprincipal balances up to $5 million.
(2) Loans with original unpaid principal balances greater than $3 million as well as loans in high cost markets with originalunpaid principal balances greater than $5 million.
The multifamily serious delinquency rate decreased as of March 31, 2012 compared with December 31, 2011 asnational multifamily market fundamentals continued to improve. The DUS loans in our guaranty book ofbusiness have lower delinquency rates when compared with the non-DUS loans in our guaranty book primarilydue to the DUS model, which has several features that more closely align our interests with those of the lenders.Small balance non-DUS loans continue to represent a disproportionately large share of delinquencies, but theyare generally covered by loss sharing arrangements that limit the credit losses we incur.
Multifamily loans with an original balance of up to $3 million nationwide or $5 million in high cost markets,which we refer to as small balance loans, acquired through non-DUS lenders continue to exhibit higherdelinquencies than small balance loans acquired through DUS lenders. These small balance non-DUS loansaccount for 27% of our multifamily serious delinquencies and 8% of our multifamily guaranty book of businessas of March 31, 2012 compared with 20% of our multifamily serious delinquencies and 9% of our multifamilyguaranty book of business as of December 31, 2011. These small balance non-DUS loan acquisitions were mostcommon in 2007 and 2008 and have not been a significant portion of our total multifamily acquisitions since2008. Although our 2007 and early 2008 acquisitions were underwritten to our then-current credit standards andrequired borrower cash equity, they were acquired near the peak of multifamily housing values. During thesecond half of 2008, our underwriting standards were adjusted to reflect the evolving market trends at that time.
67

In addition, Florida, Nevada, and Ohio have a disproportionately high share of seriously delinquent loanscompared with their share of the multifamily guaranty book of business as a result of slow economic recovery incertain areas of these states. These states accounted for 36% of multifamily serious delinquencies but only 8% ofthe multifamily guaranty book of business as of March 31, 2012.
REO Management
Foreclosure and REO activity affect the level of our credit losses. Table 44 displays our held for sale multifamilyREO activity for the periods indicated.
Table 44: Multifamily Foreclosed Properties
For the ThreeMonthsEnded
March 31,
2012 2011
Multifamily foreclosed properties (number of properties):
Beginning of period inventory of multifamily foreclosed properties (REO) . . . . . . . . . . . . . . . . . . . 260 222
Total properties acquired through foreclosure . . . . . . . . . . . . . . . . . . . . . . . . . . . . . . . . . . . . . . . . 61 50
Disposition of REO . . . . . . . . . . . . . . . . . . . . . . . . . . . . . . . . . . . . . . . . . . . . . . . . . . . . . . . . . . . . (58) (37)
End of period inventory of multifamily foreclosed properties (REO) . . . . . . . . . . . . . . . . . . . . . . . . 263 235
Carrying value of multifamily foreclosed properties (dollars in millions)(1) . . . . . . . . . . . . . . . . . . . $646 $576
(1) Excludes DUS lender risk-sharing receivables, which are reported in our condensed consolidated balance sheets as acomponent of “Acquired property, net.”
The increase in our multifamily foreclosed property inventory reflects the continuing stress on our multifamilyguaranty book of business as certain local markets and properties continue to exhibit weak fundamentals, thoughnational multifamily market fundamentals continued to improve in the first quarter of 2012.
Institutional Counterparty Credit Risk Management
We rely on our institutional counterparties to provide services and credit enhancements, including primary andpool mortgage insurance coverage, risk sharing agreements with lenders and financial guaranty contracts that arecritical to our business. Institutional counterparty credit risk is the risk that these institutional counterparties mayfail to fulfill their contractual obligations to us, including seller/servicers who are obligated to repurchase loansfrom us or reimburse us for losses in certain circumstances. Defaults by a counterparty with significantobligations to us could result in significant financial losses to us.
See “MD&A—Risk Management—Credit Risk Management—Institutional Counterparty Credit RiskManagement” in our 2011 Form 10-K for additional information about our institutional counterparties, includingcounterparty risk we face from mortgage originators and investors, from debt security and mortgage dealers, andfrom document custodians.
Mortgage Seller/Servicers
Our primary exposures to institutional counterparty risk are with mortgage seller/servicers that service the loanswe hold in our mortgage portfolio or that back our Fannie Mae MBS, as well as seller/servicers that are obligatedto repurchase loans from us or reimburse us for losses in certain circumstances. We rely on mortgage seller/servicers to meet our servicing standards and fulfill their servicing and repurchase obligations.
68

Our business with our mortgage seller/servicers is concentrated. Our ten largest single-family mortgage servicers,including their affiliates, serviced 74% of our single-family guaranty book of business as of March 31, 2012,compared to 75% as of December 31, 2011. Our largest mortgage servicer is Bank of America, N.A. which,together with its affiliates, serviced approximately 20% of our single-family guaranty book of business as ofMarch 31, 2012, compared with 21% as of December 31, 2011. In addition, we had two other mortgageservicers, JPMorgan Chase Bank, N.A. and Wells Fargo Bank, N.A., that, with their affiliates, each serviced over10% of our single-family guaranty book of business as of March 31, 2012 and December 31, 2011. In addition,Wells Fargo Bank serviced over 10% of our multifamily guaranty book of business as of March 31, 2012 andDecember 31, 2011. Although our business with our mortgage seller/servicers is concentrated, a number of ourlargest mortgage seller/servicer counterparties have recently reduced or eliminated their purchases of mortgageloans from mortgage brokers and correspondent lenders. As a result, we are acquiring an increasing portion ofour business volume directly from smaller financial institutions and some of our servicing volume is shifting tosmaller or non-traditional servicers that may not have the same financial strength or operational capacity as ourlargest servicers. See “Risk Factors” for a description of the risks to our business associated with a decrease inthe concentration of our business with large institutions.
Because we delegate the servicing of our mortgage loans to mortgage servicers and do not have our ownservicing function, servicers’ lack of appropriate process controls or the loss of business from a significantmortgage servicer counterparty could pose significant risks to our ability to conduct our business effectively.Many of our largest servicer counterparties continue to reevaluate the effectiveness of their processcontrols. Many servicers are also subject to consent orders by their regulators that require the servicers to correctforeclosure process deficiencies and improve their servicing and foreclosure practices. This has resulted inextended foreclosure timelines and, therefore, additional holding costs for us, such as property taxes andinsurance, repairs and maintenance, and valuation adjustments due to home price changes. See “ExecutiveSummary” in our 2011 Form 10-K for a discussion of managing foreclosure timelines.
Our mortgage seller/servicers are obligated to repurchase loans or foreclosed properties, or reimburse us forlosses if the foreclosed property has been sold, under certain circumstances, such as if it is determined that themortgage loan did not meet our underwriting or eligibility requirements, if loan representations and warrantiesare violated or if mortgage insurers rescind coverage. We refer to our demands that seller/servicers meet theseobligations collectively as “repurchase requests.” The number of our repurchase requests remained high duringthe first quarter of 2012, and we expect that the amount of our outstanding repurchase requests will remain high.As the volume of repurchase requests increases, so does the risk that affected seller/servicers will not meet theterms of their repurchase obligations, and we may be unable to recover on all outstanding loan repurchaseobligations resulting from seller/servicers’ breaches of contractual obligations. Failure by a significant seller/servicer counterparty, or a number of seller/servicers, to fulfill repurchase obligations to us could result in asignificant increase in our credit losses and have a material adverse effect on our results of operations andfinancial condition. In addition, actions we take to pursue our contractual remedies could increase our costs,reduce our revenues, or otherwise have a material adverse effect on our results of operations or financialcondition. We estimate our allowance for loan losses assuming the benefit of repurchase demands only fromthose counterparties we determine have the financial capacity to fulfill this obligation. Accordingly, as ofMarch 31, 2012, in estimating our allowance for loan losses we assumed no benefit from repurchase demandsdue to us from seller/servicers that lacked the financial capacity to honor their contractual obligations.
Table 45 displays repurchase request activity, measured by unpaid principal balance, during the three monthsended March 31, 2012 and 2011. The dollar amounts of our outstanding repurchase requests provided below arebased on the unpaid principal balance of the loans underlying the repurchase request issued, not the actualamount we have requested from the lenders. In some cases, we allow lenders to remit payment equal to our loss,including imputed interest, on the loan after we have disposed of the REO, which is less than the unpaid principalbalance of the loan. As a result, we expect our actual cash receipts relating to these outstanding repurchaserequests to be significantly lower than the unpaid principal balance of the loan. Amounts relating to repurchaserequests originating from missing documentation or loan files are excluded from the total requests outstandinguntil the completion of a full underwriting review, once the documents and loan files are received.
69

Table 45: Repurchase Request Activity
For the Three Months Ended March 31,
2012 2011
(Dollars in millions)
Beginning outstanding repurchase requests . . . . . . . . . . . . . . . . . . . . . . . . . . . $10,400 $ 5,007Issuances . . . . . . . . . . . . . . . . . . . . . . . . . . . . . . . . . . . . . . . . . . . . . . . . . . . . . 6,556 6,350
Collections . . . . . . . . . . . . . . . . . . . . . . . . . . . . . . . . . . . . . . . . . . . . . . . . . . (2,361) (1,595)Other resolutions(1) . . . . . . . . . . . . . . . . . . . . . . . . . . . . . . . . . . . . . . . . . . . . (2,105) (886)
Total successfully resolved . . . . . . . . . . . . . . . . . . . . . . . . . . . . . . . . . . . . . . . (4,466) (2,481)
Cancellations . . . . . . . . . . . . . . . . . . . . . . . . . . . . . . . . . . . . . . . . . . . . . . . . . . (337) (227)
Ending outstanding repurchase requests . . . . . . . . . . . . . . . . . . . . . . . . . . . . . $12,153 $ 8,649
(1) Includes repurchase requests that were successfully resolved through reimbursement of losses or other remedies such as,but not limited to, loan pricing adjustments, indemnification or future repurchase agreements, lender corrective action, ornegotiated settlements.
Table 46 displays our top five mortgage seller/servicers by outstanding repurchase requests based on the unpaidprincipal balance of the loans underlying repurchase requests issued as of March 31, 2012 and December 31,2011. Table 46 also displays the mortgage seller/servicers balance and percentage of our repurchase requests thatwere over 120 days outstanding, and the seller/servicers’ repurchase requests outstanding over 120 days as apercentage of total repurchase requests outstanding over 120 days, as of March 31, 2012 and December 31, 2011.
Table 46: Outstanding Repurchase Requests(1)
Outstanding Repurchase Requests as of
March 31, 2012 December 31, 2011
TotalOutstandingBalance(3)
Over 120 Days(2) TotalOutstanding
Balance(3)
Over 120 Days(2)
Balance(3) % % of Total Balance(3) % % of Total
(Dollars in millions)
Mortgage Seller/ServicerCounterparty:Bank of America, N.A. . . . . . . . . $ 7,057 $3,039 43% 71% $ 5,449 $1,841 34% 59%JPMorgan Chase Bank, N.A. . . . 1,251 187 15 4 1,136 197 17 6CitiMortgage(4) . . . . . . . . . . . . . . 955 249 26 6 917 226 25 7Wells Fargo Bank, N.A.(4) . . . . . 797 231 29 5 830 259 31 8SunTrust Bank, Inc.(4) . . . . . . . . . 380 75 20 2 430 40 9 1Other(5) . . . . . . . . . . . . . . . . . . . . 1,713 478 28 12 1,638 576 35 19
Total . . . . . . . . . . . . . . . . . . . . . . $12,153 $4,259 100% $10,400 $3,139 100%
(1) Amounts relating to repurchase requests originating from missing documentation or loan files are excluded from theoutstanding repurchase requests until the completion of a full underwriting review.
(2) Measured from either the original repurchase request date or, for lenders remitting after the property is disposed, the dateof our final loss determination.
(3) Based on the unpaid principal balance of the loans underlying the repurchase request issued. In some cases, lenders remitpayment equal to our loss on sale of the loan as REO, which includes imputed interest, and is significantly lower than theunpaid principal balance of the loan. Also includes repurchase requests resulting from the rescission of mortgageinsurance coverage.
(4) Seller/servicer has entered into a plan with us to resolve certain outstanding repurchase requests and/or has postedcollateral to us.
(5) Includes some seller/servicers that have entered into a plan with us to resolve outstanding repurchase requests and/or haveposted collateral to us.
70

We continue to aggressively pursue our contractual rights associated with outstanding repurchase requests.Failure by a seller/servicer to repurchase a loan or to otherwise make us whole for our losses may result in theimposition of certain sanctions including, but not limited to:
• requiring the posting of collateral,
• denying transfer of servicing requests or denying pledged servicing requests,
• modifying or suspending any contract or agreement with a lender, or
• suspending or terminating a lender or imposing some other formal sanction on a lender.
If we are unable to resolve these matters to our satisfaction, we may seek additional remedies. If we are unable toresolve our repurchase requests, either through collection or additional remedies, we will not recover the losseswe have recognized from the associated loans.
Since the fourth quarter of 2011, Bank of America, the seller/servicer with which we have the most repurchaserequests outstanding, slowed the pace of its repurchases. As a result of Bank of America’s failure to honor itscontractual obligations in a timely manner, the already high volume of our outstanding repurchase requests withBank of America increased substantially. Measured by unpaid principal balance, Bank of America accounted forapproximately 58% of our total outstanding repurchase requests as of March 31, 2012, compared with 52% as ofDecember 31, 2011 and 41% as of December 31, 2010. Similarly, Bank of America accounted for 71% of ourrepurchase requests that had been outstanding for more than 120 days as of March 31, 2012, compared with 59%as of December 31, 2011 and 37% as of December 31, 2010. We are taking steps to address Bank of America’sdelays in honoring our repurchase requests. For example, we did not renew our existing loan delivery contractwith Bank of America at the end of January 2012, which significantly restricts the types of loans it can deliver tous. Bank of America, however, can continue delivering loans to us under our Refi Plus initiative, includingHARP loans. Bank of America’s failure to honor repurchase obligations in a timely manner has not caused us tochange our estimate of the amounts we expect to collect from them ultimately, and we continue to work withBank of America to resolve these issues. If we collect less than the amount we expect from Bank of America, wemay be required to seek additional funds from Treasury under our senior preferred stock purchase agreement.Table 46 above displays our top five mortgage seller/servicers by outstanding repurchase requests based on theunpaid principal balance of the loans underlying repurchase requests issued as of March 31, 2012. We do notexpect the change in our loan delivery agreement with Bank of America to be material to our business or resultsof operations as Bank of America represented less than 5% of our loan delivery volume in the quarter endedDecember 31, 2011.
We are also exposed to the risk that a mortgage seller/servicer or another party involved in a mortgage loantransaction will engage in mortgage fraud by misrepresenting the facts about the loan. We have experiencedfinancial losses in the past and may experience significant financial losses and reputational damage in the futureas a result of mortgage fraud. See “Risk Factors” in our 2011 Form 10-K for additional discussion on risks ofmortgage fraud to which we are exposed.
Mortgage Insurers
We use several types of credit enhancement to manage our single-family mortgage credit risk, including primaryand pool mortgage insurance coverage. Table 47 displays our maximum potential loss recovery for the primaryand pool mortgage insurance coverage on single-family loans in our guaranty book of business and our unpaidprincipal balance covered by insurance for our mortgage insurer counterparties as of March 31, 2012 andDecember 31, 2011. The table includes our top nine mortgage insurer counterparties, which provided over 99%of our total mortgage insurance coverage on single-family loans in our guaranty book of business as of March 31,2012 and December 31, 2011. See “Risk Management—Credit Risk Management—Institutional CounterpartyRisk Management—Mortgage Insurers” in our 2011 Form 10-K for a discussion on the credit ratings of ourmortgage insurers.
71

Table 47: Mortgage Insurance Coverage
Maximum Coverage(1)Unpaid Principal BalanceCovered By Insurance(2)
As of March 31, 2012 As ofDecember 31,
2011
As ofMarch 31,
2012
As ofDecember 31,
2011Counterparty:(3) Primary Pool Total
(Dollars in millions)
Mortgage Guaranty Insurance Corporation . . . . . . $19,736 $1,555 $21,291 $21,479 $ 87,833 $ 89,872Radian Guaranty, Inc. . . . . . . . . . . . . . . . . . . . . . . 15,660 333 15,993 15,505 65,630 63,534United Guaranty Residential Insurance Company . . . 14,936 129 15,065 14,579 61,199 59,233Genworth Mortgage Insurance Corporation . . . . . 13,540 58 13,598 13,628 54,822 54,893PMI Mortgage Insurance Co. . . . . . . . . . . . . . . . . . 10,374 238 10,612 11,128 45,428 47,734Republic Mortgage Insurance Company . . . . . . . . 7,923 872 8,795 9,219 37,108 39,130Triad Guaranty Insurance Corporation . . . . . . . . . 2,390 637 3,027 3,150 11,924 12,400CMG Mortgage Insurance Company(4) . . . . . . . . . 1,968 — 1,968 1,951 8,314 8,241Essent Guaranty, Inc. . . . . . . . . . . . . . . . . . . . . . . . 601 — 601 395 2,556 1,685Others . . . . . . . . . . . . . . . . . . . . . . . . . . . . . . . . . . . 217 — 217 217 1,222 1,214
Total . . . . . . . . . . . . . . . . . . . . . . . . . . . . . . . . . . . . $87,345 $3,822 $91,167 $91,251 $376,036 $377,936
Total as a percentage of single-family guarantybook of business . . . . . . . . . . . . . . . . . . . . . . . . . 3% 3% 13% 13%
(1) Maximum coverage refers to the aggregate dollar amount of insurance coverage (that is, “risk in force”) on single-familyloans in our guaranty book of business and represents our maximum potential loss recovery under the applicable mortgageinsurance policies.
(2) Represents the unpaid principal balance of single-family loans in our guaranty book of business covered under theapplicable mortgage insurance policies (that is, “insurance in force”).
(3) Insurance coverage amounts provided for each counterparty may include coverage provided by consolidated affiliates andsubsidiaries of the counterparty.
(4) CMG Mortgage Insurance Company is a joint venture owned by PMI Mortgage Insurance Co. and CUNA MutualInsurance Society.
As of May 9, 2012, one of our mortgage insurance counterparties, PMI Mortgage Insurance Co. (“PMI”), haspublicly disclosed that it is now in receivership. Three of our mortgage insurance counterparties—TriadGuaranty Insurance Corporation (“Triad”), Republic Mortgage Insurance Company (“RMIC”), and PMI—havepublicly disclosed that they are in run-off. A mortgage insurer that is in run-off continues to collect premiumsand pay claims on its existing insurance business, but no longer writes new insurance. One mortgage insurer,Genworth Mortgage Insurance Corporation (“Genworth”), is currently operating pursuant to a waiver it receivedfrom its regulator of the state regulatory capital requirements applicable to its main insurance writing entity. Anadditional two of our mortgage insurers—Mortgage Guaranty Insurance Corporation (“MGIC”) and RadianGuaranty, Inc. (“Radian”)—have disclosed that, in the absence of additional capital contributions to theirinsurance writing entity, their capital might fall below state regulatory capital requirements in the future. In April2012, Radian announced that it had entered into a reinsurance agreement with an external reinsurance provider toproactively manage its mortgage insurance risk-to-capital position. These six mortgage insurers provided acombined $73.3 billion, or 80%, of our risk in force mortgage insurance coverage of our single-family guarantybook of business as of March 31, 2012.
We are unable to determine how long our mortgage insurer counterparties that are operating under a waiver willcontinue to operate under a waiver, or that are currently below their state-imposed risk-to-capital limits willremain below these limits. If these mortgage insurers are not able to raise capital and they exceed their
72

risk-to-capital limits, they will likely be forced into run-off or receivership unless they can secure and maintain awaiver from their state regulator. This would increase the risk that these mortgage insurers will fail to pay ourclaims under insurance policies, and could also cause the quality and speed of their claims processing todeteriorate.
The weak financial condition of many of our mortgage insurer counterparties increases the significant risk thatthese counterparties will fail to fulfill their obligations to pay our claims under insurance policies. If wedetermine that it is probable that we will not collect all of our claims from one or more of these mortgage insurercounterparties, it could result in an increase in our loss reserves, which could adversely affect our earnings,liquidity, financial condition and net worth.
We evaluate each of our mortgage insurer counterparties individually to determine whether or under whatconditions it will remain eligible to insure new mortgages sold to us. Based on our evaluation, we may imposeadditional terms and conditions of approval on some of our mortgage insurers, including: limiting the volumeand types of loans they may insure for us; requiring them to obtain our consent prior to entering into risk sharingarrangements with mortgage lenders; requiring them to meet certain financial conditions, such as maintaining aminimum level of policyholders’ surplus, a maximum risk-to-capital ratio, a maximum combined ratio, or aminimum amount of acceptable liquid assets; or requiring that they secure parental or other capital supportagreements.
The claims obligations of RMIC, PMI and Triad have been partially deferred pursuant to orders from their stateregulators. State regulators could take additional corrective actions against RMIC and Triad, including placingthem into receivership. While our remaining mortgage insurers have continued to pay claims owed to us in full,there can be no assurance that they will continue to do so given their current financial condition.
Some mortgage insurers have explored corporate restructurings designed to provide relief from risk-to-capitallimits in certain states. We have approved several restructurings so that certain of our mortgage insurercounterparties or their subsidiaries could continue to write new business. Additionally, mortgage insurerscontinue to approach us with various proposed corporate restructurings that would require our approval ofaffiliated mortgage insurance writing entities.
The number of mortgage loans for which our mortgage insurer counterparties have rescinded coverage decreasedbut remained high in the first quarter of 2012. In those cases where the mortgage insurer has rescinded coverage,we require the seller/servicer to repurchase the loan or indemnify us against loss. The table below displayscumulative rescission rates as of March 31, 2012, by the period in which the claim was filed. We do not presentinformation for claims filed in the most recent two quarters to allow sufficient time for a substantial percentageof the claims filed to be resolved.
Table 48: Rescission Rates of Mortgage Insurance Claims
As of March 31, 2012
Cumulative RescissionRate(1)
Cumulative ClaimsResolution Percentage(2)
Primary mortgage insurance claims filed in:2010 . . . . . . . . . . . . . . . . . . . . . . . . . . . . . . . . . . . . . . . . . . . . . . . . . 11% 90 %First nine months of 2011 . . . . . . . . . . . . . . . . . . . . . . . . . . . . . . . . 8 65
Pool mortgage insurance claims filed in:2010 . . . . . . . . . . . . . . . . . . . . . . . . . . . . . . . . . . . . . . . . . . . . . . . . . 14% 99%First nine months of 2011 . . . . . . . . . . . . . . . . . . . . . . . . . . . . . . . . 10 91
(1) Represents claims filed during the period that have been rescinded as of March 31, 2012, divided by total claims filedduring the same period. Denied claims are excluded.
(2) Represents claims filed during the period that have been resolved as of March 31, 2012, divided by the total claims filedduring the same period. Claims resolved mainly consist of claims for which we have settled and claims for whichcoverage has been rescinded by the mortgage insurer.
73

When we estimate the credit losses that are inherent in our mortgage loan portfolio and under the terms of ourguaranty obligations, we also consider the recoveries that we will receive on primary mortgage insurance, asmortgage insurance recoveries would reduce the severity of the loss associated with defaulted loans. We evaluatethe financial condition of our mortgage insurer counterparties and adjust the contractually due recovery amountsto ensure that only probable losses as of the balance sheet date are included in our loss reserve estimate. As aresult, if our assessment of one or more of our mortgage insurer counterparties’ ability to fulfill their respectiveobligations to us worsens, it could result in an increase in our loss reserves.
The following table displays our estimated benefit from mortgage insurer recoveries.
Table 49: Estimated Mortgage Insurance Benefit
As of
March 31, 2012 December 31, 2011
(Dollars in millions)
Contractual mortgage insurance benefit . . . . . . . . . . . . . . . . . . . . . . . . . . . . . . . $15,237 $15,099Less: Collectability adjustment(1) . . . . . . . . . . . . . . . . . . . . . . . . . . . . . . . . . . . . . 2,571 2,867
Estimated benefit included in total loss reserves . . . . . . . . . . . . . . . . . . . . . . . . $12,666 $12,232
(1) Represents an adjustment that reduces the contractual benefit for our assessment of our mortgage insurer counterparties’inability to fully pay the contractual mortgage insurance claims.
When an insured loan held in our mortgage portfolio subsequently goes into foreclosure, we charge off the loan,eliminating any previously-recorded loss reserves, and record REO and a mortgage insurance receivable for theclaim proceeds deemed probable of recovery, as appropriate. However, if a mortgage insurer rescinds insurancecoverage, the initial receivable becomes due from the mortgage seller/servicer. We had outstanding receivablesof $3.7 billion as of March 31, 2012 and $3.6 billion as of December 31, 2011 related to amounts claimed oninsured, defaulted loans that we have not yet received, of which $894 million as of March 31, 2012 and $639million as of December 31, 2011 was due from our mortgage seller/servicers. We assessed the total outstandingreceivables for collectibility, and they were recorded net of a valuation allowance of $786 million as ofMarch 31, 2012 and $570 million as of December 31, 2011 in “Other assets.” These mortgage insurancereceivables are short-term in nature, having an average duration of approximately six months, and the valuationallowance reduces our claim receivable to the amount that we consider probable of collection. We receivedproceeds under our primary and pool mortgage insurance policies for single-family loans of $1.3 billion duringthe first quarter of 2012 compared with $1.6 billion during the first quarter of 2011.
Financial Guarantors
We are the beneficiary of financial guarantees on non-agency securities held in our investment portfolio and onnon-agency securities that have been resecuritized to include a Fannie Mae guaranty and sold to third parties.Table 50 displays the total unpaid principal balance of guaranteed non-agency securities in our portfolio as ofMarch 31, 2012 and December 31, 2011.
Table 50: Unpaid Principal Balance of Financial Guarantees
As of
March 31, 2012 December 31, 2011
(Dollars in millions)Alt-A private-label securities . . . . . . . . . . . . . . . . . . . . . . . . . . . . . . . . . . . . $1,206 $1,279Subprime private-label securities . . . . . . . . . . . . . . . . . . . . . . . . . . . . . . . . . 1,367 1,398Mortgage revenue bonds . . . . . . . . . . . . . . . . . . . . . . . . . . . . . . . . . . . . . . . 4,897 4,931Other mortgage-related securities . . . . . . . . . . . . . . . . . . . . . . . . . . . . . . . . 311 317Non mortgage-related securities . . . . . . . . . . . . . . . . . . . . . . . . . . . . . . . . . — 46
Total . . . . . . . . . . . . . . . . . . . . . . . . . . . . . . . . . . . . . . . . . . . . . . . . . . . . . . . $7,781 $7,971
74

With the exception of Ambac Assurance Corporation (“Ambac”), none of our financial guarantor counterpartieshas failed to repay us for claims under guaranty contracts. Ambac provided coverage on $3.2 billion, or 41%, ofour total non-governmental guarantees, as of March 31, 2012. However, based on the stressed financial conditionof our non-governmental financial guarantor counterparties, we believe that all but one of these counterpartiesmay not be able to fully meet their obligations to us in the future. We model our securities without assuming thebenefit of non-governmental financial guarantees. We then adjust results for those external financial guaranteesfrom guarantors that we determine are creditworthy, although we continue to seek collection of any amounts dueto us from all counterparties. As of March 31, 2012, when modeling our securities for impairments we did notassume the benefit of external financial guarantees from any non-governmental counterparties. See “Note 5,Investments in Securities” for a further discussion of our model methodology and key inputs used to determineother-than-temporary-impairment.
We are also the beneficiary of financial guarantees included in securities issued by Freddie Mac, the federalgovernment and its agencies that totaled $30.3 billion as of March 31, 2012 and $31.4 billion as of December 31,2011.
Lenders with Risk Sharing
We enter into risk sharing agreements with lenders pursuant to which the lenders agree to bear all or someportion of the credit losses on the covered loans. Our maximum potential loss recovery from lenders under theserisk sharing agreements on single-family loans was $12.3 billion as of March 31, 2012 and $12.8 billion as ofDecember 31, 2011. As of March 31, 2012, 59% of our maximum potential loss recovery on single-family loanswas from three lenders and as of December 31, 2011, 58% of our maximum potential loss recovery on single-family loans was from the same three lenders. Our maximum potential loss recovery from lenders under risksharing agreements on DUS and non-DUS multifamily loans was $32.7 billion as of March 31, 2012 and $32.1billion as of December 31, 2011. As of March 31, 2012 and December 31, 2011, 40% of our maximum potentialloss recovery on multifamily loans was from three DUS lenders.
Unfavorable market conditions have adversely affected, and continue to adversely affect, the liquidity andfinancial condition of our lender counterparties. The percentage of single-family recourse obligations to lenderswith investment grade credit ratings (based on the lower of S&P, Moody’s and Fitch ratings) was 46% as ofMarch 31, 2012 and December 31, 2011. The percentage of these recourse obligations to lender counterpartiesrated below investment grade was 26% as of March 31, 2012 and December 31, 2011. The remaining percentageof these recourse obligations were to lender counterparties that were not rated by rating agencies, which was 28%as of March 31, 2012 and December 31, 2011. Given the stressed financial condition of some of our lenders, weexpect in some cases we will recover less, perhaps significantly less, than the amount the lender is obligated toprovide us under our risk sharing arrangement with them. Depending on the financial strength of thecounterparty, we may require a lender to pledge collateral to secure its recourse obligations.
As noted above in “Multifamily Credit Risk Management,” our primary multifamily delivery channel is our DUSprogram, which is comprised of lenders that span the spectrum from large depositories to independent non-bankfinancial institutions. Approximately 42% as of March 31, 2012, and 51% as of December 31, 2011, of theunpaid principal balance of loans in our multifamily guaranty book of business serviced by our DUS lenders wasfrom institutions with an external investment grade credit rating or a guarantee from an affiliate with an externalinvestment grade credit rating. Given the recourse nature of the DUS program, the lenders are bound byeligibility standards that dictate, among other items, minimum capital and liquidity levels, and the posting ofcollateral at a highly rated custodian to secure a portion of the lenders’ future obligations. We actively monitorthe financial condition of these lenders to help ensure the level of risk remains within our standards and to ensurerequired capital levels are maintained and are in alignment with actual and modeled loss projections.
Custodial Depository Institutions
A total of $65.5 billion in deposits for single-family payments were received and held by 284 institutions in themonth of March 2012 and a total of $66.4 billion in deposits for single-family payments were received and heldby 284 institutions in the month of December 2011. Of these total deposits, 93% as of March 31, 2012 and 92%
75

as of December 31, 2011 were held by institutions rated as investment grade by S&P, Moody’s and Fitch. Ourtransactions with custodial depository institutions is concentrated. Our ten largest custodial depositoryinstitutions held 93% of these deposits as of March 31, 2012 and 92% of these deposits as of December 31, 2011.
If a custodial depository institution were to fail while holding remittances of borrower payments of principal andinterest due to us in our custodial account, we would be an unsecured creditor of the depository for balances inexcess of the deposit insurance protection and might not be able to recover all of the principal and interestpayments being held by the depository on our behalf, or there might be a substantial delay in receiving theseamounts. If this were to occur, we would be required to replace these amounts with our own funds to makepayments that are due to Fannie Mae MBS certificateholders. Accordingly, the insolvency of one of our principalcustodial depository counterparties could result in significant financial losses to us. In the month of March 2012,approximately $5.9 billion or 9% of our total deposits for single-family payments received and held by theseinstitutions was in excess of the deposit insurance protection limit compared with approximately $6.1 billion or9% in the month of December 2011. These amounts can vary as they are calculated based on individual paymentsof mortgage borrowers and we must estimate which borrowers are paying their regular principal and interestpayments and other types of payments, such as prepayments from refinancing or sales.
Issuers of Investments Held in our Cash and Other Investments Portfolio
Our cash and other investments portfolio consists of cash and cash equivalents, federal funds sold and securitiespurchased under agreements to resell or similar arrangements, U.S. Treasury securities and asset-backedsecurities. Our cash and other investment counterparties are primarily financial institutions and the FederalReserve Bank. We held no unsecured positions with financial institutions as of March 31, 2012 or December 31,2011. See “Liquidity and Capital Management—Liquidity Management—Cash and Other Investments Portfolio”for more detailed information on our cash and other investments portfolio.
Derivative Counterparty Credit Exposure
Our derivative counterparty credit exposure relates principally to interest rate and foreign currency derivativescontracts. We estimate our exposure to credit loss on derivative instruments by calculating the replacement cost,on a present value basis, to settle at current market prices all outstanding derivative contracts in a net gainposition at the counterparty level where the right of legal offset exists. For derivative instruments where the rightof legal offset does not exist, we calculate the replacement cost of the outstanding derivative contracts in a gainposition at the transaction level. The fair value of derivatives in a gain position is included in our condensedconsolidated balance sheets in “Other assets.” We manage our credit exposure by requiring counterparties to postcollateral, which includes cash, U.S. Treasury securities, agency debt and agency mortgage-related securities.
Our net counterparty credit exposure on derivatives contracts decreased to $59 million as of March 31, 2012,from $96 million as of December 31, 2011. We had outstanding interest rate and foreign currency derivativetransactions with 16 counterparties as of March 31, 2012 and December 31, 2011. Derivatives transactions with10 of our counterparties accounted for approximately 95% of our total outstanding notional amount as ofMarch 31, 2012, with each of these counterparties accounting for between approximately 6% and 16% of thetotal outstanding notional amount. As of March 31, 2012, we had outstanding notional amounts and masternetting agreements with 16 counterparties.
See “Note 9, Derivative Instruments” for information on the outstanding notional amount and additionalinformation on our risk management derivative contracts as of March 31, 2012 and December 31, 2011, as wellas a discussion of our collateral requirements including the impact of decreases in our credit ratings on ourcollateral obligations under our derivatives contracts.
Market Risk Management, Including Interest Rate Risk Management
We are subject to market risk, which includes interest rate risk, spread risk and liquidity risk. These risks arisefrom our mortgage asset investments. Interest rate risk is the risk of loss in value or expected future earnings thatmay result from changes to interest rates. Spread risk is the resulting impact of changes in the spread between our
76

mortgage assets and our debt and derivatives we use to hedge our position. Liquidity risk is the risk that we willnot be able to meet our funding obligations in a timely manner. We describe our sources of interest rate riskexposure and our strategy for managing interest rate risk and spread risk in “MD&A—Risk Management—Market Risk Management, Including Interest Rate Risk Management” in our 2011 Form 10-K.
Measurement of Interest Rate Risk
Below we present two quantitative metrics that provide estimates of our interest rate exposure: (1) fair valuesensitivity of net portfolio to changes in interest rate levels and slope of yield curve; and (2) duration gap. Themetrics presented are calculated using internal models that require standard assumptions regarding interest ratesand future prepayments of principal over the remaining life of our securities. These assumptions are derivedbased on the characteristics of the underlying structure of the securities and historical prepayment ratesexperienced at specified interest rate levels, taking into account current market conditions, the current mortgagerates of our existing outstanding loans, loan age and other factors. On a continuous basis, management makesjudgments about the appropriateness of the risk assessments and will make adjustments as necessary to properlyassess our interest rate exposure and manage our interest rate risk. The methodologies used to calculate riskestimates are periodically changed on a prospective basis to reflect improvements in the underlying estimationprocess.
Interest Rate Sensitivity to Changes in Interest Rate Level and Slope of Yield Curve
As part of our disclosure commitments with FHFA, we disclose on a monthly basis the estimated adverse impacton the fair value of our net portfolio that would result from the following hypothetical situations:
• A 50 basis point shift in interest rates.
• A 25 basis point change in the slope of the yield curve.
In measuring the estimated impact of changes in the level of interest rates, we assume a parallel shift in allmaturities of the U.S. LIBOR interest rate swap curve.
In measuring the estimated impact of changes in the slope of the yield curve, we assume a constant 7-year rateand a shift of 16.7 basis points for the 1-year rate and 8.3 basis points for the 30-year rate. We believe theaforementioned interest rate shocks for our monthly disclosures represent moderate movements in interest ratesover a one-month period.
Duration Gap
Duration gap measures the price sensitivity of our assets and liabilities to changes in interest rates by quantifyingthe difference between the estimated durations of our assets and liabilities. Our duration gap analysis reflects theextent to which the estimated maturity and repricing cash flows for our assets are matched, on average, over timeand across interest rate scenarios to the estimated cash flows of our liabilities. A positive duration gap indicatesthat the duration of our assets exceeds the duration of our liabilities. We disclose duration gap on a monthly basisunder the caption “Interest Rate Risk Disclosures” in our Monthly Summary, which is available on our websiteand announced in a press release.
The sensitivity measures presented in Table 51, which we disclose on a quarterly basis as part of our disclosurecommitments with FHFA, are an extension of our monthly sensitivity measures. There are three primarydifferences between our monthly sensitivity disclosure and the quarterly sensitivity disclosure presented below:(1) the quarterly disclosure is expanded to include the sensitivity results for larger rate level shocks of plus orminus 100 basis points; (2) the monthly disclosure reflects the estimated pre-tax impact on the market value ofour net portfolio calculated based on a daily average, while the quarterly disclosure reflects the estimated pre-taximpact calculated based on the estimated financial position of our net portfolio and the market environment as ofthe last business day of the quarter; and (3) the monthly disclosure shows the most adverse pre-tax impact on themarket value of our net portfolio from the hypothetical interest rate shocks, while the quarterly disclosureincludes the estimated pre-tax impact of both up and down interest rate shocks.
77

In addition, Table 51 also provides the average, minimum, maximum and standard deviation for duration gap andfor the most adverse market value impact on the net portfolio for non-parallel and parallel interest rate shocks forthe three months ended March 31, 2012 and 2011.
Table 51: Interest Rate Sensitivity of Net Portfolio to Changes in Interest Rate Level and Slope of Yield Curve(1)
As of
March 31, 2012 December 31, 2011
(Dollars in billions)Rate level shock:
-100 basis points . . . . . . . . . . . . . . . . . . . . . . . . . . . . . . . . . . . . . . . . . . . . $ 0.5 $ 0.3
-50 basis points . . . . . . . . . . . . . . . . . . . . . . . . . . . . . . . . . . . . . . . . . . . . . 0.1 0.1
+50 basis points . . . . . . . . . . . . . . . . . . . . . . . . . . . . . . . . . . . . . . . . . . . . — (0.1)
+100 basis points . . . . . . . . . . . . . . . . . . . . . . . . . . . . . . . . . . . . . . . . . . . (0.3) (0.4)
Rate slope shock:
-25 basis points (flattening) . . . . . . . . . . . . . . . . . . . . . . . . . . . . . . . . . . . — —
+25 basis points (steepening) . . . . . . . . . . . . . . . . . . . . . . . . . . . . . . . . . . — 0.1
The duration gap for the three months ended March 31, 2012 averaged zero months which is similar to the resultsfor the three months ended March 31, 2011.
For the Three Months Ended March 31, 2012
DurationGap
Rate Slope Shock25 Bps
Rate Level Shock50 Bps
Exposure
(In months) (Dollars in billions)Average . . . . . . . . . . . . . . . . . . . . . . . . . . . . . . . . . . . . . . . . (0.1) $ — $ —Minimum . . . . . . . . . . . . . . . . . . . . . . . . . . . . . . . . . . . . . . . (0.9) — —Maximum . . . . . . . . . . . . . . . . . . . . . . . . . . . . . . . . . . . . . . 0.4 0.1 0.2Standard deviation . . . . . . . . . . . . . . . . . . . . . . . . . . . . . . . . 0.3 — 0.1
For the Three Months Ended March 31, 2011
DurationGap
Rate Slope Shock25 Bps
Rate Level Shock50 Bps
Exposure
(In months) (Dollars in billions)
Average . . . . . . . . . . . . . . . . . . . . . . . . . . . . . . . . . . . . . . . . 0.4 $0.1 $0.2Minimum . . . . . . . . . . . . . . . . . . . . . . . . . . . . . . . . . . . . . . . (0.4) — 0.1Maximum . . . . . . . . . . . . . . . . . . . . . . . . . . . . . . . . . . . . . . 0.8 0.2 0.4Standard deviation . . . . . . . . . . . . . . . . . . . . . . . . . . . . . . . . 0.2 — 0.1
(1) Computed based on changes in LIBOR swap rates.
A majority of the interest rate risk associated with our mortgage-related securities and loans is hedged with ourdebt issuances, which includes callable debt. We use derivatives to help manage the residual interest rate riskexposure between our assets and liabilities. Derivatives have enabled us to keep our interest rate risk exposure atconsistently low levels in a wide range of interest-rate environments. Table 52 displays an example of howderivatives impacted the net market value exposure for a 50 basis point parallel interest rate shock.
78

Table 52: Derivative Impact on Interest Rate Risk (50 Basis Points)
BeforeDerivatives
AfterDerivatives
Effect ofDerivatives
(Dollars in billions)
As of March 31, 2012 . . . . . . . . . . . . . . . . . . . . . . . . . . . . . . . . . . . . . . . . . . . . $(1.1) $ — $1.1As of December 31, 2011 . . . . . . . . . . . . . . . . . . . . . . . . . . . . . . . . . . . . . . . . . $(1.3) $(0.1) $1.2
Other Interest Rate Risk Information
The interest rate risk measures discussed above exclude the impact of changes in the fair value of our netguaranty assets resulting from changes in interest rates. We exclude our guaranty business from these sensitivitymeasures based on our current assumption that the guaranty fee income generated from future business activitywill largely replace guaranty fee income lost due to mortgage prepayments.
In “MD&A—Risk Management—Market Risk Management, Including Interest Rate Risk Management—Measurement of Interest Rate Risk—Other Interest Rate Risk Information” in our 2011 Form 10-K, we providedadditional interest rate sensitivities including separate disclosure of the potential impact on the fair value of ourtrading assets and other financial instruments. As of March 31, 2012, these sensitivities were relativelyunchanged as compared with December 31, 2011. The fair value of our trading financial instruments and ourother financial instruments as of March 31, 2012 and December 31, 2011 can be found in “Note 12, Fair Value.”
Liquidity Risk Management
See “Liquidity and Capital Management—Liquidity Management” for a discussion on how we manage liquidityrisk.
Operational Risk Management
See “Risk Management—Operational Risk Management” in our 2011 Form 10-K for more information on ourframework for managing operational risk.
FORWARD-LOOKING STATEMENTS
This report includes statements that constitute forward-looking statements within the meaning of Section 21E ofthe Securities Exchange Act of 1934 (the “Exchange Act”). In addition, our senior management may from time totime make forward-looking statements orally to analysts, investors, the news media and others. Forward-lookingstatements often include words such as “expect,” “anticipate,” “intend,” “plan,” “believe,” “seek,” “estimate,”“forecast,” “project,” “would,” “should,” “could,” “likely,” “may,” or similar words.
Among the forward-looking statements in this report are statements relating to:
• Our expectation that our financial results for 2012 will be significantly better than our 2011 results;
• Our expectation that housing will start to recover if the employment market continues to improve;
• Our expectation of high levels of period-to-period volatility in our results of operations and financialcondition because our derivatives are recorded at fair value in our financial statements while some of theinstruments they hedge are not recorded at fair value in our financial statements;
• Our expectation that the single-family loans we have acquired since the beginning of 2009, in theaggregate, will be profitable over their lifetime, by which we mean that we expect our fee income onthese loans to exceed our credit losses and administrative costs for them;
• Our expectation that the single-family loans we acquired from 2005 through 2008, in the aggregate, willnot be profitable over their lifetime;
79

• Our expectation that the serious delinquency rates for single-family loans acquired in recent years will behigher after the loans have aged, but not as high as the March 31, 2012 serious delinquency rates of loansin our legacy book of business;
• Our expectations regarding the credit profile of loans we acquire in the future, and the factors that willinfluence their credit profile;
• Our expectation that the trends of stabilizing home prices and declining single-family serious delinquencyrates will continue;
• Our belief that our total loss reserves peaked as of December 31, 2011 and will not increase above $76.9billion in the foreseeable future;
• Our expectation that our loss reserves will remain significantly elevated relative to historical levels for anextended period because (1) we expect future defaults on loans we acquired prior to 2009 and theresulting charge-offs will occur over a period of years and (2) a significant portion of our reservesrepresents concessions granted to borrowers upon modification of their loans and will remain in ourreserves until the loans are fully paid or default;
• Our expectation that it will take a significant amount of time before our REO inventory is reduced topre-2008 levels;
• Our estimate that we will realize as credit losses nearly two-thirds of the fair value losses on loanspurchased out of unconsolidated MBS trusts that are reflected in our condensed consolidated balancesheets, and eventually recover the remaining over one-third, either through net interest income for loansthat cure or through foreclosed property income for loans where the sale of the collateral exceeds ourrecorded investment in the loan;
• Our belief that the changes in the foreclosure environment will continue to negatively affect our single-family serious delinquency rates, foreclosure timelines and credit-related expenses;
• Our expectation that serious delinquency rates will continue to be affected in the future by home pricechanges, changes in other macroeconomic conditions, the length of the foreclosure process, the volume ofloan modifications and the extent to which borrowers with modified loans continue to make timelypayments;
• Our expectation that the number of our single-family loans that are seriously delinquent will remain wellabove pre-2008 levels for years;
• Our belief that continued federal government support of our business and the financial markets, as well asour status as a GSE, are essential to maintaining our access to debt funding;
• Our expectation that changes or perceived changes in the government’s support could materiallyadversely affect our ability to refinance our debt as it becomes due, which could have a material adverseimpact on our liquidity, financial condition and results of operations;
• Our belief that our liquidity contingency plan may be difficult or impossible to execute for a company ofour size in our circumstances;
• Our expectation that weakness in the housing and mortgage markets will continue in 2012;
• Our expectation that the high level of delinquent mortgage loans will ultimately result in high levels offoreclosures, which is likely to add to the excess housing inventory;
• Our expectation that single-family default and severity rates will remain high in 2012, but will be lowerthan in 2011;
• Our expectation that multifamily foreclosures in 2012 will remain generally commensurate with 2011levels as certain local markets and properties continue to exhibit weak fundamentals;
• Our expectations that changes to HARP announced in October 2011 will result in our acquisition of morerefinancings in 2012 than we would have acquired in the absence of the changes, but that we will acquirefewer refinancings overall in 2012 than in 2011;
80

• Our expectation that our loan acquisitions for 2012 will be lower than in 2011;
• Our estimation that total originations in the U.S. single-family mortgage market in 2012 will decreasefrom 2011 levels by approximately 8%, from an estimated $1.36 trillion to an estimated $1.26 trillion,and that the amount of originations in the U.S. single-family mortgage market that are refinancings willdecline from approximately $900 billion to approximately $800 billion;
• Our expectation that home prices on a national basis will decline further before stabilizing in 2013;
• Our expectation of a peak-to-trough home price decline on a national basis ranging from 24% to 30%,with the occurrence of an additional adverse economic event needed to reach the high end of the range;
• Our expectations regarding regional variations in home price declines and stabilization;
• Our expectation that our credit-related expenses will remain high in 2012 but that, overall, our credit-related expenses will be lower in 2012 than in 2011;
• Our expectation that our credit losses will remain high in 2012;
• Our expectation that our realization of some credit losses will be delayed to the extent delays inforeclosures continue in 2012;
• Our expectation that we will request additional draws under the senior preferred stock purchaseagreement in future periods, which will further increase the dividends we owe to Treasury on the seniorpreferred stock;
• Our expectation that, over time, our dividend obligation to Treasury will increasingly drive our futuredraws under the senior preferred stock purchase agreement;
• Our expectation that, although we may experience period-to-period volatility in earnings andcomprehensive income, we will not generate net income or comprehensive income in excess of ourannual dividend obligation to Treasury over the long term;
• Our expectation that uncertainty regarding the future of our company will continue;
• Our expectation that we will continue to purchase loans from MBS trusts as they become four or moreconsecutive monthly payments delinquent subject to market conditions, economic benefit, servicercapacity, and other factors, including the limit on the mortgage assets that we may own pursuant to thesenior preferred stock purchase agreement;
• Our expectation that Congressional hearings on GSE reform will continue in 2012 and additionallegislation will be considered and proposals will be discussed, including proposals that would result in asubstantial change to our business structure or that involve Fannie Mae’s liquidation or dissolution;
• Our belief that, as drafted, bills introduced in Congress that would require FHFA to make a determinationwithin two years of enactment regarding whether the GSEs were financially viable and, if the GSEs weredetermined to be not financially viable, to place them into receivership may upon enactment impair ourability to issue securities in the capital markets and therefore our ability to conduct our business, absentthe federal government providing an explicit guarantee of our existing and future liabilities;
• Our expectation that our acquisitions of Alt-A mortgage loans (which are limited to refinancings ofexisting Fannie Mae loans) will continue to be minimal in future periods and the percentage of the bookof business attributable to Alt-A will continue to decrease over time;
• Our belief that Refi Plus loans may not perform as well as the other loans we have acquired since thebeginning of 2009;
• Our expectation that Refi Plus loans will perform better than the loans they replace because Refi Plusloans reduce the borrowers’ monthly payments or otherwise should provide more stability than theborrowers’ old loans (for example, by refinancing into a mortgage with a fixed interest rate instead of anadjustable rate).
81

• Our expectation that the current market premium portion of our current estimate of the fair value of ourbook of business will not impact future Treasury draws, which is based on our intention generally not tohave other parties assume the credit risk inherent in our book of business;
• Our expectation that, although our funding needs may vary from quarter to quarter depending on marketconditions, our debt funding needs will decline in future periods as we reduce the size of our mortgageportfolio in compliance with the requirement of the senior preferred stock purchase agreement;
• Our expectation that our debt funding activity will likely continue to decline in future periods as the sizeof our mortgage portfolio decreases;
• Our intention to repay our short-term and long-term debt obligations as they become due primarilythrough proceeds from the issuance of additional debt securities;
• Our expectations regarding our credit ratings and their impact on us as set forth in “MD&A—Liquidityand Capital Management—Liquidity Management—Credit Ratings”;
• Our expectation that the volume of our home retention solutions and foreclosure alternatives will remainhigh throughout the remainder of 2012;
• Our belief that the performance of our workouts will be highly dependent on economic factors, such asunemployment rates, household wealth and income, and home prices;
• Our expectation that the amount of our outstanding repurchase requests to seller/servicers will remainhigh, and that we may be unable to recover on all outstanding loan repurchase obligations resulting fromseller/servicers’ breaches of contractual obligations;
• Our expectation that the change in our loan delivery agreement with Bank of America will not be materialto our business or results of operations;
• Our expectations regarding recoveries from our lenders under risk sharing arrangements, and thepossibility that we may require a lender to pledge collateral to secure its recourse obligations;
• Our beliefs regarding whether our financial guarantor counterparties will be able to fully meet theirobligations to us in the future;
• Our belief that we have limited credit exposure on government loans;
• Our expectation that the ultimate performance of all our loans will be affected by macroeconomic trends,including unemployment, the economy, and home prices;
• Our expectation that implementing recent Congressional and FHFA directives will increase ouroperational risk and may potentially result in one or more significant deficiencies or material weaknessesin our internal control over financial reporting in a future period; and
• Our belief that none of the seven lawsuits relating to the payment of transfer taxes described in “Note 13,Commitments and Contingencies” is likely to have a material impact on our business, either individuallyor in the aggregate.
Forward-looking statements reflect our management’s expectations, forecasts or predictions of future conditions,events or results based on various assumptions and management’s estimates of trends and economic factors in themarkets in which we are active, as well as our business plans. They are not guarantees of future performance. Bytheir nature, forward-looking statements are subject to risks and uncertainties. Our actual results and financialcondition may differ, possibly materially, from the anticipated results and financial condition indicated in theseforward-looking statements. There are a number of factors that could cause actual conditions, events or results todiffer materially from those described in the forward-looking statements contained in this report, including, butnot limited to, the following: the uncertainty of our future; legislative and regulatory changes affecting us;challenges we face in retaining and hiring qualified employees; the deteriorated credit performance of manyloans in our guaranty book of business; the conservatorship and its effect on our business; the investment byTreasury and its effect on our business; adverse effects from activities we undertake to support the mortgagemarket and help borrowers; a decrease in our credit ratings; limitations on our ability to access the debt capital
82

markets; further disruptions in the housing and credit markets; defaults by one or more institutionalcounterparties; our reliance on mortgage servicers; guidance by the Financial Accounting Standards Board(“FASB”); operational control weaknesses; our reliance on models; the level and volatility of interest rates andcredit spreads; changes in the structure and regulation of the financial services industry; and those factorsdescribed in “Risk Factors” in this report and in our 2011 Form 10-K, as well as the factors described in“Executive Summary—Outlook—Factors that Could Cause Actual Results to be Materially Different from ourEstimates and Expectations” in this report.
Readers are cautioned to place forward-looking statements in this report or that we make from time to time intoproper context by carefully considering the factors discussed in “Risk Factors” in our 2011 Form 10-K and in thisreport. These forward-looking statements are representative only as of the date they are made, and we undertakeno obligation to update any forward-looking statement as a result of new information, future events or otherwise,except as required under the federal securities laws.
83

Item 1. Financial Statements
FANNIE MAE(In conservatorship)
Condensed Consolidated Balance Sheets—(Unaudited)(Dollars in millions, except share amounts)
As of
March 31, December 31,2012 2011
ASSETSCash and cash equivalents . . . . . . . . . . . . . . . . . . . . . . . . . . . . . . . . . . . . . . . . . . . . . . . . . . . . . . . . . . . . . . . . . . . . . $ 22,049 $ 17,539Restricted cash (includes $51,347 and $45,900, respectively, related to consolidated trusts) . . . . . . . . . . . . . . . . . . 55,921 50,797Federal funds sold and securities purchased under agreements to resell or similar arrangements . . . . . . . . . . . . . . . 15,000 46,000Investments in securities:
Trading, at fair value . . . . . . . . . . . . . . . . . . . . . . . . . . . . . . . . . . . . . . . . . . . . . . . . . . . . . . . . . . . . . . . . . . . . . 75,806 74,198Available-for-sale, at fair value (includes $1,091 and $1,191, respectively, related to consolidated trusts) . . . 73,779 77,582
Total investments in securities . . . . . . . . . . . . . . . . . . . . . . . . . . . . . . . . . . . . . . . . . . . . . . . . . . . . . . . . . . 149,585 151,780
Mortgage loans:Loans held for sale, at lower of cost or fair value (includes $56 and $66, respectively, related to consolidated
trusts) . . . . . . . . . . . . . . . . . . . . . . . . . . . . . . . . . . . . . . . . . . . . . . . . . . . . . . . . . . . . . . . . . . . . . . . . . . . . . . . 282 311Loans held for investment, at amortized cost:
Of Fannie Mae . . . . . . . . . . . . . . . . . . . . . . . . . . . . . . . . . . . . . . . . . . . . . . . . . . . . . . . . . . . . . . . . . . . . . . . . 377,031 380,134Of consolidated trusts (includes $4,292 and $3,611, respectively, at fair value and loans pledged as
collateral that may be sold or repledged of $749 and $798, respectively) . . . . . . . . . . . . . . . . . . . . . . . . . 2,616,521 2,590,332
Total loans held for investment . . . . . . . . . . . . . . . . . . . . . . . . . . . . . . . . . . . . . . . . . . . . . . . . . . . . . . . . . . . 2,993,552 2,970,466Allowance for loan losses . . . . . . . . . . . . . . . . . . . . . . . . . . . . . . . . . . . . . . . . . . . . . . . . . . . . . . . . . . . . . . . . (70,109) (72,156)
Total loans held for investment, net of allowance . . . . . . . . . . . . . . . . . . . . . . . . . . . . . . . . . . . . . . . . . . . 2,923,443 2,898,310
Total mortgage loans . . . . . . . . . . . . . . . . . . . . . . . . . . . . . . . . . . . . . . . . . . . . . . . . . . . . . . . . . . . . . 2,923,725 2,898,621Accrued interest receivable, net (includes $8,416 and $8,466, respectively, related to consolidated trusts) . . . . . . . 10,018 10,000Acquired property, net . . . . . . . . . . . . . . . . . . . . . . . . . . . . . . . . . . . . . . . . . . . . . . . . . . . . . . . . . . . . . . . . . . . . . . . . 10,619 11,373Other assets (includes cash pledged as collateral of $1,159 and $1,109, respectively) . . . . . . . . . . . . . . . . . . . . . . . 23,023 25,374
Total assets . . . . . . . . . . . . . . . . . . . . . . . . . . . . . . . . . . . . . . . . . . . . . . . . . . . . . . . . . . . . . . . . . . . . . . . . . . . . . . . $3,209,940 $3,211,484
LIABILITIES AND EQUITY (DEFICIT)Liabilities:
Accrued interest payable (includes $9,227 and $9,302, respectively, related to consolidated trusts) . . . . . . . . . . $ 12,442 $ 12,648Debt:
Of Fannie Mae (includes $825 and $838, respectively, at fair value) . . . . . . . . . . . . . . . . . . . . . . . . . . . . . . . . 685,974 732,444Of consolidated trusts (includes $4,279 and $3,939, respectively, at fair value) . . . . . . . . . . . . . . . . . . . . . . . . 2,498,233 2,457,428
Other liabilities (includes $581 and $629, respectively, related to consolidated trusts) . . . . . . . . . . . . . . . . . . . . . 13,023 13,535
Total liabilities . . . . . . . . . . . . . . . . . . . . . . . . . . . . . . . . . . . . . . . . . . . . . . . . . . . . . . . . . . . . . . . . . . . . . . . . . . 3,209,672 3,216,055
Commitments and contingencies (Note 13) . . . . . . . . . . . . . . . . . . . . . . . . . . . . . . . . . . . . . . . . . . . . . . . . . . . . . . . . — —Fannie Mae stockholders' equity (deficit):
Senior preferred stock, 1,000,000 shares issued and outstanding . . . . . . . . . . . . . . . . . . . . . . . . . . . . . . . . . . . 117,149 112,578Preferred stock, 700,000,000 shares are authorized—555,374,922 shares issued and outstanding . . . . . . . . . . 19,130 19,130Common stock, no par value, no maximum authorization—1,308,762,703 shares issued, and;
1,158,069,699 and 1,157,767,400 shares outstanding, respectively . . . . . . . . . . . . . . . . . . . . . . . . . . . . . . . . 687 687Accumulated deficit . . . . . . . . . . . . . . . . . . . . . . . . . . . . . . . . . . . . . . . . . . . . . . . . . . . . . . . . . . . . . . . . . . . . . . (128,482) (128,381)Accumulated other comprehensive loss . . . . . . . . . . . . . . . . . . . . . . . . . . . . . . . . . . . . . . . . . . . . . . . . . . . . . . . (873) (1,235)Treasury stock, at cost, 150,693,004 and 150,995,303 shares, respectively . . . . . . . . . . . . . . . . . . . . . . . . . . . (7,401) (7,403)
Total Fannie Mae stockholders’ equity (deficit) . . . . . . . . . . . . . . . . . . . . . . . . . . . . . . . . . . . . . . . . . . . . . . . . 210 (4,624)Noncontrolling interest . . . . . . . . . . . . . . . . . . . . . . . . . . . . . . . . . . . . . . . . . . . . . . . . . . . . . . . . . . . . . . . . . . . . . . . . 58 53
Total equity (deficit) . . . . . . . . . . . . . . . . . . . . . . . . . . . . . . . . . . . . . . . . . . . . . . . . . . . . . . . . . . . . . . . . . . . . . . 268 (4,571)
Total liabilities and equity (deficit) . . . . . . . . . . . . . . . . . . . . . . . . . . . . . . . . . . . . . . . . . . . . . . . . . . . . . . . . . . . . . . $3,209,940 $3,211,484
See Notes to Condensed Consolidated Financial Statements
84

FANNIE MAE(In conservatorship)
Condensed Consolidated Statements of Operations and Comprehensive Income (Loss)—(Unaudited)(Dollars and shares in millions, except per share amounts)
For the ThreeMonths Ended
March 31,
2012 2011
Interest income:Trading securities . . . . . . . . . . . . . . . . . . . . . . . . . . . . . . . . . . . . . . . . . . . . . . . . . . . . . . . . . . . . . . . . . . . . . . . . . . . . . . $ 449 $ 284Available-for-sale securities . . . . . . . . . . . . . . . . . . . . . . . . . . . . . . . . . . . . . . . . . . . . . . . . . . . . . . . . . . . . . . . . . . . . . . 727 1,213Mortgage loans (includes $29,001 and $31,865, respectively, related to consolidated trusts) . . . . . . . . . . . . . . . . . . . . 32,570 35,590Other . . . . . . . . . . . . . . . . . . . . . . . . . . . . . . . . . . . . . . . . . . . . . . . . . . . . . . . . . . . . . . . . . . . . . . . . . . . . . . . . . . . . . . . . 38 28
Total interest income . . . . . . . . . . . . . . . . . . . . . . . . . . . . . . . . . . . . . . . . . . . . . . . . . . . . . . . . . . . . . . . . . . . . . . . . . . 33,784 37,115
Interest expense:Short-term debt (includes $1 and $3, respectively, related to consolidated trusts) . . . . . . . . . . . . . . . . . . . . . . . . . . . . . 42 107Long-term debt (includes $25,360 and $27,852, respectively, related to consolidated trusts) . . . . . . . . . . . . . . . . . . . . 28,545 32,048
Total interest expense . . . . . . . . . . . . . . . . . . . . . . . . . . . . . . . . . . . . . . . . . . . . . . . . . . . . . . . . . . . . . . . . . . . . . . . . . 28,587 32,155
Net interest income . . . . . . . . . . . . . . . . . . . . . . . . . . . . . . . . . . . . . . . . . . . . . . . . . . . . . . . . . . . . . . . . . . . . . . . . . . . . . . . 5,197 4,960Provision for credit losses . . . . . . . . . . . . . . . . . . . . . . . . . . . . . . . . . . . . . . . . . . . . . . . . . . . . . . . . . . . . . . . . . . . . . . . . . . (2,000) (10,554)
Net interest income (loss) after provision for credit losses . . . . . . . . . . . . . . . . . . . . . . . . . . . . . . . . . . . . . . . . . . . . . . . . . 3,197 (5,594)
Investment gains, net . . . . . . . . . . . . . . . . . . . . . . . . . . . . . . . . . . . . . . . . . . . . . . . . . . . . . . . . . . . . . . . . . . . . . . . . . . . . . . 116 75Other-than-temporary impairments . . . . . . . . . . . . . . . . . . . . . . . . . . . . . . . . . . . . . . . . . . . . . . . . . . . . . . . . . . . . . . . . . . . (80) (57)Noncredit portion of other-than-temporary impairments recognized in other comprehensive income . . . . . . . . . . . . . . . . 16 13
Net other-than-temporary impairments . . . . . . . . . . . . . . . . . . . . . . . . . . . . . . . . . . . . . . . . . . . . . . . . . . . . . . . . . . . . . . . . (64) (44)Fair value gains, net . . . . . . . . . . . . . . . . . . . . . . . . . . . . . . . . . . . . . . . . . . . . . . . . . . . . . . . . . . . . . . . . . . . . . . . . . . . . . . . 283 289Debt extinguishment (losses) gains, net . . . . . . . . . . . . . . . . . . . . . . . . . . . . . . . . . . . . . . . . . . . . . . . . . . . . . . . . . . . . . . . (34) 13Fee and other income . . . . . . . . . . . . . . . . . . . . . . . . . . . . . . . . . . . . . . . . . . . . . . . . . . . . . . . . . . . . . . . . . . . . . . . . . . . . . . 375 237
Non-interest income . . . . . . . . . . . . . . . . . . . . . . . . . . . . . . . . . . . . . . . . . . . . . . . . . . . . . . . . . . . . . . . . . . . . . . . . . . . . 676 570
Administrative expenses:Salaries and employee benefits . . . . . . . . . . . . . . . . . . . . . . . . . . . . . . . . . . . . . . . . . . . . . . . . . . . . . . . . . . . . . . . . . . . . 306 320Professional services . . . . . . . . . . . . . . . . . . . . . . . . . . . . . . . . . . . . . . . . . . . . . . . . . . . . . . . . . . . . . . . . . . . . . . . . . . . . 168 189Occupancy expense . . . . . . . . . . . . . . . . . . . . . . . . . . . . . . . . . . . . . . . . . . . . . . . . . . . . . . . . . . . . . . . . . . . . . . . . . . . . . 43 42Other administrative expenses . . . . . . . . . . . . . . . . . . . . . . . . . . . . . . . . . . . . . . . . . . . . . . . . . . . . . . . . . . . . . . . . . . . . . 47 54
Total administrative expenses . . . . . . . . . . . . . . . . . . . . . . . . . . . . . . . . . . . . . . . . . . . . . . . . . . . . . . . . . . . . . . . . . . . 564 605Foreclosed property expense . . . . . . . . . . . . . . . . . . . . . . . . . . . . . . . . . . . . . . . . . . . . . . . . . . . . . . . . . . . . . . . . . . . . . . . . 339 488Other expenses . . . . . . . . . . . . . . . . . . . . . . . . . . . . . . . . . . . . . . . . . . . . . . . . . . . . . . . . . . . . . . . . . . . . . . . . . . . . . . . . . . . 252 352
Total expenses . . . . . . . . . . . . . . . . . . . . . . . . . . . . . . . . . . . . . . . . . . . . . . . . . . . . . . . . . . . . . . . . . . . . . . . . . . . . . . . 1,155 1,445
Income (loss) before federal income taxes . . . . . . . . . . . . . . . . . . . . . . . . . . . . . . . . . . . . . . . . . . . . . . . . . . . . . . . . . . . . . 2,718 (6,469)Provision for federal income taxes . . . . . . . . . . . . . . . . . . . . . . . . . . . . . . . . . . . . . . . . . . . . . . . . . . . . . . . . . . . . . . . . . . . — 2
Net income (loss) . . . . . . . . . . . . . . . . . . . . . . . . . . . . . . . . . . . . . . . . . . . . . . . . . . . . . . . . . . . . . . . . . . . . . . . . . . . . . . . . . 2,718 (6,471)Other comprehensive income:
Changes in unrealized losses on available-for-sale securities, net of reclassification adjustments and taxes . . . . . . . . . 355 179Other . . . . . . . . . . . . . . . . . . . . . . . . . . . . . . . . . . . . . . . . . . . . . . . . . . . . . . . . . . . . . . . . . . . . . . . . . . . . . . . . . . . . . . . . 7 2
Total other comprehensive income . . . . . . . . . . . . . . . . . . . . . . . . . . . . . . . . . . . . . . . . . . . . . . . . . . . . . . . . . . . . . . . 362 181
Total comprehensive income (loss) . . . . . . . . . . . . . . . . . . . . . . . . . . . . . . . . . . . . . . . . . . . . . . . . . . . . . . . . . . . . . . . . . . . 3,080 (6,290)Less: Comprehensive loss attributable to the noncontrolling interest . . . . . . . . . . . . . . . . . . . . . . . . . . . . . . . . . . . . . . . 1 —
Total comprehensive income (loss) attributable to Fannie Mae . . . . . . . . . . . . . . . . . . . . . . . . . . . . . . . . . . . . . . . . . . . . . $ 3,081 $ (6,290)
Net income (loss) . . . . . . . . . . . . . . . . . . . . . . . . . . . . . . . . . . . . . . . . . . . . . . . . . . . . . . . . . . . . . . . . . . . . . . . . . . . . . . . . . $ 2,718 $ (6,471)Less: Net loss attributable to the noncontrolling interest . . . . . . . . . . . . . . . . . . . . . . . . . . . . . . . . . . . . . . . . . . . . . . . . 1 —
Net income (loss) attributable to Fannie Mae . . . . . . . . . . . . . . . . . . . . . . . . . . . . . . . . . . . . . . . . . . . . . . . . . . . . . . . . . . . 2,719 (6,471)Preferred stock dividends . . . . . . . . . . . . . . . . . . . . . . . . . . . . . . . . . . . . . . . . . . . . . . . . . . . . . . . . . . . . . . . . . . . . . . . . . . (2,817) (2,216)
Net loss attributable to common stockholders . . . . . . . . . . . . . . . . . . . . . . . . . . . . . . . . . . . . . . . . . . . . . . . . . . . . . . . . . . . $ (98) $ (8,687)
Loss per share—Basic and Diluted . . . . . . . . . . . . . . . . . . . . . . . . . . . . . . . . . . . . . . . . . . . . . . . . . . . . . . . . . . . . . . . . . . . $ (0.02) $ (1.52)Weighted-average common shares outstanding—Basic and Diluted . . . . . . . . . . . . . . . . . . . . . . . . . . . . . . . . . . . . . . . . . 5,761 5,698
See Notes to Condensed Consolidated Financial Statements
85

FANNIE MAE(In conservatorship)
Condensed Consolidated Statements of Cash Flows—(Unaudited)(Dollars in millions)
For the Three MonthsEnded March 31,
2012 2011
Net cash (used in) provided by operating activities . . . . . . . . . . . . . . . . . . . . . . . . . . . . $ (114) $ 2,566
Cash flows provided by investing activities:
Purchases of trading securities held for investment . . . . . . . . . . . . . . . . . . . . . . . . . . . . (226) (185)
Proceeds from maturities and paydowns of trading securities held for investment . . . . 756 522
Proceeds from sales of trading securities held for investment . . . . . . . . . . . . . . . . . . . . 413 409
Purchases of available-for-sale securities . . . . . . . . . . . . . . . . . . . . . . . . . . . . . . . . . . . . (9) (44)
Proceeds from maturities and paydowns of available-for-sale securities . . . . . . . . . . . 2,929 3,851
Proceeds from sales of available-for-sale securities . . . . . . . . . . . . . . . . . . . . . . . . . . . . 401 498
Purchases of loans held for investment . . . . . . . . . . . . . . . . . . . . . . . . . . . . . . . . . . . . . (38,276) (15,745)
Proceeds from repayments of loans held for investment of Fannie Mae . . . . . . . . . . . . 6,856 5,381
Proceeds from repayments of loans held for investment of consolidated trusts . . . . . . 174,954 121,533
Net change in restricted cash . . . . . . . . . . . . . . . . . . . . . . . . . . . . . . . . . . . . . . . . . . . . . (5,124) 26,948
Advances to lenders . . . . . . . . . . . . . . . . . . . . . . . . . . . . . . . . . . . . . . . . . . . . . . . . . . . . (26,131) (15,646)
Proceeds from disposition of acquired property and short sales . . . . . . . . . . . . . . . . . . 10,195 10,979
Net change in federal funds sold and securities purchased under agreements to resellor similar agreements . . . . . . . . . . . . . . . . . . . . . . . . . . . . . . . . . . . . . . . . . . . . . . . . . 31,000 (14,499)
Other, net . . . . . . . . . . . . . . . . . . . . . . . . . . . . . . . . . . . . . . . . . . . . . . . . . . . . . . . . . . . . (208) (163)
Net cash provided by investing activities . . . . . . . . . . . . . . . . . . . . . . . . . . . . . . . . . . . . . . 157,530 123,839
Cash flows used in financing activities:
Proceeds from issuance of debt of Fannie Mae . . . . . . . . . . . . . . . . . . . . . . . . . . . . . . . 167,848 163,776
Payments to redeem debt of Fannie Mae . . . . . . . . . . . . . . . . . . . . . . . . . . . . . . . . . . . . (214,701) (183,073)
Proceeds from issuance of debt of consolidated trusts . . . . . . . . . . . . . . . . . . . . . . . . . . 80,933 72,567
Payments to redeem debt of consolidated trusts . . . . . . . . . . . . . . . . . . . . . . . . . . . . . . . (188,730) (177,551)
Payments of cash dividends on senior preferred stock to Treasury . . . . . . . . . . . . . . . . (2,819) (2,216)
Proceeds from senior preferred stock purchase agreement with Treasury . . . . . . . . . . . 4,571 2,600
Net change in federal funds purchased and securities sold under agreements torepurchase . . . . . . . . . . . . . . . . . . . . . . . . . . . . . . . . . . . . . . . . . . . . . . . . . . . . . . . . . . — 26
Other, net . . . . . . . . . . . . . . . . . . . . . . . . . . . . . . . . . . . . . . . . . . . . . . . . . . . . . . . . . . . . (8) —
Net cash used in financing activities . . . . . . . . . . . . . . . . . . . . . . . . . . . . . . . . . . . . . . . . . (152,906) (123,871)
Net increase in cash and cash equivalents . . . . . . . . . . . . . . . . . . . . . . . . . . . . . . . . . . . 4,510 2,534
Cash and cash equivalents at beginning of period . . . . . . . . . . . . . . . . . . . . . . . . . . . . . . . 17,539 17,297
Cash and cash equivalents at end of period . . . . . . . . . . . . . . . . . . . . . . . . . . . . . . . . . . . . $ 22,049 $ 19,831
Cash paid during the period for interest . . . . . . . . . . . . . . . . . . . . . . . . . . . . . . . . . . . . $ 30,590 $ 32,689
See Notes to Condensed Consolidated Financial Statements
86

FANNIE MAE(In conservatorship)
NOTES TO CONDENSED CONSOLIDATED FINANCIAL STATEMENTS(UNAUDITED)
1. Summary of Significant Accounting Policies
Organization
We are a stockholder-owned corporation organized and existing under the Federal National MortgageAssociation Charter Act (the “Charter Act” or our “charter”). We are a government-sponsored enterprise(“GSE”), and we are subject to government oversight and regulation. Our regulators include the Federal HousingFinance Agency (“FHFA”), the U.S. Department of Housing and Urban Development (“HUD”), theU.S. Securities and Exchange Commission (“SEC”), and the U.S. Department of the Treasury (“Treasury”). TheU.S. government does not guarantee our securities or other obligations.
Conservatorship
On September 7, 2008, the Secretary of the Treasury and the Director of FHFA announced several actions takenby Treasury and FHFA regarding Fannie Mae, which included: (1) placing us in conservatorship and (2) theexecution of a senior preferred stock purchase agreement by our conservator, on our behalf, and Treasury,pursuant to which we issued to Treasury both senior preferred stock and a warrant to purchase common stock.
Under the Federal Housing Enterprises Financial Safety and Soundness Act of 1992, as amended by the FederalHousing Finance Regulatory Reform Act of 2008, (together, the “GSE Act”), the conservator immediatelysucceeded to (1) all rights, titles, powers and privileges of Fannie Mae, and of any stockholder, officer or directorof Fannie Mae with respect to Fannie Mae and its assets, and (2) title to the books, records and assets of anyother legal custodian of Fannie Mae. The conservator has since delegated specified authorities to our Board ofDirectors and has delegated to management the authority to conduct our day-to-day operations. The conservatorretains the authority to withdraw its delegations at any time.
The conservator has the power to transfer or sell any asset or liability of Fannie Mae (subject to limitations andpost-transfer notice provisions for transfers of qualified financial contracts) without any approval, assignment ofrights or consent of any party. The GSE Act, however, provides that mortgage loans and mortgage-related assetsthat have been transferred to a Fannie Mae mortgage-backed securities (“MBS”) trust must be held by theconservator for the beneficial owners of the Fannie Mae MBS and cannot be used to satisfy the general creditorsof Fannie Mae. As of May 9, 2012, FHFA has not exercised this power.
Neither the conservatorship nor the terms of our agreements with Treasury change our obligation to makerequired payments on our debt securities or perform under our mortgage guaranty obligations. FHFA issued arule establishing a framework for conservatorship and receivership operations for the GSEs, which becameeffective in 2011. The rule established procedures for conservatorship and receivership, and priorities of claimsfor contract parties and other claimants. This rule is part of FHFA’s implementation of the powers provided bythe Federal Housing Finance Regulatory Reform Act of 2008, and does not seek to anticipate or predict futureconservatorships or receiverships.
FHFA has announced that, during the conservatorship, our existing statutory and FHFA-directed regulatorycapital requirements will not be binding and that FHFA will not issue quarterly capital classifications. We submitcapital reports to FHFA and FHFA monitors our capital levels. The deficit of core capital over statutoryminimum capital was $147.8 billion as of March 31, 2012 and $148.4 billion as of December 31, 2011.
The conservatorship has no specified termination date and there continues to be uncertainty regarding the futureof our company, including how long the company will continue to exist in its current form, the extent of our rolein the market, what form we will have, and what ownership interest, if any, our current common and preferredstockholders will hold in us after the conservatorship is terminated. Under the GSE Act, FHFA must place us intoreceivership if the Director of FHFA makes a written determination that our assets are less than our obligationsor if we have not been paying our debts, in either case, for a period of 60 days. In addition, the Director of FHFA
87

FANNIE MAE(In conservatorship)
NOTES TO CONDENSED CONSOLIDATED FINANCIAL STATEMENTS—(Continued)(UNAUDITED)
may place us in receivership at his discretion at any time for other reasons, including conditions that FHFA hasalready asserted existed at the time the former Director of FHFA placed us into conservatorship. Placement intoreceivership would have a material adverse effect on holders of our common stock, preferred stock, debtsecurities and Fannie Mae MBS. Should we be placed into receivership, different assumptions would be requiredto determine the carrying value of our assets, which could lead to substantially different financial results. We arenot aware of any plans of FHFA to significantly change our business model or capital structure in the near-term.
Impact of U.S. Government Support
We are dependent upon the continued support of Treasury to eliminate our net worth deficit, which avoids ourbeing placed into receivership. Based on consideration of all the relevant conditions and events affecting ouroperations, including our dependence on the U.S. government, we continue to operate as a going concern and inaccordance with our delegation of authority from FHFA.
Pursuant to the senior preferred stock purchase agreement, Treasury has committed to provide us with funding asdescribed below to help us maintain a positive net worth thereby avoiding the mandatory receivership triggerdescribed above. We have received a total of $116.1 billion from Treasury pursuant to the senior preferred stockpurchase agreement as of March 31, 2012. The aggregate liquidation preference of the senior preferred stock,including the initial aggregate liquidation preference of $1.0 billion, remains at $117.1 billion.
The senior preferred stock purchase agreement provides that the $200 billion maximum amount of thecommitment from Treasury will increase as necessary to accommodate any net worth deficiencies attributable toperiods during 2010, 2011, and 2012. If we do not have a positive net worth as of December 31, 2012, then theamount of funding available under the amended senior preferred stock purchase agreement after 2012 will be$124.8 billion ($200 billion less $75.2 billion in cumulative draws for net worth deficiencies throughDecember 31, 2009).
In the event we have a positive net worth as of December 31, 2012, then the amount of funding available after2012 under the amended senior preferred stock purchase agreement will depend on the size of that positive networth relative to the cumulative draws for net worth deficiencies attributable to periods during 2010, 2011, and2012, as follows:
• If our positive net worth as of December 31, 2012 is less than the cumulative draws for net worthdeficiencies attributable to periods during 2010, 2011, and 2012, then the amount of available funding willbe $124.8 billion less our positive net worth as of December 31, 2012.
• If our positive net worth as of December 31, 2012 is greater than the cumulative draws for net worthdeficiencies attributable to periods during 2010, 2011, and 2012, then the amount of available funding willbe $124.8 billion less the cumulative draws attributable to periods during 2010, 2011, and 2012.
We were scheduled to begin paying a quarterly commitment fee to Treasury under the senior preferred stockpurchase agreement beginning on March 31, 2011; however, Treasury waived the quarterly commitment fee foreach quarter of 2011 and the first and second quarters of 2012 due to the continued fragility of the U.S. mortgagemarket and Treasury’s belief that the imposition of the quarterly commitment fee would not generate increasedcompensation for taxpayers. In its notification to FHFA that it had waived the quarterly commitment fee for thesecond quarter of 2012, Treasury indicated that it will reevaluate the situation during the next calendar quarter todetermine whether the quarterly commitment fee should then be set. The agreement provides that Treasury maywaive the periodic commitment fee for up to one year at a time, in its sole discretion, based on adverse conditionsin the U.S. mortgage market.
88
FANNIE MAE(In conservatorship)
NOTES TO CONDENSED CONSOLIDATED FINANCIAL STATEMENTS—(Continued)(UNAUDITED)
We fund our business primarily through the issuance of short-term and long-term debt securities in the domesticand international capital markets. Because debt issuance is our primary funding source, we are subject to “roll-over,” or refinancing, risk on our outstanding debt. Our ability to issue long-term debt has been strong primarilydue to actions taken by the federal government to support us and the financial markets.
We believe that continued federal government support of our business and the financial markets, as well as ourstatus as a GSE, are essential to maintaining our access to debt funding. Changes or perceived changes in thegovernment’s support could materially adversely affect our ability to refinance our debt as it becomes due, whichcould have a material adverse impact on our liquidity, financial condition and results of operations. In addition,due to our reliance on the U.S. government’s support, our access to debt funding or the cost of debt funding alsocould be materially adversely affected by a change or perceived change in the creditworthiness of the U.S.government. A downgrade in our credit ratings could reduce demand for our debt securities and increase ourborrowing costs. Standard & Poor’s Ratings Services’ (“S&P”) downgrade of our credit rating on August 8,2011, which was a result of a similar action on the U.S. government’s sovereign credit rating, has not adverselyaffected our access to debt funding or the cost of our debt funding. Future changes or disruptions in the financialmarkets could significantly change the amount, mix and cost of funds we obtain, which also could increase ourliquidity and roll-over risk and have a material adverse impact on our liquidity, financial condition and results ofoperations.
In February 2011, Treasury and HUD released a report to Congress on reforming America’s housing financemarket. The report provides that the Obama Administration will work with FHFA to determine the best way toresponsibly reduce Fannie Mae’s and Freddie Mac’s role in the market and ultimately wind down bothinstitutions. The report emphasizes the importance of proceeding with a careful transition plan and providing thenecessary financial support to Fannie Mae and Freddie Mac during the transition period. In February2012, Treasury Secretary Geithner stated that the Administration intended to release new details in the spring of2012 around approaches to housing finance reform including winding down Fannie Mae and Freddie Mac and towork with Congressional leaders to explore options for legislation, but that he does not expect housing financereform legislation to be enacted in 2012. We cannot predict the prospects for the enactment, timing or content oflegislative proposals regarding the future status of the GSEs.
Basis of Presentation
The accompanying unaudited interim condensed consolidated financial statements have been prepared inaccordance with accounting principles generally accepted in the United States of America (“GAAP”) for interimfinancial information and with the SEC’s instructions to Form 10-Q and Article 10 of Regulation S-X.Accordingly, they do not include all of the information and note disclosures required by GAAP for completeconsolidated financial statements. In the opinion of management, all adjustments of a normal recurring natureconsidered necessary for a fair presentation have been included. The accompanying condensed consolidatedfinancial statements include our accounts as well as the accounts of other entities in which we have a controllingfinancial interest. All intercompany accounts and transactions have been eliminated. Results for the three monthsended March 31, 2012 may not necessarily be indicative of the results for the year ending December 31, 2012.The unaudited interim condensed consolidated financial statements as of and for the three months endedMarch 31, 2012 should be read in conjunction with our audited consolidated financial statements and relatednotes included in our Annual Report on Form 10-K for the year ended December 31, 2011 (“2011 Form 10-K”),filed with the SEC on February 29, 2012.
Related Parties
As a result of our issuance to Treasury of the warrant to purchase shares of Fannie Mae common stock equal to79.9% of the total number of shares of Fannie Mae common stock, we and Treasury are deemed related parties.
89

FANNIE MAE(In conservatorship)
NOTES TO CONDENSED CONSOLIDATED FINANCIAL STATEMENTS—(Continued)(UNAUDITED)
As of March 31, 2012, Treasury held an investment in our senior preferred stock with an aggregate liquidationpreference of $117.1 billion. Our administrative expenses were reduced by $22 million and $35 million for thethree months ended March 31, 2012 and 2011, respectively, due to reimbursements from Treasury and FreddieMac for expenses incurred as program administrator for Treasury’s Home Affordable Modification Program(“HAMP”) and other initiatives under Treasury’s Making Home Affordable Program.
During the three months ended March 31, 2011, we received a refund of $1.1 billion from the Internal RevenueService (“IRS”) related to the carryback of our 2009 operating loss to the 2008 and 2007 tax years.
Under the temporary credit and liquidity facilities (“TCLF”) program, we had $2.6 billion and $3.0 billionoutstanding, which include principal and interest, of three-year standby credit and liquidity support as ofMarch 31, 2012 and December 31, 2011, respectively. Under the new issue bond (“NIB”) program, we had $7.3billion and $7.5 billion outstanding of pass-through securities backed by single-family and multifamily housingbonds issued by housing finance agencies (“HFAs”) as of March 31, 2012 and December 31, 2011, respectively.Treasury will bear any initial losses of principal under the TCLF program and the NIB program up to 35% of thetotal original principal on a combined program-wide basis, and thereafter we will bear the losses of principal thatare attributable to the TCLF and the securities we have issued. Treasury will also bear any losses of unpaidinterest under the two programs. As of March 31, 2012, there had been no losses of principal or interest under theTCLF program or the NIB program.
FHFA’s control of both us and Freddie Mac has caused us and Freddie Mac to be related parties. No transactionsoutside of normal business activities have occurred between us and Freddie Mac. As of March 31, 2012 andDecember 31, 2011, we held Freddie Mac mortgage-related securities with a fair value of $14.5 billion and $15.6billion, respectively, and accrued interest receivable of $64 million and $69 million, respectively. We recognizedinterest income on these securities held by us of $153 million and $188 million for the three months endedMarch 31, 2012 and 2011, respectively. In addition, Freddie Mac may be an investor in variable interest entitiesthat we have consolidated, and we may be an investor in variable interest entities that Freddie Mac hasconsolidated.
Use of Estimates
Preparing condensed consolidated financial statements in accordance with GAAP requires management to makeestimates and assumptions that affect our reported amounts of assets and liabilities, and disclosure of contingentassets and liabilities as of the dates of our condensed consolidated financial statements, as well as our reportedamounts of revenues and expenses during the reporting periods. Management has made significant estimates in avariety of areas including, but not limited to, valuation of certain financial instruments, and other assets andliabilities, the allowance for loan losses and reserve for guaranty losses, and other-than-temporary impairment ofinvestment securities. Actual results could be different from these estimates.
Collateral
Our liability to third party holders of Fannie Mae MBS that arises as the result of a consolidation of asecuritization trust is collateralized by the underlying loans and/or mortgage-related securities.
We had reverse repurchase agreements outstanding of $26.0 billion and $49.5 billion as of March 31, 2012 andDecember 31, 2011, respectively. The fair value of non-cash collateral we accepted was $26.1 billion and $50.1billion as of March 31, 2012 and December 31, 2011, respectively, of which we were permitted to sell orrepledge $20.0 billion as of March 31, 2012 and December 31, 2011. None of the underlying collateral was soldor repledged as of March 31, 2012 or December 31, 2011.
We had no repurchase agreements outstanding as of March 31, 2012 or December 31, 2011.
90

FANNIE MAE(In conservatorship)
NOTES TO CONDENSED CONSOLIDATED FINANCIAL STATEMENTS—(Continued)(UNAUDITED)
Reclassifications
To conform to our current period presentation, we have reclassified certain amounts reported in our condensedconsolidated financial statements.
Adoption of New Accounting Guidance
Effective January 1, 2012, we prospectively adopted guidance issued by the Financial Accounting StandardsBoard (“FASB”) related to fair value measurement. The new guidance does not expand the use of fair value;instead, it provides guidance about how fair value should be determined where it already is required or permittedunder U.S. GAAP. The new fair value guidance changes certain fair value principles and clarifies the FASB’sintent on certain items, including a clarification that the principal market should be determined based on themarket the entity has access to with the greatest volume and level of activity for the asset or liability. It alsoexpands the disclosures about fair value measurements. The adoption of this guidance did not have a materialimpact on our condensed consolidated financial statements; however, it required us to expand our fair valuedisclosures. See “Note 12, Fair Value,” for additional information regarding the impact upon adoption of thisguidance.
2. Consolidations and Transfers of Financial Assets
We have interests in various entities that are considered to be variable interest entities (“VIEs”). The primarytypes of entities are securitization trusts guaranteed by us via lender swap and portfolio securitizationtransactions, mortgage and asset-backed trusts that were not created by us, as well as housing partnerships thatare established to finance the acquisition, construction, development or rehabilitation of affordable multifamilyand single-family housing. These interests include investments in securities issued by VIEs, such as Fannie MaeMBS created pursuant to our securitization transactions and our guaranty to the entity. We consolidate thesubstantial majority of our single-class securitization trusts because our role as guarantor and master servicerprovides us with the power to direct matters (primarily the servicing of mortgage loans) that impact the creditrisk to which we are exposed. In contrast, we do not consolidate single-class securitization trusts when otherorganizations have the power to direct these activities.
As of March 31, 2012, we consolidated certain VIEs that were not consolidated as of December 31, 2011,generally due to increases in the amount of the certificates issued by the entity that are held in our portfolio (forexample, when we hold a substantial portion of the securities issued by Fannie Mae multi-class resecuritizationtrusts). As a result of consolidating these entities, which had combined total assets of $1.7 billion in unpaidprincipal balance as of March 31, 2012, we derecognized our investment in these entities and recognized theassets and liabilities of the consolidated entities at fair value.
As of March 31, 2012, we also deconsolidated certain VIEs that were consolidated as of December 31, 2011,generally due to decreases in the amount of the certificates issued by the entity that are held in our portfolio. As aresult of deconsolidating these entities, which had combined total assets of $102 million in unpaid principalbalance as of December 31, 2011, we derecognized the assets and liabilities of the entities and recognized at fairvalue our retained interests as securities in our condensed consolidated balance sheets.
Unconsolidated VIEs
We do not consolidate VIEs when we are not deemed to be the primary beneficiary. Our unconsolidated VIEsinclude securitization trusts, as well as other investment entities. The following table displays the carryingamount and classification of our assets and liabilities that relate to our involvement with unconsolidated VIEs asof March 31, 2012 and December 31, 2011, as well as our maximum exposure to loss and the total assets of thoseunconsolidated VIEs.
91

FANNIE MAE(In conservatorship)
NOTES TO CONDENSED CONSOLIDATED FINANCIAL STATEMENTS—(Continued)(UNAUDITED)
As of March 31, 2012
Mortgage-BackedTrusts
Asset-BackedTrusts
LimitedPartnershipInvestments
(Dollars in millions)
Assets and liabilities recorded in our condensedconsolidated balance sheets:
Assets:
Available-for-sale securities(1) . . . . . . . . . . . . . . . . $ 65,640 $ — $ —
Trading securities(1) . . . . . . . . . . . . . . . . . . . . . . . . 23,824 1,896 —
Other assets . . . . . . . . . . . . . . . . . . . . . . . . . . . . . . 271 — 118
Other liabilities . . . . . . . . . . . . . . . . . . . . . . . . . . . . . (1,362) — (148)
Net carrying amount . . . . . . . . . . . . . . . . . . . . . . . . $ 88,373 $ 1,896 $ (30)
Maximum exposure to loss(1) . . . . . . . . . . . . . . . . . . . . $ 97,103 $ 1,896 $ 115
Total assets of unconsolidated VIEs(1) . . . . . . . . . . . . $609,941 $244,148 $12,058
As of December 31, 2011
Mortgage-BackedTrusts
Asset-BackedTrusts
LimitedPartnershipInvestments
(Dollars in millions)
Assets and liabilities recorded in our condensedconsolidated balance sheets:Assets:
Available-for-sale securities(1) . . . . . . . . . . . . . . . . $ 69,101 $ — $ —Trading securities(1) . . . . . . . . . . . . . . . . . . . . . . . . 24,292 2,111 —Other assets . . . . . . . . . . . . . . . . . . . . . . . . . . . . . . 271 — 145
Other liabilities . . . . . . . . . . . . . . . . . . . . . . . . . . . . . (1,347) — (153)
Net carrying amount . . . . . . . . . . . . . . . . . . . . . . . . $ 92,317 $ 2,111 $ (8)
Maximum exposure to loss(1) . . . . . . . . . . . . . . . . . . . . $100,146 $ 2,111 $ 137Total assets of unconsolidated VIEs(1) . . . . . . . . . . . . $641,346 $256,845 $12,256
(1) Contains securities recognized in our condensed consolidated balance sheets due to consolidation of certain multi-classresecuritization trusts.
Our maximum exposure to loss generally represents the greater of our recorded investment in the entity or theunpaid principal balance of the assets covered by our guaranty. However, our securities issued by Fannie Maemulti-class resecuritization trusts that are not consolidated do not give rise to any additional exposure to loss aswe already consolidate the underlying collateral.
Transfers of Financial Assets
We issue Fannie Mae MBS through portfolio securitization transactions by transferring pools of mortgage loansor mortgage-related securities to one or more trusts or special purpose entities. We are considered to be thetransferor when we transfer assets from our own portfolio in a portfolio securitization transaction. For the threemonths ended March 31, 2012 and 2011, the unpaid principal balance of portfolio securitizations was $41.7billion and $29.3 billion, respectively.
92

FANNIE MAE(In conservatorship)
NOTES TO CONDENSED CONSOLIDATED FINANCIAL STATEMENTS—(Continued)(UNAUDITED)
The following table displays some key characteristics of the securities retained in unconsolidated portfoliosecuritization trusts.
Fannie MaeSingle-class
MBS & FannieMae Megas
REMICS &SMBS(1)
(Dollars in millions)
As of March 31, 2012Unpaid principal balance . . . . . . . . . . . . . . . . . . . . . . . . . . . . . . . . . . . . . $ 556 $ 11,138Fair value . . . . . . . . . . . . . . . . . . . . . . . . . . . . . . . . . . . . . . . . . . . . . . . . . 619 12,388Weighted-average coupon . . . . . . . . . . . . . . . . . . . . . . . . . . . . . . . . . . . . 6.21% 5.68%Weighted-average loan age . . . . . . . . . . . . . . . . . . . . . . . . . . . . . . . . . . . 5.7 years 4.2 yearsWeighted-average maturity . . . . . . . . . . . . . . . . . . . . . . . . . . . . . . . . . . . 23.3 years 16.9 yearsAs of December 31, 2011Unpaid principal balance . . . . . . . . . . . . . . . . . . . . . . . . . . . . . . . . . . . . . $ 588 $ 12,697Fair value . . . . . . . . . . . . . . . . . . . . . . . . . . . . . . . . . . . . . . . . . . . . . . . . . 654 14,043Weighted-average coupon . . . . . . . . . . . . . . . . . . . . . . . . . . . . . . . . . . . . 6.21% 5.86%Weighted-average loan age . . . . . . . . . . . . . . . . . . . . . . . . . . . . . . . . . . . 5.4 years 4.5 yearsWeighted-average maturity . . . . . . . . . . . . . . . . . . . . . . . . . . . . . . . . . . . 23.5 years 18.6 years
(1) Consists of Real Estate Mortgage Investment Conduits (“REMICs”) and stripped mortgage-backed securities (“SMBS”).
For the three months ended March 31, 2012 and 2011, the principal and interest received on retained interestswas $694 million and $750 million, respectively.
Managed Loans
We define “managed loans” as on-balance sheet mortgage loans as well as mortgage loans that we havesecuritized in unconsolidated portfolio securitization trusts. The following table displays the unpaid principalbalances of managed loans, including those managed loans that were delinquent as of March 31, 2012 andDecember 31, 2011.
As of
March 31, 2012 December 31, 2011
Unpaid PrincipalBalance
Principal Amount ofDelinquent Loans(1)
Unpaid PrincipalBalance
Principal Amount ofDelinquent Loans(1)
(Dollars in millions)
Loans held for investmentOf Fannie Mae . . . . . . . . . . . . . . . . . $ 392,988 $115,708 $ 396,276 $122,392Of consolidated trusts . . . . . . . . . . . . 2,591,235 20,018 2,570,339 24,893
Loans held for sale . . . . . . . . . . . . . . . . 283 60 312 57Securitized loans . . . . . . . . . . . . . . . . . 2,307 72 2,273 71
Total loans managed . . . . . . . . . . . . $2,986,813 $135,858 $2,969,200 $147,413
(1) Represents the unpaid principal balance of loans held for investment, loans held for sale and securitized loans for whichwe are no longer accruing interest and loans 90 days or more delinquent which are continuing to accrue interest.
Qualifying Sales of Portfolio Securitizations
The majority of our portfolio securitization transactions do not qualify for sale treatment, as we consolidate thesubstantial majority of our single-class MBS trusts. We report assets and liabilities of consolidated trusts createdvia portfolio securitization transactions that do not qualify as sales in our condensed consolidated balance sheets.
93

FANNIE MAE(In conservatorship)
NOTES TO CONDENSED CONSOLIDATED FINANCIAL STATEMENTS—(Continued)(UNAUDITED)
We recognize assets obtained and liabilities incurred in qualifying sales of portfolio securitizations at fair value.Proceeds from the initial sale of securities from portfolio securitizations were $133 million and $108 million forthe three months ended March 31, 2012 and 2011, respectively. Our continuing involvement in the form ofguaranty assets and guaranty liabilities with assets that were transferred into unconsolidated trusts is not materialto our condensed consolidated financial statements.
Other Securitizations
We also completed other portfolio securitization transactions that did not qualify as sales during the three monthsended March 31, 2012 and were accounted for as secured borrowings. Proceeds from these transactions were$421 million and were recorded as long-term debt of Fannie Mae in our condensed consolidated balance sheet.As of March 31, 2012, the fair value of trading securities underlying these transactions was $213 million, and theunpaid principal balance of mortgage loans of consolidated trusts underlying these transactions was $239 million.The related assets have been transferred to MBS trusts and are restricted solely for the purpose of servicing therelated MBS. We did not complete any securitizations of this type during the first quarter of 2011.
3. Mortgage Loans
The following table displays our mortgage loans as of March 31, 2012 and December 31, 2011.
As of
March 31, 2012 December 31, 2011
OfFannie
Mae
OfConsolidated
Trusts Total
OfFannie
Mae
OfConsolidated
Trusts Total
(Dollars in millions)
Single-family . . . . . . . . . . . . . . . . $320,635 $2,485,077 $2,805,712 $319,496 $2,470,533 $2,790,029Multifamily . . . . . . . . . . . . . . . . . 72,580 106,214 178,794 77,026 99,872 176,898
Total unpaid principal balanceof mortgage loans . . . . . . . . 393,215 2,591,291 2,984,506 396,522 2,570,405 2,966,927
Cost basis and fair valueadjustments, net . . . . . . . . . . . . (15,958) 25,286 9,328 (16,143) 19,993 3,850
Allowance for loan losses forloans held for investment . . . . . (57,001) (13,108) (70,109) (57,309) (14,847) (72,156)
Total mortgage loans . . . . . . $320,256 $2,603,469 $2,923,725 $323,070 $2,575,551 $2,898,621
During the three months ended March 31, 2012, we did not redesignate any loans from held for investment(“HFI”) to held for sale (“HFS”). During the three months ended March 31, 2011, we redesignated loans with acarrying value of $561 million from HFI to HFS.
Nonaccrual Loans
We discontinue accruing interest on loans when we believe collectibility of principal or interest is not reasonablyassured, which for single-family loans we have determined, based on our historical experience, to be when theloan becomes two months or more past due according to its contractual terms. We generally place multifamilyloans on nonaccrual status when the loan is deemed to be individually impaired, unless the loan is well securedsuch that collectibility of principal and accrued interest is reasonably assured.
When a loan is placed on nonaccrual status, interest previously accrued but not collected becomes part of ourrecorded investment in the loan and is collectively reviewed for impairment. For single-family loans, we
94

FANNIE MAE(In conservatorship)
NOTES TO CONDENSED CONSOLIDATED FINANCIAL STATEMENTS—(Continued)(UNAUDITED)
recognize interest income for loans on nonaccrual status when cash is received. For multifamily loans, we applyany payment received on a cost recovery basis to reduce principal on the mortgage loan unless the loan isdetermined to be well secured.
We return a single-family loan to accrual status at the point that the borrower has made sufficient payments toreduce their delinquency below our nonaccrual threshold. For modified single-family loans, the loan is notreturned to accrual status until the borrower successfully makes all required payments during the trial period(generally three to four months) and the modification is made permanent. We generally return a multifamily loanto accrual status when the borrower cures the delinquency of the loan or we otherwise determine that the loan iswell secured such that collectibility is reasonably assured.
Aging Analysis
The following tables display an aging analysis of the total recorded investment in our HFI mortgage loans,excluding loans for which we have elected the fair value option, by portfolio segment and class as of March 31,2012 and December 31, 2011.
As of March 31, 2012(1)
30 - 59 DaysDelinquent
60 - 89 DaysDelinquent
SeriouslyDelinquent(2)
TotalDelinquent Current Total
RecordedInvestment
in Loans90 Daysor More
Delinquentand
AccruingInterest
RecordedInvestment
inNonaccrual
Loans
(Dollars in millions)Single-family:
Primary(3) . . . . . . . . . . . $36,041 $12,415 $ 76,561 $125,017 $2,385,647 $2,510,664 $102 $ 88,813Government(4) . . . . . . . . 85 35 330 450 51,373 51,823 330 —Alt-A . . . . . . . . . . . . . . . 6,141 2,572 26,427 35,140 136,578 171,718 15 28,978Other(5) . . . . . . . . . . . . . 2,732 1,153 10,510 14,395 71,228 85,623 85 11,505
Total single-family . . 44,999 16,175 113,828 175,002 2,644,826 2,819,828 532 129,296Multifamily(6) . . . . . . . . . . 159 NA 707 866 180,359 181,225 1 2,059
Total . . . . . . . . . $45,158 $16,175 $114,535 $175,868 $2,825,185 $3,001,053 $533 $131,355
As of December 31, 2011(1)
30 - 59 DaysDelinquent
60 - 89 DaysDelinquent
SeriouslyDelinquent(2)
TotalDelinquent Current Total
RecordedInvestment
in Loans90 Daysor More
Delinquentand
AccruingInterest
RecordedInvestment
inNonaccrual
Loans
(Dollars in millions)Single-family:
Primary(3) . . . . . . . . . . . $43,516 $15,282 $ 80,712 $139,510 $2,341,646 $2,481,156 $111 $ 95,959Government(4) . . . . . . . . 109 49 327 485 51,391 51,876 327 —Alt-A . . . . . . . . . . . . . . . 7,155 3,054 28,323 38,532 138,880 177,412 14 31,356Other(5) . . . . . . . . . . . . . 3,403 1,431 11,277 16,111 73,115 89,226 96 12,533
Total single-family . . 54,183 19,816 120,639 194,638 2,605,032 2,799,670 548 139,848Multifamily(6) . . . . . . . . . . 210 NA 1,105 1,315 177,906 179,221 — 2,764
Total . . . . . . . . . $54,393 $19,816 $121,744 $195,953 $2,782,938 $2,978,891 $548 $142,612
95

FANNIE MAE(In conservatorship)
NOTES TO CONDENSED CONSOLIDATED FINANCIAL STATEMENTS—(Continued)(UNAUDITED)
(1) Recorded investment consists of unpaid principal balance, unamortized premiums, discounts and other cost basisadjustments, and accrued interest receivable.
(2) Single-family seriously delinquent loans are loans that are 90 days or more past due or in the foreclosure process.Multifamily seriously delinquent loans are loans that are 60 days or more past due.
(3) Consists of mortgage loans that are not included in other loan classes.(4) Consists of mortgage loans guaranteed or insured, in whole or in part, by the U.S. government or one of its agencies that
are not Alt-A. Primarily consists of reverse mortgages which due to their nature are not aged and are included in thecurrent column.
(5) Includes loans with higher-risk loan characteristics, such as interest-only loans and negative-amortizing loans that areneither government nor Alt-A.
(6) Multifamily loans 60-89 days delinquent are included in the seriously delinquent column.
Credit Quality Indicators
The following table displays the total recorded investment in our single-family HFI loans, excluding loans forwhich we have elected the fair value option, by class and credit quality indicator as of March 31, 2012 andDecember 31, 2011. The single-family credit quality indicator is updated quarterly.
As of
March 31, 2012(1)(2) December 31, 2011(1)(2)
Primary(3) Alt-A Other(4) Primary(3) Alt-A Other(4)
(Dollars in millions)Estimated mark-to-market LTV ratio:(5)
Less than or equal to 80% . . . . . . . . . . . . . . . . . . . . . . . . $1,440,871 $ 57,093 $21,777 $1,464,348 $ 61,618 $23,414Greater than 80% and less than or equal to 90% . . . . . . 424,475 20,019 8,251 412,342 21,369 9,224Greater than 90% and less than or equal to 100% . . . . . 263,111 18,713 8,657 246,648 19,790 9,445Greater than 100% and less than or equal to 110% . . . . 138,458 16,042 8,364 128,428 16,164 8,951Greater than 110% and less than or equal to 120% . . . . 79,367 12,759 7,703 73,836 12,534 7,912Greater than 120% and less than or equal to 125% . . . . 27,927 5,261 3,513 25,750 5,087 3,557Greater than 125% . . . . . . . . . . . . . . . . . . . . . . . . . . . . . 136,455 41,831 27,358 129,804 40,850 26,723
Total . . . . . . . . . . . . . . . . . . . . . . . . . . . . . . . . . . . . . . $2,510,664 $171,718 $85,623 $2,481,156 $177,412 $89,226
(1) Recorded investment consists of unpaid principal balance, unamortized premiums, discounts and other cost basisadjustments, and accrued interest receivable.
(2) Excludes $51.8 billion and $51.9 billion as of March 31, 2012 and December 31, 2011, respectively, of mortgage loansguaranteed or insured, in whole or in part, by the U.S. government or one of its agencies that are not Alt-A loans. Thesegment class is primarily reverse mortgages for which we do not calculate an estimated mark-to-market LTV.
(3) Consists of mortgage loans that are not included in other loan classes.(4) Includes loans with higher-risk loan characteristics, such as interest-only loans and negative-amortizing loans that are
neither government nor Alt-A.(5) The aggregate estimated mark-to-market LTV ratio is based on the unpaid principal balance of the loan as of the end of
each reported period divided by the estimated current value of the property, which we calculate using an internal valuationmodel that estimates periodic changes in home value.
96
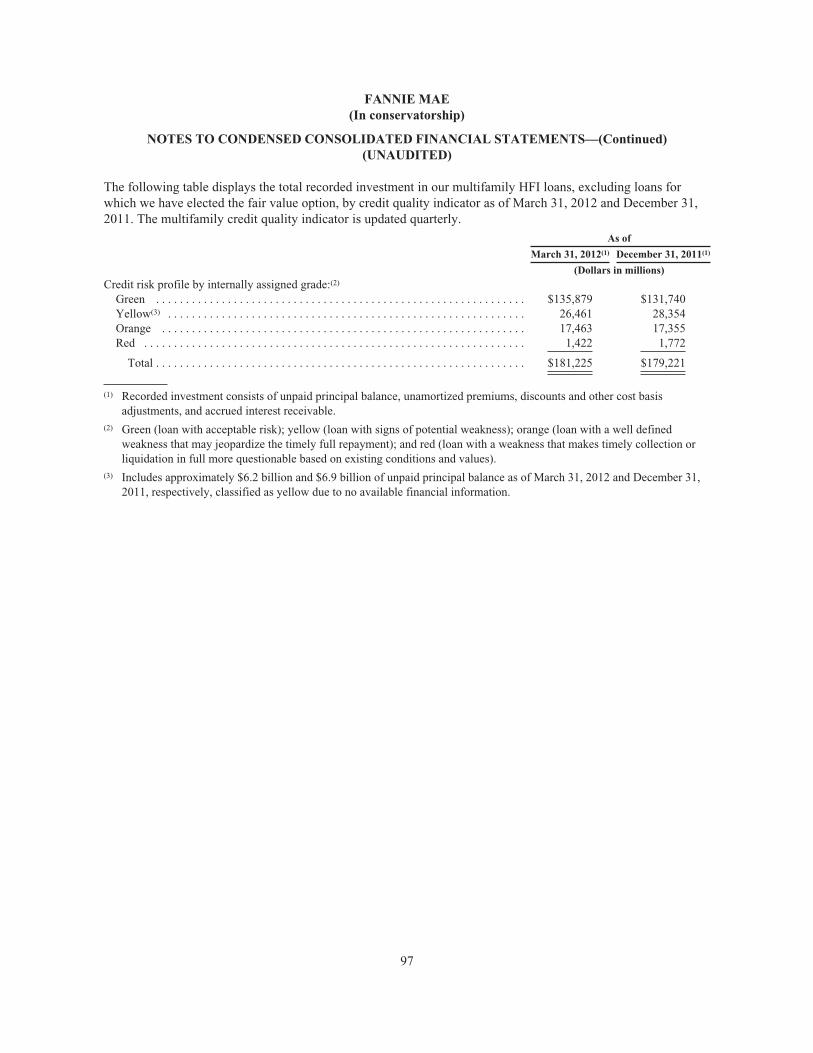
FANNIE MAE(In conservatorship)
NOTES TO CONDENSED CONSOLIDATED FINANCIAL STATEMENTS—(Continued)(UNAUDITED)
The following table displays the total recorded investment in our multifamily HFI loans, excluding loans forwhich we have elected the fair value option, by credit quality indicator as of March 31, 2012 and December 31,2011. The multifamily credit quality indicator is updated quarterly.
As of
March 31, 2012(1) December 31, 2011(1)
(Dollars in millions)Credit risk profile by internally assigned grade:(2)
Green . . . . . . . . . . . . . . . . . . . . . . . . . . . . . . . . . . . . . . . . . . . . . . . . . . . . . . . . . . . . . . $135,879 $131,740Yellow(3) . . . . . . . . . . . . . . . . . . . . . . . . . . . . . . . . . . . . . . . . . . . . . . . . . . . . . . . . . . . . 26,461 28,354Orange . . . . . . . . . . . . . . . . . . . . . . . . . . . . . . . . . . . . . . . . . . . . . . . . . . . . . . . . . . . . . 17,463 17,355Red . . . . . . . . . . . . . . . . . . . . . . . . . . . . . . . . . . . . . . . . . . . . . . . . . . . . . . . . . . . . . . . . 1,422 1,772
Total . . . . . . . . . . . . . . . . . . . . . . . . . . . . . . . . . . . . . . . . . . . . . . . . . . . . . . . . . . . . . . $181,225 $179,221
(1) Recorded investment consists of unpaid principal balance, unamortized premiums, discounts and other cost basisadjustments, and accrued interest receivable.
(2) Green (loan with acceptable risk); yellow (loan with signs of potential weakness); orange (loan with a well definedweakness that may jeopardize the timely full repayment); and red (loan with a weakness that makes timely collection orliquidation in full more questionable based on existing conditions and values).
(3) Includes approximately $6.2 billion and $6.9 billion of unpaid principal balance as of March 31, 2012 and December 31,2011, respectively, classified as yellow due to no available financial information.
97

FANNIE MAE(In conservatorship)
NOTES TO CONDENSED CONSOLIDATED FINANCIAL STATEMENTS—(Continued)(UNAUDITED)
Individually Impaired Loans
Individually impaired loans include TDRs, acquired credit-impaired loans, and other multifamily loans regardlessof whether we are currently accruing interest. The following tables display the total recorded investment, unpaidprincipal balance, and related allowance as of March 31, 2012 and December 31, 2011 and interest incomerecognized and average recorded investment for the three months ended March 31, 2012 and 2011 forindividually impaired loans.
As of
March 31, 2012 December 31, 2011
UnpaidPrincipalBalance
TotalRecorded
Investment(1)
RelatedAllowance
forLoan
Losses
RelatedAllowance for
AccruedInterest
Receivable
UnpaidPrincipalBalance
TotalRecorded
Investment(1)
RelatedAllowance
forLoan
Losses
RelatedAllowance for
AccruedInterest
Receivable
(Dollars in millions)Individually impaired loans:
With related allowance recorded:
Single-family:
Primary(2) . . . . . . . . . . . . . . . . . . $118,225 $110,913 $29,927 $610 $116,825 $109,684 $29,598 $ 674
Government(3) . . . . . . . . . . . . . . 263 264 76 9 258 258 67 8
Alt-A . . . . . . . . . . . . . . . . . . . . 34,511 31,633 11,140 239 34,318 31,516 11,121 268
Other(4) . . . . . . . . . . . . . . . . . . . 16,102 15,270 5,300 87 16,181 15,363 5,353 99
Total single-family . . . . . . . . 169,101 158,080 46,443 945 167,582 156,821 46,139 1,049
Multifamily . . . . . . . . . . . . . . . . . 2,478 2,504 557 15 2,832 2,855 718 32
Total individually impaired loanswith related allowancerecorded . . . . . . . . . . . . . . . . . . 171,579 160,584 47,000 960 170,414 159,676 46,857 1,081
With no related allowance recorded:(5)
Single-family:
Primary(2) . . . . . . . . . . . . . . . . . . 9,171 6,535 — — 9,370 6,471 — —
Government(3) . . . . . . . . . . . . . . 28 21 — — 25 17 — —
Alt-A . . . . . . . . . . . . . . . . . . . . 2,928 1,523 — — 3,056 1,538 — —
Other(4) . . . . . . . . . . . . . . . . . . . 650 363 — — 680 367 — —
Total single-family . . . . . . . . 12,777 8,442 — — 13,131 8,393 — —
Multifamily . . . . . . . . . . . . . . . . . 1,648 1,661 — — 1,759 1,771 — —
Total individually impaired loanswith no related allowancerecorded . . . . . . . . . . . . . . . . . . 14,425 10,103 — — 14,890 10,164 — —
Total individually impaired loans(6) . . $186,004 $170,687 $47,000 $960 $185,304 $169,840 $46,857 $1,081
98

FANNIE MAE(In conservatorship)
NOTES TO CONDENSED CONSOLIDATED FINANCIAL STATEMENTS—(Continued)(UNAUDITED)
For the Three Months Ended March 31,
2012 2011
AverageRecorded
Investment
Total InterestIncome
Recognized(7)
Interest IncomeRecognized ona Cash Basis
Average RecordedInvestment
Total InterestIncome
Recognized(7)
Interest IncomeRecognized ona Cash Basis
(Dollars in millions)Individually impaired loans:
With related allowance recorded:
Single-family:
Primary(2) . . . . . . . . . . . . . . . . $109,970 $ 973 $173 $ 95,087 $ 904 $ 41
Government(3) . . . . . . . . . . . . 260 3 — 232 3 —
Alt-A . . . . . . . . . . . . . . . . . . 31,509 253 39 28,567 242 2
Other(4) . . . . . . . . . . . . . . . . . 15,255 110 18 13,889 106 6
Total single-family . . . . . . 156,994 1,339 230 137,775 1,255 49
Multifamily . . . . . . . . . . . . . . . 2,673 31 — 2,202 25 1
Total individually impairedloans with related allowancerecorded 159,667 1,370 230 139,977 1,280 50
Withno related allowance recorded:(5)
Single-family:
Primary(2) . . . . . . . . . . . . . . . . 6,608 184 54 7,139 108 57
Government(3) . . . . . . . . . . . . 20 2 — 12 1 —
Alt-A . . . . . . . . . . . . . . . . . . 1,558 51 15 1,863 33 19
Other(4) . . . . . . . . . . . . . . . . . 374 19 7 513 8 4
Total single-family . . . . . . 8,560 256 76 9,527 150 80
Multifamily . . . . . . . . . . . . . . . 1,714 21 1 754 15 3
Total individually impairedloans with no relatedallowance recorded . . . . . . . 10,274 277 77 10,281 165 83
Total individually impaired loans . . $169,941 $1,647 $307 $150,258 $1,445 $133
(1) Recorded investment consists of unpaid principal balance, unamortized premiums, discounts and other cost basisadjustments, and accrued interest receivable.
(2) Consists of mortgage loans that are not included in other loan classes.(3) Consists of mortgage loans guaranteed or insured, in whole or in part, by the U.S. government or one of its agencies that
are not Alt-A.(4) Includes loans with higher-risk characteristics, such as interest-only loans and negative-amortizing loans that are neither
government nor Alt-A.(5) The discounted cash flows or collateral value equals or exceeds the carrying value of the loan and, as such, no valuation
allowance is required.(6) Includes single-family loans restructured in a TDR with a recorded investment of $163.5 billion and $161.9 billion as of
March 31, 2012 and December 31, 2011, respectively. Includes multifamily loans restructured in a TDR with a recordedinvestment of $992 million and $956 million as of March 31, 2012 and December 31, 2011, respectively.
(7) Total single-family interest income recognized of $1.6 billion for the three months ended March 31, 2012 consists of $1.2billion of contractual interest and $387 million of effective yield adjustments. Total single-family interest incomerecognized of $1.4 billion for the three months ended March 31, 2011 consists of $1.1 billion of contractual interest and$352 million of effective yield adjustments.
99
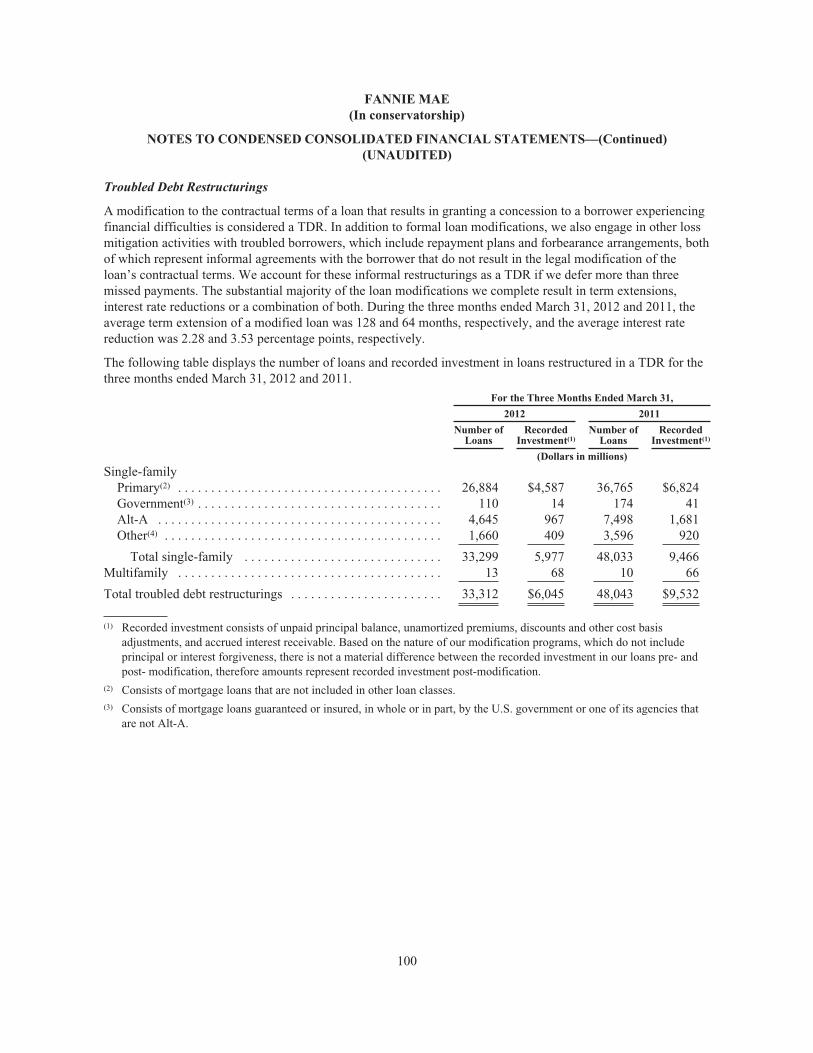
FANNIE MAE(In conservatorship)
NOTES TO CONDENSED CONSOLIDATED FINANCIAL STATEMENTS—(Continued)(UNAUDITED)
Troubled Debt Restructurings
A modification to the contractual terms of a loan that results in granting a concession to a borrower experiencingfinancial difficulties is considered a TDR. In addition to formal loan modifications, we also engage in other lossmitigation activities with troubled borrowers, which include repayment plans and forbearance arrangements, bothof which represent informal agreements with the borrower that do not result in the legal modification of theloan’s contractual terms. We account for these informal restructurings as a TDR if we defer more than threemissed payments. The substantial majority of the loan modifications we complete result in term extensions,interest rate reductions or a combination of both. During the three months ended March 31, 2012 and 2011, theaverage term extension of a modified loan was 128 and 64 months, respectively, and the average interest ratereduction was 2.28 and 3.53 percentage points, respectively.
The following table displays the number of loans and recorded investment in loans restructured in a TDR for thethree months ended March 31, 2012 and 2011.
For the Three Months Ended March 31,
2012 2011
Number ofLoans
RecordedInvestment(1)
Number ofLoans
RecordedInvestment(1)
(Dollars in millions)
Single-familyPrimary(2) . . . . . . . . . . . . . . . . . . . . . . . . . . . . . . . . . . . . . . . . 26,884 $4,587 36,765 $6,824Government(3) . . . . . . . . . . . . . . . . . . . . . . . . . . . . . . . . . . . . . 110 14 174 41Alt-A . . . . . . . . . . . . . . . . . . . . . . . . . . . . . . . . . . . . . . . . . . . 4,645 967 7,498 1,681Other(4) . . . . . . . . . . . . . . . . . . . . . . . . . . . . . . . . . . . . . . . . . . 1,660 409 3,596 920
Total single-family . . . . . . . . . . . . . . . . . . . . . . . . . . . . . . 33,299 5,977 48,033 9,466Multifamily . . . . . . . . . . . . . . . . . . . . . . . . . . . . . . . . . . . . . . . . 13 68 10 66
Total troubled debt restructurings . . . . . . . . . . . . . . . . . . . . . . . 33,312 $6,045 48,043 $9,532
(1) Recorded investment consists of unpaid principal balance, unamortized premiums, discounts and other cost basisadjustments, and accrued interest receivable. Based on the nature of our modification programs, which do not includeprincipal or interest forgiveness, there is not a material difference between the recorded investment in our loans pre- andpost- modification, therefore amounts represent recorded investment post-modification.
(2) Consists of mortgage loans that are not included in other loan classes.(3) Consists of mortgage loans guaranteed or insured, in whole or in part, by the U.S. government or one of its agencies that
are not Alt-A.
100

FANNIE MAE(In conservatorship)
NOTES TO CONDENSED CONSOLIDATED FINANCIAL STATEMENTS—(Continued)(UNAUDITED)
(4) Includes loans with higher-risk characteristics, such as interest-only loans and negative-amortizing loans that are neithergovernment nor Alt-A.
The following table displays the number of loans and recorded investment in loans that had a payment default forthe three months ended March 31, 2012 and 2011 and were modified in a TDR in the twelve months prior to thepayment default. For purposes of this disclosure, we define loans that had a payment default as single-family andmultifamily loans with completed TDRs that liquidated during the period, either through foreclosure,deed-in-lieu of foreclosure or a short sale, single-family loans with completed modifications that are two or moremonths delinquent during the period or multifamily loans with completed modifications that are one or moremonths delinquent during the period.
For the Three Months Ended March 31,
2012 2011
Number ofLoans
RecordedInvestment(1)
Number ofLoans
RecordedInvestment(1)
(Dollars in millions)
Single-family
Primary(2) . . . . . . . . . . . . . . . . . . . . . . . . . . . . . . . . . . . . . . . . . . . . . . 11,872 $2,074 21,946 $3,874
Government(3) . . . . . . . . . . . . . . . . . . . . . . . . . . . . . . . . . . . . . . . . . . 50 10 78 21
Alt-A . . . . . . . . . . . . . . . . . . . . . . . . . . . . . . . . . . . . . . . . . . . . . . . . . 2,243 466 5,009 1,066
Other(4) . . . . . . . . . . . . . . . . . . . . . . . . . . . . . . . . . . . . . . . . . . . . . . . . 1,195 288 2,192 530
Total single-family . . . . . . . . . . . . . . . . . . . . . . . . . . . . . . . . . . . . 15,360 2,838 29,225 5,491
Multifamily . . . . . . . . . . . . . . . . . . . . . . . . . . . . . . . . . . . . . . . . . . . . . . 1 2 3 24
Total TDRs that subsequently defaulted . . . . . . . . . . . . . . . . . . . . . . . 15,361 $2,840 29,228 $5,515
(1) Recorded investment consists of unpaid principal balance, unamortized premiums, discounts and other cost basisadjustments, and accrued interest receivable. Represents our recorded investment in the loan at time of payment default.
(2) Consists of mortgage loans that are not included in other loan classes.
(3) Consists of mortgage loans guaranteed or insured, in whole or in part, by the U.S. government or one of its agencies thatare not Alt-A.
(4) Includes loans with higher-risk characteristics, such as interest-only loans and negative-amortizing loans that are neithergovernment nor Alt-A.
4. Allowance for Loan Losses
Our allowance for loan losses is a valuation allowance that reflects an estimate of incurred credit losses related toour recorded investment in both single-family and multifamily HFI loans. This population includes both HFIloans held by Fannie Mae and by consolidated Fannie Mae MBS trusts. When calculating our loan lossallowance, we consider only our net recorded investment in the loan at the balance sheet date, which includes theloan’s unpaid principal balance and accrued interest recognized while the loan was on accrual status and anyapplicable cost basis adjustments. We record charge-offs as a reduction to the allowance for loan losses whenlosses are confirmed through the receipt of assets in full satisfaction of a loan, such as the underlying collateralupon foreclosure or cash upon completion of a short sale.
We aggregate single-family HFI loans that are not individually impaired based on similar risk characteristics, forpurposes of estimating incurred credit losses and establish a collective single-family loss reserve using aneconometric model that derives an overall loss reserve estimate. We base our allowance and reserve methodology
101

FANNIE MAE(In conservatorship)
NOTES TO CONDENSED CONSOLIDATED FINANCIAL STATEMENTS—(Continued)(UNAUDITED)
on historical events and trends, such as loss severity (in event of default), default rates, and recoveries frommortgage insurance contracts and other credit enhancements. In addition, management performs a review of theobservable data used in its estimate to ensure it is representative of prevailing economic conditions and otherevents existing as of the balance sheet date.
Individually impaired single-family loans currently include those restructured in a TDR and acquired credit-impaired loans. When a loan has been restructured, we measure impairment using a cash flow analysisdiscounted at the loan’s original effective interest rate. However, if we expect to recover our recorded investmentin an individually impaired loan through probable foreclosure of the underlying collateral, we measureimpairment based on the fair value of the collateral, reduced by estimated disposal costs and adjusted forestimated proceeds from mortgage, flood, or hazard insurance or similar sources.
We identify multifamily loans for evaluation for impairment through a credit risk assessment process. Based onthis evaluation, we determine for loans that are not in homogeneous pools whether or not a loan is individuallyimpaired. If we determine that a multifamily loan is individually impaired, we generally measure impairment onthat loan based on the fair value of the underlying collateral less estimated costs to sell the property. If wedetermine that an individual loan that was specifically evaluated for impairment is not individually impaired, weinclude the loan as part of a pool of loans with similar characteristics that are evaluated collectively for incurredlosses.
102

FANNIE MAE(In conservatorship)
NOTES TO CONDENSED CONSOLIDATED FINANCIAL STATEMENTS—(Continued)(UNAUDITED)
The following table displays changes in our single-family, multifamily, and total allowance for loan losses for thethree months ended March 31, 2012 and 2011.
For the Three Months Ended March 31,
2012 2011
OfFannie
Mae
OfConsolidated
Trusts Total
OfFannie
Mae
OfConsolidated
Trusts Total
(Dollars in millions)
Single-family allowance for loan losses(1):Beginning balance . . . . . . . . . . . . . . . . . . . $56,294 $14,339 $70,633 $47,377 $12,603 $59,980
Provision for loan losses(2) . . . . . . . . . . . 1,400 620 2,020 7,243 3,369 10,612Charge-offs(3)(4) . . . . . . . . . . . . . . . . . . . (4,404) (263) (4,667) (5,623) (448) (6,071)Recoveries . . . . . . . . . . . . . . . . . . . . . . . 421 65 486 530 952 1,482Transfers(5) . . . . . . . . . . . . . . . . . . . . . . . 2,193 (2,193) — 3,162 (3,162) —Other(6) . . . . . . . . . . . . . . . . . . . . . . . . . . 204 62 266 (18) 99 81
Ending balance . . . . . . . . . . . . . . . . . . . . . $56,108 $12,630 $68,738 $52,671 $13,413 $66,084
Multifamily allowance for loan losses:Beginning balance . . . . . . . . . . . . . . . . . . . $ 1,015 $ 508 $ 1,523 $ 1,153 $ 423 $ 1,576
(Benefit) provision for loan losses(2) . . . (17) (23) (40) (84) 59 (25)Charge-offs(3)(4) . . . . . . . . . . . . . . . . . . . (129) — (129) (82) — (82)Transfers(5) . . . . . . . . . . . . . . . . . . . . . . . 8 (8) — 45 (45) —Other(6) . . . . . . . . . . . . . . . . . . . . . . . . . . 16 1 17 5 (1) 4
Ending balance . . . . . . . . . . . . . . . . . . . . . $ 893 $ 478 $ 1,371 $ 1,037 $ 436 $ 1,473
Total allowance for loan losses(1):Beginning balance . . . . . . . . . . . . . . . . . . . $57,309 $14,847 $72,156 $48,530 $13,026 $61,556
Provision for loan losses(2) . . . . . . . . . . . 1,383 597 1,980 7,159 3,428 10,587Charge-offs(3)(4) . . . . . . . . . . . . . . . . . . . (4,533) (263) (4,796) (5,705) (448) (6,153)Recoveries . . . . . . . . . . . . . . . . . . . . . . . 421 65 486 530 952 1,482Transfers(5) . . . . . . . . . . . . . . . . . . . . . . . 2,201 (2,201) — 3,207 (3,207) —Other(6) . . . . . . . . . . . . . . . . . . . . . . . . . . 220 63 283 (13) 98 85
Ending balance(7) . . . . . . . . . . . . . . . . . . . . $57,001 $13,108 $70,109 $53,708 $13,849 $67,557
(1) Includes an out-of-period adjustment of $548 million to increase the provision for loan losses for the three months endedMarch 31, 2012.
(2) Provision for loan losses is included in provision for credit losses in our condensed consolidated statements of operationsand comprehensive income (loss).
(3) While we purchase the substantial majority of loans that are four or more months delinquent from our MBS trusts, we donot exercise this option to purchase loans during a forbearance period. Accordingly, charge-offs of consolidated trustsgenerally represent loans that remained in our consolidated trusts at the time of default.
(4) Single-family charge-offs include accrued interest of $258 million and $377 million for the three months ended March 31,2012 and 2011, respectively. Multifamily charge-offs include accrued interest of $15 million and $9 million for the threemonths ended March 31, 2012 and 2011, respectively. Total charge-offs include accrued interest of $273 million and $386million for the three months ended March 31, 2012 and 2011, respectively.
(5) Includes transfers from trusts for delinquent loan purchases.
103

FANNIE MAE(In conservatorship)
NOTES TO CONDENSED CONSOLIDATED FINANCIAL STATEMENTS—(Continued)(UNAUDITED)
(6) Amounts represent the net activity recorded in our allowances for accrued interest receivable and preforeclosure propertytaxes and insurance receivable from borrowers. The provision for loan losses, charge-offs, recoveries and transfer activityincluded in this table reflects all changes for both the allowance for loan losses and the valuation allowances for accruedinterest and preforeclosure property taxes and insurance receivable that relate to the mortgage loans.
(7) Total allowance for loan losses includes $353 million and $412 million as of March 31, 2012 and 2011, respectively, foracquired credit-impaired loans.
As of March 31, 2012, the allowance for accrued interest receivable for loans of Fannie Mae was $1.9 billion andfor loans of consolidated trusts was $273 million. As of December 31, 2011, the allowance for accrued interestreceivable for loans of Fannie Mae was $2.2 billion and for loans of consolidated trusts was $336 million.
The following table displays the allowance for loan losses and total recorded investment in our HFI loans,excluding loans for which we have elected the fair value option, by impairment or reserve methodology andportfolio segment as of March 31, 2012 and December 31, 2011.
As of
March 31, 2012 December 31, 2011
Single-Family Multifamily Total
Single-Family Multifamily Total
(Dollars in millions)
Allowance for loan losses by segment:
Individually impaired loans $ 46,091 $ 556 $ 46,647 $ 45,765 $ 717 $ 46,482
Collectively reserved loans 22,295 814 23,109 24,494 805 25,299
Acquired credit-impaired loans 352 1 353 374 1 375
Total allowance for loan losses $ 68,738 $ 1,371 $ 70,109 $ 70,633 $ 1,523 $ 72,156
Recorded investment in loans by segment:(1)
Individually impaired loans $ 163,487 $ 4,121 $ 167,608 $ 161,942 $ 4,579 $ 166,521
Collectively reserved loans 2,653,306 177,060 2,830,366 2,634,456 174,595 2,809,051
Acquired credit-impaired loans 3,035 44 3,079 3,272 47 3,319
Total recorded investment in loans $2,819,828 $181,225 $3,001,053 $2,799,670 $179,221 $2,978,891
(1) Recorded investment consists of unpaid principal balance, unamortized premiums, discounts and other cost basisadjustments, and accrued interest receivable.
104

FANNIE MAE(In conservatorship)
NOTES TO CONDENSED CONSOLIDATED FINANCIAL STATEMENTS—(Continued)(UNAUDITED)
5. Investments in Securities
Trading Securities
Trading securities are recorded at fair value with subsequent changes in fair value recorded as “Fair value gains,net” in our condensed consolidated statements of operations and comprehensive income (loss). The followingtable displays our investments in trading securities as of March 31, 2012 and December 31, 2011.
As of
March 31,2012
December 31,2011
(Dollars in millions)
Mortgage-related securities:Fannie Mae . . . . . . . . . . . . . . . . . . . . . . . . . . . . . . . . . . . . . . . . . . . . . . . . . $ 7,168 $ 7,424Freddie Mac . . . . . . . . . . . . . . . . . . . . . . . . . . . . . . . . . . . . . . . . . . . . . . . . 2,575 2,732Ginnie Mae . . . . . . . . . . . . . . . . . . . . . . . . . . . . . . . . . . . . . . . . . . . . . . . . . 286 287Alt-A private-label securities . . . . . . . . . . . . . . . . . . . . . . . . . . . . . . . . . . . 1,338 1,349Subprime private-label securities . . . . . . . . . . . . . . . . . . . . . . . . . . . . . . . . 1,305 1,280CMBS . . . . . . . . . . . . . . . . . . . . . . . . . . . . . . . . . . . . . . . . . . . . . . . . . . . . . 10,417 10,411Mortgage revenue bonds . . . . . . . . . . . . . . . . . . . . . . . . . . . . . . . . . . . . . . 668 724Other mortgage-related securities . . . . . . . . . . . . . . . . . . . . . . . . . . . . . . . . 123 143
Total . . . . . . . . . . . . . . . . . . . . . . . . . . . . . . . . . . . . . . . . . . . . . . . . . . . . 23,880 24,350
Non-mortgage-related securities:U.S. Treasury securities . . . . . . . . . . . . . . . . . . . . . . . . . . . . . . . . . . . . . . . 50,030 47,737Asset-backed securities . . . . . . . . . . . . . . . . . . . . . . . . . . . . . . . . . . . . . . . 1,896 2,111
Total . . . . . . . . . . . . . . . . . . . . . . . . . . . . . . . . . . . . . . . . . . . . . . . . . . . . 51,926 49,848
Total trading securities . . . . . . . . . . . . . . . . . . . . . . . . . . . . . . . . . . . . . . . . . . $75,806 $74,198
The following table displays information about our net trading gains and losses for the three months endedMarch 31, 2012 and 2011.
For the Three MonthsEnded March 31,
2012 2011
(Dollars in millions)
Net trading gains (losses):Mortgage-related securities . . . . . . . . . . . . . . . . . . . . . . . . . . . . . . . . . . . . . . . $296 $229Non-mortgage-related securities . . . . . . . . . . . . . . . . . . . . . . . . . . . . . . . . . . . (12) (4)
Total . . . . . . . . . . . . . . . . . . . . . . . . . . . . . . . . . . . . . . . . . . . . . . . . . . . . . . . $284 $225
Net trading gains (losses) recorded in the period related to securities still heldat period end:Mortgage-related securities . . . . . . . . . . . . . . . . . . . . . . . . . . . . . . . . . . . . . . . $331 $222Non-mortgage-related securities . . . . . . . . . . . . . . . . . . . . . . . . . . . . . . . . . . . (12) (5)
Total . . . . . . . . . . . . . . . . . . . . . . . . . . . . . . . . . . . . . . . . . . . . . . . . . . . . . . . $319 $217
105

FANNIE MAE(In conservatorship)
NOTES TO CONDENSED CONSOLIDATED FINANCIAL STATEMENTS—(Continued)(UNAUDITED)
Available-for-Sale Securities
We measure available-for-sale (“AFS”) securities at fair value with unrealized gains and losses recorded as acomponent of “Other comprehensive income,” net of tax, and we record realized gains and losses from the saleof AFS securities in “Investment gains, net” in our condensed consolidated statements of operations andcomprehensive income (loss).
The following table displays the gross realized gains, losses and proceeds on sales of AFS securities for the threemonths ended March 31, 2012 and 2011.
For the ThreeMonths Ended
March 31,
2012 2011
(Dollars in millions)Gross realized gains . . . . . . . . . . . . . . . . . . . . . . . . . . . . . . . . . . . . . . . . . . . . . . . . . . . . . . . . . $ 18 $ 60Gross realized losses . . . . . . . . . . . . . . . . . . . . . . . . . . . . . . . . . . . . . . . . . . . . . . . . . . . . . . . . 9 6Total proceeds(1) . . . . . . . . . . . . . . . . . . . . . . . . . . . . . . . . . . . . . . . . . . . . . . . . . . . . . . . . . . . . 268 390
(1) Excludes proceeds from the initial sale of securities from new portfolio securitizations included in “Note 2, Consolidationsand Transfers of Financial Assets.”
The following table displays the amortized cost, gross unrealized gains and losses, and fair value by majorsecurity type for AFS securities we held as of March 31, 2012 and December 31, 2011.
As of March 31, 2012
TotalAmortized
Cost(1)
GrossUnrealized
Gains
GrossUnrealized
Losses -OTTI(2)
GrossUnrealized
Losses -Other(3)
TotalFair
Value
(Dollars in millions)Fannie Mae . . . . . . . . . . . . . . . . . . . . . . . . . . $13,501 $1,141 $ (2) $ (15) $14,625Freddie Mac . . . . . . . . . . . . . . . . . . . . . . . . . 11,053 890 — — 11,943Ginnie Mae . . . . . . . . . . . . . . . . . . . . . . . . . . 744 122 — — 866Alt-A private-label securities . . . . . . . . . . . . 12,895 219 (1,325) (200) 11,589Subprime private-label securities . . . . . . . . . 9,263 35 (1,296) (407) 7,595CMBS(4) . . . . . . . . . . . . . . . . . . . . . . . . . . . . . 13,612 491 — (35) 14,068Mortgage revenue bonds . . . . . . . . . . . . . . . 9,793 138 (79) (113) 9,739Other mortgage-related securities . . . . . . . . . 3,610 84 (32) (308) 3,354
Total . . . . . . . . . . . . . . . . . . . . . . . . . . . . . . . $74,471 $3,120 $(2,734) $(1,078) $73,779
As of December 31, 2011
TotalAmortized
Cost(1)
GrossUnrealized
Gains
GrossUnrealized
Losses -OTTI(2)
GrossUnrealized
Losses -Other(3)
TotalFair
Value
(Dollars in millions)
Fannie Mae . . . . . . . . . . . . . . . . . . . . . . . . . . $15,486 $1,381 $ (3) $ (14) $16,850Freddie Mac . . . . . . . . . . . . . . . . . . . . . . . . . 11,906 917 — — 12,823Ginnie Mae . . . . . . . . . . . . . . . . . . . . . . . . . . 775 127 — — 902Alt-A private-label securities . . . . . . . . . . . . 13,314 233 (1,618) (246) 11,683Subprime private-label securities . . . . . . . . . 9,556 17 (1,534) (453) 7,586CMBS(4) . . . . . . . . . . . . . . . . . . . . . . . . . . . . . 13,949 181 — (104) 14,026Mortgage revenue bonds . . . . . . . . . . . . . . . 10,172 202 (56) (64) 10,254Other mortgage-related securities . . . . . . . . . 3,687 92 (39) (282) 3,458
Total . . . . . . . . . . . . . . . . . . . . . . . . . . . . . . . $78,845 $3,150 $(3,250) $(1,163) $77,582
106

FANNIE MAE(In conservatorship)
NOTES TO CONDENSED CONSOLIDATED FINANCIAL STATEMENTS—(Continued)(UNAUDITED)
(1) Amortized cost includes unamortized premiums, discounts and other cost basis adjustments as well as the creditcomponent of other-than-temporary impairments recognized in our condensed consolidated statements of operations andcomprehensive income (loss).
(2) Represents the noncredit component of other-than-temporary impairment losses recorded in “Accumulated othercomprehensive loss” as well as cumulative changes in fair value of securities for which we previously recognized thecredit component of an other-than-temporary impairment.
(3) Represents the gross unrealized losses on securities for which we have not recognized an other-than-temporaryimpairment.
(4) Amortized cost includes $649 million and $686 million as of March 31, 2012 and December 31, 2011, respectively, ofincrease to the carrying amount from previous fair value hedge accounting.
The following table displays additional information regarding gross unrealized losses and fair value by majorsecurity type for AFS securities in an unrealized loss position that we held as of March 31, 2012 andDecember 31, 2011.
As of March 31, 2012
Less Than 12Consecutive Months
12 ConsecutiveMonths or Longer
GrossUnrealized
LossesFair
Value
GrossUnrealized
LossesFair
Value
(Dollars in millions)
Fannie Mae . . . . . . . . . . . . . . . . . . . . . . . . . . . . . . . . . . . . . . . . . $ (5) $ 636 $ (12) $ 202Alt-A private-label securities . . . . . . . . . . . . . . . . . . . . . . . . . . . (41) 1,339 (1,484) 6,534Subprime private-label securities . . . . . . . . . . . . . . . . . . . . . . . . (28) 389 (1,675) 6,599CMBS . . . . . . . . . . . . . . . . . . . . . . . . . . . . . . . . . . . . . . . . . . . . (1) 259 (34) 534Mortgage revenue bonds . . . . . . . . . . . . . . . . . . . . . . . . . . . . . . (56) 1,003 (136) 1,280Other mortgage-related securities . . . . . . . . . . . . . . . . . . . . . . . (12) 499 (328) 1,614
Total . . . . . . . . . . . . . . . . . . . . . . . . . . . . . . . . . . . . . . . . . . . . . . $(143) $4,125 $(3,669) $16,763
As of December 31, 2011
Less Than 12Consecutive Months
12 ConsecutiveMonths or Longer
GrossUnrealized
LossesFair
Value
GrossUnrealized
LossesFair
Value
(Dollars in millions)
Fannie Mae . . . . . . . . . . . . . . . . . . . . . . . . . . . . . . . . . . . . . . . . . $ (4) $ 519 $ (13) $ 208Alt-A private-label securities . . . . . . . . . . . . . . . . . . . . . . . . . . . (133) 1,414 (1,731) 6,525Subprime private-label securities . . . . . . . . . . . . . . . . . . . . . . . . (73) 471 (1,914) 6,686CMBS . . . . . . . . . . . . . . . . . . . . . . . . . . . . . . . . . . . . . . . . . . . . (20) 1,458 (84) 2,790Mortgage revenue bonds . . . . . . . . . . . . . . . . . . . . . . . . . . . . . . (4) 114 (116) 1,971Other mortgage-related securities . . . . . . . . . . . . . . . . . . . . . . . (21) 547 (300) 1,588
Total . . . . . . . . . . . . . . . . . . . . . . . . . . . . . . . . . . . . . . . . . . . . . . $(255) $4,523 $(4,158) $19,768
107

FANNIE MAE(In conservatorship)
NOTES TO CONDENSED CONSOLIDATED FINANCIAL STATEMENTS—(Continued)(UNAUDITED)
Other-Than-Temporary Impairments
We recognize the credit component of other-than-temporary impairments of our debt securities in “Netother-than-temporary impairments” and the noncredit component in “Other comprehensive income” in ourcondensed consolidated statements of operations and comprehensive income (loss) for those securities that we donot intend to sell and for which it is not more likely than not that we will be required to sell before recovery.
The fair value of our securities varies from period to period due to changes in interest rates, in the performance ofthe underlying collateral and in the credit performance of the underlying issuer, among other factors. As ofMarch 31, 2012, $3.7 billion of the $3.8 billion of gross unrealized losses on AFS securities had existed for aperiod of 12 consecutive months or longer. Gross unrealized losses on AFS securities as of March 31, 2012include unrealized losses on securities with other-than-temporary impairment in which a portion of theimpairment remains in “Accumulated other comprehensive loss.” The securities with unrealized losses for 12consecutive months or longer, on average, had a fair value as of March 31, 2012 that was 82% of their amortizedcost basis. Based on our review for impairments of AFS securities, which includes an evaluation of thecollectibility of cash flows and any intent or requirement to sell the securities, we have concluded that we do nothave an intent to sell and we believe it is not more likely than not that we will be required to sell the securities.Additionally, our projections of cash flows indicate that we will recover these unrealized losses over the lives ofthe securities.
The following table displays our net other-than-temporary impairments by major security type recognized in ourcondensed consolidated statements of operations and comprehensive income (loss) for the three months endedMarch 31, 2012 and 2011.
For the ThreeMonths Ended
March 31,
2012 2011
(Dollars in millions)
Alt-A private-label securities . . . . . . . . . . . . . . . . . . . . . . . . . . . . . . . . . . . . . . . . . . $43 $37Subprime private-label securities . . . . . . . . . . . . . . . . . . . . . . . . . . . . . . . . . . . . . . . 19 —Other . . . . . . . . . . . . . . . . . . . . . . . . . . . . . . . . . . . . . . . . . . . . . . . . . . . . . . . . . . . . . 2 7
Net other-than-temporary impairments . . . . . . . . . . . . . . . . . . . . . . . . . . . . . . . . . . . $64 $44
The net other-than-temporary impairment charges recorded in the three months ended March 31, 2012 wereprimarily driven by a decrease in the expected cash flows on Alt-A and subprime securities.
108

FANNIE MAE(In conservatorship)
NOTES TO CONDENSED CONSOLIDATED FINANCIAL STATEMENTS—(Continued)(UNAUDITED)
The following table displays activity related to the unrealized credit component on debt securities held by us andrecognized in our condensed consolidated statements of operations and comprehensive income (loss) for thethree months ended March 31, 2012 and 2011. A related unrealized noncredit component has been recognizedin “Other comprehensive income.”
For the ThreeMonths Ended
March 31,
2012 2011
(Dollars in millions)
Balance, January 1 . . . . . . . . . . . . . . . . . . . . . . . . . . . . . . . . . . . . . . . . . . . . . . . . . . $8,915 $8,215Additions for the credit component on debt securities for which OTTI was not
previously recognized . . . . . . . . . . . . . . . . . . . . . . . . . . . . . . . . . . . . . . . . . . . . . — 8Additions for credit losses on debt securities for which OTTI was previously
recognized . . . . . . . . . . . . . . . . . . . . . . . . . . . . . . . . . . . . . . . . . . . . . . . . . . . . . . . 64 36Reductions for amortization resulting from changes in cash flows expected to be
collected over the remaining life of the securities . . . . . . . . . . . . . . . . . . . . . . . . (109) (219)
Balance, March 31 . . . . . . . . . . . . . . . . . . . . . . . . . . . . . . . . . . . . . . . . . . . . . . . . . . $8,870 $8,040
As of March 31, 2012, those debt securities with other-than-temporary impairment for which we recognized inour condensed consolidated statements of operations and comprehensive income (loss) the amount of loss relatedto credit consisted predominantly of Alt-A and subprime securities. We evaluate Alt-A (including optionadjustable rate mortgage (“ARM”)) and subprime private-label securities for other-than-temporary impairmentby discounting the projected cash flows from econometric models to estimate the portion of loss in valueattributable to credit. Separate components of a third-party model project regional home prices, unemploymentand interest rates. The model combines these factors with available current information regarding attributes ofloans in pools backing the private-label mortgage-related securities to project prepayment speeds, conditionaldefault rates, loss severities and delinquency rates. It incorporates detailed information on security-levelsubordination levels and cash flow priority of payments to project security level cash flows. We have recordedother-than-temporary impairments for the three months ended March 31, 2012 based on this analysis. Forsecurities we determined were not other-than-temporarily impaired, we concluded that either the bond had noprojected credit loss or if we projected a loss, that the present value of expected cash flows was greater than thesecurity’s cost basis.
109

FANNIE MAE(In conservatorship)
NOTES TO CONDENSED CONSOLIDATED FINANCIAL STATEMENTS—(Continued)(UNAUDITED)
The following table displays the modeled attributes, including default rates and severities, which are used todetermine whether our senior interests in certain non-agency mortgage-related securities will experience a cashshortfall as of March 31, 2012. Assumption of voluntary prepayment rates is also an input to the present value ofexpected losses.
As of March 31, 2012
Alt-A
Subprime Option ARM Fixed Rate Variable Rate Hybrid Rate
(Dollars in millions)Vintage Year2004 & Prior:
Unpaid principal balance . . . . . . . . . . . . . . . . . . . . . $ 1,580 $ 469 $3,237 $ 474 $2,174Weighted average collateral default(1) . . . . . . . . . . . . 38.8% 36.8% 11.5% 32.0% 16.5%Weighted average collateral severities(2) . . . . . . . . . . 60.5 53.1 49.4 43.5 40.4Weighted average voluntary prepayment rates(3) . . . 6.5 10.9 12.4 9.1 12.6Average credit enhancement(4) . . . . . . . . . . . . . . . . . 51.5 14.6 12.2 22.7 10.2
2005Unpaid principal balance . . . . . . . . . . . . . . . . . . . . . $ 163 $1,267 $1,139 $ 513 $2,259Weighted average collateral default(1) . . . . . . . . . . . . 71.3% 55.0% 40.8% 52.4% 38.0%Weighted average collateral severities(2) . . . . . . . . . . 71.6 61.8 64.6 59.2 48.5Weighted average voluntary prepayment rates(3) . . . 2.3 6.3 8.5 7.5 9.1Average credit enhancement(4) . . . . . . . . . . . . . . . . . 65.6 23.7 1.1 15.9 5.0
2006Unpaid principal balance . . . . . . . . . . . . . . . . . . . . . $11,283 $1,136 $ 507 $1,534 $1,605Weighted average collateral default(1) . . . . . . . . . . . . 77.0% 69.6% 40.5% 57.9% 30.9%Weighted average collateral severities(2) . . . . . . . . . . 72.8 63.6 64.8 58.8 51.3Weighted average voluntary prepayment rates(3) . . . 2.2 3.6 7.6 6.3 9.9Average credit enhancement(4) . . . . . . . . . . . . . . . . . 16.6 18.2 0.5 1.0 —
2007 & After:Unpaid principal balance . . . . . . . . . . . . . . . . . . . . . $ 591 $ — $ — $ — $ 113Weighted average collateral default(1) . . . . . . . . . . . . 77.6% N/A N/A N/A 42.2%Weighted average collateral severities(2) . . . . . . . . . . 66.8 N/A N/A N/A 59.5Weighted average voluntary prepayment rates(3) . . . 1.8 N/A N/A N/A 8.4Average credit enhancement(4) . . . . . . . . . . . . . . . . . 32.4 N/A N/A N/A 25.3
TotalUnpaid principal balance . . . . . . . . . . . . . . . . . . . . . $13,617 $2,872 $4,883 $2,521 $6,151Weighted average collateral default(1) . . . . . . . . . . . . 72.5% 57.8% 21.3% 51.9% 28.6%Weighted average collateral severities(2) . . . . . . . . . . 71.1 61.1 54.6 56.0 46.6Weighted average voluntary prepayment rates(3) . . . 2.7 5.9 11.0 7.0 10.6Average credit enhancement(4) . . . . . . . . . . . . . . . . . 21.9 20.1 8.4 8.1 5.9
(1) The expected remaining cumulative default rate of the collateral pool backing the securities, as a percentage of the currentcollateral unpaid principal balance, weighted by security unpaid principal balance.
(2) The expected remaining loss given default of the collateral pool backing the securities, calculated as the ratio of remainingcumulative loss divided by cumulative defaults, weighted by security unpaid principal balance.
(3) The average monthly voluntary prepayment rate, weighted by security unpaid principal balance.(4) The average percent current credit enhancement provided by subordination of other securities. Excludes excess interest
projections and monoline bond insurance.
110
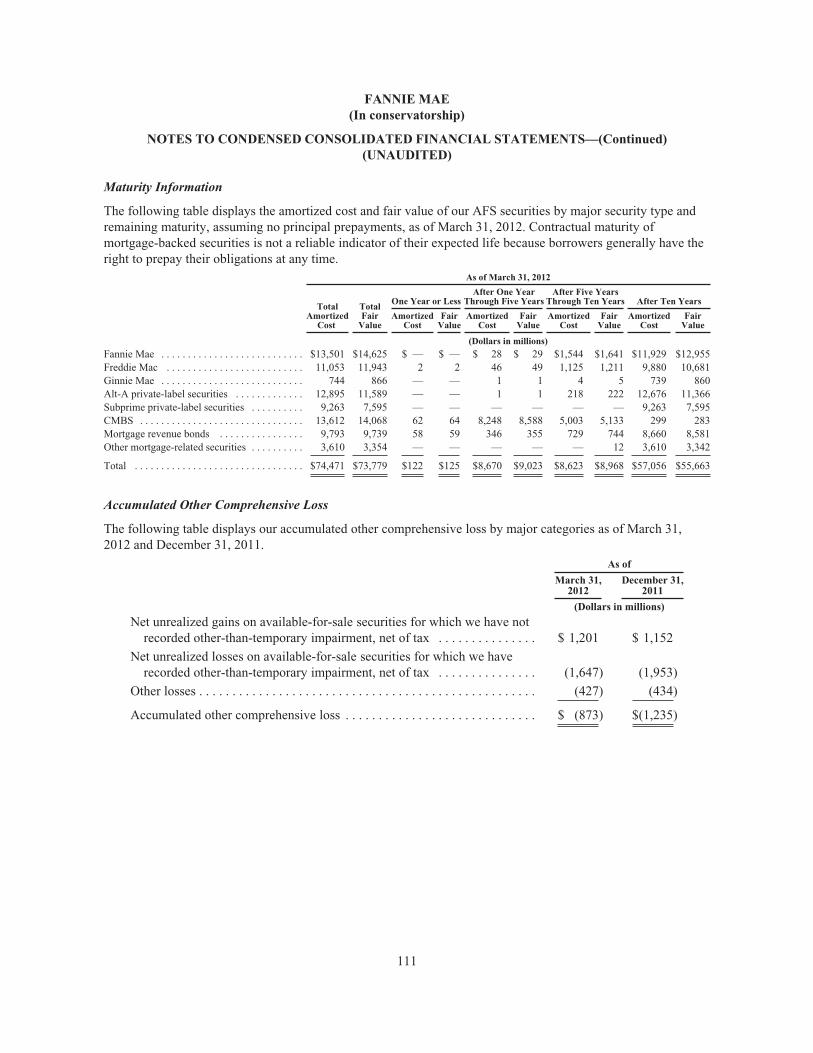
FANNIE MAE(In conservatorship)
NOTES TO CONDENSED CONSOLIDATED FINANCIAL STATEMENTS—(Continued)(UNAUDITED)
Maturity Information
The following table displays the amortized cost and fair value of our AFS securities by major security type andremaining maturity, assuming no principal prepayments, as of March 31, 2012. Contractual maturity ofmortgage-backed securities is not a reliable indicator of their expected life because borrowers generally have theright to prepay their obligations at any time.
As of March 31, 2012
TotalAmortized
Cost
TotalFair
Value
One Year or LessAfter One Year
Through Five YearsAfter Five Years
Through Ten Years After Ten Years
AmortizedCost
FairValue
AmortizedCost
FairValue
AmortizedCost
FairValue
AmortizedCost
FairValue
(Dollars in millions)
Fannie Mae . . . . . . . . . . . . . . . . . . . . . . . . . . . $13,501 $14,625 $ — $ — $ 28 $ 29 $1,544 $1,641 $11,929 $12,955Freddie Mac . . . . . . . . . . . . . . . . . . . . . . . . . . 11,053 11,943 2 2 46 49 1,125 1,211 9,880 10,681Ginnie Mae . . . . . . . . . . . . . . . . . . . . . . . . . . . 744 866 — — 1 1 4 5 739 860Alt-A private-label securities . . . . . . . . . . . . . 12,895 11,589 — — 1 1 218 222 12,676 11,366Subprime private-label securities . . . . . . . . . . 9,263 7,595 — — — — — — 9,263 7,595CMBS . . . . . . . . . . . . . . . . . . . . . . . . . . . . . . . 13,612 14,068 62 64 8,248 8,588 5,003 5,133 299 283Mortgage revenue bonds . . . . . . . . . . . . . . . . 9,793 9,739 58 59 346 355 729 744 8,660 8,581Other mortgage-related securities . . . . . . . . . . 3,610 3,354 — — — — — 12 3,610 3,342
Total . . . . . . . . . . . . . . . . . . . . . . . . . . . . . . . . $74,471 $73,779 $122 $125 $8,670 $9,023 $8,623 $8,968 $57,056 $55,663
Accumulated Other Comprehensive Loss
The following table displays our accumulated other comprehensive loss by major categories as of March 31,2012 and December 31, 2011.
As of
March 31,2012
December 31,2011
(Dollars in millions)
Net unrealized gains on available-for-sale securities for which we have notrecorded other-than-temporary impairment, net of tax . . . . . . . . . . . . . . . $ 1,201 $ 1,152
Net unrealized losses on available-for-sale securities for which we haverecorded other-than-temporary impairment, net of tax . . . . . . . . . . . . . . . (1,647) (1,953)
Other losses . . . . . . . . . . . . . . . . . . . . . . . . . . . . . . . . . . . . . . . . . . . . . . . . . . . (427) (434)
Accumulated other comprehensive loss . . . . . . . . . . . . . . . . . . . . . . . . . . . . . $ (873) $(1,235)
111

FANNIE MAE(In conservatorship)
NOTES TO CONDENSED CONSOLIDATED FINANCIAL STATEMENTS—(Continued)(UNAUDITED)
The following table displays the activity in other comprehensive income, net of tax, by major categories for thethree months ended March 31, 2012 and 2011.
For the ThreeMonths Ended
March 31,
2012 2011
(Dollars in millions)
Comprehensive income (loss):
Net income (loss) . . . . . . . . . . . . . . . . . . . . . . . . . . . . . . . . . . . . . . . . . . . . . . . . . . . . . . . . . . . $2,718 $(6,471)
Other comprehensive income (loss), net of tax:
Changes in net unrealized losses on available-for-sale securities (net of tax of $196 and$87, respectively) . . . . . . . . . . . . . . . . . . . . . . . . . . . . . . . . . . . . . . . . . . . . . . . . . . . . . . . 319 161
Reclassification adjustment for other-than-temporary impairments recognized in netincome (loss) (net of tax of $22 and $13, respectively) . . . . . . . . . . . . . . . . . . . . . . . . . . 42 32
Reclassification adjustment for gains included in net income (loss) (net of tax of $3 and$8, respectively) . . . . . . . . . . . . . . . . . . . . . . . . . . . . . . . . . . . . . . . . . . . . . . . . . . . . . . . . (6) (14)
Other . . . . . . . . . . . . . . . . . . . . . . . . . . . . . . . . . . . . . . . . . . . . . . . . . . . . . . . . . . . . . . . . . . 7 2
Other comprehensive income . . . . . . . . . . . . . . . . . . . . . . . . . . . . . . . . . . . . . . . . . . . . . . . . . 362 181
Total comprehensive income (loss) . . . . . . . . . . . . . . . . . . . . . . . . . . . . . . . . . . . . . . . . . . . . . $3,080 $(6,290)
6. Financial Guarantees
We recognize a guaranty obligation for our obligation to stand ready to perform for our guarantees tounconsolidated trusts and other guaranty arrangements. These guarantees expose us to credit losses on themortgage loans or, in the case of mortgage-related securities, the underlying mortgage loans of the relatedsecurities. The contractual terms of our guarantees range from 30 days to 40 years. However, the actual term ofeach guaranty may be significantly less than the contractual term based on the prepayment characteristics of therelated mortgage loans.
For those guarantees recognized in our condensed consolidated balance sheets, our maximum potential exposureunder these guarantees is primarily comprised of the unpaid principal balance of the underlying mortgage loans,which totaled $59.2 billion and $59.4 billion as of March 31, 2012 and December 31, 2011, respectively.
In addition, we had maximum potential exposure of $9.0 billion and $9.3 billion for other guarantees notrecognized in our condensed consolidated balance sheets as of March 31, 2012 and December 31, 2011,respectively, which primarily represents the unpaid principal balance of loans underlying guarantees issued priorto the effective date of current accounting guidance on guaranty accounting.
The maximum amount we could recover through available credit enhancements and recourse with third partieson guarantees recognized in our condensed consolidated balance sheets was $14.1 billion as of March 31, 2012and December 31, 2011. The maximum amount we could recover through available credit enhancements andrecourse with third parties on guarantees not recognized in our condensed consolidated balance sheets was $3.9billion and $4.0 billion as of March 31, 2012 and December 31, 2011, respectively. Recoverability of such creditenhancements and recourse is subject to, among other factors, our mortgage insurers’ and financial guarantors’ability to meet their obligations to us.
The fair value of our guaranty obligations associated with the Fannie Mae MBS included in “Investments insecurities” was $2.1 billion and $2.2 billion as of March 31, 2012 and December 31, 2011, respectively.
112

FANNIE MAE(In conservatorship)
NOTES TO CONDENSED CONSOLIDATED FINANCIAL STATEMENTS—(Continued)(UNAUDITED)
Risk Characteristics of our Book of Business
We gauge our performance risk under our guaranty based on the delinquency status of the mortgage loans wehold in portfolio, or in the case of mortgage-backed securities, the mortgage loans underlying the relatedsecurities.
For single-family loans, management monitors the serious delinquency rate, which is the percentage of single-family loans three or more months past due or in the foreclosure process, and loans that have higher riskcharacteristics, such as high mark-to-market LTV ratios.
For multifamily loans, management monitors the serious delinquency rate, which is the percentage of loans 60days or more past due and loans that have higher risk characteristics, to determine our overall credit qualityindicator. Higher risk characteristics include, but are not limited to, original debt service coverage ratios(“DSCR”) below 1.10, current DSCR below 1.0, and high original and current estimated LTV ratios. We stratifymultifamily loans into different internal risk categories based on the credit risk inherent in each individual loan.
For single and multifamily loans, we use this information, in conjunction with housing market and economicconditions, to structure our pricing and our eligibility and underwriting criteria to reflect the current risk of loanswith these higher-risk characteristics, and in some cases we decide to significantly reduce our participation inriskier loan product categories. Management also uses this data together with other credit risk measures toidentify key trends that guide the development of our loss mitigation strategies.
The following tables display the current delinquency status and certain higher risk characteristics of our single-family conventional and total multifamily guaranty book of business as of March 31, 2012 and December 31,2011.
As of March 31, 2012(1) As of December 31, 2011(1)
30 DaysDelinquent
60 DaysDelinquent
SeriouslyDelinquent(2)
30 DaysDelinquent
60 DaysDelinquent
SeriouslyDelinquent(2)
Percentage of single-familyconventional guaranty book ofbusiness(3) . . . . . . . . . . . . . . . . . . . . . 1.64% 0.59% 4.19% 1.98% 0.73% 4.47%
Percentage of single-familyconventional loans(4) . . . . . . . . . . . . 1.78 0.59 3.67 2.17 0.74 3.91
113
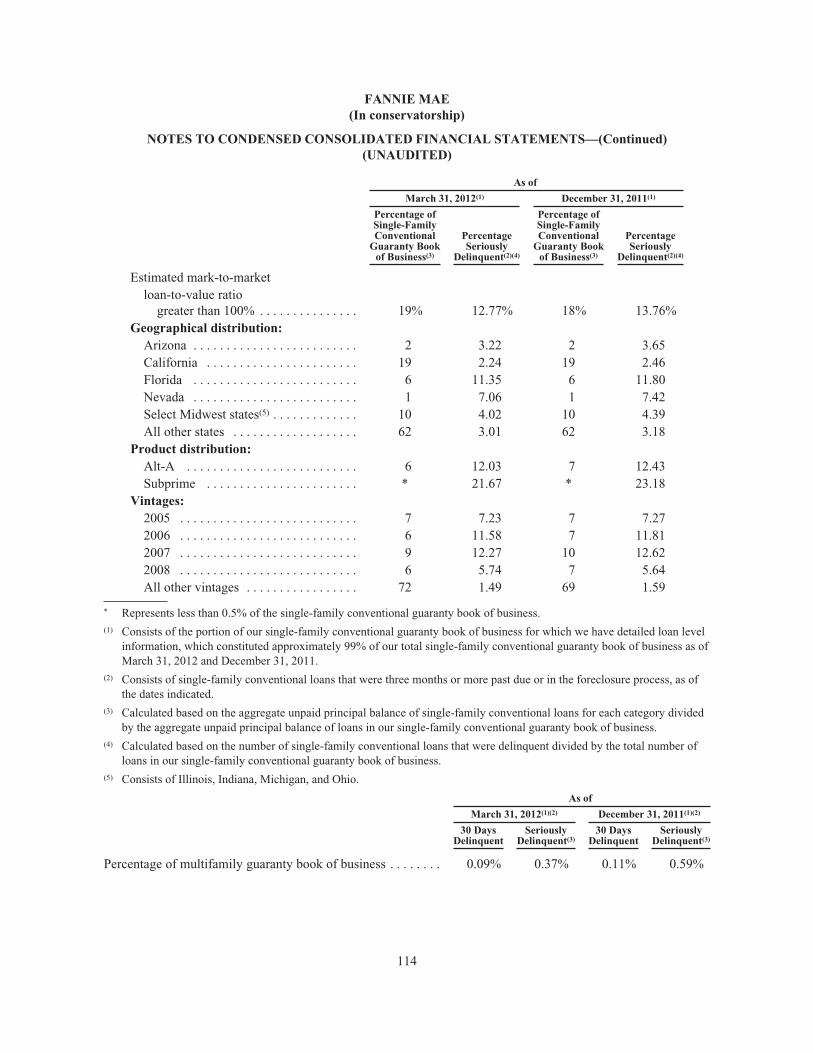
FANNIE MAE(In conservatorship)
NOTES TO CONDENSED CONSOLIDATED FINANCIAL STATEMENTS—(Continued)(UNAUDITED)
As of
March 31, 2012(1) December 31, 2011(1)
Percentage ofSingle-FamilyConventional
Guaranty Bookof Business(3)
PercentageSeriously
Delinquent(2)(4)
Percentage ofSingle-FamilyConventional
Guaranty Bookof Business(3)
PercentageSeriously
Delinquent(2)(4)
Estimated mark-to-marketloan-to-value ratio
greater than 100% . . . . . . . . . . . . . . . 19% 12.77% 18% 13.76%Geographical distribution:
Arizona . . . . . . . . . . . . . . . . . . . . . . . . . 2 3.22 2 3.65California . . . . . . . . . . . . . . . . . . . . . . . 19 2.24 19 2.46Florida . . . . . . . . . . . . . . . . . . . . . . . . . 6 11.35 6 11.80Nevada . . . . . . . . . . . . . . . . . . . . . . . . . 1 7.06 1 7.42Select Midwest states(5) . . . . . . . . . . . . . 10 4.02 10 4.39All other states . . . . . . . . . . . . . . . . . . . 62 3.01 62 3.18
Product distribution:Alt-A . . . . . . . . . . . . . . . . . . . . . . . . . . 6 12.03 7 12.43Subprime . . . . . . . . . . . . . . . . . . . . . . . * 21.67 * 23.18
Vintages:2005 . . . . . . . . . . . . . . . . . . . . . . . . . . . 7 7.23 7 7.272006 . . . . . . . . . . . . . . . . . . . . . . . . . . . 6 11.58 7 11.812007 . . . . . . . . . . . . . . . . . . . . . . . . . . . 9 12.27 10 12.622008 . . . . . . . . . . . . . . . . . . . . . . . . . . . 6 5.74 7 5.64All other vintages . . . . . . . . . . . . . . . . . 72 1.49 69 1.59
* Represents less than 0.5% of the single-family conventional guaranty book of business.(1) Consists of the portion of our single-family conventional guaranty book of business for which we have detailed loan level
information, which constituted approximately 99% of our total single-family conventional guaranty book of business as ofMarch 31, 2012 and December 31, 2011.
(2) Consists of single-family conventional loans that were three months or more past due or in the foreclosure process, as ofthe dates indicated.
(3) Calculated based on the aggregate unpaid principal balance of single-family conventional loans for each category dividedby the aggregate unpaid principal balance of loans in our single-family conventional guaranty book of business.
(4) Calculated based on the number of single-family conventional loans that were delinquent divided by the total number ofloans in our single-family conventional guaranty book of business.
(5) Consists of Illinois, Indiana, Michigan, and Ohio.
As of
March 31, 2012(1)(2) December 31, 2011(1)(2)
30 DaysDelinquent
SeriouslyDelinquent(3)
30 DaysDelinquent
SeriouslyDelinquent(3)
Percentage of multifamily guaranty book of business . . . . . . . . 0.09% 0.37% 0.11% 0.59%
114

FANNIE MAE(In conservatorship)
NOTES TO CONDENSED CONSOLIDATED FINANCIAL STATEMENTS—(Continued)(UNAUDITED)
As of
March 31, 2012(1)(2) December 31, 2011(1)(2)
Percentage ofMultifamilyGuarantyBook ofBusiness
PercentageSeriously
Delinquent(3)
Percentage ofMultifamilyGuarantyBook ofBusiness
PercentageSeriously
Delinquent(3)
Original loan-to-value ratio:
Greater than 80% . . . . . . . . . . . . . . . . . . . . . . . . . . . . . . 4% 0.75% 5% 2.51%
Less than or equal to 80% . . . . . . . . . . . . . . . . . . . . . . . 96 0.36 95 0.49
Original debt service coverage ratio:
Less than or equal to 1.10 . . . . . . . . . . . . . . . . . . . . . . . 8 0.17 8 0.24
Greater than 1.10 . . . . . . . . . . . . . . . . . . . . . . . . . . . . . . 92 0.39 92 0.62Current debt service coverage ratio
less than 1.0(4) . . . . . . . . . . . . . . . . . . . . . . . . . . . . . . . . . 7 2.45 7 3.66
(1) Consists of the portion of our multifamily guaranty book of business for which we have detailed loan level information,which constituted approximately 99% of our total multifamily guaranty book of business as of March 31, 2012 andDecember 31, 2011, excluding loans that have been defeased.
(2) Calculated based on the aggregate unpaid principal balance of multifamily loans for each category divided by theaggregate unpaid principal balance of loans in our multifamily guaranty book of business.
(3) Consists of multifamily loans that were 60 days or more past due as of the dates indicated.(4) Our estimates of current DSCRs are based on the latest available income information for these properties. Although we
use the most recently available results of our multifamily borrowers, there is a lag in reporting, which typically can rangefrom 6 to 18 months as they prepare their results in the normal course of business.
7. Acquired Property, Net
Acquired property, net consists of held for sale foreclosed property received in full satisfaction of a loan, net of avaluation allowance for declines in the fair value of the properties after initial acquisition. We classify propertiesas held for sale when we intend to sell the property and are actively marketing it for sale. The following tabledisplays the activity in acquired property and the related valuation allowance for the three months endedMarch 31, 2012, and 2011.
For the Three Months EndedMarch 31, 2012
For the Three Months EndedMarch 31, 2011
AcquiredProperty
ValuationAllowance(1)
AcquiredProperty, Net
AcquiredProperty
ValuationAllowance(1)
AcquiredProperty, Net
(Dollars in millions)
Beginning balance, January 1 . . . . . . . $12,401 $(1,028) $11,373 $18,054 $(1,881) $16,173Additions . . . . . . . . . . . . . . . . . . . . . . 3,826 (121) 3,705 4,889 (129) 4,760Disposals . . . . . . . . . . . . . . . . . . . . . . . (4,818) 518 (4,300) (6,015) 730 (5,285)Write-downs, net of recoveries . . . . . . — (159) (159) — (384) (384)
Ending Balance, March 31 . . . . . . . . . $11,409 $ (790) $10,619 $16,928 $(1,664) $15,264
(1) Reflects activities in the valuation allowance for acquired properties held primarily by our single-family segment.
115

FANNIE MAE(In conservatorship)
NOTES TO CONDENSED CONSOLIDATED FINANCIAL STATEMENTS—(Continued)(UNAUDITED)
8. Short-Term Borrowings and Long-Term Debt
Short-Term Borrowings
The following table displays our outstanding short-term borrowings (borrowings with an original contractualmaturity of one year or less) and weighted-average interest rates of these borrowings as of March 31, 2012 andDecember 31, 2011.
As of
March 31, 2012 December 31, 2011
Outstanding
Weighted-AverageInterestRate(1) Outstanding
Weighted-AverageInterestRate(1)
(Dollars in millions)
Fixed-rate short-term debt:Discount notes(2) . . . . . . . . . . . . . . . . . . . . . . . . $110,350 0.12% $146,301 0.13%Foreign exchange discount notes(3) . . . . . . . . . . 422 2.05 371 1.88Other(4) . . . . . . . . . . . . . . . . . . . . . . . . . . . . . . . 80 0.04 80 0.04
Total short-term debt of Fannie Mae . . . . . . 110,852 0.13 146,752 0.13Debt of consolidated trusts . . . . . . . . . . . . . . . . . 4,495 0.11 4,973 0.09
Total short-term debt . . . . . . . . . . . . . . . . . . . . $115,347 0.13% $151,725 0.13%
(1) Includes the effects of discounts, premiums, and other cost basis adjustments.(2) Represents unsecured general obligations with maturities ranging from overnight to 360 days from the date of issuance.(3) Represents foreign exchange discount notes we issue in the Euro commercial paper market with maturities ranging from 5
to 360 days which enable investors to hold short-term investments in different currencies. We do not incur foreignexchange risk on these transactions, as we simultaneously enter into foreign currency swaps that have the effect ofconverting debt that we issue in foreign denominated currencies into U.S. dollars.
(4) Includes foreign exchange discount notes denominated in U.S. dollars.
Intraday Lines of Credit
We periodically use secured and unsecured intraday funding lines of credit provided by several large financialinstitutions. We post collateral which, in some circumstances, the secured party has the right to repledge to thirdparties. As these lines of credit are uncommitted intraday loan facilities, we may be unable to draw on them ifand when needed. We had secured uncommitted lines of credit of $25.0 billion and unsecured uncommitted linesof credit of $500 million as of March 31, 2012 and December 31, 2011. We had no borrowings outstanding fromthese lines of credit as of March 31, 2012.
Long-Term Debt
Long-term debt represents borrowings with an original contractual maturity of greater than one year. Thefollowing table displays our outstanding long-term debt as of March 31, 2012 and December 31, 2011.
116

FANNIE MAE(In conservatorship)
NOTES TO CONDENSED CONSOLIDATED FINANCIAL STATEMENTS—(Continued)(UNAUDITED)
As of
March 31, 2012 December 31, 2011
Maturities Outstanding
Weighted-AverageInterestRate(1) Maturities Outstanding
Weighted-AverageInterestRate(1)
(Dollars in millions)Senior fixed:
Benchmark notes and bonds . . . . . . . . . 2012-2030 $ 275,342 2.67% 2012-2030 $ 277,146 2.81%Medium-term notes(2) . . . . . . . . . . . . . . . 2012-2022 170,219 1.55 2012-2021 176,886 1.61Foreign exchange notes and bonds . . . . . 2021-2028 683 5.40 2021-2028 662 5.44Other(3)(4) . . . . . . . . . . . . . . . . . . . . . . . . . 2012-2040 47,034 5.29 2012-2040 50,912 5.29
Total senior fixed . . . . . . . . . . . . . . . . 493,278 2.53 505,606 2.64Senior floating:
Medium-term notes(2) . . . . . . . . . . . . . . . 2012-2019 73,187 0.32 2012-2016 71,855 0.32Other(3)(4) . . . . . . . . . . . . . . . . . . . . . . . . . 2020-2037 364 8.18 2020-2037 420 8.01
Total senior floating . . . . . . . . . . . . . . 73,551 0.36 72,275 0.35Subordinated fixed:
Qualifying subordinated(5) . . . . . . . . . . . 2012-2014 4,894 5.08 2012-2014 4,894 5.08Subordinated debentures . . . . . . . . . . . . 2019 2,984 9.91 2019 2,917 9.91
Total subordinated fixed . . . . . . . . . . 7,878 6.91 7,811 6.88Secured borrowings(6) . . . . . . . . . . . . . . . . 2021-2022 415 1.87 — — —
Total long-term debt of Fannie Mae(7) . . 575,122 2.32 585,692 2.42Debt of consolidated trusts(4) . . . . . . . . . . . 2012-2052 2,493,738 4.04 2012-2051 2,452,455 4.18
Total long-term debt . . . . . . . . . . . . . $3,068,860 3.71% $3,038,147 3.84%
(1) Includes the effects of discounts, premiums and other cost basis adjustments.(2) Includes long-term debt with an original contractual maturity of greater than 1 year and up to 10 years, excluding zero-
coupon debt.(3) Includes long-term debt that is not included in other debt categories.(4) Includes a portion of structured debt instruments that is reported at fair value.(5) Consists of subordinated debt issued with an interest deferral feature.(6) Represents remaining liability for transfer of financial assets from our condensed consolidated balance sheets that did not
qualify as a sale.(7) Reported amounts include a net discount and other cost basis adjustments of $8.4 billion and $9.2 billion as of March 31,
2012 and December 31, 2011, respectively.
9. Derivative Instruments
Derivative instruments are an integral part of our strategy in managing interest rate risk. Derivative instrumentsmay be privately negotiated contracts, which are often referred to as over-the-counter derivatives, or they may belisted and traded on an exchange. We typically do not settle the notional amount of our risk managementderivatives; rather, notional amounts provide the basis for calculating actual payments or settlement amounts.The derivatives we use for interest rate risk management purposes consist primarily of interest rate swaps,interest rate options and foreign currency swaps.
117

FANNIE MAE(In conservatorship)
NOTES TO CONDENSED CONSOLIDATED FINANCIAL STATEMENTS—(Continued)(UNAUDITED)
We enter into forward purchase and sale commitments that lock in the future delivery of mortgage loans andmortgage-related securities at a fixed price or yield. Certain commitments to purchase mortgage loans andpurchase or sell mortgage-related securities meet the criteria of a derivative. We typically settle the notionalamount of our mortgage commitments that are accounted for as derivatives.
We recognize all derivatives as either assets or liabilities in our condensed consolidated balance sheets at theirfair value on a trade date basis. Fair value amounts, which are netted to the extent a legal right of offset exists andis enforceable by law at the counterparty level and are inclusive of the right or obligation associated with the cashcollateral posted or received, are recorded in “Other assets” or “Other liabilities” in our condensed consolidatedbalance sheets.
Notional and Fair Value Position of our Derivatives
The following table displays the notional amount and estimated fair value of our asset and liability derivativeinstruments as of March 31, 2012 and December 31, 2011.
118

FANNIE MAE(In conservatorship)
NOTES TO CONDENSED CONSOLIDATED FINANCIAL STATEMENTS—(Continued)(UNAUDITED)
As of March 31, 2012 As of December 31, 2011
Asset Derivatives Liability Derivatives Asset Derivatives Liability Derivatives
NotionalAmount
EstimatedFair Value
NotionalAmount
EstimatedFair Value
NotionalAmount
EstimatedFair Value
NotionalAmount
EstimatedFair Value
(Dollars in millions)Risk management derivatives:Swaps:
Pay-fixed . . . . . . . . . . . . . . . . . $ 33,300 $ 241 $173,007 $(15,510) $ 30,950 $ 102 $155,807 $(17,391)Receive-fixed . . . . . . . . . . . . . . 194,880 7,742 55,442 (230) 170,668 8,118 59,027 (93)Basis . . . . . . . . . . . . . . . . . . . . . 4,532 118 14,141 (7) 382 122 9,240 (44)Foreign currency . . . . . . . . . . . 601 146 503 (56) 581 155 451 (62)
Swaptions:Pay-fixed . . . . . . . . . . . . . . . . . 37,850 154 17,875 (206) 48,600 165 47,750 (194)Receive-fixed . . . . . . . . . . . . . . 24,395 4,129 17,875 (1,843) 33,695 6,371 47,750 (3,238)
Other(1) . . . . . . . . . . . . . . . . . . . . . . . 7,752 59 437 (5) 8,214 52 75 —
Total gross risk managementderivatives . . . . . . . . . . . . . . . . 303,310 12,589 279,280 (17,857) 293,090 15,085 320,100 (21,022)
Accrued interest receivable(payable) . . . . . . . . . . . . . . . . . — 1,081 — (1,455) — 920 — (1,238)
Netting adjustment(2) . . . . . . . . . . . — (13,524) — 19,053 — (15,829) — 21,898
Total net risk managementderivatives . . . . . . . . . . . . . . $303,310 $ 146 $279,280 $ (259) $293,090 $ 176 $320,100 $ (362)
Mortgage commitment derivatives:Mortgage commitments to
purchase whole loans . . . . . . . . $ 3,623 $ 15 $ 8,723 $ (38) $ 9,710 $ 73 $ 422 $ —Forward contracts to purchase
mortgage-related securities . . . 23,609 69 26,436 (100) 32,707 309 2,570 (6)Forward contracts to sell
mortgage-related securities . . . 41,663 135 35,231 (125) 1,370 3 54,656 (548)
Total mortgage commitmentderivatives . . . . . . . . . . . . . . $ 68,895 $ 219 $ 70,390 $ (263) $ 43,787 $ 385 $ 57,648 $ (554)
Derivatives at fair value . . . . . . $372,205 $ 365 $349,670 $ (522) $336,877 $ 561 $377,748 $ (916)
(1) Includes interest rate caps, futures, swap credit enhancements and mortgage insurance contracts that we account for asderivatives. The mortgage insurance contracts have payment provisions that are not based on a notional amount.
(2) The netting adjustment represents the effect of the legal right to offset under legally enforceable master netting agreementsto settle with the same counterparty on a net basis, as well as cash collateral posted and received. Cash collateral postedwas $6.0 billion and $6.8 billion as of March 31, 2012 and December 31, 2011, respectively. Cash collateral received was$515 million and $779 million as of March 31, 2012 and December 31, 2011, respectively.
A majority of our derivative instruments contain provisions that require our senior unsecured debt to maintain aminimum credit rating from S&P and Moody’s. If our senior unsecured debt were to fall below establishedthresholds in our governing agreements, which range from A- to BBB+, we could be required to provideadditional collateral to or terminate transactions with certain counterparties. The aggregate fair value of allderivatives with credit-risk-related contingent features that were in a net liability position as of March 31, 2012was $6.1 billion, for which we posted collateral of $6.0 billion in the normal course of business. Had all of thecredit-risk-related contingency features underlying these agreements been triggered, an additional $87 million ofcollateral would have been required to be posted as collateral or to immediately settle our positions based on theindividual agreements and our fair value position as of March 31, 2012.
119

FANNIE MAE(In conservatorship)
NOTES TO CONDENSED CONSOLIDATED FINANCIAL STATEMENTS—(Continued)(UNAUDITED)
The aggregate fair value of all derivatives with credit risk-related contingent features that were in a net liabilityposition as of December 31, 2011 was $7.2 billion, for which we posted collateral of $6.8 billion in the normalcourse of business. Had all of the credit risk-related contingency features underlying these agreements beentriggered, an additional $362 million would have been required to be posted as collateral or to immediately settleour positions based on the individual agreements and our fair value position as of December 31, 2011.
We record all derivative gains and losses, including accrued interest, in “Fair value gains, net” in our condensedconsolidated statements of operations and comprehensive income (loss). The following table displays, by type ofderivative instrument, the fair value gains and losses, net on our derivatives for the three months endedMarch 31, 2012 and 2011.
For theThree Months Ended
March 31,
2012 2011
(Dollars in millions)
Risk management derivatives:Swaps:
Pay-fixed . . . . . . . . . . . . . . . . . . . . . . . . . . . . . . . . . . . . . . . . . . . . . . . . . . . . $1,175 $ 602Receive-fixed . . . . . . . . . . . . . . . . . . . . . . . . . . . . . . . . . . . . . . . . . . . . . . . . . (918) (256)Basis . . . . . . . . . . . . . . . . . . . . . . . . . . . . . . . . . . . . . . . . . . . . . . . . . . . . . . . . 38 19Foreign currency . . . . . . . . . . . . . . . . . . . . . . . . . . . . . . . . . . . . . . . . . . . . . . 1 30
Swaptions:Pay-fixed . . . . . . . . . . . . . . . . . . . . . . . . . . . . . . . . . . . . . . . . . . . . . . . . . . . . (22) (55)Receive-fixed . . . . . . . . . . . . . . . . . . . . . . . . . . . . . . . . . . . . . . . . . . . . . . . . . (94) (233)
Other(1) . . . . . . . . . . . . . . . . . . . . . . . . . . . . . . . . . . . . . . . . . . . . . . . . . . . . . . . . . (1) 9
Total risk management derivatives fair value gains, net . . . . . . . . . . . . . . . . 179 116Mortgage commitment derivatives fair value (losses) gains, net . . . . . . . . . . . . (205) 23
Total derivatives fair value (losses) gains, net . . . . . . . . . . . . . . . . . . . . . . . . $ (26) $ 139
(1) Includes interest rate caps, futures, swap credit enhancements and mortgage insurance contracts.
Derivative Counterparty Credit Exposure
Our derivative counterparty credit exposure relates principally to interest rate and foreign currency derivativecontracts. We are exposed to the risk that a counterparty in a derivative transaction will default on payments dueto us. If there is a default, we may need to acquire a replacement derivative from a different counterparty at ahigher cost or may be unable to find a suitable replacement. We estimate our exposure to credit loss on derivativeinstruments by calculating the replacement cost, on a present value basis, to settle at current market prices alloutstanding derivative contracts in a net gain position at the counterparty level where the right of legal offsetexists. For derivative instruments where the right of legal offset does not exist, we calculate the replacement costof the outstanding derivative contracts in a gain position at the transaction level. We manage our exposure byrequiring counterparties to post collateral, which includes cash, U.S. Treasury securities, agency debt and agencymortgage-related securities.
120

FANNIE MAE(In conservatorship)
NOTES TO CONDENSED CONSOLIDATED FINANCIAL STATEMENTS—(Continued)(UNAUDITED)
The table below displays our counterparty credit exposure on outstanding risk management derivativeinstruments in a gain position by counterparty credit ratings, as well as the notional amount outstanding and thenumber of counterparties for all risk management derivatives as of March 31, 2012 and December 31, 2011.
As of March 31, 2012
Credit Rating(1)
AA+/AA/AA- A+/A Subtotal(2) Other(3) Total
(Dollars in millions)
Credit loss exposure(4) . . . . . . . . . . . . . $ 5 $ 392 $ 397 $ 54 $ 451Less: Collateral held(5) . . . . . . . . . . . . — 392 392 — 392
Exposure net of collateral . . . . . . . . . . $ 5 $ — $ 5 $ 54 $ 59
Additional information:Notional amount . . . . . . . . . . . . . . $63,771 $511,039 $574,810 $7,780 $582,590Number of counterparties . . . . . . . 6 10 16
As of December 31, 2011
Credit Rating(1)
AA+/AA/AA- A+/A Subtotal(2) Other(3) Total
(Dollars in millions)
Credit loss exposure(4) . . . . . . . . . . . . . $ — $ 885 $ 885 $ 51 $ 936Less: Collateral held(5) . . . . . . . . . . . . — 840 840 — 840
Exposure net of collateral . . . . . . . . . $ — $ 45 $ 45 $ 51 $ 96
Additional information:Notional amount . . . . . . . . . . . . . . $63,294 $546,967 $610,261 $2,929 $613,190Number of counterparties . . . . . . . 6 10 16
(1) We manage collateral requirements based on the lower credit rating of the legal entity, as issued by S&P and Moody’s.The credit rating reflects the equivalent S&P's rating for any ratings based on Moody’s scale.
(2) We had exposure to 2 and 4 counterparties for interest rate and foreign currency derivatives in a net gain position as ofMarch 31, 2012 and December 31, 2011, respectively. Those interest rate and foreign currency derivatives had notionalbalances of $2.4 billion and $127.5 billion as of March 31, 2012 and December 31, 2011, respectively.
(3) Includes defined benefit mortgage insurance contracts and swap credit enhancements accounted for as derivatives wherethe right of legal offset does not exist. Also includes exchange-traded derivatives, such as futures and interest rate swaps,which are settled daily through a clearinghouse.
(4) Represents the exposure to credit loss on derivative instruments, which we estimate using the fair value of all outstandingderivative contracts in a gain position. We net derivative gains and losses with the same counterparty where a legal rightof offset exists under an enforceable master netting agreement. This table excludes mortgage commitments accounted foras derivatives.
(5) Represents both cash and non-cash collateral posted by our counterparties to us. Does not include collateral held in excessof exposure. We reduce the value of non-cash collateral in accordance with the counterparty agreements to help ensurerecovery of any loss through the disposition of the collateral.
10. Segment Reporting
Our three reportable segments are: Single-Family, Multifamily, and Capital Markets. We use these threesegments to generate revenue and manage business risk, and each segment is based on the type of businessactivities it performs. We are working on reorganizing our company by function rather than by business in order
121

FANNIE MAE(In conservatorship)
NOTES TO CONDENSED CONSOLIDATED FINANCIAL STATEMENTS—(Continued)(UNAUDITED)
to improve our operational efficiencies and effectiveness. In future periods, we may change some of ourmanagement reporting and how we report our business segment results.
Under our segment reporting, the sum of the results for our three business segments does not equal ourcondensed consolidated statements of operations and comprehensive income (loss), as we separate the activityrelated to our consolidated trusts from the results generated by our three segments. Our segment financial resultsinclude directly attributable revenues and expenses. Additionally, we allocate to each of our segments: (1) capitalusing FHFA minimum capital requirements adjusted for over- or under-capitalization; (2) indirect administrativecosts; and (3) a provision or benefit for federal income taxes. In addition, we allocate intracompany guaranty feeincome as a charge from the Single-Family and Multifamily segments to Capital Markets for managing the creditrisk on mortgage loans held by the Capital Markets group. We also include an eliminations/adjustments categoryto reconcile our business segment results and the activity related to our consolidated trusts to net income (loss) inour condensed consolidated statements of operations and comprehensive income (loss).
The following tables display our segment results for the three months ended March 31, 2012 and 2011.
For the Three Months Ended March 31, 2012
Business Segments Other Activity/Reconciling Items
Single-Family Multifamily
CapitalMarkets
ConsolidatedTrusts(1)
Eliminations/Adjustments(2)
TotalResults
(Dollars in millions)Net interest (loss) income . . . . . . . . . . . . . . . . . . $ (379) $ (7) $3,541 $ 1,569 $ 473(3) $ 5,197(Provision) benefit for credit losses . . . . . . . . . . (2,053) 53 — — — (2,000)
Net interest (loss) income after provision forcredit losses . . . . . . . . . . . . . . . . . . . . . . . . . . . (2,432) 46 3,541 1,569 473 3,197
Guaranty fee income (expense) . . . . . . . . . . . . . . 1,911 243 (332) (1,159)(5) (601)(5) 62(5)
Investment gains, net . . . . . . . . . . . . . . . . . . . . . . 1 6 1,007 27 (925)(6) 116Net other-than-temporary impairments . . . . . . . . — — (64) — — (64)Fair value (losses) gains, net . . . . . . . . . . . . . . . . (1) — 170 52 62(7) 283Debt extinguishment (losses) gains, net . . . . . . . — — (70) 36 — (34)Gains from partnership investments . . . . . . . . . . — 11 — — (1) 10(8)
Fee and other income (expense) . . . . . . . . . . . . . 200 47 180 (108) (6) 313Administrative expenses . . . . . . . . . . . . . . . . . . . (380) (64) (120) — — (564)Foreclosed property expense . . . . . . . . . . . . . . . . (332) (7) — — — (339)Other expenses . . . . . . . . . . . . . . . . . . . . . . . . . . (235) (3) (8) — (16) (262)
Net (loss) income . . . . . . . . . . . . . . . . . . . . . . (1,268) 279 4,304 417 (1,014) 2,718Less: Net loss attributable to noncontrolling
interest . . . . . . . . . . . . . . . . . . . . . . . . . . . . . — — — — 1(9) 1
Net (loss) income attributable to FannieMae . . . . . . . . . . . . . . . . . . . . . . . . . . . . . . . . $(1,268) $279 $4,304 $ 417 $(1,013) $ 2,719
122

FANNIE MAE(In conservatorship)
NOTES TO CONDENSED CONSOLIDATED FINANCIAL STATEMENTS—(Continued)(UNAUDITED)
For the Three Months Ended March 31, 2011
Business Segments Other Activity/Reconciling Items
TotalResults
Single-Family Multifamily
CapitalMarkets
ConsolidatedTrusts(1)
Eliminations/Adjustments(2)
(Dollars in millions)Net interest (loss) income . . . . . . . . . . . . . . . . . . . $ (898) $ (9) $3,710 $ 1,574 $ 583(3) $ 4,960(Provision) benefit for credit losses (4) . . . . . . . . . . (10,618) 64 — — — (10,554)
Net interest (loss) income after provision for creditlosses . . . . . . . . . . . . . . . . . . . . . . . . . . . . . . . . . (11,516) 55 3,710 1,574 583 (5,594)
Guaranty fee income (expense) . . . . . . . . . . . . . . . 1,871 209 (399) (1,110)(5) (521)(5) 50(5)
Investment gains (losses), net . . . . . . . . . . . . . . . . 1 4 870 (26) (774)(6) 75Net other-than-temporary impairments . . . . . . . . . — — (44) — — (44)Fair value gains (losses), net . . . . . . . . . . . . . . . . . — — 218 (33) 104(7) 289Debt extinguishment (losses) gains, net . . . . . . . . — — (24) 37 — 13Losses from partnership investments . . . . . . . . . . — (12) — — — (12)(8)
Fee and other income (expense) . . . . . . . . . . . . . . 147 58 75 (92) (1) 187Administrative expenses . . . . . . . . . . . . . . . . . . . . (416) (68) (121) — — (605)Foreclosed property expense . . . . . . . . . . . . . . . . . (488) — — — — (488)Other (expenses) income . . . . . . . . . . . . . . . . . . . . (318) 6 (9) — (19) (340)
(Loss) income before federal income taxes . . . . . . (10,719) 252 4,276 350 (628) (6,469)(Provision) benefit for federal income taxes . . . . . (2) (5) 5 — — (2)
Net (loss) income attributable to Fannie Mae . . $(10,721) $247 $4,281 $ 350 $(628) $ (6,471)
(1) Represents activity related to the assets and liabilities of consolidated trusts in our condensed consolidated balance sheets.(2) Represents the elimination of intercompany transactions occurring between the three business segments and our
consolidated trusts, as well as other adjustments to reconcile to our consolidated results.(3) Represents the amortization expense of cost basis adjustments on securities that we own in our portfolio that on a GAAP
basis are eliminated.(4) Prior period amounts have been reclassified to conform to the current period presentation.(5) Represents the guaranty fees paid from consolidated trusts to the Single-Family and Multifamily segments. The
adjustment to guaranty fee income in the Eliminations/Adjustments column represents the elimination of the amortizationof deferred cash fees related to consolidated trusts that were re-established for segment reporting. Total guaranty feeincome is included in fee and other income in our condensed consolidated statements of operations and comprehensiveincome (loss).
(6) Primarily represents the removal of realized gains and losses on sales of Fannie Mae MBS classified as available-for-salesecurities that are issued by consolidated trusts and retained in the Capital Markets portfolio. The adjustment also includesthe removal of securitization gains (losses) recognized in the Capital Markets segment relating to portfolio securitizationtransactions that do not qualify for sale accounting under GAAP.
(7) Represents the removal of fair value adjustments on consolidated Fannie Mae MBS classified as trading that are retainedin the Capital Markets portfolio.
(8) Gains (losses) from partnership investments are included in other expenses in our condensed consolidated statements ofoperations and comprehensive income (loss).
(9) Represents the adjustment from equity method accounting to consolidation accounting for partnership investments that areconsolidated in our condensed consolidated balance sheets.
123
FANNIE MAE(In conservatorship)
NOTES TO CONDENSED CONSOLIDATED FINANCIAL STATEMENTS—(Continued)(UNAUDITED)
11. Concentrations of Credit Risk
Mortgage Seller/Servicers. Mortgage servicers collect mortgage and escrow payments from borrowers, paytaxes and insurance costs from escrow accounts, monitor and report delinquencies, and perform other requiredactivities on our behalf. Our mortgage seller/servicers are also obligated to repurchase loans or foreclosedproperties, or reimburse us for losses if the foreclosed property has been sold, under certain circumstances, suchas if it is determined that the mortgage loan did not meet our underwriting or eligibility requirements, if loanrepresentations and warranties are violated or if mortgage insurers rescind coverage. Our business with mortgageservicers is concentrated. Our ten largest single-family mortgage servicers, including their affiliates, serviced74% of our single-family guaranty book of business as of March 31, 2012, compared with 75% as ofDecember 31, 2011. Our ten largest multifamily mortgage servicers, including their affiliates, serviced 66% ofour multifamily guaranty book of business as of March 31, 2012, compared with 67% as of December 31, 2011.
If a significant seller/servicer counterparty, or a number of seller/servicers fails to meet its obligations to us, itcould result in a significant increase in our credit losses and have a material adverse affect on our results ofoperations, liquidity, financial condition and net worth.
Mortgage Insurers. Mortgage insurance “risk in force” represents our maximum potential loss recovery underthe applicable mortgage insurance policies. We had total mortgage insurance coverage risk in force of$91.2 billion on the single-family mortgage loans in our guaranty book of business as of March 31, 2012 andDecember 31, 2011, which represented 3% of our single-family guaranty book of business. Our primarymortgage insurance coverage risk in force was $87.3 billion as of March 31, 2012 and December 31, 2011. Ourpool mortgage insurance coverage risk in force was $3.8 billion and $3.9 billion as of March 31, 2012 andDecember 31, 2011, respectively. Nine mortgage insurance companies provided over 99% of our mortgageinsurance as of March 31, 2012 and December 31, 2011.
As of May 9, 2012, one of our mortgage insurance counterparties, PMI Mortgage Insurance Co. (“PMI”), haspublicly disclosed that it is now in receivership. Three of our mortgage insurance counterparties—TriadGuaranty Insurance Corporation (“Triad”), Republic Mortgage Insurance Company (“RMIC”), and PMI—havepublicly disclosed that they are in run-off. One mortgage insurer, Genworth Mortgage Insurance Corporation(“Genworth”), is currently operating pursuant to a waiver it received from its regulator of the state regulatorycapital requirements applicable to its main insurance writing entity. An additional two of our mortgageinsurers—Mortgage Guaranty Insurance Corporation (“MGIC”) and Radian Guaranty, Inc. (“Radian”)—havedisclosed that, in the absence of additional capital contributions to their insurance writing entity, their capitalmight fall below state regulatory capital requirements in the future. These six mortgage insurers provided acombined $73.3 billion, or 80%, of our risk in force mortgage insurance coverage of our single-family guarantybook of business as of March 31, 2012.
The current weakened financial condition of our mortgage insurer counterparties creates an increased risk thatthese counterparties will fail to fulfill their obligations to reimburse us for claims under insurance policies. If wedetermine that it is probable that we will not collect all of our claims from one or more of these mortgage insurercounterparties, it could result in an increase in our loss reserves, which could adversely affect our earnings,liquidity, financial condition and net worth.
Our total loss reserves incorporate an estimated recovery amount from mortgage insurance coverage. Weevaluate the financial condition of our mortgage insurer counterparties and adjust the contractually due mortgageinsurance benefit for collectability in order to ensure that our total loss reserves reflect probable losses as of thebalance sheet date. The following table displays our estimated benefit from mortgage insurers as of March 31,2012, and December 31, 2011 that reduce our total loss reserves.
124

FANNIE MAE(In conservatorship)
NOTES TO CONDENSED CONSOLIDATED FINANCIAL STATEMENTS—(Continued)(UNAUDITED)
As of
March 31,2012
December 31,2011
(Dollars in millions)
Contractual mortgage insurance benefit . . . . . . . . . . . . . . . . . . . . . . . . . . . . $15,237 $15,099Less: Collectability adjustment(1) . . . . . . . . . . . . . . . . . . . . . . . . . . . . . . . . . . 2,571 2,867
Estimated benefit included in total loss reserves . . . . . . . . . . . . . . . . . . . . . . $12,666 $12,232
(1) Represents an adjustment that reduces the contractual benefit for our assessment of our mortgage insurer counterparties’inability to fully pay the contractual mortgage insurance claims.
We had outstanding receivables of $3.7 billion recorded in “Other assets” in our condensed consolidated balancesheets as of March 31, 2012 and $3.6 billion as of December 31, 2011 related to amounts claimed on insured,defaulted loans that we have not yet received, of which $894 million as of March 31, 2012 and $639 million as ofDecember 31, 2011 was due from our mortgage seller/servicers. We assessed the total outstanding receivablesfor collectability, and they are recorded net of a valuation allowance of $786 million as of March 31, 2012 and$570 million as of December 31, 2011. These mortgage insurance receivables are short-term in nature, having anaverage duration of approximately six months, and the valuation allowance reduces our claim receivable to theamount which is considered probable of collection as of March 31, 2012 and December 31, 2011.
We received proceeds under our primary and pool mortgage insurance policies for single-family loans of$1.3 billion during the three months ended March 31, 2012 and $1.6 billion during the three months endedMarch 31, 2011.
Derivatives Counterparties. For information on credit risk associated with our derivatives transactions refer to“Note 9, Derivative Instruments.”
12. Fair Value
We use fair value measurements for the initial recording of certain assets and liabilities and periodicremeasurement of certain assets and liabilities on a recurring or nonrecurring basis.
Fair Value Measurement
Fair value measurement guidance defines fair value, establishes a framework for measuring fair value and setsforth disclosures around fair value measurements. This guidance applies whenever other accounting guidancerequires or permits assets or liabilities to be measured at fair value. The guidance establishes a three-level fairvalue hierarchy that prioritizes the inputs into the valuation techniques used to measure fair value. The fair valuehierarchy gives the highest priority, Level 1, to measurements based on unadjusted quoted prices in activemarkets for identical assets or liabilities. The next highest priority, Level 2, is given to measurements of assetsand liabilities based on limited observable inputs or observable inputs for similar assets and liabilities. Thelowest priority, Level 3, is given to measurements based on unobservable inputs.
Effective January 1, 2012, we adopted new accounting guidance that requires enhanced disclosures about fairvalue measurement. Upon adoption of the new fair value guidance, we made changes to the principal marketsthat we use to estimate the fair value of the following categories of mortgage loans: (a) for loans that have beenmodified but have been reperforming for nine months or more, we changed to the whole loan market; (b) forloans that are one month delinquent, we changed to the GSE securitization market; and (c) for loans that are twomonths and three months delinquent, we changed to the whole loan market. The impact of making these changesto our principal markets was a net decrease in the estimated fair value of our loans of $24.4 billion as ofMarch 31, 2012.
125

FANNIE MAE(In conservatorship)
NOTES TO CONDENSED CONSOLIDATED FINANCIAL STATEMENTS—(Continued)(UNAUDITED)
In addition, we enhanced our fair value estimation process for HARP loans as of March 31, 2012 to use themodified build-up approach, as described in “Fair Value of Financial Instruments – HARPLoans.” Previously, we measured the fair value of these loans using our standard build-up approach. The impactof this enhancement was an increase in the estimated fair value of HARP loans of $7.4 billion as of March 31,2012.
Recurring Changes in Fair Value
The following tables display our assets and liabilities measured in our condensed consolidated balance sheets atfair value on a recurring basis subsequent to initial recognition, including instruments for which we have electedthe fair value option as of March 31, 2012 and December 31, 2011.
126
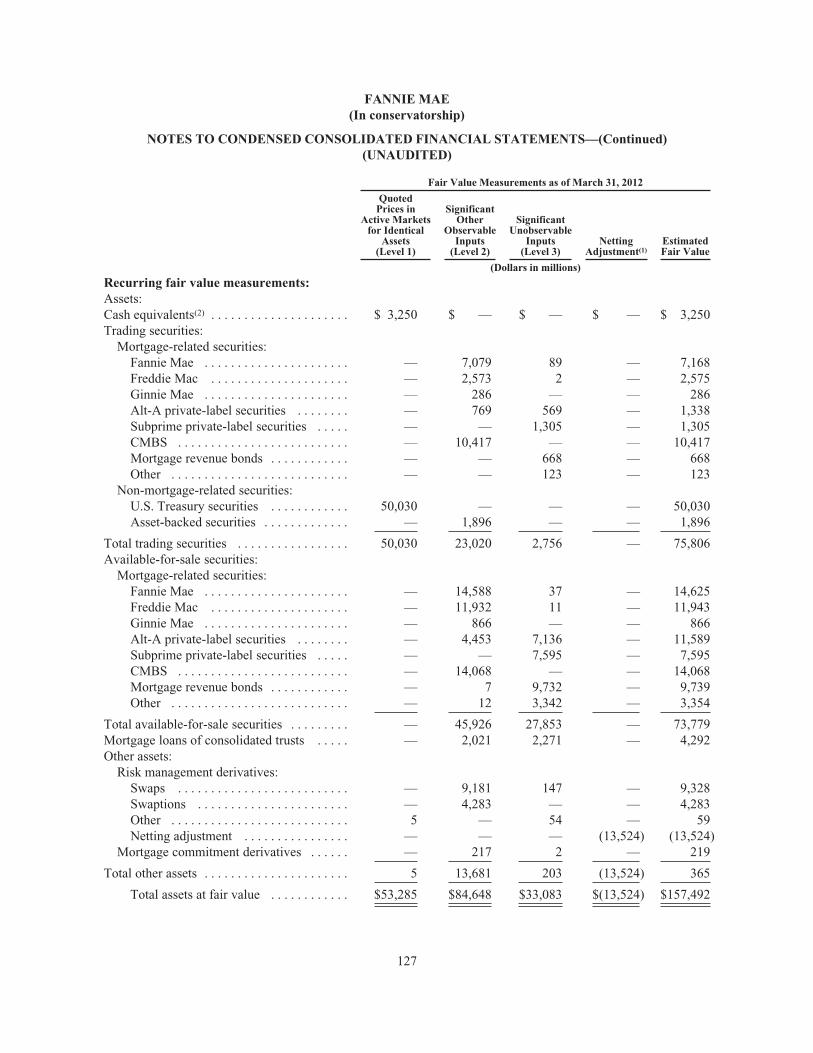
FANNIE MAE(In conservatorship)
NOTES TO CONDENSED CONSOLIDATED FINANCIAL STATEMENTS—(Continued)(UNAUDITED)
Fair Value Measurements as of March 31, 2012
QuotedPrices in
Active Marketsfor Identical
Assets(Level 1)
SignificantOther
ObservableInputs
(Level 2)
SignificantUnobservable
Inputs(Level 3)
NettingAdjustment(1)
EstimatedFair Value
(Dollars in millions)
Recurring fair value measurements:Assets:Cash equivalents(2) . . . . . . . . . . . . . . . . . . . . . $ 3,250 $ — $ — $ — $ 3,250Trading securities:
Mortgage-related securities:Fannie Mae . . . . . . . . . . . . . . . . . . . . . . — 7,079 89 — 7,168Freddie Mac . . . . . . . . . . . . . . . . . . . . . — 2,573 2 — 2,575Ginnie Mae . . . . . . . . . . . . . . . . . . . . . . — 286 — — 286Alt-A private-label securities . . . . . . . . — 769 569 — 1,338Subprime private-label securities . . . . . — — 1,305 — 1,305CMBS . . . . . . . . . . . . . . . . . . . . . . . . . . — 10,417 — — 10,417Mortgage revenue bonds . . . . . . . . . . . . — — 668 — 668Other . . . . . . . . . . . . . . . . . . . . . . . . . . . — — 123 — 123
Non-mortgage-related securities:U.S. Treasury securities . . . . . . . . . . . . 50,030 — — — 50,030Asset-backed securities . . . . . . . . . . . . . — 1,896 — — 1,896
Total trading securities . . . . . . . . . . . . . . . . . 50,030 23,020 2,756 — 75,806Available-for-sale securities:
Mortgage-related securities:Fannie Mae . . . . . . . . . . . . . . . . . . . . . . — 14,588 37 — 14,625Freddie Mac . . . . . . . . . . . . . . . . . . . . . — 11,932 11 — 11,943Ginnie Mae . . . . . . . . . . . . . . . . . . . . . . — 866 — — 866Alt-A private-label securities . . . . . . . . — 4,453 7,136 — 11,589Subprime private-label securities . . . . . — — 7,595 — 7,595CMBS . . . . . . . . . . . . . . . . . . . . . . . . . . — 14,068 — — 14,068Mortgage revenue bonds . . . . . . . . . . . . — 7 9,732 — 9,739Other . . . . . . . . . . . . . . . . . . . . . . . . . . . — 12 3,342 — 3,354
Total available-for-sale securities . . . . . . . . . — 45,926 27,853 — 73,779Mortgage loans of consolidated trusts . . . . . — 2,021 2,271 — 4,292Other assets:
Risk management derivatives:Swaps . . . . . . . . . . . . . . . . . . . . . . . . . . — 9,181 147 — 9,328Swaptions . . . . . . . . . . . . . . . . . . . . . . . — 4,283 — — 4,283Other . . . . . . . . . . . . . . . . . . . . . . . . . . . 5 — 54 — 59Netting adjustment . . . . . . . . . . . . . . . . — — — (13,524) (13,524)
Mortgage commitment derivatives . . . . . . — 217 2 — 219
Total other assets . . . . . . . . . . . . . . . . . . . . . . 5 13,681 203 (13,524) 365
Total assets at fair value . . . . . . . . . . . . $53,285 $84,648 $33,083 $(13,524) $157,492
127

FANNIE MAE(In conservatorship)
NOTES TO CONDENSED CONSOLIDATED FINANCIAL STATEMENTS—(Continued)(UNAUDITED)
Fair Value Measurements as of March 31, 2012
QuotedPrices inActive
Markets forIdentical
Assets(Level 1)
SignificantOther
ObservableInputs
(Level 2)
SignificantUnobservable
Inputs(Level 3)
NettingAdjustment(1)
EstimatedFair Value
(Dollars in millions)
Liabilities:
Long-term debt:
Of Fannie Mae:
Senior fixed . . . . . . . . . . . . . . . . . . . . . . . . $— $ 426 $ — $ — $ 426
Senior floating . . . . . . . . . . . . . . . . . . . . . . — — 399 — 399
Total of Fannie Mae . . . . . . . . . . . . . . . . . . . . — 426 399 — 825
Of consolidated trusts . . . . . . . . . . . . . . . . . . . — 3,329 950 — 4,279
Total long-term debt . . . . . . . . . . . . . . . . . . . . . . — 3,755 1,349 — 5,104
Other liabilities:
Risk management derivatives:
Swaps . . . . . . . . . . . . . . . . . . . . . . . . . . . . . — 17,116 142 — 17,258
Swaptions . . . . . . . . . . . . . . . . . . . . . . . . . . — 2,049 — — 2,049
Other . . . . . . . . . . . . . . . . . . . . . . . . . . . . . . 5 — — — 5
Netting adjustment . . . . . . . . . . . . . . . . . . . — — — (19,053) (19,053)
Mortgage commitment derivatives . . . . . . . . — 246 17 — 263
Total other liabilities . . . . . . . . . . . . . . . . . . . . . 5 19,411 159 (19,053) 522
Total liabilities at fair value . . . . . . . . . . . . $ 5 $23,166 $1,508 $(19,053) $ 5,626
128

FANNIE MAE(In conservatorship)
NOTES TO CONDENSED CONSOLIDATED FINANCIAL STATEMENTS—(Continued)(UNAUDITED)
Fair Value Measurements as of December 31, 2011
QuotedPrices inActive
Markets forIdentical
Assets(Level 1)
SignificantOther
ObservableInputs
(Level 2)
SignificantUnobservable
Inputs(Level 3)
NettingAdjustment(1)
EstimatedFair Value
(Dollars in millions)
Assets:Cash equivalents(2) . . . . . . . . . . . . . . . . . . . . . . . $ 600 $ — $ — $ — $ 600Trading securities:
Mortgage-related securities:Fannie Mae . . . . . . . . . . . . . . . . . . . . . . . . . — 5,687 1,737 — 7,424Freddie Mac . . . . . . . . . . . . . . . . . . . . . . . . — 2,732 — — 2,732Ginnie Mae . . . . . . . . . . . . . . . . . . . . . . . . . — 278 9 — 287Alt-A private-label securities . . . . . . . . . . . — 1,004 345 — 1,349Subprime private-label securities . . . . . . . . — — 1,280 — 1,280CMBS . . . . . . . . . . . . . . . . . . . . . . . . . . . . . — 10,411 — — 10,411Mortgage revenue bonds . . . . . . . . . . . . . . . — — 724 — 724Other . . . . . . . . . . . . . . . . . . . . . . . . . . . . . . — — 143 — 143
Non-mortgage-related securities:U.S. Treasury securities . . . . . . . . . . . . . . . 47,737 — — — 47,737Asset-backed securities . . . . . . . . . . . . . . . . — 2,111 — — 2,111
Total trading securities . . . . . . . . . . . . . . . . . . . . 47,737 22,223 4,238 — 74,198Available-for-sale securities:
Mortgage-related securities:Fannie Mae . . . . . . . . . . . . . . . . . . . . . . . . . — 15,904 946 — 16,850Freddie Mac . . . . . . . . . . . . . . . . . . . . . . . . — 12,811 12 — 12,823Ginnie Mae . . . . . . . . . . . . . . . . . . . . . . . . . — 902 — — 902Alt-A private-label securities . . . . . . . . . . . — 4,427 7,256 — 11,683Subprime private-label securities . . . . . . . . — — 7,586 — 7,586CMBS . . . . . . . . . . . . . . . . . . . . . . . . . . . . . — 14,026 — — 14,026Mortgage revenue bonds . . . . . . . . . . . . . . . — 7 10,247 — 10,254Other . . . . . . . . . . . . . . . . . . . . . . . . . . . . . . — 13 3,445 — 3,458
Total available-for-sale securities . . . . . . . . . . . . — 48,090 29,492 — 77,582Mortgage loans of consolidated trusts . . . . . . . . — 1,292 2,319 — 3,611Other assets:
Risk management derivatives:Swaps . . . . . . . . . . . . . . . . . . . . . . . . . . . . . — 9,247 170 — 9,417Swaptions . . . . . . . . . . . . . . . . . . . . . . . . . . — 6,536 — — 6,536Other . . . . . . . . . . . . . . . . . . . . . . . . . . . . . . — 1 51 — 52Netting adjustment . . . . . . . . . . . . . . . . . . . — — — (15,829) (15,829)
Mortgage commitment derivatives . . . . . . . . . — 368 17 — 385
Total other assets . . . . . . . . . . . . . . . . . . . . . . . . — 16,152 238 (15,829) 561
Total assets at fair value . . . . . . . . . . . . . . . $48,337 $87,757 $36,287 $(15,829) $156,552
129

FANNIE MAE(In conservatorship)
NOTES TO CONDENSED CONSOLIDATED FINANCIAL STATEMENTS—(Continued)(UNAUDITED)
Fair Value Measurements as of December 31, 2011
QuotedPrices inActive
Markets forIdentical
Assets(Level 1)
SignificantOther
ObservableInputs
(Level 2)
SignificantUnobservable
Inputs(Level 3)
NettingAdjustment(1)
EstimatedFair Value
(Dollars in millions)
Liabilities:
Long-term debt:
Of Fannie Mae:
Senior fixed . . . . . . . . . . . . . . . . . . . . . . . . . $— $ 432 $ — $ — $ 432
Senior floating . . . . . . . . . . . . . . . . . . . . . . . — — 406 — 406
Total of Fannie Mae . . . . . . . . . . . . . . . . . . . . — 432 406 — 838
Of consolidated trusts . . . . . . . . . . . . . . . . . . . — 3,174 765 — 3,939
Total long-term debt . . . . . . . . . . . . . . . . . . . . . . — 3,606 1,171 — 4,777
Other liabilities:
Risk management derivatives:
Swaps . . . . . . . . . . . . . . . . . . . . . . . . . . . . . — 18,661 167 — 18,828
Swaptions . . . . . . . . . . . . . . . . . . . . . . . . . . — 3,432 — — 3,432
Netting adjustment . . . . . . . . . . . . . . . . . . . — — — (21,898) (21,898)
Mortgage commitment derivatives . . . . . . . . . — 548 6 — 554
Total other liabilities . . . . . . . . . . . . . . . . . . . . . . — 22,641 173 (21,898) 916
Total liabilities at fair value . . . . . . . . . . . . $— $26,247 $1,344 $(21,898) $ 5,693
(1) Derivative contracts are reported on a gross basis by level. The netting adjustment represents the effect of the legal right tooffset under legally enforceable master netting agreements to settle with the same counterparty on a net basis, as well ascash collateral.
(2) Cash equivalents are comprised of U.S. Treasury Bills that are classified as Level 1.
130

FANNIE MAE(In conservatorship)
NOTES TO CONDENSED CONSOLIDATED FINANCIAL STATEMENTS—(Continued)(UNAUDITED)
The following tables display a reconciliation of all assets and liabilities measured at fair value on a recurringbasis using significant unobservable inputs (Level 3) for the three months ended March 31, 2012 and 2011. Thetables also display gains and losses due to changes in fair value, including both realized and unrealized gains andlosses, recognized in our condensed consolidated statements of operations and comprehensive income (loss) forLevel 3 assets and liabilities for the three months ended March 31, 2012 and 2011. When assets and liabilities aretransferred between levels, we recognize the transfer as of the end of the period.
Fair Value Measurements Using Significant Unobservable Inputs (Level 3)For the Three Months Ended March 31, 2012
Balance,December 31,
2011
Total Gains or (Losses)(Realized/Unrealized)
Net UnrealizedGains (Losses)
Included inNet Income
(Loss) Relatedto Assets and
Liabilities StillHeld as ofMarch 31,
2012(5)
Included inNet
Income(Loss)
Included inOther
ComprehensiveIncome(1) Purchases(2) Sales(2) Issues(3) Settlements(3)
Transfersout of
Level 3(4)
Transfersinto
Level 3(4)
Balance,March 31,
2012
(Dollars in millions)Trading securities:
Mortgage-related:Fannie Mae . . . . . . . $ 1,737 $ 5 $ — $ — $(33) $ — $ (104) $(1,581) $ 65 $ 89 $ —Freddie Mac . . . . . . . — — — — — — — — 2 2 —Ginnie Mae . . . . . . . 9 — — — — — — (9) — — —Alt-A private-label
securities . . . . . . . 345 13 — — — — (17) — 228 569 13Subprime private-
label securities . . . 1,280 59 — — — — (34) — — 1,305 59Mortgage revenue
bonds . . . . . . . . . . 724 (54) — — — — (2) — — 668(55)
Other . . . . . . . . . . . . 143 (19) — — — — (1) — — 123 (19)
Total trading securities . . . $ 4,238 $ 4 $ — $ — $(33) $ — $ (158) $(1,590) $295 $ 2,756 $ (2)
Available-for-salesecurities:Mortgage-related:
Fannie Mae . . . . . . . $ 946 $ — $ (8) $ 1 $ (1) $ — $ (16) $ (895) $ 10 $ 37 $ —Freddie Mac . . . . . . . 12 — — — — — (1) — — 11 —Alt-A private-label
securities . . . . . . . 7,256 (17) 166 — — — (262) (985) 978 7,136 —Subprime private-
label securities . . . 7,586 35 303 — — — (329) — — 7,595 —Mortgage revenue
bonds . . . . . . . . . . 10,247 2 (137) — (24) — (356) — — 9,732 —Other . . . . . . . . . . . . 3,445 6 (26) — — — (83) — — 3,342 —
Total available-for-salesecurities . . . . . . . . . . . $29,492 $ 26 $ 298 $ 1 $(25) $ — $(1,047) $(1,880) $988 $27,853 $ —
Mortgage loans ofconsolidated trusts . . . . $ 2,319 $ 73 $ — $245 $ — $ — $ (59) $ (318) $ 11 $ 2,271 $ 17
Net derivatives . . . . . . . . 65 7 — — — (3) (25) — — 44 3Long-term debt:Of Fannie Mae:
Senior floating . . . . . $ (406) $ 7 $ — $ — $ — $ — $ — $ — $ — $ (399) $ 7Of consolidated
trusts . . . . . . . . . . . (765) (9) — — — (267) 28 110 (47) (950) (8)
Total long-term debt . . . . $ (1,171) $ (2) $ — $ — $ — $(267) $ 28 $ 110 $ (47) $ (1,349) $ (1)
131

FANNIE MAE(In conservatorship)
NOTES TO CONDENSED CONSOLIDATED FINANCIAL STATEMENTS—(Continued)(UNAUDITED)
Fair Value Measurements Using Significant Unobservable Inputs (Level 3)For the Three Months Ended March 31, 2011
Total Gains or (Losses)(Realized/Unrealized)
Net UnrealizedGains (Losses)Included in NetIncome (Loss)
Related toAssets and
Liabilities StillHeld as ofMarch 31,
2011(5)
Balance,December 31,
2010
Includedin Net
Income(Loss)
Included inOther
ComprehensiveIncome(1) Purchases(2) Sales(2) Settlements(3)
Transfersout of
Level 3(4)
Transfersinto
Level 3(4)
Balance,March 31,
2011
(Dollars in millions)Trading securities:
Mortgage-related:Fannie Mae . . . . . . $ 2,202 $ (13) $ — $ — $(15) $ (132) $(391) $ — $ 1,651 $(10)Alt-A private-label
securities . . . . . . 20 — — — — — — — 20 —Subprime
private-labelsecurities . . . . . . 1,581 11 — — — (45) — — 1,547 11
Mortgage revenuebonds . . . . . . . . . 609 — — — — (3) — — 606 3
Other . . . . . . . . . . . 152 4 — — — (1) — — 155 4Non-mortgage-related:
Asset-backedsecurities . . . . . . 12 — — — — (3) (9) 2 2 —
Total trading securities . . $ 4,576 $ 2 $ — $ — $(15) $ (184) $(400) $ 2 $ 3,981 $ 8
Available-for-salesecurities:Mortgage-related:
Fannie Mae . . . . . . $ 114 $ — $ 4 $416 $(15) $ (2) $(101) $130 $ 546 $ —Freddie Mac . . . . . . 3 — — — — — — 9 12 —Alt-A private-label
securities . . . . . . 7,049 (2) 104 — — (258) (317) 660 7,236 —Subprime
private-labelsecurities . . . . . . 9,932 130 (58) — — (344) — — 9,660 —
Mortgage revenuebonds . . . . . . . . . 11,030 (2) 21 — (42) (475) — — 10,532 —
Other . . . . . . . . . . . 3,806 1 71 — — (102) — — 3,776 —
Total available-for-salesecurities . . . . . . . . . . $31,934 $127 $142 $416 $(57) $(1,181) $(418) $799 $31,762 $ —
Mortgage loans ofconsolidated trusts . . . $ 2,207 $ 11 $ — $ 15 $ — $ (79) $ (6) $ 73 $ 2,221 $ 11
Net derivatives . . . . . . . . 104 14 — — — — — — 118 5Long-term debt:
Of Fannie Mae:Senior floating . . . . $ (421) $ (22) $ — $ — $ — $ 20 $ — $ — $ (423) $(22)
Of consolidatedtrusts . . . . . . . . . . . (627) (35) — — — 22 22 (49) (667) (35)
Total long-term debt . . . $ (1,048) $ (57) $ — $ — $ — $ 42 $ 22 $ (49) $ (1,090) $(57)
(1) Gains (losses) included in other comprehensive income are included in “Changes in unrealized losses onavailable-for-sale securities, net of reclassification adjustments and taxes” in the condensed consolidated statement ofoperations and comprehensive income (loss).
(2) Purchases and sales include activity related to the consolidation and deconsolidation of assets of securitization trusts.
132
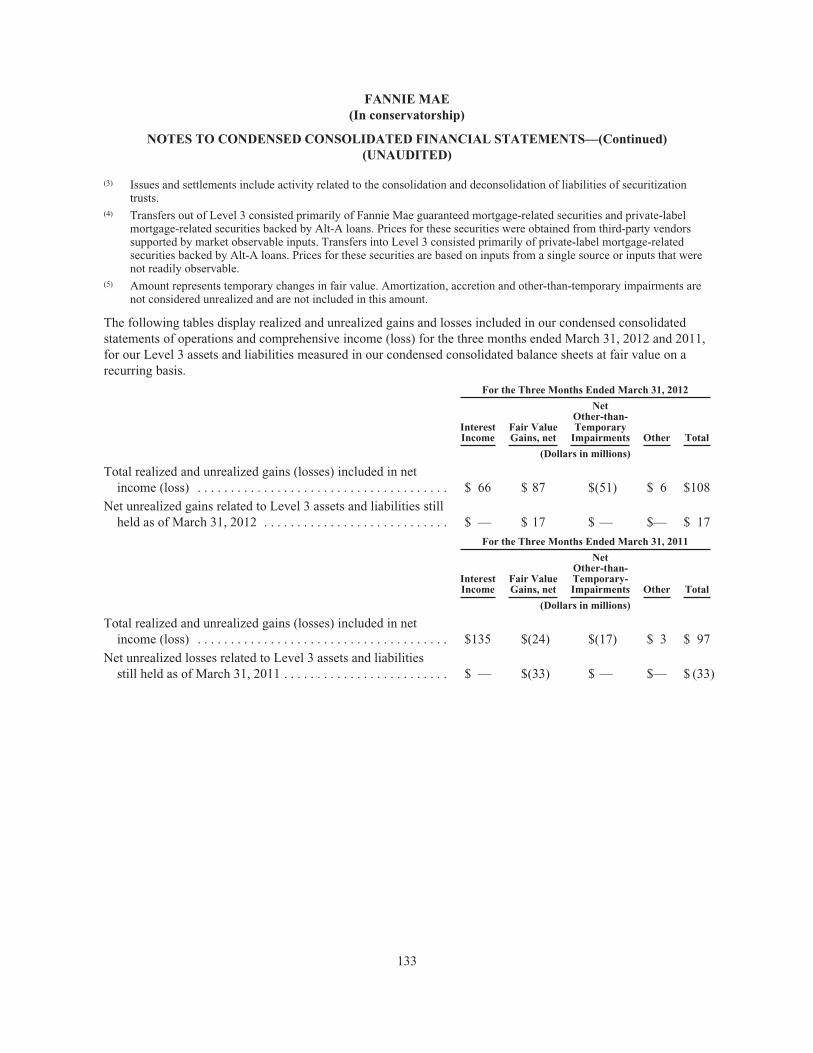
FANNIE MAE(In conservatorship)
NOTES TO CONDENSED CONSOLIDATED FINANCIAL STATEMENTS—(Continued)(UNAUDITED)
(3) Issues and settlements include activity related to the consolidation and deconsolidation of liabilities of securitizationtrusts.
(4) Transfers out of Level 3 consisted primarily of Fannie Mae guaranteed mortgage-related securities and private-labelmortgage-related securities backed by Alt-A loans. Prices for these securities were obtained from third-party vendorssupported by market observable inputs. Transfers into Level 3 consisted primarily of private-label mortgage-relatedsecurities backed by Alt-A loans. Prices for these securities are based on inputs from a single source or inputs that werenot readily observable.
(5) Amount represents temporary changes in fair value. Amortization, accretion and other-than-temporary impairments arenot considered unrealized and are not included in this amount.
The following tables display realized and unrealized gains and losses included in our condensed consolidatedstatements of operations and comprehensive income (loss) for the three months ended March 31, 2012 and 2011,for our Level 3 assets and liabilities measured in our condensed consolidated balance sheets at fair value on arecurring basis.
For the Three Months Ended March 31, 2012
InterestIncome
Fair ValueGains, net
NetOther-than-Temporary
Impairments Other Total
(Dollars in millions)
Total realized and unrealized gains (losses) included in netincome (loss) . . . . . . . . . . . . . . . . . . . . . . . . . . . . . . . . . . . . . . $ 66 $ 87 $(51) $ 6 $108
Net unrealized gains related to Level 3 assets and liabilities stillheld as of March 31, 2012 . . . . . . . . . . . . . . . . . . . . . . . . . . . . $ — $ 17 $ — $— $ 17
For the Three Months Ended March 31, 2011
InterestIncome
Fair ValueGains, net
NetOther-than-Temporary-Impairments Other Total
(Dollars in millions)
Total realized and unrealized gains (losses) included in netincome (loss) . . . . . . . . . . . . . . . . . . . . . . . . . . . . . . . . . . . . . . $135 $(24) $(17) $ 3 $ 97
Net unrealized losses related to Level 3 assets and liabilitiesstill held as of March 31, 2011 . . . . . . . . . . . . . . . . . . . . . . . . . $ — $(33) $ — $— $ (33)
133
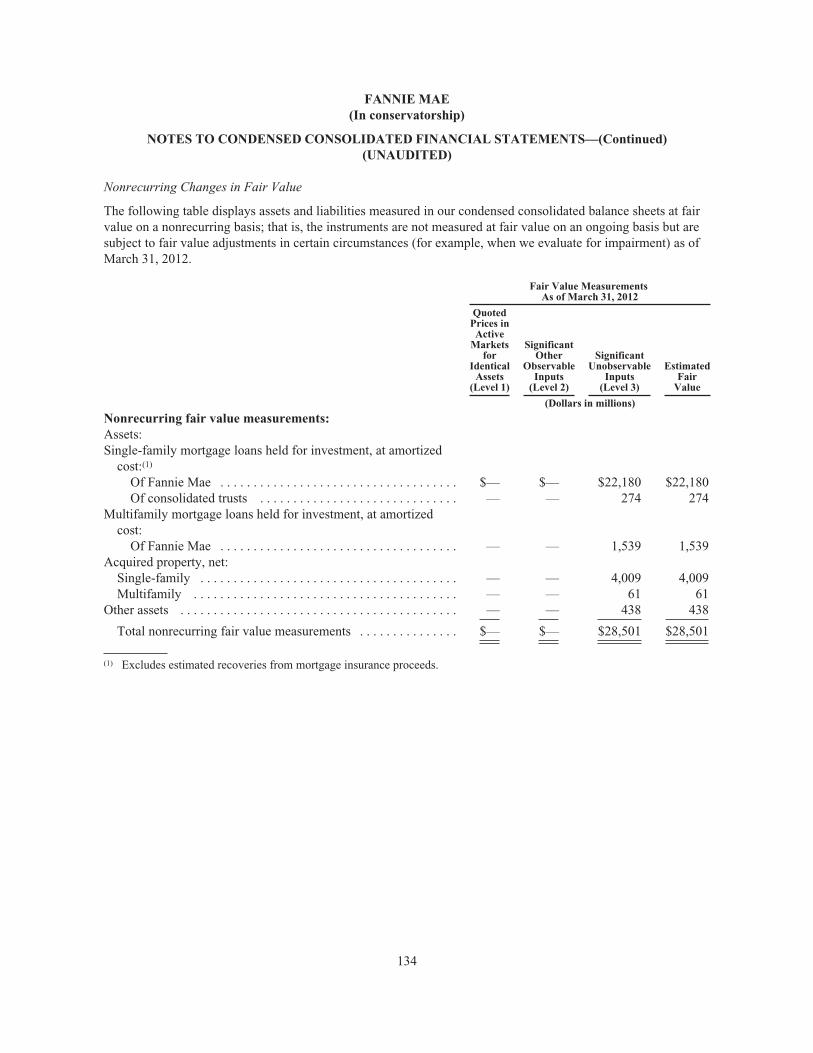
FANNIE MAE(In conservatorship)
NOTES TO CONDENSED CONSOLIDATED FINANCIAL STATEMENTS—(Continued)(UNAUDITED)
Nonrecurring Changes in Fair Value
The following table displays assets and liabilities measured in our condensed consolidated balance sheets at fairvalue on a nonrecurring basis; that is, the instruments are not measured at fair value on an ongoing basis but aresubject to fair value adjustments in certain circumstances (for example, when we evaluate for impairment) as ofMarch 31, 2012.
Fair Value MeasurementsAs of March 31, 2012
QuotedPrices inActive
Marketsfor
IdenticalAssets
(Level 1)
SignificantOther
ObservableInputs
(Level 2)
SignificantUnobservable
Inputs(Level 3)
EstimatedFair
Value
(Dollars in millions)
Nonrecurring fair value measurements:Assets:Single-family mortgage loans held for investment, at amortized
cost:(1)
Of Fannie Mae . . . . . . . . . . . . . . . . . . . . . . . . . . . . . . . . . . . . $— $— $22,180 $22,180Of consolidated trusts . . . . . . . . . . . . . . . . . . . . . . . . . . . . . . — — 274 274
Multifamily mortgage loans held for investment, at amortizedcost:
Of Fannie Mae . . . . . . . . . . . . . . . . . . . . . . . . . . . . . . . . . . . . — — 1,539 1,539Acquired property, net:
Single-family . . . . . . . . . . . . . . . . . . . . . . . . . . . . . . . . . . . . . . . — — 4,009 4,009Multifamily . . . . . . . . . . . . . . . . . . . . . . . . . . . . . . . . . . . . . . . . — — 61 61
Other assets . . . . . . . . . . . . . . . . . . . . . . . . . . . . . . . . . . . . . . . . . . — — 438 438
Total nonrecurring fair value measurements . . . . . . . . . . . . . . . $— $— $28,501 $28,501
(1) Excludes estimated recoveries from mortgage insurance proceeds.
134

FANNIE MAE(In conservatorship)
NOTES TO CONDENSED CONSOLIDATED FINANCIAL STATEMENTS—(Continued)(UNAUDITED)
The following table displays assets and liabilities measured in our condensed consolidated balance sheets at fairvalue on a nonrecurring basis and the gains or losses recognized for these assets and liabilities for the threemonths ended March 31, 2011.
Fair Value MeasurementsFor the Three Months Ended March 31, 2011
For the ThreeMonths EndedMarch 31, 2011
QuotedPrices inActive
Markets forIdentical
Assets(Level 1)
SignificantOther
ObservableInputs
(Level 2)
SignificantUnobservable
Inputs(Level 3)
EstimatedFair
Value Total Losses
(Dollars in millions)
Assets:Mortgage loans held for sale, at lower of cost
or fair value . . . . . . . . . . . . . . . . . . . . . . . . . . $— $89 $ 131 $ 220 $ (5)Single-family mortgage loans held for
investment, at amortized cost:Of Fannie Mae . . . . . . . . . . . . . . . . . . . . . . — — 27,265 27,265(1) (1,014)Of consolidated trusts . . . . . . . . . . . . . . . . — — 633 633(1) (80)
Multifamily mortgage loans held forinvestment, at amortized cost:Of Fannie Mae . . . . . . . . . . . . . . . . . . . . . . . . — — 1,028 1,028(1) (80)
Acquired property, net:Single-family . . . . . . . . . . . . . . . . . . . . . . . . . — — 12,114 12,114(2) (811)Multifamily . . . . . . . . . . . . . . . . . . . . . . . . . . — — 93 93(2) (16)
Other assets . . . . . . . . . . . . . . . . . . . . . . . . . . . . 1,402 1,402 (30)
Total assets at fair value . . . . . . . . . . . . . . . . $— $89 $42,666 $42,755 $(2,036)
(1) Includes $1.3 billion of mortgage loans held for investment that were liquidated or transferred to foreclosed properties asof March 31, 2011.
(2) Includes $4.1 billion of acquired properties that were sold or transferred as of March 31, 2011.
The following table displays valuation techniques and the range and weighted-average of significantunobservable inputs for our Level 3 assets and liabilities measured at fair value on a recurring basis as ofMarch 31, 2012.
135
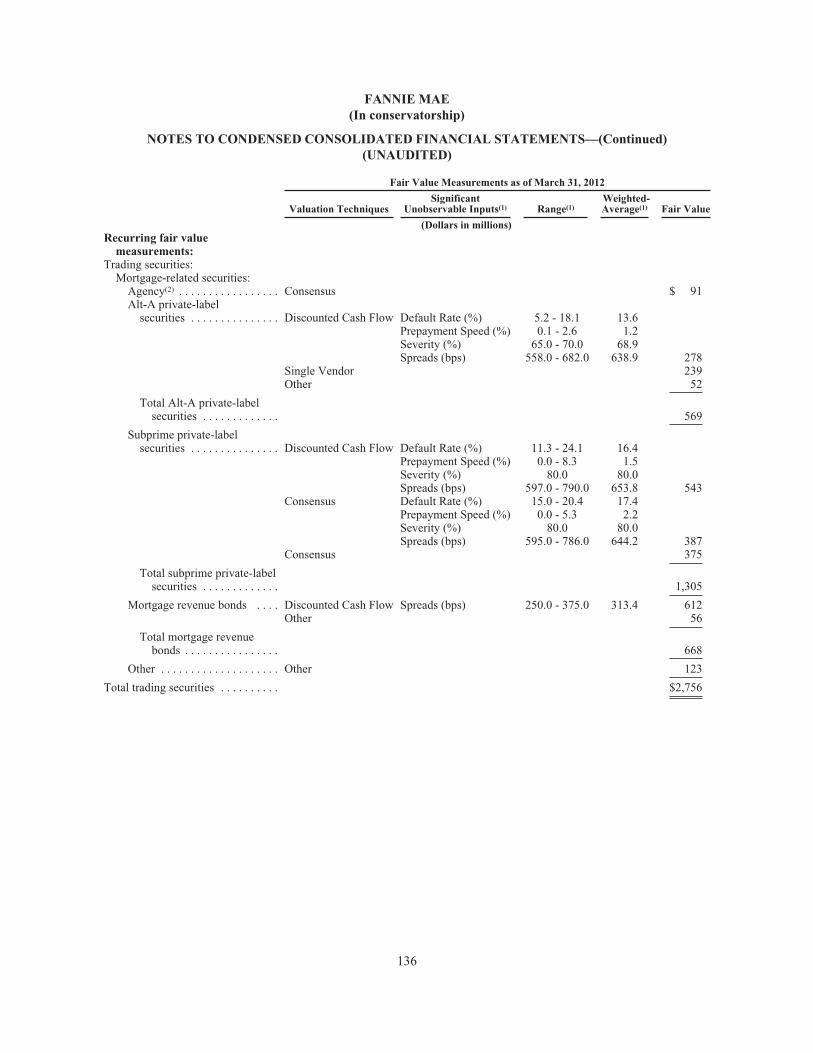
FANNIE MAE(In conservatorship)
NOTES TO CONDENSED CONSOLIDATED FINANCIAL STATEMENTS—(Continued)(UNAUDITED)
Fair Value Measurements as of March 31, 2012
Valuation TechniquesSignificant
Unobservable Inputs(1) Range(1)Weighted-Average(1) Fair Value
(Dollars in millions)Recurring fair value
measurements:Trading securities:
Mortgage-related securities:Agency(2) . . . . . . . . . . . . . . . . . Consensus $ 91Alt-A private-label
securities . . . . . . . . . . . . . . . Discounted Cash Flow Default Rate (%) 5.2 - 18.1 13.6Prepayment Speed (%) 0.1 - 2.6 1.2Severity (%) 65.0 - 70.0 68.9Spreads (bps) 558.0 - 682.0 638.9 278
Single Vendor 239Other 52
Total Alt-A private-labelsecurities . . . . . . . . . . . . . 569
Subprime private-labelsecurities . . . . . . . . . . . . . . . Discounted Cash Flow Default Rate (%) 11.3 - 24.1 16.4
Prepayment Speed (%) 0.0 - 8.3 1.5Severity (%) 80.0 80.0Spreads (bps) 597.0 - 790.0 653.8 543
Consensus Default Rate (%) 15.0 - 20.4 17.4Prepayment Speed (%) 0.0 - 5.3 2.2Severity (%) 80.0 80.0Spreads (bps) 595.0 - 786.0 644.2 387
Consensus 375
Total subprime private-labelsecurities . . . . . . . . . . . . . 1,305
Mortgage revenue bonds . . . . Discounted Cash Flow Spreads (bps) 250.0 - 375.0 313.4 612Other 56
Total mortgage revenuebonds . . . . . . . . . . . . . . . . 668
Other . . . . . . . . . . . . . . . . . . . . Other 123
Total trading securities . . . . . . . . . . $2,756
136

FANNIE MAE(In conservatorship)
NOTES TO CONDENSED CONSOLIDATED FINANCIAL STATEMENTS—(Continued)(UNAUDITED)
Fair Value Measurements as of March 31, 2012
Valuation TechniquesSignificant
Unobservable Inputs(1) Range(1)Weighted-Average(1) Fair Value
(Dollars in millions)Available-for-sale securities:
Mortgage-related securities:Agency(2) . . . . . . . . . . . . . . . . . . . . . . . . . Other $ 48Alt-A private-label securities . . . . . . . . . . Consensus Default Rate (%) 0.0 - 13.1 1.8
Prepayment Speed (%) 0.1 - 23.6 10.5Severity (%) 50.0 - 70.0 52.4Spreads (bps) 295.0 - 725.0 441.6 3,045
Consensus 1,501Discounted Cash Flow Default Rate (%) 0.0 - 29.4 8.0
Prepayment Speed (%) 0.0 - 40.6 4.9Severity (%) 50.0 - 70.0 58.5Spreads (bps) 308.0 - 786.0 548.7 2,010
Single Vendor 350Single Vendor Default Rate (%) 2.5 - 22.0 12.4
Prepayment Speed (%) 0.4 - 3.0 1.1Severity (%) 65.0 65.0Spreads (bps) 555.0 - 821.0 673.3 142
Other 88
Total Alt-A private-label securities . . . 7,136
Subprime private-label securities . . . . . . Consensus Default Rate (%) 0.0 - 25.9 15.1Prepayment Speed (%) 0.0 - 13.4 1.9Severity (%) 65.0 - 80.0 76.9Spreads (bps) 0.0 - 834.0 658.1 2,795
Consensus 2,296Discounted Cash Flow Default Rate (%) 0.0 - 27.5 16.9
Prepayment Speed (%) 0.0 - 10.9 1.7Severity (%) 65.0 - 80.0 77.9Spreads (bps) 527.0 - 840.0 652.4 2,098
Other 406
Total subprime private-labelsecurities . . . . . . . . . . . . . . . . . . . . . . 7,595
Mortgage revenue bonds . . . . . . . . . . . . . Single Vendor 7,746Discounted Cash Flow Spreads (bps) 143.0 - 375.0 299.9 1,766Other 220
Total mortgage revenue bonds . . . . . . 9,732
Other . . . . . . . . . . . . . . . . . . . . . . . . . . . . Consensus Default Rate (%) 5.0 - 12.1 5.0Prepayment Speed (%) 3.0 - 5.0 3.0Severity (%) 65.0 - 85.0 84.9Spreads (bps) 572.0 - 792.0 662.3 827
Consensus 825Discounted Cash Flow Default Rate (%) 0.2 - 5.0 4.8
Prepayment Speed (%) 3.0 - 11.0 3.4Severity (%) 50.0 - 85.0 84.0Spreads (bps) 541.0 - 786.0 632.9 713
Single Vendor 195Other 782
Total Other . . . . . . . . . . . . . . . . . . . . . 3,342
Total available-for-sale securities . . . . . . . . . . . $27,853
137

FANNIE MAE(In conservatorship)
NOTES TO CONDENSED CONSOLIDATED FINANCIAL STATEMENTS—(Continued)(UNAUDITED)
Fair Value Measurements as of March 31, 2012
Valuation TechniquesSignificant
Unobservable Inputs(1) Range(1)Weighted-Average(1) Fair Value
(Dollars in millions)Mortgage loans of consolidated
trusts:Single-family . . . . . . . . . . . . . Build-Up Default Rate (%) 0.1 - 97.2 16.0
Prepayment Speed (%) 8.4 - 96.7 30.1Severity (%) 8.7 - 100.0 39.2 $ 1,437
Discounted Cash Flow Default Rate (%) 2.4 - 9.2 6.6Prepayment Speed (%) 0.0 - 8.9 5.0Severity (%) 50.0 - 70.0 61.9Spreads (bps) 0.0 - 789.0 641.5 284
Consensus 216Consensus Default Rate (%) 0.0 - 6.7 4.0
Prepayment Speed (%) 0.0 - 32.5 4.9Severity (%) 65.0 - 70.0 66.5Spreads (bps) 516.0 - 772.0 678.8 145
Single Vendor 50
Total single-family . . . . . . . 2,132Multifamily . . . . . . . . . . . . . . . Build-Up Spreads (bps) 88.0 - 357.4 172.2 139
Total mortgage loans ofconsolidated trusts . . . . . . . . . $ 2,271
Net derivatives . . . . . . . . . . . . . . Dealer Mark $ 148Internal Model (84)Other (20)
Total net derivatives . . . . . . $ 44
Long-term debt:Of Fannie Mae:
Senior floating . . . . . . . . . . Discounted Cash Flow $ (399)Of consolidated trusts . . . . . . . Consensus (321)
Consensus Default Rate (%) 0.0 - 6.7 4.0Prepayment Speed (%) 0.0 - 32.5 4.9Severity (%) 50.0 - 70.0 66.4Spreads (bps) 516.0 - 772.0 676.9 (157)
Discounted Cash Flow Default Rate (%) 2.4 - 10.0 5.8Prepayment Speed (%) 0.0 - 100.0 22.8Severity (%) 50.0 - 70.0 60.9Spreads (bps) 0.0 - 789.0 545.5 (315)
Single Vendor (96)Other (61)
Total of consolidated trusts . . . (950)
Total long-term debt . . . . . . . . . . $(1,349)
(1) Valuation techniques for which no unobservable inputs are disclosed generally reflect the use of third-party pricingservices or dealers, and the range of unobservable inputs applied by these sources is not readily available or cannot bereasonably estimated. Where we have disclosed unobservable inputs for consensus and single vendor techniques, thoseinputs are based on our validations performed at the security level.
(2) Includes Fannie Mae and Freddie Mac securities.
138

FANNIE MAE(In conservatorship)
NOTES TO CONDENSED CONSOLIDATED FINANCIAL STATEMENTS—(Continued)(UNAUDITED)
The following table displays valuation techniques for our Level 3 assets measured at fair value on a nonrecurringbasis as of March 31, 2012. The significant unobservable inputs related to these techniques primarily relate tocollateral dependent valuations. The related ranges and weighted averages are not meaningful when aggregatedas they vary significantly from property to property.
Fair Value Measurements as of March 31, 2012
Valuation Techniques Fair Value
(Dollars in millions)
Nonrecurring fair value measurements:Level 3 Assets:Single-family mortgage loans held for investment, at amortized cost:
Of Fannie Mae . . . . . . . . . . . . . . . . . . . . . . . . . . . . . . . . . . . . . . . . . Internal Model $22,180Of consolidated trusts . . . . . . . . . . . . . . . . . . . . . . . . . . . . . . . . . . . Internal Model 274
Multifamily mortgage loans held for investment, at amortized cost:Of Fannie Mae . . . . . . . . . . . . . . . . . . . . . . . . . . . . . . . . . . . . . . . . . Appraisals 276
Broker Price Opinions 488Asset Manager Estimate 740Other 35
Total of Fannie Mae . . . . . . . . . . . . . . . . . . . . . . . . . . . . . . . . . . 1,539
Acquired property, net:Single-family . . . . . . . . . . . . . . . . . . . . . . . . . . . . . . . . . . . . . . . . . . Accepted Offers 1,092
Appraisals 569Walk Forwards 1,202Internal Model 1,058Other 88
Total single-family . . . . . . . . . . . . . . . . . . . . . . . . . . . . . . . . . . . 4,009
Multifamily . . . . . . . . . . . . . . . . . . . . . . . . . . . . . . . . . . . . . . . . . . . Accepted Offers 16Appraisals 20Broker Price Opinions 25
Total multifamily . . . . . . . . . . . . . . . . . . . . . . . . . . . . . . . . . . . . . 61
Other assets . . . . . . . . . . . . . . . . . . . . . . . . . . . . . . . . . . . . . . . . . . . . . Accepted Offers 176Appraisals 36Walk Forwards 38Internal Model 77Other 111
Total other assets . . . . . . . . . . . . . . . . . . . . . . . . . . . . . . . . . . . . . . . 438
Total nonrecurring assets at fair value . . . . . . . . . . . . . . . . . . . . $28,501
We use valuation techniques that maximize the use of observable inputs and minimize the use of unobservableinputs. The following is a description of the valuation techniques we use for fair value measurement anddisclosure as well as our basis of classifying these measurements as Level 1, Level 2 or Level 3 of the valuationhierarchy.
139

FANNIE MAE(In conservatorship)
NOTES TO CONDENSED CONSOLIDATED FINANCIAL STATEMENTS—(Continued)(UNAUDITED)
Cash Equivalents, Trading Securities and Available-for-Sale Securities—These securities are recorded in ourcondensed consolidated balance sheets at fair value on a recurring basis. Fair value is measured using quotedmarket prices in active markets for identical assets, when available. Securities, such as U.S. Treasury Bills,whose value is based on quoted market prices in active markets for identical assets are classified as Level 1 of thevaluation hierarchy.
We classify securities as Level 2 of the valuation hierarchy if quoted market prices in active markets for identicalassets are not available. To estimate fair value, we use vendor prices provided by as many as three third-partypricing services which are calibrated to the quoted market prices in active markets for similar securities. Thesingle vendor valuation technique utilizes one vendor price to estimate fair value. The consensus valuationtechnique utilizes an average of two or more vendors’ prices to estimate fair value. In the absence of pricesprovided by third-party pricing services supported by observable market data, fair values are estimated usingquoted prices of securities with similar characteristics or a discounted cash flow technique that uses inputs suchas default rates, prepayment speed, loss severity and spreads based on market assumptions where available. Suchinstruments are generally classified as Level 2 of the valuation hierarchy.
For all valuation techniques used for securities where there is limited activity or less transparency around theseinputs to the valuation, these securities are classified as Level 3 of the valuation hierarchy.
For agency and private-label securities, an increase in unobservable prepayment speeds in isolation wouldgenerally result in an increase in fair value, and an increase in unobservable spreads, severity rates or defaultrates in isolation would generally result in a decrease in fair value. For mortgage revenue bonds classified asLevel 3 of the valuation hierarchy, an increase in unobservable spreads would result in a decrease in fair value.Although the sensitivities of the fair value of our recurring Level 3 securities of the valuation hierarchy to variousunobservable inputs are discussed above in isolation, interrelationships exist among these inputs such that achange in one unobservable input typically results in a change to one or more of the other inputs.
Mortgage Loans Held for Investment—The majority of HFI loans are reported in our condensed consolidatedbalance sheets at the principal amount outstanding, net of cost basis adjustments and an allowance for loanlosses. We estimate the fair value of HFI loans using the build-up and consensus valuation techniques, asdiscussed below, for periodic disclosure of financial instruments as required by GAAP. For our remaining loans,which include those containing embedded derivatives that would otherwise require bifurcation and consolidatedloans of senior-subordinated trust structures, we elect the fair value option and therefore, we record these loans atfair value in our condensed consolidated balance sheets. We measure these loans on a recurring basis using thebuild-up, consensus, discounted cash flow and single vendor price techniques. Certain impaired loans aremeasured at fair value on a nonrecurring basis by using the fair value of their underlying collateral. Specifictechniques used include internal models, broker price opinions and appraisals.
A description of our valuation techniques is as follows:
Build-Up: The fair value of performing loans represents an estimate of the prices we would receive if we wereto securitize those loans and is determined based on comparisons to Fannie Mae MBS with similarcharacteristics, either on a pool or loan level. We use the observable market values of our Fannie Mae MBSdetermined primarily from third-party pricing services, quoted market prices in active markets for similarsecurities, and other observable market data as a base value. In the build-up valuation technique we start with thebase value for our Fannie Mae MBS then we add or subtract the fair value of the associated guaranty asset,guaranty obligation (“GO”) and master servicing arrangement. We set the GO equal to the estimated fair valuewe would receive if we were to issue our guaranty to an unrelated party in a stand-alone arm’s length transactionat the measurement date. We estimate the fair value of the GO using our internal GO valuation models, whichcalculate the present value of expected cash flows based on management’s best estimate of certain key
140

FANNIE MAE(In conservatorship)
NOTES TO CONDENSED CONSOLIDATED FINANCIAL STATEMENTS—(Continued)(UNAUDITED)
assumptions such as current mark-to-market LTV ratios, future house prices, default rates, severity rates andrequired rate of return. We may further adjust the model values based on our current market pricing when suchtransactions reflect credit characteristics that are similar to our outstanding GO. These loans are generallyclassified as Level 2 of the valuation hierarchy to the extent that significant inputs are observable. To the extentthat unobservable inputs are significant, the loans are classified as Level 3 of the valuation hierarchy.
Consensus: The fair value of single-family nonperforming loans represents an estimate of the prices we wouldreceive if we were to sell these loans in the nonperforming whole-loan market. These nonperforming loans areeither two or more months delinquent, in an open modification period, or in a closed modification state and haveperformed for twelve or fewer months. We calculate the fair value of nonperforming loans based on assumptionsabout key factors, including collateral value and mortgage insurance repayment. Collateral value is derived fromthe current estimated mark-to-market LTV ratio of the individual loan along with a state-level distressed propertysales discount. Mortgage insurance is estimated by taking the loan-level coverage and adjusting it by theprobability of repayment by the associated mortgage insurer. This probability is based on the credit rating of themortgage insurance company. Using these assumptions, along with indicative bids for a representative sample ofnonperforming loans, we estimate the fair value. The bids on sample loans are obtained from multiple activemarket participants. Fair value is estimated from the extrapolation of these indicative sample bids plus an amountfor the recovery of any associated mortgage insurance estimated through our GO valuation models as describedabove. These loans are classified as Level 3 of the valuation hierarchy because significant inputs areunobservable.
Discounted Cash Flow: We estimate the fair value of a portion of our senior-subordinated trust structures usingdiscounted cash flow at the security level as a proxy for estimating loan fair value. This valuation technique usesunobservable inputs such as prepayment speeds, default rates, spreads, and loss severities to estimate the fairvalue of our securities. These inputs are weighted in a model that calculates the expected cash flow of thesecurity which is used as the basis of fair value. These loans are classified as Level 3 of the valuation hierarchybecause significant inputs are unobservable.
Single Vendor: We estimate the fair value of a portion of our senior-subordinated trust structures using thesingle vendor valuation technique at the security level as a proxy for estimating loan fair value. This valuationtechnique estimates fair value based upon prices received from one specific vendor. These loans are classified asLevel 3 of the valuation hierarchy because significant inputs are unobservable.
Internal Model: We estimate the fair value of a portion of our single-family nonperforming loans using thevalue of the underlying collateral. The inputs into this internal model include property level data such as priorsales prices, tax assessment values, property characteristics, and historical foreclosure sales data. This internalmodel takes one of two approaches when valuing foreclosed properties. The first approach relies on comparableforeclosed property sales, where the value of the target property is the weighted average price of comparableforeclosed property sales. The weights in the comparable sales approach are determined by various factors suchas geographic distance, transaction time, and the value difference. The second approach relies on modelcalibrations that consider the target property’s attributes such as prior sales prices, tax assessment values, andproperty characteristics to derive the foreclosed property values. In the second approach, we build separatepredictive models for each Metropolitan Statistical Area (“MSA”). Specifically, we use the data of prior salesprices, tax assessment values, property characteristics, and historical foreclosure sales to calibrate the models ineach MSA. We can use the available data about that property and our MSA-level model to estimate the fair valuefor a given property. The majority of the internal model valuations come from the comparable sales approach.The determination of whether the internal model valuations in a particular geographic area should use thecomparable sales approach or model calibration is based on the quarterly evaluation of these two approaches forvaluation accuracy. The unobservable inputs used in this technique include model weights based upon
141

FANNIE MAE(In conservatorship)
NOTES TO CONDENSED CONSOLIDATED FINANCIAL STATEMENTS—(Continued)(UNAUDITED)
geographic distance, transaction time, and metropolitan statistics. When a physical address is not available, weestimate fair value using state-average foreclosed property values. These loans are classified as Level 3 of thevaluation hierarchy because significant inputs are unobservable.
Appraisals: For a portion of our multifamily loans, we use appraisals to estimate the fair value of the loan.There are three approaches used to estimate fair value of a specific property: (1) cost, (2) income capitalizationand (3) sales comparison. This technique uses an average of the three estimates. The cost approach uses theinsurable value as a basis. The unobservable inputs used in this model include the estimated cost to construct orreplace multifamily properties in the closest localities available. The income capitalization approach estimatesthe fair value using the present value of the future cash flow expectations by applying an appropriate overallcapitalization rate to the forecasted net operating income. The significant unobservable inputs used in thiscalculation include rental income, fees associated with rental income, expenses associated with the propertyincluding taxes, payroll, insurance and other items, and the capitalization rates which are determined throughmarket extraction and DSCR. The sales comparison approach compares the prices paid for similar properties, theprices asked by owners and offers made. The unobservable inputs to this methodology include ratios of salesprices to annual gross income, price paid per unit and adjustments made based on financing, conditions of sale,and physical characteristics of the property. These loans are classified as Level 3 of the valuation hierarchybecause significant inputs are unobservable.
Broker Price Opinion (“BPO”): For a portion of our multifamily loans, we use BPO to estimate the fair value ofthe loan. This technique uses both current property value and the property value adjusted for stabilization. Theseapproaches compute net operating income based on current rents and expenses and use a range of marketcapitalization rates to estimate property value. The unobservable inputs used in this technique are property netoperating income and market capitalization rates to estimate property value. These loans are classified as Level 3of the valuation hierarchy because significant inputs are unobservable.
Asset Manager Estimate (“AME”): For a portion of our multifamily loans, AME is used to estimate the fairvalue of the loan. This technique uses the net operating income and tax assessments of the specific property aswell as MSA-specific market capitalization rates and average per unit sales values to estimate property fair value.These loans are classified as Level 3 of the valuation hierarchy because significant inputs are unobservable.
An increase in prepayment speeds in isolation would generally result in an increase in the fair value of ourmortgage loans classified as Level 3 of the valuation hierarchy, and an increase in severity rates, default rates, orspreads in isolation would generally result in a decrease in fair value. Although the sensitivities of the fair valueof mortgage loans classified as Level 3 of the valuation hierarchy to various unobservable inputs are discussedabove in isolation, interrelationships exist among these inputs such that a change in one unobservable inputtypically results in a change to one or more of the other inputs.
Acquired Property, Net and Other Assets—Acquired property, net represents foreclosed property received in fullsatisfaction of a loan net of a valuation allowance. Acquired property is initially recorded in our condensedconsolidated balance sheets at its fair value less its estimated cost to sell. The initial fair value of foreclosedproperties is determined using a hierarchy based on the reliability of available information. The hierarchy forsingle-family acquired property includes accepted offers, appraisals, broker price opinions and proprietary homeprice model values. The hierarchy for multifamily acquired property includes accepted offers, appraisals, andbroker price opinions. We consider an accepted offer on a specific foreclosed property to be the best estimate ofits fair value. If we have not accepted an offer on the property we use the highest available valuationmethodology as described in our valuation hierarchy to determine fair value. While accepted offers representan agreement in principle to transact, a significant portion of these agreements do not get executed for variousreasons, and are therefore classified as Level 3 of the valuation hierarchy.
142

FANNIE MAE(In conservatorship)
NOTES TO CONDENSED CONSOLIDATED FINANCIAL STATEMENTS—(Continued)(UNAUDITED)
Third-party valuations can be obtained from either an appraisal or a broker price opinion. These valuations arekept current using a monthly walk forward process that updates them for any change in the value of the property.When accepted offers or third-party valuations are not available, we generally utilize the home price valuesdetermined using an internal model.
Subsequent to initial measurement, the foreclosed properties that we intend to sell are reported at the lower of thecarrying amount or fair value less estimated costs to sell. Foreclosed properties classified as held for use,included in “Other Assets” in our condensed consolidated balance sheets, are depreciated and impaired whencircumstances indicate that the carrying amount of the property is no longer recoverable. The fair values of oursingle-family foreclosed properties subsequent to initial measurement are determined using the same informationhierarchy used for the initial fair value measurement.
The most commonly used techniques in our valuation of acquired property are proprietary home price model andappraisals (both current and walk forward). Based on the number of properties measured as of March 31, 2012,these methodologies comprised approximately 75% of our valuations, while accepted offers comprisedapproximately 23% of our valuations.
Acquired property is classified as Level 3 of the valuation hierarchy because significant inputs are unobservable.
A description of our valuation techniques to estimate the fair value of our acquired property is as follows.
Single-family acquired property valuation techniques
Appraisal: An appraisal is an estimate of the value of a specific property by a certified or licensed appraiser, inaccordance with the Uniform Standards of Professional Appraisal Practice. Data most commonly used is fromthe local Multiple Listing Service and includes properties currently listed for sale, properties under contract, andclosed transactions. The appraiser performs an analysis that starts with these data points and then adjusts fordifferences between the comparable properties and the property being appraised, to arrive at an estimated valuefor the specific property. Adjustments are made for differences between comparable properties for unobservableinputs such as square footage, location, and condition of the property. The appraiser typically uses recenthistorical data for the estimate of value.
Broker Price Opinion: This technique provides an estimate of what the property is worth based upon a realestate broker’s knowledge. The broker uses research of pertinent data in the appropriate market, and a salescomparison approach that is similar to the appraisal process. The broker typically has insight into local markettrends, such as the number of and terms of offers, lack of offers, increasing supply, shortage of inventory andoverall interest in buying a home. This information, all of which is unobservable, is used along with recent andpending sales and current listings of similar properties to arrive at an estimate of value.
Appraisal and Broker Price Opinion Walk Forwards (“Walk Forwards”): We use these techniques to adjustappraisal and broker price opinion valuations for changing market conditions by applying a walk forward factorbased on local price movements since the time the third-party value was obtained. The majority of third-partyvalues are updated by comparing the difference in our internal home price model from the month of the originalappraisal/broker price opinion to the current period and by applying the resulting percentage change to theoriginal value. If a price is not determinable through our internal home price model, we use our zip code levelhome price index to update the valuations.
Internal Model: We use an internal model to estimate fair value for distressed properties. The valuationmethodology and inputs used are described under “Mortgage Loans Held for Investment.”
143

FANNIE MAE(In conservatorship)
NOTES TO CONDENSED CONSOLIDATED FINANCIAL STATEMENTS—(Continued)(UNAUDITED)
Multifamily acquired property valuation techniques
Appraisals: We use this method to estimate property values for distressed properties. The valuationmethodology and inputs used are described under “Mortgage Loans Held for Investment.”
Broker Price Opinions: We use this method to estimate property values for distressed properties. The valuationmethodology and inputs used are described under “Mortgage Loans Held for Investment.”
Derivatives Assets and Liabilities (collectively “Derivatives”)—Derivatives are recorded in our condensedconsolidated balance sheets at fair value on a recurring basis. The valuation process for the majority of our riskmanagement derivatives uses observable market data provided by third-party sources, resulting in Level 2classification of the valuation hierarchy. Interest rate swaps are valued by referencing yield curves derived fromobservable interest rates and spreads to project and discount swap cash flows to present value. Option-basedderivatives use a model that projects the probability of various levels of interest rates by referencing swaptionand caplet volatilities provided by market makers/dealers. The projected cash flows of the underlying swaps ofthese option-based derivatives are discounted to present value using yield curves derived from observable interestrates and spreads. Exchange-traded futures are valued using market quoted prices, resulting in Level 1classification of the valuation hierarchy. Certain highly complex structured swaps primarily use a single dealermark due to lack of transparency in the market and may be modeled using observable interest rates and volatilitylevels as well as significant unobservable assumptions, resulting in Level 3 classification of the valuationhierarchy. Mortgage commitment derivatives use observable market data, quotes and actual transaction pricelevels adjusted for market movement, and are typically classified as Level 2 of the valuation hierarchy. Mortgagecommitment derivatives that include adjustments for market movement that cannot be corroborated byobservable market data are classified as Level 3 of the valuation hierarchy.
Debt—The majority of debt of Fannie Mae is recorded in our condensed consolidated balance sheets at theprincipal amount outstanding, net of cost basis adjustments. We elected the fair value option for certainstructured debt instruments, which are recorded in our condensed consolidated balance sheets at fair value on arecurring basis.
We use third-party pricing services that reference observable market data such as interest rates and spreads tomeasure the fair value of debt, and thus classify that debt as Level 2 of the valuation hierarchy.
For structured debt instruments that are not valued by third-party pricing services, cash flows are evaluatedtaking into consideration any structured derivatives through which we have swapped out of the structuredfeatures of the notes. The resulting cash flows are discounted to present value using a yield curve derived frommarket prices observed for Fannie Mae Benchmark Notes and adjusted to reflect fair values at the offer side ofthe market. Market swaption volatilities are also referenced for the valuation of callable structured debtinstruments. Since the derivatives considered in the valuations of these structured debt instruments are classifiedas Level 3 of the valuation hierarchy, the valuations of the structured debt instruments result in a Level 3classification.
Certain consolidated MBS debt with embedded derivatives is recorded in our condensed consolidated balancesheets at fair value on a recurring basis. Consolidated MBS debt is traded in the market as MBS assets.Accordingly, we estimate the fair value of our consolidated MBS debt using quoted market prices in activemarkets for similar liabilities when traded as assets. The valuation methodology and inputs used in estimating thefair value of MBS assets are described under “Cash Equivalents, Trading Securities and Available-for-SaleSecurities.”
144

FANNIE MAE(In conservatorship)
NOTES TO CONDENSED CONSOLIDATED FINANCIAL STATEMENTS—(Continued)(UNAUDITED)
Valuation Control Processes
We have control processes that are designed to ensure that our fair value measurements are appropriate andreliable, that they are based on observable inputs wherever possible and that our valuation approaches areconsistently applied and the assumptions used are reasonable. Our control processes consist of a framework thatprovides for a segregation of duties and oversight of our fair value methodologies and valuations, as well asvalidation procedures.
The Pricing Group within our Finance Division is responsible for estimating the fair value of the majority of ourfinancial assets and financial liabilities. These fair values are verified by our Price Verification Group, which is acontrol group separate from the group responsible for obtaining prices. Our Modeling and Analytics Groupdevelops models that are used in estimating the fair value of assets and liabilities for financial reporting purposes.In addition, our Model Oversight Committee (“MOC”) facilitates the cross-functional coordination andeffectiveness of our modeling efforts in terms of research, model use and risk governance. The MOC iscomprised of senior representatives from Underwriting and Pricing, Capital Markets, Credit PortfolioManagement, Enterprise Risk Management, Finance and Modeling & Analytics and is chaired by our Chief RiskOfficer. Our Model Risk Oversight Group is responsible for establishing risk management controls and forreviewing, validating and approving models used in the determination of fair value measurements for financialreporting. Fair value measurements for acquired property and collateral dependent loans are determined by othervaluation groups in the Finance division.
Our Valuation Oversight Committee (“VOC”) includes senior representation from our Capital Markets segment,our Enterprise Risk Office and our Finance division, and is responsible for providing overall governance for ourvaluation processes and results. The composition of the VOC is determined by the VOC chair, our ChiefFinancial Officer, with the objective of obtaining appropriate representation from finance, risk and selectbusiness units within Fannie Mae. Based on its review of valuation methodologies and fair value results forvarious financial instruments used for financial reporting, the VOC is responsible for advising the VOCCommittee chair, who has the ultimate responsibility over all valuation processes and results. The VOC alsoreviews trend analysis for various financial assets and liabilities on a quarterly basis.
We use third-party vendor prices and dealer quotes to estimate fair value of some of our financial assets andliabilities. Third-party vendor prices are primarily used to estimate fair value for trading securities,available-for-sale securities, debt of Fannie Mae, and consolidated MBS debt. Our Pricing Group performsvarious review and validation procedures prior to utilizing these prices in our fair value estimation process. Weverify selected prices, using a variety of methods, including corroborating the prices by reference to otherindependent market data, such as non-binding broker or dealer quotations, relevant benchmark indices, and pricesof similar instruments. We also review prices for reasonableness based on variations from prices provided inprevious periods, comparing prices to internally estimated prices, using primarily a discounted cash flowapproach, and conducting relative value comparisons based on specific characteristics of securities.
We have discussions with the pricing services as part of our due diligence process in order to maintain a currentunderstanding of the valuation processes and related assumptions and inputs that these vendors use in developingprices. The prices provided to us by third-party pricing services reflect the existence of market reliance uponcredit enhancements, if any, and the current lack of liquidity in the marketplace. If we determine that a priceprovided to us is outside established parameters, we will further examine the price, including having follow-updiscussions with the pricing service or dealer. If we conclude that a price is not valid, we will adjust the price forvarious factors, such as liquidity, bid-ask spreads and credit considerations. All of these procedures are executedbefore we use the prices in preparing our financial statements.
Our Price Verification Group is responsible for performing monthly independent price verification, primarilyrelated to financial assets and financial liabilities that are priced by our Pricing Group. This is generally
145

FANNIE MAE(In conservatorship)
NOTES TO CONDENSED CONSOLIDATED FINANCIAL STATEMENTS—(Continued)(UNAUDITED)
accomplished by comparing the value that the Price Verification Group obtains through its own sources andmethods with values provided by the Pricing Group. Alternatively, the Price Verification Group may performreviews of the assumptions used by the Pricing Group to estimate the fair value of products we hold that havematerial estimation risk because observable market-based inputs do not exist. This group provides an update tothe VOC on results, relevant market information and pricing trends, and significant valuation challenges andresolution of those challenges with the Pricing Group on a quarterly basis.
We have an internal property valuation function that utilizes an internal model to compare the values received ona property and assign a risk rating based on several factors including the deviation between the various values.Property valuations with risk ratings above a specified threshold are reviewed for reasonableness by a team ofproperty valuation experts. The internal model that is used to assign a risk rating and the threshold specified issubject to VOC oversight. In addition, our Quality Control Group reviews the overall work performed andinspects a portion of the properties in major markets, for which the third-party valuations are obtained, in order toassess the quality of the valuations.
We calibrate the performance of our proprietary internal model using actual offers on our properties and recentobserved transactions. The internal model’s performance is reviewed on a monthly basis by the REO valuationteam and is compared with the review performed by our Modeling and Analytics team on a quarterly basis. Thesereview results are presented to the Model Risk Oversight Group, who performs a review and evaluation of themodel performance on a quarterly basis. The results of the validation are also reviewed with the VOC on aquarterly basis.
Our Appraisal Review Group reviews appraisals to determine whether they have been performed in accordancewith appraisal standards and the results are consistent with our observed transactions on similar properties. Weand/or third-party servicers review broker price opinions to determine whether the values provided are consistentwith our observed transactions on similar properties. We conduct quarterly portfolio reviews, annual audits andperiodic reviews of the counterparties that provide services to review broker price opinions. In addition,valuation results and trend analyses are reviewed at least monthly by REO management.
146

FANNIE MAE(In conservatorship)
NOTES TO CONDENSED CONSOLIDATED FINANCIAL STATEMENTS—(Continued)(UNAUDITED)
Fair Value of Financial Instruments
The following table displays the carrying value and estimated fair value of our financial instruments as ofMarch 31, 2012 and December 31, 2011. The fair value of financial instruments we disclose includescommitments to purchase multifamily and single-family mortgage loans which are off-balance sheet financialinstruments that we do not record in our condensed consolidated balance sheets. The fair values of thesecommitments are included as “Mortgage loans held for investment, net of allowance for loan losses.” Thedisclosure excludes certain financial instruments, such as plan obligations for pension and postretirement healthcare benefits, employee stock option and stock purchase plans, and also excludes all non-financial instruments.As a result, the fair value of our financial assets and liabilities does not represent the underlying fair value of ourtotal consolidated assets and liabilities.
As of
March 31, 2012 December 31, 2011
CarryingValue
Quoted Pricein Active
Markets forIdentical
Assets(Level 1)
SignificantOther
ObservableInputs
(Level 2)
SignificantUnobservable
Inputs(Level 3)
NettingAdjust-ment
EstimatedFair
ValueCarrying
Value
EstimatedFair
Value
(Dollars in millions)Financial assets:Cash and cash equivalents and
restricted cash . . . . . . . . . . . . . . . . $ 77,970 $ 66,970 $ 11,000 $ — $ — $ 77,970 $ 68,336 $ 68,336Federal funds sold and securities
purchased under agreements toresell or similar arrangements . . . . 15,000 — 15,000 — — 15,000 46,000 46,000
Trading securities . . . . . . . . . . . . . . . 75,806 50,030 23,020 2,756 — 75,806 74,198 74,198Available-for-sale securities . . . . . . . 73,779 — 45,926 27,853 — 73,779 77,582 77,582Mortgage loans held for sale . . . . . . . 282 — 198 88 — 286 311 325Mortgage loans held for investment,
net of allowance for loan losses:Of Fannie Mae . . . . . . . . . . . . . . . 320,032 — 35,805 236,274 — 272,079 322,825 294,996Of consolidated trusts . . . . . . . . . . 2,603,411 — 2,345,292 327,739 — 2,673,031 2,575,485 2,652,025
Mortgage loans held for investment . . 2,923,443 — 2,381,097 564,013 — 2,945,110 2,898,310 2,947,021Advances to lenders . . . . . . . . . . . . . 3,548 — 2,819 640 — 3,459 5,538 5,420Derivative assets at fair value . . . . . . 365 5 13,681 203 (13,524) 365 561 561Guaranty assets and buy-ups . . . . . . . 497 — — 920 — 920 503 901
Total financial assets . . . . . . . . . . . . $3,170,690 $117,005 $2,492,741 $596,473 $(13,524) $3,192,695 $3,171,339 $3,220,344
Financial liabilities:Short-term debt:
Of Fannie Mae . . . . . . . . . . . . . . . $ 110,852 $ — $ 110,865 $ — $ — $ 110,865 $ 146,752 $ 146,782Of consolidated trusts . . . . . . . . . . 4,495 — — 4,495 — 4,495 4,973 4,973
Long-term debt:Of Fannie Mae . . . . . . . . . . . . . . . 575,122 — 599,427 1,065 — 600,492 585,692 613,983Of consolidated trusts . . . . . . . . . . 2,493,738 — 2,615,986 12,506 — 2,628,492 2,452,455 2,596,657
Derivative liabilities at fair value . . . 522 5 19,411 159 (19,053) 522 916 916Guaranty obligations . . . . . . . . . . . . 799 — — 3,815 — 3,815 811 3,944
Total financial liabilities . . . . . . . . . . $3,185,528 $ 5 $3,345,689 $ 22,040 $(19,053) $3,348,681 $3,191,599 $3,367,255
147

FANNIE MAE(In conservatorship)
NOTES TO CONDENSED CONSOLIDATED FINANCIAL STATEMENTS—(Continued)(UNAUDITED)
Financial Instruments for which fair value approximates carrying value—We hold certain financial instrumentsthat are not carried at fair value but for which the carrying value approximates fair value due to the short-termnature and negligible credit risk inherent in them. These financial instruments include cash and cash equivalents,the majority of advances to lenders and federal funds and securities sold/purchased under agreements torepurchase/resell (exclusive of dollar roll repurchase transactions).
Federal funds and securities sold/purchased under agreements to repurchase/resell—The carrying value for themajority of these specific instruments approximates the fair value due to the short-term nature and the negligibleinherent credit risk, as they involve the exchange of liquid collateral. Were we to calculate the fair value of theseinstruments we would use observable inputs resulting in Level 2 classification.
Mortgage Loans Held for Sale—Loans are reported at the lower of cost or fair value in our condensedconsolidated balance sheets. The valuation methodology and inputs used in estimating the fair value of HFSloans are the same as for our HFI loans and are described under “Fair Value Measurement–Mortgage Loans Heldfor Investment” and these loans are classified as Level 2 of the valuation hierarchy to the extent that significantinputs are observable. To the extent that significant inputs are unobservable, the loans are classified within Level3 of the valuation hierarchy.
Advances to Lenders—The carrying value for the majority of our advances to lenders approximates fair valuedue to the short-term nature and the negligible inherent credit risk. Were we to calculate the fair value of theseinstruments we would use discounted cash flow models that use observable inputs such as spreads based onmarket assumptions, resulting in Level 2 classification.
Advances to lenders also include loans for which the carrying value does not approximate fair value. These loansdo not qualify for Fannie Mae MBS securitization and are valued using market-based techniques including creditspreads, severities and prepayment speeds for similar loans, through third-party pricing services or through amodel approach incorporating both interest rate and credit risk simulating a loan sale via a synthetic structure.We classify these valuations as Level 3 given that significant inputs are not observable or are determined byextrapolation of observable points.
Guaranty Assets and Buy-ups—Guaranty assets related to our portfolio securitizations are recorded in ourcondensed consolidated balance sheets at fair value on a recurring basis and are classified within Level 3 of thevaluation hierarchy. Guaranty assets in lender swap transactions are recorded in our condensed consolidatedbalance sheets at the lower of cost or fair value. These assets, which are measured at fair value on a nonrecurringbasis, are classified within Level 3 of the fair value hierarchy.
We estimate the fair value of guaranty assets based on the present value of expected future cash flows of theunderlying mortgage assets using management’s best estimate of certain key assumptions, which includeprepayment speeds, forward yield curves, and discount rates commensurate with the risks involved. These cashflows are projected using proprietary prepayment, interest rate and credit risk models. Because guaranty assetsare like an interest-only income stream, the projected cash flows from our guaranty assets are discounted usingone-month LIBOR plus the option-adjusted spread (“OAS”) for interest-only trust securities. The interest-onlyOAS is calibrated using prices of a representative sample of interest-only trust securities. We believe the remittedfee income is less liquid than interest-only trust securities and more like an excess servicing strip. We take afurther discount of the present value for these liquidity considerations. This discount is based on market quotesfrom dealers.
The fair value of the guaranty assets includes the fair value of any associated buy-ups, which is estimated in thesame manner as guaranty assets but is recorded separately as a component of “Other assets” in our condensedconsolidated balance sheets.
148

FANNIE MAE(In conservatorship)
NOTES TO CONDENSED CONSOLIDATED FINANCIAL STATEMENTS—(Continued)(UNAUDITED)
Guaranty Obligations—The fair value of all guaranty obligations, measured subsequent to their initialrecognition, is our estimate of a hypothetical transaction price we would receive if we were to issue our guarantyto an unrelated party in a standalone arm’s-length transaction at the measurement date. These obligations areclassified within Level 3. The valuation methodology and inputs used in estimating the fair value of the guarantyobligation are described under “Fair Value Measurement–Mortgage Loans Held for Investment–Build up.”
HARP Loans—We measure the fair value of loans that are delivered under the Home Affordable RefinanceProgram (“HARP”) using a modified build-up approach while the loan is performing. Under this modifiedapproach, we set the credit component of the consolidated loans (i.e., the guaranty obligation) equal to thecompensation we would currently receive for a loan delivered to us under the program because the totalcompensation for these loans is equal to their current exit price in the GSE securitization market. For adescription of the build-up valuation methodology, refer to “Fair Value Measurement–Mortgage Loans Held forInvestment.” We will continue to use this pricing methodology as long as the HARP program is available tomarket participants. If, subsequent to delivery, the refinanced loan becomes past due or is modified as a part of atroubled debt restructuring, the fair value of the guaranty obligation is then measured consistent with other loansthat have these characteristics.
The total compensation that we receive for the delivery of a HARP loan reflects the pricing that we are willing tooffer because HARP is a part of a broader government program intended to provide assistance to homeownersand prevent foreclosures. If these benefits were not reflected in the pricing for these loans (that is, if the loanswere valued using our standard build-up approach), the fair value disclosed in the table above would be lower by$7.4 billion as of March 31, 2012. The total fair value of the loans in our portfolio that have been refinancedunder HARP as of March 31, 2012 as presented in the table above is $142.9 billion.
Fair Value Option
We elected the fair value option for certain consolidated loans and debt instruments recorded in our condensedconsolidated balance sheets. These instruments contain embedded derivatives that would otherwise requirebifurcation. Under the fair value option, we elected to carry these instruments at fair value instead ofbifurcating the embedded derivative from the respective loan or debt instrument.
We elected the fair value option for all long-term structured debt instruments that are issued in response tospecific investor demand and have interest rates that are based on a calculated index or formula and areeconomically hedged with derivatives at the time of issuance. By electing the fair value option for theseinstruments, we are able to eliminate the volatility in our results of operations that would otherwise result fromthe accounting asymmetry created by recording these structured debt instruments at cost while recording therelated derivatives at fair value.
We elected the fair value option for the financial assets and liabilities of the consolidated senior-subordinate truststructures. By electing the fair value option for these instruments, we are able to eliminate the volatility in ourresults of operations that would otherwise result from different accounting treatment between loans at cost anddebt at cost.
Interest income for the mortgage loans is recorded in “Mortgage loans interest income” and interest expense forthe debt instruments is recorded in “Long-term debt interest expense” in our condensed consolidated statementsof operations and comprehensive income (loss).
149

FANNIE MAE(In conservatorship)
NOTES TO CONDENSED CONSOLIDATED FINANCIAL STATEMENTS—(Continued)(UNAUDITED)
The following table displays the fair value and unpaid principal balance of the financial instruments for which wehave made fair value elections as of March 31, 2012 and December 31, 2011.
As of
March 31, 2012 December 31, 2011
Loans ofConsolidated
Trusts (1)
Long-TermDebt of
Fannie Mae
Long-TermDebt of
ConsolidatedTrusts(2)
Loans ofConsolidated
Trusts(1)
Long-TermDebt of
Fannie Mae
Long-TermDebt of
ConsolidatedTrusts(2)
(Dollars in millions)
Fair value . . . . . . . . . . . . . . . . . . $4,292 $825 $4,279 $3,611 $838 $3,939Unpaid principal balance . . . . . . 4,758 712 4,391 4,122 712 4,012
(1) Includes nonaccrual loans with a fair value of $231 million and $195 million as of March 31, 2012 and December 31,2011, respectively. The difference between unpaid principal balance and the fair value of these nonaccrual loans as ofMarch 31, 2012 and December 31, 2011 is $232 million. Includes loans that are 90 days past due with a fair value of $382million and $310 million as of March 31, 2012 and December 31, 2011, respectively. The difference between unpaidprincipal balance and the fair value of these 90 or more days past due loans as of March 31, 2012 and December 31, 2011is $263 million and $262 million, respectively.
(2) Includes interest-only debt instruments with no unpaid principal balance and a fair value of $115 million as of March 31,2012 and December 31, 2011.
Changes in Fair Value under the Fair Value Option Election
The following table displays fair value gains and losses, net, including changes attributable to instrument-specificcredit risk, for loans and debt for which the fair value election was made. Amounts are recorded as a componentof “Fair value gains, net” in our condensed consolidated statements of operations and comprehensive income(loss) for the three months ended March 31, 2012 and 2011.
For the Three Months Ended March 31,
2012 2011
Long-Term Total Gains Long-Term Total GainsLoans Debt (Losses) Loans Debt (Losses)
(Dollars in millions)
Changes in instrument-specific credit risk . . . . $ 66 $ (2) $64 $(217) $ (4) $(221)Other changes in fair value . . . . . . . . . . . . . . . . (65) 60 (5) 65 33 98
Fair value gains, net . . . . . . . . . . . . . . . . . . . . $ 1 $58 $59 $(152) $29 $(123)
In determining the changes in the instrument-specific credit risk for loans, the changes in the associated credit-related components of these loans, primarily the guaranty obligation, were taken into consideration with theoverall change in the fair value of the loans for which we elected the fair value option for financial instruments.In determining the changes in the instrument-specific credit risk for debt, the changes in Fannie Mae debt spreadsto LIBOR that occurred during the period were taken into consideration with the overall change in the fair valueof the debt for which we elected the fair value option for financial instruments. Specifically, cash flows areevaluated taking into consideration any derivatives through which Fannie Mae has swapped out of the structuredfeatures of the notes and thus created a floating-rate LIBOR-based debt instrument. The change in value of theseLIBOR-based cash flows based on the Fannie Mae yield curve at the beginning and end of the period representsthe instrument-specific risk.
150

FANNIE MAE(In conservatorship)
NOTES TO CONDENSED CONSOLIDATED FINANCIAL STATEMENTS—(Continued)(UNAUDITED)
13. Commitments and Contingencies
We are party to various types of legal actions and proceedings, including actions brought on behalf of variousclasses of claimants. We also are subject to regulatory examinations, inquiries and investigations and otherinformation gathering requests. In some of the matters, indeterminate amounts are sought. Modern pleadingpractice in the U.S. permits considerable variation in the assertion of monetary damages or other relief.Jurisdictions may permit claimants not to specify the monetary damages sought or may permit claimants to stateonly that the amount sought is sufficient to invoke the jurisdiction of the trial court. This variability in pleadings,together with our and our counsel’s actual experience in litigating or settling claims, leads us to conclude that themonetary relief that may be sought by plaintiffs bears little relevance to the merits or disposition value of claims.
On a quarterly and annual basis, we review relevant information about all pending legal actions and proceedingsfor the purpose of evaluating and revising our contingencies, reserves and disclosures.
Legal actions and proceedings of all types are subject to many uncertain factors that generally cannot bepredicted with assurance. Accordingly, the outcome of any given matter and the amount or range of potential lossat particular points in time is frequently difficult to ascertain. Uncertainties can include how fact finders willevaluate documentary evidence and the credibility and effectiveness of witness testimony, and how trial andappellate courts will apply the law. Disposition valuations are also subject to the uncertainty of how opposingparties and their counsel view the evidence and applicable law. Further, FHFA adopted a regulation on June 20,2011, which provides, in part, that while we are in conservatorship, FHFA will not pay claims by our current orformer shareholders, unless the Director of FHFA determines it is in the interest of the conservatorship. Thepresence of this regulation and the Director of FHFA’s assertion that FHFA will not pay claims asserted incertain cases discussed below while we are in conservatorship creates additional uncertainty in those cases.
We establish a reserve for those matters when a loss is probable and we can reasonably estimate the amount ofsuch loss. Reserves have been established for certain of the matters noted below. These reserves did not have amaterial adverse effect on our financial statements. We note, however, that in light of the uncertainties involvedin such actions and proceedings, there is no assurance that the ultimate resolution of these matters will notsignificantly exceed the reserves we have currently accrued.
For the remaining legal actions or proceedings, including those where there is only a reasonable possibility that aloss may be incurred, we are not currently able to estimate the reasonably possible losses or ranges of losses andwe have not established a reserve with respect to those actions or proceedings. We are often unable to estimatethe possible losses or ranges of losses, particularly for proceedings that are in their early stages of development,where plaintiffs seek substantial or indeterminate damages, where there may be novel or unsettled legal questionsrelevant to the proceedings, or where settlement negotiations have not occurred or progressed. Further, as notedabove, FHFA’s regulation and the Director of FHFA’s assertion creates additional uncertainty with respect tocertain cases.
Given the uncertainties involved in any action or proceeding, regardless of whether we have established areserve, the ultimate resolution of certain of these matters may be material to our operating results for a particularperiod, depending on, among other factors, the size of the loss or liability imposed and the level of our netincome or loss for that period. Based on our current knowledge with respect to the matters described below, webelieve we have valid defenses to the claims in these proceedings and intend to defend these matters vigorouslyregardless of whether or not we have recorded a loss reserve.
In addition to the matters specifically described below, we are involved in a number of legal and regulatoryproceedings that arise in the ordinary course of business that we do not expect will have a material impact on ourbusiness or financial condition. We have advanced fees and expenses of certain current and former officers anddirectors in connection with various legal proceedings pursuant to indemnification agreements.
151

FANNIE MAE(In conservatorship)
NOTES TO CONDENSED CONSOLIDATED FINANCIAL STATEMENTS—(Continued)(UNAUDITED)
In re Fannie Mae Securities Litigation
Fannie Mae is a defendant in a consolidated class action lawsuit initially filed in 2004 and currently pending inthe U.S. District Court for the District of Columbia. In the consolidated complaint filed on March 4, 2005, leadplaintiffs Ohio Public Employees Retirement System and State Teachers Retirement System of Ohio allege thatwe and certain former officers, as well as our former outside auditor, made materially false and misleadingstatements in violation of Sections 10(b) and 20(a) of the Securities Exchange Act of 1934, and SEC Rule 10b-5promulgated thereunder. Plaintiffs contend that Fannie Mae’s accounting statements were inconsistent withGAAP requirements relating to hedge accounting and the amortization of premiums and discounts, and seekunspecified compensatory damages, attorneys’ fees, and other fees and costs. On January 7, 2008, the courtdefined the class as all purchasers of Fannie Mae common stock and call options and all sellers of publicly tradedFannie Mae put options during the period from April 17, 2001 through December 22, 2004. On October 17,2008, FHFA, as conservator for Fannie Mae, intervened in this case. On August 18, 2011, the parties filedvarious motions for summary judgment, which are fully briefed.
On October 7, 2011, FHFA, as conservator, filed a motion to stay this case for the duration of ourconservatorship based on a regulation FHFA adopted on June 20, 2011, which provides in part that while we arein conservatorship, FHFA will not pay claims by our current or former shareholders, unless the Director of FHFAdetermines it is in the interest of the conservatorship. The Acting Director of FHFA has determined it will notpay the claims asserted in this case while we are in conservatorship. FHFA maintains, therefore, that continuinglitigation of this matter would be a waste of resources. FHFA’s motion was denied on November 14, 2011.FHFA’s regulation has been challenged by lead plaintiffs in a separate lawsuit also pending in the U.S. DistrictCourt for the District of Columbia.
In September and December 2010, plaintiffs served expert reports claiming damages to plaintiffs under variousscenarios ranging cumulatively from $2.2 billion to $8.6 billion. Given the substantial and novel legal questionsthat remain, including those raised by FHFA’s regulation and the Director of FHFA’s determination, we arecurrently unable to estimate the reasonably possible loss or range of loss arising from this litigation.
2008 Class Action Lawsuits
Fannie Mae is a defendant in two consolidated class actions filed in 2008 and currently pending in theU.S. District Court for the Southern District of New York – In re Fannie Mae 2008 Securities Litigation and Inre 2008 Fannie Mae ERISA Litigation. On February 11, 2009, the Judicial Panel on Multidistrict Litigationordered that the cases be coordinated for pretrial proceedings.
Given the early status of these matters, the absence of a specified demand or claim by the plaintiffs, and thesubstantial and novel legal questions that remain, including those raised by FHFA’s regulation and the Directorof FHFA’s determination, we are currently unable to estimate the reasonably possible loss or range of loss arisingfrom these lawsuits.
In re Fannie Mae 2008 Securities Litigation
In a consolidated complaint filed on June 22, 2009, lead plaintiffs Massachusetts Pension Reserves InvestmentManagement Board and Boston Retirement Board (for common shareholders) and Tennessee ConsolidatedRetirement System (for preferred shareholders) allege that we, certain of our former officers, and certain of ourunderwriters violated Sections 12(a)(2) and 15 of the Securities Act of 1933. Lead plaintiffs also allege that we,certain of our former officers, and our outside auditor, violated Sections 10(b) (and Rule 10b-5 promulgatedthereunder) and 20(a) of the Securities Exchange Act of 1934. Lead plaintiffs seek various forms of relief,including rescission, damages, interest, costs, attorneys’ and experts’ fees, and other equitable and injunctiverelief. On October 13, 2009, the Court entered an order allowing FHFA to intervene.
152

FANNIE MAE(In conservatorship)
NOTES TO CONDENSED CONSOLIDATED FINANCIAL STATEMENTS—(Continued)(UNAUDITED)
On November 24, 2009, the Court granted the defendants’ motion to dismiss the Securities Act claims as to alldefendants. On September 30, 2010, the Court granted in part and denied in part the defendants’ motions todismiss the Securities Exchange Act claims. As a result of the partial denial, some of the Securities Exchange Actclaims remain pending against us and certain of our former officers. On October 14, 2010, we and certain otherdefendants filed motions for reconsideration of those portions of the Court’s September 30, 2010 order denyingin part the defendants’ motions to dismiss. Fannie Mae filed its answer to the consolidated complaint onDecember 31, 2010. Defendants’ motions for reconsideration were denied on April 11, 2011. On July 28, 2011,lead plaintiffs filed motions to certify a class of persons who, between November 8, 2006 and September 5, 2008,inclusive, purchased or acquired (a) Fannie Mae common stock and options or (b) Fannie Mae preferred stock.
On February 1, 2012, plaintiffs sought leave to amend their complaint to add new factual allegations and thecourt granted plaintiffs’ motion. Briefing on the pending motions for class certification will be held in abeyancepending resolution of motions to dismiss the amended complaint. Plaintiffs filed an amended complaint onMarch 2, 2012 and added FHFA as a defendant. On April 4, 2012, defendants filed motions to dismiss theamended complaint.
In re 2008 Fannie Mae ERISA Litigation
In a consolidated complaint filed on September 11, 2009, plaintiffs allege that certain of our current and formerofficers and directors, including former members of Fannie Mae’s Benefit Plans Committee and theCompensation Committee of Fannie Mae’s Board of Directors, as fiduciaries of Fannie Mae’s Employee StockOwnership Plan (“ESOP”), breached their duties to ESOP participants and beneficiaries by investing ESOP fundsin Fannie Mae common stock when it was no longer prudent to continue to do so. Plaintiffs purport to represent aclass of participants and beneficiaries of the ESOP whose accounts invested in Fannie Mae common stockbeginning April 17, 2007. The plaintiffs seek unspecified damages, attorneys’ fees and other fees and costs, andinjunctive and other equitable relief. On November 2, 2009, defendants filed motions to dismiss these claims. OnNovember 2, 2011, we filed a letter notifying the court of two recent decisions by the U.S. Court of Appeals forthe Second Circuit that are relevant to defendants’ motions to dismiss. On February 1, 2012, plaintiffs soughtleave to amend their complaint to add new factual allegations and the court granted plaintiffs’ motion. Plaintiffsfiled an amended complaint on March 2, 2012 adding two current Board members and CEO Michael J. Williamsas defendants. On April 4, 2012, defendants filed motions to dismiss the amended complaint.
Comprehensive Investment Services v. Mudd, et al.
This individual securities action was originally filed on May 13, 2009, by plaintiff Comprehensive InvestmentServices, Inc. against certain of our former officers and directors, and certain of our underwriters in the U.S.District Court for the Southern District of Texas. On July 7, 2009, this case was transferred to the SouthernDistrict of New York for coordination with In re Fannie Mae 2008 Securities Litigation and In re 2008 FannieMae ERISA Litigation. Plaintiff filed an amended complaint on May 11, 2011 against us, certain of our formerofficers, and certain of our underwriters. The amended complaint alleges violations of Section 10(b) of theSecurities Exchange Act of 1934 and Rule 10b-5 promulgated thereunder; violations of Section 20(a) of theSecurities Exchange Act of 1934; and violations of the Texas Business and Commerce Code, common law fraud,and negligent misrepresentation in connection with Fannie Mae’s May 2008 $2.0 billion offering of 8.25%non-cumulative preferred Series T stock. Plaintiff seeks relief in the form of rescission, actual damages, punitivedamages, interest, costs, attorneys’ and experts’ fees, and other equitable and injunctive relief. On July 11, 2011,defendants filed motions to dismiss the amended complaint. On February 1, 2012, plaintiff sought leave toamend its complaint to add new factual allegations and the court granted plaintiff’s motion. Plaintiff filed anamended complaint on March 2, 2012. On April 4, 2012, defendants filed motions to dismiss the amendedcomplaint.
153

FANNIE MAE(In conservatorship)
NOTES TO CONDENSED CONSOLIDATED FINANCIAL STATEMENTS—(Continued)(UNAUDITED)
Given the preliminary stage of this lawsuit, the absence of a specified demand or claim by the plaintiff, and thesubstantial and novel legal questions that remain, we are currently unable to estimate the reasonably possible lossor range of loss arising from this litigation.
Smith v. Fannie Mae, et al.
This individual securities action was originally filed on February 25, 2010, by plaintiff Edward Smith againstFannie Mae and certain of its former officers as well as several underwriters in the U.S. District Court for theCentral District of California. On April 12, 2010, this case was transferred to the Southern District of New Yorkfor coordination with In re Fannie Mae 2008 Securities Litigation and In re 2008 Fannie Mae ERISA Litigation.Plaintiff filed an amended complaint on April 19, 2011, which alleges violations of Section 10(b) of theSecurities Exchange Act of 1934 and Rule 10b-5 promulgated thereunder; violations of Section 20(a) of theSecurities Exchange Act of 1934; common law fraud and negligence claims; and California state law claims formisrepresentation in connection with Fannie Mae’s December 2007 $7.0 billion offering of 7.75%fixed-to-floating rate non-cumulative preferred Series S stock. Plaintiff seeks relief in the form of rescission,actual damages (including interest), and exemplary and punitive damages. On February 1, 2012, plaintiff soughtleave to amend his complaint to add new factual allegations and the court granted plaintiff’s motion. Plaintifffiled an amended complaint on March 2, 2012. On April 4, 2012, defendants filed motions to dismiss theamended complaint.
Given the preliminary stage of this lawsuit, the absence of a specified demand or claim by the plaintiff, and thesubstantial and novel legal questions that remain, we are currently unable to estimate the reasonably possible lossor range of loss arising from this litigation.
Transfer Tax Litigation
Seven lawsuits have been filed against us in four states challenging our right to claim an exemption under ourcharter from transfer taxes in connection with the recordation of deeds upon transfers of real property by sale orforeclosure. The plaintiff in one of these lawsuits seeks to represent a nationwide class of localities. If theselawsuits are decided against us, we may be required to pay past transfer taxes, damages, fees and/or costs.Although we believe that our charter provides us with an exemption from these taxes and therefore we have avalid defense in these lawsuits, in March 2012 a federal district court in Michigan held in two cases that we arenot exempt from Michigan transfer taxes under our charter. We plan to appeal these two Michigan decisions. Webelieve that none of these seven lawsuits are likely to have a material impact on our business, either individuallyor in the aggregate; however, these lawsuits may lead to additional lawsuits relating to the more than thirty statesthat impose these taxes. We are currently unable to estimate the reasonably possible loss or range of lossesarising from these lawsuits given the following factors: (a) taxing authorities may conclude that our charterprovides us with an exemption from these taxes, (b) existing opinions from taxing authorities in somejurisdictions may preclude retroactive collection, (c) no plaintiff has demanded a stated amount of damages, and(d) the scope of permissible claims has not yet been determined in any jurisdiction.
154

Item 3. Quantitative and Qualitative Disclosures about Market Risk
Information about market risk is set forth in “MD&A—Risk Management—Market Risk Management, IncludingInterest Rate Risk Management.”
Item 4. Controls and Procedures
Overview
We are required under applicable laws and regulations to maintain controls and procedures, which includedisclosure controls and procedures as well as internal control over financial reporting, as further described below.
Evaluation of Disclosure Controls and Procedures
Disclosure Controls and Procedures
Disclosure controls and procedures refer to controls and other procedures designed to provide reasonableassurance that information required to be disclosed in the reports we file or submit under the Exchange Act isrecorded, processed, summarized and reported within the time periods specified in the rules and forms of theSecurities and Exchange Commission (“SEC”). Disclosure controls and procedures include, without limitation,controls and procedures designed to provide reasonable assurance that information required to be disclosed by usin the reports that we file or submit under the Exchange Act is accumulated and communicated to management,including our Chief Executive Officer and Chief Financial Officer, as appropriate, to allow timely decisionsregarding our required disclosure. In designing and evaluating our disclosure controls and procedures,management recognizes that any controls and procedures, no matter how well designed and operated, can provideonly reasonable assurance of achieving the desired control objectives, and management was required to apply itsjudgment in evaluating and implementing possible controls and procedures.
Evaluation of Disclosure Controls and Procedures
As required by Rule 13a-15 under the Exchange Act, management has evaluated, with the participation of ourChief Executive Officer and Chief Financial Officer, the effectiveness of our disclosure controls and proceduresas in effect as of March 31, 2012, the end of the period covered by this report. As a result of management’sevaluation, our Chief Executive Officer and Chief Financial Officer concluded that our disclosure controls andprocedures were not effective at a reasonable assurance level as of March 31, 2012 or as of the date of filing thisreport.
Our disclosure controls and procedures were not effective as of March 31, 2012 or as of the date of filing thisreport because they did not adequately ensure the accumulation and communication to management ofinformation known to FHFA that is needed to meet our disclosure obligations under the federal securities laws.As a result, we were not able to rely upon the disclosure controls and procedures that were in place as ofMarch 31, 2012 or as of the date of this filing, and we continue to have a material weakness in our internalcontrol over financial reporting. This material weakness is described in more detail below under “Description ofMaterial Weakness.” Based on discussions with FHFA and the structural nature of the weakness in our disclosurecontrols and procedures, it is likely that we will not remediate this material weakness while we are underconservatorship.
Description of Material Weakness
The Public Company Accounting Oversight Board’s Auditing Standard No. 5 defines a material weakness as adeficiency or a combination of deficiencies in internal control over financial reporting, such that there is areasonable possibility that a material misstatement of the company’s annual or interim financial statements willnot be prevented or detected on a timely basis.
155

Management has determined that we continued to have the following material weakness as of March 31, 2012and as of the date of filing this report:
• Disclosure Controls and Procedures. We have been under the conservatorship of FHFA sinceSeptember 6, 2008. Under the 2008 Reform Act, FHFA is an independent agency that currently functions asboth our conservator and our regulator with respect to our safety, soundness and mission. Because of thenature of the conservatorship under the 2008 Reform Act, which places us under the “control” of FHFA (asthat term is defined by securities laws), some of the information that we may need to meet our disclosureobligations may be solely within the knowledge of FHFA. As our conservator, FHFA has the power to takeactions without our knowledge that could be material to our shareholders and other stakeholders, and couldsignificantly affect our financial performance or our continued existence as an ongoing business. Althoughwe and FHFA attempted to design and implement disclosure policies and procedures that would account forthe conservatorship and accomplish the same objectives as a disclosure controls and procedures policy of atypical reporting company, there are inherent structural limitations on our ability to design, implement, testor operate effective disclosure controls and procedures. As both our regulator and our conservator under the2008 Reform Act, FHFA is limited in its ability to design and implement a complete set of disclosurecontrols and procedures relating to Fannie Mae, particularly with respect to current reporting pursuant toForm 8-K. Similarly, as a regulated entity, we are limited in our ability to design, implement, operate andtest the controls and procedures for which FHFA is responsible.
Due to these circumstances, we have not been able to update our disclosure controls and procedures in amanner that adequately ensures the accumulation and communication to management of information knownto FHFA that is needed to meet our disclosure obligations under the federal securities laws, includingdisclosures affecting our condensed consolidated financial statements. As a result, we did not maintaineffective controls and procedures designed to ensure complete and accurate disclosure as required by GAAPas of March 31, 2012 or as of the date of filing this report. Based on discussions with FHFA and thestructural nature of this weakness, it is likely that we will not remediate this material weakness while we areunder conservatorship.
Mitigating Actions Relating to Material Weakness
As described above under “Description of Material Weakness,” we continue to have a material weakness in ourinternal control over financial reporting relating to our disclosure controls and procedures. However, we andFHFA have engaged in the following practices intended to permit accumulation and communication tomanagement of information needed to meet our disclosure obligations under the federal securities laws:
• FHFA has established the Office of Conservatorship Operations, which is intended to facilitate operation ofthe company with the oversight of the conservator.
• We have provided drafts of our SEC filings to FHFA personnel for their review and comment prior to filing.We also have provided drafts of external press releases, statements and speeches to FHFA personnel fortheir review and comment prior to release.
• FHFA personnel, including senior officials, have reviewed our SEC filings prior to filing, including thisquarterly report on Form 10-Q for the quarter ended March 31, 2012 (“First Quarter 2012 Form 10-Q”), andengaged in discussions regarding issues associated with the information contained in those filings. Prior tofiling our First Quarter 2012 Form 10-Q, FHFA provided Fannie Mae management with a writtenacknowledgement that it had reviewed the First Quarter 2012 Form 10-Q, and it was not aware of anymaterial misstatements or omissions in the First Quarter 2012 Form 10-Q and had no objection to our filingthe First Quarter 2012 Form 10-Q.
• The Acting Director of FHFA and our Chief Executive Officer have been in frequent communication,typically meeting on at least a bi-weekly basis.
• FHFA representatives attend meetings frequently with various groups within the company to enhance theflow of information and to provide oversight on a variety of matters, including accounting, credit andmarket risk management, external communications and legal matters.
156

• Senior officials within FHFA’s Office of the Chief Accountant have met frequently with our senior financeexecutives regarding our accounting policies, practices and procedures.
Changes in Internal Control over Financial Reporting
Overview
Management has evaluated, with the participation of our Chief Executive Officer and Chief Financial Officer,whether any changes in our internal control over financial reporting that occurred during our last fiscal quarterhave materially affected, or are reasonably likely to materially affect, our internal control over financialreporting. Below we describe changes in our internal control over financial reporting since December 31, 2011that management believes have materially affected, or are reasonably likely to materially affect, our internalcontrol over financial reporting.
Change in Management
In the first quarter of 2012, Michael J. Williams, our President and Chief Executive Officer, announced that hewill step down from his position when our Board of Directors names a successor.
157

PART II—OTHER INFORMATION
Item 1. Legal Proceedings
The information in this item supplements and updates information regarding certain legal proceedings set forth in“Legal Proceedings” in our 2011 Form 10-K. We also provide information regarding material legal proceedingsin “Note 13, Commitments and Contingencies,” which is incorporated herein by reference. In addition to thematters specifically described or incorporated by reference in this item, we are involved in a number of legal andregulatory proceedings that arise in the ordinary course of business that do not have a material impact on ourbusiness. Litigation claims and proceedings of all types are subject to many factors that generally cannot bepredicted accurately.
We record reserves for legal claims when losses associated with the claims become probable and the amountscan be reasonably estimated. The actual costs of resolving legal claims may be substantially higher or lower thanthe amounts reserved for those claims. For matters where the likelihood or extent of a loss is not probable orcannot be reasonably estimated, we do not recognize in our condensed consolidated financial statements thepotential liability that may result from these matters. We presently cannot determine the ultimate resolution ofthe matters described below or incorporated by reference into this item or in our 2011 Form 10-K. We haverecorded a reserve for legal claims related to those matters when we were able to determine a loss was bothprobable and reasonably estimable. If certain of these matters are determined against us, it could have a materialadverse effect on our results of operations, liquidity and financial condition, including our net worth.
Shareholder Derivative Litigation
Three shareholder derivative cases were filed at various times between June 2007 and June 2008 naming certainof our current and former directors and officers as defendants, and Fannie Mae as a nominal defendant. Thesecases were pending before the U.S. Court of Appeals for the District of Columbia Circuit: Kellmer v. Raines,et al. (filed June 29, 2007); Middleton v. Raines, et al. (filed July 6, 2007); and Agnes v. Raines, et al.(filed June 25, 2008). The cases relied on factual allegations that Fannie Mae’s accounting statements wereinconsistent with the GAAP requirements relating to hedge accounting and the amortization of premiums anddiscounts. Agnes relied on factual allegations that defendants wrongfully failed to disclose our exposure to thesubprime mortgage crisis and that the Board improperly authorized the company to buy back $100 million inshares while the stock price was artificially inflated. Plaintiffs sought, on behalf of Fannie Mae, various forms ofmonetary and non-monetary relief, including unspecified money damages (including restitution, legal fees andexpenses, disgorgement and punitive damages); corporate governance changes; an accounting; and attaching,impounding or imposing a constructive trust on the individual defendants’ assets.
Pursuant to a June 25, 2009 order, FHFA, as our conservator, substituted itself for shareholder plaintiffs in all ofthese actions. On July 27, 2010, the U.S. District Court for the District of Columbia dismissed Kellmer andMiddleton with prejudice and Agnes without prejudice. FHFA filed motions to reconsider the decisionsdismissing Kellmer and Middleton with prejudice, and those motions were denied on October 22, 2010. FHFAappealed that denial on November 22, 2010. Plaintiffs Kellmer and Agnes also appealed the substitution and thedismissal orders. On January 20, 2011, the U.S. Court of Appeals for the District of Columbia Circuit issued anorder in the Kellmer appeal granting FHFA’s motions for the voluntary dismissal of defendants KennethM. Duberstein, Frederic Malek and Patrick Swygert. On that same day, in the Middleton appeal, the Court ofAppeals issued an order granting FHFA’s motions for the voluntary dismissal of defendants Stephen Ashley,Kenneth Duberstein, Thomas Gerrity, Ann Korologos, Frederic Malek, Donald Marron, Anne Mulcahy, JoePickett, Leslie Rahl, Patrick Swygert, and John Wulff. On March 30, 2012, the Court of Appeals affirmed theorders allowing FHFA to substitute itself for shareholder plaintiffs Kellmer and Agnes. Also, the Court ofAppeals reversed the district court’s dismissal with prejudice of the Kellmer and Middleton actions, andremanded with instructions for dismissal without prejudice.
FHFA Private-Label Mortgage-Related Securities Litigation
In the third quarter of 2011, FHFA, as conservator for us and for Freddie Mac, filed 16 lawsuits on behalf of usand Freddie Mac against various financial institutions, their officers and affiliated and unaffiliated underwriters
158

who were responsible for marketing and selling private-label mortgage-related securities to us. The lawsuits seekto recover losses we and Freddie Mac incurred on the securities. FHFA filed 13 of these lawsuits in theU.S. District Court for the Southern District of New York—against Bank of America Corp.; Barclays Bank PLC;Citigroup, Inc.; Credit Suisse Holdings (USA), Inc.; Deutsche Bank AG; First Horizon National Corporation;Goldman, Sachs & Co.; HSBC North America Holdings Inc.; JPMorgan Chase & Co.; Merrill Lynch & Co.;Nomura Holding America Inc.; SG Americas, Inc.; and UBS Americas Inc. (“UBS”) and against certain relatedentities and individuals. Two lawsuits—against Countrywide Financial Corporation (“Countrywide”) andMorgan Stanley—were filed in the Supreme Court of the State of New York for the County of New York, andone—against The Royal Bank of Scotland Group PLC (“RBS”)—was filed in the U.S. District Court for theDistrict of Connecticut. The lawsuit against UBS was filed on July 27, 2011, and all the others were filed onSeptember 2, 2011. The lawsuits allege that the defendants violated federal securities laws and state common lawby making material misstatements and omissions in the offering documents for the securities that were sold toFannie Mae and Freddie Mac regarding the characteristics of the loans underlying the securities. The complaintsalso allege state securities law violations and some allege common law fraud. The complaints seek, among otherthings, rescission and recovery of consideration paid for the securities at issue in the lawsuits, monetary damagesand, in certain cases, punitive damages for common law fraud.
Defendants in the two cases filed in New York state court removed those cases to the U.S. District Court for theSouthern District of New York and FHFA filed motions to remand the cases back to state court. On February 7,2012, the Joint Panel on Multidistrict Litigation transferred the Countrywide case to the U.S. District Court forthe Central District of California for inclusion in a multidistrict proceeding involving other actions pendingagainst Countrywide. On April 6, 2012, the court denied FHFA’s motion to remand the Countrywide case.
On November 16, 2011, all of the cases pending in the Southern District of New York were transferred to onejudge in the district, Judge Cote. The court stayed the time to answer or move to dismiss all of the cases exceptthe UBS case. On December 21, 2011, FHFA filed an amended complaint in the UBS case. On January 20, 2012,defendants in the UBS case filed a motion to dismiss the amended complaint. On May 4, 2012, the court denieddefendants’ motion to dismiss in the UBS case with respect to the federal and state securities law claims andgranted defendants’ motion to dismiss with respect to the negligent misrepresentation claim.
On February 1, 2012, FHFA filed an amended complaint in the RBS case. On March 2, 2012, defendants in theRBS case filed a motion to dismiss the amended complaint.
Item 1A. Risk Factors
In addition to the information in this report, you should carefully consider the risks relating to our business thatwe identify in “Risk Factors” in our 2011 Form 10-K. This section supplements and updates that discussion. Fora complete understanding of the subject, you should read both together. Please also refer to “MD&A—RiskManagement” in this report and in our 2011 Form 10-K for more detailed descriptions of the primary risks to ourbusiness and how we seek to manage those risks.
The risks we face could materially adversely affect our business, results of operations, financial condition,liquidity and net worth, and could cause our actual results to differ materially from our past results or the resultscontemplated by forward-looking statements contained in this report. However, these are not the only risks weface. In addition to the risks we discuss below, we face risks and uncertainties not currently known to us or thatwe currently believe are immaterial.
Our business and results of operations may be materially adversely affected if we are unable to retain and hirequalified employees.
Our business processes are highly dependent on the talents and efforts of our employees. The conservatorship,the uncertainty of our future, limitations on employee compensation, the heightened scrutiny of our actions byCongress and regulators and the working environment created thereby, and negative publicity concerning theGSEs have had and are likely to continue to have an adverse effect on our ability to retain and recruitwell-qualified employees. We have already had significant departures by various members of executive
159

management since shortly before we entered into conservatorship in September 2008, including two ChiefExecutive Officers and three Chief Financial Officers. In addition, in January 2012, our current Chief ExecutiveOfficer announced that he will step down from his position when our Board of Directors names a successor.Further turnover in key management positions and challenges in integrating new management could harm ourability to manage our business effectively and ultimately adversely affect our financial performance.
Actions taken by Congress, FHFA and Treasury to date, or that may be taken by them or other governmentagencies in the future, may have an adverse effect on the retention and recruitment of senior executives,management, and other valuable employees. We are subject to significant restrictions on the amount and type ofcompensation we may pay our executives and other employees under conservatorship. For example, in April2012, the STOCK Act was enacted, which includes a provision that prohibits senior executives at Fannie Maeand Freddie Mac from receiving bonuses during any period of conservatorship on or after the date of enactmentof the law. In addition, FHFA has directed us to maintain individual salaries and wage rates for all employees at2010 levels for 2011 and 2012 (except in the case of promotions or significant changes in responsibilities). Weare also unable to offer equity-based compensation.
Congress has also considered other legislation that would alter the compensation for Fannie Mae and FreddieMac employees. In 2011, the Financial Services Committee of the House of Representatives approved a bill thatwould put our employees on a federal government pay scale. If this or similar legislation were to become law,our employees could experience a sudden and sharp decrease in compensation. The Acting Director of FHFAstated on November 15, 2011 that this “would certainly risk a substantial exodus of talent, the best leaving first inmany instances. [Fannie Mae and Freddie Mac] likely would suffer a rapidly growing vacancy list andreplacements with lesser skills and no experience in their specific jobs. A significant increase in safety andsoundness risks and in costly operational failures would, in my opinion, be highly likely.” The Acting Directorobserved, “Should the risks I fear materialize, FHFA might well be forced to limit [Fannie Mae and FreddieMac’s] business activities. . . . Some of the business [Fannie Mae and Freddie Mac] would be unable toundertake might simply not occur, with potential disruption in housing markets and the economy.”
We face competition from within the financial services industry and from businesses outside of the financialservices industry for qualified employees. Additionally, an improving economy is likely to put additionalpressures on turnover, as attractive opportunities become available to our employees. Our competitors for talentare able to provide market-based compensation and to link employees’ pay to performance. The constraints onour compensation could adversely affect our ability to attract qualified candidates. While we engage insuccession planning for our senior management and other critical positions and have been able to fill a number ofimportant positions internally, our inability to offer market-based compensation may limit our ability to attractand retain qualified employees below the senior executive level that could fill our senior executive level positionsif there is further turnover.
If we are unable to retain, promote and attract employees with the necessary skills and talent, we would faceincreased risks for operational failures. Our ability to conduct our business and our results of operations wouldlikely be materially adversely affected.
We expect our operational risk to increase as a result of recent FHFA and Congressional directives.
We recently have been directed by FHFA and Congress to take specified actions that present significantoperational challenges for us. We believe that implementing these directives will increase our operational riskand may potentially result in one or more significant deficiencies or material weaknesses in our internal controlover financial reporting in a future period.
As described in “Business—Legislative and Regulatory Developments—Changes to Our Single-FamilyGuaranty Fee Pricing” in our 2011 Form 10-K, in December 2011, Congress enacted the Temporary Payroll TaxCut Continuation Act of 2011 which, among other provisions, requires that we increase our single-familyguaranty fees by at least 10 basis points and remit the additional revenue to Treasury. In addition, as described in“Legislative and Regulatory Developments—FHFA Advisory Bulletin Regarding Framework for AdverselyClassifying Loans,” in April 2012, FHFA issued supervisory guidance requiring that we change our method ofaccounting for delinquent loans. Each of these directives creates significant operational burdens and costs for us.
160

We are also currently working on implementing a number of other FHFA initiatives that may increase ouroperational burdens and our costs, including those described in “Executive Compensation—CompensationDiscussion and Analysis—2012 Executive Compensation Program—2012 Corporate Performance Objectives” ofour 2011 Form 10-K/A.
While implementation of each individual directive creates operational challenges, implementing multipledirectives significantly increases these challenges. Implementing these directives requires a substantial timecommitment from management and the employees responsible for implementing the changes, which couldadversely affect our ability to retain these employees. In addition, some of these directives require significantchanges to our accounting methods and systems. Due to the operational complexity associated with thesechanges and the limited time periods for implementing them, we believe there is a significant risk thatimplementing these changes may result in one or more significant deficiencies or material weaknesses in ourinternal control over financial reporting in a future period. If this were to occur, we could experience materialerrors in our reported financial results.
In addition to the directives described above, FHFA, other agencies of the U.S. government or Congress maydirect us to take additional actions in the future that could further increase our operational risk. For example,FHFA may require us to change our accounting policies to align more closely with those of Freddie Mac or wemay be required to implement a principal forgiveness program.
Changes in accounting standards and policies can be difficult to predict and can materially impact how werecord and report our financial results.
Our accounting policies and methods are fundamental to how we record and report our financial condition andresults of operations. From time to time, the FASB, the SEC or FHFA changes the financial accounting andreporting standards or the policies that govern the preparation of our financial statements. These changes can bedifficult to predict and expensive to implement, and can materially impact how we record and report our financialcondition and results of operations. We could be required to apply new or revised guidance retrospectively,which may result in the revision of prior period financial statements by material amounts. The implementation ofnew or revised accounting guidance could have a material adverse effect on our net worth and result in orcontribute to the need for additional draws from Treasury under the senior preferred stock purchase agreement.
In addition, FHFA may require us to change our accounting policies to align more closely with those of FreddieMac. FHFA may also require that we and Freddie Mac have the same independent public accounting firm. Eitherof these events could significantly increase our expenses and require a substantial amount of management’sattention.
Given the deteriorated credit quality of many of our mortgage insurer counterparties, we may incur losses as aresult of claims under our mortgage insurance policies not being paid in full or at all, and we may facebusiness disruptions and increased concentration risk.
We rely heavily on mortgage insurers to provide insurance against borrower defaults on single-familyconventional mortgage loans with LTV ratios over 80% at the time of acquisition. The already weak financialcondition of many of our mortgage insurer counterparties continued to deteriorate in the first quarter of 2012,which increased the risk that these counterparties will fail to fulfill their obligations to pay our claims underinsurance policies.
As of May 9, 2012, three of our mortgage insurance counterparties—Triad, RMIC and PMI—have publiclydisclosed that they are in run-off. A mortgage insurer that is in run-off continues to collect premiums on itsexisting insurance business, but no longer writes new insurance. This increases the risk that the mortgage insurerwill fail to pay our claims under insurance policies, and could also cause the quality and speed of its claimsprocessing to deteriorate. Triad, RMIC and PMI are currently paying only a portion of policyholder claims anddeferring the remaining portion. As of May 9, 2012, Triad is paying only 60% of claims under its mortgageguaranty insurance policies and deferring the remaining 40%, and both PMI and RMIC are paying 50% of claimsand deferring the remaining 50%. It is uncertain when, or if, regulators for Triad, RMIC or PMI will allowdeferred policyholder claims to be paid or increase the amount paid on claims. In addition, PMI has publiclydisclosed that it is in receivership.
161

In addition to our three mortgage insurers in run-off, one mortgage insurer, Genworth, is currently operatingpursuant to a waiver it received from its regulator of the state regulatory capital requirements applicable to itsmain insurance writing entity. An additional two of our mortgage insurance counterparties (MGIC and Radian)have disclosed that, in the absence of additional capital contributions to their insurance writing entity, theircapital might fall below state regulatory capital requirements in the future. These three mortgage insurers,together with our three mortgage insurers in run-off, provided a combined $73.3 billion, or 80%, of our risk inforce mortgage insurance coverage of our single-family guaranty book of business as of March 31, 2012. We donot know how long certain of our mortgage insurer counterparties will remain below their state-imposedrisk-to-capital limits. If mortgage insurers are not able to raise capital and they exceed their risk-to-capital limits,they will likely be forced into run-off or receivership unless they can secure and maintain waivers from their stateregulators.
Some mortgage insurers have explored corporate restructurings, which are intended to provide relief fromrisk-to-capital limits in certain states. A restructuring plan that would involve contributing capital to a subsidiarywould result in less liquidity available to its parent company to pay claims on its existing book of business and anincreased risk that its parent company will not pay its claims in full in the future.
Our loss reserves take into account our assessment of our mortgage insurer counterparties’ ability to fulfill theirobligations to us. If our assessment of their ability to pay claims deteriorates significantly, it could result in asignificant increase in our loss reserves and our credit losses.
Many mortgage insurers stopped insuring new mortgages with higher LTV ratios or with lower borrower FICOcredit scores or on select property types. As our charter generally requires us to obtain credit enhancement onsingle-family conventional mortgage loans with loan-to-value ratios over 80% at the time of purchase, aninability to find suitable credit enhancement may inhibit our ability to pursue new business opportunities, meetour housing goals and otherwise support the housing and mortgage markets. For example, where mortgageinsurance or other credit enhancement is not available, we may be hindered in our ability to refinance loans intomore affordable loans. In addition, access to fewer mortgage insurer counterparties will increase ourconcentration risk with the remaining mortgage insurers in the industry.
Changes in the mortgage industry may negatively impact our business.
A number of our largest mortgage seller/servicer counterparties have reduced or eliminated their purchases ofmortgage loans from mortgage brokers and correspondent lenders. As a result, we are acquiring an increasingportion of our business volume directly from smaller financial institutions that may not have the same financialstrength as our largest counterparties. Our top five lender customers in terms of single-family businessacquisition volume, in the aggregate, accounted for approximately 54% of our single-family business acquisitionvolume in the first quarter of 2012, compared with approximately 65% of our single-family business acquisitionvolume in the first quarter of 2011. In addition, only three of our top five lender customers for the first quarter of2011 remained in our top five for the first quarter of 2012. Similarly, some of our servicing volume is shifting tosmaller or non-traditional servicers. Our ten largest single-family mortgage servicers, including their affiliates,serviced 74% of our single-family guaranty book of business as of March 31, 2012, compared to 76% as ofMarch 31, 2011. These smaller servicers may not have the same financial strength or operational capacity as ourlargest servicers, which could negatively affect their ability to service the loans on our behalf or to satisfy theirrepurchase or compensatory fee obligations. This decrease in the concentration of our business with largeinstitutions could increase both our institutional counterparty credit risk and our mortgage credit risk, and couldhave a material adverse effect on our business, results of operations, financial condition, liquidity and net worth.
If we become subject to state and local taxes on the transfer of real property in a large number of states, itwould increase our costs going forward and could have an adverse effect on our financial results.
As of May 9, 2012, seven lawsuits have been filed against us in four states challenging our right to claim anexemption under our charter from transfer taxes in connection with the recordation of deeds upon transfers ofreal property by sale or foreclosure. The plaintiff in one of these lawsuits seeks to represent a nationwide class oflocalities. If these lawsuits are decided against us, we may be required to pay past transfer taxes, damages, feesand/or costs. In addition, we would be subject to payment of transfer taxes in these states going forward, which
162

would increase our costs. Although we believe that our charter provides us with an exemption from these taxesand therefore we have a valid defense in these lawsuits, in March 2012, a federal district court in Michigan heldin two cases that we are not exempt from Michigan transfer taxes under our charter. We plan to appeal these twoMichigan decisions.
More than thirty states impose a tax on the transfer of real property by sale or foreclosure. Accordingly,additional lawsuits relating to state or local transfer taxes could be filed against us in the future. Also, variousstate taxing authorities from other jurisdictions could seek to impose these transfer taxes. If we were to becomesubject to real property transfer taxes in a large number of states and localities, and if we were required to pay anumber of years of past transfer taxes in these states and localities, it would increase our costs going forward andcould have an adverse effect on our financial results.
Item 2. Unregistered Sales of Equity Securities and Use of Proceeds
Recent Sales of Unregistered Securities
Under the terms of our senior preferred stock purchase agreement with Treasury, we are prohibited from sellingor issuing our equity interests, other than as required by (and pursuant to) the terms of a binding agreement ineffect on September 7, 2008, without the prior written consent of Treasury.
We previously provided stock compensation to employees and members of the Board of Directors under theFannie Mae Stock Compensation Plan of 1993 and the Fannie Mae Stock Compensation Plan of 2003 (the“Plans”). During the quarter ended March 31, 2012, 40,786 restricted stock units vested, as a result of which26,989 shares of common stock were issued, and 13,797 shares of common stock that otherwise would have beenissued were withheld by us in lieu of requiring the recipients to pay us the withholding taxes due upon vesting.All of these restricted stock units were granted prior to our entering into conservatorship. Restricted stock unitsgranted under the Plans typically vest in equal annual installments over three or four years beginning on the firstanniversary of the date of grant. Each restricted stock unit represents the right to receive a share of common stockat the time of vesting. As a result, restricted stock units are generally similar to restricted stock, except thatrestricted stock units do not confer voting rights on their holders. All restricted stock units were granted topersons who were employees or members of the Board of Directors of Fannie Mae.
The securities we issue are “exempted securities” under laws administered by the SEC to the same extent assecurities that are obligations of, or are guaranteed as to principal and interest by, the United States, except that,under the Federal Housing Enterprises Financial Safety and Soundness Act of 1992, as amended by the FederalHousing Finance Regulatory Reform Act of 2008 (together, the “GSE Act”), our equity securities are not treatedas exempted securities for purposes of Section 12, 13, 14 or 16 of the Exchange Act. As a result, our securitiesofferings are exempt from SEC registration requirements and we do not file registration statements orprospectuses with the SEC under the Securities Act of 1933 with respect to our securities offerings.
Information about Certain Securities Issuances by Fannie Mae
Pursuant to SEC regulations, public companies are required to disclose certain information when they incur amaterial direct financial obligation or become directly or contingently liable for a material obligation under anoff-balance sheet arrangement. The disclosure must be made in a current report on Form 8-K under Item 2.03 or,if the obligation is incurred in connection with certain types of securities offerings, in prospectuses for thatoffering that are filed with the SEC.
Because the securities we issue are exempted securities under the Securities Act of 1933, we do not fileregistration statements or prospectuses with the SEC with respect to our securities offerings. To comply with thedisclosure requirements of Form 8-K relating to the incurrence of material financial obligations, we report ourincurrence of these types of obligations either in offering circulars or prospectuses (or supplements thereto) thatwe post on our Web site or in a current report on Form 8-K that we file with the SEC, in accordance with a“no-action” letter we received from the SEC staff in 2004. In cases where the information is disclosed in aprospectus or offering circular posted on our Web site, the document will be posted on our Web site within thesame time period that a prospectus for a non-exempt securities offering would be required to be filed with theSEC.
163

The Web site address for disclosure about our debt securities is www.fanniemae.com/debtsearch. From thisaddress, investors can access the offering circular and related supplements for debt securities offerings underFannie Mae’s universal debt facility, including pricing supplements for individual issuances of debt securities.
Disclosure about our obligations pursuant to some of the MBS we issue, some of which may be off-balance sheetobligations, can be found at www.fanniemae.com/mbsdisclosure. From this address, investors can accessinformation and documents about our MBS, including prospectuses and related prospectus supplements.
We are providing our Web site address solely for your information. Information appearing on our Web site is notincorporated into this report.
Our Purchases of Equity Securities
The following table displays shares of our common stock we repurchased during the first quarter of 2012.
Period
TotalNumber of
SharesPurchased(1)
AveragePrice Paidper Share
Total Number ofShares Purchased as
Part of PubliclyAnnouncedProgram(2)
Maximum Number ofShares thatMay Yet be
Purchased Underthe Program(2)
2012
January 1-31 . . . . . . . . . . . . . . . . . . . . . . . . . . . 169,738 $0.23 — —
February 1-29 . . . . . . . . . . . . . . . . . . . . . . . . . . 82 0.21 — —
March 1-31 . . . . . . . . . . . . . . . . . . . . . . . . . . . . — — — —
Total . . . . . . . . . . . . . . . . . . . . . . . . . . . . . . 169,820
(1) Consists of shares of common stock reacquired from employees to pay an aggregate of $38,386 in withholding taxes dueupon the vesting of previously issued restricted stock.
(2) We do not have any publicly announced share repurchase programs under which we could purchase our common stock.
Dividend Restrictions
Our payment of dividends is subject to the following restrictions:
Restrictions Relating to Conservatorship. Our conservator announced on September 7, 2008 that we would notpay any dividends on the common stock or on any series of preferred stock, other than the senior preferred stock.In addition, FHFA’s regulations relating to conservatorship and receivership operations, which became effectiveJuly 20, 2011, prohibit us from paying any dividends while in conservatorship unless authorized by the Directorof FHFA. The Acting Director of FHFA directs us to make dividend payments on the senior preferred stock on aquarterly basis.
Restrictions under Senior Preferred Stock Purchase Agreement. The senior preferred stock purchase agreementprohibits us from declaring or paying any dividends on Fannie Mae equity securities (other than the seniorpreferred stock) without the prior written consent of Treasury.
Statutory Restrictions. Under the GSE Act, FHFA has authority to prohibit capital distributions, includingpayment of dividends, if we fail to meet our capital requirements. If FHFA classifies us as significantlyundercapitalized, approval of the Director of FHFA is required for any dividend payment. Under the GSE Act,we are not permitted to make a capital distribution if, after making the distribution, we would beundercapitalized, except the Director of FHFA may permit us to repurchase shares if the repurchase is made inconnection with the issuance of additional shares or obligations in at least an equivalent amount and will reduceour financial obligations or otherwise improve our financial condition.
Restrictions Relating to Qualifying Subordinated Debt. During any period in which we defer payment ofinterest on qualifying subordinated debt, we may not declare or pay dividends on, or redeem, purchase or acquire,our common stock or preferred stock.
164

Restrictions Relating to Preferred Stock. Payment of dividends on our common stock is also subject to the priorpayment of dividends on our preferred stock and our senior preferred stock. Payment of dividends on alloutstanding preferred stock, other than the senior preferred stock, is also subject to the prior payment ofdividends on the senior preferred stock.
Item 3. Defaults Upon Senior Securities
None.
Item 4. Mine Safety Disclosures
None.
Item 5. Other Information
None.
Item 6. Exhibits
An index to exhibits has been filed as part of this report beginning on page E-1 and is incorporated herein byreference.
165

SIGNATURES
Pursuant to the requirements of the Securities Exchange Act of 1934, the registrant has duly caused this report tobe signed on its behalf by the undersigned thereunto duly authorized.
Federal National Mortgage Association
By: /s/ Michael J. Williams
Michael J. WilliamsPresident and Chief Executive Officer
Date: May 9, 2012
By: /s/ Susan R. McFarland
Susan R. McFarlandExecutive Vice President andChief Financial Officer
Date: May 9, 2012
166

INDEX TO EXHIBITS
Item Description
3.1 Fannie Mae Charter Act (12 U.S.C. § 1716 et seq.) as amended through July 30, 2008(Incorporated by reference to Exhibit 3.1 to Fannie Mae’s Annual Report on Form 10-K, filedFebruary 24, 2011.)
3.2 Fannie Mae Bylaws, as amended through January 30, 2009 (Incorporated by reference toExhibit 3.2 to Fannie Mae’s Annual Report on Form 10-K for the year ended December 31, 2008,filed February 26, 2009.)
10.43 Termination Agreement and General Release, effective as of February 28, 2012, by and betweenDavid C. Hisey and Fannie Mae
10.44 Repayment Provisions For SEC Executive Officers, amended and restated as of March 8, 2012
31.1 Certification of Chief Executive Officer pursuant to Securities Exchange Act Rule 13a-14(a)
31.2 Certification of Chief Financial Officer pursuant to Securities Exchange Act Rule 13a-14(a)
32.1 Certification of Chief Executive Officer pursuant to 18 U.S.C. Section 1350
32.2 Certification of Chief Financial Officer pursuant to 18 U.S.C. Section 1350
101.INS XBRL Instance Document*
101.SCH XBRL Taxonomy Extension Schema*
101.LAB XBRL Taxonomy Extension Labels*
101.PRE XBRL Taxonomy Extension Presentation*
101.DEF XBRL Taxonomy Extension Definition*
* The financial information contained in these XBRL documents is unaudited. The information in these exhibitsshall not be deemed “filed” for purposes of Section 18 of the Securities Exchange Act of 1934, or otherwisesubject to the liabilities of Section 18, nor shall they be deemed incorporated by reference into any disclosuredocument relating to Fannie Mae, except to the extent, if any, expressly set forth by specific reference in suchfiling.
E-1

FR010