feature facts section: index facts issue 2015 · commercial: 46, 48 u.s. market share, retreaded...
TRANSCRIPT

MTD January 2015
Facts section: Index
Modern Tire Dealer breaks down the North Ameri-can marketplace for the 49th consecutive year. Here’s a list of what you’ll find in our record 29 charts.
Tire shipments: 30, 32, 34 U.S. replacement tire salesU.S. consumer and truck tire imports from ChinaU.S. units shippedU.S. consumer tire imports by countryU.S./Canadian and world leaders in new tire sales
Brand share: 36, 38, 40U.S./Canadian replacement consumer tire brand sharesOriginal equipment brand sharesU.S./Canadian OE consumer tire market sharesBrands listed by the MTD 100
Tire plant capacities, North America: 44-45
Commercial: 46, 48U.S. market share, retreaded truck tiresU.S. replacement medium/heavy truck tire brand sharesU.S. farm tire market shares
Tire sizing and pricing: 52, 53OE passenger and light truck tires, 2011-2012Top passenger and light truck tire sizes, 2012New sizes in 2014
Retailing and wholesaling: 54U.S. consumer tire retail market shareConsumer tire distribution channel market share2015 tire-buying decisions based on gender
Future shock: 56New P-metric and LT tire sizes/SKUs in 2015
All figures in the 14-page Facts Section are Modern Tire Dealer figures unless otherwise noted. For all market share charts: Because numbers are rounded to the nearest one-half percent, the total may not equal 100%.
FACTS ISSUE 2015
feature

MTD January 2015
By Bob Ulrich
A lthough it is 6,000 miles away, the People’s Republic of China is the center of the universe to the U.S. tire industry. In 2014, China exported a record 60.5
million passenger and light truck tires to the United States, representing one-quarter of all domestic replacement consumer tire shipments.
That alone is enough to keep tire manufacturers, market-ers, retailers and the U.S. government focused on China and its low-cost radials. However, recent tariffs placed on Chinese consumer tire imports will change tier pricing in the U.S. throughout 2015 and beyond. And that will affect the consumer, too.
To put China’s influence on the U.S. tire market into per-spective, Chinese exports are three times larger than the second largest exporter, Canada, and twice as large as our NAFTA partners combined, even though we share borders with Canada and Mexico.
Plant capacity has something to do with the disparities. While Canada and Mexico host 12 consumer tire plants that can produce 46 million tires a year, there are some 80 companies in China that can produce more than 400 million passenger and light truck tires annually, according to the U.S. International Trade Commission (ITC).
If you look at the list of consumer tire imports by country (see Chart 5 on page 32), the number of Chinese imports roughly equals imports from the next four largest countries: Canada, South Korea, Thailand and Indonesia.
Based on the massive influx of Chinese tires over the last two years, the United Steelworkers (USW) union charged the Chinese government with subsidizing exports to the U.S., resulting in unfair trade. It filed a complaint with the ITC and U.S. Department of Commerce last June asking for countervailing and anti-dumping duties, also known as tariffs.
The charges were similar to those filed by the USW in 2009, which led to additional tariffs ranging from 35% to 25% over the next three years. (All Chinese passenger and light truck
Facts section: Tire shipments
The hub of the wheelLike it or not, the U.S. tire industry
revolves around China
Chart 42014 REPLACEMENT PASSENGER TIRE MARKET
(based on 206.6 million units)
Chart 12014 U.S. REPLACEMENT TIRE SALES
(a $37.4 billion industry)
Passenger tires $24.8 billon
Light truck tires $4.9 billion
Truck tires $6.6 billion
Farm tires $ 538 million
OTR tires $ 580 millionIn 2013, U.S. replacement tire sales totaled $37.3 billion.
Chart 3U.S. UNITS SHIPPED
2010-2014 (in millions; imports included)
PASSENGER TIRES
Year Replacement OE
2014 206.6 46.0
2013 201.6 44.0
2012 192.0 40.5
2011 196.5 36.0
2010 198.7 34.6
LIGHT TRUCK TIRES
2014 28.8 4.8
2013 28.3 4.4
2012 28.3 4.2
2011 28.6 4.1
2010 28.0 3.5
MEDIUM/HEAVY TRUCK TIRES
2014 17.3 5.8
2013 15.7 5.0
2012 16.0 5.3
2011 17.0 4.9
2010 15.3 3.0
Chart 2U.S. CONSUMER TIRE IMPORTS
FROM CHINA(in millions of units)
Year Units Yr./yr. change
2014 60.5 +17.9%
2013 51.3 +57.8%
2012 32.5 +25.0%
2011 26.0 - 16.1%
2010 31.0 -27.9%
Sources: MTD figures, Rubber Manufacturers Association
30

MTD January 2015
tires are already saddled with a 4% duty.) Over that span, average replacement tire prices increased 30%.
Without the tariffs, pricing has dropped each of the last two years.
Although low-cost radial production in the U.S. cannot keep up with demand, the Department of Commerce once again agreed with the union. On Dec. 1, 2014, it implemented coun-tervailing duties on all consumer tires, broken out as follows:
• 11.74% for Giti Tire (Fujian) Co. Ltd.• 12.5% for Cooper Tire & Rubber Co.• 81.9% for Shandong Yongsheng Rubber Group Co. Ltd.• 12.03% for all other Chinese exporters.
(The DOC is expected to add anti-dumping duties to consumer tire imports from China before the end of January; ST tires are exempt from either tariff.)
Except for Giti and Cooper imports, the additional tariffs are retroactive 90 days from Dec. 1, their effective date. That means even tires imported on or after Sept. 2, 2014, are subject to the additional duties. Giti and Cooper were exempt because they kept their import volume growth in check.
The resulting consequences relating to the decisions were severe and swift.
Two tire manufacturers raised prices. Giti Tire (USA) Ltd. announced a 9.5% increase on all passenger and light truck tires, effective Jan. 1, 2015. Cooper Tire quietly increased prices 6% to 8% on some, but not all, of its Cooper and Starfire lines, also effective Jan. 1.
Shandong produces some of the private brand tires for Del-Nat Tire Corp., which is in talks to sell to TBC Corp. In a letter to Del-Nat shareholders, CEO Brian Grant referenced how Del-Nat was “significantly impacted” by the recent coun-tervailing duties imposed on consumer imports from China.
Shandong was one of three Chinese manufacturers that produced the Fuzion brand for Bridgestone Americas Inc. Now there are two sources.
“We knew back in September that they would be assigned the maximum CV (countervailing) tariff, so we moved molds and shifted production to the other plants,” says a Bridgestone spokesperson. “The other two plants have the necessary capacity to handle our volume needs.”
Tire shipments, 2014... and 2015Replacement and original equipment tire shipments were
up across the board in 2014 vs. 2013 (not counting farm and OTR tires). Passenger tire shipments were up 2.5% and 4.5%, respectively (see Chart 3 on page 30). Light truck tire shipments — LT sizing, not P-metric light truck — were up 1.7% and 9%, respectively.
The growth in the truck tire segment, which includes wide-base and heavy truck tires as well as medium truck tires, was particularly robust. Replacement shipments were up 10.2% year-over-year, while OE shipments increased 16%.
Demand for commercial vehicles in the U.S. and Canada continues to strengthen, though used commercial vehicle registrations still outnumber new registrations, according to Gary Meteer, director of commercial vehicle solutions for the IHS Automotive division of IHS Inc. Speaking to industry executives at the 2014 Automotive Aftermarket Products
Expo in Las Vegas, he said the average age among Class 4 to 8 trucks has risen from 12.5 years in 2007 to 14.7 years.
The Rubber Manufacturers Association (RMA) estimates total U.S. replacement and OE tire shipments will increase from nearly 310 million units in 2014 to slightly more than 310 million this year.
“Passenger original equipment shipments are expected to increase in 2015 due to anticipated growth in auto sales, while replacement tire shipments are expected to decline less than 1%,” said the RMA. “Light truck and commercial truck original equipment and replacement tire shipments are expected to grow in 2015.”
Facts section: Tire shipments
Chart 62014 U.S. TRUCK TIRE IMPORTS FROM CHINA
(based on 8.2 million units)
Sources for Charts 5-6: U.S. government, MTD figures
Chart 5U.S. CONSUMER TIRE IMPORTS
BY COUNTRY(units, in parentheses, are in millions)
2014 rank/country 2013 rank% changevs. 2013
1. China (60.5) 1 +17.9%
2. Canada (19.6) 2 -4.8%
3. South Korea (18.0) 3 -9.0%
4. Thailand (12.2) 6 +10.9%
5. Indonesia (11.1) 5 -0.9%
6. Mexico (10.8) 4 -0.9%
7. Japan (10.1) 7 -2.9%
8. Taiwan (7.3) 8 +1.4%
9. Chile (6.8) 9 +13.3%
10. Germany (3.7) 10 +5.7%
32

MTD January 2015
West Coast port problemsNorth American container port demand has increased
significantly the last three years. Record tire imports have added to the congestion problems at ports, especially in Los Angeles and Long Beach, Calif.
The Long Beach Board of Harbor Commissioners recently approved measures to relieve congestion. It also petitioned the Federal Maritime Commission “for permission to work in concert with the neighboring Port of Los Angeles.” The Port of Los Angeles also wants to work together.
The Commission gave preliminary approval “to a cap of four days for parking or dockage fees charged by the port to ships at berth,” according to the Port of Long Beach. “Due to delays in cargo movement, ships have needed to stay at berth longer and have had to pay higher fees. With the dockage relief, the Port would forgo an estimated $150,000 in fees by allowing longer stays without charge during stays from Dec. 1, 2014, through March, 31, 2015.”
The development of a new generation of “mega ships” and a shortage of “truck trailer frames used to haul cargo containers” have been partially blamed for causing bottlenecks at ports around the country. Increased trade, although desired, has simply exacerbated the problems.
The growth of e-retailing, or e-tailingThere is no question retail tire sales over the Internet are
increasing. But at what rate? And what is the percentage of consumers who buy them online?
When American Tire Distributors Inc. (ATD) launched TireBuyer.com in 2008, it estimated 3% of the tires sold in the U.S. — more than 7 million tires — were being sold to consumers over the Internet. According to its own research, consumers between the ages of 18 and 34 years of age, espe-cially women, were more likely to purchase tires online “and to shop exclusively online.”
When asked how likely they would be to purchase tires online in the future, 30% of the consumers surveyed by ATD indicated they were “very or somewhat likely” to do so.
In 2013, Matthew Walker, managing director of Tireweb Marketing Inc., was quoted as saying 90% of shoppers preferred to purchase tires in the store. “We also know most of them start their research online, and about 50% will leave a website if it doesn’t have pricing information on it.”
The 2013 “Google Auto Tires Purchase” online study de-termined 10% of consumers purchased tires online in 2012. That jumped to 29% in 2013. Online tire buyers also were spending more money per tire, and considering more brands during online research.
In terms of online purchasing dollars spent on automotive replacement parts, three categories represented half of the e-tail dollar volume in 2013 and none of them were tire-related. According to the Auto Care Association’s “E-Tailing in the Automotive Aftermarket” report, the top three product categories were braking systems, primarily pads and shoes; ignition and engine (fuel pumps, alternators, ignition coils, etc.); and glass, mirrors and lamps.”
When even Wal-Mart Stores Inc. is investing a considerable sum of money on e-commerce at the expense of store growth, retail sales online cannot be ignored.
It should be noted, however, that for now, online-only retailers don’t have to pay sales tax. That may change soon.
“The Marketplace Fairness Act” grants states the authority to compel online and catalog retailers, no matter where they are located, to collect sales tax at the time of a transaction. That would put them on a level playing field with local retailers.
However, the act requires states to simplify their sales tax laws before they can receive “collection authority.”
Simplification is required because two Supreme Court rul-ings cite “concern that collecting sales tax for multiple states would be too difficult.” ■
Facts section: Tire shipments
Chart 7WORLD LEADERS IN NEW TIRE SALES
(fiscal year 2014; in billions of U.S. dollars1)
Tire company 2014 2013
Bridgestone Corp. $29.3 $31.0
Groupe Michelin $24.4 $25.5
Goodyear Tire & Rubber Co. $17.8 $18.9
Continental AG $12.9 $12.7
Pirelli & Cie SpA $8.0 $8.1
Sumitomo Rubber Industries Ltd. $6.9 $7.0
Hankook Tire Co. $6.4 $6.5
Yokohama Rubber Co.2 $4.8 $4.9
Cheng Shin Rubber Ind. Co. Ltd.3 $4.3 $4.5
Cooper Tire & Rubber Co. $3.5 $3.4
Kumho Tire Co. Inc.2 $3.3 $3.4
Toyo Tire & Rubber Co. Ltd. $3.0 $3.0
U.S./CANADIAN LEADERS IN NEW TIRE SALES(fiscal year 2014; in billions of U.S. dollars)
Tire company 2014 2013
Bridgestone Americas Inc. $8.8 $9.3
Goodyear Tire & Rubber $7.3 $8.0
Michelin North America Inc. $7.3 $7.7
Continental Tire the Americs LLC $2.8 $2.8
Cooper Tire & Rubber $2.6 $2.5
Toyo Tire Holdings of America Inc. $1.5 $1.5
Hankook Tire America Corp. $1.3 $1.3
Yokohama Tire Corp. $1.3 $1.4
Sumitomo Rubber Industries4 $.90 $.91
Kumho Tire U.S.A. Inc. $.70 $.74
Pirelli Tire North America $.64 $.651 The average exchange rates between foreign currencies and the U.S. dollar differed from 2013 to 2014 as follows: Japanese yen, up 8.2%; Korean won, down 3.7%; Taiwan dollar, up 2.2%. The euro was relatively unchanged.2 Yokohama Rubber Co. and Kumho Tire Co. Ltd. signed a Memorandum of Understanding on Nov. 29, 2013. As part of the strategic alliance, the companies will share resources to “jointly pursue research and development of tire related technologies to compete with the Big 3,” according to Kumho.3 The Cheng Shin Rubber USA Inc. subsidiary does business as Maxxis International.4 Sumitomo Corp. of America is run independently of Sumi-tomo Rubber Industries.
34

MTD January 2015
How many consumer tire brands are available to the independent tire dealer? 50? 100? If you look hard enough, there are more than 100. The options ap-
pear endless. Not surprisingly, the average tire dealer offers at least 13 brands.
Imports are the main reason for brand proliferation. In 2014, U.S. companies imported a record 150.7 million passenger tires and 26.9 million light truck tires. More than 60 million consumer tires were imported from China alone.
When the tariffs on Chinese tires are fully implemented, perhaps the number of available brands will diminish. But even when the last tariff was at its highest — 35% for most of 2010 — China still exported 31 million consumer tires to the U.S.
Then why are there only three tiers of tires? The replacement tire market is made up of price points.
With so many brands from which to choose, and the increas-ing number of tire segments and sub segments, determining the right brand at the right price suddenly becomes more complicated for retailers.
Take into account increasing competition (Amazon.com?!) and the “Good-Better-Best” method of selling tires can seem antiquated.
That is why Modern Tire Dealer believes four tiers are ultimately more accurate and helpful than three. In order to develop four tiers of brands for the U.S. market, we asked the following questions:
1. How is the brand marketed? That includes both the promotional aspect of marketing and the tires against which a brand is marketed. For example, associate and private brand tires generally compete against each other in the same tier.
2. What is the selling price of the tire?3. What is the perceived quality? People often associate
greater expense with greater quality.
We also took the following into consideration: OE contracts; place on the manufacturer’s own product screen; size of the company; brand recognition; availability; market share (see Chart 8); ultra-high performance tire market share; global presence; domination of a niche market; and whether or not a manufacturer had at least a sales and marketing arm in the U.S.
Tier 1 was easy. Michelin, Bridgestone and Goodyear are generally considered to be Tier 1 products by everyone. That is why they are the anchor brands of the U.S. market. There is a reason they have the most U.S. market share among the major brands.
We couldn’t list every brand in every tier, but as a general rule, inexpensively priced tires either from China or competing against them would be placed in Tier 4.
Facts section: Brand share
There are 4 tiers, not 3‘Good-Better-Best’ still works, but new
complications require brand reorganization
Chart 82014 U.S. REPLACEMENT CONSUMER TIRE
BRAND SHARES
PASSENGER TIRES(based on 206.6 million
units)
LIGHT TRUCK TIRES(based on 28.8 million
units)
Brand % of total Brand % of total
Goodyear 13.0% Goodyear 12.0%
Michelin 9.0% BFGoodrich 8.5%
Bridgestone 8.0% Bridgestone 7.5%
Firestone 7.5% Firestone 7.0%
Cooper 5.5% Michelin 7.0%
BFGoodrich 4.5% Cooper 6.0%
Hankook 4.0% General 4.5%
Yokohama 4.0% Multi-Mile 4.0%
Continental 3.5% Hankook 3.5%
Falken 3.0% Toyo 3.5%
General 3.0% Yokohama 3.5%
Pirelli 2.5% Pirelli 2.5%
Toyo 2.5% Kumho 2.0%
Kumho 2.0% Mastercraft 2.0%
Multi-Mile 2.0% Uniroyal 2.0%
Nexen 2.0% Continental 1.5%
Primewell 2.0% Cordovan 1.5%
Dunlop 1.5% Dunlop 1.5%
GT Radial 1.5% Eldorado 1.5%
Hercules 1.5% Falken 1.5%
Mastercraft 1.5% Hercules 1.5%
Sumitomo 1.5% Kelly 1.5%
Uniroyal 1.5% Maxxis 1.5%
Big O 1.0% Big O 1.0%
Cordovan 1.0% Delta 1.0%
Delta 1.0% GT Radial 1.0%
Fuzion 1.0% Nexen 1.0%
Kelly 1.0% Primewell 1.0%
Nitto 1.0% Others 7.5%
Sailun 1.0%
Sigma 1.0%
Others 5.0%Brands must have at least 1% of the market to be listed at 1%.
36
MTD January 2015
Consumer tire tiers by brands (in random order)
Tier 1 (major tire companies’ premium brands): Michelin, Bridgestone, Goodyear.
Tier 2 (upper- and middle-market brands): Continental, Pirelli, Hankook, Yokohama, Toyo, Falken, Kumho, Dunlop, Cooper, Firestone, BFGoodrich, General.
Tier 3 (value brands; all private brands): Nexen, Hercules, Multi-Mile, GT Radial, Mastercraft, Sumitomo, Big O, Cordovan, Delta, Fierce, Fuzion, Kelly, Nitto, Sigma, Landsail, Delinte, Kenda, Vredestein, Nokian, Sailun, Eldorado, Uniroyal.
Tier 4 (low-cost brands): Atturo, Linglong, Goodride, Dy-natrac, Warrior, Duraturn, Aeolus, Zenna, Starfire, Primewell, Federal.
The International Trade Commission, in determining the need for tariffs in 2009, categorized tires into three tiers. Its Tier
1 definition was the same as ours. Tier 2 included Firestone, Dunlop, BFGoodrich, Continental, Yokohama and Toyo. Tier 3 included GT Radial, Runway, Primewell, Douglas and Riken.
It doesn’t seem to matter where the tire is produced. Consum-ers rely on the tire dealer under our industry’s well-established “70-30 Rule,” which states 70% of consumers have no tire brand preference. They rely on the dealers’ recommendations for the brands they buy.
Of the 30% who have a brand preference, 50% of them buy alternate brands based on the recommendations of their tire dealers. In other words, the dealer greatly influences the tire purchase 85% of the time.
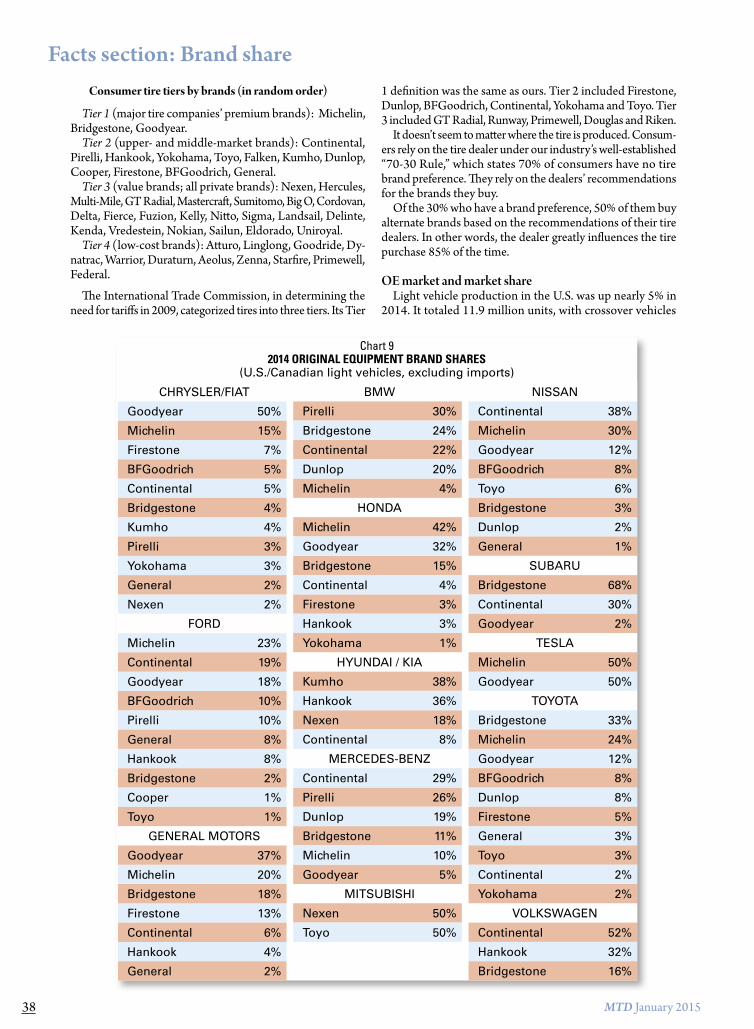
OE market and market shareLight vehicle production in the U.S. was up nearly 5% in
2014. It totaled 11.9 million units, with crossover vehicles
Facts section: Brand share
Chart 92014 ORIGINAL EQUIPMENT BRAND SHARES
(U.S./Canadian light vehicles, excluding imports)
CHRYSLER/FIAT
Goodyear 50%
Michelin 15%
Firestone 7%
BFGoodrich 5%
Continental 5%
Bridgestone 4%
Kumho 4%
Pirelli 3%
Yokohama 3%
General 2%
Nexen 2%
FORD
Michelin 23%
Continental 19%
Goodyear 18%
BFGoodrich 10%
Pirelli 10%
General 8%
Hankook 8%
Bridgestone 2%
Cooper 1%
Toyo 1%
GENERAL MOTORS
Goodyear 37%
Michelin 20%
Bridgestone 18%
Firestone 13%
Continental 6%
Hankook 4%
General 2%
BMW
Pirelli 30%
Bridgestone 24%
Continental 22%
Dunlop 20%
Michelin 4%
HONDA
Michelin 42%
Goodyear 32%
Bridgestone 15%
Continental 4%
Firestone 3%
Hankook 3%
Yokohama 1%
HYUNDAI / KIA
Kumho 38%
Hankook 36%
Nexen 18%
Continental 8%
MERCEDES-BENZ
Continental 29%
Pirelli 26%
Dunlop 19%
Bridgestone 11%
Michelin 10%
Goodyear 5%
MITSUBISHI
Nexen 50%
Toyo 50%
NISSAN
Continental 38%
Michelin 30%
Goodyear 12%
BFGoodrich 8%
Toyo 6%
Bridgestone 3%
Dunlop 2%
General 1%
SUBARU
Bridgestone 68%
Continental 30%
Goodyear 2%
TESLA
Michelin 50%
Goodyear 50%
TOYOTA
Bridgestone 33%
Michelin 24%
Goodyear 12%
BFGoodrich 8%
Dunlop 8%
Firestone 5%
General 3%
Toyo 3%
Continental 2%
Yokohama 2%
VOLKSWAGEN
Continental 52%
Hankook 32%
Bridgestone 16%
38

MTD January 2015
leading the way. Canadian production was up, too.
The increase was needed: Light vehicle sales were up 5.8% in the U.S., to 16.4 million vehicles, according to the Na-tional Automobile Dealers Association (NADA), and 6.1% in Canada, to more than 1.8 million vehicles, according to WardsAuto.com.
General Motors Corp. remained the market share leader at 19.2%, followed by Chrysler/Fiat (Fiat Chrysler Automobiles US LLC) at 18%. Ford Motor Co. was a close third at 17.9%.
Toyota Motor Sales U.S.A. Inc. , with a 13.5% market share, and American Honda Motor Co., with a 12% share, rounded out the top five vehicle manufacturers. Nissan North America Inc. was sixth with a 6.7% share.
The youngest and smallest of the OEMs, Tesla Motors Inc., accounts for less than half of one percent of the light vehicles produced in the U.S. However, the electric car company’s output was up 44% versus 2013. More than 60,000 electric vehicles were sold in the U.S. last year, up from the previous year, according to WardsAuto.com. In contrast, hybrid sales were down.
In line with increased vehicle demand, OE passenger and light truck tire ship-ments were up 5% (see Chart 3 on page 30). Five brands were up in market share: Goodyear, Pirelli, General, Toyo and Nexen (see Chart 10).
American car owners drove an esti-mated 3 trillion miles last year, up ap-proximately 1%. (There are roughly 260 million registered domestic vehicles on the road today.) Nick Mitchell, senior vice president of research for Northcoast Research Holdings LLC, said in light of his company’s positive Miles Driven Index reading for last November, “and the favorable outlook for gasoline prices, we believe the improvement in the underlying traffic volume trends should continue in December and throughout 2015. If historical relationships hold true, this backdrop should provide a tailwind to the intermediate demand trends across the automotive aftermarket and tire industries.”
Modern Tire Dealer 100 favors Michelin, but...
The three most popular brands among the Modern Tire Dealer 100
list of the top independent tire dealers in the U.S. are Michelin, Goodyear and BFGoodrich, the same three as last year. Michelin is offered by 78.5% of the top 107 (there was a 10-way tie for the 98th spot), while Goodyear and BFGoodrich are sold through 66% of them (71 deal-ers each).
However, Bridgestone, although sold through a fewer number of dealers, was offered in more outlets than any other brand, 4,604 out of 5,630 (see Chart 11).
Of the 17 top brands, 11 had greater store counts than the year before: Mi-chelin, Bridgestone, Continental, Fires-tone, General, Hankook, Uniroyal, Kelly, Falken, Kumho and Nexen.
For the ninth consecutive year, Mi-chelin topped the list of brands sold by the MTD 100. ■
Facts section: Brand share
Chart 10U.S./CANADIAN OE CONSUMER
TIRE MARKET SHARE(excluding imported
vehicles)
Brand 2014 2013
Goodyear 27.8% 26.4%
Michelin 20.6% 22.0%
Bridgestone 12.6% 12.7%
Continental 10.9% 11.1%
Hankook 4.8% 5.0%
Firestone 4.7% 4.8%
BFGoodrich 4.2% 4.4%
Pirelli 3.4% 3.1%
General 2.6% 2.5%
Kumho 2.6% 2.6%
Dunlop 2.0% 2.0%
Nexen 1.4% 1.0%
Toyo 1.3% 1.2%
Yokohama 0.9% 1.0%
Cooper 0.2% 0.2%
Chart 112014 BRANDS LISTED
BY THE MTD 100(Total outlets: 5,630)
Rank by No. of dealers
Dealers/outlets
1. Michelin 84/4,536
2. Goodyear 71/4,277
2. BFGoodrich 71/4,176
4. Bridgestone 67/4,604
5. Continental 62/3,616
6. Firestone 59/3,069
7. Yokohama 54/3,722
8. Cooper 51/3,308
8. General 51/3,176
10. Hankook 45/3,395
11. Dunlop 41/3,495
11. Uniroyal 41/2,923
11. Kelly 41/1,889
14. Pirelli 34/3,724
15. Toyo 32/2,433
16. Falken 30/3,228
16. Kumho 30/2,651
18. Nexen 23/1,658
Chart 122014 CANADIAN REPLACEMENT
CONSUMER TIRE BRAND SHARES
PASSENGER TIRE(based on 16.5 million units)
LIGHT TRUCK TIRE(based on 2.8 million units)
Brand % Brand %
Goodyear 12.5% Goodyear 16.0%
Michelin 12.0% Michelin 11.0%
Motomaster 11.0% BFGoodrich 9.0%
Bridgestone 8.0% Motomaster 9.0%
BFGoodrich 6.0% Bridgestone 8.5%
Hankook 6.0% Firestone 5.5%
Continental 4.5% Yokohama 5.0%
General 4.0% General 4.5%
Toyo 4.0% Hankook 4.0%
Firestone 3.5% Toyo 4.0%
Yokohama 3.5% Continental 3.0%
Cooper 3.0% Uniroyal 3.0%
GT Radial 3.0% Hercules 2.0%
Nexen 3.0% Kumho 2.0%
Uniroyal 2.5% Pirelli 2.0%
Dunlop 2.0% Cooper 1.5%
Hercules 1.5% Dunlop 1.5%
Kumho 1.5% GT Radial 1.0%
Nokian 1.5% Kelly 1.0%
Pirelli 1.0% Multi-Mile 1.0%
Westlake 1.0% Others 5.5%
Others 5.0%Brands must have at least 1% of the market in ship-ment numbers to be listed at 1% in the passenger and/or light truck tire segments.
40

MTD January 2015
Yearly tire capacity, not produc-tion, in North America totaled 308.3 million tires at 56 plants
as of Jan. 1, 2015. That’s up just over one-half percent compared to 2014, when capacity was 306.5 million tires. (The total does not include race or aviation tires.)
In the United States, annual capac-ity increased more than 1%, to 248.5 million units. That was a year-over-year increase of 2.6 million tires. Canadian tire plant capacity decreased 4%, to 26.1 million tires a year. Mexican plant capacity increased 1.1%, to 33.7 million tires annually.
In the next two years, another five plants, all under construction, are expected to come online in North America. Three are consumer tire plants, one is a truck tire plant, and the last is a farm tire facility.
Goodyear Tire & Rubber Co. also announced plans to build a consumer tire plant. The $500 million facility will support demand in North America and Latin America. A site for the plant has yet to be determined, however.
The company says the plant will produce high-value-added tires for the replacement and original equipment markets beginning in the first half of 2017. It will have an initial capacity of close to 6 million tires per year.
1. Kumho Tire U.S.A. Inc. will begin producing tires at its new consumer tire plant in 2016, almost eight years after the groundbreaking ceremony in Macon, Ga. The plant will be dedicated to OE business in North America, says John Hagan, national sales vice president. Replacement tire capacity will be added in 2018.
Facts section: North American plant capacities
Five more
tire plantsby 2017!
Plant location/Year constructed
Non-union ISO1 QS2
Passen-ger
per day:
Light truck per day:
Truck per day:
Others per day: Total
Bridgestone Americas Inc.Aiken County, S.C., 2013 x 0.0 0.0 0.0 0.02 0.02La Vergne, Tenn., 1972 x x 0.0 0.0 6.2 0.0 6.2Warren County, Tenn., 1990 x x 0.0 0.0 9.0 0.0 9.0Bloomington, Ill., 1965 x x 0.0 0.0 0.0 0.29 0.29Des Moines, Iowa, 1945 x x 0.0 0.0 0.0 4.57 4.57Wilson City, N.C., 1974 3 x x x 30.5 3.5 0.0 0.0 34.0Aiken County, S.C., 1999 x x x 20.5 9.2 0.0 0.0 29.7Joliette, Quebec, 1966 x x 9.3 7.2 0.0 0.0 16.5Monterrey, Mexico, 2007 x 8.0 0.0 0.0 0.0 8.0Cuernavaca, Mexico, 1980 x x 11.0 4.4 0.0 0.0 15.4Total: 79.3 24.3 15.2 4.88 123.69
American Industrial Partners (formerly Carlisle Tire & Wheel Co.)Jackson, Tenn., 2009 x 0.0 0.0 0.0 26.0 26.0Clinton, Tenn. (Dico), 1974 x x 0.0 0.0 0.0 15.0 15.0Total: 0.0 0.0 0.0 41.0 41.0
Continental Tire the Americas LLCSumter, S.C., 2013 x 2.9 0.6 0.0 0.0 3.5Mount Vernon, Ill., 1973 x x x 29.0 4.0 6.0 0.0 39.0Total: 31.9 4.6 6.0 0.0 42.5
Cooper Tire & Rubber Co.Findlay, Ohio, 1917 x 7.0 16.0 0.0 0.0 23.0Texarkana, Ark., 1964 x 24.0 8.0 0.0 0.0 32.0Tupelo, Miss., 1984/1960 x x 42.0 0.0 0.0 0.0 42.0Total: 73.0 24.0 0.0 0.0 97.0
Goodyear Tire & Rubber Co.Buffalo, N.Y., 1923 x 4.0 2.5 2.3 5.2 14.0Danville, Va., 1966 x x 0.0 0.0 11.0 2.0 13.0Fayetteville, N.C., 1969 x x 30.5 10.5 0.0 0.0 41.0Gadsden, Ala., 1928 x x 14.5 11.5 0.0 0.0 26.0Lawton, Okla., 1978 x x x 63.0 0.0 0.0 0.0 63.0Topeka, Kan., 1945 x x 0.0 1.5 5.5 0.1 7.1Medicine Hat, Alberta, 1960 x x 0.0 0.0 0.0 12.0 12.0Napanee, Ontario, 1990 x x x 19.0 0.0 0.0 0.0 19.0Total: 131.0 26.0 18.8 19.3 195.1
GTY (General/Yokohama)Mount Vernon, Ill., 1988 x x x 0.0 0.0 3.9 0.0 3.9
Michelin North America Inc.Ardmore, Okla., 1969 x x x 40.5 3.5 0.0 0.0 44.0Dothan, Ala., 1979 x x 1.0 4.0 0.0 0.0 5.0Fort Wayne, Ind., 1961 21.0 9.5 0.0 0.0 30.5Greenville, S.C., 1975 x x 28.0 0.0 0.0 0.0 28.0Greenville, S.C. (C3M), 1997 x x x 7.0 0.0 0.0 0.0 7.0Greenville, S.C. (Tweel), 2014 x 0.0 0.0 0.0 0.07 0.07Lexington, S.C., 1981 x x 19.0 5.0 0.0 0.0 24.0Lexington, S.C., 1998 x x 0.0 0.0 0.0 0.1 0.1Spartanburg, S.C., 1978 x x 0.0 0.0 7.0 0.0 7.0
Chart 132015 NORTH AMERICAN PLANT CAPACITIES (in thousands of units)
44

45www.moderntiredealer.com
2. Hankook Tire America Corp. expects to begin operation of its con-sumer tire plant in Clarksville, Tenn., in 2016. The $800 million facility will have annual production capacity of 12 million tires, which Hankook says will be earmarked “mostly for regional supplies in the North American market.”
3. Giti Tire (USA) Ltd. is building a tire manufacturing plant in Chester County, S.C. The $560 million tire plant will produce passenger and light truck tires for the replacement and original equipment markets.
“The first phase of production capacity is expected to be 5 million tires annually,” says Tom McNamara, executive vice president of sales and marketing. “Giti Tire plans to further increase production capacity in response to future market demand and conditions.”
4. Trelleborg Wheel Systems Ameri-cas Inc. will build a $50 million radial agricultural tire plant in Spartanburg, S.C. Production is expected to commence by the end of this year.
The manufacturing facility will be located at Trelleborg’s existing premises in Spartanburg.
“Although we already sell our products in the U.S. and Canada, local produc-tion offers considerably more favor-able conditions, thus enhancing our competitiveness,” says Maurizio Vischi, Trelleborg’s business area president.
Being located in Spartanburg will help the company capitalize on “existing partnership agreements with major original equipment manufacturers and distributors,” he adds.
The 430,000-square-foot plant is expected to be at full capacity by 2018, Trelleborg Wheel Systems closed its industrial tire plant in Hartville, Ohio, in September 2009.
5. Yokohama Tire Corp. will be building truck tires at its West Point, Miss., plant by the fourth quarter of this year. Eventually, the plant will have annual capacity of 1 million tires.
The $300 million facility is being built on 500 acres. The company says plant expansions could quadruple the initial investment.
Yokohama Tire Manufacturing Vir-ginia LLC, which oversees the company’s Salem, Va., consumer tire plant, signed a new four-year contract with the United Steelworkers last June. ■
Plant location/Year constructed
Non-union ISO1 QS2
Passen-ger
per day:
Light truck per day:
Truck per day:
Others per day: Total
Starr, S.C., 2013 x 0.0 0.0 0.0 0.01 0.01Tuscaloosa, Ala., 1945 x 23.0 7.0 0.0 0.0 30.0Bridgewater, Nova Scotia, Canada, 1973 x x 11.0 3.0 0.0 0.0 14.0New Glasgow, Nova Scotia, 1971 x x 4.0 1.0 0.0 0.0 5.0Waterville, Nova Scotia, 1982 x x 0.0 0.0 0.0 5.0 5.0Queretaro, Mexico x 6.0 0.0 0.0 0.0 6.0Total: 160.5 33.0 7.0 5.18 205.68
Mitas Tires North America Inc.Charles City, Iowa, 2012 0.0 0.0 0.0 0.5 0.5
Pirelli Tire North America Inc.Rome, Ga., (MIRS), 2002 x x 1.2 0.5 0.0 0.0 1.7Guanajuato, Mexico, 2011 x 3.8 1.2 0.0 0.0 5.0Total: 5.0 1.7 0.0 0.0 6.7
Specialty Tires of America Inc.Indiana, Pa., 1915 x 0.0 0.4 0.0 4.6 5.0Unicoi, Tenn., 1997 x 0.0 0.0 0.0 1.6 1.6Total: 0.0 0.4 0.0 6.2 6.6
Titan Tire Corp.Bryan, Ohio, 1967 x x 0.0 0.0 0.0 0.33 0.33Des Moines, Iowa, 1943 x 0.0 0.0 0.0 11.25 11.25Freeport, Ill., 1964 x x 0.0 0.0 0.0 8.1 8.1Total: 0.0 0.0 0.0 19.68 19.68
Toyo Tire North America Manufacturing Inc.White, Ga., 2005 x x 8.3 8.3 0.0 0.0 16.6
Yokohama Tire Corp.Salem, Va., 1968 4 25.7 1.1 0.0 0.0 26.8
Grupo Carso/Euzkadi (Continental AG)San Luis Potosi, Mexico 15.0 5.0 0.0 0.0 20.0
JK Tyre & Industries (formerly CIA Hulera Tornel)Mexico City, Mexico 0.5 1.0 1.5 0.64 3.64Tultitlan, Mexico 7.0 1.5 0.5 0.4 9.4Tacuba, Mexico 2.5 2.5 0.0 0.0 5.0Total: 10.0 5.0 2.0 1.04 18.04
Corporacion de Occidente SA de CV (Cooper Tire)Guadalajara, Mexico, 2005 x x x 10.0 7.2 2.8 0.0 20.0
U.S. Totals 443.6 106.6 50.9 79.74 680.84Canadian Totals 43.3 11.2 0.0 17.0 71.5Mexican Totals 63.8 22.8 4.8 1.04 92.44TOTAL: 550.7 140.6 55.7 97.78 844.782015 vs. 2014 +0.4% +1.1% 0.0% 0.0% +0.6%Footnotes: 1 Plants that are ISO (International Organization for Standardization) 9001:2000 certified (www. iso.org). 2 QS (Quality System) 9000 certification, required by suppliers to Ford Motor Co., General Motors Corp. and Fiat Chrysler Automobiles US LLC (www.qscertification.com).3 ISO 50001 (Industrial Energy Management Systems). 4 ISO 14001 (Environment Management Systems).

MTD January 2015
To domestic truck tire dealers, 2014 will go down as a banner year. Replacement truck tire demand increased significantly compared to 2013. Shipments were up
10.2%, from 15.7 million units to 17.3 million. Retreaded truck tires grew nearly 5%, from 14.9 million units to 15.6 million (see Chart 16).
The segments combined for 32.9 million tires worth $10.3 billion in replacement sales.
Tire manufacturers not only enjoyed the increase in replace-ment sales, but also benefited from a 16% increase in OE sales.
According to the Auto Care Association, medium and heavy-duty replacement sales, which include tires, parts, ac-
cessories, non-warranty service repair and maintenance for Class 4 through Class 8 trucks, have grown 19.5% since 2009. Of the estimated $81.3 billion market, medium and wide-base truck tires accounted for $4.7 billion.
Average new and retreaded truck tire prices were down substantially in 2014 compared to 2013 mainly due to lower raw material costs:
Tire segment 2014 2013 2012New truck $381.50 $401.27 $425.00Retreaded truck $237.48 $250.24 $228.24
Total medium and heavy truck sales neared 400,000 units for the year, up 12%. The Auto Care Association projects truck part and maintenance sales will continue to rise steadily, reaching $90.4 billion in 2017.
Adding to the good news is a positive forecast from the American Trucking Associations, which predicts 11.6 billion tons of goods will be carried by trucks in 2019.
Facts section: Commercial
Double digit growth!New truck tires were in demand at the
replacement and OE levels last year
Chart 142014 U.S. MARKET SHARE, RETREADED TRUCK TIRES
(based on 15.6 million units)
Bridgestone (Bandag) 42.0%
Goodyear 25.0%
Michelin 23.5%
Marangoni 5.0%
Others 4.5%
Chart 162014 TRUCK TIRE REPLACEMENT MARKET BREAKDOWN
(Before 2009, the number of retreaded truck tires pro-duced last topped new truck tire shipments in 2004.)
10
15
20 Retreaded
New
201420132012201120102009In 2014, the average price of a retreaded truck tire was $237.48.The average price of a new tire was $381.50.
Chart 152014 U.S. REPLACEMENT MEDIUM/HEAVY
TRUCK TIRE BRAND SHARES(based on 17.3 million units)
Michelin 18.0%
Bridgestone 17.5%
Goodyear 12.5%
Yokohama 10.0%
Firestone 8.0%
Continental 5.0%
Double Coin 4.0%
General 3.0%
Hankook 3.0%
Hercules 3.0%
Toyo 2.5%
BFGoodrich 2.0%
Dunlop 2.0%
Dynatrac 2.0%
Sailun 2.0%
Gladiator 1.0%
Kelly 1.0%
Kumho 1.0%
Roadmaster 1.0%
Sumitomo 1.0%
Others 3.0%
46

MTD January 2015
Farm and OTR tire marketsCompared to 2013, the replacement farm tire market was
down a little and the replacement OTR tire market was up a little. But both suffered greatly at the OE level.
Radial rear OE farm tire shipments were down more than 17%, from 380,000 units to 315,000. Bias rear OE tire ship-ments decreased 1.4%, while small farm OE tire shipments remained flat.
At the replacement level, radial rear shipments were up slightly, while bias rear and small farm remained unchanged.
With its Goodyear and Titan brands, Titan International Inc. is the rear OE farm tire leader with a 46.8% share of the market (see Chart 18). It also owns a 52% share of the small farm OE market (see Chart 17).
The rear replacement farm tire market share leader is BKT Tires USA Inc.. The BKT brand has a 40% share of the bias seg-ment and a 20% share of the radial segment. The Firestone brand is second overall (see Chart 19).
Scott Sloan, Titan’s product engineering manager, expects the farm tire market to start slowly in 2015. “A late har-vest along with the inclement weather (last) fall has pushed producers’ projects back a few months.”
However, the extremely wet conditions resulted in a “tremendous” increase in the demand for wide flotation tires, he adds.
As for OTR tires, Tim Easter, director of OTR tire sales for Yokohama Tire Corp., believes OE shipments were down more than expected following 2013, when the overall market “bot-tomed out.” He says growth in both overall shipments and OTR tire radialization is expected to be marginal over the next three years.
At least the replacement OTR tire market didn’t decrease. Easter says six size categories represented approxi-mately 80% of all replacement units sold in 2013; 65.3% of the units were radial.
Top six replacement OTR tire size categories in 2013
1. 24-inch bias (11.6%) 4. 25-inch radial (29.3%)2. 24-inch radial (10.0%) 5. 49-inch radial (4.0%) 3. 25-inch bias (16.3%) 6. > 51-inch radial (9.3%)
In 2013, OTR tire unit sales were down 21% compared to 2012, partially due to challenges in the coal mining segment, said Easter.
Michelle Lane, director of OTR marketing for Bridgestone Commercial Solutions, says the North American mining tire market has been impacted by the ongoing slowdown in global mining operations. “Coal, especially eastern coal, has been negatively impacted over the last couple of years, a trend likely to continue in the near term.” ■
Facts section: Commercial
Chart 182014 U.S. OE REAR FARM
TIRE MARKET SHARE(660,000 radial and
bias units)
Firestone 41.7%
Goodyear 26.7%
Titan 20.1%
Other 11.5%Titan Tire Corp. produces both the Titan and Goodyear brands at its three plants.
Chart 172014 U.S. OE FARM TIRE
MARKET SHARE
REAR RADIAL (315,000 units)
Firestone 43.5%
Goodyear 34.0%
Michelin 12.5%
Titan 5.0%
BKT 2.0%
Trelleborg 2.0%
Others 1.0%
REAR BIAS (345,000 units)
Firestone 40.0%
Titan 34.0%
Goodyear 20.0%
Alliance 4.0%
Trelleborg 1.0%
Others 1.0%
SMALL FARM (469,000 units)
Goodyear 32.0%
Titan 20.0%
Firestone 18.0%
Carlisle 10.0%
Alliance 6.5%
BKT 6.5%
American Farmer 3.0%
Trelleborg 1.5%
Others 2.5%
Chart 20SMALL FARM TIRE MARKET SHARE, 2014
Total shipments: 1.25 million
Chart 19REAR FARM TIRE MARKET SHARE, 2014
Total bias and radial shipments: 782,000
0
5
10
15
20
25
30
35
Other 7
.7%
Trelleborg
2.7%
Alliance
6.0%
Michelin
6.6%
Titan 8.0%
Goodyear 10.2%
Firesto
ne 26.8%BKT 32.0%
0
5
10
15
20
25
Other 3
.0%
Trelleborg
2.5%
American Fa
rmer 3
.0%
Harvest King 4.0%
Akuret 4.0%
Carlisle 10.0%
BKT 16.5%
Titan 17.0%
Goodyear 18.0%
Firesto
ne 22.0%
0
5
10
15
20
25
30
35
Other 7
.7%
Trelleborg
2.7%
Alliance
6.0%
Michelin
6.6%
Titan 8.0%
Goodyear 10.2%
Firesto
ne 26.8%BKT 32.0%
0
5
10
15
20
25
Other 3
.0%
Trelleborg
2.5%
American Fa
rmer 3
.0%
Harvest King 4.0%
Akuret 4.0%
Carlisle 10.0%
BKT 16.5%
Titan 17.0%
Goodyear 18.0%
Firesto
ne 22.0%
48

MTD January 2015
There are more than 550 consumer tire sizes available in the aftermarket, according to the Tire & Rim Associa-tion, too many to seriously consider stocking. If you
were building an inventory from scratch, however, stocking the two most popular sizes would be a good place to start.
The top two replacement passenger tire sizes in 2014 were hardly surprises: 205/55R16 and 215/60R16. Other top sizes (P-metric and metric combined) included the following:
195/65R15 225/50R17 235/70R16 225/60R16 215/70R15 215/55R17 205/65R15 265/70R17 215/65R16 195/60R15 235/70R16 225/65R17
One of the sizes to look for in the near future is the 235/50R18, which has been OE on the hot-selling Ford Escape.
The top-selling P-metric light truck tire sizes were 265/70R17, 235/75R15, 235/70R16 and 245/65R17. LT245/75R16 has been the number one replacement LT size for the last six years; it also was the top OE LT size from 1993-2010. (See Chart 21 for the most popular OE LT sizes from 2011-2013).
Major brand versus low-cost radial pricingThe average advertised price for the 215/55R17 tire is
$138.27, broken down as follows: $144.53 for a major brand, and $98.24 for a low-cost radial (see Chart 24 on page 53 for benchmark pricing). Overall, the price differential between the two is nearly 50%.
Advertised prices for higher cost major brands and low-cost radial LT tires are closer. The percentage difference ranges from 15.1% for the LT245/75R17 to 24.9% for the LT245/75R16.
The split is similar when speed rating is taken into account, at least for the H- and V-rated tires.
Tire Intelligence LLC, which tracks 540,000 tire prices on a daily basis in seven countries and has a database of 400 million prices, broke down the domestic 215/55R17 price structure from T- through V-rated tires.
Advertised pricing breakdown, 215/55R17Speed Major LCR Difference OverallV-rated $148.26 $97.33 52.3% $140.97H-rated $147.10 $102.16 44.0% $143.95T-rated $138.21 $123.96 11.5% $137.08
According to a recent Modern Tire Dealer survey of indepen-dent retail and wholesale tire dealers, the average profit margin on a passenger tire is 26.4%. For a light truck tire it falls to 24%. The average wholesale passenger tire sales margin is 12.4%.
Car dealerships vs. quick lubes
Quick lubes accounted for 34% of the installed lubricant business, based on volume, in 2002. According to Kline & Co. Inc. research, full synthetic motor oil accounted for an average of 12% of all oil used at quick lubes, while synthetic
Facts section: Tire sizing and pricing
Start with 205/55R16Then worry about the the other 500-plus sizes
Chart 22TOP U.S. PASSENGER TIRE SIZES, 2013
Replacement (Top 10 = 22.5%)
1. 205/55R16 6. 195/65R15
2. 215/60R16 7. P215/60R16
3. 225/60R16 8. 195/60R15
4. P235/75R15 9. 215/65R16
5. P265/70R17 10. P225/60R16
Chart 23TOP U.S. LIGHT TRUCK TIRE SIZES, 2013
Replacement (Top 10 = 68.9%)
1. LT245/75R16 6. LT285/75R16
2. LT265/75R16 7. LT245/75R17
3. LT265/70R17 8. 31x10.50R15
4. LT225/75R16 9. LT215/85R16
5. LT235/85R16 10. LT285/70R17Source for Charts 21-23: Rubber Manufacturers Association
Chart 21MOST POPULAR DOMESTIC OE PASSENGER AND LT TIRE SIZES
2013 OE P-metric/metric
Size % of total
P215/55R17 6.1%
P265/70R17 4.0%
P275/55R20 3.2%
P275/65R18 3.1%
P215/60R16 3.1%
2012 OE P-metric/metric
Size % of total
P215/55R17 6.1%
P265/70R17 4.4%
P215/60R16 3.8%
P275/65R18 3.4%
P205/65R16 3.1%
2011 OE P-metric/metric
Size % of total
P215/60R16 9.1%
P265/70R17 5.1%
P215/55R17 4.2%
P235/70R16 3.2%
P275/65R18 3.0%
2013 OE light truck (LT)
Size % of total
LT245/75R17 21.9%
LT245/75R16 14.0%
LT225/75R16 11.3%
LT265/70R17 8.9%
LT265/75R18 8.1%
2012 OE light truck (LT)
Size % of total
LT245/75R17 22.1%
LT245/75R16 14.7%
LT225/75R16 11.1%
LT265/70R18 8.1%
LT265/70R17 7.7%
2011 OE light truck (LT)
Size % of total
LT245/75R17 22.3%
LT245/75R16 15.6%
LT225/75R16 11.9%
LT265/70R17 7.8%
LT265/70R18 7.0%
52

53www.moderntiredealer.com
blends averaged nearly 7% of total volume. Conventional oil accounted for the rest.
In 2013, quick lubes accounted for an estimated 36% of the total U.S. installed market. However, Kline & Co. expects that percentage to decline to 35% by 2018, while car dealerships increase their share of the market from 29% to 30%.
Full synthetic motor oil usage in quick lubes increased to 20% in 2013 and will continue to trend upward, reaching 22% in 2018.
Kline & Co. predicts semi-synthetic oil usage, which dropped to 5% in 2013, will plateau there.
The makeup of oil usage in car dealerships relies more heavily on semi-synthetic oil. In four years, it will represent 15% of the volume used at new car dealerships, while full synthetic oil will account for 25% of the volume.
The average advertised price of a conventional oil change dropped 5% to $20.47 in 2014 (see Chart 25). ■
Chart 242014 AVERAGE ADVERTISED TIRE PRICES
(in the U.S.)
Size Major brand Low-cost Overall
205/55R16 $126.70 $90.71 $122.24
215/55R17 $144.53 $98.24 $138.27
215/60R16 $119.13 $86.79 $114.09
235/75R15 $117.15 $91.60 $112.99
275/65R18 $210.29 $172.90 $206.68
LT225/75R16 $173.66 $142.66 $169.33
LT245/75R16 $188.04 $150.57 $184.22
LT245/75R17 $203.43 $176.76 $200.72
31x10.50R15 $167.72 $138.25 $163.48Source: Tire Intelligence LLC, www.tire-intelligence.com
Chart 252014 AVERAGE ADVERTISED OIL CHANGE PRICING
(in the U.S.)
0
$5
$10
$15
$20
$25
2014 2013 2009201020112012
Quik-Link: 800-687-1557 ext. 11126

MTD January 2015
There are between 29,000 and 30,000 independent tire dealers in the U.S. in any given year. Whether store owners or store managers, they deal with men and
women tire buyers on a daily basis. And most of the time, the primary decision maker, the person who decides which tires to buy and where to buy them, is, contrary to popular belief, male.
Recent research by BrightLine Marketing LLC sheds a new light on the tire-buying process. According to a survey of tens of thousands of men and women, when it comes to buying tires, men are the primary decision makers 61% of the time.
“One of my primary goals as a market researcher is to make sure my survey is ‘representative,’” says BrightLine Marketing owner Randy Ladd. “One of the ways I do this is to invite an equal number of male and female respondents to take my survey.”
Determining the tire decision makers is the key to his survey. “This may not necessarily be the person who calls on the phone, the person who drops off the car or the person who hands you their credit card. But it is the person who decided where to buy.”
The percentages vary depending on the city, but not enough to change the results. In Chart 28, the cities chosen were based on extremes: the percentages in San Diego and Sacramento were the closest spread, while Houston and New York were
the two with the greatest discrepancies. “The range is a little over 10% from the lowest market to the highest,” says Ladd.
None of the results indicate a trend at this point. “Don’t get me wrong, I am not arguing that tire retailers
should focus on men as decision makers,” he says. “Women represent 40% of decision makers in my survey, and most retailers who ignore 40% of the market will have a tough time staying afloat. I am simply suggesting that tire decision makers may not be 50%-50%.”
Distribution channel trendsWarehouse clubs and auto dealerships gained market share
at the expense of mass merchandisers in 2014 (see Chart 26). Steady growth in the number of outlets in both distribution channels is the partial key to their success.
Warehouse clubs have increased their number of outlets 7.7% since 2011. Franchised new car dealerships are slowly building up their numbers again following the recession, and that is in addition to the more than 700 (and counting) Ford Motor Co. Quick Lane locations.
The problems of Sears Holdings Corp. and its Sears Auto Centers factors into its reversal of fortune. At one time, Sears sold close to 20 million tires a year; that total dropped to 3.2 million last year.
Independent tire dealers remain the dominant force in the tire industry (see Charts 26-27), led by the top tire dealer in the country, Discount Tire. With close to 900 outlets and Discount Tire Direct, the company sold 28 million tires last year. The average Discount Tire store sells more than 80 tires a day. ■
Facts section: Retailing and wholesaling
Gender bendingSurprise! When it comes to buying tires,
women are not the dominant sex
Chart 27CONSUMER TIRE DISTRIBUTION CHANNEL
MARKET SHARE
Initial channel 2014 2012 2010 2008
Independenttire dealers
77.0% 77.0% 76.0% 75.0%
Tire companystores
8.0% 8.0% 8.0% 8.5%
Miscellaneous* 15.0% 15.0% 16.0% 16.5%* Miscellaneous includes mass merchandisers, warehouse clubs, car dealers, auto parts chains, muffler shops and oil com-panies/service stations.
Chart 26U.S. CONSUMER TIRE RETAIL MARKET SHARE
(based on retail sales)
Distribution channel 2014 2013
Independent tire dealers 60.5% 60.5%
Mass merchandisers 13.0% 14.0%
Warehouse clubs 9.0% 8.5%
Auto dealerships 8.0% 7.5%
Tire company-owned stores 7.5% 7.5%
Miscellaneous outlets 2.0% 2.0%
0
20
40
60
80
100% Male
52% 52%63% 64%
36%37%48%48%
% Female
New YorkHoustonSacramentoSan Diego
Chart 282014 TIRE-BUYING DECISIONS BASED ON GENDER
Source: BrightLine Marketing, (330) 239-1006
54

MTD January 2015
When the Chinese consumer tire tariffs are fully implemented, everyone in the industry will adapt accordingly. They will have to: The tariffs will be
in place for a minimum of five years, and historical precedent makes 10 years a real possibility. They may even become permanent.
Tariffs are a given in 2015. What else can we expect to see that will affect the industry in general and independent tire dealers in particular? Here are three more concerns that may become commonplace in the near future. At the very least, they will be topics of discussion.
1. Truck tire tariffs? Consumer tire shipments from China were up 86% from 2012 to 2014. Over that same period, truck tire shipments from the same country increased 30%; in addition, they represent a greater percentage of their market (35.5%) than Chinese consumer tire imports do (25.7%).
Truck tire pricing is a concern among retreaders. In 2014, the average price differential between a new and retreaded truck tire was a healthy 46.5%. Unfortunately, some low-cost imports skewed the average.
According to Bob Majewski, owner of Sumerel Tire Service Inc. in Newport, Ky., truck tires from China are almost meet-ing retread prices on a cap and casing. He said a low profile 295/75R22.5 import is selling for $178 ($150 plus the Federal Excise Tax) “and they are getting lower. A cap and a casing is more than that. They need a tariff on it.”
Nick Mitchell, senior vice president of research for Northcoast Research Holdings, believes a tariff is a possibility.
“The ITC (International Trade Commission) voted unani-mously in early 2014 to retain the antidumping and counter-vailing duties that were levied against Chinese off-the-road tires in response to a 2008 judgment, despite the fact that Chinese manufacturers are pressing forward with efforts to fight the ruling.
“The odds look good that similar measures will be finalized
against passenger and light truck tires imported from China. “As such, I would not be surprised if the next area of focus is on the TBR tire market. China has the ability to produce nearly 120 million radial truck tires, so it is clearly a force that needs to be monitored.”
When asked if the United Steelworkers (USW) union is looking at petitioning for the implementation of any other tariffs on imported tires, such as on medium truck tires from China, Wayne Ranick, director of communications for USW International, said the union “will not rule anything out. We are always exploring opportunities to pursue trade cases where U.S. jobs are threatened and the security of families is put at risk by unfair trade.”
2. Private equity influence. What do American Tire Distributors Inc., Dealer Tire LLC, BJ’s Wholesale Club Inc. and Titan International Inc. have in common? Private equity firms have a significant stake in all of them. That trend will
continue, based on the steady performance of the tire industry through economic ups and downs.
The influx of cash from private equity firms can change the landscape quickly. Thanks to backing from TPG Capital LP (Tarrant Capital IP LLC), ATD purchased Hercules Tire Holdings LLC and Terry’s Tire Town Holdings Inc. for $655 million.
In 2014, MHR Fund Management LLC made a major move on Titan, increasing the private equity shareholder’s influence over the company. On its website, MHR says it seeks to “exert control or significant influence on its portfolio companies.”
Dealer Tire already has had two investment partners. The minority stake owned by the first, TA Associates, was purchased by the second, Lindsay Goldberg LLC, late last year.
Carlisle Transportation Products was sold to American Industrial Partners. Wheel Pros LLC was acquired by Audax Group Inc. from Platinum Equity LLC.
Most recently, Raben Holdings LLC, which does business as Raben Tire Co. Inc., sold an equity interest to Palladium Equity Partners LLC. President Tom Raben said Palladium “shares our vision of expanding the Raben Tire footprint within our existing markets and into adjacent markets across the U.S.”
3. Eco-friendly tires. Corporate Average Fuel Economy (CAFE) standards setting a 49.6 mpg average fuel-efficiency goal for 2025 almost necessitate eco-friendly or low rolling resistance tires at OE. The aftermarket is a different story, however.
According to Modern Tire Dealer’s 2014 Eco Tire Survey, tire dealers say 7% of their customers ask for environmentally friendly tires. The highest request ratio is, not surprisingly, for hybrid vehicles, followed by sedan owners and electric vehicle owners. When asked if consumers were willing to pay more for eco tires, 61% of the dealers responding to the survey said “no.” ■
Facts section: Future shock
Look for... more tariffs?You never know. The same goes for the fascination
private equity firms have with our industry
Chart 29NEW P-METRIC AND LT TIRE SIZES/SKUS IN 2015
P275/35R15 SL P305/55R20 XL P315/30R20 SL
P235/45R17 XL P245/40R18 XL LT205/70R15 LRC
LT215/65R16 LRD LT255/55R18 LRD LT235/65R17 LRD
LT255/65R17 LRD LT255/65R18 LRE LT375/45R22
LT355/40R22 LT375/40R24 LRF LT225/70R17 LRE
LT265/65R18 LRD LT285/60R18 LRD LT315/70R17 LRC
37x12.50R22LT LRE 35x13.50R20LT LRE 38x13.50R20LT LRESource: Tire & Rim Association
56