feasibility study of economics and performance of … · printed on paper containing at least 50%...
TRANSCRIPT

Feasibility Study of Economics and Performance of Solar Photovoltaics at the Atlas Industrial Park in Duluth Minnesota A Study Prepared in Partnership with the Environmental Protection Agency for the RE-Powering Americarsquos Land Initiative Siting Renewable Energy on Potentially Contaminated Land and Mine Sites Matthew Steen Lars Lisell and Gail Mosey
Produced under direction of the Environmental Protection Agency (EPA) by the National Renewable Energy Laboratory (NREL) under Interagency Agreement IAG-08-0719 and Task No WFD31002
NREL is a national laboratory of the US Department of Energy Office of Energy Efficiency amp Renewable Energy operated by the Alliance for Sustainable Energy LLC
Technical Report NRELTP-7A40-56772 January 2013 Contract No DE-AC36-08GO28308
National Renewable Energy Laboratory 15013 Denver West Parkway Golden CO 80401 303-275-3000 bull wwwnrelgov
Feasibility Study of Economics and Performance of Solar Photovoltaics at the Atlas Industrial Park in Duluth Minnesota A Study Prepared in Partnership with the Environmental Protection Agency for the RE-Powering Americarsquos Land Initiative Siting Renewable Energy on Potentially Contaminated Land and Mine Sites Matthew Steen Lars Lisell and Gail Mosey Prepared under Task No WFD31002
NREL is a national laboratory of the US Department of Energy Office of Energy Efficiency amp Renewable Energy operated by the Alliance for Sustainable Energy LLC
Technical Report NRELTP-7A40-56772 January 2013 Contract No DE-AC36-08GO28308
NOTICE
This manuscript has been authored by employees of the Alliance for Sustainable Energy LLC (ldquoAlliancerdquo) under Contract No DE-AC36-08GO28308 with the US Department of Energy (ldquoDOErdquo)
This report was prepared as an account of work sponsored by an agency of the United States government Neither the United States government nor any agency thereof nor any of their employees makes any warranty express or implied or assumes any legal liability or responsibility for the accuracy completeness or usefulness of any information apparatus product or process disclosed or represents that its use would not infringe privately owned rights Reference herein to any specific commercial product process or service by trade name trademark manufacturer or otherwise does not necessarily constitute or imply its endorsement recommendation or favoring by the United States government or any agency thereof The views and opinions of authors expressed herein do not necessarily state or reflect those of the United States government or any agency thereof
Cover Photos (left to right) PIX 16416 PIX 17423 PIX 16560 PIX 17613 PIX 17436 PIX 17721
Printed on paper containing at least 50 wastepaper including 10 post consumer waste
Acknowledgments The National Renewable Energy Laboratory (NREL) thanks the US Environmental Protection Agency (EPA) for its interest in securing NRELrsquos technical expertise In particular NREL and the assessment team for this project are grateful to Heidi Timm-Bijold Pakou Ly and Mayor Don Ness of the City of Duluth for all of their help setting up site visits and meetings and for the time they spent supporting this project The team would also like to thank Gary Schafer Rosita Clarke Shea Jones Lura Matthews and Jessica Trice of EPA and Katie Brown AAAS Science amp Technology Policy fellow hosted by the US EPA for supporting the study Additionally the team would like to thank Carol Andrews of Barr Engineering and Bill Sawyer of Minnesota Power for their generous assistance and cooperation
iii
List of Acronyms AC alternating current a-Si amorphous silicon BOS balance of system CBI capacity-based incentive CREB clean renewable energy bond DC direct current DEDA Duluth Economic Development Authority EPA US Environmental Protection Agency FTE full-time equivalent JEDI Jobs and Economic Development Impact kW kilowatt kWh kilowatt-hour kV kilovolt LCOE levelized cost of energy MP Minnesota Power M-RETS Midwest Renewable Energy Tracking System MW megawatt MWh megawatt-hour NREL National Renewable Energy Laboratory OampM operations and maintenance PAH polyaromatic hydrocarbons PBI production-based incentive PCB polychlorinated biphenyls PPA power purchase agreement PV photovoltaic QCEB qualified conservation energy bond REC renewable energy certificate RES renewable energy standard SAM System Advisor Model SPE special purpose entity SSA Solar Services Agreement UAC Universal Atlas Cement Company VNM virtual net metering W watt
iv
Executive Summary The US Environmental Protection Agency (EPA) Region 5 in accordance with the RE-Powering Americarsquos Land initiative selected the Atlas Industrial Park in Duluth Minnesota for a feasibility study of renewable energy production Under the RE-Powering Americarsquos Land initiative the EPA provided funding to the National Renewable Energy Laboratory (NREL) to support a feasibility study of solar renewable energy generation at the Atlas Industrial Park NREL provided technical assistance for this project but did not assess environmental conditions at the site beyond those related to the performance of a photovoltaic (PV) system The purpose of this study is to assess the site for a possible PV installation and estimate the cost performance and site impacts of different PV configurations In addition the study evaluates financing options that could assist in the implementation of a PV system at the site
The feasibility of a PV project depends greatly on both site-specific and economic factors Site-specific factors include the available area for an array solar resource distance to transmission lines and distance to major roads In addition the operating status ground conditions and restrictions associated with redevelopment of contaminated sites impact the feasibility of a PV system Economic factors include purchase price of the electricity produced power purchase agreement (PPA) price and retail electric rates along with federal state and utility incentives for PV systems
The Atlas Industrial Park is a 62-acre brownfield site currently undergoing remediation and redevelopment The Duluth Economic Development Authority (DEDA) which owns the property is considering a 2-acre parcel for a PV installation as part of its redevelopment plan Based on an assessment of the site conditions the Atlas Industrial Park is suitable for deployment of a large- or small-scale PV system however the economics specific to the area currently limit the financial viability of a PV installation Table ES-1 summarizes the performance and economics of the different PV systems and the developmentfinancing options evaluated in this study The table shows the annual energy output the levelized cost of energy (LCOE) and the PPA price along with the payback period and cost of each system
v
Table ES-1 Atlas Industrial Park PV System Summary
PV System Type System Scale System Sizea Array Tilt Annual Output Number of Houses
Poweredb
(kW) (deg) (kWhyear)
Crystalline Silicon (Fixed Tilt) Commercial 348 200 423073 38
Crystalline Silicon (Fixed Tilt) Residential 10 200 12157 11
Crystalline Silicon (Fixed Tilt) Residential 8 200 9726 09
Development Scenario System Scale - Size System Cost LCOE Real LCOE Nominal Payback Period ($kWh) ($kWh) or PPA Price
DEDA Purchase Commercial - 348 kW 2014920 $ 034 044 gt25 years
Private Purchase Commercial - 348 kW 2014920 $ 015 019 gt25 years
Private Purchase with PPA Commercial - 348 kW 2014920 $ 031 040 $031kWh
DEDA Purchase Residential - 8 kW 58880 $ 030 039 gt25 years
Private Purchase Residential - 10 kW 73600 $ 013 016 gt25 years
a Data assume a maximum usable area of 2 acres
Number of average American households that could hypothetically be powered by the PV system assuming 11040 b
kWhyearhousehold
As indicated in Table ES-1 each system configuration is expected to have an LCOE significantly greater than $005kWh the average commercial electricity rate in Duluth These results include the current cost of energy expected installation cost site solar resource and existing incentives for a PV system The economic feasibility of a PV installation at the Atlas Industrial Park is primarily limited by lower-than-average electricity rates but also by available incentives that are based on system capacity and have a relatively low cap of $20000 The current incentive structure favors smaller residential-scale systems reflected in a lower LCOE however the feasibility of these systems is constrained by higher module costs resulting from reduced economies of scale The most cost-competitive scenario is for a privately owned system without a PPA This scenario represents a PV configuration designed to offset on-site energy use whereas the purpose of a PPA is to sell energy to another entity
If DEDA wishes to further pursue a PV installation at the Atlas Industrial Park development options different from the ones evaluated in this study should be explored A public-private partnership between DEDA and Minnesota Power an energy services company or a currentfuture site developer to create a demonstration project could be one way to successfully implement a PV project at the site The results of this study indicate that a privately owned residential-scale PV installation such as a rooftop system for future site-occupying businesses is currently the lowest-cost option for the Atlas Industrial Park however further increases in electric rates combined with decreases in module costs and changes to incentive structures could make a PV system at the site cost-competitive in the future
vi
Table of Contents 1 Study and Site Background 1 2 Development of a PV System on Brownfields 3 3 PV Systems5
31 PV Overview 5 32 Major System Components 6
321 PV Module 6 322 Inverter 8 323 Balance-of-System Components 9 324 Operation and Maintenance11
33 Siting Considerations 11 4 Proposed Installation Location Information 12
41 Atlas Industrial Park PV System12 42 Utility-Resource Considerations 17 43 PV Site Solar Resource 18 44 Atlas Industrial Park Energy Usage 18
441 Net Metering 18 442 Virtual Net Metering 19
5 Economics and Performance 20 51 Assumptions and Input Data for Analysis20 52 SAM Forecasted Economic Performance 23 53 Job Analysis and Impact26 54 Financing Opportunities 27
541 Owner and Operator Financing 27 542 Third-Party Developers with Power Purchase Agreements 28 543 Third-Party ldquoFliprdquo Agreements 28 544 Hybrid Financial Structures28 545 Solar Services Agreement and Operating Lease 29 546 SaleLeaseback 29 547 Community Solar GardensSolar29
6 Conclusions and Recommendations31 Appendix A Solar Access Measurements33 Appendix B Results from PVWatts 34 Appendix C Results of the SAM Analysis37 Appendix D Results of the JEDI Model 39
vii
List of Figures Figure 1 Generation of electricity from a PV cell5 Figure 2 Ground-mounted array diagram 6 Figure 3 Mono- and multi-crystalline solar panels 7 Figure 4 Thin-film solar panels installed on a solar energy cover (left) and fixed-tilt
mounting system (middleright)7 Figure 5 String inverter9 Figure 6 Aerial view of the feasible area for PV at the Atlas Industrial Park 13 Figure 7 Aerial view of the 2-acre silo site for PV at the Atlas Industrial Park 14 Figure 8 Northwest view of the Atlas Industrial Park 15 Figure 9 East view of the Atlas Industrial Park 15 Figure 10 Southeast view of the Atlas Industrial Park 16 Figure 11 West view (near silo site) of the Atlas Industrial Park16 Figure 12 Potential electrical tie-in point for the PV system at the Atlas Industrial Park
showing the IKONICS building and meter in the background17 Figure 13 Solar market insight Q1 2012 national weighted average system prices 21 Figure 14 Optimal system size for a DEDA-purchased residential-scale system 25 Figure 15 Optimal system size for a privately purchased residential-scale system25 Figure A-1 Solar access measurements for the Atlas Industrial Park PV site 33 Figure C-1 Module cost versus real levelized cost of energy for grid parity 38
List of Tables Table ES-1 Atlas Industrial Park PV System Summary vi Table 1 Energy Density by Panel and System10 Table 2 Performance Results for 1-kW PV Systems in Duluth Minnesota18 Table 3 Installed Fixed-Tilt System Cost Assumptions 21 Table 4 Minnesota Powerrsquos 2012 SolarSense Program Incentive Levels 22 Table 5 SAM Inputs and Assumptions 23 Table 6 Atlas Industrial Park PV System Summary24 Table 7 Predicted Real Module Cost for Grid Parity ($005kWh) 26 Table 8 JEDI Analysis Assumptions 26 Table 9 JEDI Summary Results27 Table 10 Predicted Real Levelized Cost of Energy Using a Performance-Based Incentive
in Duluth 31 Table B-1 PVWatts Inputs 34 Table B-2 Performance Results for a 20-Degree Tilt System 34 Table B-3 Performance Results for a Tilt = Latitude (468deg) Fixed-Tilt System 35 Table B-4 Performance Results for Zero-Degree Single-Axis System 35 Table B-5 Performance Results for Zero-Degree Double-Axis System36 Table C-1 DEDA Purchase Scenario37 Table C-2 Third-Party Purchase Without PPA37 Table C-3 Commercial-Scale PPA Scenario 38 Table D-1 JEDI Results Residential-Scale System 39 Table D-2 JEDI Results Commercial-Scale System42
viii
1 Study and Site Background The US Environmental Protection Agency (EPA) Region 5 in accordance with the RE-Powering Americarsquos Land initiative selected the Atlas Industrial Park in Duluth Minnesota for a feasibility study of renewable energy production Under the RE-Powering Americarsquos Land initiative the EPA provided funding to the National Renewable Energy Laboratory (NREL) to support a feasibility study of solar renewable energy generation at the Atlas Industrial Park NREL provided technical assistance for this project but did not assess environmental conditions at the site beyond those related to the performance of a photovoltaic (PV) system The purpose of this study is to assess the site for a possible PV installation and estimate the cost performance and site impacts of different PV configurations In addition the study evaluates financing options that could assist in the implementation of a PV system at the site
The feasibility of a PV project depends greatly on both site-specific and economic factors Site-specific factors include the available area for an array solar resource distance to transmission lines and distance to major roads In addition the operating status ground conditions and restrictions associated with redevelopment of contaminated sites impact the feasibility of a PV system Economic factors include purchase price of the electricity produced power purchase agreement (PPA) price and retail electric rates along with federal state and utility incentives for PV systems
The Atlas Industrial Park is approximately 62 acres and is located at the corner of Commonwealth and Grand Avenues along the St Louis River corridor in southern Duluth The City of Duluth has a population of 862651 and is served by the investor-owned utility Minnesota Power (MP) MP is required to follow the statersquos renewable energy standard (RES) which mandates that 25 of retail electricity sales come from renewable sources by 2025 The utility currently offers capacity-based incentives (CBI) up to $20000 for solar electric systems through its SolarSense program In 2012 the budget for the SolarSense program was $300000 with all funds committed by June 4
The Atlas Industrial Park was part of a local industrial manufacturing hub along the St Louis River and was operated by the Universal Atlas Cement Company (UAC) which produced Portland cement from 1915 to the mid-1970s UAC a subsidiary of US Steel Corporation used slag by-products from the nearby Duluth Works steel plant as a raw material in the manufacturing process The Duluth Works plant was also closed in the 1970s and is now a state and federal Superfund site covering approximately 500 acres Following closure of the UAC plant many of the structures were demolished and the debris spread across the site which created fill depths up to 13 feet This resulted in unstable soils and contamination including high pH soils polyaromatic hydrocarbons (PAH) polychlorinated biphenyls (PCB) metals (arsenic and lead) and likely presence of asbestos and petroleum
The Atlas Industrial Park is a state brownfield owned by the Duluth Economic Development Authority (DEDA) which acquired the land from UAC following its closure The land is zoned General Industrial and the southwestern 11 acres have been
1 US Census Quickfacts Accessed August 2012 httpquickfactscensusgovqfdstates272717000html 1
remediated and redeveloped into a warehouse and manufacturing facility for the IKONICS Corporation an imaging technology company headquartered in Duluth DEDA plans to develop the southeastern corner of the site to provide IKONICS with a 4-acre expansion and create a 5-acre model site The remaining 42 acres are undergoing remediation and redevelopment including road stormwater sewer and electric infrastructure which are anticipated to be completed in December 2012 The revitalization of the Saint Louis River Corridor is a key part of the cityrsquos community-supported comprehensive plan2 and DEDA believes that a solar project at the Atlas site would contribute to the growth of the area
Feasibility assessment team members from NREL DEDA and the EPA conducted a site visit on April 17 2012 to gather information integral to this feasibility study The team considered information including solar resource transmission availability community acceptance and ground conditions The site has un-shaded open areas is generally flat has electric infrastructure in place and is close to transmission and distribution lines making it a potential candidate for a PV installation
2 2006 City of Duluth Comprehensive Plan Accessed September 2012 httpwwwduluthmngovplanningcomp_planindexcfm
2
2 Development of a PV System on Brownfields Through the RE-Powering Americarsquos Lands initiative EPA has identified several benefits for siting solar PV facilities on brownfields noting that they
bull Can be developed in place of limited greenfields preserving the land carbon sink
bull May have environmental conditions that are not well suited for commercial or residential redevelopment and may be adequately zoned for renewable energy
bull Generally are located near existing roads and energy transmission or distribution infrastructure
bull May provide an economically viable reuse for sites that may have significant cleanup costs or low real estate development demand
bull Can provide job opportunities in urban and rural communities
bull Can advance cleaner and more cost-effective energy technologies and reduce the environmental impacts of energy systems (eg reduce greenhouse gas emissions)
By taking advantage of these potential benefits PV can provide a viable beneficial reusemdashin many cases generating significant revenue on a site that would otherwise go unused For many brownfields the local community has significant interest in the redevelopment of the site and community engagement is critical to match future reuse options to the communityrsquos vision for the site Understanding opportunities studied and realized by other similar sites demonstrates the potential for PV system development
Although brownfields can potentially present unique challenges for installing PV systems in many ways brownfields can be ideal locations for renewable energy projects offering a productive use of unproductive land PV systems have been successfully installed on a variety of brownfields in many parts of the country For example in Chicago Illinois a 41-acre site within the West Pullman industrial redevelopment area was used to install a 10-MW PV system in 2010 The project was the result of a partnership between the City of Chicago and the Excelon Corporation a local utility that developed the site that had been home to numerous manufacturing facilities since the 1800s3
The Atlas Industrial Park has potential to be used for other functions beyond the solar PV systems proposed in this report Any potential use should align with the community vision for the site and should work to enhance the overall utility of the property Some examples of other functions for the site include
bull Renewable-energy-powered remediation
bull Business park with sustainable site features
bull Habitat restorationopen space
3 See httpwwwexeloncorpcomassetsenergypowerplantsdocspdf_ExelonCitySolarFactpdf for a description of the project
3
There are many compelling reasons to consider moving toward renewable energy sources for power generation instead of fossil fuels including
bull Renewable energy sources offer a sustainable energy option in the broader energy portfolio
bull Renewable energy can have a net positive effect on human health and the environment
bull Deployment of renewable energy bolsters national energy independence and increases domestic energy security
bull Fluctuating electric costs can be mitigated by locking in electricity rates through long-term PPAs linked to renewable energy systems
bull Generating energy without harmful emissions or waste products can be accomplished through renewable energy sources
4
-
- -
-
-
- - -
3 PV Systems 31 PV Overview Solar PV technology converts energy from solar radiation directly into electricity Solar PV cells are the electricity-generating component of a solar energy system When sunlight (photons) strikes a PV cell an electric current is produced by stimulating electrons (negative charges) in a layer in the cell designed to give up electrons easily The existing electric field in the solar cell pulls these electrons to another layer By connecting the cell to an external load this current (movement of charges) can then be used to power the load (eg in a light bulb)
(-)
Solar cell
Figure 1 Generation of electricity from a PV cell
Source EPA
PV cells are assembled into a PV panel or module PV modules are then connected to create an array The modules are connected in series and then in parallel as needed to reach the specific voltage and current requirements for the array The direct current (DC) electricity generated by the array is then converted by an inverter to useable alternating current (AC) that can be consumed by adjoining buildings and facilities or exported to the electricity grid PV system size varies from small residential (2ndash10 kW) to commercial (100ndash500 kW) to large utility scale (10+ MW) Central distribution plants are also currently being built in the 100+ MW scale Electricity from utility-scale systems is commonly sold back to the electricity grid
(+)
Electron
Load
Current flow
5
32 Major System Components
Figure 2 Ground-mounted array diagram
Source NREL
A typical PV system is made up of several key components including
bull PV modules
bull Inverter
bull Balance-of-system (BOS) components These along with other PV system components are discussed below
321 PV Module Module technologies are differentiated by the type of PV material used resulting in a range of conversion efficiencies from light energy to electrical energy The module efficiency is a measure of the percentage of solar energy converted into electricity
Two common PV technologies that have been widely used for commercial and utility-scale projects are crystalline silicon and thin film
3211 Crystalline Silicon Traditional solar cells are made from silicon Silicon is quite abundant and nontoxic It builds on a strong industry on both supply (silicon industry) and product side This technology has been demonstrated for a consistent and high efficiency over 30 years in the field The performance degradation a reduction in power generation due to long-term exposure is under 1 per year Silicon modules have a lifespan in the 25ndash30-year range but can keep producing energy beyond this range
6
Typical overall efficiency of silicon solar panels is between 12 and 18 However some manufacturers of mono-crystalline panels claim an overall efficiency nearing 20 This range of efficiencies represents significant variation among the crystalline silicon technologies available The technology is generally divided into mono- and multi-crystalline technologies which indicates the presence of grain-boundaries (ie multiple crystals) in the cell materials and is controlled by raw material selection and manufacturing technique Crystalline silicon panels are widely used based on deployments worldwide
Figure 3 shows two examples of crystalline solar panels mono- and multi-silicon installed on tracking mounting systems
Source SunPower NREL PIX 23816 Source NREL PIX 13823
Figure 3 Mono- and multi-crystalline solar panels
3212 Thin Film Thin-film PV cells are made from amorphous silicon (a-Si) or non-silicon materials such as cadmium telluride (CdTe) Thin-film cells use layers of semiconductor materials only a few micrometers thick Due to the unique nature of thin films some thin-film cells are constructed into flexible modules enabling such applications as solar energy covers for landfills such as a geomembrane system Other thin-film modules are assembled into rigid constructions that can be used in fixed-tilt or in some cases tracking system configurations
The efficiency of thin-film solar cells is generally lower than for crystalline cells Current overall efficiency of a thin-film panel is 6ndash8 for a-Si and 11ndash12 for CdTe Figure 4 shows thin-film solar panels
Source Republic Services NREL PIX 23817 Source NREL PIX 14726 Source NREL PIX 17395
Figure 4 Thin-film solar panels installed on a solar energy cover (left) and fixed-tilt mounting system (middleright)
7
Industry-standard warranties of both crystalline and thin-film PV panels typically guarantee system performance of 80 of the rated power output for 25 years After 25 years they will continue producing electricity at a lower performance level
322 Inverter Inverters convert DC electricity from the PV array into AC and can connect seamlessly to the electricity grid Inverter efficiencies can be as high as 985
Inverters also sense the utility power frequency and synchronize the PV-produced power to that frequency When utility power is not present the inverter will stop producing AC power to prevent ldquoislandingrdquo or putting power into the grid while utility workers are trying to fix what they assume is a de-energized distribution system This safety feature is built into all grid-connected inverters in the market Electricity produced from the system may be fed to a step-up transformer to increase the voltage to match the grid
There are two primary types of inverters for grid-connected systems string and micro-inverters Each type has strengths and weaknesses and would be recommended for different types of installations
String inverters are most common and typically range in size from 15ndash1000 kW These inverters tend to be cheaper on a capacity basis as well as have high efficiency and lower operation and maintenance (OampM) costs String inverters offer various sizes and capacities to handle a large range of voltage output For larger systems string inverters are combined in parallel to produce a single point of interconnection with the grid Warranties are typically 10 years and extended warranties up to 20 years are possible for larger units Given that the expected life of PV panels is 25ndash30 years an operator can expect to replace a string inverter at least one time during the life of the PV system
Micro-inverters are dedicated to the conversion of a single PV modulersquos power output The AC output from each module is connected in parallel to create the array This technology is relatively new to the market and in limited use in larger systems due to the potential increase in OampM associated with significantly increasing the number of inverters in a given array Current micro-inverters range in size between 175 W and 380 W These inverters can be the most expensive option per watt of capacity Warranties range from 10ndash20 years Small projects with irregular modules and shading issues typically benefit from micro-inverters
With string inverters small amounts of shading on a solar panel will significantly affect the entire array production Instead it impacts only that shaded panel if micro-inverters are used Figure 5 shows a string inverter
8
Figure 5 String inverter
Source NREL PIX 07985
323 Balance-of-System Components In addition to the modules and inverter a PV system consists of other parts called BOS components which include
bull Mounting racks and hardware for the panels
bull Wiring for electrical connections
3231 Mounting Systems An array has to be secured and oriented optimally to maximize system output The structure holding the modules is referred to as the mounting system
32311 Ground-Mounted Systems For ground-mounted systems the mounting system can be either directly anchored into the ground (via driven piers or concrete footers) or ballasted on the surface without ground penetration Mounting systems must withstand local wind loads which range from 90ndash120 mph for most areas or 130 mph or more for areas with hurricane potential Depending on the region snow and ice loads must also be a design consideration for the mounting system For brownfields mounting system designs will be primarily driven by these considerations coupled with settlement concerns
Typical ground-mounted systems can be categorized as fixed tilt or tracking Fixed-tilt mounting structures consist of panels installed at a set angle typically based on site latitude and wind conditions to increase exposure to solar radiation throughout the year Fixed-tilt systems are used at many brownfield sites and have lower maintenance costs but generate less energy (kWh) per unit power (kW) of capacity than tracking systems However energy density is often greater for fixed-tilt systems which require less area per module and are less prone to ldquoself-shadingrdquo than tracking systems although self-shading does increase with panel-tilt for fixed-tilt systems requiring additional spacing between rows
9
Table 1 Energy Density by Panel and System
Fixed-Tilt Energy Single-Axis Tracking Energy System Type Density (DC-Wattsft2) Density (DC-Wattsft2) Crystalline Silicon 40 33 Thin Film 33 27 Hybrid High Efficiency 48 39
Tracking systems rotate the PV modules so they are following the sun as it moves across the sky This increases energy output but also increases maintenance and equipment costs slightly Single-axis tracking in which PV is rotated on a single axis can increase energy output by 25 or more With dual-axis tracking the module is able to directly face the sun all day potentially increasing energy output by 35 or more Depending on underlying soiling conditions single- and dual-axis trackers may not be suitable due to potential settlement effects which can interfere with the alignment requirements of such systems
The selection of mounting type is dependent on many factors including installation size electricity rates government incentives land constraints latitude and local weather Contaminated land applications may raise additional design considerations due to site conditions including differential settlement
Selection of the mounting system is also heavily dependent on anchoring or foundation selection The mounting system design will also need to meet applicable local building code requirements with respect to snow wind and seismic zones Selection of mounting types should also consider frost protection needs especially in cold regions such as New England
3232 Wiring for Electrical Connections Electrical connections including wiring disconnect switches fuses and breakers are required to meet electrical code (eg NEC Article 690) for both safety and equipment protection
In most traditional applications wiring from (1) the arrays to inverters and (2) inverters to point of interconnection is generally run as direct burial through trenches In brownfield applications this wiring may be required to run through above-ground conduit due to restrictions with ground penetration or other concerns Therefore developers should consider noting any such restrictions if applicable in requests for proposals in order to improve overall bid accuracy Similarly it is recommended that PV system vendors reflect these costs in the quote when costing out the overall system
3233 PV System Monitoring Monitoring PV systems can be essential for reliable functioning and maximum yield of a system It can be as simple as reading values such as produced AC power daily kilowatt-hours and cumulative kilowatt-hours locally on an LCD display on the inverter For more sophisticated monitoring and control purposes environmental data such as module temperature ambient temperature solar radiation and wind speed can be collected
10
Remote control and monitoring can be performed by various remote connections Systems can send alerts and status messages to the control center or user Data can be stored in the inverterrsquos memory or in external data loggers for further system analysis Collection of this basic information is standard for PV systems and not unique to landfill applications
Weather stations are typically installed in large-scale systems Weather data such as solar radiation and temperature can be used to predict energy production enabling comparison of the target and actual system output and performance and identification of under-performing arrays Operators may also use this data to identify for example required maintenance shade on panels and accumulating dirt on panels Monitoring system data can also be used for outreach and education This can be achieved with publicly available online displays wall-mounted systems or even smart phone applications
324 Operation and Maintenance PV panels typically have a 25-year performance warranty The inverters which come standard with a 10-year warranty (extended warranties available) would be expected to last 10ndash15 years System performance should be verified on a vendor-provided website Wire and rack connections should be checked annually This economic analysis uses an annual OampM cost computed as $30kWyr for the first 15 years and $20kWyr for the remaining 10 years which is based on the historical OampM costs of installed fixed-axis grid-tied PV systems The system should expect a replacement of system inverters in year 15 at a cost of $025W which has been amortized over the first 15 years of operation
33 Siting Considerations PV modules are very sensitive to shading When shaded (either partially or fully shaded) the panel is unable to optimally collect the high-energy beam radiation from the sun As explained above PV modules are made up of many individual cells that all produce a small amount of current and voltage These individual cells are connected in series to produce a larger current If an individual cell is shaded it acts as resistance to the whole series circuit impeding current flow and dissipating power rather than producing it
The NREL solar assessment team uses a Solmetric SunEye solar path calculator to assess shading at particular locations by analyzing the sky view where solar panels will be located By finding the solar access the NREL team can determine if the area is appropriate for solar panels Following the successful collection of solar resource data using the Solmetric SunEye tool and determination that the site is adequate for a solar installation an analysis to determine the ideal system size must be conducted System size depends highly on the average energy use of the facilities on the site PPAs available incentives and utility policy
11
4 Proposed Installation Location Information This section summarizes the findings of the NREL solar assessment site visit at the Atlas Industrial Park on April 17 2012
41 Atlas Industrial Park PV System In order to get the most out of the ground area available it is important to consider whether the site layout can be improved to better incorporate a PV system If there are structures fences vegetation or electrical poles that can be removed the un-shaded area can be increased to incorporate more PV panels From the information collected during the site visit the team concluded that 80 of the entire site could accommodate a PV system and the remaining 20 would be unusable due to roads topography vegetation or other restrictions
Typically a minimum of 2 useable acres is recommended to site PV systems Useable acreage is typically characterized as flat to gently sloping southern exposures that are free from obstructions and get full sun for at least a 6-hour period each day For example eligible space for PV includes under-utilized or unoccupied land vacant lots andor unused paved areas (eg a parking lot or industrial site space) as well as existing building rooftops
Figure 6 shows an aerial view of the Atlas Industrial Park taken from Google Earth showing the total feasible area (highlighted in orange) and electrical tie-in point for a PV system As shown there are large expanses of relatively flat un-shaded land which makes it a suitable candidate for a PV system The total area of the site that appears feasible for PV is 233 acres (1016969 ft2) which could support a 4-MW fixed-tilt system or a 33-MW single-axis tracking system
12
Figure 6 Aerial view of the feasible area for PV at the Atlas Industrial Park
Illustration made in Google Earth
Based on current development plans it is unlikely that the entire site will be utilized for a PV system Instead a smaller 2-acre parcel which was formerly the location of the Atlas Cement silos is being considered This site is shown in Figure 7 and could support a 348shykW fixed-tilt or 287-kW single-axis tracking PV system The difference in system size is due to the need for additional space to prevent self-shading between modules with tracking systems which also becomes more pronounced at higher tilt angles for fixed-tilt systems In addition if the existing vegetation could be removed along Commonwealth Avenue the available acreage and visibility could be increased
13
Figure 7 Aerial view of the 2-acre silo site for PV at the Atlas Industrial Park
Illustration made in Google Earth
PV systems are suitable for Duluth Minnesota where the average global horizontal annual solar resourcemdashthe total solar radiation for a given location including direct diffuse and ground-reflected radiationmdashis 433 kWhm2day For comparison Seattle Washington receives 367 kWhm2day and Tucson Arizona receives 613 kWhm2day4 Figures 8ndash11 show various views of the Atlas Industrial Park site taken during the site visit
4 PVWatts Viewer Accessed August 2012 httpgisatnrelnrelgovPVWatts_Viewerindexhtml 14
Figure 8 Northwest view of the Atlas Industrial Park
Photo by Lars Lisell NREL
Figure 9 East view of the Atlas Industrial Park
Photo by Lars Lisell NREL
15
Figure 10 Southeast view of the Atlas Industrial Park
Photo by Lars Lisell NREL
Figure 11 West view (near silo site) of the Atlas Industrial Park
Photo by Lars Lisell NREL
16
42 Utility-Resource Considerations When considering a ground-mounted system an electrical tie-in location should be identified to determine how it would be connected to the grid or on-site facilities The existing infrastructure at the Atlas Industrial Park is well suited for installation of a PV system The expected electrical tie-in and inverter location for the PV system at the Atlas Industrial Park is located at the MP electrical box east of the IKONICS building along the road into the site The proposed additional electric infrastructure might also be used as an alternative tie-in and inverter location and could add flexibility to the location of a PV system Additionally there are transmission and distribution lines crossing the southern portion of the property that could carry surplus electricity off-site The electrical tie-in point was not evaluated specifically for compatibility with a PV system and for the purposes of this analysis the site was assumed to need no additional infrastructure Before moving forward with a solar project however a grid integration study should be performed in order to determine definitively whether or not additional infrastructure will be needed to accommodate a PV system The expected electrical tie-in point is shown in Figure 12
Figure 12 Potential electrical tie-in point for the PV system at the Atlas Industrial Park showing the IKONICS building and meter in the background
Photo by Lars Lisell NREL
17
43 PV Site Solar Resource The Atlas Industrial Park site has been evaluated to determine the adequacy of the solar resource available using both on-site data and industry tools The assessment team for this feasibility study collected multiple Solmetric SunEye data points and found an annual solar access of 95 and estimated solar resource of 419 kWhm2day The data gathered using this tool is available in Appendix A
The predicted array performance was found using PVWatts Version 25 for Duluth Minnesota For this summary array performance information a hypothetical system size of 1 kW was used to show the estimated production for each kilowatt It is scaled linearly so that additional analyses can be performed to match the proposed system size Table 2 shows the annual performance results of four different system configurations in Duluth Minnesota as calculated by PVWatts The monthly results for each system type are available in Appendix B
Table 2 Performance Results for 1-kW PV Systems in Duluth Minnesota
System Type AC Energy (kWhyr)
Increase from Fixed 20deg Tilt
Fixed Tilt 20deg Tilt 1216 0
Fixed Tilt 468deg Tilt (latitude) 1271 45
Single-Axis Tracking 1427 173
Double-Axis Tracking 1714 410
44 Atlas Industrial Park Energy Usage Understanding the energy use of a site will enable a full analysis of whether or not energy produced would need to be sold or if it could offset on-site energy use Currently the Atlas Industrial Park does not have any energy-consuming infrastructure in place However a PV system could be used to offset adjacent facilities such as the IKONICS building or on-site energy use from future development
441 Net Metering Net metering is an electricity policy for consumers who own renewable energy facilities Net in this context is used to mean what remains after deductionsmdashin this case the deduction of any energy outflows from metered energy inflows Under net metering a system owner receives retail credit for at least a portion of the electricity it generates As part of the Energy Policy Act of 2005 under Sec 1251 all public electric utilities are required upon request to make net metering available to their customers6
5 NREL Renewable Resource Data Center ndash PVWatts Accessed September 2012 httpwwwnrelgovrredcpvwatts6 Energy Policy Act of 2005 Title XIImdashElectricity Subtitle EmdashAmendments to PURPA Section 1251mdash Net Metering and Additional Standards Accessed January 9 2013 httpwwwgpogovfdsyspkgPLAWshy109publ58pdfPLAW-109publ58pdf
18
(11) NET METERINGmdashEach electric utility shall make available upon request net metering service to any electric consumer that the electric utility serves For purposes of this paragraph the term lsquonet metering servicersquo means service to an electric consumer under which electric energy generated by that electric consumer from an eligible on-site generating facility and delivered to the local distribution facilities may be used to offset electric energy provided by the electric utility to the electric consumer during the applicable billing period
Minnesotarsquos net-metering law7 which took effect in 1983 requires utilities to offer net metering to all customers with solar and wind-energy systems up to 40 kW
Renewable energy certificates (RECs) also known as green certificates green tags or tradable renewable certificates are tradable commodities in the United States that represent proof of electric energy generation from eligible renewable energy resources (renewable electricity) The RECs that are associated with the electricity produced and are used on-site remain with the customer-generator If however the customer chooses to receive financial compensation for the net electricity generation remaining after a 12shymonth period the utility will be granted the RECs associated with only that surplus they purchase Minnesota currently participates in the Midwest Renewable Energy Tracking System (M-RETS) which uses production data from participating generators to create RECs in the form of digital tradable certificates for each megawatt-hour8
442 Virtual Net Metering Some states and utilities allow for virtual net metering (VNM) often referred to as community solar or solar gardens This arrangement can allow certain entities such as a local government to install renewable generation at one location within its geographic boundary and to generate credits that can be used to offset charges at one or more other locations within the same geographic boundary Currently neither MP nor the State of Minnesota offer VNM
7 For the full text of this bill see httpwwwdsireusaorgincentivesincentivecfmIncentive_Code=MN01Rampre=0ampee=08 Midwest Renewable Energy Tracking System Accessed August 2012 wwwmretsnet
19
5 Economics and Performance The economics and performance of a PV system installed on the site was evaluated using a combination of the assumptions and background information discussed previously as well as a number of industry-specific inputs determined by other studies In particular this study used the NREL System Advisor Model (SAM)9
SAM is a performance and economic model designed to facilitate decision making for people involved in the renewable energy industry ranging from project managers and engineers to incentive program designers technology developers and researchers
SAM makes performance predictions for grid-connected solar solar water heating wind and geothermal power systems and makes economic calculations for both projects that buy and sell power at retail rates and power projects that sell power through a PPA
SAM consists of a performance model and financial model The performance model calculates a systems energy output on an hourly basis (sub-hourly simulations are available for some technologies) The financial model calculates annual project cash flows over a period of years for a range of financing structures for residential commercial and utility projects
SAM makes performance predictions for grid-connected solar small wind and geothermal power systems and economic estimates for distributed energy and central generation projects The model calculates the cost of generating electricity based on information you provide about a projects location installation and operating costs type of financing applicable tax credits and incentives and system specifications
51 Assumptions and Input Data for Analysis Cost of a PV system depends on the system size and other factors such as geographic location mounting structure and type of PV module Based on significant cost reductions seen in recent years the average cost for utility-scale ground-mounted systems have declined from $480W in the first quarter (Q1) of 2010 to $290W in Q1 2012 Costs for smaller commercial and residential-scale systems have also declined steadily to $463W and $589W respectively The lower cost of utility-scale systems reflects increased economies of scale which allows fixed costs to be spread over a larger project budget With an increasing demand and supply the potential for further cost reduction is expected as market conditions evolve Figure 13 shows the cost per watt of PV systems from 2010 to 2012 for residential commercial (non-residential) and utility-scale installations
9 For additional information on SAM see httpssamnrelgovcost 20
Figure 13 Solar market insight Q1 2012 national weighted average system prices10
Credit Solar Energy Industries Association
For this analysis the installed cost of fixed-tilt ground-mounted commercial- and residential-scale systems was assumed to be $579W and $736W respectively The increased cost is because of limitations placed on design and construction methods due to the ground conditions at the site and is estimated to be 25 for a ballasted system Such limitations include restrictions on storm water runoff weight loading of construction equipment inability to trench for utility lines additional engineering costs permitting issues and non-standard ballasted racking systems The installed system cost assumptions for commercial- and residential-scale systems are summarized in Table 3
Table 3 Installed Fixed-Tilt System Cost Assumptions
System Size Commercial ($W)
Residential ($W)
Baseline system 463 589 With ballast 116 147 Total installed cost 579 736
These prices include the PV array and the BOS components for each system including the inverter and electrical equipment as well as the installation cost This includes estimated taxes and a national-average labor rate but does not include land cost The economics of grid-tied PV depend on incentives the cost of electricity the solar resource
10 Data and figure from the Solar Energy Industries Association SEIAGTM Research US Solar Market Insight Report 2012 Q1 Accessed August 2012 httpwwwseiaorgresearch-resourcessolar-marketshyinsight-report-2012-q1
21
and panel tilt and orientation For this analysis the cost of electricity was assumed to be $005kWh an average of MPrsquos commercial rates11
It was assumed for this analysis that relevant federal incentives are received It is important to consider all applicable incentives or grants to make PV as cost effective as possible If the PV system is owned by a private tax-paying entity this entity may qualify for federal tax credits and accelerated depreciation on the PV system which can be worth about 15 of the initial capital investment The total potential tax benefits to the taxshypaying entity can be as high as 45 of the initial system cost Because state and federal governments do not pay taxes private ownership of the PV system would be required to capture tax incentives
MPrsquos current solar electric incentive program SolarSense uses a CBI structure with a cap of $20000 The program budget for 2012 has been fully committed and the utility is currently evaluating the results for next yearrsquos program Due to the uncertainty of next yearrsquos incentive structure this analysis limited the incentive to the base level Table 4 shows the incentive levels for the SolarSense program
Table 4 Minnesota Powerrsquos 2012 SolarSense Program Incentive Levels
Incentive Level ($kW) Base incentive 2000 Non-profittax exempt owner 500 Minnesota-made modules 1000 NABCEP certified installers 250
For the purposes of this analysis three development scenarios were considered for installing a PV system at the site
1 DEDA purchase
2 Private purchase and use
3 Private development with a PPA
For each scenario the project is expected to have a 25-year life although the systems can be reasonably expected to continue operation past this point The panels are assumed to have a 05 per year degradation in performance A system DC-to-AC conversion of 80 was assumed which includes losses in the inverter wire losses PV module losses and losses due to temperature effects Inflation is assumed to be 25 and the loan rate is assumed to be 6 for each scenario The OampM expenses are estimated to be $30kWyear during the first 15 years and then $20kWyear for years 16ndash25 A fixed 20deg-tilt system was used as a baseline for evaluating the economics of PV at the site The exact system design is beyond the scope of this study and will depend on additional site-specific analysis and input from stakeholders The assumptions and inputs for each scenario are included in Table 5 with the differences highlighted
11 Minnesota Power commercial rates Accessed August 2012 httpwwwmnpowercomcustomer_serviceyour_billdocumentsFinal_4961apdf
22
Table 5 SAM Inputs and Assumptions
Parameter DEDA Purchase Private PurchasePPA Analysis period (years) 25 25 Inflation 250 250 Real discount rate 300 585 Federal tax rate 0 3500 State tax rate 0 980 Insurance ( of installed cost) 050 050 Property tax 000 000 Construction loan 000 000 Loan term (years) 25 15 Loan rate 600 600 Debt fraction 10000 5000 Minimum IRR na na 1500 PPA escalation rate na na 150 Federal depreciation na Custom 5-year MACRSa
State depreciation na na Federal ITC na 3000 Capacity-based incentive $250kW $200kW Degradation 050 050 Operational availability 10000 10000 Cost - fixed axis per kW $579 $579 Grid interconnection cost 0 0 OampM $30kWyr for years 1-15 amp $20kWyr for years 16-25 DC-AC derate factor 8000 8000 Tilt 20deg 20deg a Modified Accelerated Cost Recovery System
The PVWatts calculation engine within SAM was used to calculate expected energy performance for the system based on system size configuration and solar resource System size was calculated from the available land area this analysis was restricted to the 2-acre silo site and determined to be 348 kW for a fixed-tilt system and 287 kW for a single-axis tracking system Additionally this study evaluated smaller residential-scale systems which are favored by the current incentive structure from MP
52 SAM Forecasted Economic Performance Using the inputs and assumptions summarized above the SAM tool predicts the levelized cost of energy (LCOE) payback period and PPA price for a PV system at the Atlas Industrial Park Table 6 summarizes the results of the economic analysis for the system configurations and development scenarios considered in this study The entire results are available in Appendix C
23
Table 6 Atlas Industrial Park PV System Summary
PV System Type System Scale System Sizea Array Tilt Annual Output Number of Houses
Poweredb
(kW) (deg) (kWhyear)
Crystalline Silicon (Fixed Tilt) Commercial 348 200 423073 38
Crystalline Silicon (Fixed Tilt) Residential 10 200 12157 11
Crystalline Silicon (Fixed Tilt) Residential 8 200 9726 09
Development Scenario System Scale - Size System Cost LCOE Real LCOE Nominal Payback Period ($kWh) ($kWh) or PPA Price
DEDA Purchase Commercial - 348 kW 2014920 $ 034 044 gt25 years
Private Purchase Commercial - 348 kW 2014920 $ 015 019 gt25 years
Private Purchase with PPA Commercial - 348 kW 2014920 $ 031 040 $031kWh
DEDA Purchase Residential - 8 kW 58880 $ 030 039 gt25 years
Private Purchase Residential - 10 kW 73600 $ 013 016 gt25 years
a Data assume a maximum usable area of 2 acres
Number of average American households that could hypothetically be powered by the PV system assuming 11040 b
kWhyearhousehold
In each case the results indicate that the LCOE and PPA price would be significantly higher than the retail commercial rate of $005kWh Although the current CBI and incentive cap favor smaller residential-scale systems the increased cost per watt compared to larger commercial-scale systems also limits the economic feasibility of these systems
Figures 14 and 15 show the optimal size for a residential-scale PV system based on current base-level CBIs The inputs and assumptions were kept the same as the commercial-scale system however the module cost was increased to $736W reflecting current market data for residential systems Again the LCOE for each scenario was found to be significantly higher than the current retail commercial electricity rate The optimal system size is 8 kW for the DEDA purchase scenario and 10 kW for the private purchase scenario In each case adding CBIs would decrease the optimal system size by reaching the incentive cap with a smaller system
24
LCO
E (cent
kW
h)
LCO
E (cent
kW
h)
0 5
10 15 20 25 30 35 40 45 50
1 2 3 4 5 6 7 8 9 10 11 12 13 14 15 Nameplate Capacity (kW)
DEDA Purchase
LCOE Real
LCOE Nominal
Figure 14 Optimal system size for a DEDA-purchased residential-scale system
0 5
10 15 20 25 30 35 40 45 50
1 2 3 4 5 6 7 8 9 10 11 12 13 14 15 Nameplate Capacity (kW)
Private Purchase
LCOE Real
LCOE Nominal
Figure 15 Optimal system size for a privately purchased residential-scale system
Due to the uncertainty of future incentives and high LCOE for PV in Duluth this study evaluated grid-paritymdashthe point at which PV might become cost-competitive with grid-purchased electricity Table 7 summarizes the result of the grid-parity analysis showing the module cost at which the real LCOE (without incentives) becomes cost-competitive with the current price of electricity The results indicate that significant decreases in module costs would be necessary to compete with grid-purchased electricity Grid parity could occur in Duluth as module costs continue to decline and incentives for PV evolve in the coming years The entire results of this analysis are available in Appendix C
25
Table 7 Predicted Real Module Cost for Grid Parity ($005kWh)
Module Cost ($kW) DEDA Purchase 060 Private Purchase 110 Private PPA 040
53 Job Analysis and Impact To evaluate the impact on employment and economic impacts of the PV project associated with this analysis the NREL Jobs and Economic Development Impact (JEDI) model was used12 The JEDI models are tools that estimate the economic impacts associated with the construction and operation of distributed generation power plants It is a flexible input-output tool that estimates but does not precisely predict the number of jobs and economic impacts that can be reasonably supported by the proposed facility
The JEDI models represent the entire economy including cross-industry or cross-company impacts For example JEDI estimates the impact that the installation of a distributed generation facility would have on not only the manufacturers of PV modules and inverters but also the associated construction materials metal fabrication industry project management support transportation and other industries that are required to enable the procurement and installation of the complete system
For this analysis inputs including the estimated installed project cost ($kW) targeted year of construction system capacity (kW) OampM costs ($kW) and location were entered into the model to predict the jobs and economic impact It is important to note that the JEDI model does not predict or incorporate any displacement of related economic activity or alternative jobs due to the implementation of the proposed project As such the JEDI model results are considered gross estimates as opposed to net estimates Table 8 shows the assumed values for the Atlas Industrial Park
Table 8 JEDI Analysis Assumptions
Assumed Value Assumed Value Input Residential Commercial Capacity 9 kW 348 kW
Year Placed In Service 2013 2013
Installed System Cost $736W $579W
Location Duluth MN Duluth MN
Using these inputs the JEDI tool estimates the gross direct indirect and induced jobs associated earnings and total economic impact supported by the construction and continued operation of the proposed PV system
12 The JEDI models have been used by the US Department of Energy the US Department of Agriculture NREL and the Lawrence Berkeley National Laboratory as well as a number of universities For information on the JEDI tool see httpwwwnrelgovanalysisjediabout_jedihtml
26
The estimates of jobs associated with this project are presented as either construction period jobs or sustained operations jobs Each job is expressed as a whole or fraction full-time equivalent (FTE) position An FTE is defined as one person working 40 hours per week for the duration of a year Construction period jobs are considered short-term positions that exist only during the procurement and construction periods Table 9 summarizes the results from the JEDI model analysis The full results are provided in Appendix D
Table 9 JEDI Summary Results
Residential System Commercial System Jobs during construction 07 189
Wages paid to workers $13600 $935500
Economic output during construction $24100 $2326000
Jobs during operating years 00 01
Earnings per year $200 $7700
Economic output per year $300 $13500
54 Financing Opportunities The procurement development construction and management of a successful distributed generation facility can be owned and financed a number of different ways The most common ownership and financing structures are described below
541 Owner and Operator Financing The owneroperator financing structure is characterized by a single entity with the financial strength to fund all of the solar project costs and if a private entity sufficient tax appetite to utilize all of the projectrsquos tax benefits Private ownersoperators typically establish a special purpose entity (SPE) that solely owns the assets of the project An initial equity investment into the SPE is funded by the private entity using existing funds and all of the projectrsquos cash flows and tax benefits are utilized by the entity This equity investment is typically matched with debt financing for the majority of the project costs Project debt is typically issued as a loan based on the ownersrsquooperatorsrsquo assets and equity in the project In addition private entities can utilize any of federal tax credits offered
For public entities that choose to finance own and operate a solar project funding can be raised as part of a larger general obligation bond as a standalone tax credit bond through a tax-exempt lease structure bank financing grant and incentive programs or internal cash or some combination of the above Federal qualified energy conservation bonds (QECBs)13 can also be used to finance renewable energy as well as energy efficiency projects Certain structures are more common than others and grant programs for solar programs are on the decline Regardless as tax-exempt entities public entities
13 Department of Energy Solution Center Qualified Energy Conservation Bonds Accessed January 10 2013 httpwww1eereenergygovwipsolutioncenterfinancialproductsqecbhtml
27
are unable to benefit directly from the various tax-credit-based incentives available to private companies This has given way to the now common use of third-party financing structures such as the PPA
542 Third-Party Developers with Power Purchase Agreements Because many project site hosts do not have the financial or technical capabilities to develop a capital intensive project many times they turn to third-party developers (andor their investors) In exchange for access to a site through a lease or easement arrangement third-party developers will finance develop own and operate solar projects utilizing their own expertise and sources of tax equity financing and debt capital Once the system is installed the third-party developer will sell the electricity to the site host or local utility via a PPAmdasha contract to sell electricity at a negotiated rate over a fixed period of time The PPA typically will be between the third-party developer and the site host if it is a retail ldquobehind-the-meterrdquo transaction or directly with an electric utility if it is a wholesale transaction
Site hosts benefit by either receiving competitively priced electricity from the project via the PPA or land lease revenues for making the site available to the solar developer via a lease payment This lease payment can take on the form of either a revenue-sharing agreement or an annual lease payment In addition third-party developers are able to utilize federal tax credits For public entities this arrangement allows them to utilize the benefits of the tax credits (low PPA price higher lease payment) while not directly receiving them The term of PPAs typically varies from 20ndash25 years
543 Third-Party ldquoFliprdquo Agreements The most common use of a third-party ldquofliprdquo agreement is a site host working with a third-party developer who then partners with a tax-motivated investor in an SPE that would own and operate the project Initially most of the equity provided to the SPE would come from the tax investor and most of the benefit would flow to the tax investor (as much as 99) When the tax investor has fully monetized the tax benefits and achieved an agreed-upon rate of return the allocation of benefits and majority ownership (95) would flip to the site host (but not within the first 5 years) After the flip the site host would have the option to buy out all or most of the tax investorsrsquo interest in the project at the fair market value of the tax investorrsquos remaining interest
A flip agreement can also be signed between a developer and investors within an SPE where the investor would begin with the majority ownership Eventually the ownership would flip to the developer once the investorsrsquo return is met
544 Hybrid Financial Structures As the solar market evolves hybrid financial solutions have been developed in certain instances to finance solar projects A particular structure nicknamed ldquoThe Morris Modelrdquo after Morris County New Jersey combines highly rated public debt a capital lease and a PPA Low-interest public debt replaces more costly financing available to the solar developer and contributes to a very attractive PPA price for the site hosts New markets tax credits have been combined with PPAs and public debt in other locations such as Denver and Salt Lake City
28
545 Solar Services Agreement and Operating Lease The Solar Services Agreement (SSA) and operating lease business models have been predominately used in the municipal and cooperative utility markets due to its treatment of tax benefits and the rules limiting federal tax benefit transfers from non-profit to for-profit companies Under IRS guidelines municipalities cannot enter capital leases with for-profit entities when the for-profit entities capture tax incentives As a result a number of business models have emerged as a work-around to this issue One model is the SSA wherein a private party sells ldquosolar servicesrdquo (ie energy and RECs) to a municipality over a specified contract period (typically long enough for the private party to accrue the tax credits) The non-profit utility typically purchases the solar services with either a oneshytime up-front payment equal to the turn-key system cost minus the 30 federal tax credit or may purchase the services in annual installments The municipality may buy out the system once the third-party has accrued the tax credits but because of IRS regulations the buyout of the plant cannot be included as part of the SSA (ie the SSA cannot be used as a vehicle for a sale and must be a separate transaction)
Similar to the SSA there are a variety of lease options that are available to municipalities that allow the capture of tax benefits by third-party owners which result in a lower cost to the municipality These include an operating lease for solar services (as opposed to an equipment capital lease) and a complex business model called a ldquosaleleasebackrdquo
546 SaleLeaseback In the saleleaseback model the public or private entity installs the PV system sells it to a tax investor and then leases it back As the lessee they are responsible for operating and maintaining the PV system as well as have the right to sell or use the power In exchange for use of the PV system the public or private entity would make lease payments to the tax investor (the lessor) The tax investor would have rights to federal tax benefits generated by the project and the lease payments Sometimes the entity is allowed to buy back the project at 100 fair market value after the tax benefits are exhausted
547 Community Solar GardensSolar The concept of ldquocommunity solarrdquo is one in which the costs and benefits of one large solar project are shared by a number of participants A site owner may be able to make the land available for a large solar project which can be the basis for a community solar project Ownership structures for these projects vary but the large projects are typically owned or sponsored by a local utility Community solar gardens are distributed solar projects wherein utility customers have a stake via a pro-rated share of the projectrsquos energy output This business model is targeted to meet demand for solar projects by customers who rentlease homes or businesses do not have good solar access at their site or do not want to install a PV system on their facilities Customer pro-rated shares of solar projects are acquired through a long-term transferrable lease of one or more panels or they subscribe to a share of the project in terms of a specific level of energy output or the energy output of a set amount of capacity Under the customer lease option the customer receives a billing credit for the number of kilowatt-hours their pro-rated share of the solar project produces each month it is also known as VNM Under the customer subscription option the customers typically pay a set price for a block of solar energy
29
(ie 100 kWh per month blocks) from the community solar project Other models include monthly energy outputs from a specific investment dollar amount or a specific number of panels
Community solar garden and customer subscription-based projects can be owned solely by the utility owned solely by third-party developers with facilitation of billing provided by the utility or be a joint venture between the utility and a third-party developer leading to eventual ownership by the utility after the tax benefits have been absorbed by the third-party developer
There are some states that offer solar incentives for community solar projects including Washington State (production incentive) and Utah (state income tax credit) Community solar is known as solar gardens depending on the location (eg Colorado) Solar gardens are not currently offered in Minnesota but if approved by the Minnesota public utility commission could be an effective way to make the Atlas site a sustainable office park
30
6 Conclusions and Recommendations From a technical standpoint the Atlas Industrial Park is a suitable area in which to implement a PV project with an adequate land area and solar resource However the existing economics specific to Duluth currently limit the feasibility of a PV system there As summarized in Section 5 the economic analysis completed using SAM predicts an LCOE significantly higher than the current retail rate which is approximately half the national average14 Additionally MPrsquos current incentive structure favors smaller systems by using a capacity-based approach with a relatively low incentive cap Based on current economics the most cost-competitive scenario is a privately owned residential-scale system used to offset on-site energy use with larger systems also predicted to have lower LCOEs than either the DEDA purchase or PPA scenarios
Future changes to electric rates module costs and incentives may make PV in Duluth cost-competitive with grid-purchased electricity Continued increases in electric rates combined with decreases in module costs will reduce the gap between grid-purchased electricity and distributed generation In addition changes to MPrsquos current incentive structure or the addition of incentives from the state could further reduce the LCOE of PV systems in the future if for example a performance-based incentive (PBI) was offered The structure of PBIs typically produces cash flows for the project on an annual basis rather than a one-time payment during the construction year as is the case with CBIs For comparison Massachusetts many parts of which have a solar resource similar to Duluth offers a PBI of $055kWh15 If a similar incentive was available in Duluth either from the state or utility the LCOE for PV systems would become more competitive with retail electric rates Table 10 shows the predicted economics for PV systems in Duluth using PBIs from Massachusetts
Table 10 Predicted Real Levelized Cost of Energy Using a Performance-Based Incentive in Duluth
Real Payback Period Debt Development Scenario System Scale ndash Size LCOE or PPA price Fraction
($kWh) DEDA Purchase Commercial - 348 kW 0098 98 years 100
Private Purchase Commercial - 348 kW 0028 66 years 10
Private Purchase with PPA Commercial - 348 kW 0018 $0021kWh 40
DEDA Purchase Residential - 8 kW 0186 gt25 years 100
Private Purchase Residential - 10 kW 0022 86 years 50
14 In 2011 the average retail electricity price for commercial customers was $0103kWh Energy Information Administration Factors Affecting Electricity Prices Accessed August 2012 wwweiagovenergyexplainedindexcfmpage=electricity_factors_affecting_prices 15 For a complete description of incentives available in Massachusetts see httpwwwdsireusaorgincentivesindexcfmre=0ampee=0ampspv=0ampst=0ampsrp=1ampstate=MA
31
Although the existing economics currently limit the feasibility of PV in Duluth financing options separate from the ones considered in this study may provide DEDA with a viable means to implement a PV system at the Atlas Industrial Park Future site developers may in fact be able to install a small or large PV system at a price comparable to retail electric rates with a creative financial model and changes to existing economics Additionally DEDA may be able to facilitate the development of a standalone system using alternative financing For example a public-private partnership with MP an energy services company or currentfuture site developers to create a solar demonstration project could be a beneficial arrangement to all stakeholders By leasing the land for a nominal fee DEDA could provide a developer with a highly visible site to build a large commercial-scale ground-mounted PV system The energy from a PV system could be fed directly into MPrsquos electric grid to satisfy the statersquos RES andor used on-site by IKONICS or other site developers In addition if VNM becomes an option a solar garden approach could be used whereby off-site electric customers could purchase a stake in the system on a per-kilowatt-hour or module basis16
It is recommended that DEDA further pursue opportunities for a PV installation at the Atlas Industrial Park A renewable energy project aligns closely with Duluthrsquos vision for the redevelopment of the St Louis River corridor and the Atlas Industrial Park in particular could provide a valuable opportunity for a highly visible demonstration project for the city and solar developer to gain experience with large PV systems Although this report finds that traditional financing opportunities are not economically feasible at this time due to existing incentives and low electricity rates creative partnerships and financing may facilitate a PV installation at the Atlas Industrial Park in the short term Additionally changes in electric rates incentives and module costs could make a PV system more cost-competitive with grid-purchased electricity in the years to come
16 For a list of solar gardens by state see wwwsolargardensorg 32
Appendix A Solar Access Measurements
Figure A-1 Solar access measurements for the Atlas Industrial Park PV site
33
Appendix B Results from PVWatts Table B-1 PVWatts Inputs
Station Identification Cell ID 14913 State Minnesota Latitude 4683deg N Longitude 9218deg W
PV System Specifications DC Rating 100 kW DC to AC Derate Factor 08 AC Rating 08 kW Array Type Fixed Tilt Array Tilt 20deg Array Azimuth 180deg
Energy Specifications Cost of Electricity $005kWh
Table B-2 Performance Results for a 20-Degree Tilt System
Solar Radiation AC Energy Energy Value Month (kWhm2day) (kWh) ($) 1 249 67 335
2 344 83 415
3 483 126 630
4 499 120 600
5 590 140 700
6 620 139 695
7 597 135 675
8 549 126 630
9 430 99 495
10 331 80 400
11 209 50 250
12 194 50 250
Year 425 1216 6080
34
Table B-3 Performance Results for a Tilt = Latitude (468deg) Fixed-Tilt System
Month Solar Radiation (kWhm2day)
AC Energy (kWh)
Energy Value ($)
1 329 90 450
2 427 104 520
3 541 141 705
4 499 119 595
5 542 127 635
6 551 122 610
7 536 120 600
8 526 120 600
9 448 102 510
10 385 94 470
11 261 63 315
12 261 69 345
Year 442 1271 6355
Table B-4 Performance Results for Zero-Degree Single-Axis System
Month Solar Radiation (kWhm2day)
AC Energy (kWh)
Energy Value ($)
1 237 64 320
2 351 86 430
3 538 143 715
4 579 142 710
5 744 180 900
6 799 183 915
7 765 177 885
8 665 156 780
9 491 115 575
10 347 86 430
11 203 48 240
12 180 46 230
Year 492 1427 7135
35
1
2
3
4
5
6
7
8
9
10
11
12
Table B-5 Performance Results for Zero-Degree Double-Axis System
Solar Radiation AC Energy Energy Value Month (kWhm2day) (kWh) ($) 398 109 545
516 126 630
667 175 875
648 158 790
796 192 960
846 194 970
810 186 930
725 168 840
570 133 665
462 114 570
308 76 380
314 84 420
Year 589 1714 8570
36
Appendix C Results of the SAM AnalysisTable C-1 Table C-2 and Table C-3 are summary output tables from SAM that show the five scenarios analyzed in this study
Table C-1 DEDA Purchase Scenario
DEDA Purchase - 8 kW DEDA Purchase - 348 kW Net Annual Energy 9726 kWh Net Annual Energy 423073 kWh LCOE Nominal 3915 centkWh LCOE Nominal 4416 centkWh LCOE Real 3012 centkWh LCOE Real 3398 centkWh First-Year Revenue without system $0 First-Year Revenue without system $0 First-Year Revenue with System $0 First-Year Revenue with System $0 First-Year Net Revenue $0 First-Year Net Revenue $0 After-Tax Net Present Value -$48432 After-Tax NPV -$2376681 Payback Period gt25 years Payback Period gt25 years Capacity Factor 139 Capacity Factor 139 First Year kWhACkWDC 1216 First Year kWhACkWDC 1216
Table C-2 Third-Party Purchase Without PPA
Third Party - 10 kW Third Party - 348 kW Net Annual Energy 12157 kWh Net Annual Energy 423073 kWh LCOE Nominal 1588 centkWh LCOE Nominal 1880 centkWh LCOE Real 1260 centkWh LCOE Real 1493 centkWh First-Year Revenue without system $0 First-Year Revenue without system $0 First-Year Revenue with System $0 First-Year Revenue with System $0 First-Year Net Revenue $0 First-Year Net Revenue $0 After-Tax Net Present Value -$18991 After-Tax NPV -$782657 Payback Period gt25 years Payback Period gt25 years Capacity Factor 139 Capacity Factor 139 First Year kWhACkWDC 1216 First Year kWhACkWDC 1216
37
Table C-3 Commercial-Scale PPA Scenario
Third PartyPPA - 348 kW Net Annual Energy 423073 kWh PPA Price 3515 centkWh LCOE Nominal 3967 centkWh LCOE Real 3149 centkWh After-Tax IRR 15 Pre-Tax Min DSCRa 125 After-Tax Net Present Value $185576 PPA Price Escalation 150 Debt Fraction 50 Capacity Factor 139 First Year kWhDCkWAC 1216 a Debt service coverage ratio
Figure C-1 Module cost versus real levelized cost of energy for grid parity
0 2 4 6 8
10 12 14 16 18 20
01 03 05 07 09 11 13 15 17 19
Rea
l LC
OE
(centk
Wh)
Module Cost ($kW)
Module Cost vs Real LCOE for Grid-Parity
DEDA
Private
PPA
38
Appendix D Results of the JEDI Model Table D-1 and Table D-2 are output tables from the JEDI PV model for implementing a residential- and commercial-scale PV system in Duluth Minnesota
Table D-1 JEDI Results Residential-Scale System
Photovoltaic - Project Data Summary based on model default values
Project Location Minnesota Year of Construction or Installation 2013 Average System Size - DC Nameplate Capacity (kW) 9 Number of Systems Installed 1 Total Project Size - DC Nameplate Capacity (kW) 9
Small System Application Commercial
Crystalline Solar CellModule Material Silicon System Tracking Fixed Mount Base Installed System Cost ($kWDC) $7360 Annual Direct Operations and Maintenance Cost ($kW) $2600 Money Value - Current or Constant (Dollar Year) 2012 Project Construction or Installation Cost $66240 Local Spending $42955
Total Annual Operational Expenses $7918 Direct Operating and Maintenance Costs $234 Local Spending $213
Other Annual Costs $7684 Local Spending $0 Debt Payments $0 Property Taxes $0
Local Economic Impacts - Summary Results
Jobs Earnings Output During construction and installation period $000 (2012) $000 (2012)
Project Development and On-site Labor Impacts
Construction and Installation Labor 01 $60
Construction and Installation Related Services 02 $76 Subtotal 02 $136 $241
Module and Supply Chain Impacts Manufacturing 00 $00 $00 Trade (Wholesale and Retail) 00 $32 $92 Finance Insurance and Real Estate 00 $00 $00 Professional Services 01 $24 $75 Other Services 01 $38 $122
39
Other Sectors 01 $25 $60 Subtotal 02 $120 $349
Induced Impacts 02 $75 $243 Total Impacts 07 $331 $832
Annual Annual Annual Earnings Output
During operating years Jobs $000 (2012) $000 (2012) On-Site Labor Impacts PV Project Labor Only 00 $01 $01
Local Revenue and Supply Chain Impacts 00 $00 $01
Induced Impacts 00 $00 $01
Total Impacts 00 $02 $03
Notes Earnings and output values are thousands of dollars in year 2012 dollars Construction and operating period jobs are full-time equivalent for one year (1 FTE = 2080 hours) Economic impacts during operating years represent impacts that occur from systemplant operationsexpenditures Totals may not add up due to independent rounding
Detailed PV Project Data Costs
Purchased Manufactured Installation Costs Cost Locally () Locally (Y or N) Materials amp Equipment
Mounting (rails clamps fittings etc) $2619 100 N Modules $21010 100 N Electrical (wire connectors breakers etc) $1685 100 N Inverter $3792 100 N Subtotal $29106
Labor Installation $5972 100 Subtotal $5972
Subtotal $35078 Other Costs
Permitting $8378 100 Other Costs $3420 100 Business Overhead $19364 100 Subtotal $31162
Subtotal $66240 Sales Tax (Materials amp Equipment Purchases) $0 100 Total $66240
40
PV System Annual Operating and Maintenance Costs Cost Local Share Labor
Technicians $128 100 Subtotal $128
Materials and Services Materials amp Equipment $106 100 Services $0 100 Subtotal $106
Sales Tax (Materials amp Equipment Purchases) $0 100 Average Annual Payment (Interest and Principal) $7684 0 Property Taxes $0 100 Total $7918
Other Parameters Financial Parameters Debt Financing Percentage Financed 80 0 Years Financed (term) 10 Interest Rate 10
Tax Parameters Local Property Tax (percent of taxable value) 0 Assessed Value (percent of construction cost) 0 Taxable Value (percent of assessed value) 0 Taxable Value $0 Property Tax Exemption (percent of local taxes) 100 Local Property Taxes $0 100 Local Sales Tax Rate 688 100 Sales Tax Exemption (percent of local taxes) 10000
Payroll Parameters Wage per hour Employer Payroll Overhead
Construction and Installation Labor Construction WorkersInstallers $2369 456 OampM Labor Technicians $2369 456
41
Table D-2 JEDI Results Commercial-Scale System
Photovoltaic - Project Data Summary Based on Model Default Values
Project Location Minnesota Year of Construction or Installation 2013 Average System Size - DC Nameplate Capacity (kW) 348 Number of Systems Installed 1 Total Project Size - DC Nameplate Capacity (kW) 348
Large System Application Commercial
Crystalline Solar CellModule Material Silicon System Tracking Fixed Mount Base Installed System Cost ($kWDC) $5790 Annual Direct Operations and Maintenance Cost ($kW) $2600 Money Value - Current or Constant (Dollar Year) 2012 Project Construction or Installation Cost $2014920 Local Spending $1205084
Total Annual Operational Expenses $242779 Direct Operating and Maintenance Costs $9048 Local Spending $8324
Other Annual Costs $233731 Local Spending $0 Debt Payments $0 Property Taxes $0
Local Economic Impacts - Summary Results
Jobs Earnings Output During construction and installation period $000 (2012) $000 (2012)
Project Development and On-site Labor Impacts
Construction and Installation Labor 30 $19120
Construction and Installation Related Services 41 $19810 Subtotal 70 $38930 $66240
Module and Supply Chain Impacts Manufacturing 00 $00 $00 Trade (Wholesale and Retail) 15 $10140 $28920 Finance Insurance and Real Estate 00 $00 $00 Professional Services 13 $6360 $19450 Other Services 14 $9900 $31740 Other Sectors 25 $7350 $18520 Subtotal 67 $33750 $98620
Induced Impacts 52 $20870 $67740 Total Impacts 189 $93550 $232600
42
Annual Annual Annual Earnings Output
During operating years Jobs $000 (2012) $000 (2012) On-Site Labor Impacts PV Project Labor Only 01 $500 $500
Local Revenue and Supply Chain Impacts 00 $170 $510 Induced Impacts 00 $100 $330 Total Impacts 01 $770 $1350
Notes Earnings and output values are thousands of dollars in year 2012 dollars Construction and operating period jobs are full-time equivalent for one year (1 FTE = 2080 hours) Economic impacts during operating years represent impacts that occur from systemplant operationsexpenditures Totals may not add up due to independent rounding
Detailed PV Project Data Costs
Purchased Manufactured Installation Costs Cost Locally () Locally (Y or N) Materials amp Equipment
Mounting (rails clamps fittings etc) $87998 100 N Modules $730706 100 N Electrical (wire connectors breakers etc) $61708 100 N Inverter $131884 100 N Subtotal $1012295
Labor Installation $191183 100 Subtotal $191183
Subtotal $1203478 Other Costs
Permitting $218164 100 Other Costs $89047 100 Business Overhead $504231 100 Subtotal $811442
Subtotal $2014920 Sales Tax (materials and equipment purchases) $0 100 Total $2014920
PV System Annual Operating and Maintenance Costs Cost Local Share Labor
Technicians $5429 100 Subtotal $5429
Materials and Services
43
Materials amp Equipment $3619 100 Services $0 100 Subtotal $3619
Sales Tax (materials and equipment purchases) $0 100 Average Annual Payment (interest and principal) $233731 0 Property Taxes $0 100 Total $242779
Other Parameters Financial Parameters Debt Financing Percentage Financed 80 0 Years Financed (term) 10 Interest Rate 10
Tax Parameters Local Property Tax (percent of taxable value) 0 Assessed Value (percent of construction cost) 0 Taxable Value (percent of assessed value) 0 Taxable Value $0 Property Tax Exemption (percent of local taxes) 100 Local Property Taxes $0 100 Local Sales Tax Rate 688 100 Sales Tax Exemption (percent of local taxes) 10000
Payroll Parameters Wage per hour Employer Payroll Overhead
Construction and Installation Labor Construction WorkersInstallers $2139 456 OampM Labor Technicians $2139 456
44
- Acknowledgments
- List of Acronyms
- Executive Summary
- Table of Contents
- List of Figures
- List of Tables
- 1 Study and Site Background
- 2 Development of a PV System on Brownfields
- 3 PV Systems
-
- 31 PV Overview
- 32 Major System Components
- 33 Siting Considerations
-
- 4 Proposed Installation Location Information
-
- 41 Atlas Industrial Park PV System
- 42 Utility-Resource Considerations
- 43 PV Site Solar Resource
- 44 Atlas Industrial Park Energy Usage
-
- 5 Economics and Performance
-
- 51 Assumptions and Input Data for Analysis
- 52 SAM Forecasted Economic Performance
- 53 Job Analysis and Impact
- 54 Financing Opportunities
-
- 6 Conclusions and Recommendations
- Appendix A Solar Access Measurements
- Appendix B Results from PVWatts
- Appendix C Results of the SAM Analysis
- Appendix D Results of the JEDI Model
-
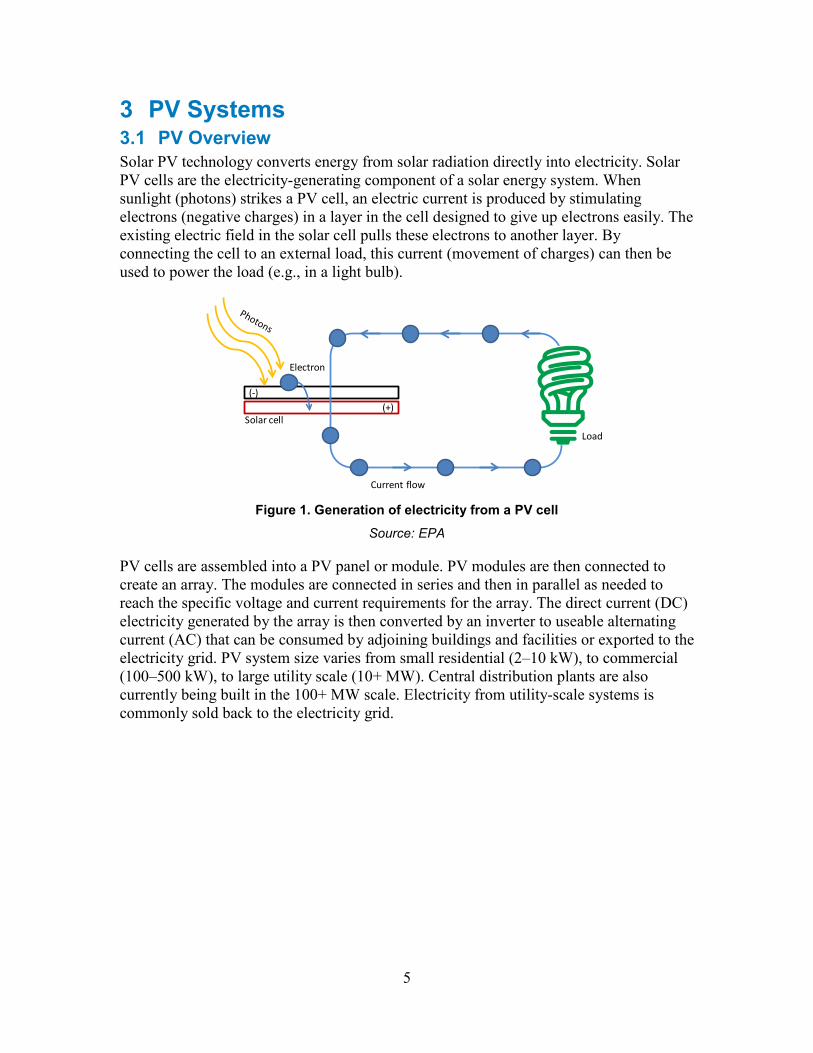
-
- -
-
-
- - -
3 PV Systems 31 PV Overview Solar PV technology converts energy from solar radiation directly into electricity Solar PV cells are the electricity-generating component of a solar energy system When sunlight (photons) strikes a PV cell an electric current is produced by stimulating electrons (negative charges) in a layer in the cell designed to give up electrons easily The existing electric field in the solar cell pulls these electrons to another layer By connecting the cell to an external load this current (movement of charges) can then be used to power the load (eg in a light bulb)
(-)
Solar cell
Figure 1 Generation of electricity from a PV cell
Source EPA
PV cells are assembled into a PV panel or module PV modules are then connected to create an array The modules are connected in series and then in parallel as needed to reach the specific voltage and current requirements for the array The direct current (DC) electricity generated by the array is then converted by an inverter to useable alternating current (AC) that can be consumed by adjoining buildings and facilities or exported to the electricity grid PV system size varies from small residential (2ndash10 kW) to commercial (100ndash500 kW) to large utility scale (10+ MW) Central distribution plants are also currently being built in the 100+ MW scale Electricity from utility-scale systems is commonly sold back to the electricity grid
(+)
Electron
Load
Current flow
5
32 Major System Components
Figure 2 Ground-mounted array diagram
Source NREL
A typical PV system is made up of several key components including
bull PV modules
bull Inverter
bull Balance-of-system (BOS) components These along with other PV system components are discussed below
321 PV Module Module technologies are differentiated by the type of PV material used resulting in a range of conversion efficiencies from light energy to electrical energy The module efficiency is a measure of the percentage of solar energy converted into electricity
Two common PV technologies that have been widely used for commercial and utility-scale projects are crystalline silicon and thin film
3211 Crystalline Silicon Traditional solar cells are made from silicon Silicon is quite abundant and nontoxic It builds on a strong industry on both supply (silicon industry) and product side This technology has been demonstrated for a consistent and high efficiency over 30 years in the field The performance degradation a reduction in power generation due to long-term exposure is under 1 per year Silicon modules have a lifespan in the 25ndash30-year range but can keep producing energy beyond this range
6
Typical overall efficiency of silicon solar panels is between 12 and 18 However some manufacturers of mono-crystalline panels claim an overall efficiency nearing 20 This range of efficiencies represents significant variation among the crystalline silicon technologies available The technology is generally divided into mono- and multi-crystalline technologies which indicates the presence of grain-boundaries (ie multiple crystals) in the cell materials and is controlled by raw material selection and manufacturing technique Crystalline silicon panels are widely used based on deployments worldwide
Figure 3 shows two examples of crystalline solar panels mono- and multi-silicon installed on tracking mounting systems
Source SunPower NREL PIX 23816 Source NREL PIX 13823
Figure 3 Mono- and multi-crystalline solar panels
3212 Thin Film Thin-film PV cells are made from amorphous silicon (a-Si) or non-silicon materials such as cadmium telluride (CdTe) Thin-film cells use layers of semiconductor materials only a few micrometers thick Due to the unique nature of thin films some thin-film cells are constructed into flexible modules enabling such applications as solar energy covers for landfills such as a geomembrane system Other thin-film modules are assembled into rigid constructions that can be used in fixed-tilt or in some cases tracking system configurations
The efficiency of thin-film solar cells is generally lower than for crystalline cells Current overall efficiency of a thin-film panel is 6ndash8 for a-Si and 11ndash12 for CdTe Figure 4 shows thin-film solar panels
Source Republic Services NREL PIX 23817 Source NREL PIX 14726 Source NREL PIX 17395
Figure 4 Thin-film solar panels installed on a solar energy cover (left) and fixed-tilt mounting system (middleright)
7
Industry-standard warranties of both crystalline and thin-film PV panels typically guarantee system performance of 80 of the rated power output for 25 years After 25 years they will continue producing electricity at a lower performance level
322 Inverter Inverters convert DC electricity from the PV array into AC and can connect seamlessly to the electricity grid Inverter efficiencies can be as high as 985
Inverters also sense the utility power frequency and synchronize the PV-produced power to that frequency When utility power is not present the inverter will stop producing AC power to prevent ldquoislandingrdquo or putting power into the grid while utility workers are trying to fix what they assume is a de-energized distribution system This safety feature is built into all grid-connected inverters in the market Electricity produced from the system may be fed to a step-up transformer to increase the voltage to match the grid
There are two primary types of inverters for grid-connected systems string and micro-inverters Each type has strengths and weaknesses and would be recommended for different types of installations
String inverters are most common and typically range in size from 15ndash1000 kW These inverters tend to be cheaper on a capacity basis as well as have high efficiency and lower operation and maintenance (OampM) costs String inverters offer various sizes and capacities to handle a large range of voltage output For larger systems string inverters are combined in parallel to produce a single point of interconnection with the grid Warranties are typically 10 years and extended warranties up to 20 years are possible for larger units Given that the expected life of PV panels is 25ndash30 years an operator can expect to replace a string inverter at least one time during the life of the PV system
Micro-inverters are dedicated to the conversion of a single PV modulersquos power output The AC output from each module is connected in parallel to create the array This technology is relatively new to the market and in limited use in larger systems due to the potential increase in OampM associated with significantly increasing the number of inverters in a given array Current micro-inverters range in size between 175 W and 380 W These inverters can be the most expensive option per watt of capacity Warranties range from 10ndash20 years Small projects with irregular modules and shading issues typically benefit from micro-inverters
With string inverters small amounts of shading on a solar panel will significantly affect the entire array production Instead it impacts only that shaded panel if micro-inverters are used Figure 5 shows a string inverter
8
Figure 5 String inverter
Source NREL PIX 07985
323 Balance-of-System Components In addition to the modules and inverter a PV system consists of other parts called BOS components which include
bull Mounting racks and hardware for the panels
bull Wiring for electrical connections
3231 Mounting Systems An array has to be secured and oriented optimally to maximize system output The structure holding the modules is referred to as the mounting system
32311 Ground-Mounted Systems For ground-mounted systems the mounting system can be either directly anchored into the ground (via driven piers or concrete footers) or ballasted on the surface without ground penetration Mounting systems must withstand local wind loads which range from 90ndash120 mph for most areas or 130 mph or more for areas with hurricane potential Depending on the region snow and ice loads must also be a design consideration for the mounting system For brownfields mounting system designs will be primarily driven by these considerations coupled with settlement concerns
Typical ground-mounted systems can be categorized as fixed tilt or tracking Fixed-tilt mounting structures consist of panels installed at a set angle typically based on site latitude and wind conditions to increase exposure to solar radiation throughout the year Fixed-tilt systems are used at many brownfield sites and have lower maintenance costs but generate less energy (kWh) per unit power (kW) of capacity than tracking systems However energy density is often greater for fixed-tilt systems which require less area per module and are less prone to ldquoself-shadingrdquo than tracking systems although self-shading does increase with panel-tilt for fixed-tilt systems requiring additional spacing between rows
9
Table 1 Energy Density by Panel and System
Fixed-Tilt Energy Single-Axis Tracking Energy System Type Density (DC-Wattsft2) Density (DC-Wattsft2) Crystalline Silicon 40 33 Thin Film 33 27 Hybrid High Efficiency 48 39
Tracking systems rotate the PV modules so they are following the sun as it moves across the sky This increases energy output but also increases maintenance and equipment costs slightly Single-axis tracking in which PV is rotated on a single axis can increase energy output by 25 or more With dual-axis tracking the module is able to directly face the sun all day potentially increasing energy output by 35 or more Depending on underlying soiling conditions single- and dual-axis trackers may not be suitable due to potential settlement effects which can interfere with the alignment requirements of such systems
The selection of mounting type is dependent on many factors including installation size electricity rates government incentives land constraints latitude and local weather Contaminated land applications may raise additional design considerations due to site conditions including differential settlement
Selection of the mounting system is also heavily dependent on anchoring or foundation selection The mounting system design will also need to meet applicable local building code requirements with respect to snow wind and seismic zones Selection of mounting types should also consider frost protection needs especially in cold regions such as New England
3232 Wiring for Electrical Connections Electrical connections including wiring disconnect switches fuses and breakers are required to meet electrical code (eg NEC Article 690) for both safety and equipment protection
In most traditional applications wiring from (1) the arrays to inverters and (2) inverters to point of interconnection is generally run as direct burial through trenches In brownfield applications this wiring may be required to run through above-ground conduit due to restrictions with ground penetration or other concerns Therefore developers should consider noting any such restrictions if applicable in requests for proposals in order to improve overall bid accuracy Similarly it is recommended that PV system vendors reflect these costs in the quote when costing out the overall system
3233 PV System Monitoring Monitoring PV systems can be essential for reliable functioning and maximum yield of a system It can be as simple as reading values such as produced AC power daily kilowatt-hours and cumulative kilowatt-hours locally on an LCD display on the inverter For more sophisticated monitoring and control purposes environmental data such as module temperature ambient temperature solar radiation and wind speed can be collected
10
Remote control and monitoring can be performed by various remote connections Systems can send alerts and status messages to the control center or user Data can be stored in the inverterrsquos memory or in external data loggers for further system analysis Collection of this basic information is standard for PV systems and not unique to landfill applications
Weather stations are typically installed in large-scale systems Weather data such as solar radiation and temperature can be used to predict energy production enabling comparison of the target and actual system output and performance and identification of under-performing arrays Operators may also use this data to identify for example required maintenance shade on panels and accumulating dirt on panels Monitoring system data can also be used for outreach and education This can be achieved with publicly available online displays wall-mounted systems or even smart phone applications
324 Operation and Maintenance PV panels typically have a 25-year performance warranty The inverters which come standard with a 10-year warranty (extended warranties available) would be expected to last 10ndash15 years System performance should be verified on a vendor-provided website Wire and rack connections should be checked annually This economic analysis uses an annual OampM cost computed as $30kWyr for the first 15 years and $20kWyr for the remaining 10 years which is based on the historical OampM costs of installed fixed-axis grid-tied PV systems The system should expect a replacement of system inverters in year 15 at a cost of $025W which has been amortized over the first 15 years of operation
33 Siting Considerations PV modules are very sensitive to shading When shaded (either partially or fully shaded) the panel is unable to optimally collect the high-energy beam radiation from the sun As explained above PV modules are made up of many individual cells that all produce a small amount of current and voltage These individual cells are connected in series to produce a larger current If an individual cell is shaded it acts as resistance to the whole series circuit impeding current flow and dissipating power rather than producing it
The NREL solar assessment team uses a Solmetric SunEye solar path calculator to assess shading at particular locations by analyzing the sky view where solar panels will be located By finding the solar access the NREL team can determine if the area is appropriate for solar panels Following the successful collection of solar resource data using the Solmetric SunEye tool and determination that the site is adequate for a solar installation an analysis to determine the ideal system size must be conducted System size depends highly on the average energy use of the facilities on the site PPAs available incentives and utility policy
11
4 Proposed Installation Location Information This section summarizes the findings of the NREL solar assessment site visit at the Atlas Industrial Park on April 17 2012
41 Atlas Industrial Park PV System In order to get the most out of the ground area available it is important to consider whether the site layout can be improved to better incorporate a PV system If there are structures fences vegetation or electrical poles that can be removed the un-shaded area can be increased to incorporate more PV panels From the information collected during the site visit the team concluded that 80 of the entire site could accommodate a PV system and the remaining 20 would be unusable due to roads topography vegetation or other restrictions
Typically a minimum of 2 useable acres is recommended to site PV systems Useable acreage is typically characterized as flat to gently sloping southern exposures that are free from obstructions and get full sun for at least a 6-hour period each day For example eligible space for PV includes under-utilized or unoccupied land vacant lots andor unused paved areas (eg a parking lot or industrial site space) as well as existing building rooftops
Figure 6 shows an aerial view of the Atlas Industrial Park taken from Google Earth showing the total feasible area (highlighted in orange) and electrical tie-in point for a PV system As shown there are large expanses of relatively flat un-shaded land which makes it a suitable candidate for a PV system The total area of the site that appears feasible for PV is 233 acres (1016969 ft2) which could support a 4-MW fixed-tilt system or a 33-MW single-axis tracking system
12
Figure 6 Aerial view of the feasible area for PV at the Atlas Industrial Park
Illustration made in Google Earth
Based on current development plans it is unlikely that the entire site will be utilized for a PV system Instead a smaller 2-acre parcel which was formerly the location of the Atlas Cement silos is being considered This site is shown in Figure 7 and could support a 348shykW fixed-tilt or 287-kW single-axis tracking PV system The difference in system size is due to the need for additional space to prevent self-shading between modules with tracking systems which also becomes more pronounced at higher tilt angles for fixed-tilt systems In addition if the existing vegetation could be removed along Commonwealth Avenue the available acreage and visibility could be increased
13
Figure 7 Aerial view of the 2-acre silo site for PV at the Atlas Industrial Park
Illustration made in Google Earth
PV systems are suitable for Duluth Minnesota where the average global horizontal annual solar resourcemdashthe total solar radiation for a given location including direct diffuse and ground-reflected radiationmdashis 433 kWhm2day For comparison Seattle Washington receives 367 kWhm2day and Tucson Arizona receives 613 kWhm2day4 Figures 8ndash11 show various views of the Atlas Industrial Park site taken during the site visit
4 PVWatts Viewer Accessed August 2012 httpgisatnrelnrelgovPVWatts_Viewerindexhtml 14
Figure 8 Northwest view of the Atlas Industrial Park
Photo by Lars Lisell NREL
Figure 9 East view of the Atlas Industrial Park
Photo by Lars Lisell NREL
15
Figure 10 Southeast view of the Atlas Industrial Park
Photo by Lars Lisell NREL
Figure 11 West view (near silo site) of the Atlas Industrial Park
Photo by Lars Lisell NREL
16
42 Utility-Resource Considerations When considering a ground-mounted system an electrical tie-in location should be identified to determine how it would be connected to the grid or on-site facilities The existing infrastructure at the Atlas Industrial Park is well suited for installation of a PV system The expected electrical tie-in and inverter location for the PV system at the Atlas Industrial Park is located at the MP electrical box east of the IKONICS building along the road into the site The proposed additional electric infrastructure might also be used as an alternative tie-in and inverter location and could add flexibility to the location of a PV system Additionally there are transmission and distribution lines crossing the southern portion of the property that could carry surplus electricity off-site The electrical tie-in point was not evaluated specifically for compatibility with a PV system and for the purposes of this analysis the site was assumed to need no additional infrastructure Before moving forward with a solar project however a grid integration study should be performed in order to determine definitively whether or not additional infrastructure will be needed to accommodate a PV system The expected electrical tie-in point is shown in Figure 12
Figure 12 Potential electrical tie-in point for the PV system at the Atlas Industrial Park showing the IKONICS building and meter in the background
Photo by Lars Lisell NREL
17
43 PV Site Solar Resource The Atlas Industrial Park site has been evaluated to determine the adequacy of the solar resource available using both on-site data and industry tools The assessment team for this feasibility study collected multiple Solmetric SunEye data points and found an annual solar access of 95 and estimated solar resource of 419 kWhm2day The data gathered using this tool is available in Appendix A
The predicted array performance was found using PVWatts Version 25 for Duluth Minnesota For this summary array performance information a hypothetical system size of 1 kW was used to show the estimated production for each kilowatt It is scaled linearly so that additional analyses can be performed to match the proposed system size Table 2 shows the annual performance results of four different system configurations in Duluth Minnesota as calculated by PVWatts The monthly results for each system type are available in Appendix B
Table 2 Performance Results for 1-kW PV Systems in Duluth Minnesota
System Type AC Energy (kWhyr)
Increase from Fixed 20deg Tilt
Fixed Tilt 20deg Tilt 1216 0
Fixed Tilt 468deg Tilt (latitude) 1271 45
Single-Axis Tracking 1427 173
Double-Axis Tracking 1714 410
44 Atlas Industrial Park Energy Usage Understanding the energy use of a site will enable a full analysis of whether or not energy produced would need to be sold or if it could offset on-site energy use Currently the Atlas Industrial Park does not have any energy-consuming infrastructure in place However a PV system could be used to offset adjacent facilities such as the IKONICS building or on-site energy use from future development
441 Net Metering Net metering is an electricity policy for consumers who own renewable energy facilities Net in this context is used to mean what remains after deductionsmdashin this case the deduction of any energy outflows from metered energy inflows Under net metering a system owner receives retail credit for at least a portion of the electricity it generates As part of the Energy Policy Act of 2005 under Sec 1251 all public electric utilities are required upon request to make net metering available to their customers6
5 NREL Renewable Resource Data Center ndash PVWatts Accessed September 2012 httpwwwnrelgovrredcpvwatts6 Energy Policy Act of 2005 Title XIImdashElectricity Subtitle EmdashAmendments to PURPA Section 1251mdash Net Metering and Additional Standards Accessed January 9 2013 httpwwwgpogovfdsyspkgPLAWshy109publ58pdfPLAW-109publ58pdf
18
(11) NET METERINGmdashEach electric utility shall make available upon request net metering service to any electric consumer that the electric utility serves For purposes of this paragraph the term lsquonet metering servicersquo means service to an electric consumer under which electric energy generated by that electric consumer from an eligible on-site generating facility and delivered to the local distribution facilities may be used to offset electric energy provided by the electric utility to the electric consumer during the applicable billing period
Minnesotarsquos net-metering law7 which took effect in 1983 requires utilities to offer net metering to all customers with solar and wind-energy systems up to 40 kW
Renewable energy certificates (RECs) also known as green certificates green tags or tradable renewable certificates are tradable commodities in the United States that represent proof of electric energy generation from eligible renewable energy resources (renewable electricity) The RECs that are associated with the electricity produced and are used on-site remain with the customer-generator If however the customer chooses to receive financial compensation for the net electricity generation remaining after a 12shymonth period the utility will be granted the RECs associated with only that surplus they purchase Minnesota currently participates in the Midwest Renewable Energy Tracking System (M-RETS) which uses production data from participating generators to create RECs in the form of digital tradable certificates for each megawatt-hour8
442 Virtual Net Metering Some states and utilities allow for virtual net metering (VNM) often referred to as community solar or solar gardens This arrangement can allow certain entities such as a local government to install renewable generation at one location within its geographic boundary and to generate credits that can be used to offset charges at one or more other locations within the same geographic boundary Currently neither MP nor the State of Minnesota offer VNM
7 For the full text of this bill see httpwwwdsireusaorgincentivesincentivecfmIncentive_Code=MN01Rampre=0ampee=08 Midwest Renewable Energy Tracking System Accessed August 2012 wwwmretsnet
19
5 Economics and Performance The economics and performance of a PV system installed on the site was evaluated using a combination of the assumptions and background information discussed previously as well as a number of industry-specific inputs determined by other studies In particular this study used the NREL System Advisor Model (SAM)9
SAM is a performance and economic model designed to facilitate decision making for people involved in the renewable energy industry ranging from project managers and engineers to incentive program designers technology developers and researchers
SAM makes performance predictions for grid-connected solar solar water heating wind and geothermal power systems and makes economic calculations for both projects that buy and sell power at retail rates and power projects that sell power through a PPA
SAM consists of a performance model and financial model The performance model calculates a systems energy output on an hourly basis (sub-hourly simulations are available for some technologies) The financial model calculates annual project cash flows over a period of years for a range of financing structures for residential commercial and utility projects
SAM makes performance predictions for grid-connected solar small wind and geothermal power systems and economic estimates for distributed energy and central generation projects The model calculates the cost of generating electricity based on information you provide about a projects location installation and operating costs type of financing applicable tax credits and incentives and system specifications
51 Assumptions and Input Data for Analysis Cost of a PV system depends on the system size and other factors such as geographic location mounting structure and type of PV module Based on significant cost reductions seen in recent years the average cost for utility-scale ground-mounted systems have declined from $480W in the first quarter (Q1) of 2010 to $290W in Q1 2012 Costs for smaller commercial and residential-scale systems have also declined steadily to $463W and $589W respectively The lower cost of utility-scale systems reflects increased economies of scale which allows fixed costs to be spread over a larger project budget With an increasing demand and supply the potential for further cost reduction is expected as market conditions evolve Figure 13 shows the cost per watt of PV systems from 2010 to 2012 for residential commercial (non-residential) and utility-scale installations
9 For additional information on SAM see httpssamnrelgovcost 20
Figure 13 Solar market insight Q1 2012 national weighted average system prices10
Credit Solar Energy Industries Association
For this analysis the installed cost of fixed-tilt ground-mounted commercial- and residential-scale systems was assumed to be $579W and $736W respectively The increased cost is because of limitations placed on design and construction methods due to the ground conditions at the site and is estimated to be 25 for a ballasted system Such limitations include restrictions on storm water runoff weight loading of construction equipment inability to trench for utility lines additional engineering costs permitting issues and non-standard ballasted racking systems The installed system cost assumptions for commercial- and residential-scale systems are summarized in Table 3
Table 3 Installed Fixed-Tilt System Cost Assumptions
System Size Commercial ($W)
Residential ($W)
Baseline system 463 589 With ballast 116 147 Total installed cost 579 736
These prices include the PV array and the BOS components for each system including the inverter and electrical equipment as well as the installation cost This includes estimated taxes and a national-average labor rate but does not include land cost The economics of grid-tied PV depend on incentives the cost of electricity the solar resource
10 Data and figure from the Solar Energy Industries Association SEIAGTM Research US Solar Market Insight Report 2012 Q1 Accessed August 2012 httpwwwseiaorgresearch-resourcessolar-marketshyinsight-report-2012-q1
21
and panel tilt and orientation For this analysis the cost of electricity was assumed to be $005kWh an average of MPrsquos commercial rates11
It was assumed for this analysis that relevant federal incentives are received It is important to consider all applicable incentives or grants to make PV as cost effective as possible If the PV system is owned by a private tax-paying entity this entity may qualify for federal tax credits and accelerated depreciation on the PV system which can be worth about 15 of the initial capital investment The total potential tax benefits to the taxshypaying entity can be as high as 45 of the initial system cost Because state and federal governments do not pay taxes private ownership of the PV system would be required to capture tax incentives
MPrsquos current solar electric incentive program SolarSense uses a CBI structure with a cap of $20000 The program budget for 2012 has been fully committed and the utility is currently evaluating the results for next yearrsquos program Due to the uncertainty of next yearrsquos incentive structure this analysis limited the incentive to the base level Table 4 shows the incentive levels for the SolarSense program
Table 4 Minnesota Powerrsquos 2012 SolarSense Program Incentive Levels
Incentive Level ($kW) Base incentive 2000 Non-profittax exempt owner 500 Minnesota-made modules 1000 NABCEP certified installers 250
For the purposes of this analysis three development scenarios were considered for installing a PV system at the site
1 DEDA purchase
2 Private purchase and use
3 Private development with a PPA
For each scenario the project is expected to have a 25-year life although the systems can be reasonably expected to continue operation past this point The panels are assumed to have a 05 per year degradation in performance A system DC-to-AC conversion of 80 was assumed which includes losses in the inverter wire losses PV module losses and losses due to temperature effects Inflation is assumed to be 25 and the loan rate is assumed to be 6 for each scenario The OampM expenses are estimated to be $30kWyear during the first 15 years and then $20kWyear for years 16ndash25 A fixed 20deg-tilt system was used as a baseline for evaluating the economics of PV at the site The exact system design is beyond the scope of this study and will depend on additional site-specific analysis and input from stakeholders The assumptions and inputs for each scenario are included in Table 5 with the differences highlighted
11 Minnesota Power commercial rates Accessed August 2012 httpwwwmnpowercomcustomer_serviceyour_billdocumentsFinal_4961apdf
22
Table 5 SAM Inputs and Assumptions
Parameter DEDA Purchase Private PurchasePPA Analysis period (years) 25 25 Inflation 250 250 Real discount rate 300 585 Federal tax rate 0 3500 State tax rate 0 980 Insurance ( of installed cost) 050 050 Property tax 000 000 Construction loan 000 000 Loan term (years) 25 15 Loan rate 600 600 Debt fraction 10000 5000 Minimum IRR na na 1500 PPA escalation rate na na 150 Federal depreciation na Custom 5-year MACRSa
State depreciation na na Federal ITC na 3000 Capacity-based incentive $250kW $200kW Degradation 050 050 Operational availability 10000 10000 Cost - fixed axis per kW $579 $579 Grid interconnection cost 0 0 OampM $30kWyr for years 1-15 amp $20kWyr for years 16-25 DC-AC derate factor 8000 8000 Tilt 20deg 20deg a Modified Accelerated Cost Recovery System
The PVWatts calculation engine within SAM was used to calculate expected energy performance for the system based on system size configuration and solar resource System size was calculated from the available land area this analysis was restricted to the 2-acre silo site and determined to be 348 kW for a fixed-tilt system and 287 kW for a single-axis tracking system Additionally this study evaluated smaller residential-scale systems which are favored by the current incentive structure from MP
52 SAM Forecasted Economic Performance Using the inputs and assumptions summarized above the SAM tool predicts the levelized cost of energy (LCOE) payback period and PPA price for a PV system at the Atlas Industrial Park Table 6 summarizes the results of the economic analysis for the system configurations and development scenarios considered in this study The entire results are available in Appendix C
23
Table 6 Atlas Industrial Park PV System Summary
PV System Type System Scale System Sizea Array Tilt Annual Output Number of Houses
Poweredb
(kW) (deg) (kWhyear)
Crystalline Silicon (Fixed Tilt) Commercial 348 200 423073 38
Crystalline Silicon (Fixed Tilt) Residential 10 200 12157 11
Crystalline Silicon (Fixed Tilt) Residential 8 200 9726 09
Development Scenario System Scale - Size System Cost LCOE Real LCOE Nominal Payback Period ($kWh) ($kWh) or PPA Price
DEDA Purchase Commercial - 348 kW 2014920 $ 034 044 gt25 years
Private Purchase Commercial - 348 kW 2014920 $ 015 019 gt25 years
Private Purchase with PPA Commercial - 348 kW 2014920 $ 031 040 $031kWh
DEDA Purchase Residential - 8 kW 58880 $ 030 039 gt25 years
Private Purchase Residential - 10 kW 73600 $ 013 016 gt25 years
a Data assume a maximum usable area of 2 acres
Number of average American households that could hypothetically be powered by the PV system assuming 11040 b
kWhyearhousehold
In each case the results indicate that the LCOE and PPA price would be significantly higher than the retail commercial rate of $005kWh Although the current CBI and incentive cap favor smaller residential-scale systems the increased cost per watt compared to larger commercial-scale systems also limits the economic feasibility of these systems
Figures 14 and 15 show the optimal size for a residential-scale PV system based on current base-level CBIs The inputs and assumptions were kept the same as the commercial-scale system however the module cost was increased to $736W reflecting current market data for residential systems Again the LCOE for each scenario was found to be significantly higher than the current retail commercial electricity rate The optimal system size is 8 kW for the DEDA purchase scenario and 10 kW for the private purchase scenario In each case adding CBIs would decrease the optimal system size by reaching the incentive cap with a smaller system
24
LCO
E (cent
kW
h)
LCO
E (cent
kW
h)
0 5
10 15 20 25 30 35 40 45 50
1 2 3 4 5 6 7 8 9 10 11 12 13 14 15 Nameplate Capacity (kW)
DEDA Purchase
LCOE Real
LCOE Nominal
Figure 14 Optimal system size for a DEDA-purchased residential-scale system
0 5
10 15 20 25 30 35 40 45 50
1 2 3 4 5 6 7 8 9 10 11 12 13 14 15 Nameplate Capacity (kW)
Private Purchase
LCOE Real
LCOE Nominal
Figure 15 Optimal system size for a privately purchased residential-scale system
Due to the uncertainty of future incentives and high LCOE for PV in Duluth this study evaluated grid-paritymdashthe point at which PV might become cost-competitive with grid-purchased electricity Table 7 summarizes the result of the grid-parity analysis showing the module cost at which the real LCOE (without incentives) becomes cost-competitive with the current price of electricity The results indicate that significant decreases in module costs would be necessary to compete with grid-purchased electricity Grid parity could occur in Duluth as module costs continue to decline and incentives for PV evolve in the coming years The entire results of this analysis are available in Appendix C
25
Table 7 Predicted Real Module Cost for Grid Parity ($005kWh)
Module Cost ($kW) DEDA Purchase 060 Private Purchase 110 Private PPA 040
53 Job Analysis and Impact To evaluate the impact on employment and economic impacts of the PV project associated with this analysis the NREL Jobs and Economic Development Impact (JEDI) model was used12 The JEDI models are tools that estimate the economic impacts associated with the construction and operation of distributed generation power plants It is a flexible input-output tool that estimates but does not precisely predict the number of jobs and economic impacts that can be reasonably supported by the proposed facility
The JEDI models represent the entire economy including cross-industry or cross-company impacts For example JEDI estimates the impact that the installation of a distributed generation facility would have on not only the manufacturers of PV modules and inverters but also the associated construction materials metal fabrication industry project management support transportation and other industries that are required to enable the procurement and installation of the complete system
For this analysis inputs including the estimated installed project cost ($kW) targeted year of construction system capacity (kW) OampM costs ($kW) and location were entered into the model to predict the jobs and economic impact It is important to note that the JEDI model does not predict or incorporate any displacement of related economic activity or alternative jobs due to the implementation of the proposed project As such the JEDI model results are considered gross estimates as opposed to net estimates Table 8 shows the assumed values for the Atlas Industrial Park
Table 8 JEDI Analysis Assumptions
Assumed Value Assumed Value Input Residential Commercial Capacity 9 kW 348 kW
Year Placed In Service 2013 2013
Installed System Cost $736W $579W
Location Duluth MN Duluth MN
Using these inputs the JEDI tool estimates the gross direct indirect and induced jobs associated earnings and total economic impact supported by the construction and continued operation of the proposed PV system
12 The JEDI models have been used by the US Department of Energy the US Department of Agriculture NREL and the Lawrence Berkeley National Laboratory as well as a number of universities For information on the JEDI tool see httpwwwnrelgovanalysisjediabout_jedihtml
26
The estimates of jobs associated with this project are presented as either construction period jobs or sustained operations jobs Each job is expressed as a whole or fraction full-time equivalent (FTE) position An FTE is defined as one person working 40 hours per week for the duration of a year Construction period jobs are considered short-term positions that exist only during the procurement and construction periods Table 9 summarizes the results from the JEDI model analysis The full results are provided in Appendix D
Table 9 JEDI Summary Results
Residential System Commercial System Jobs during construction 07 189
Wages paid to workers $13600 $935500
Economic output during construction $24100 $2326000
Jobs during operating years 00 01
Earnings per year $200 $7700
Economic output per year $300 $13500
54 Financing Opportunities The procurement development construction and management of a successful distributed generation facility can be owned and financed a number of different ways The most common ownership and financing structures are described below
541 Owner and Operator Financing The owneroperator financing structure is characterized by a single entity with the financial strength to fund all of the solar project costs and if a private entity sufficient tax appetite to utilize all of the projectrsquos tax benefits Private ownersoperators typically establish a special purpose entity (SPE) that solely owns the assets of the project An initial equity investment into the SPE is funded by the private entity using existing funds and all of the projectrsquos cash flows and tax benefits are utilized by the entity This equity investment is typically matched with debt financing for the majority of the project costs Project debt is typically issued as a loan based on the ownersrsquooperatorsrsquo assets and equity in the project In addition private entities can utilize any of federal tax credits offered
For public entities that choose to finance own and operate a solar project funding can be raised as part of a larger general obligation bond as a standalone tax credit bond through a tax-exempt lease structure bank financing grant and incentive programs or internal cash or some combination of the above Federal qualified energy conservation bonds (QECBs)13 can also be used to finance renewable energy as well as energy efficiency projects Certain structures are more common than others and grant programs for solar programs are on the decline Regardless as tax-exempt entities public entities
13 Department of Energy Solution Center Qualified Energy Conservation Bonds Accessed January 10 2013 httpwww1eereenergygovwipsolutioncenterfinancialproductsqecbhtml
27
are unable to benefit directly from the various tax-credit-based incentives available to private companies This has given way to the now common use of third-party financing structures such as the PPA
542 Third-Party Developers with Power Purchase Agreements Because many project site hosts do not have the financial or technical capabilities to develop a capital intensive project many times they turn to third-party developers (andor their investors) In exchange for access to a site through a lease or easement arrangement third-party developers will finance develop own and operate solar projects utilizing their own expertise and sources of tax equity financing and debt capital Once the system is installed the third-party developer will sell the electricity to the site host or local utility via a PPAmdasha contract to sell electricity at a negotiated rate over a fixed period of time The PPA typically will be between the third-party developer and the site host if it is a retail ldquobehind-the-meterrdquo transaction or directly with an electric utility if it is a wholesale transaction
Site hosts benefit by either receiving competitively priced electricity from the project via the PPA or land lease revenues for making the site available to the solar developer via a lease payment This lease payment can take on the form of either a revenue-sharing agreement or an annual lease payment In addition third-party developers are able to utilize federal tax credits For public entities this arrangement allows them to utilize the benefits of the tax credits (low PPA price higher lease payment) while not directly receiving them The term of PPAs typically varies from 20ndash25 years
543 Third-Party ldquoFliprdquo Agreements The most common use of a third-party ldquofliprdquo agreement is a site host working with a third-party developer who then partners with a tax-motivated investor in an SPE that would own and operate the project Initially most of the equity provided to the SPE would come from the tax investor and most of the benefit would flow to the tax investor (as much as 99) When the tax investor has fully monetized the tax benefits and achieved an agreed-upon rate of return the allocation of benefits and majority ownership (95) would flip to the site host (but not within the first 5 years) After the flip the site host would have the option to buy out all or most of the tax investorsrsquo interest in the project at the fair market value of the tax investorrsquos remaining interest
A flip agreement can also be signed between a developer and investors within an SPE where the investor would begin with the majority ownership Eventually the ownership would flip to the developer once the investorsrsquo return is met
544 Hybrid Financial Structures As the solar market evolves hybrid financial solutions have been developed in certain instances to finance solar projects A particular structure nicknamed ldquoThe Morris Modelrdquo after Morris County New Jersey combines highly rated public debt a capital lease and a PPA Low-interest public debt replaces more costly financing available to the solar developer and contributes to a very attractive PPA price for the site hosts New markets tax credits have been combined with PPAs and public debt in other locations such as Denver and Salt Lake City
28
545 Solar Services Agreement and Operating Lease The Solar Services Agreement (SSA) and operating lease business models have been predominately used in the municipal and cooperative utility markets due to its treatment of tax benefits and the rules limiting federal tax benefit transfers from non-profit to for-profit companies Under IRS guidelines municipalities cannot enter capital leases with for-profit entities when the for-profit entities capture tax incentives As a result a number of business models have emerged as a work-around to this issue One model is the SSA wherein a private party sells ldquosolar servicesrdquo (ie energy and RECs) to a municipality over a specified contract period (typically long enough for the private party to accrue the tax credits) The non-profit utility typically purchases the solar services with either a oneshytime up-front payment equal to the turn-key system cost minus the 30 federal tax credit or may purchase the services in annual installments The municipality may buy out the system once the third-party has accrued the tax credits but because of IRS regulations the buyout of the plant cannot be included as part of the SSA (ie the SSA cannot be used as a vehicle for a sale and must be a separate transaction)
Similar to the SSA there are a variety of lease options that are available to municipalities that allow the capture of tax benefits by third-party owners which result in a lower cost to the municipality These include an operating lease for solar services (as opposed to an equipment capital lease) and a complex business model called a ldquosaleleasebackrdquo
546 SaleLeaseback In the saleleaseback model the public or private entity installs the PV system sells it to a tax investor and then leases it back As the lessee they are responsible for operating and maintaining the PV system as well as have the right to sell or use the power In exchange for use of the PV system the public or private entity would make lease payments to the tax investor (the lessor) The tax investor would have rights to federal tax benefits generated by the project and the lease payments Sometimes the entity is allowed to buy back the project at 100 fair market value after the tax benefits are exhausted
547 Community Solar GardensSolar The concept of ldquocommunity solarrdquo is one in which the costs and benefits of one large solar project are shared by a number of participants A site owner may be able to make the land available for a large solar project which can be the basis for a community solar project Ownership structures for these projects vary but the large projects are typically owned or sponsored by a local utility Community solar gardens are distributed solar projects wherein utility customers have a stake via a pro-rated share of the projectrsquos energy output This business model is targeted to meet demand for solar projects by customers who rentlease homes or businesses do not have good solar access at their site or do not want to install a PV system on their facilities Customer pro-rated shares of solar projects are acquired through a long-term transferrable lease of one or more panels or they subscribe to a share of the project in terms of a specific level of energy output or the energy output of a set amount of capacity Under the customer lease option the customer receives a billing credit for the number of kilowatt-hours their pro-rated share of the solar project produces each month it is also known as VNM Under the customer subscription option the customers typically pay a set price for a block of solar energy
29
(ie 100 kWh per month blocks) from the community solar project Other models include monthly energy outputs from a specific investment dollar amount or a specific number of panels
Community solar garden and customer subscription-based projects can be owned solely by the utility owned solely by third-party developers with facilitation of billing provided by the utility or be a joint venture between the utility and a third-party developer leading to eventual ownership by the utility after the tax benefits have been absorbed by the third-party developer
There are some states that offer solar incentives for community solar projects including Washington State (production incentive) and Utah (state income tax credit) Community solar is known as solar gardens depending on the location (eg Colorado) Solar gardens are not currently offered in Minnesota but if approved by the Minnesota public utility commission could be an effective way to make the Atlas site a sustainable office park
30
6 Conclusions and Recommendations From a technical standpoint the Atlas Industrial Park is a suitable area in which to implement a PV project with an adequate land area and solar resource However the existing economics specific to Duluth currently limit the feasibility of a PV system there As summarized in Section 5 the economic analysis completed using SAM predicts an LCOE significantly higher than the current retail rate which is approximately half the national average14 Additionally MPrsquos current incentive structure favors smaller systems by using a capacity-based approach with a relatively low incentive cap Based on current economics the most cost-competitive scenario is a privately owned residential-scale system used to offset on-site energy use with larger systems also predicted to have lower LCOEs than either the DEDA purchase or PPA scenarios
Future changes to electric rates module costs and incentives may make PV in Duluth cost-competitive with grid-purchased electricity Continued increases in electric rates combined with decreases in module costs will reduce the gap between grid-purchased electricity and distributed generation In addition changes to MPrsquos current incentive structure or the addition of incentives from the state could further reduce the LCOE of PV systems in the future if for example a performance-based incentive (PBI) was offered The structure of PBIs typically produces cash flows for the project on an annual basis rather than a one-time payment during the construction year as is the case with CBIs For comparison Massachusetts many parts of which have a solar resource similar to Duluth offers a PBI of $055kWh15 If a similar incentive was available in Duluth either from the state or utility the LCOE for PV systems would become more competitive with retail electric rates Table 10 shows the predicted economics for PV systems in Duluth using PBIs from Massachusetts
Table 10 Predicted Real Levelized Cost of Energy Using a Performance-Based Incentive in Duluth
Real Payback Period Debt Development Scenario System Scale ndash Size LCOE or PPA price Fraction
($kWh) DEDA Purchase Commercial - 348 kW 0098 98 years 100
Private Purchase Commercial - 348 kW 0028 66 years 10
Private Purchase with PPA Commercial - 348 kW 0018 $0021kWh 40
DEDA Purchase Residential - 8 kW 0186 gt25 years 100
Private Purchase Residential - 10 kW 0022 86 years 50
14 In 2011 the average retail electricity price for commercial customers was $0103kWh Energy Information Administration Factors Affecting Electricity Prices Accessed August 2012 wwweiagovenergyexplainedindexcfmpage=electricity_factors_affecting_prices 15 For a complete description of incentives available in Massachusetts see httpwwwdsireusaorgincentivesindexcfmre=0ampee=0ampspv=0ampst=0ampsrp=1ampstate=MA
31
Although the existing economics currently limit the feasibility of PV in Duluth financing options separate from the ones considered in this study may provide DEDA with a viable means to implement a PV system at the Atlas Industrial Park Future site developers may in fact be able to install a small or large PV system at a price comparable to retail electric rates with a creative financial model and changes to existing economics Additionally DEDA may be able to facilitate the development of a standalone system using alternative financing For example a public-private partnership with MP an energy services company or currentfuture site developers to create a solar demonstration project could be a beneficial arrangement to all stakeholders By leasing the land for a nominal fee DEDA could provide a developer with a highly visible site to build a large commercial-scale ground-mounted PV system The energy from a PV system could be fed directly into MPrsquos electric grid to satisfy the statersquos RES andor used on-site by IKONICS or other site developers In addition if VNM becomes an option a solar garden approach could be used whereby off-site electric customers could purchase a stake in the system on a per-kilowatt-hour or module basis16
It is recommended that DEDA further pursue opportunities for a PV installation at the Atlas Industrial Park A renewable energy project aligns closely with Duluthrsquos vision for the redevelopment of the St Louis River corridor and the Atlas Industrial Park in particular could provide a valuable opportunity for a highly visible demonstration project for the city and solar developer to gain experience with large PV systems Although this report finds that traditional financing opportunities are not economically feasible at this time due to existing incentives and low electricity rates creative partnerships and financing may facilitate a PV installation at the Atlas Industrial Park in the short term Additionally changes in electric rates incentives and module costs could make a PV system more cost-competitive with grid-purchased electricity in the years to come
16 For a list of solar gardens by state see wwwsolargardensorg 32
Appendix A Solar Access Measurements
Figure A-1 Solar access measurements for the Atlas Industrial Park PV site
33
Appendix B Results from PVWatts Table B-1 PVWatts Inputs
Station Identification Cell ID 14913 State Minnesota Latitude 4683deg N Longitude 9218deg W
PV System Specifications DC Rating 100 kW DC to AC Derate Factor 08 AC Rating 08 kW Array Type Fixed Tilt Array Tilt 20deg Array Azimuth 180deg
Energy Specifications Cost of Electricity $005kWh
Table B-2 Performance Results for a 20-Degree Tilt System
Solar Radiation AC Energy Energy Value Month (kWhm2day) (kWh) ($) 1 249 67 335
2 344 83 415
3 483 126 630
4 499 120 600
5 590 140 700
6 620 139 695
7 597 135 675
8 549 126 630
9 430 99 495
10 331 80 400
11 209 50 250
12 194 50 250
Year 425 1216 6080
34
Table B-3 Performance Results for a Tilt = Latitude (468deg) Fixed-Tilt System
Month Solar Radiation (kWhm2day)
AC Energy (kWh)
Energy Value ($)
1 329 90 450
2 427 104 520
3 541 141 705
4 499 119 595
5 542 127 635
6 551 122 610
7 536 120 600
8 526 120 600
9 448 102 510
10 385 94 470
11 261 63 315
12 261 69 345
Year 442 1271 6355
Table B-4 Performance Results for Zero-Degree Single-Axis System
Month Solar Radiation (kWhm2day)
AC Energy (kWh)
Energy Value ($)
1 237 64 320
2 351 86 430
3 538 143 715
4 579 142 710
5 744 180 900
6 799 183 915
7 765 177 885
8 665 156 780
9 491 115 575
10 347 86 430
11 203 48 240
12 180 46 230
Year 492 1427 7135
35
1
2
3
4
5
6
7
8
9
10
11
12
Table B-5 Performance Results for Zero-Degree Double-Axis System
Solar Radiation AC Energy Energy Value Month (kWhm2day) (kWh) ($) 398 109 545
516 126 630
667 175 875
648 158 790
796 192 960
846 194 970
810 186 930
725 168 840
570 133 665
462 114 570
308 76 380
314 84 420
Year 589 1714 8570
36
Appendix C Results of the SAM AnalysisTable C-1 Table C-2 and Table C-3 are summary output tables from SAM that show the five scenarios analyzed in this study
Table C-1 DEDA Purchase Scenario
DEDA Purchase - 8 kW DEDA Purchase - 348 kW Net Annual Energy 9726 kWh Net Annual Energy 423073 kWh LCOE Nominal 3915 centkWh LCOE Nominal 4416 centkWh LCOE Real 3012 centkWh LCOE Real 3398 centkWh First-Year Revenue without system $0 First-Year Revenue without system $0 First-Year Revenue with System $0 First-Year Revenue with System $0 First-Year Net Revenue $0 First-Year Net Revenue $0 After-Tax Net Present Value -$48432 After-Tax NPV -$2376681 Payback Period gt25 years Payback Period gt25 years Capacity Factor 139 Capacity Factor 139 First Year kWhACkWDC 1216 First Year kWhACkWDC 1216
Table C-2 Third-Party Purchase Without PPA
Third Party - 10 kW Third Party - 348 kW Net Annual Energy 12157 kWh Net Annual Energy 423073 kWh LCOE Nominal 1588 centkWh LCOE Nominal 1880 centkWh LCOE Real 1260 centkWh LCOE Real 1493 centkWh First-Year Revenue without system $0 First-Year Revenue without system $0 First-Year Revenue with System $0 First-Year Revenue with System $0 First-Year Net Revenue $0 First-Year Net Revenue $0 After-Tax Net Present Value -$18991 After-Tax NPV -$782657 Payback Period gt25 years Payback Period gt25 years Capacity Factor 139 Capacity Factor 139 First Year kWhACkWDC 1216 First Year kWhACkWDC 1216
37
Table C-3 Commercial-Scale PPA Scenario
Third PartyPPA - 348 kW Net Annual Energy 423073 kWh PPA Price 3515 centkWh LCOE Nominal 3967 centkWh LCOE Real 3149 centkWh After-Tax IRR 15 Pre-Tax Min DSCRa 125 After-Tax Net Present Value $185576 PPA Price Escalation 150 Debt Fraction 50 Capacity Factor 139 First Year kWhDCkWAC 1216 a Debt service coverage ratio
Figure C-1 Module cost versus real levelized cost of energy for grid parity
0 2 4 6 8
10 12 14 16 18 20
01 03 05 07 09 11 13 15 17 19
Rea
l LC
OE
(centk
Wh)
Module Cost ($kW)
Module Cost vs Real LCOE for Grid-Parity
DEDA
Private
PPA
38
Appendix D Results of the JEDI Model Table D-1 and Table D-2 are output tables from the JEDI PV model for implementing a residential- and commercial-scale PV system in Duluth Minnesota
Table D-1 JEDI Results Residential-Scale System
Photovoltaic - Project Data Summary based on model default values
Project Location Minnesota Year of Construction or Installation 2013 Average System Size - DC Nameplate Capacity (kW) 9 Number of Systems Installed 1 Total Project Size - DC Nameplate Capacity (kW) 9
Small System Application Commercial
Crystalline Solar CellModule Material Silicon System Tracking Fixed Mount Base Installed System Cost ($kWDC) $7360 Annual Direct Operations and Maintenance Cost ($kW) $2600 Money Value - Current or Constant (Dollar Year) 2012 Project Construction or Installation Cost $66240 Local Spending $42955
Total Annual Operational Expenses $7918 Direct Operating and Maintenance Costs $234 Local Spending $213
Other Annual Costs $7684 Local Spending $0 Debt Payments $0 Property Taxes $0
Local Economic Impacts - Summary Results
Jobs Earnings Output During construction and installation period $000 (2012) $000 (2012)
Project Development and On-site Labor Impacts
Construction and Installation Labor 01 $60
Construction and Installation Related Services 02 $76 Subtotal 02 $136 $241
Module and Supply Chain Impacts Manufacturing 00 $00 $00 Trade (Wholesale and Retail) 00 $32 $92 Finance Insurance and Real Estate 00 $00 $00 Professional Services 01 $24 $75 Other Services 01 $38 $122
39
Other Sectors 01 $25 $60 Subtotal 02 $120 $349
Induced Impacts 02 $75 $243 Total Impacts 07 $331 $832
Annual Annual Annual Earnings Output
During operating years Jobs $000 (2012) $000 (2012) On-Site Labor Impacts PV Project Labor Only 00 $01 $01
Local Revenue and Supply Chain Impacts 00 $00 $01
Induced Impacts 00 $00 $01
Total Impacts 00 $02 $03
Notes Earnings and output values are thousands of dollars in year 2012 dollars Construction and operating period jobs are full-time equivalent for one year (1 FTE = 2080 hours) Economic impacts during operating years represent impacts that occur from systemplant operationsexpenditures Totals may not add up due to independent rounding
Detailed PV Project Data Costs
Purchased Manufactured Installation Costs Cost Locally () Locally (Y or N) Materials amp Equipment
Mounting (rails clamps fittings etc) $2619 100 N Modules $21010 100 N Electrical (wire connectors breakers etc) $1685 100 N Inverter $3792 100 N Subtotal $29106
Labor Installation $5972 100 Subtotal $5972
Subtotal $35078 Other Costs
Permitting $8378 100 Other Costs $3420 100 Business Overhead $19364 100 Subtotal $31162
Subtotal $66240 Sales Tax (Materials amp Equipment Purchases) $0 100 Total $66240
40
PV System Annual Operating and Maintenance Costs Cost Local Share Labor
Technicians $128 100 Subtotal $128
Materials and Services Materials amp Equipment $106 100 Services $0 100 Subtotal $106
Sales Tax (Materials amp Equipment Purchases) $0 100 Average Annual Payment (Interest and Principal) $7684 0 Property Taxes $0 100 Total $7918
Other Parameters Financial Parameters Debt Financing Percentage Financed 80 0 Years Financed (term) 10 Interest Rate 10
Tax Parameters Local Property Tax (percent of taxable value) 0 Assessed Value (percent of construction cost) 0 Taxable Value (percent of assessed value) 0 Taxable Value $0 Property Tax Exemption (percent of local taxes) 100 Local Property Taxes $0 100 Local Sales Tax Rate 688 100 Sales Tax Exemption (percent of local taxes) 10000
Payroll Parameters Wage per hour Employer Payroll Overhead
Construction and Installation Labor Construction WorkersInstallers $2369 456 OampM Labor Technicians $2369 456
41
Table D-2 JEDI Results Commercial-Scale System
Photovoltaic - Project Data Summary Based on Model Default Values
Project Location Minnesota Year of Construction or Installation 2013 Average System Size - DC Nameplate Capacity (kW) 348 Number of Systems Installed 1 Total Project Size - DC Nameplate Capacity (kW) 348
Large System Application Commercial
Crystalline Solar CellModule Material Silicon System Tracking Fixed Mount Base Installed System Cost ($kWDC) $5790 Annual Direct Operations and Maintenance Cost ($kW) $2600 Money Value - Current or Constant (Dollar Year) 2012 Project Construction or Installation Cost $2014920 Local Spending $1205084
Total Annual Operational Expenses $242779 Direct Operating and Maintenance Costs $9048 Local Spending $8324
Other Annual Costs $233731 Local Spending $0 Debt Payments $0 Property Taxes $0
Local Economic Impacts - Summary Results
Jobs Earnings Output During construction and installation period $000 (2012) $000 (2012)
Project Development and On-site Labor Impacts
Construction and Installation Labor 30 $19120
Construction and Installation Related Services 41 $19810 Subtotal 70 $38930 $66240
Module and Supply Chain Impacts Manufacturing 00 $00 $00 Trade (Wholesale and Retail) 15 $10140 $28920 Finance Insurance and Real Estate 00 $00 $00 Professional Services 13 $6360 $19450 Other Services 14 $9900 $31740 Other Sectors 25 $7350 $18520 Subtotal 67 $33750 $98620
Induced Impacts 52 $20870 $67740 Total Impacts 189 $93550 $232600
42
Annual Annual Annual Earnings Output
During operating years Jobs $000 (2012) $000 (2012) On-Site Labor Impacts PV Project Labor Only 01 $500 $500
Local Revenue and Supply Chain Impacts 00 $170 $510 Induced Impacts 00 $100 $330 Total Impacts 01 $770 $1350
Notes Earnings and output values are thousands of dollars in year 2012 dollars Construction and operating period jobs are full-time equivalent for one year (1 FTE = 2080 hours) Economic impacts during operating years represent impacts that occur from systemplant operationsexpenditures Totals may not add up due to independent rounding
Detailed PV Project Data Costs
Purchased Manufactured Installation Costs Cost Locally () Locally (Y or N) Materials amp Equipment
Mounting (rails clamps fittings etc) $87998 100 N Modules $730706 100 N Electrical (wire connectors breakers etc) $61708 100 N Inverter $131884 100 N Subtotal $1012295
Labor Installation $191183 100 Subtotal $191183
Subtotal $1203478 Other Costs
Permitting $218164 100 Other Costs $89047 100 Business Overhead $504231 100 Subtotal $811442
Subtotal $2014920 Sales Tax (materials and equipment purchases) $0 100 Total $2014920
PV System Annual Operating and Maintenance Costs Cost Local Share Labor
Technicians $5429 100 Subtotal $5429
Materials and Services
43
Materials amp Equipment $3619 100 Services $0 100 Subtotal $3619
Sales Tax (materials and equipment purchases) $0 100 Average Annual Payment (interest and principal) $233731 0 Property Taxes $0 100 Total $242779
Other Parameters Financial Parameters Debt Financing Percentage Financed 80 0 Years Financed (term) 10 Interest Rate 10
Tax Parameters Local Property Tax (percent of taxable value) 0 Assessed Value (percent of construction cost) 0 Taxable Value (percent of assessed value) 0 Taxable Value $0 Property Tax Exemption (percent of local taxes) 100 Local Property Taxes $0 100 Local Sales Tax Rate 688 100 Sales Tax Exemption (percent of local taxes) 10000
Payroll Parameters Wage per hour Employer Payroll Overhead
Construction and Installation Labor Construction WorkersInstallers $2139 456 OampM Labor Technicians $2139 456
44
- Acknowledgments
- List of Acronyms
- Executive Summary
- Table of Contents
- List of Figures
- List of Tables
- 1 Study and Site Background
- 2 Development of a PV System on Brownfields
- 3 PV Systems
-
- 31 PV Overview
- 32 Major System Components
- 33 Siting Considerations
-
- 4 Proposed Installation Location Information
-
- 41 Atlas Industrial Park PV System
- 42 Utility-Resource Considerations
- 43 PV Site Solar Resource
- 44 Atlas Industrial Park Energy Usage
-
- 5 Economics and Performance
-
- 51 Assumptions and Input Data for Analysis
- 52 SAM Forecasted Economic Performance
- 53 Job Analysis and Impact
- 54 Financing Opportunities
-
- 6 Conclusions and Recommendations
- Appendix A Solar Access Measurements
- Appendix B Results from PVWatts
- Appendix C Results of the SAM Analysis
- Appendix D Results of the JEDI Model
-
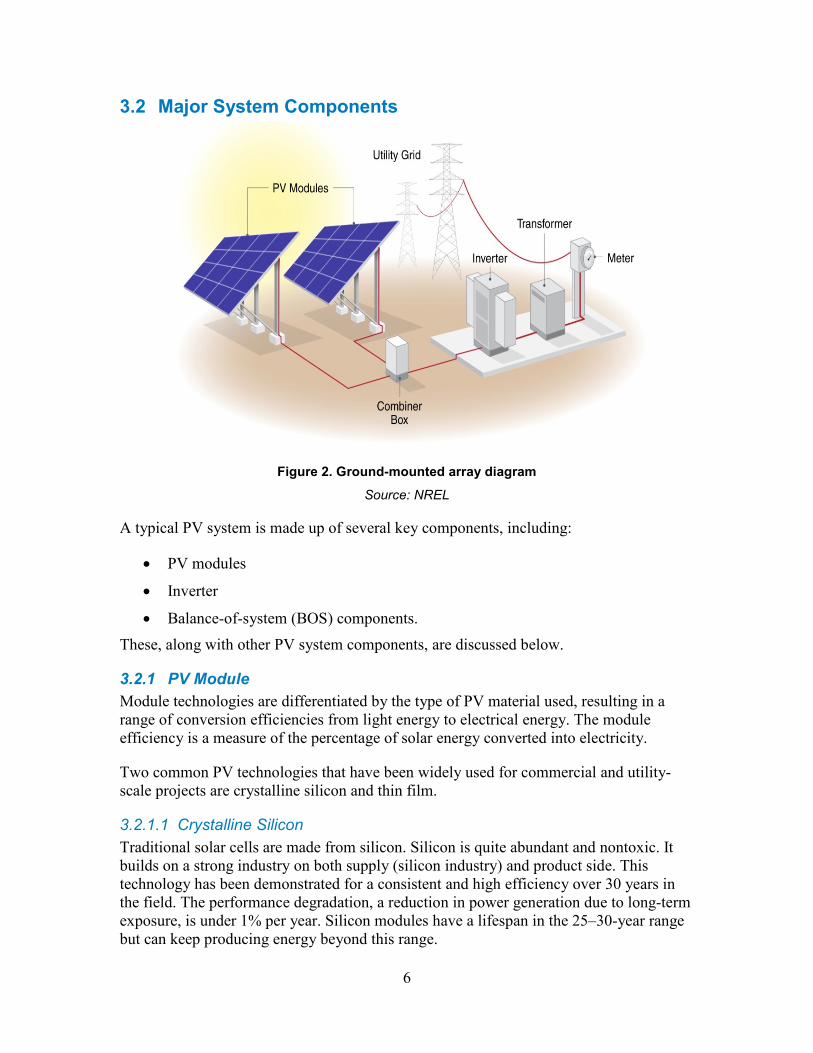
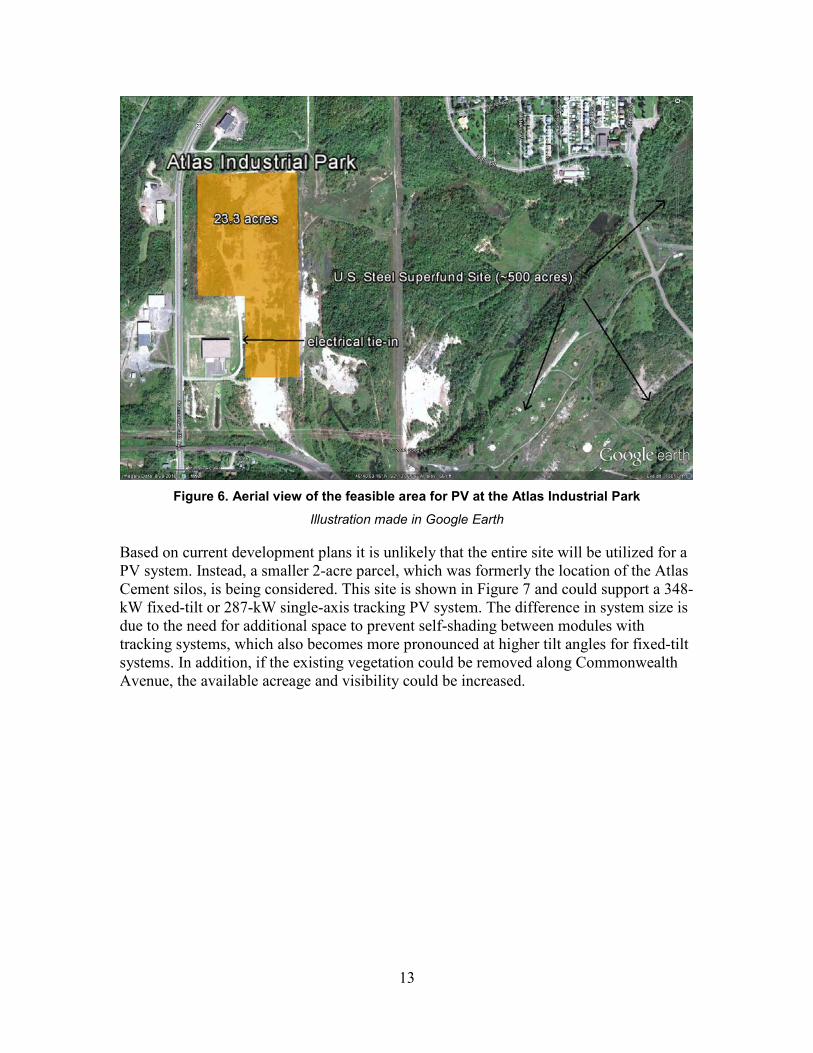
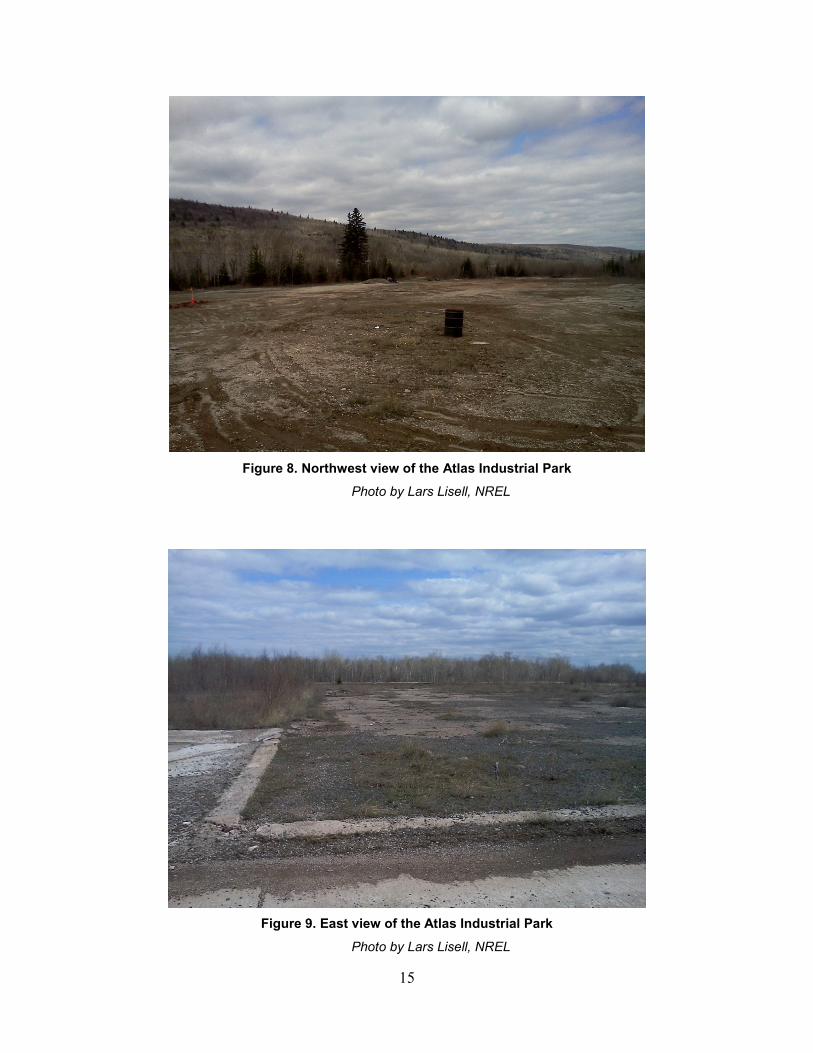
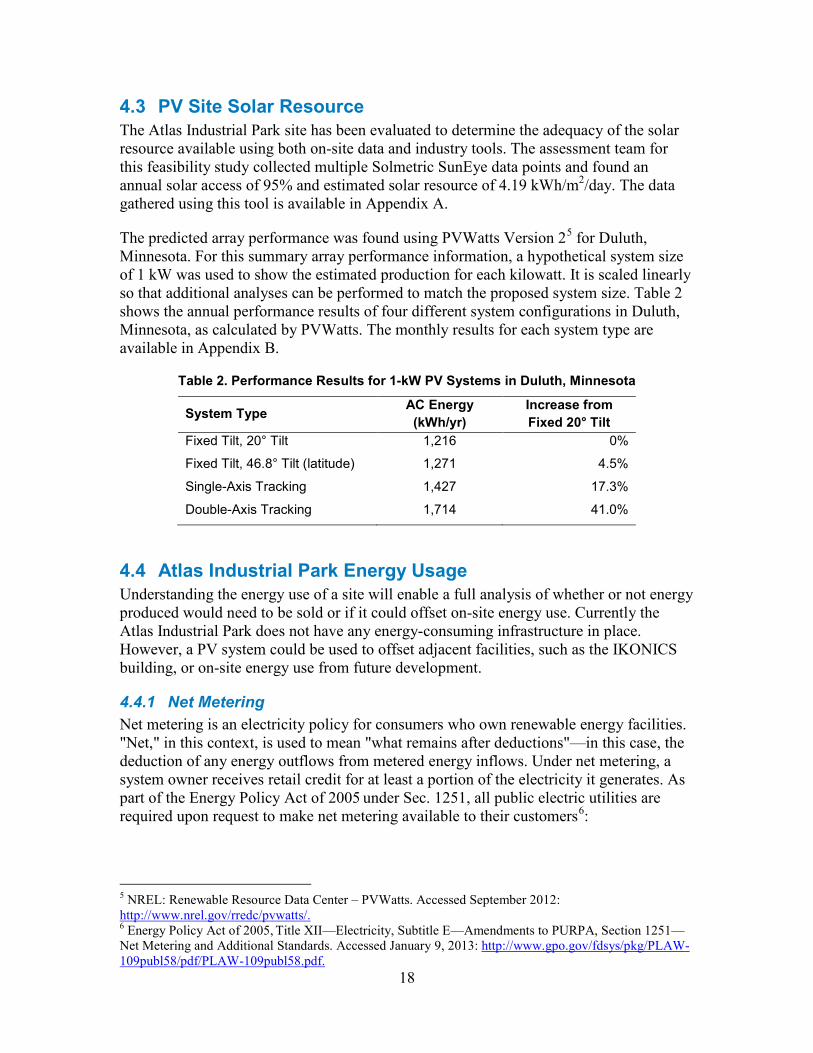

LCO
E (cent
kW
h)
LCO
E (cent
kW
h)
0 5
10 15 20 25 30 35 40 45 50
1 2 3 4 5 6 7 8 9 10 11 12 13 14 15 Nameplate Capacity (kW)
DEDA Purchase
LCOE Real
LCOE Nominal
Figure 14 Optimal system size for a DEDA-purchased residential-scale system
0 5
10 15 20 25 30 35 40 45 50
1 2 3 4 5 6 7 8 9 10 11 12 13 14 15 Nameplate Capacity (kW)
Private Purchase
LCOE Real
LCOE Nominal
Figure 15 Optimal system size for a privately purchased residential-scale system
Due to the uncertainty of future incentives and high LCOE for PV in Duluth this study evaluated grid-paritymdashthe point at which PV might become cost-competitive with grid-purchased electricity Table 7 summarizes the result of the grid-parity analysis showing the module cost at which the real LCOE (without incentives) becomes cost-competitive with the current price of electricity The results indicate that significant decreases in module costs would be necessary to compete with grid-purchased electricity Grid parity could occur in Duluth as module costs continue to decline and incentives for PV evolve in the coming years The entire results of this analysis are available in Appendix C
25
Table 7 Predicted Real Module Cost for Grid Parity ($005kWh)
Module Cost ($kW) DEDA Purchase 060 Private Purchase 110 Private PPA 040
53 Job Analysis and Impact To evaluate the impact on employment and economic impacts of the PV project associated with this analysis the NREL Jobs and Economic Development Impact (JEDI) model was used12 The JEDI models are tools that estimate the economic impacts associated with the construction and operation of distributed generation power plants It is a flexible input-output tool that estimates but does not precisely predict the number of jobs and economic impacts that can be reasonably supported by the proposed facility
The JEDI models represent the entire economy including cross-industry or cross-company impacts For example JEDI estimates the impact that the installation of a distributed generation facility would have on not only the manufacturers of PV modules and inverters but also the associated construction materials metal fabrication industry project management support transportation and other industries that are required to enable the procurement and installation of the complete system
For this analysis inputs including the estimated installed project cost ($kW) targeted year of construction system capacity (kW) OampM costs ($kW) and location were entered into the model to predict the jobs and economic impact It is important to note that the JEDI model does not predict or incorporate any displacement of related economic activity or alternative jobs due to the implementation of the proposed project As such the JEDI model results are considered gross estimates as opposed to net estimates Table 8 shows the assumed values for the Atlas Industrial Park
Table 8 JEDI Analysis Assumptions
Assumed Value Assumed Value Input Residential Commercial Capacity 9 kW 348 kW
Year Placed In Service 2013 2013
Installed System Cost $736W $579W
Location Duluth MN Duluth MN
Using these inputs the JEDI tool estimates the gross direct indirect and induced jobs associated earnings and total economic impact supported by the construction and continued operation of the proposed PV system
12 The JEDI models have been used by the US Department of Energy the US Department of Agriculture NREL and the Lawrence Berkeley National Laboratory as well as a number of universities For information on the JEDI tool see httpwwwnrelgovanalysisjediabout_jedihtml
26
The estimates of jobs associated with this project are presented as either construction period jobs or sustained operations jobs Each job is expressed as a whole or fraction full-time equivalent (FTE) position An FTE is defined as one person working 40 hours per week for the duration of a year Construction period jobs are considered short-term positions that exist only during the procurement and construction periods Table 9 summarizes the results from the JEDI model analysis The full results are provided in Appendix D
Table 9 JEDI Summary Results
Residential System Commercial System Jobs during construction 07 189
Wages paid to workers $13600 $935500
Economic output during construction $24100 $2326000
Jobs during operating years 00 01
Earnings per year $200 $7700
Economic output per year $300 $13500
54 Financing Opportunities The procurement development construction and management of a successful distributed generation facility can be owned and financed a number of different ways The most common ownership and financing structures are described below
541 Owner and Operator Financing The owneroperator financing structure is characterized by a single entity with the financial strength to fund all of the solar project costs and if a private entity sufficient tax appetite to utilize all of the projectrsquos tax benefits Private ownersoperators typically establish a special purpose entity (SPE) that solely owns the assets of the project An initial equity investment into the SPE is funded by the private entity using existing funds and all of the projectrsquos cash flows and tax benefits are utilized by the entity This equity investment is typically matched with debt financing for the majority of the project costs Project debt is typically issued as a loan based on the ownersrsquooperatorsrsquo assets and equity in the project In addition private entities can utilize any of federal tax credits offered
For public entities that choose to finance own and operate a solar project funding can be raised as part of a larger general obligation bond as a standalone tax credit bond through a tax-exempt lease structure bank financing grant and incentive programs or internal cash or some combination of the above Federal qualified energy conservation bonds (QECBs)13 can also be used to finance renewable energy as well as energy efficiency projects Certain structures are more common than others and grant programs for solar programs are on the decline Regardless as tax-exempt entities public entities
13 Department of Energy Solution Center Qualified Energy Conservation Bonds Accessed January 10 2013 httpwww1eereenergygovwipsolutioncenterfinancialproductsqecbhtml
27
are unable to benefit directly from the various tax-credit-based incentives available to private companies This has given way to the now common use of third-party financing structures such as the PPA
542 Third-Party Developers with Power Purchase Agreements Because many project site hosts do not have the financial or technical capabilities to develop a capital intensive project many times they turn to third-party developers (andor their investors) In exchange for access to a site through a lease or easement arrangement third-party developers will finance develop own and operate solar projects utilizing their own expertise and sources of tax equity financing and debt capital Once the system is installed the third-party developer will sell the electricity to the site host or local utility via a PPAmdasha contract to sell electricity at a negotiated rate over a fixed period of time The PPA typically will be between the third-party developer and the site host if it is a retail ldquobehind-the-meterrdquo transaction or directly with an electric utility if it is a wholesale transaction
Site hosts benefit by either receiving competitively priced electricity from the project via the PPA or land lease revenues for making the site available to the solar developer via a lease payment This lease payment can take on the form of either a revenue-sharing agreement or an annual lease payment In addition third-party developers are able to utilize federal tax credits For public entities this arrangement allows them to utilize the benefits of the tax credits (low PPA price higher lease payment) while not directly receiving them The term of PPAs typically varies from 20ndash25 years
543 Third-Party ldquoFliprdquo Agreements The most common use of a third-party ldquofliprdquo agreement is a site host working with a third-party developer who then partners with a tax-motivated investor in an SPE that would own and operate the project Initially most of the equity provided to the SPE would come from the tax investor and most of the benefit would flow to the tax investor (as much as 99) When the tax investor has fully monetized the tax benefits and achieved an agreed-upon rate of return the allocation of benefits and majority ownership (95) would flip to the site host (but not within the first 5 years) After the flip the site host would have the option to buy out all or most of the tax investorsrsquo interest in the project at the fair market value of the tax investorrsquos remaining interest
A flip agreement can also be signed between a developer and investors within an SPE where the investor would begin with the majority ownership Eventually the ownership would flip to the developer once the investorsrsquo return is met
544 Hybrid Financial Structures As the solar market evolves hybrid financial solutions have been developed in certain instances to finance solar projects A particular structure nicknamed ldquoThe Morris Modelrdquo after Morris County New Jersey combines highly rated public debt a capital lease and a PPA Low-interest public debt replaces more costly financing available to the solar developer and contributes to a very attractive PPA price for the site hosts New markets tax credits have been combined with PPAs and public debt in other locations such as Denver and Salt Lake City
28
545 Solar Services Agreement and Operating Lease The Solar Services Agreement (SSA) and operating lease business models have been predominately used in the municipal and cooperative utility markets due to its treatment of tax benefits and the rules limiting federal tax benefit transfers from non-profit to for-profit companies Under IRS guidelines municipalities cannot enter capital leases with for-profit entities when the for-profit entities capture tax incentives As a result a number of business models have emerged as a work-around to this issue One model is the SSA wherein a private party sells ldquosolar servicesrdquo (ie energy and RECs) to a municipality over a specified contract period (typically long enough for the private party to accrue the tax credits) The non-profit utility typically purchases the solar services with either a oneshytime up-front payment equal to the turn-key system cost minus the 30 federal tax credit or may purchase the services in annual installments The municipality may buy out the system once the third-party has accrued the tax credits but because of IRS regulations the buyout of the plant cannot be included as part of the SSA (ie the SSA cannot be used as a vehicle for a sale and must be a separate transaction)
Similar to the SSA there are a variety of lease options that are available to municipalities that allow the capture of tax benefits by third-party owners which result in a lower cost to the municipality These include an operating lease for solar services (as opposed to an equipment capital lease) and a complex business model called a ldquosaleleasebackrdquo
546 SaleLeaseback In the saleleaseback model the public or private entity installs the PV system sells it to a tax investor and then leases it back As the lessee they are responsible for operating and maintaining the PV system as well as have the right to sell or use the power In exchange for use of the PV system the public or private entity would make lease payments to the tax investor (the lessor) The tax investor would have rights to federal tax benefits generated by the project and the lease payments Sometimes the entity is allowed to buy back the project at 100 fair market value after the tax benefits are exhausted
547 Community Solar GardensSolar The concept of ldquocommunity solarrdquo is one in which the costs and benefits of one large solar project are shared by a number of participants A site owner may be able to make the land available for a large solar project which can be the basis for a community solar project Ownership structures for these projects vary but the large projects are typically owned or sponsored by a local utility Community solar gardens are distributed solar projects wherein utility customers have a stake via a pro-rated share of the projectrsquos energy output This business model is targeted to meet demand for solar projects by customers who rentlease homes or businesses do not have good solar access at their site or do not want to install a PV system on their facilities Customer pro-rated shares of solar projects are acquired through a long-term transferrable lease of one or more panels or they subscribe to a share of the project in terms of a specific level of energy output or the energy output of a set amount of capacity Under the customer lease option the customer receives a billing credit for the number of kilowatt-hours their pro-rated share of the solar project produces each month it is also known as VNM Under the customer subscription option the customers typically pay a set price for a block of solar energy
29
(ie 100 kWh per month blocks) from the community solar project Other models include monthly energy outputs from a specific investment dollar amount or a specific number of panels
Community solar garden and customer subscription-based projects can be owned solely by the utility owned solely by third-party developers with facilitation of billing provided by the utility or be a joint venture between the utility and a third-party developer leading to eventual ownership by the utility after the tax benefits have been absorbed by the third-party developer
There are some states that offer solar incentives for community solar projects including Washington State (production incentive) and Utah (state income tax credit) Community solar is known as solar gardens depending on the location (eg Colorado) Solar gardens are not currently offered in Minnesota but if approved by the Minnesota public utility commission could be an effective way to make the Atlas site a sustainable office park
30
6 Conclusions and Recommendations From a technical standpoint the Atlas Industrial Park is a suitable area in which to implement a PV project with an adequate land area and solar resource However the existing economics specific to Duluth currently limit the feasibility of a PV system there As summarized in Section 5 the economic analysis completed using SAM predicts an LCOE significantly higher than the current retail rate which is approximately half the national average14 Additionally MPrsquos current incentive structure favors smaller systems by using a capacity-based approach with a relatively low incentive cap Based on current economics the most cost-competitive scenario is a privately owned residential-scale system used to offset on-site energy use with larger systems also predicted to have lower LCOEs than either the DEDA purchase or PPA scenarios
Future changes to electric rates module costs and incentives may make PV in Duluth cost-competitive with grid-purchased electricity Continued increases in electric rates combined with decreases in module costs will reduce the gap between grid-purchased electricity and distributed generation In addition changes to MPrsquos current incentive structure or the addition of incentives from the state could further reduce the LCOE of PV systems in the future if for example a performance-based incentive (PBI) was offered The structure of PBIs typically produces cash flows for the project on an annual basis rather than a one-time payment during the construction year as is the case with CBIs For comparison Massachusetts many parts of which have a solar resource similar to Duluth offers a PBI of $055kWh15 If a similar incentive was available in Duluth either from the state or utility the LCOE for PV systems would become more competitive with retail electric rates Table 10 shows the predicted economics for PV systems in Duluth using PBIs from Massachusetts
Table 10 Predicted Real Levelized Cost of Energy Using a Performance-Based Incentive in Duluth
Real Payback Period Debt Development Scenario System Scale ndash Size LCOE or PPA price Fraction
($kWh) DEDA Purchase Commercial - 348 kW 0098 98 years 100
Private Purchase Commercial - 348 kW 0028 66 years 10
Private Purchase with PPA Commercial - 348 kW 0018 $0021kWh 40
DEDA Purchase Residential - 8 kW 0186 gt25 years 100
Private Purchase Residential - 10 kW 0022 86 years 50
14 In 2011 the average retail electricity price for commercial customers was $0103kWh Energy Information Administration Factors Affecting Electricity Prices Accessed August 2012 wwweiagovenergyexplainedindexcfmpage=electricity_factors_affecting_prices 15 For a complete description of incentives available in Massachusetts see httpwwwdsireusaorgincentivesindexcfmre=0ampee=0ampspv=0ampst=0ampsrp=1ampstate=MA
31
Although the existing economics currently limit the feasibility of PV in Duluth financing options separate from the ones considered in this study may provide DEDA with a viable means to implement a PV system at the Atlas Industrial Park Future site developers may in fact be able to install a small or large PV system at a price comparable to retail electric rates with a creative financial model and changes to existing economics Additionally DEDA may be able to facilitate the development of a standalone system using alternative financing For example a public-private partnership with MP an energy services company or currentfuture site developers to create a solar demonstration project could be a beneficial arrangement to all stakeholders By leasing the land for a nominal fee DEDA could provide a developer with a highly visible site to build a large commercial-scale ground-mounted PV system The energy from a PV system could be fed directly into MPrsquos electric grid to satisfy the statersquos RES andor used on-site by IKONICS or other site developers In addition if VNM becomes an option a solar garden approach could be used whereby off-site electric customers could purchase a stake in the system on a per-kilowatt-hour or module basis16
It is recommended that DEDA further pursue opportunities for a PV installation at the Atlas Industrial Park A renewable energy project aligns closely with Duluthrsquos vision for the redevelopment of the St Louis River corridor and the Atlas Industrial Park in particular could provide a valuable opportunity for a highly visible demonstration project for the city and solar developer to gain experience with large PV systems Although this report finds that traditional financing opportunities are not economically feasible at this time due to existing incentives and low electricity rates creative partnerships and financing may facilitate a PV installation at the Atlas Industrial Park in the short term Additionally changes in electric rates incentives and module costs could make a PV system more cost-competitive with grid-purchased electricity in the years to come
16 For a list of solar gardens by state see wwwsolargardensorg 32
Appendix A Solar Access Measurements
Figure A-1 Solar access measurements for the Atlas Industrial Park PV site
33
Appendix B Results from PVWatts Table B-1 PVWatts Inputs
Station Identification Cell ID 14913 State Minnesota Latitude 4683deg N Longitude 9218deg W
PV System Specifications DC Rating 100 kW DC to AC Derate Factor 08 AC Rating 08 kW Array Type Fixed Tilt Array Tilt 20deg Array Azimuth 180deg
Energy Specifications Cost of Electricity $005kWh
Table B-2 Performance Results for a 20-Degree Tilt System
Solar Radiation AC Energy Energy Value Month (kWhm2day) (kWh) ($) 1 249 67 335
2 344 83 415
3 483 126 630
4 499 120 600
5 590 140 700
6 620 139 695
7 597 135 675
8 549 126 630
9 430 99 495
10 331 80 400
11 209 50 250
12 194 50 250
Year 425 1216 6080
34
Table B-3 Performance Results for a Tilt = Latitude (468deg) Fixed-Tilt System
Month Solar Radiation (kWhm2day)
AC Energy (kWh)
Energy Value ($)
1 329 90 450
2 427 104 520
3 541 141 705
4 499 119 595
5 542 127 635
6 551 122 610
7 536 120 600
8 526 120 600
9 448 102 510
10 385 94 470
11 261 63 315
12 261 69 345
Year 442 1271 6355
Table B-4 Performance Results for Zero-Degree Single-Axis System
Month Solar Radiation (kWhm2day)
AC Energy (kWh)
Energy Value ($)
1 237 64 320
2 351 86 430
3 538 143 715
4 579 142 710
5 744 180 900
6 799 183 915
7 765 177 885
8 665 156 780
9 491 115 575
10 347 86 430
11 203 48 240
12 180 46 230
Year 492 1427 7135
35
1
2
3
4
5
6
7
8
9
10
11
12
Table B-5 Performance Results for Zero-Degree Double-Axis System
Solar Radiation AC Energy Energy Value Month (kWhm2day) (kWh) ($) 398 109 545
516 126 630
667 175 875
648 158 790
796 192 960
846 194 970
810 186 930
725 168 840
570 133 665
462 114 570
308 76 380
314 84 420
Year 589 1714 8570
36
Appendix C Results of the SAM AnalysisTable C-1 Table C-2 and Table C-3 are summary output tables from SAM that show the five scenarios analyzed in this study
Table C-1 DEDA Purchase Scenario
DEDA Purchase - 8 kW DEDA Purchase - 348 kW Net Annual Energy 9726 kWh Net Annual Energy 423073 kWh LCOE Nominal 3915 centkWh LCOE Nominal 4416 centkWh LCOE Real 3012 centkWh LCOE Real 3398 centkWh First-Year Revenue without system $0 First-Year Revenue without system $0 First-Year Revenue with System $0 First-Year Revenue with System $0 First-Year Net Revenue $0 First-Year Net Revenue $0 After-Tax Net Present Value -$48432 After-Tax NPV -$2376681 Payback Period gt25 years Payback Period gt25 years Capacity Factor 139 Capacity Factor 139 First Year kWhACkWDC 1216 First Year kWhACkWDC 1216
Table C-2 Third-Party Purchase Without PPA
Third Party - 10 kW Third Party - 348 kW Net Annual Energy 12157 kWh Net Annual Energy 423073 kWh LCOE Nominal 1588 centkWh LCOE Nominal 1880 centkWh LCOE Real 1260 centkWh LCOE Real 1493 centkWh First-Year Revenue without system $0 First-Year Revenue without system $0 First-Year Revenue with System $0 First-Year Revenue with System $0 First-Year Net Revenue $0 First-Year Net Revenue $0 After-Tax Net Present Value -$18991 After-Tax NPV -$782657 Payback Period gt25 years Payback Period gt25 years Capacity Factor 139 Capacity Factor 139 First Year kWhACkWDC 1216 First Year kWhACkWDC 1216
37
Table C-3 Commercial-Scale PPA Scenario
Third PartyPPA - 348 kW Net Annual Energy 423073 kWh PPA Price 3515 centkWh LCOE Nominal 3967 centkWh LCOE Real 3149 centkWh After-Tax IRR 15 Pre-Tax Min DSCRa 125 After-Tax Net Present Value $185576 PPA Price Escalation 150 Debt Fraction 50 Capacity Factor 139 First Year kWhDCkWAC 1216 a Debt service coverage ratio
Figure C-1 Module cost versus real levelized cost of energy for grid parity
0 2 4 6 8
10 12 14 16 18 20
01 03 05 07 09 11 13 15 17 19
Rea
l LC
OE
(centk
Wh)
Module Cost ($kW)
Module Cost vs Real LCOE for Grid-Parity
DEDA
Private
PPA
38
Appendix D Results of the JEDI Model Table D-1 and Table D-2 are output tables from the JEDI PV model for implementing a residential- and commercial-scale PV system in Duluth Minnesota
Table D-1 JEDI Results Residential-Scale System
Photovoltaic - Project Data Summary based on model default values
Project Location Minnesota Year of Construction or Installation 2013 Average System Size - DC Nameplate Capacity (kW) 9 Number of Systems Installed 1 Total Project Size - DC Nameplate Capacity (kW) 9
Small System Application Commercial
Crystalline Solar CellModule Material Silicon System Tracking Fixed Mount Base Installed System Cost ($kWDC) $7360 Annual Direct Operations and Maintenance Cost ($kW) $2600 Money Value - Current or Constant (Dollar Year) 2012 Project Construction or Installation Cost $66240 Local Spending $42955
Total Annual Operational Expenses $7918 Direct Operating and Maintenance Costs $234 Local Spending $213
Other Annual Costs $7684 Local Spending $0 Debt Payments $0 Property Taxes $0
Local Economic Impacts - Summary Results
Jobs Earnings Output During construction and installation period $000 (2012) $000 (2012)
Project Development and On-site Labor Impacts
Construction and Installation Labor 01 $60
Construction and Installation Related Services 02 $76 Subtotal 02 $136 $241
Module and Supply Chain Impacts Manufacturing 00 $00 $00 Trade (Wholesale and Retail) 00 $32 $92 Finance Insurance and Real Estate 00 $00 $00 Professional Services 01 $24 $75 Other Services 01 $38 $122
39
Other Sectors 01 $25 $60 Subtotal 02 $120 $349
Induced Impacts 02 $75 $243 Total Impacts 07 $331 $832
Annual Annual Annual Earnings Output
During operating years Jobs $000 (2012) $000 (2012) On-Site Labor Impacts PV Project Labor Only 00 $01 $01
Local Revenue and Supply Chain Impacts 00 $00 $01
Induced Impacts 00 $00 $01
Total Impacts 00 $02 $03
Notes Earnings and output values are thousands of dollars in year 2012 dollars Construction and operating period jobs are full-time equivalent for one year (1 FTE = 2080 hours) Economic impacts during operating years represent impacts that occur from systemplant operationsexpenditures Totals may not add up due to independent rounding
Detailed PV Project Data Costs
Purchased Manufactured Installation Costs Cost Locally () Locally (Y or N) Materials amp Equipment
Mounting (rails clamps fittings etc) $2619 100 N Modules $21010 100 N Electrical (wire connectors breakers etc) $1685 100 N Inverter $3792 100 N Subtotal $29106
Labor Installation $5972 100 Subtotal $5972
Subtotal $35078 Other Costs
Permitting $8378 100 Other Costs $3420 100 Business Overhead $19364 100 Subtotal $31162
Subtotal $66240 Sales Tax (Materials amp Equipment Purchases) $0 100 Total $66240
40
PV System Annual Operating and Maintenance Costs Cost Local Share Labor
Technicians $128 100 Subtotal $128
Materials and Services Materials amp Equipment $106 100 Services $0 100 Subtotal $106
Sales Tax (Materials amp Equipment Purchases) $0 100 Average Annual Payment (Interest and Principal) $7684 0 Property Taxes $0 100 Total $7918
Other Parameters Financial Parameters Debt Financing Percentage Financed 80 0 Years Financed (term) 10 Interest Rate 10
Tax Parameters Local Property Tax (percent of taxable value) 0 Assessed Value (percent of construction cost) 0 Taxable Value (percent of assessed value) 0 Taxable Value $0 Property Tax Exemption (percent of local taxes) 100 Local Property Taxes $0 100 Local Sales Tax Rate 688 100 Sales Tax Exemption (percent of local taxes) 10000
Payroll Parameters Wage per hour Employer Payroll Overhead
Construction and Installation Labor Construction WorkersInstallers $2369 456 OampM Labor Technicians $2369 456
41
Table D-2 JEDI Results Commercial-Scale System
Photovoltaic - Project Data Summary Based on Model Default Values
Project Location Minnesota Year of Construction or Installation 2013 Average System Size - DC Nameplate Capacity (kW) 348 Number of Systems Installed 1 Total Project Size - DC Nameplate Capacity (kW) 348
Large System Application Commercial
Crystalline Solar CellModule Material Silicon System Tracking Fixed Mount Base Installed System Cost ($kWDC) $5790 Annual Direct Operations and Maintenance Cost ($kW) $2600 Money Value - Current or Constant (Dollar Year) 2012 Project Construction or Installation Cost $2014920 Local Spending $1205084
Total Annual Operational Expenses $242779 Direct Operating and Maintenance Costs $9048 Local Spending $8324
Other Annual Costs $233731 Local Spending $0 Debt Payments $0 Property Taxes $0
Local Economic Impacts - Summary Results
Jobs Earnings Output During construction and installation period $000 (2012) $000 (2012)
Project Development and On-site Labor Impacts
Construction and Installation Labor 30 $19120
Construction and Installation Related Services 41 $19810 Subtotal 70 $38930 $66240
Module and Supply Chain Impacts Manufacturing 00 $00 $00 Trade (Wholesale and Retail) 15 $10140 $28920 Finance Insurance and Real Estate 00 $00 $00 Professional Services 13 $6360 $19450 Other Services 14 $9900 $31740 Other Sectors 25 $7350 $18520 Subtotal 67 $33750 $98620
Induced Impacts 52 $20870 $67740 Total Impacts 189 $93550 $232600
42
Annual Annual Annual Earnings Output
During operating years Jobs $000 (2012) $000 (2012) On-Site Labor Impacts PV Project Labor Only 01 $500 $500
Local Revenue and Supply Chain Impacts 00 $170 $510 Induced Impacts 00 $100 $330 Total Impacts 01 $770 $1350
Notes Earnings and output values are thousands of dollars in year 2012 dollars Construction and operating period jobs are full-time equivalent for one year (1 FTE = 2080 hours) Economic impacts during operating years represent impacts that occur from systemplant operationsexpenditures Totals may not add up due to independent rounding
Detailed PV Project Data Costs
Purchased Manufactured Installation Costs Cost Locally () Locally (Y or N) Materials amp Equipment
Mounting (rails clamps fittings etc) $87998 100 N Modules $730706 100 N Electrical (wire connectors breakers etc) $61708 100 N Inverter $131884 100 N Subtotal $1012295
Labor Installation $191183 100 Subtotal $191183
Subtotal $1203478 Other Costs
Permitting $218164 100 Other Costs $89047 100 Business Overhead $504231 100 Subtotal $811442
Subtotal $2014920 Sales Tax (materials and equipment purchases) $0 100 Total $2014920
PV System Annual Operating and Maintenance Costs Cost Local Share Labor
Technicians $5429 100 Subtotal $5429
Materials and Services
43
Materials amp Equipment $3619 100 Services $0 100 Subtotal $3619
Sales Tax (materials and equipment purchases) $0 100 Average Annual Payment (interest and principal) $233731 0 Property Taxes $0 100 Total $242779
Other Parameters Financial Parameters Debt Financing Percentage Financed 80 0 Years Financed (term) 10 Interest Rate 10
Tax Parameters Local Property Tax (percent of taxable value) 0 Assessed Value (percent of construction cost) 0 Taxable Value (percent of assessed value) 0 Taxable Value $0 Property Tax Exemption (percent of local taxes) 100 Local Property Taxes $0 100 Local Sales Tax Rate 688 100 Sales Tax Exemption (percent of local taxes) 10000
Payroll Parameters Wage per hour Employer Payroll Overhead
Construction and Installation Labor Construction WorkersInstallers $2139 456 OampM Labor Technicians $2139 456
44
- Acknowledgments
- List of Acronyms
- Executive Summary
- Table of Contents
- List of Figures
- List of Tables
- 1 Study and Site Background
- 2 Development of a PV System on Brownfields
- 3 PV Systems
-
- 31 PV Overview
- 32 Major System Components
- 33 Siting Considerations
-
- 4 Proposed Installation Location Information
-
- 41 Atlas Industrial Park PV System
- 42 Utility-Resource Considerations
- 43 PV Site Solar Resource
- 44 Atlas Industrial Park Energy Usage
-
- 5 Economics and Performance
-
- 51 Assumptions and Input Data for Analysis
- 52 SAM Forecasted Economic Performance
- 53 Job Analysis and Impact
- 54 Financing Opportunities
-
- 6 Conclusions and Recommendations
- Appendix A Solar Access Measurements
- Appendix B Results from PVWatts
- Appendix C Results of the SAM Analysis
- Appendix D Results of the JEDI Model
-
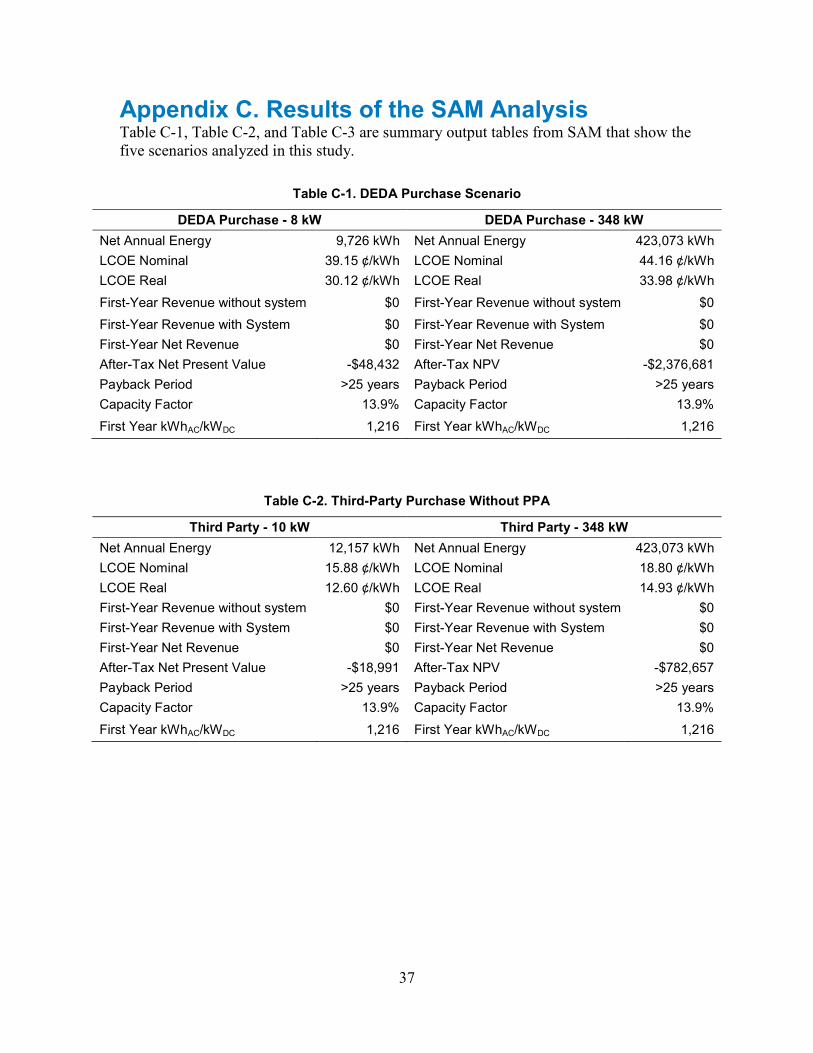
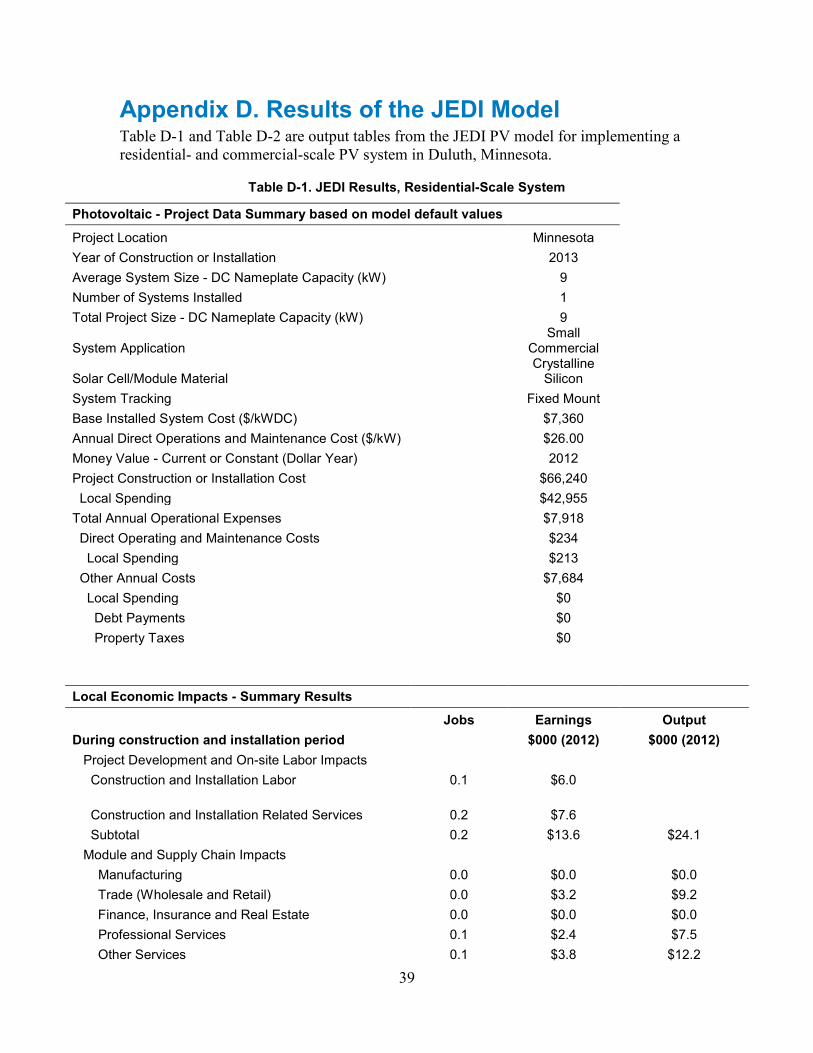
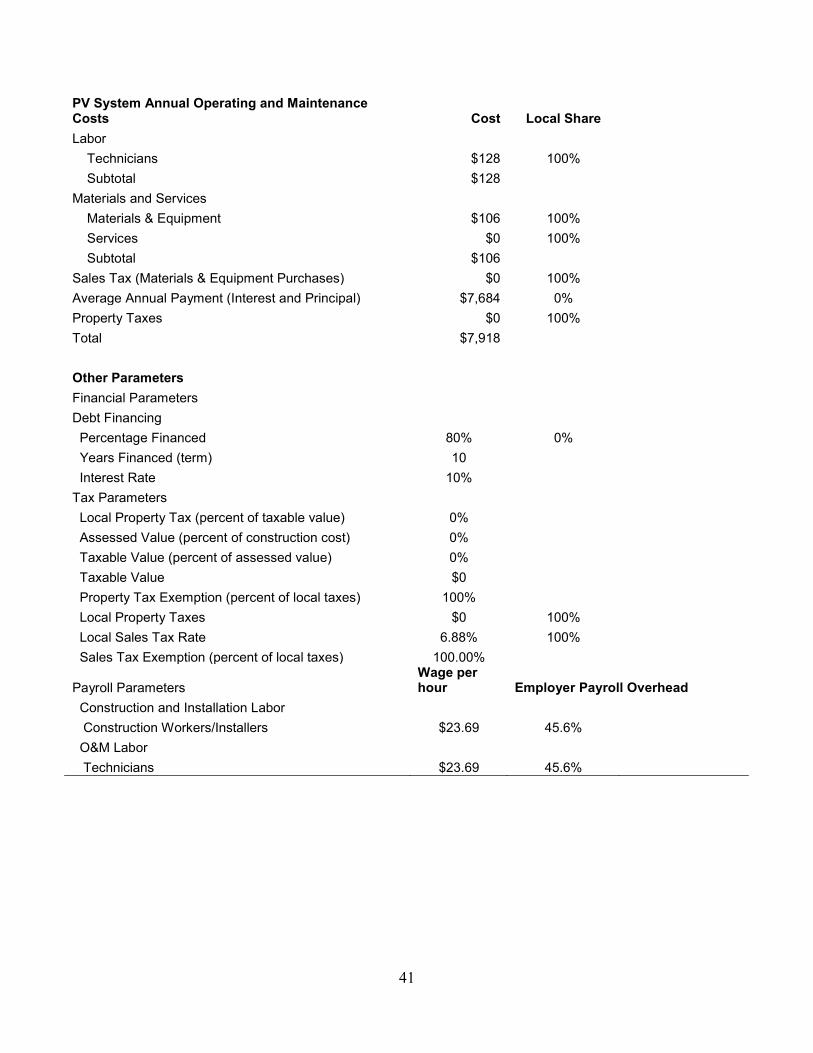
PV System Annual Operating and Maintenance Costs Cost Local Share Labor
Technicians $128 100 Subtotal $128
Materials and Services Materials amp Equipment $106 100 Services $0 100 Subtotal $106
Sales Tax (Materials amp Equipment Purchases) $0 100 Average Annual Payment (Interest and Principal) $7684 0 Property Taxes $0 100 Total $7918
Other Parameters Financial Parameters Debt Financing Percentage Financed 80 0 Years Financed (term) 10 Interest Rate 10
Tax Parameters Local Property Tax (percent of taxable value) 0 Assessed Value (percent of construction cost) 0 Taxable Value (percent of assessed value) 0 Taxable Value $0 Property Tax Exemption (percent of local taxes) 100 Local Property Taxes $0 100 Local Sales Tax Rate 688 100 Sales Tax Exemption (percent of local taxes) 10000
Payroll Parameters Wage per hour Employer Payroll Overhead
Construction and Installation Labor Construction WorkersInstallers $2369 456 OampM Labor Technicians $2369 456
41
Table D-2 JEDI Results Commercial-Scale System
Photovoltaic - Project Data Summary Based on Model Default Values
Project Location Minnesota Year of Construction or Installation 2013 Average System Size - DC Nameplate Capacity (kW) 348 Number of Systems Installed 1 Total Project Size - DC Nameplate Capacity (kW) 348
Large System Application Commercial
Crystalline Solar CellModule Material Silicon System Tracking Fixed Mount Base Installed System Cost ($kWDC) $5790 Annual Direct Operations and Maintenance Cost ($kW) $2600 Money Value - Current or Constant (Dollar Year) 2012 Project Construction or Installation Cost $2014920 Local Spending $1205084
Total Annual Operational Expenses $242779 Direct Operating and Maintenance Costs $9048 Local Spending $8324
Other Annual Costs $233731 Local Spending $0 Debt Payments $0 Property Taxes $0
Local Economic Impacts - Summary Results
Jobs Earnings Output During construction and installation period $000 (2012) $000 (2012)
Project Development and On-site Labor Impacts
Construction and Installation Labor 30 $19120
Construction and Installation Related Services 41 $19810 Subtotal 70 $38930 $66240
Module and Supply Chain Impacts Manufacturing 00 $00 $00 Trade (Wholesale and Retail) 15 $10140 $28920 Finance Insurance and Real Estate 00 $00 $00 Professional Services 13 $6360 $19450 Other Services 14 $9900 $31740 Other Sectors 25 $7350 $18520 Subtotal 67 $33750 $98620
Induced Impacts 52 $20870 $67740 Total Impacts 189 $93550 $232600
42
Annual Annual Annual Earnings Output
During operating years Jobs $000 (2012) $000 (2012) On-Site Labor Impacts PV Project Labor Only 01 $500 $500
Local Revenue and Supply Chain Impacts 00 $170 $510 Induced Impacts 00 $100 $330 Total Impacts 01 $770 $1350
Notes Earnings and output values are thousands of dollars in year 2012 dollars Construction and operating period jobs are full-time equivalent for one year (1 FTE = 2080 hours) Economic impacts during operating years represent impacts that occur from systemplant operationsexpenditures Totals may not add up due to independent rounding
Detailed PV Project Data Costs
Purchased Manufactured Installation Costs Cost Locally () Locally (Y or N) Materials amp Equipment
Mounting (rails clamps fittings etc) $87998 100 N Modules $730706 100 N Electrical (wire connectors breakers etc) $61708 100 N Inverter $131884 100 N Subtotal $1012295
Labor Installation $191183 100 Subtotal $191183
Subtotal $1203478 Other Costs
Permitting $218164 100 Other Costs $89047 100 Business Overhead $504231 100 Subtotal $811442
Subtotal $2014920 Sales Tax (materials and equipment purchases) $0 100 Total $2014920
PV System Annual Operating and Maintenance Costs Cost Local Share Labor
Technicians $5429 100 Subtotal $5429
Materials and Services
43
Materials amp Equipment $3619 100 Services $0 100 Subtotal $3619
Sales Tax (materials and equipment purchases) $0 100 Average Annual Payment (interest and principal) $233731 0 Property Taxes $0 100 Total $242779
Other Parameters Financial Parameters Debt Financing Percentage Financed 80 0 Years Financed (term) 10 Interest Rate 10
Tax Parameters Local Property Tax (percent of taxable value) 0 Assessed Value (percent of construction cost) 0 Taxable Value (percent of assessed value) 0 Taxable Value $0 Property Tax Exemption (percent of local taxes) 100 Local Property Taxes $0 100 Local Sales Tax Rate 688 100 Sales Tax Exemption (percent of local taxes) 10000
Payroll Parameters Wage per hour Employer Payroll Overhead
Construction and Installation Labor Construction WorkersInstallers $2139 456 OampM Labor Technicians $2139 456
44
- Acknowledgments
- List of Acronyms
- Executive Summary
- Table of Contents
- List of Figures
- List of Tables
- 1 Study and Site Background
- 2 Development of a PV System on Brownfields
- 3 PV Systems
-
- 31 PV Overview
- 32 Major System Components
- 33 Siting Considerations
-
- 4 Proposed Installation Location Information
-
- 41 Atlas Industrial Park PV System
- 42 Utility-Resource Considerations
- 43 PV Site Solar Resource
- 44 Atlas Industrial Park Energy Usage
-
- 5 Economics and Performance
-
- 51 Assumptions and Input Data for Analysis
- 52 SAM Forecasted Economic Performance
- 53 Job Analysis and Impact
- 54 Financing Opportunities
-
- 6 Conclusions and Recommendations
- Appendix A Solar Access Measurements
- Appendix B Results from PVWatts
- Appendix C Results of the SAM Analysis
- Appendix D Results of the JEDI Model
-