feasibility study of car-sharing service in hangzhou, china
TRANSCRIPT
i
Feasibility Study of Car-sharing Service in Hangzhou, China
A Major Qualifying Project Report
Submitted to the Faculty of
WORCESTER POLYTECHNIC INSTITUTE
In partial fulfillment of the requirements for the
Degree of Bachelor of Science
By:
Lorey Aragon Alp Humbaraci Joseph Papotto
In partnership with Hangzhou Dianzi University students:
Xiaoyan Fei Wanqiong Lin Jinpin Quan Hexin Tian
Yingchao Wu Ling Li Pu Wang
Date: August 13, 2011
Approved: _________________________ Prof. Amy Zeng, Major Advisor
Project Number: ZAZ-E111

ii
Abstract
The goal of this project was to prepare an in-depth study of the feasibility of car-sharing
service in Hangzhou city to effectively asses the business opportunities and social effects of this
alternative of transportation. We analyzed the social, marketing and financial aspects of the
feasibility of this business idea through a large survey, interviews and site visits. We also
examined the supporting functions to implement future car-sharing service in Hangzhou,
including advertising tools, location distribution design, and technologies.

iii
Acknowledgements
We would like to thank Delta Consulting Associates and Hangzhou Omnipay for
sponsoring this project. We would especially like to thank Kailai Zhou (Delta) and Peter Zhao
(Omnipay) for their continuous assistance for this project.
We would also like to thank Hangzhou Dianzi University for their hospitality. Finally we
would like to thank our advisors: Professor Amy Zeng of WPI, Professor Hansong Pu of HDU and
Dr. Xiaobing Xu of HDU throughout this project.

iv
Table of Contents
Chapter 1: Introduction ................................................................................................................................ 1
Chapter 2: Literature Review ........................................................................................................................ 4
2.1 Collaborative Consumption ................................................................................................................ 4
2.2 Car-sharing Service.............................................................................................................................. 5
2.3 Air Pollution and Environmental Impact of Cars ................................................................................. 7
2.4 Air Pollution in China .......................................................................................................................... 9
Chapter 3: Car-sharing Services in the US and China.................................................................................. 16
3.1 Zipcar in Boston and Beyond ............................................................................................................ 16
3.1.1 History of Car-sharing Services .................................................................................................. 16
3.1.2 History of Zipcar ......................................................................................................................... 17
3.1.3 Zipcar and Competitors .............................................................................................................. 17
3.1.4 Zipcar and Customers ................................................................................................................ 20
3.1.5 Zipcar and Government ............................................................................................................. 21
3.2 Car-sharing in China .......................................................................................................................... 22
3.3 Why Hangzhou for this Project ......................................................................................................... 25
Chapter 4: Methodology ............................................................................................................................. 27
Chapter 5: Results and Findings .................................................................................................................. 31
5.1 Surveys .............................................................................................................................................. 31
5.2 Interviews and Site Visits .................................................................................................................. 42
5.3 Social Impacts of Car-sharing in Hangzhou ........................................................................................... 55
5.3.1 Environmental Concerns ............................................................................................................ 55
5.3.2 Traffic in Hangzhou and Car-sharing’s Impact ........................................................................... 57
5.3.3 Social Impact of Electric Cars ..................................................................................................... 60
5.4 Marketing Aspects of Car-sharing in Hangzhou ................................................................................ 67
5.4.1 Advertising Car-sharing .............................................................................................................. 67
5.4.2 Target Customers ....................................................................................................................... 72
5.4.3 Marketing Similarities of Electric Cars and Zipcar...................................................................... 79
5.4.4 Marketing and Implementation Plans ....................................................................................... 82
5.5 Technological Aspects of Car-sharing in Hangzhou .............................................................................. 87
5.5.1 The Central Database ................................................................................................................. 87

v
5.5.2 User Interfaces ........................................................................................................................... 87
5.5.3 On Board Vehicle System ........................................................................................................... 88
5.5.4 Communication System ............................................................................................................. 90
5.6 Financial Aspects of Car-sharing in Hangzhou .................................................................................. 93
5.6.1 Financial Plan ............................................................................................................................. 93
5.6.2 Car-sharing versus Private Cars .................................................................................................. 97
5.6.3 Car-sharing versus Taxi .............................................................................................................. 98
5.6.4 Car-Sharing versus Car-Rental.................................................................................................. 100
5.7 Location Analysis ............................................................................................................................. 102
5.7.1 Selection Criteria ...................................................................................................................... 102
5.7.2 Locations of Car-sharing Service in Hangzhou ......................................................................... 105
5.7.3 Parking Analysis ....................................................................................................................... 127
Chapter 6: Discussions and Recommendations ........................................................................................ 129
6.1 Risks of Implementing Car-sharing ................................................................................................. 129
6.2 Financial Recommendations ........................................................................................................... 133
6.3 Partnership Recommendations ...................................................................................................... 134
6.4 Relationship between Price and Demand ....................................................................................... 135
6.5 Reflections on the Design Process .................................................................................................. 137
6.6 Suggestions for Future Studies ....................................................................................................... 146
Appendices ................................................................................................................................................ 148
Appendix A: Sample Survey .................................................................................................................. 148
Appendix B: Excel Data for Survey Results ........................................................................................... 149
Appendix C: Financial Plan Details ........................................................................................................ 150
Appendix D: Annual Costs of Car-sharing versus Private Car Ownership ............................................. 160
Bibliography .............................................................................................................................................. 163

vi
Table of Figures Figure 1: Global satellite-derived map of PM2.5 averaged over 2001-2006. (Donkelaar, 2010) ............... 10
Figure 2: Deaths from Urban Air Pollution (UAP) in 2000 (World Resources Institute, 2007) ................... 11
Figure 3: Total Sulfur Dioxide Emission by Country (Paster, 2007) ............................................................ 12
Figure 4: China’s Total NOX emissions by sectors, 1980~2000 (The World Bank, 2007) ........................... 13
Figure 5: Distribution of Acid Rain in China, 2001, 2003, and 2005 ........................................................... 14
Figure 6: Traffic Flow in Hangzhou (City Planning Board, 2011) ................................................................. 26
Figure 7: Methodology Flow Chart ............................................................................................................. 27
Figure 8: Survey Results Question 1 ........................................................................................................... 32
Figure 9: Survey Results Question 2 ........................................................................................................... 33
Figure 10: Survey Results Question 3 ......................................................................................................... 34
Figure 11: Survey Results Question 4 ......................................................................................................... 35
Figure 12: Survey Results Question 5 ......................................................................................................... 36
Figure 13: Survey Results Question 6 ......................................................................................................... 37
Figure 14: Survey Results Question 7 ......................................................................................................... 38
Figure 15: Survey Results Question 8 ......................................................................................................... 39
Figure 16: Survey Results Question 9 ......................................................................................................... 40
Figure 17: Survey Results Question 10 ....................................................................................................... 41
Figure 18: Prices for bicycle usage in Hangzhou ......................................................................................... 44
Figure 19: Bicycle Sharing in other Cities .................................................................................................... 46
Figure 20: Bicycle Sharing Station ............................................................................................................... 47
Figure 21: Map of China (City Planning Board, 2011) ................................................................................. 48
Figure 22: Districts of Hangzhou ................................................................................................................. 50
Figure 23: Zipcar Car Emissions (U.S. Environmental Protection Agency, 2011) ........................................ 56
Figure 24: Urban Traffic Planning (City Planning Board, 2011) .................................................................. 58
Figure 25: Zhonghe Bridge (City Planning Board, 2011) ............................................................................. 59
Figure 26: Automobile Output (National Bureau of Statistics, 2009) ......................................................... 62
Figure 27: Advertising Costs ........................................................................................................................ 71
Figure 28: Survey Analysis Question 1 ........................................................................................................ 73
Figure 29: Survey Analysis Question 2 ........................................................................................................ 74
Figure 30: Survey Analysis Question 3 ........................................................................................................ 75
Figure 31: Survey Analysis Question 4 ........................................................................................................ 76
Figure 32: Private Car Use ........................................................................................................................... 78
Figure 33: Car-sharing Opinions .................................................................................................................. 78
Figure 34: City Comparison of Hangzhou .................................................................................................... 86
Figure 35: Financial Plan for Car-sharing in Hangzhou 2011 ...................................................................... 94
Figure 36: Sensitivity Analysis ..................................................................................................................... 95
Figure 37: Scenarios with Different Number of Members ......................................................................... 97
Figure 38: Car-sharing versus Private Car ................................................................................................... 98
Figure 39: Taxi in Hangzhou ........................................................................................................................ 99
Figure 40: Car-sharing versus Taxi ............................................................................................................ 100

vii
Figure 41: Car-Sharing versus Car-Rental ................................................................................................. 101
Figure 42: Car-sharing Locations in Hangzhou .......................................................................................... 105
Figure 43: Qingchun Square ...................................................................................................................... 107
Figure 44: Qingchun Square Key Location ................................................................................................ 108
Figure 45: Hangzhou Tower ...................................................................................................................... 110
Figure 46: Hangzhou Tower Key Locations ............................................................................................... 110
Figure 47: Binjiang..................................................................................................................................... 112
Figure 48: Binjiang Key Locations ............................................................................................................. 112
Figure 49: Heaven Software Park .............................................................................................................. 114
Figure 50: Heaven Software Park Key Locations ....................................................................................... 114
Figure 51: Xiaoshan ................................................................................................................................... 116
Figure 52: Xiaoshan Key Locations ............................................................................................................ 116
Figure 53: Huanglong Stadium .................................................................................................................. 118
Figure 54: Huanglong Stadium Key Locations ........................................................................................... 118
Figure 55: Gongshu ................................................................................................................................... 120
Figure 56: Gongshu Key Locations ............................................................................................................ 120
Figure 57: Lingwu Office Building ............................................................................................................. 121
Figure 58: Lingwu Office Building Key Locations ...................................................................................... 121
Figure 59: Xiasha ....................................................................................................................................... 124
Figure 60: Xiasha Key Locations ................................................................................................................ 124
Figure 61: West City Square ...................................................................................................................... 125
Figure 62: West City Square Key Locations ............................................................................................... 125
Figure 63: Demand vs. Price...................................................................................................................... 135
Figure 64: Network Design Process .......................................................................................................... 137
1
Chapter 1: Introduction
“In the United States alone, revenue generated by the car-sharing market is expected to
experience 44 percent annual growth through 2016 — from just shy of $200 million in 2009 to
almost $3.3 billion” (Goodison, 2011). Car-sharing is a “business model using modern electronic
communication technology and GPS satellite positioning technology to provide a range of car
service to the members. Car-sharing Service operators provide vehicles, coordination
management of network operations, and are responsible for vehicle maintenance, insurance,
parking and other issues; and car-sharing members have the right to use the vehicle only, but
not to own” (香港达泰投资咨询有限公司, 2011). It provides people the benefits of using a car
without actually owning it and worrying about the responsibilities that comes with it. The
growing market and popularity provides opportunity for existing service providers to expand
and for new companies to enter the market. In 2009 there were more than one thousand cities
in the world where people can use car-sharing services.
Transportation is the life-blood of any economy. And yet, the fast-growing urban centers
are faced with increasingly clogged arteries. A country where this kind of problem is escalating
is China. Transportation in China has experienced major growth in recent years. One mode of
transportation, the highway and road system has gone through a rapid expansion resulting in
an increase the use of motor vehicles in China. According to the China’s State Statistical Bureau,
China had 5.54 million vehicles on the road in 1990, but this number increased to 90.86 million
in 2011, 19.3% from a year earlier. The use of motor vehicles in China is estimated to grow even
more as China is one of the fastest growing countries in the world. The increased number of
motor vehicles coupled with overpopulation contributes to traffic, transportation issues and air

2
pollution. A possible way to alleviate these kinds of problems is to implement the idea of car-
sharing services in China.
Zipcar, one of the most successful car-sharing services in the USA, was originated in the
Boston, Ma in 2000. It provides its customers the opportunity to rent a car for a specific amount
of time providing them the benefits of owning a car without owning it. Zipcar currently
operates over 8000 vehicles and serves to over 565,000 members worldwide (Zipcar, Inc). This
project paper involves the steps and results of the research that our team carried out to help
the government of Hangzhou to implement of similar car-sharing service. The reason why the
city of Hangzhou is a good candidate for hosting China’s first established car-sharing service is
that it is sister cities with Boston and share several characteristic with the city of Boston.
Car-sharing service has become a widely used alternative for automobile drivers in the
U.S. and Europe. It benefits individuals and institutions by lowering their transportation costs
and helps society reduce the number of vehicles on the road, in the parking area, energy
consumption and emission of carbon dioxide. While car-sharing services like Zipcar are thriving
in American and European cities, they are not yet available in China. As our goal for this project
we will answer the following questions.
Can car-sharing business be equally successful in Hangzhou as in Boston?
Can it be part of the solution for the increasingly worsening traffic conditions and air
pollution of big cities in China?
What roles can the government play in the development of this new transportation
model?
What opportunities will this business offer to investors and entrepreneurs?

3
In the end we are planning to provide governments and businesses an in-depth study of
the feasibility of car-sharing service in Hangzhou city so that they can effectively assess the
business opportunities and social effects of this alternative of transportation.

4
Chapter 2: Literature Review
2.1 Collaborative Consumption
“Collaborative Consumption describes the rapid explosion in swapping, sharing,
bartering, trading and renting being reinvented through the latest technologies”. Several
markets, where collaborative consumption is common, are: Transportation (cars, bikes),
apparel (clothing, accessories), food, living spaces, household appliances, money (social
lending, virtual currencies) workspaces, travel, accommodation, space (storage, parking, spare
rooms). (Rachel Botsman, 2010)
Rachel Botsman and Roo Rogers classify collaborative consumption in to three types of
systems: product service systems, redistribution markets and collaborative lifestyles. In
redistribution markets, used goods are moved from somewhere they are not needed to
somewhere they are. Used items can be sold or redistributed; resulting in a more sustainable
world. In collaborative lifestyles people who share similar needs and interests share fewer
tangible assets such as time, money and space. Product service systems enable companies to
offer products as services instead of selling them. This provides the benefits of a product
without actually having the customer own the product.
A system of collaborative consumption is based on used or pre-owned goods being
passed on from someone who does not want them to someone who does want them. This is
another alternative to the more common “reduce, reuse, recycle” methods of dealing with
waste. Preventing waste; therefore helping the environment is one of the main benefits of
collaborative consumption.
5
Another benefit of collaborative consumption gives people the benefits of ownership
with reduced personal burden and cost. For example renting a product would save someone
the initial cost of actually buying the product. Companies, as well as individuals, shape the way
they fulfill their needs taking collaborative consumption into account. A very widespread
example of collaborative consumption is car-sharing services.
2.2 Car-sharing Service
A car rental agency is a company that rents motor vehicles for short periods of time for
a fee. These kinds of agencies often serve people who do not have access to their own cars. For
example, tourists who are from out of town or people whose cars need to be repaired. Car-
sharing, similar to car rental, allows people to rent cars by the hour. They attract people who
occasionally use cars and people who would like to have access to different type of cars than
they use day-to-day. Car-sharing services have unique characteristics which separate them from
regular car rental services.
Different than car rental companies, car-sharing services provide unit pricing that
includes fuel and insurance. While renting a car from a car rental company, the customer pays
for the gas they use. They usually receive the car with a full tank and required to return the car
the same way. Also if the customer wants insurance on the car they are required to pay extra
fees. With car-sharing services, on the other hand, the gas and insurance money are included in
the hourly fee of the car. The customer receives a “gas card” from the service provider and can
purchase gas with that card.
Another essential element of car-sharing services that distinguish them from car rental
is the unattended access to the vehicle at the start and end of the trip. Unattended access is

6
provided with a mechanical lockbox mounted near the vehicle or on the vehicle. This makes it
very convenient for the customer to share a car. At car rentals, the customer needs to talk to a
company representative about the terms of agreement before renting the car. This step is done
online with cars sharing services. These are the characteristics that make car-sharing services
distinct from car rentals.

7
2.3 Air Pollution and Environmental Impact of Cars
“Air pollution is the addition of harmful chemicals to the Earth’s atmosphere”
(Houghton Mifflin Company, 2005). It is one of the most pressing global issues due to its rapid
influence on increasing human diseases. According to the World Health Organization in 2008,
air pollution was estimated to have caused approximately two million premature deaths
worldwide.
There are several man made activities that contribute to air pollution. Industrial and
utility activities such as coal-burning power plants, car engines and trash incinerators are the
major sources of air pollution created by human-induced activities (The Encyclopedia of Earth,
2008). These activities produce chemicals that have severe impacts on the environment.
Most common pollutants produced as a result of these activities are ground level ozone,
particulate matter, carbon monoxide, nitrogen oxides, sulfur dioxide and lead (U.S.
Environmental Protection Agency, 2011). Each individual pollutant has different effects on the
environment and the human health. Ground level ozone, also known as summertime air
pollution, forms smog which is harmful when concentrated in the air. As the primary
constituent of smog, it can scar the lung tissue causing bronchitis, emphysema, and asthma.
Particulate matter can contain materials ranging from acids, organic chemicals, metals, soil, and
dust particles. According to the American Lung Association, exposure to particulate air pollution
can cause asthma attacks and harm individuals with sensitive airways. The emission of carbon
monoxide mainly comes from motor vehicles. Carbon monoxide reduces the amount of oxygen
carried by the blood and cause diseases related to lack of oxygen in different body parts (U.S.
Environmental Protection Agency, 2011). Nitrogen oxides (NOx) come from emissions from

8
cars, trucks and buses, and power plants. Exposure to NOx may cause adverse respiratory
effects including airway inflammation and increase respiratory symptoms, such as asthma.
Sulfur dioxide is majorly produced by power plants and industrial facilities which affect human
respiratory system causing respiratory effects such as bronchoconstriction and asthma. Lead,
an indoor pollutant, affects humans working in contaminated workforces, especially in
manufacturing plants. “Lead may cause a range of health effects, from behavioral problems and
learning disabilities, to seizures and death (U.S. Environmental Protection Agency, 2011).”
Even though standards are set by the National Resources Defense Council (NRDC) to
prevent thousands of cases of respiratory and heart diseases, air pollution is still part of our
everyday lives. Studies show that traffic-related air pollutants increase respiratory and
cardiovascular mortality. Emission from motor vehicles’ engines release nitric oxide, nitrogen
dioxide and carbon monoxide gases, pollutants which contribute to air pollution and provoke
several respiratory symptoms.
Large cities, especially ones with high automobile traffic, have a high amount of nitrogen
oxides emitted into the atmosphere which can be significant in many ways. “Overall, 80 percent
or more of nitric oxide emissions worldwide are generated by human activities, and in many
regions the result is increased smog and acid rain” (Vitousek, 2007). Acid rain is produced from
high levels of nitric and sulfuric acid in the atmosphere and is considered an environmental
problem (U.S. Environmental Protection Agency, 2011)
Acid rain is not the only result of air pollution, global warming is another very pressing
concern that can be aggravated by air pollution. Global warming has become a severe
environmental issue around the world. The pollutants emitted by vehicles such as nitrogen

9
dioxide and carbon dioxide contribute to the greenhouse effect. The greenhouse effect is a
naturally occurring process that aids in heating the Earth's surface and atmosphere. The
atmospheric gases like carbon dioxide absorb the heat from the sunlight and keep the Earth
surface warm. An increase in the concentration of these gases can cause the temperature of
the Earth to increase causing global warming. Therefore emissions from motor vehicles in high
concentrations have an impact on global warming.
With the rise of air pollution worldwide, China has made its way to the top of the list of
countries that have the worst air pollution. According to the World Bank, 16 of the world’s 20
cities with the worst air are in China. In the foreseeable future China’s air pollution does not
seem to be getting better. “The air pollution death figure is expected to rise to 380,000 in 2010
and 550,000 in 2020.” (Hays, 2011)
2.4 Air Pollution in China
A basic requirement of human health is clean air; therefore organizations such as the
World Health Organization, set air quality guidance in order to reduce impacts of air pollution.
The air quality guidelines are “expert evaluation of current scientific evidence (Global Health
Organization, 2006).” The information included in the guidelines is related to the four common
air pollutants: particulate matter (PM), ozone (O3), nitrogen dioxide (NO2) and sulfur dioxide
(SO2). There are two types of standards: primary and secondary. Primary standards main goal is
to protect the living individuals against adverse health effects. Secondary standards protect
against welfare effects, including damages to buildings and vegetation. Pollutants also have
standards for long-term and short-term average times which are set to protect chronic health
effects (U.S. Environmental Protection Agency, 2011).
10
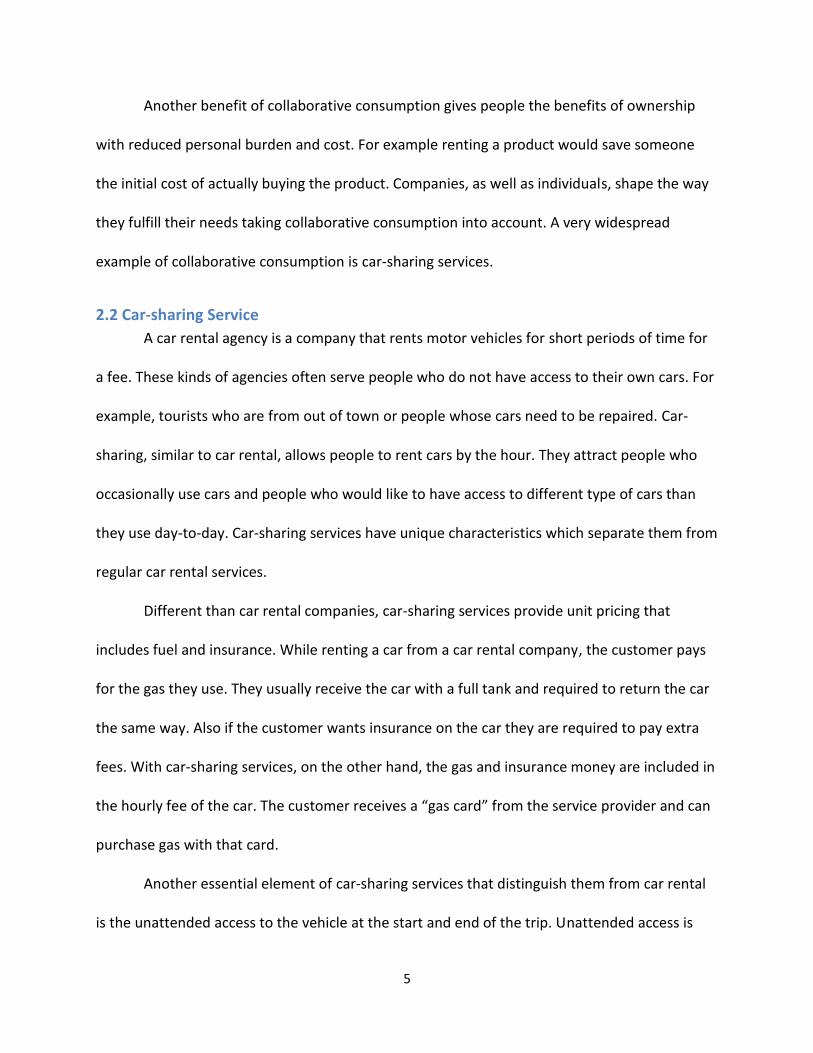
The air we breathe in the world today is not as clean as we think it may be. Fine particle
matter (PM2.5) is the problematic particles which pass the body’s normal defenses and
penetrate into the lungs causing premature deaths. Figure 1, displays the severity of air
pollution in the world as the map shows the global view of health-sapping air pollution
particles. The map shows the average PM2.5 results until 2006, and levels of PM2.5 are very high
from Northern Africa to Eastern Asia. It can be clearly seen that China has high volumes of air
pollution across the country.
Figure 1: Global satellite-derived map of PM2.5 averaged over 2001-2006. (Donkelaar, 2010)
China’s growth has several negative impacts on the environment. Land degradation, bad
water quality, severe air pollution and declining natural forest cover are some of the
consequences of China’s rapid growth. These environmental issues are undermining the
sustainability of long-term growth and as a result threaten the health of future generations.
Air pollution is the cause for hundreds of thousands of deaths each year (New York
Times, 2007). China has the highest annual incidence of premature death triggered by air

11
pollution (United Press International, 2011). According to the Ministry of Health, in 2007
pollution made cancer China’s leading cause of death. Figure 2 shows the number of deaths in
2000 due to urban air pollution (World Resources Institute, 2007). Worldwide, air pollution
causes approximately 800,000 million premature deaths each year. 25% of these deaths are
seen in East Asia, with China having more than 200 million deaths.
Figure 2: Deaths from Urban Air Pollution (UAP) in 2000 (World Resources Institute, 2007)
According to the World Health Organization, 90% of urban air pollution is caused by
fossil fuels burned by motor vehicles. Today, sulfur dioxide and nitrogen oxide are the major
two pollutants responsible for China’s environmental issues (The World Bank, 2007). The
increase in industrial-based sulfur dioxide emissions has degraded air quality in the country. In
2003, almost three-quarters of China’s cities had sulfur dioxide below the U.S. annual average
standard (60 μg/m3). In 2005, China discharged 25.49 million tons of sulfur dioxide creating
about 50% of these cities violating at least one air quality standards (Xinhua News Agency,
2006). Figure 3 shows the total sulfur dioxide emissions worldwide, making China the largest
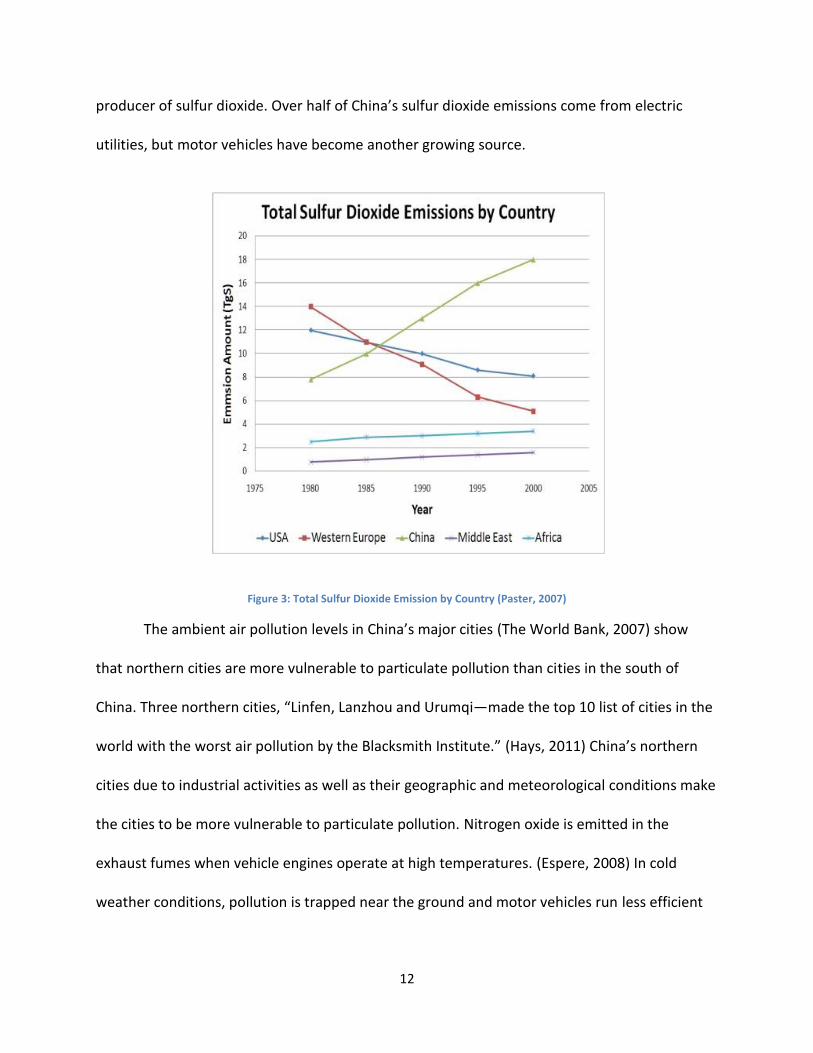
12
producer of sulfur dioxide. Over half of China’s sulfur dioxide emissions come from electric
utilities, but motor vehicles have become another growing source.
Figure 3: Total Sulfur Dioxide Emission by Country (Paster, 2007)
The ambient air pollution levels in China’s major cities (The World Bank, 2007) show
that northern cities are more vulnerable to particulate pollution than cities in the south of
China. Three northern cities, “Linfen, Lanzhou and Urumqi—made the top 10 list of cities in the
world with the worst air pollution by the Blacksmith Institute.” (Hays, 2011) China’s northern
cities due to industrial activities as well as their geographic and meteorological conditions make
the cities to be more vulnerable to particulate pollution. Nitrogen oxide is emitted in the
exhaust fumes when vehicle engines operate at high temperatures. (Espere, 2008) In cold
weather conditions, pollution is trapped near the ground and motor vehicles run less efficient

13
and also require more combustion for space heating. This is another reason why northern cities
are easily polluted than the southern area of China.
Nitrogen oxide is released by power plants, heavy industrial activities and motor
vehicles. “China’s emissions of nitrogen oxide have increased 3.8 percent a year for 25 years
(Hays, 2011).” Figure 4 shows the total nitrogen oxide emissions in China, allocated in different
economic sectors and fuels. The pink color shows transportation which includes the emission in
all the country until 2000; transportation is the third largest source in the country. The nitrogen
oxide emissions from this graph were mainly concentrated in the eastern and central provinces,
accounting for over 80% of the totals (Tian, 2003).
Figure 4: China’s Total NOX emissions by sectors, 1980~2000 (The World Bank, 2007)
A direct consequence of air pollution from sulfur dioxide and nitrogen oxide is acid rain;
this is a serious problem in China. Figure 5 shows the distribution of acid rain in the country
from 2001 until 2005 (The World Bank, 2007). As seen in these maps, the problem remains
serious in the south and southeastern portion of China. The maps also show that the main areas
affected are gradually moving from southwest to southeast. 38% of Chinese cities are affected

14
by acid rain where Beijing and Shanghai are the two most affected cities. In cities, the major
causes of acid rain are the rapidly growing number of cars, and the increasing consumption of
coal. In recent years coal consumption has accounted for about 70% of total energy
consumption (China Statistical Yearbook, 2004). The increase of crude oil consumption is due to
the rapid expansion of motor vehicles in many cities in China. “The drastic rise in the number of
vehicles and rapid development of industries in cities has led to worsening air quality in China
(Tang, 2004)”.
Figure 5: Distribution of Acid Rain in China, 2001, 2003, and 2005
Vehicle pollution has increased dramatically in China according to the Chinese Ministry
of Environmental Protection (MEP) in 2010. In cities across China, exhaust fumes from vehicles
have become the major source of air pollution. In 2009, the total vehicle emissions across China
were 51.433 million tons, of which 5.833 million tons were nitrogen oxide. 25.4% of the
automobiles meet Grade III National Vehicle Emission Standard and only about 17% of all
vehicles are below any standards. Automobiles contribute to over 70% of China’s carbon oxide
and more than 90% of nitrogen oxide (Clean Biz , 2010).

15
China is the country that suffers the most from air pollution in the world. Amongst the many
reasons of air pollution there are few that people can take action against. One of these is the
overuse of motor vehicles. As mentioned before motor vehicles are an important contributor of
air pollution in China. The quality of air we breathe can be improved by the choices we make
every day. If we can take strides in our everyday lives to prevent harmful emissions, we can
help create a healthier world.

16
Chapter 3: Car-sharing Services in the US and China
3.1 Zipcar in Boston and Beyond
Car- Sharing has been around since the late 1940s, but it was not until the European car-
sharing services and Zipcar got established that it has become noticed. We can learn from the
early days of car-sharing to help us analyze why it came about and what use it has in today’s
world. But as we look deeper into what the car-sharing service really has to over we will notice
more characteristics it has such as providing convenience, cost savings, and environmental
impacts in society. As we look at the past and beyond on what car-sharing has to offer, we
notice that it brings us much more than we expected.
3.1.1 History of Car-sharing Services
The development of the car-sharing industry has become a more predominant matter in
society today than has in its beginning years. With rising fuel costs and a strapped economy the
demand for a car-sharing service is more than ever. With innovators in the industry such as
Zipcar, many people are second guessing the way they travel. The concept of car-sharing has
been around for a while, but it took an economic downturn and a well-developed car-sharing
service to get it noticed. To help understand how car-sharing got its name to fame, we need to
understand where it started.
Car-sharing took its first real steps in the early 1990s even though smaller undeveloped
types of car-sharing programs tried to spurt earlier but never turned the corner. The first
structured car-sharing programs include Statt auto in Germany, Green Wheels in the
Netherlands, and Zipcar in Boston which would help carve a new face in the car-sharing
industry. By introducing this new market to the world, car-sharing Companies helped bridge the

17
gap between people not owning a car and convenience of being able to use one at the fraction
of owning one (Rachel Botsman, 2010).
3.1.2 History of Zipcar
The car-sharing industry has really taken off in the past 15 years and has been driven by
the lack of affordable and convenient car rental agencies in congested cities. One of the
premier names that pop up in the car-sharing industry is Zipcar. Zipcar was founded in 2000 by
Antje Danielson and Robin Chase who are residents in Cambridge Massachusetts. Their vision
was to create a car-sharing company that provided major cities the ability to provide wheels
when you want them. In 2000, the first “Zipcars” hit the streets of Boston. Soon after that
Washington D.C. and New York City followed suit. Soon after launching the program, Zipcar
became a hit in these major cities and as of today they are made available in over 50 major
cities and over 100 universities nationwide. (Zipcar, Inc)
Zipcar funding is made available through venture capitalist firm Benchmark capital. They
provide Zipcar with $10 million in funding and gave them the ability to expand their service
worldwide. In 2010, Zipcar bought out Streetcar which is a London based car-sharing service.
With this addition, Zipcar currently operates over 8,000 vehicles and serves to over 565,000
members worldwide. As it keeps expanding Zipcar has shown it has become a reliable form of
transportation and stands by its slogan “Wheels when you want them.” (Zipcar, 2011)
3.1.3 Zipcar and Competitors
Zipcar offers an easy and unique service compared to its competition. They offer easy
affordable enrollment fees and competitive daily driving charges. If you are a Zipcar member
you first have to reserve a vehicle within your local area online or by telephone for a specified
18
date and time. Once you have a schedule appointment you then go to the Zipcar parking area
and use your membership card to unlock your car. All “Zipcars” use RFID incorporated into
membership cards to open the cars via GPS system. Once in the car you must return it to the
same location at the time your reservation ends or late fees will be added. The GPS monitoring
system in the car lets Zipcar track their cars and know where a car is at all times. This helps
Zipcar attend to accidents, assess late fees, and know the status of their cars at all times. The
cars come equipped with a gas card to fill up, 180 miles per reservation $.45 per mile over, and
insurance. By offering these amenities in their service Zipcar continues to be a leader in car-
sharing services. (Zipcar, 2011)
Even though Zipcar is one of the top companies that offer a car-sharing service, it does
have to compete with a few other services. These companies include Co-Operative Auto
Network (CAN), Philly Car Share, and U Car Share. (Goodison, 2011) All of these companies have
a developed business model and require memberships in order to use the service. All of these
competitors are located in the regions where Zipcar operates which include the continental US
and parts of Canada. Even though Zipcar seems to control a high percentage of the car-sharing
industry, they still have to compete against these other companies that take away possible
members to the Zipcar.
The CAN or Co-Operative Auto Network based in Vancouver, Canada was first
established in 1997 under the company’s director Tracy Axelsson. The company originally
started off with 16 members and 2 cars when it started up in 1997. Now the company has
climbed to having over 2000 members and 113 vehicles. Even though this may seem small
compared to Zipcar, CAN only serves in the area of Vancouver in which Zipcar also serves. The

19
membership fee for CAN is $50 annual fee plus the user gets to choose driving plans for a
certain amount each month for use of the service. Driving plans are based upon usage and CAN
also charges a fee for kilometers traveled on top of an hourly charge based on the driving plan
chosen. Even though CAN is not one of Zipcars biggest competitors, they compete of the same
playing field as Zipcar. (Goldman, 2008)
Another competitor of Zipcar that is stationed in Philadelphia, Pa called Philly Car Share
is a unique company that pushes its car-sharing services towards universities and colleges in
neighborhood Pennsylvania areas. The company founded by both Tanya Seaman and Clayton
Lane in 2002 focused on bringing a car-sharing service to local universities in order to get
college students a way to travel around town. Starting with only 13 environmentally friendly
vehicles, Philly Car Share took off booming. In 2008 it partners with the University of PA to
launch the largest university car-sharing program by deploying 40 vehicles around campus.
Currently they have expanded to many other area colleges and have made its services available
in Delaware. The rates depend on the car and are anywhere from $4-8 hr/$40-60 day and
includes gas, insurance, and 210 free miles a day. The access is 24/7 and can be accessed
online. They have over 35000 members today and are a true competitor to Zipcar when it
comes to car-sharing around universities. (Goldman, 2008)
One of the last main competitors to Zipcar called U Car Share is a car-sharing service
that is a division under the worldwide known U-Haul international. U haul, which is widely
known for storage and truck rentals, established a car-sharing division in 2007 in 26 U-Haul
centers nationwide. They run in major locations around the US including Boston, Washington
D.C., Chicago, and many more cities that have U-haul centers. Unlike all the other competitors
20
which have a variety of vehicles, U Share only has PT Cruiser in its fleet. The rates include an
annual $50 fee along with $10/hr or $65 day which includes gas, insurance, and 125 miles.
Although the other competitors seem to have better offerings in their plans, U-haul has a great
reputation worldwide and makes most of its profits in car-sharing by focusing its services more
towards businesses than individuals. With its wide array of U-haul centers, it is one of Zipcars
biggest competitors with its versatility of being a nationwide service. (Goldman, 2008)
Having a wide array of competition, Zipcar needs to always be one step ahead of the
game in order to maintain its dominance in the car-sharing industry. Each of its competitors
offer something different in their services which makes possible Zipcar members choose
another service. For example, Philly Car Share focuses around local universities for its business
while CAN focuses its customers in only one region. With all of its competitors it just gets
tougher for Zipcar to keep one step ahead.
3.1.4 Zipcar and Customers
Zipcar scores high on Business to Customer (B2C) loyalty drivers by focusing on shared
values, differentiate aggressively, and engage to their customers (Mull, 2011). The values that
Zipcar puts great emphasis on are environmental and financial values. Both of this values are
part of Zipcar’s mission: “providing a great timesaving service that frees up space in our cities
and puts more money in consumers’ wallets (Zipcar, 2011).” Values such as these are not strong
for car ownership. Zipcar stand out their believes for its values in their marketing materials and
plays an active role in helping consumers implement this values. “Differentiate aggressively” is
the way a brand inspires the most loyalty differentiated from their competitors. Technically,
Zipcar is a car rental company but they rent only by the hour, instead of by the day. Zipcar’s

21
stations are located within customer’s neighborhood, not in airports or train stations. The
brand is more complex than just renting a car. Another way Zipcar obtains loyalty from its
customers is by engaging to them and “rope” consumers into the brand. “Zipster,” created by
Zipcar, is the name given to one who uses Zipcar (Zipcar, 2011). Zipcar offers “Zipster” events as
well as discounts at area retailers and restaurants.
3.1.5 Zipcar and Government
In April 2007, Zipcar received the Green Business Award by The City of Boston and
Mayor Thomas M. Menino (City of Boston, 2011). This award recognizes businesses that are
committed to promoting a sustainable vision for Boston. The sustainable vision and
performance is related to the environmental practices, in this case the promotion of alternative
transit.
“The City of Boston has partnered with local company Zipcar to promote car-sharing in an
effort to reduce congestion and promote sustainable transportation alternatives (City of
Boston, 2011).” This community involvement shows that the government is aware of its traffic
congestion and wants to solve this problem by facilitating carpooling. By partnership with car-
sharing companies, Boston City Government wants to ensure that its residents live within one-
fourth of a mile of a shared car by 2020 (City of Boston, 2011). The Boston Transportation
Department requires developers and parking facility owners to work with car-sharing
companies. This communication will determine whether their facilities can be sites for car
shared cars. If the city ensures that users can easily access shared cars locations, then
potentially it will be reducing vehicle miles traveled. Boston residents will access cars when
needed; therefore the city will be implementing an expansion method (Green Boston, 2010).

22
Today, Boston City Government is using its contracting authority in order to increase the
number of car-sharing opportunities in different areas. A request for proposal (RFP) was issued
in November 2011 from car-sharing provides, this included: (a) Reserve approximately 19
vehicles at two different locations for City Government employees during working hours, but
available to general public at other times, (b) 20 vehicles located in areas outside of downtown,
possibly located in municipal parking lots (City of Boston, 2011).
3.2 Car-sharing in China
Through our research online we found out that the closest resemblance to car-sharing in
China is eHi Auto Services Co. Ltd. Therefore we analyzed the history, operations, and
marketing.
eHi Auto Services Co. Ltd, founded in 2006, is a leading car rental service provider in
China for both corporate and individual clients. The company offers both self-drive and
chauffeur-drive service nationwide, including Hong Kong, Macao and Taiwan. Head-quartered
in Shanghai, they provide services in more than 50 cities in China and own 7,000 of vehicles. (一
嗨租车, 2011). Their mission is "To Share, Create an Environmentally Friendly look, Promote
Energy Savings, and create a Greener Society". In 2010, eHi had become the first company in
China to offer a car-sharing service. Branded as eHi Fast Car, it provides users to experience the
car-sharing system since they have to be self-service stations. This system has won the
recognition from inside and outside of the car rental service industry.
Building on their industry-leading proprietary IT platform, eHi has won the trust from
their customers with their professional, efficient and reliable services. Some of the company’s
attractive characteristics are their fashionable vehicle selection, flexible pricing, and convenient

23
booking system. This has made many local guides and residents become their customers for
their car rental needs. eHi’s client range covers all sectors including companies involved with
energy, education, media, finance, manufacturing and more (一嗨租车, 2011) . Today, the
majority of the Fortune 500 companies that have operations in China have chosen eHi as their
preferred service provider for car rental service.
eHi provides customers with a wide range of services to fit the need of its different
customers. For individual service, eHi provides different deals including: vehicle delivery
service, special price, self-driving, free vehicle inspection, and weekly or monthly rental. The
individual service allows the customer to choose different insurance, payment and booking
methods. On the other hand, for the company service eHi offers a long-term rental service and
allows the company to design the service depending on their needs. Their corporate service
includes an enterprise shuttle, commercial car rental, and more type of vehicles depending on
the customer demand.
There are two types of individual service, one for car-renting and the other for car-
sharing. Car-renting allows customers to return the rent vehicle to different locations, this is
known as self-drive service. This process doesn’t limit the customer to use the service in one
area since customers can pick up the car and return it in a different city. eHi offers its customers
30 different models of cars for them to rent and has 300 eHi offices in more than 50 cities. (百
度百科, 2011)When car-renting, eHi offers the customer two options: self-drive or chauffeur
drive. eHi chauffeur drive service is only for VIP customers, and a professional chauffeur drives
the customer in a limousine to his/her destination. eHi car-renting service also provides vehicle
delivery, which involves an eHi’s staff to deliver the car to a designated location. This method is

24
very convenient for the customers to avoid trouble finding the store. Car-sharing service,
known as eHi Fast Car, allows customers to drive a car for a short period of time. This service
can be done by online booking, and it provides the service to its customers all year after they
acquire a membership. eHi Fast Car service is available in all main central district in Beijing &
Shanghai.
Corporate services have three methods to offer. Enterprise shuttle is driving service
used by private companies, as well as shopping malls or supermarkets customers. Companies
can use this service to transport their staff. This service may also be useful for the stores such
as malls or supermarkets. Offering this service for customers will make its convenient for
shopping. It will increase their customers because they can directly get on the shuttle for free
after shopping. The commercial car rental provides an experienced driver, who provides the
customer with knowledge about the city, suburban routes, main attractions, and restaurant
information. This service facilitates customer traveling experience. The designed service
method provides various types of vehicles, according to business needs to develop the car
programs. The customer can create a unique service only for their company.
25
3.3 Why Hangzhou for this Project
The Urban Planning of 2001-2020
City Properties
Hangzhou is the capital of Zhejiang Province and the center of economy, culture, science
and education. The city aims to be a historical, cultural, and tourist city.
Development Goals
After 20 years of efforts, the main economic and social development indicators will be
close to the level of developed countries. Further develop the effect of Hangzhou links to
Shanghai as the leading major urban centers in the Yangtze River Delta region and the leading
role of radiation in the province political, economic, culture, science and education. Also
strength, scientific, and technological innovation is at the center of the city's comprehensive
services. Soon Hangzhou will have economic prosperity, social harmony, developed ecological
environment and become a city with local characteristics as well as the modern characters.
City Scale and Land use scale
As for 2020, the permanent population should be under 9.3 million, the urban household
population under 8.2 million. And the urban land sites will reach to 400 square kilometers.
Layout Structure (City Planning Board, 2011).The city will be then expand to the east, while
tourism to the west.

26
Figure 6: Traffic Flow in Hangzhou (City Planning Board, 2011)
Government Support
Without support from the government, the bicycle sharing service that is provided today
would have not been able to succeed like it is today. It is the same for the car-sharing service.
As a huge cost project, as well as a government planning project, the government takes an
important part in it.
Locations
It is difficult to set the locations. Urban land is limited and expensive; the old city urban
land is already saturated and can’t provide parking spaces for car-sharing. But for New City, it is
under the construction, car-sharing there may be in the planning. Car-sharing service can have
a test in the New City and then expands to the whole city.

27
Chapter 4: Methodology
The goal of this project was to prepare an in depth feasibility study of launching a car-
sharing service in Hangzhou. Furthermore, we were asked to analyze four aspects; social,
marketing, technological and financial; of launching such a service. We achieved these goals by
analyzing the infrastructure of the city Hangzhou, similar existing services within the city and
successful car-sharing services around the world. We employed a number of methods to
accomplish these goals and objectives including data collection from surveys and interviews,
cross analysis between taxi, private cars and car-sharing, location analysis and feasibility study.
The flowchart below shows the entire process that we went through to achieve our goals.
Figure 7: Methodology Flow Chart
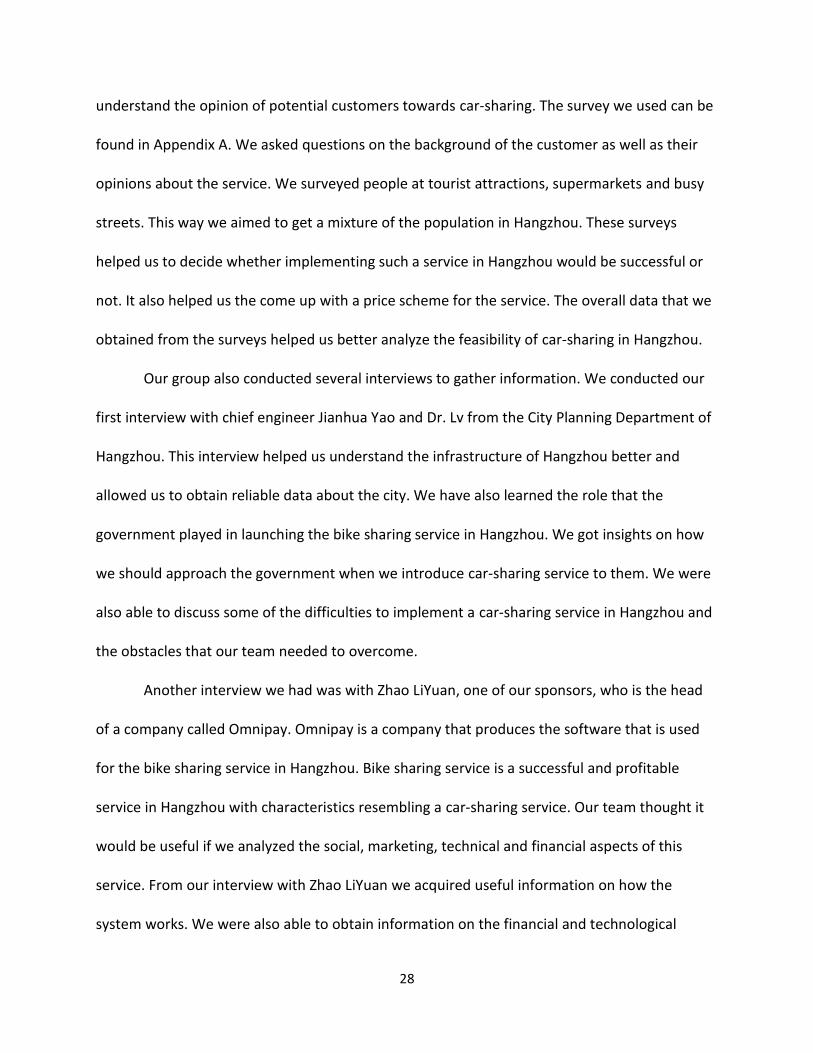
One of the methods that we used to gather information was conducting surveys. We
decided that it would be helpful for our project and our sponsors if we identified some
characteristics of the population in Hangzhou. We prepared a survey that would help us
Surveys
Interviews
Social Impacts Analysis
Marketing Analysis
Location Analysis
Cross Analysis Financial Plan
28
understand the opinion of potential customers towards car-sharing. The survey we used can be
found in Appendix A. We asked questions on the background of the customer as well as their
opinions about the service. We surveyed people at tourist attractions, supermarkets and busy
streets. This way we aimed to get a mixture of the population in Hangzhou. These surveys
helped us to decide whether implementing such a service in Hangzhou would be successful or
not. It also helped us the come up with a price scheme for the service. The overall data that we
obtained from the surveys helped us better analyze the feasibility of car-sharing in Hangzhou.
Our group also conducted several interviews to gather information. We conducted our
first interview with chief engineer Jianhua Yao and Dr. Lv from the City Planning Department of
Hangzhou. This interview helped us understand the infrastructure of Hangzhou better and
allowed us to obtain reliable data about the city. We have also learned the role that the
government played in launching the bike sharing service in Hangzhou. We got insights on how
we should approach the government when we introduce car-sharing service to them. We were
also able to discuss some of the difficulties to implement a car-sharing service in Hangzhou and
the obstacles that our team needed to overcome.
Another interview we had was with Zhao LiYuan, one of our sponsors, who is the head
of a company called Omnipay. Omnipay is a company that produces the software that is used
for the bike sharing service in Hangzhou. Bike sharing service is a successful and profitable
service in Hangzhou with characteristics resembling a car-sharing service. Our team thought it
would be useful if we analyzed the social, marketing, technical and financial aspects of this
service. From our interview with Zhao LiYuan we acquired useful information on how the
system works. We were also able to obtain information on the financial and technological
29
details on bike sharing service. This interview allowed us to compare the bike sharing service
and potential car-sharing service in Hangzhou.
Our team also conducted an interview with an electric car manufacturer, Zotye, in
Hangzhou. The Chinese government is trying to promote electric cars in China. Our team
thought that utilizing electric cars in the car-sharing service would interest the government into
investing in a car-sharing service. A car-sharing service could be a good way to advertise electric
cars in Hangzhou. Utilizing electric cars would also help the lower harmful emissions into the
air. The interview with Zotye gave us insight about the technological and financial aspects of
electric cars. This information helped us decide whether to utilize electric cars in the car-sharing
service.
With the information we gathered through our surveys, interviews and research we
prepared analysis on the social and marketing aspects of implementing a car-sharing service in
Hangzhou. In analyzing the social aspects we took into consideration the impacts electric cars,
traffic, and environmental issues that would arise due to implementing a car-sharing service.
We felt that these three issues would be the most important aspects in implementing the
service. We also looked into the marketability of the service in the Hangzhou area by creating
possible marketing plans as well as what would be the best way to market this new service to
the people of Hangzhou. By focusing on the social and marketing aspects of the car-sharing
service, we created a better outlook of how car-sharing would work in Hangzhou.
Next, our team performed a location analysis. We have taken into consideration several
factors such as population density, low vehicle ownership, mixed land uses and proximity to
transit areas that would make a location suitable for a car-sharing station. This allowed us to

30
come up with the locations that would attract more people. We made several
recommendations on the plausible locations for the first year of the car-sharing in Hangzhou.
Our research showed us that the main competitors of car-sharing in Hangzhou are
private cars and taxi. Cost saving is one of the most important motivation for members to join a
car-sharing service. Therefore we did a comparison between the yearly cost of owning a private
car and car-sharing service. We also compared the cost of car-sharing to taxis. Through these
comparisons we found out scenarios where car-sharing is cheaper or more expensive. This
allowed us to make recommendations to better compete with private cars and taxis.
We used all the previously mentioned techniques to help us gather information to
prepare a realistic and accurate financial analysis. We came up with acceptable prices for
variable and fixed costs. We also estimated the number of customers and utilization of the cars
according to the past performance of other car-sharing services. We then prepared a price
scheme using the information we obtained from our surveys and interviews. With this
information we were able to prepare a financial analysis. This analysis showed us whether
launching a car-sharing service in Hangzhou is profitable or not.
By fulfilling our objectives and goals, we successfully provided an in depth feasibility
study for our sponsors. Furthermore, we provided useful recommendations for further research
on the subject. We hope our findings will allow our sponsors to take wise steps in launching a
car-sharing service in Hangzhou.
31
Chapter 5: Results and Findings
5.1 Surveys
To help gather data for the feasibility of car -sharing we thought it would be necessary
to create a survey to help with the car-sharing analysis in Hangzhou. The survey was done by
using a random sampling method by picking out people on the street in the many popular parts
of Hangzhou. These places in Hangzhou included: West Lake, Wumart, Hangzhou Tower,
Hubing Square, Wushan Square, Wensan Road, Huanglong Gym, Yigao Digital Square, Citizen
Centre, and Qingchun Road. We thought it was necessary to have a survey in our study in order
to find key information about how people reacted about car-sharing and whether they would
accept it. Also the survey served as a baseline in our financial analysis in order to get a
reasonable per hour charge and also was used to find out information for marketing car-
sharing. As you will see we were able to analyze questions we asked in order to find valuable
information about the social, marketing, financial, and location parts in our study.
By the end of the survey we were able to get a total of 414 surveys from a wide variety
of people and got a starting basis to see what people think about car-sharing. In Appendix A,
you can see a sample of the exact survey that was given. We asked ten multiple choice
questions in order to make the survey compact and effective to get a high a response rate.
Below are the data charts of our results and the exact numbers of the results can be found in
the excel spreadsheet in Appendix B.

32
Figure 8: Survey Results Question 1
In the first question in our survey we thought it would be important to ask the audience
whether they were male or female. We did this so we could keep track of who we ask so we
could get as close to an even mix from both genders. Also the question served as a baseline in
other questions to help us evaluate if any questions favor males over females or vice versa. In
the end of our survey we used information like this to help us find similarities and differences
between gender and the car-sharing relevant questions we asked.
Male58%
Female42%
Male vs. Female

33
Figure 9: Survey Results Question 2
The second question of our survey focused on analyzing the age groups of the people
we asked. We wanted to gain this information to help us find the possible age groups of the
potential car-sharing users. We thought this information could be helpful in order to help find
the marketability of the service and analyzing information with the other questions we asked.
As you can see in the figure above our general population ranged from 18-40 which would most
likely be the people we would target the service towards.
18-2545%
26-4046%
41-506%
>503%
Age Groups
34
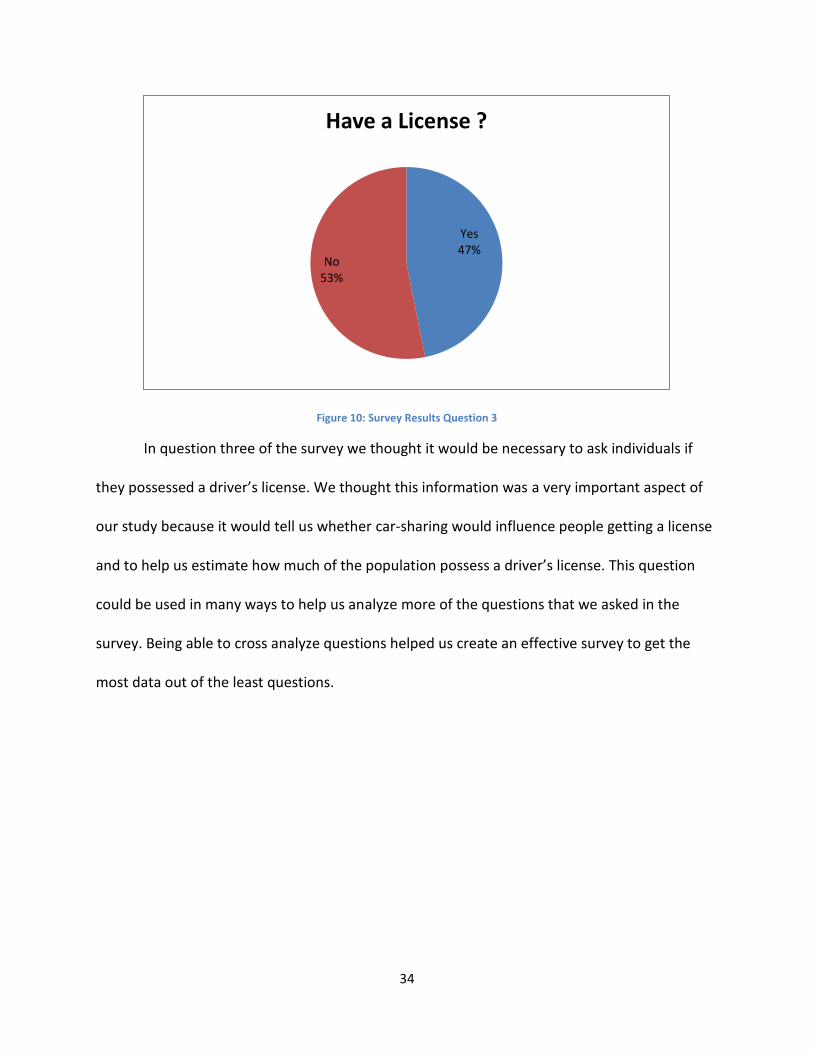
Figure 10: Survey Results Question 3
In question three of the survey we thought it would be necessary to ask individuals if
they possessed a driver’s license. We thought this information was a very important aspect of
our study because it would tell us whether car-sharing would influence people getting a license
and to help us estimate how much of the population possess a driver’s license. This question
could be used in many ways to help us analyze more of the questions that we asked in the
survey. Being able to cross analyze questions helped us create an effective survey to get the
most data out of the least questions.
Yes47%
No53%
Have a License ?

35
Figure 11: Survey Results Question 4
In question four we asked the individuals if they were a tourist, resident, or other (told
them to specify). This information was critical for us to see the scope of people we were getting
in our study. We wanted to get a variety, but wanted to get specifically the opinions of
residents in Hangzhou. Getting opinions of the people who would be a part of the potential car-
sharing service would be valid information for us because their opinions would be the ones that
the government would be interested in. This information also showed us whether resident or
other people would be more interested in the service. Knowing what kinds of people would use
the system is crucial in the final analysis. From the survey results, we had almost 50% resident
response rate which gave us a great input on how local people think about having such a
service available.
Resident49%
Tourist18%
Other33%
Are you a

36
Figure 12: Survey Results Question 5
The fifth question in our survey asked if you are a tourist, what mode of transportation
you use. This question helped us get an idea of what kinds of transportation tourists are using
and whether they would use car-sharing if it was available. The importance of this question was
to see what modes of transportation tourists are attracted to and whether they would change
to car-sharing. This question helped us analyze the traffic in Hangzhou by seeing what
transportation modes become more affected by tourism. The information in this question
proved to be helpful in analyzing the transportation habits of tourists coming to Hangzhou. We
put a car-sharing option in the question to see if people would use the service if it was an
available mode of transportation.
Car-sharing27%
Rent Car9%
Taxi31%
Other33%
Tourist Transportation

37
Figure 13: Survey Results Question 6
In question six of our survey we asked what are your estimated monthly transportation
costs. This figure was important to help us assess a possible charge for the car-sharing service
and give us an idea of how much people spend in their traveling costs monthly. Based on the
feedback we received, most people would likely use low cost modes of transportation that have
a flat rate (i.e. buses) or free modes of transportation (i.e. owning a bicycle).
100-15044%
150-30026%
300-45011%
450-6004%
>60015%
Transportation Expenses

38
Figure 14: Survey Results Question 7
In question seven of the survey, we wanted to ask the individual what is their primary
source of transportation they use on a daily basis. This information was useful in our traffic
analysis to see which modes of transportation were being used the most. Knowing this
information gave us a target model to argue that car-sharing could free up usage on these types
of transportation and create better traffic conditions. Looking at the feedback we received in
our survey, many people choose the bus as a primary mode of transportation.
Car11%
Bicycle17%
Taxi14%
Walk13%
Bus40%
Other5%
Primary Transportation
39
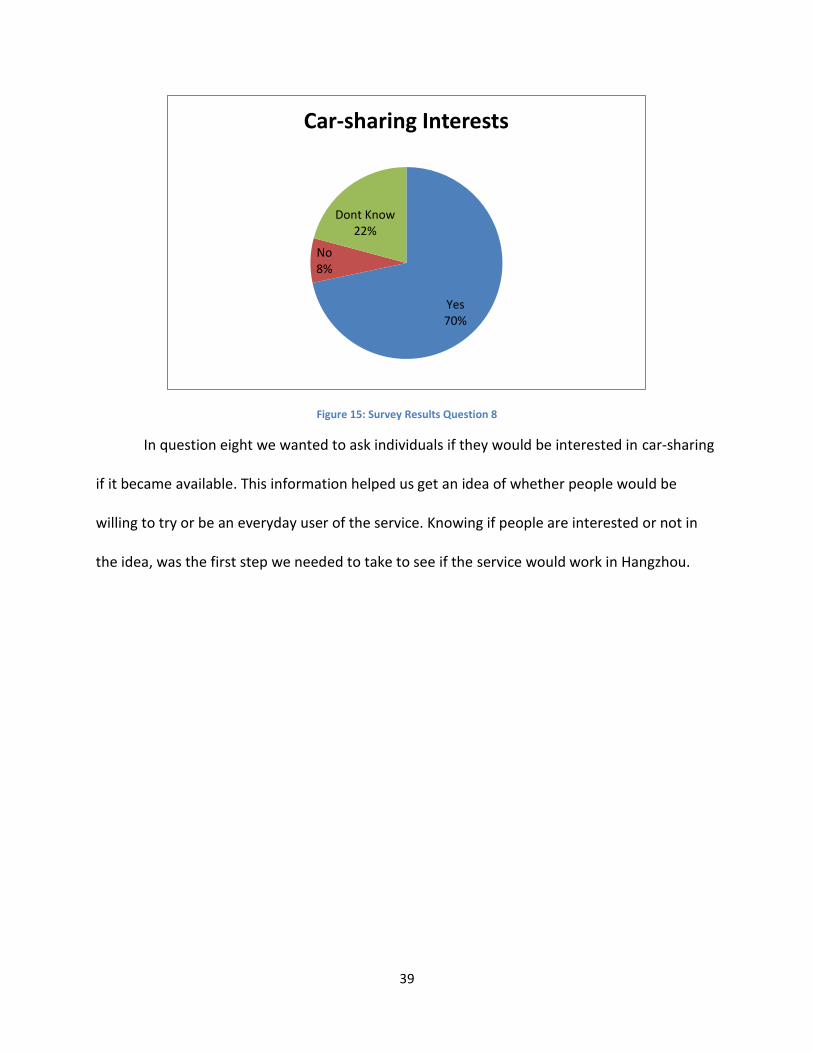
Figure 15: Survey Results Question 8
In question eight we wanted to ask individuals if they would be interested in car-sharing
if it became available. This information helped us get an idea of whether people would be
willing to try or be an everyday user of the service. Knowing if people are interested or not in
the idea, was the first step we needed to take to see if the service would work in Hangzhou.
Yes70%
No8%
Dont Know22%
Car-sharing Interests

40
Figure 16: Survey Results Question 9
Question nine asked individuals how much per hour charge they would be willing to pay
for a car-sharing service. The information gathered from this question was crucial in helping
develop an accurate per hour charge figure in our financial analysis. Knowing how much people
are willing to pay per hour is our most sensitive figure in our analysis and is the most important
number if the service wants to reach profitability quickly. Based on this information we found
that less than 50 Yuan was an accurate figure to start with.
<5061%
50-6028%
61-708%
71-802%
>811%
How Much Willing to Pay?

41
Figure 17: Survey Results Question 10
In our last question we asked people whether they thought it would be a good idea for
the government to implement such a service. From the data we were able to get people’s
opinions on why or why not they thought the government might put such a service into the
city. This question was used to gather opinions of people on how they thought about the
government and the car-sharing system in general.
Overall the survey provided us with a substantial amount of information we used
throughout the study. It provided us with an in-depth analysis of the pricing for the car-sharing
service and also served as a reference to help us find the target customers for the service. In
section 5.4.2 it talks about how we used the survey data to analyze our target market. The
questions we asked also helped us break down the results into more specific areas. For
example, we were able to analyze people who were residents, who had a driver’s license, and
were interested in car sharing. This kind of sub-analysis was very helpful in quantifying our
Yes68%
No8%
Not Sure24%
Government Implement

42
results. Overall the surveys went very well despite having a small sample size of only 414
surveys and provided us with beneficial data.
5.2 Interviews and Site Visits
Omnipay Interview on Bicycle Sharing
The bicycle-sharing system provides on-street bicycle rentals available to be shared by
individuals who do not own a bicycle. This concept increases the number of bicycle usage in
urban environment and removes some disadvantages that user have with other mobility
services. Bicycle sharing has been implemented in many countries, in Europe and North
America, and its purpose was to encourage individuals the use of nonpolluting transportation.
In addition, the bicycle sharing offers a form of mobility for those who lack the resources to
transport. Due to the collaborative consumption of this transportation form, greenhouse gas
and air pollution are potentially reducing.
Before implementing the bicycle-sharing project in Hangzhou, the government and city
planner had to gather different information to make decision. The city’s infrastructure should
provide road space for the bicycle in order for people to travel, the stations location need to be
located in high transited areas, there needs to be a high population willing to use and afford the
service.
Hangzhou tourism activity is high. The daily average of visitors in downtown is 878,800
and in 2020 it’s approximated to be about 1,635,500 visitors during tourism season. The city’s
infrastructure facilitates transportation for this population and it is ideal for bicycle-sharing
service since the roads provide space for bicycle users. Currently, 84% of the roads in Hangzhou

43
are divided into automobile lanes and bicycle lanes by physical barriers, 10.5% by painted lines,
and 5.5% are not divided. The roads are also in good condition which is important when driving
bicycles.
On May 1, 2008 61 service stations with 2500 bicycles in total were put into operation.
There were 31 permanent service stations and 30 mobile stations. These stations were located
only in scenic areas in Hangzhou such as West Lake, Lake District and WuShan Square. The
station location areas were selected due to their business activities, tourism and leisure, their
large flow of people daily, their high foreign workers concentration, and the short distance
travel demand. The lack of parking space and the limited small cars’ travel was another factor
that influenced in determining the station’s location.
The bicycle-sharing company set different fees depending on the amount of time the
user uses the bicycle. Table 1 shows the prices for bicycle usage in Hangzhou. The prices are the
same for all locations. Today, 60% of the users go beyond 120 minutes of bicycle usage. In
scenic areas, up to 90% of the users use more than 60 minutes and to be more precise, in Lake
District and WuShan Square 70% of the users use the bicycle-sharing for more than 60 minutes.
88.9% of total rentals come from scenic areas since the 15 most popular service centers are
located there.
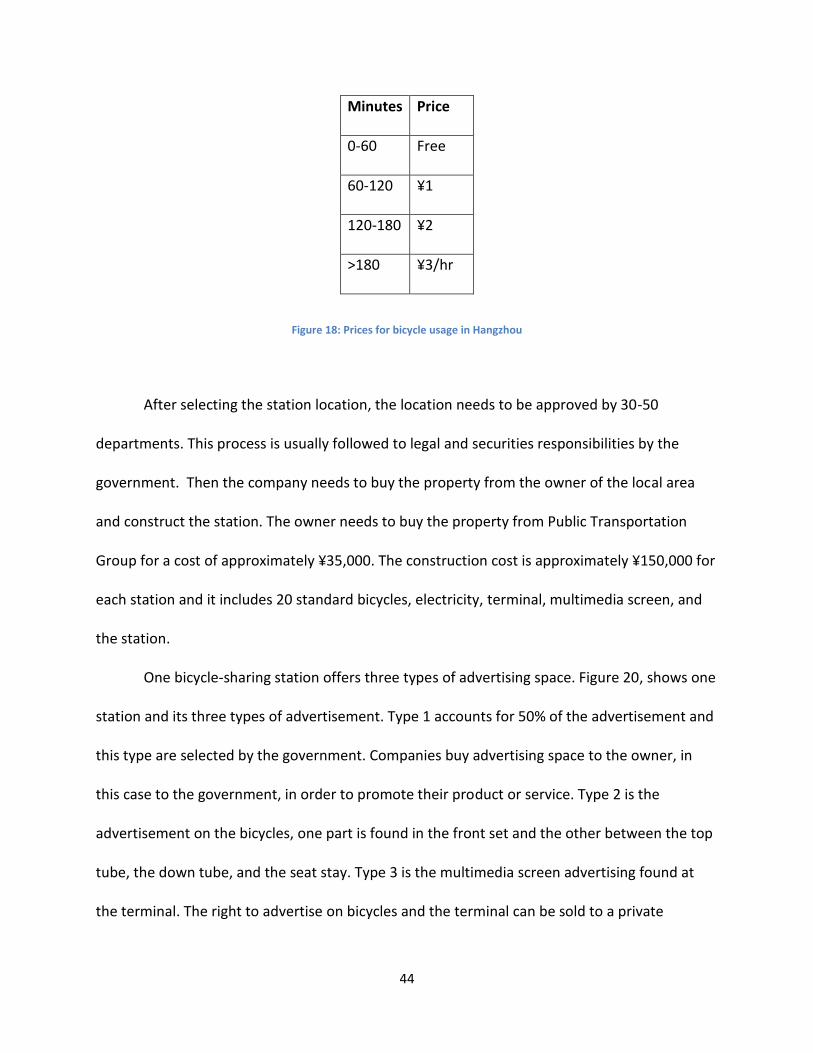
44
Minutes Price
0-60 Free
60-120 ¥1
120-180 ¥2
>180 ¥3/hr
Figure 18: Prices for bicycle usage in Hangzhou
After selecting the station location, the location needs to be approved by 30-50
departments. This process is usually followed to legal and securities responsibilities by the
government. Then the company needs to buy the property from the owner of the local area
and construct the station. The owner needs to buy the property from Public Transportation
Group for a cost of approximately ¥35,000. The construction cost is approximately ¥150,000 for
each station and it includes 20 standard bicycles, electricity, terminal, multimedia screen, and
the station.
One bicycle-sharing station offers three types of advertising space. Figure 20, shows one
station and its three types of advertisement. Type 1 accounts for 50% of the advertisement and
this type are selected by the government. Companies buy advertising space to the owner, in
this case to the government, in order to promote their product or service. Type 2 is the
advertisement on the bicycles, one part is found in the front set and the other between the top
tube, the down tube, and the seat stay. Type 3 is the multimedia screen advertising found at
the terminal. The right to advertise on bicycles and the terminal can be sold to a private
45
company for ¥23,000,000 each year. This revenue from 2,000 stations belongs to the
government.
There are three types of technologies involved in the bicycle-sharing system: RFID cards,
software, and multimedia terminal. RFID cards are provided to the bicycle-sharing company by
OmniPay. The bicycle user will use the RFID card in two ways. First, the owner of the card will
deposit money to the card in a terminal. A minimum of ¥200 is required by the company for the
security deposit. This is the first information that the chip needs to transfer to the remote
computer in order for the system to activate. Then, the same RFID card will unlock the bicycle
from the station. The remote computer uses software that manages and analyzes how often
people use the system. This software is also used to identify problems at the moment of
renting. The government pays approximately ¥580,000 each year for the software to OmniPay.
Today, the government gives ¥30,000 to OmniPay for maintenance of their software. The
multimedia terminal is added to the station in the construction and is where the customer can
access information to/from the card.
The government started this project with an initial investment of ¥400 million in May
2008. With this money they were able to start with 28 stations. Due to the revenue obtained
from 5,000,000 cards, the government break-even point was 6 months after the initial deposit.
In 2.5 years, the bicycle-sharing company accomplished 2,000 stations with at least 20 bicycles
in each station. Today, they have 500,000 transactions a month from all IC cards, which informs
that the business is profitable.
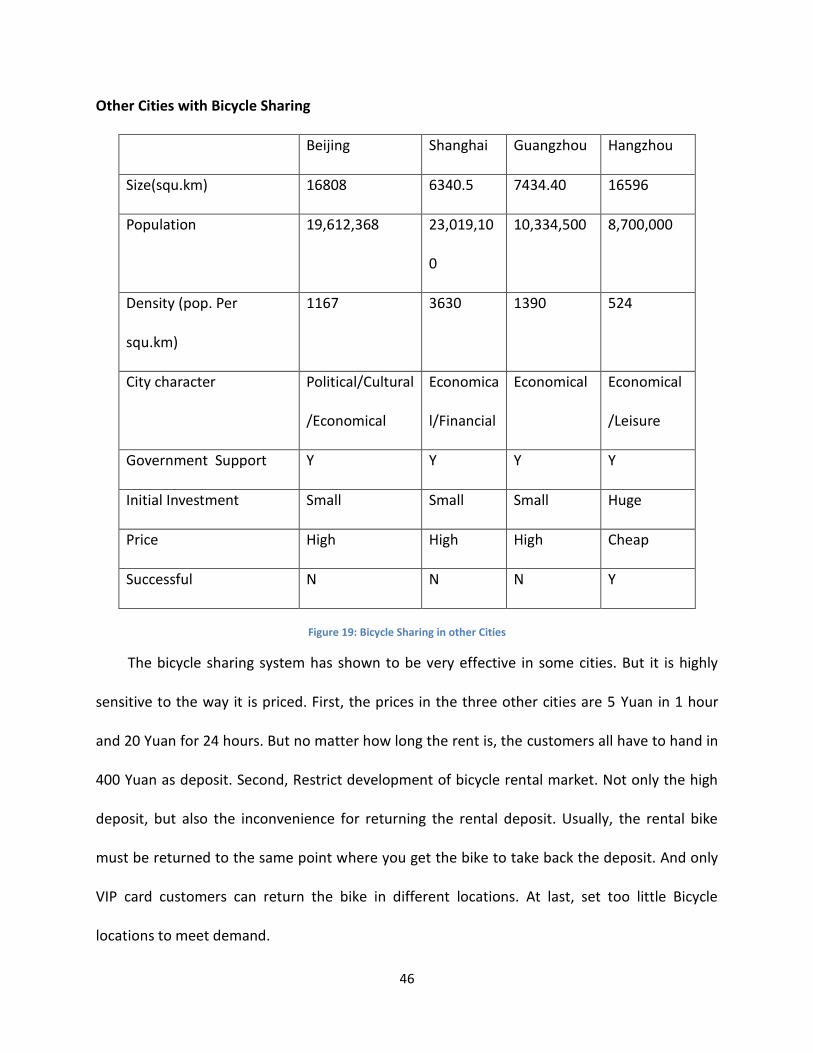
46
Other Cities with Bicycle Sharing
Beijing Shanghai Guangzhou Hangzhou
Size(squ.km) 16808 6340.5 7434.40 16596
Population 19,612,368 23,019,10
0
10,334,500 8,700,000
Density (pop. Per
squ.km)
1167 3630 1390 524
City character Political/Cultural
/Economical
Economica
l/Financial
Economical Economical
/Leisure
Government Support Y Y Y Y
Initial Investment Small Small Small Huge
Price High High High Cheap
Successful N N N Y
Figure 19: Bicycle Sharing in other Cities
The bicycle sharing system has shown to be very effective in some cities. But it is highly
sensitive to the way it is priced. First, the prices in the three other cities are 5 Yuan in 1 hour
and 20 Yuan for 24 hours. But no matter how long the rent is, the customers all have to hand in
400 Yuan as deposit. Second, Restrict development of bicycle rental market. Not only the high
deposit, but also the inconvenience for returning the rental deposit. Usually, the rental bike
must be returned to the same point where you get the bike to take back the deposit. And only
VIP card customers can return the bike in different locations. At last, set too little Bicycle
locations to meet demand.

47
On the other hand, Hangzhou is a special city, the government is very interested in create
a new model of transport, like water bus, public bicycle, electric cars and so on. The Hangzhou
government gives 5 billion start-up funds for the implementation of public bicycles that to
provide public bicycle a material basis.
The car-sharing has been promoted successfully in America and UK, and has a good impact
on environment and the traffic, as well as it is a new mode of transportation, the government
will be interested in it.
Figure 20: Bicycle Sharing Station
1
2
3

48
Hangzhou Urban Planning Bureau
The following information was provided to us in the interview with the Hangzhou City
Planning and Design Bureau.
Geography
Hangzhou is located in northern Zhejiang province, eastern China, at the southern end of
the Grand Canal of China, on the plain of the mid-lower reaches of the Yangtze River. As a core
city of the Yangtze River Delta, its position on the Hangzhou Bay 180 kilometers southwest of
Shanghai gives it economic power, and moreover. The prefecture-level region of Hangzhou
extends west to the border with the hilly-country Anhui Province, and east to the flat-land near
Hangzhou Bay. The city center is built around the eastern and northern sides of the West Lake,
just north of the Qiantang River.
Figure 21: Map of China (City Planning Board, 2011)

49
Administrative division
Hangzhou is the capital and largest city of Zhejiang Province in Eastern China. Governed as
a sub-provincial city, and as of 2010, its entire administrative division or prefecture had a
registered population of 8.7 million people. The Urban agglomeration of the Hangzhou
metropolitan area has a resident population of 6.242 million as of 2010, of which 4.36 million
are permanent residents. Hangzhou Region or prefecture-level city contains the Hangzhou
metropolitan area (eight districts), 3 metropolitan counties, and 2 ordinary counties. The
central six urban districts occupy 682 km² and have 1,910,000 people. The two suburban
districts occupy 2,642 km² and have 1,950,000 people.

50
It has direct jurisdiction over 8 districts, 3 county-level cities and 2 counties (See figure
below)
Map Subdivision Hanzi Area Population
(approx.)
Hangzhou City Proper
■ Gongshu-qu 拱墅区 87.49 km² 551,900
■ Xiacheng-qu 下城区 31.46 km² 526,100
■ Shangcheng-qu 上城区 18.30 km² 344,600
■ Jianggan-qu 江干区 210.22 km² 998,800
■ Xihu-qu 西湖区 308.70 km² 820,000
■ Binjiang-qu 滨江区 72.02 km² 319,000
Hangzhou Suburban and Rural
■ Yuhang-qu 余杭区 1,223.56 km² 1,170,300
■ Xiaoshan-qu 萧山区 1,420.00 km² 1,511,300
■ Lin'an-shi 临安市 3,126.80 km² 566,700
■ Fuyang-shi 富阳市 1,831.20 km² 717,700
■ Jiande-shi 建德市 2,321.00 km² 430,800
■ Tonglu-xian 桐庐县 1,825.00 km² 406,400
■ Chun'an-xian 淳安县 4,427.00 km² 336,800
Figure 22: Districts of Hangzhou

51
Tourism
Hangzhou is renowned for its historic relics and natural beauty. It is often known as one of the
most beautiful cities in China, also ranking as one of the most scenic cities. Although Hangzhou has been
through many recent urban developments, it still retains its historical and cultural heritage. Today,
tourism remains an important factor for Hangzhou's economy. One of Hangzhou's most popular sights is
the West Lake, a UNESCO World Heritage Site. The West Lake Cultural Landscape covers an area of 33
km2 and includes some of Hangzhou's most notable historic and scenic places. Adjacent to the lake is a
scenic area includes historical pagodas, cultural sites, as well as the natural beauty of the lake and hills.
There are two causeways across the lake.
Economy
Hangzhou's economy has rapidly developed since its reconstruction in 1992. It is an
industrial city with many diverse sectors such as light industry, agriculture, textile, it is also
considered as an important manufacturing base and logistics hub for coastal China.
In 2001, the GDP of the whole city amounts to RMB 156.8 billion which ranks the second
among all of the provincial capitals except for Guangzhou. The city has more than tripled GDP in
the last eight years, with GDP increasing from RMB ¥156.8 billion in 2001 to RMB ¥594.582
billion in 2010 and GDP per capita increasing from USD 3,025 to USD 10,103.
The city also has developed many new industries since; they include medicine, information
technology, heavy equipment, automotive components, household electrical appliances,
electronics, telecommunication, fine chemicals, chemical fiber and food processing.

52
Transportation
Airport
Hangzhou is served by the Hangzhou Xiaoshan International Airport, which provides direct
service to many international destinations such as Germany, Thailand, Australia, Japan, Korea,
Malaysia, India, Vietnam, Ethiopia, Singapore, and the Netherlands. Regional routes reach Hong
Kong, Taiwan and Macau. It has an extensive domestic route network within the PRC and is
consistently ranked top 10 in passenger traffic among Chinese airports. Hangzhou Xiaoshan
International Airport has two terminals, namely Terminal A and Terminal B. The smaller
Terminal A serves all international and regional flights while the bigger Terminal B solely
handles domestic traffic. The airport is located just outside the city in the Xiaoshan District with
direct bus service linking the airport with Downtown Hangzhou. The ambitious expansion
project will see the addition of a second runway and a third terminal which will dramatically
increase capacity of the fast-growing airport that serves as a secondary hub of Air China. A new
elevated airport express highway is under construction on top of the existing highway between
the airport and downtown Hangzhou. The second phase of Hangzhou Metro Line 1 has a
planned extension to the airport.
Railway
Hangzhou sits on the intersecting point of some of the busiest rail corridors in China. The
city's main station is Hangzhou Railway Station (colloquially the "City Station"). There are
frequent departures for Shanghai with approximately 20-minute headways from 6:00 to 21:00.
Non-stop CRH high speed service between Hangzhou and Shanghai takes 45 minutes and leaves
every hour (excluding a few early morning/late night departures) from both directions. While
53
other CRH high speed trains that stop at one or more stations along the route complete the trip
in 59 to 75 minutes. Most other major cities in China can also be reached by direct train service
from Hangzhou. The Hangzhou East Railway Station (colloquially "East Station"), is closed for
renovation until late 2011. Once completed, it will become one of the biggest rail traffic hubs in
China consisting of 15 platforms that will house the High Speed CRH service to and from
Shanghai, Nanjing, Changsha, Ningbo, and beyond. The subway station beneath the rail
complex building is a stop along the Hangzhou Metro Line 1.
Direct trains link Hangzhou with more than 20 cities, including 4 daily services to Beijing
(1650 km), more than 45 daily services to Shanghai (200 km) and it reaches as far as Ürümqi.
The Shanghai–Hangzhou High-Speed Railway serviced inaugurated on October 26, 2010. The
service is operated by the CRH 380A and CRH 380BL train sets which travel at a maximum speed
of 350 km/h, shortening the duration of the 202 km trip to only 45 minutes.
The construction of the Shanghai-Hangzhou Maglev Train Line has been debated for
several years. On 18 August 2008 Beijing Authorities gave the project the go-ahead to start
construction in 2010. Transrapid has been contracted to construct the line. However, as of 2011
construction has not yet started.
Highway
Central, north, south and west long-distance bus stations offer frequent coach service to
nearby cities/towns within Zhejiang province, as well as surrounding provinces. And as of 2010,
the government had totally invested ¥99.99 billion to build 15,266 km highway, including 502
km expressway to service 1,832,500 Motor vehicles, as well as 942,400 private cars.

54
City Buses
Hangzhou has an efficient public transportation network, consisting of a modern fleet of
regular diesel bus, trolley bus, hybrid diesel-electric bus and taxi. Hangzhou is known for its
extensive Bus Rapid Transit network expanding from downtown to many suburban areas
through dedicated bus lanes on some of the busiest streets in the city. As of 2010, there were
548 bus routes and among this 15 were new, and the total length of bus routes is 87.6 km.
7,120 buses run across the roads to service 350,000 passengers per day and 12.8 billion for one
year.
Taxi
Taxis are also a very popular form of transportation in the city of Hangzhou. With its line of
the newest Hyundai Sonatas and Volkswagen Passats, and tight regulations, the city's taxi
service is rated amongst the best in the country. According to the public information of
Hangzhou government, there are 65 taxi companies and more than 10,215 taxis by June, 2011.
In early 2011, also 30 electric taxis were deployed in Hangzhou. 15 were Zoyte Langyues and
the other 15 were Haima Freemas, however in April, one Zoyte Langye caught fire and all of the
electric taxis were taken off the roads later that day. Despite this electric vehicle scare, the city
still intends to have a fleet of 200 electric taxis by the end of 2011.
Subway
The Hangzhou Metro is currently under construction. It is expected to have 13 lines with
total distance of 480 km upon completion. Phase I, which consists of Line 1, the southern
segment of Line 2 and part of the Line 4 that links Line 1 and 2.The first subway line is expected
to enter into service by October 1, 2012.

55
5.3 Social Impacts of Car-sharing in Hangzhou
5.3.1 Environmental Concerns
The implementing of a car-sharing service in a city brings up many questions about
costs, efficiency, and risks of car-sharing. But one of top concerns on people’s minds these days
is how it will affect the environment. Yes, you can argue that car-sharing puts more cars on the
road which makes more air pollution. But the question people should ask themselves with
implementing a car-sharing service is how many cars it takes off the road. According to Zipcar,
every Zipcar that is on the road replaces fifteen privately owned cars. In other words, this takes
away roughly thirty-five tons of carbon dioxide emissions a year and 42,150,000 grams of other
harmful greenhouse gases (Rui, 2010). For most people, taking fifteen cars off the road on top
of eliminating tons of harmful emissions into the atmosphere per one shared car is a good trade
off than owning a private car.
Every vehicle on the road impacts the environment differently depending on numerous
factors including engine size, design, fuel type, etc. In Zipcar’s design of their car-sharing
system, they tried to incorporate cars based on what people would use them for. They have
compact cars for the everyday users, light duty trucks for construction workers, luxury vehicles
for people looking to impress, and SUVs for families. Each of these cars emit pollutants
differently and Zipcar tried to pick cars in accordance with the emission factors they create in
order to put the greenest and most environmentally safe vehicles on the road. The figure below
shows the top eight cars Zipcar uses in their fleet and the CO2 emissions grams per mile each
vehicle gives off.

56
Cars Est. CO2 emitted (Gram per Mile)
Toyota Prius <188
Honda Civic Hybrid 188-233
Mini Cooper 280-325
Smart Car Coupe 234-279
Volvo S80 372-417
BMW 3 series 372-418
Toyota Tacoma 464-509
Honda CRV 372-417
Figure 23: Zipcar Car Emissions (U.S. Environmental Protection Agency, 2011)
Having a car-sharing service that strives to put the environment as a priority shows the
company’s dedication to help the world become a cleaner place. Not just adding the most fuel
efficient cars on the road but also electric vehicles will get environmentalists thinking car-
sharing is the way of the future. As a potential business the car-sharing service will need to
emphasize if they can get a minimum of 10% of a city’s population to adopt car-sharing as a
mode of transportation. They can help save billions of gallons of gas and oil every year,
eliminate tons of greenhouse gases, and save money compared to private car ownership.
According to Zipcar, every member saves roughly $500 USD per month by car-sharing over
private car ownership. On top of that people tend to drive less, creating less harmful emissions
entering the atmosphere every year. Appendix D talks about the differences of the costs of car
ownership versus sharing. This information gives an idea of cost savings and how many vehicles
are being taken off the roads. Not only is car-sharing going to impact the future of the
environment, it will soon be the future of how we do things with the oil crisis amongst us
(Zipcar, Inc).

57
5.3.2 Traffic in Hangzhou and Car-sharing’s Impact
There are several factors that contribute to the traffic problems in Hangzhou. First of all,
West Lake is located in the center of the city, so the tourists increase the burden of downtown
traffic, especially on weekends and holidays. Secondly, because there is no purchase limit of
private cars, Hangzhou has an increasing number of motor vehicles on the road. Thirdly, the
education in the new city is not as good as it is in downtown, so many people send their
children to downtown to have a better education. Another important reason is that urban
public transport is not so convenient or fast enough to convince people to use it rather than
private cars. If the buses are on time, and they drive quickly, there will be more and more
people choosing public transportation. So as of now, Hangzhou does not have a sufficient plan
to solve these congestion issues.
With car-sharing implementation, many people asked in our surveys: “why should I pay a
per hour charge if I’m going to sit in traffic?” Depending on what time of day you use the
system and how the overall system is implemented, car-sharing will not add any more impact
to the already congested roads. On the other hand, it will help free up the roads by taking off
private cars off the road and give people another option of commuting on an everyday basis. If
the system is implemented in a way where you can drop the cars off at any car-sharing parking
lot, you will be able to park and walk from destination during busy hours or use the every so
popular bicycle sharing to get around. The primary goal of car-sharing is to be convenient, cost
saving, environmentally friendly, and overall to get people driving less. If the system can’t be
implemented in a way to offer this type of service then it shouldn’t be implemented in the first
place. Looking at the figure below, it shows Hangzhou City Planning Board’s traffic plan and can
give us a base point of where proper locations of implementing the system could take place in

58
order to minimize the traffic impact of the system. If we can create an implementation plan
that favors less traffic, we could see that the car-sharing service will be more useful in areas
that are less developed or “newer” areas of the city. According to the City Planning Board’s
recommendations, we should implement in “newer” districts to see how the system will work
and further educate use on how the overall system works and if traffic will be affected.
Urban Traffic Planning
Figure 24: Urban Traffic Planning (City Planning Board, 2011)
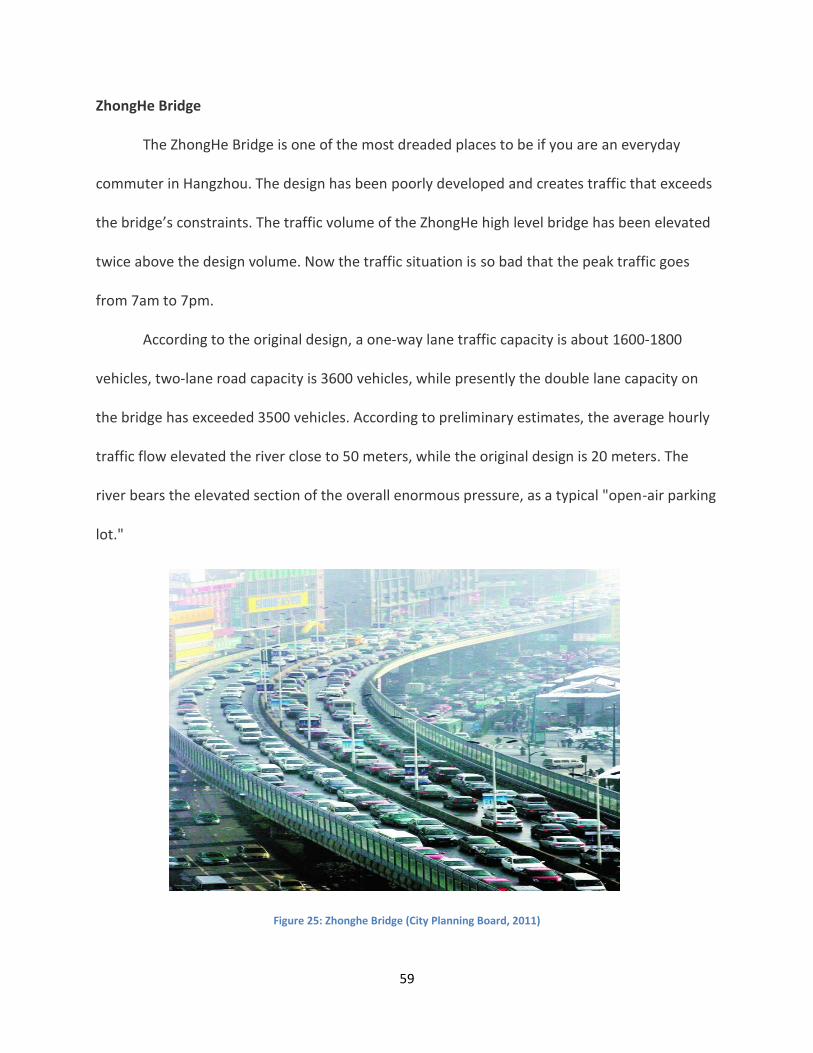
59
ZhongHe Bridge
The ZhongHe Bridge is one of the most dreaded places to be if you are an everyday
commuter in Hangzhou. The design has been poorly developed and creates traffic that exceeds
the bridge’s constraints. The traffic volume of the ZhongHe high level bridge has been elevated
twice above the design volume. Now the traffic situation is so bad that the peak traffic goes
from 7am to 7pm.
According to the original design, a one-way lane traffic capacity is about 1600-1800
vehicles, two-lane road capacity is 3600 vehicles, while presently the double lane capacity on
the bridge has exceeded 3500 vehicles. According to preliminary estimates, the average hourly
traffic flow elevated the river close to 50 meters, while the original design is 20 meters. The
river bears the elevated section of the overall enormous pressure, as a typical "open-air parking
lot."
Figure 25: Zhonghe Bridge (City Planning Board, 2011)

60
5.3.3 Social Impact of Electric Cars
The Chinese Academy of Social Sciences released in December 2010 the "Asia Pacific
Blue Book" that in 2010, China has become the most important export market. Blue Book
pointed out that after the World Financial Crisis, the Chinese economy made up its losses in
GDP created by Europe and the United States having less of a demand during the crisis. But
since the crisis has started, the demand for goods in China has declined in these countries.
China's GDP is more than $4 trillion, ranking second in the world. At the same time, China's
domestic economic output has accounted for only 36% of the total economy. This proportion is
the lowest among the developed countries in Asia. China's economic development still has a lot
of room for growth and development in the future (Rui, 2010).
With China's rising economic output, energy consumption has showed a sharp upward
trend. According to the National Bureau of Statistics in March 2011, The Republic of China’s
2010 National Economic and Social Economic Development Statistics Report ", China's total
annual consumption of coal is 32.5 million tons. This is up 5.9% over the previous year, of
which , the national coal consumption increased by 5.3%, the original consumption grew 12.9%,
natural gas consumption grew by 18.2%, and the electricity consumption increased by 13.1 %.
The National GDP for energy consumption fell 4.01% per 10,000 Yuan. At the same time last
year, China has imported 230 million tons of crude oil. This is up 17 % which means it increased
by 3 percentage points to more than 55%, which brings China closer to the United States which
is the second largest oil importer and consumer. In 2020 China's oil import dependence is
expected to exceed 64%, which will increase the domestic energy security and will challenge
China's energy consumption structure (China Energy Development Report, 2009).

61
The automotive industry
Chinese automotive industry has developed quickly, and it has be an important part in a
rising Chinese economy. The following chart represents the 1991 - 2009 Automotive Output
and the Proportion of the Country's Industrial Production Output in 100,000 million Yuan. This
chart helps give us an idea of how many vehicles China is producing and putting on the road
over almost a 20 year period. It just goes to show the rapid development of the auto industry
and the amount of revenue it has picked up since the early 90s. Knowing this information can
help us conclude that there are ways too many cars being put on the roads and that we need to
find alternative modes of transportation to make our environmental impacts less destructive.

62
Years
Auto
Industry
(A)
Automobile Output(Current Prices) National
Industry
Output(
Current
Prices)
(B)
A/B
%
Includes:
Car Modified
Cars Motorcycle
Vehicle
Engines
Car/Motorcycle
Accessories
1991 704.5 373.5 108.8 48.3 34.2 139.7 28248 2.5
1992 1191.1 671.7 166.9 86.1 59.5 206.9 37066 3.2
1993 1792 977.6 236.7 176.2 105.1 296.4 52692 3.4
1994 2183.1 1166.4 225.6 301.8 116.6 372.7 76909 2.8
1995 2216.5 1133.1 179.8 401.1 104.3 398.2 98520 2.3
1996 2399.1 1197.6 214.1 468 94.2 425.2 99595.4 2.4
1997 2668.7 1347.3 239.2 482.7 87.1 512.4 113733.7 2.4
1998 2787.3 1392.5 272.7 466.4 98.1 557.6 67737.1 4.1
1999 3122.7 1595.6 283.8 526.1 108.5 608.7 72707 4.3
2000 3612.6 1985.8 352.7 549.6 108.8 615.7 85673.7 4.2
2001 4433.2 2524.4 389.1 561.6 99 859.1 95449 4.6
2002 6224.6 3576.8 611 549.4 171 1316.4 110776.5 5.6
2003 8357.2 5274.4 634.8 579 245 1624 142271.2 5.9
2004 9463.2 5762.7 680.1 714.9 291.7 2013.8 201722.2 4.7
2005 10223.3 5640.4 640.3 779.9 508.7 2653.9 251619.5 4.1
2006 13937.5 7429.8 813.2 903.2 623.7 4167.7 316589 4.4
2007 17242 9338.1 33 84.3 840.6 4946.1 386747 4.5
2008 18780.5 10375.4 204.5 130.9 898.5 5171.3 507448 3.7
2009 23437.8 14243.7 469.1 882.6 44.1 5798.3
Figure 26: Automobile Output (National Bureau of Statistics, 2009)

63
Note: Since 1998, the country's industrial output value of all state-owned, state-controlled and non-
state industrial enterprises above the scale of output, are not comparable with the previous; non-state
industrial enterprises above designated size refers to the skin produced sales of 500 million Yuan of
business .
According to the latest statistics from the Ministry of Transportation Bureau, as of June
2011, the country's total motor vehicle ownership is more than 217 million and 72.06 million is
private car ownership (Qiyu, 2010). About 11 cities including, Chengdu and Shanghai, have
reached over 1,000,000 privately owned cars. The number of passenger cars in the country is
about 67.85 million according to the National Bureau of Statistics.
There is no doubt that China's auto industry output for China's economic contribution is
immeasurable. But the auto industry's expansion has also brought lots of hidden dangers: The
first danger being China's energy consumption structure; making the process of economic
development in China for oil consumption increase. By having an increase in oil consumption it
further deepens China’s dependency on foreign oil. Secondly, it is causing serious
environmental pollution. According to the 2009 environmental monitoring report, the National
Key Environmental Protection says only 1/3 of the 113 cities that are a part of the National Key
Environmental Protection have not reached the standards of air quality. Many cities have a
coal-burning and car exhaust mixture characteristics of air quality problems and vehicle exhaust
emissions from nitrogen oxides and fine particles, which are directly related to the air pollution
problem. Not only are our environmentally cities not meeting air quality standards, they are
creating more problems to the people that live in the area.
As the use of electric vehicles increases, related companies will benefit from their use
including battery, electric motor, electronic control and other industries. Since the
64
development of electric vehicles and other equipment, they will provide charging stations and
related equipment so that the providers are faced with new opportunities. Any industry with
the same business, electric vehicles will also be involved in downstream automotive
distributors, service providers, insurance, financial and many other downstream businesses, a
new electric car around the whole automobile industry chain will become a new growth
opportunities. Meanwhile, the new industry for China will ease the current employment rate. It
will help create more job opportunities and help the economy rise.
To the benefit of the social well-beings of a community, electric vehicles will bring in
more social benefits. Compared with the traditional car, each electric vehicle will reduce carbon
dioxide emissions 52%. The automotive industry’s carbon dioxide emissions accounts for about
16% of the total carbon dioxide emissions. By 2020, assuming that electric vehicles account for
10% of car ownership, then electric vehicles will replace the entire automotive industry to
reduce carbon dioxide emissions by 9%. The automotive industry will then reduce carbon
dioxide emissions in the country by 1.5%. From the life-cycle perspective, the assumption that
coal-fired electricity generating a capacity of 100% of the total cases, each 1L of gasoline
combustion of greenhouse gas emissions is about 2810g. Coal consumption per kWh is about
320g; the production of electricity for each release of greenhouse gases is about 910g. In
addition, consumption of power converted to the power plant. According to the pure electric
car average, there is a 100 km average consumption over an 11 kilowatt/hour range. Traveling
10,000 kilometers in years is estimated that the average power consumption of each electric
vehicles 1100 Kilowatts a year. The average car consumes 10L per hundred kilometers of oil and
its greenhouse gas emissions of approximately 2,810,000g, and the consumption of electric

65
vehicles is about 1,001,000g per year, compared to an ordinary cars, is far below the current
impacts on the environment. The production and use of these electric cars is more
environmentally friendly than a car driving 10,000 km of oil consumption that produces carbon
dioxide emissions (per gallon of gasoline produces about 25 tons of carbon dioxide, of which
five tons of oil extraction and refining process produce the other 20 tons are produced in the
car driving). In addition, a pure electric vehicle produces only a small amount of
electromagnetic noise and mechanical noise, the noise produced is lower around 10-15dB (Rui,
2010).
Electric vehicles for China can provide a breathing room for oil production. Pure electric
vehicles powered by electricity, and even hybrid electric vehicles, can greatly reduce oil
consumption for the automotive industry. It is estimated that the traditional fuel vehicle from
mining to energy use, the average utilization rate is only 14%, while the hybrid vehicle energy
use can be increased to about 30%, greatly improving the utilization of the oil. A car costs about
2.3 tons of harmful emissions in China every year. Assuming about 72.06 million private cars,
the annual fuel consumption is about 170 million tons. The use of electric cars can release the
dependent for the oil. This is increasingly dependent on oil imports for China and has a strategic
importance for Chinas future (Jiong, 2008).
International crude oil prices, have led crude oil prices to rise. Zhejiang oil price averages
in 2011 include: 93 gasoline price 7.46 Yuan / liter, 97 # gasoline price 7.93 Yuan / liter, and the
current international crude oil prices have continued rising trend in the future the price may
have to be refreshed. And compared to prices of refined oil, electricity, Hangzhou is the peak
electricity current 0.53 Yuan / kWh, Valley Electricity was 0.29 Yuan / kWh, electricity ladder

66
0.56 Yuan / kWh, according to above are talking about, each electric vehicle consumes per year
2200 degrees, and more with the Valley power, then the cost is 638 Yuan a year, far below the
normal fuel car fuel costs a year. Spending gap will attract car owners to switch to electric
vehicles, but also make people buy a car in the future to choose when more electric cars, to
ensure the low cost car (Rui, 2010).
67
5.4 Marketing Aspects of Car-sharing in Hangzhou
The marketing-process is used to determine what products or services may interest
customers, and the strategies to use in sales, service, communications and business
development. In order to make car-sharing successful in Hangzhou we need to implement
effective forms of advertising, know who our target customers are, and be able to have a few
strategic marketing plans. In order to make higher profit margins and promote our services, we
need to implement an effective and strategic plan which starts with the following three topics
of advertising, target customers, and planning.
5.4.1 Advertising Car-sharing
Advertising is a way to let people know information about the goods or service you
will provide. There are many kinds of advertising choices, such as TV advertising, newspaper
ads, radio ads, billboards, car body advertisement, brochures, network advertisement and so
on. In the process of car-sharing propaganda, we mainly chose the following as means of
advertising:
TV advertising
Television advertising is a kind of advertising which can quickly permeate people to
receive advertising content in the shortest possible time. For advertising car-sharing in
Hangzhou we would use Zhejiang people's livelihood leisure channel. This is a very high rated
TV channel and would get high publicity for the car-sharing service. The age of the audience,
and with this great span the rating of the program, can increase the awareness of the car-
sharing in Hangzhou and this is a necessary step to extension the market of car-sharing in
Hangzhou.
68
The 1818 gold eye opened in January of 2004 and is the one program we recommend
using our advertising schemes on. At the beginning, a "three Zhejiang first" : Zhejiang program
is the longest of news program (every time of day for 55 minutes); Zhejiang first opened 24
hours of television news line media; Zhejiang first open public welfare column "searching" TV
show, for the audience to provide searching for people without a free service. (罗建, 2011)
In order to maximize the value of advertisement, we chose "1818 gold eye" as our
advertising channel. We chose this channel due to the times it airs and high ratings it receives.
Advertising on this channel adds on a 30% extra charge, so the cost is $8800 * (1 + 30%) / 5 s
Yuan. Although the cost compared other time will be improved, but high ratings will bring us a
better effect.
Newspaper advertising
The newspaper is a very popular kind of media in the daily life. Although the Internet
is now developing rapidly, it still can't replace the newspaper in mass media status. A lot of
Hangzhou citizens like to read the morning paper because reading newspapers is a part of their
daily lives. In Hangzhou, the urban express, "the Qianjiang Evening News", "the Hangzhou
Daily", "The Youth Times Newspaper" are the most popular newspapers. We chose" Qianjiang
Evening News ", because this newspaper has a special layout used to do propaganda for the car
and is very convenient for our car-sharing advertising. The newspaper advertising is easier to
show car layouts and attract people's attention.
The "Qangjiang Evening News" has a large circulation in Hangzhou, everyone knows it.
In such a market influence of the newspaper advertising can improve the car-sharing has the
popularity and we want to see the advertisement effect.

69
In "Qianjiang Evening News" we chose to run our advertisement on Wednesdays, with a
black and white page layout. The daily price for this is 10,500 Yuan, which we are going to do it
for a month, four times (住在杭州网, 2006).
The Internet
With the development of economy and the improvement of people's income, the
computer penetration rate is continually upgrading. The development of the Internet in recent
years has risen significantly. The average household owns at least one computer according to
the latest poll from China Telecom.
The website homepage advertising has become very popular in recent years on popular
search engines. The BBS or Bulletin Board System is a widely used internet website that offers
people to see new products and services that are available. Here people can read
recommendations and reviews about the products and services so they have an idea of what to
expect before they use the service or purchase the product. The BBS network platform will also
give car-sharing advertising a boost with its unique platform. The BBS website may not be as
good as some other advertising websites, but it is free and can save a large sum of advertising
costs.
Radio
It is advertising for car-sharing, so we chose the voice of traffic FM93. This is a very
popular radio station people listen to in their cars. Especially for taxis and buses, the voice of
traffic will be very timely pass on Hangzhou in all of traffic information, because its convenience
and the useful information. Many drivers like to listen to traffic reports on their commutes to
and from work on a daily basis. So this is a good publicity platform and the media for car-

70
sharing, through the voice of traffic, more drivers and passengers will learn about what is the
sharing.
The price for radio advertising is relatively cheaper than other sources of advertising.
For 10 days of the radio, we intend to do 15 days, every day can broadcast 24 times, this is
similar to the way for the car bombing type Shared services at the beginning will have the help
very much, every time is 9100 Yuan. (汽车之家, 2011)
Outdoor Billboards
In Hangzhou almost all of the highways display billboards; it is a very good kind of
advertising way due to numerous people on the roads. Because car-sharing is a new type of
service, and it requires people who must have a driver's license, it would be great
advertisement on the busy roads of Hangzhou.
The billboards should be located in Genshan Road and Peng Gen port entrance, which
is near the high speed toll stations. This is a great place to advertise since the traffic flow
through this area is very heavy and people will see the advertisement on a daily basis. So the
effect here of advertisement will be very good, a billboard price is 300000 each year, a year of
advertising should be a great way to get the service noticed. (拱墅区人民政府, 2011)
Brochures
Advertising in Brochures is the most direct way to make people realize the company's
products or services that are being offered. We will show the most important information in
the collateral, and let people directly know to what is car-sharing, and understand car-sharing
service. Brochures are relatively cheap at about 3 Yuan a brochure (according to a local graphic
shop) and we could make numerous of these to hand out on the streets.

71
Live TV Advertisement
This is a very novel form of advertising, but is only in activities limitations of the
advertisement. Advertisings job is to let people at the scene of the concept of car-sharing
deepen and offer service form. In the scene audience will have a very intuitive understanding of
the car-sharing opportunities.
There are many kinds of advertisement. We choose the above seven ways and some
other advertising methods we haven’t use because of the advertising budget or the
advertisement effect, and other aspects of the limited budget. Such as many of these products
use the advertising about the car body advertisement, but we do the car advertising, the car
manufacturers advertising or companies are our competitors, such advertisement to do way of
car body advertisement was caused by the pressure of competition.
Information about advertising
Type Cost Time
TV advertising 80,080 A week
Newspaper advertising 42,000 A year
The Internet Free No limit
Radio 136,500 15 days
Outdoor billboard 300,000 A year
Brochures 2,000 A year
Broadcast live 50,000 Half hour
Figure 27: Advertising Costs
72
5.4.2 Target Customers
Target customers are the customers we wish to attract our products and services
towards. Finding the Target customer is the work in front of marketing. Only certain target
customers can be reached and we must make sure we reach the ones willing to use the service
we will provide.
Market segmentation
Car-sharing service is similar to the Hangzhou public bicycle service; it needs better
infrastructure facilities, like the parking support and electric cars require charging stations
support. Car-sharing service prices according to time, so the customers require road conditions
should be a smooth traffic and reach a degree of accessibility requirements. For the car-sharing
service to the set locations; development of car-sharing service bases on membership system,
and application for membership requires a good social credit history, so the idea of the target
customer base is well-educated or faithful group. In Hangzhou car-sharing is a new concept, the
idea of target audience tend to the young groups, because they are more receptive to new
things.
Urban Area
The area needs to have good infrastructure, perfect health care system, a high level of
education, dining and entertainment facilities, and more adequate parking; convenient and
smooth roads, there are many transportation choices; many communities around the area ,
young live age structure . For example, around Citizen center.
New city area
Firstly, the region has young age structure of residents, it has active atmosphere,
universities gathered in a college town effect, the university students are the most active

73
groups in the community, and they are willing to try new things. Secondly, high-tech industries
are concentrated, white-collar is also the active group in this area and the high income social
groups with high levels of consumption; Thirdly, the new city area is away from the downtown,
but the road is smooth and parking space is an ample. For example: Xiasha Economic
Development Zone (Xiasha Higher Education Park), Riverside High-tech Park.
Population Subdivision According to the Survey
The following figures represent our detailed findings in our survey about people that
were interested in car-sharing. This analysis below only shows the people interested in car-
sharing and tells how we analyzed the data in order to find out who our target customers are.
Figure 28: Survey Analysis Question 1
We see from the figure above, 57% of consumers are male, 43% are female, it is
reasonable. Firstly, in the "Bulletin of Hangzhou sixth census data" shows the ratio is
51.23:48.77, in Hangzhou, men are slightly more than women; Secondly, according to the social
gender
A male57%
B female43%
A male
B female
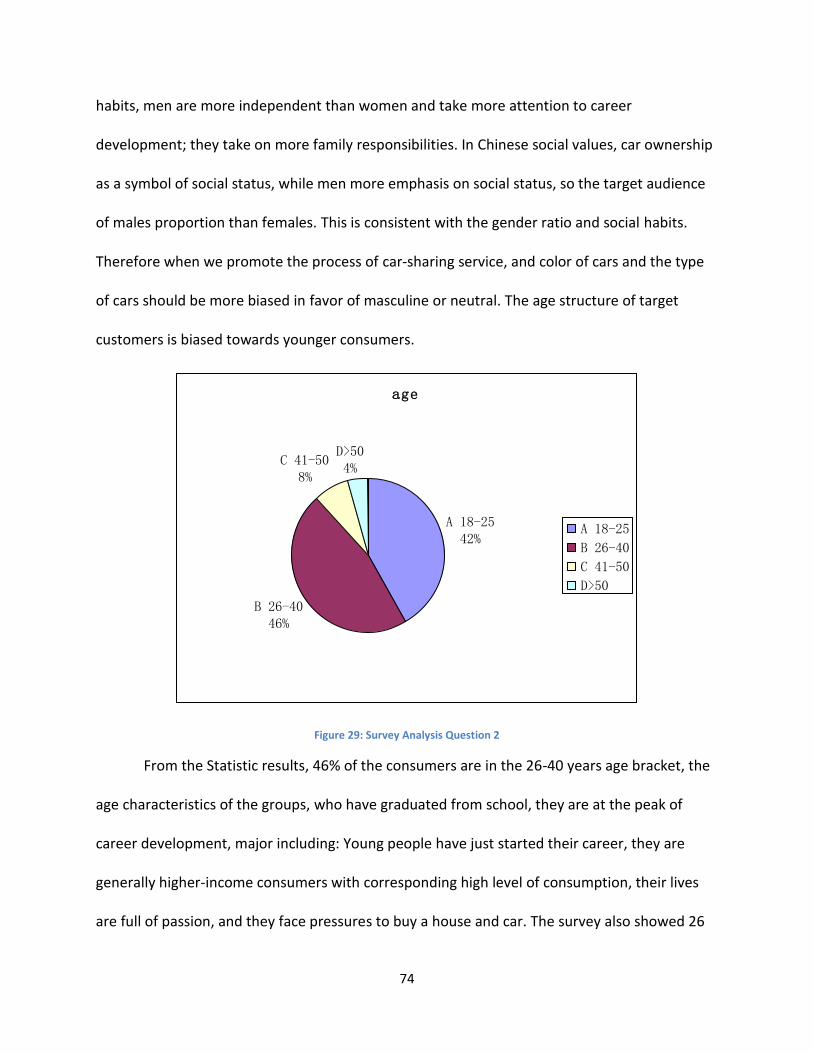
74
habits, men are more independent than women and take more attention to career
development; they take on more family responsibilities. In Chinese social values, car ownership
as a symbol of social status, while men more emphasis on social status, so the target audience
of males proportion than females. This is consistent with the gender ratio and social habits.
Therefore when we promote the process of car-sharing service, and color of cars and the type
of cars should be more biased in favor of masculine or neutral. The age structure of target
customers is biased towards younger consumers.
Figure 29: Survey Analysis Question 2
From the Statistic results, 46% of the consumers are in the 26-40 years age bracket, the
age characteristics of the groups, who have graduated from school, they are at the peak of
career development, major including: Young people have just started their career, they are
generally higher-income consumers with corresponding high level of consumption, their lives
are full of passion, and they face pressures to buy a house and car. The survey also showed 26
age
A 18-2542%
B 26-4046%
C 41-508%
D>504%
A 18-25
B 26-40
C 41-50
D>50

75
to 40 years old with a driver's license is in 50% of the population, the number of who don’t use
private cars as daily transportation mode is 65% of population who has a driver's license. Those
people will be the customers with highest degree of enthusiasm to try car-sharing service, they
have a need for a car and the data shows that car-sharing service will save them unnecessary
costs. This part of the group will choose a more affordable way by using a Car-sharing service.
These people have a successful career and have a substantial income, they own a car, they also
care about environmental protection and attention to improve the quality of life, and they are
willing to try new modes of transportation.
In the results, we can also see that 38% of the population is in 18-25 years old as the
best educated generation. These people are mostly college students or young people into the
community initially; they have lower income levels, willing to try new things. People who don’t
have a driver’s license may be inclined to get one if there was a car-sharing service.
Figure 30: Survey Analysis Question 3
whether have the driver's license
B no
52%
A Yes
48%A Yes
B no

76
In the survey of driver's license holders’ rate, almost half the population have a driver's
license and with a car-sharing service, they become the direct beneficiaries; while another 52%
of the population to become car-sharing services’ potential consumers, their car-sharing
services have great interest and have expressed the motivation for driving test or have the idea
to ask relatives, friends, to try car-sharing service. This result inspired us during the process of
marketing and advertising should cover all of the people, because the survey found that even
without a driver's license but there is great interest in car-sharing service.
Figure 31: Survey Analysis Question 4
According to the survey, it showed that more than half of the customer base are the
local resident population, and 31% is other, such as workers in Hangzhou and college students
or on business people in Hangzhou; the majority of those 31% people are the students in
Hangzhou, the number of days in Hangzhou rather long, but also more stable; car-sharing
service’s another market is for the tourist crowd in Hangzhou, but due to car-sharing service
you are
A resident52%
B tourist17%
C other31%
A resident
B tourist
C other

77
have the requirements of membership and required to pay an annual fee both credit
background checks required , temporarily unable to service this part of people, through the
establishment of new ways such as: no annual fee, the credit requirements are higher, adjust
the pricing method to facilitate the refund of rent and other means to attract tourists for
business. Therefore, car-sharing service start-up phase should tend to localize. Nearly 60% of
car users are willing to support car-sharing service.
According to survey results, it showed that only 11% of the population in Hangzhou are
using private cars as the main way for daily travel, while car-sharing services in support of the
population (Figure 32) accounted for 18% of total customers that private car user are more
concerned about car-sharing service than the group without using private cars, they also
expressed great interest in car-sharing service. According to Figure 32, it shows that the
number of private car users, who are ready to support car-sharing services, and be willing to try
the service is more than half. This means that car-sharing service can help in reducing the
existing number of private cars on the road, and the purpose of easing the traffic pressure.

78
Figure 32: Private Car Use
Figure 33: Car-sharing Opinions
Car-sharing target customer base concentrated in the new city area of Hangzhou or the
urban area with good transportation infrastructure. Main target group is young, more men than
whether they use private car
A yes
18%
B no
82%
A yes
B no
whether the car users want to try car-sharing
A willing to59%
B no\not sure41%
A willing to
B no\not sure

79
women, and well-educated, have higher levels of consumption, have a good credit record
Hangzhou local residents.
5.4.3 Marketing Similarities of Electric Cars and Zipcar
Almost every company has advertisements to promote their products such as Zotye and
Zipcar. According to our research, Zotye has three kinds of advertisement. First, they put the
logo EV on their cars. EV is short for electric vehicle and is shown on all of their electric vehicles
in the area they serve. They do this because many people can’t realize it is an electric car. The
electric car companies want more people to know that there are electric cars in city and they
want more and more people to use electric car in the future. Secondly, Zotye puts many
attractions of Hangzhou on the body portion of the electric cars. They apply scenic spots of
Hangzhou to publicize their electric car and how it makes the city greener with their unique
logo. So many tourists can remember the attractions of Hangzhou and relate it to the electric
car. Third, the advertisements on the car are seen at the Ambassador Ritual in Beijing. The
Ambassador Ritual is a great chance for Zotye to get their electric car known to other countries
around the world. It is also good chance to show the electric car to all the people and educate
other places that electric cars are becoming readily available (Zotye, 2011).
Zotye uses very similar tactics used by the car-sharing provider Zipcar. They advertise on
their cars, on billboards, on the internet, and in brochures in the areas they provide services.
They expand the market influence through advertising and use it as a way to increase their
business. By delivering a variety of advertisements, Zoyte and Zipcar get well known in the area
and people get interested in what they do.
80
The word of mouth is also very important to electric car. After all, the electric car is not
the mainstream in the society like gas powered vehicles. Almost 60% of Zipcar’s marketing
budget was to use word of mouth and free media to their advantage. This is a similar tactic
Zotye is using to gain the support of their electric vehicles. If people think electric car can
protect the environment, reduce the traffic crowded, and it can make it more convenient for
people’s everyday lives. People are always willing to new ideas the things which can be benefit
them and the environment. So the electric car companies need to gain people’s support. By
getting known by the public people, the electric car will be a fast growing car to own.
Zipcar has two kinds of cars, one is traditional car and one is electric car, but the electric
car is not popular and only San Francisco has adopted electric cars. With not enough charging
stations and people not knowing how they work, it makes it very difficult for them to be known
and used. People feel like they may run out of battery quick or they may not enjoy features in
the electric cars provide. Convincing people that they are very similar to traditional cars is the
best way to get them known. If more charging stations can become readily available and more
can be done to promote the benefits of electric cars, there will be a better chance for the future
use of electric cars.
The target customers are very significant for companies providing electric cars and car-
sharing services. Electric cars are not popular now, but most people who have a driving license
like using the traditional car. According to the research, we realized white collar is the target
customers for electric car company in China, they like the popular things, they have enough
money to pay for the car, or they can rent an electric car for half a year or one year. The white
collar people are highly educated, sophisticated workers that are working in traditional office

81
buildings and not interacting in manual labor. They can realize the benefit of electric car and
what they are doing to help society become greener. So, electric car companies should meet
their needs. At the same time, electric car companies should give the price discount for them
even if the government had given the discount. Promoting both the electric car and car-sharing
services towards the white collar crowd, will yield a better opportunity of success for both
companies.
Zipcar’s target customers are local people who are unable to afford the large costs of
maintaining a car and university students. There are more than 230 universities that are the
members of Zipcar community that provide cars available on campus to students at discounted
prices. As well as students, Zipcar markets to individuals in cities which parking is hard to come
by, people who can’t afford the costs of owning a car, and any individual looking to save
money. By targeting these individual market segments, Zipcar can focus its marketing tactics in
places which have an abundance of these types of individuals (2011, Zipcar).
The high costs of promoting the development of electric vehicles and the ownership
costs are keeping people away from. Cars are expensive and charging stations are expensive. In
order to enlarge market share, electric companies should find ways to reduce the costs in order
to attract more people to use their electric cars. Lowering production costs can make more
electric cars be available in the market. Not only will it open the market up more, but it will
provide a larger customer base to those individuals who earlier could not afford owning an
electric car. It is one of the reasons why governments are irresolute to this program. If the
government sees that more people will use the cars, they will be more willing to offer more
incentives to promote the use of these cars.

82
Convenience is also another way to attract customers. But having limited charging
stations available is making the use of the electric car obsolete. If electric car companies or the
government can build more charging stations, expanding the electric car will be easier and
more convenient for people who want to own them. With limited charging stations available,
people are limited to the distance they can travel and are drawn away from the idea of using an
electric car.
Although electric cars are difficult to promote, it is a new energy vehicle. With the
development of the society and the economy, every government wants to build a resource-
conserving society. Electric car is a kind of trend in the future. The market of electric car will be
increase year by year. But it will take time for electric cars to be implemented into our daily
lives and only time will tell when we will accept the use of electric vehicles.
5.4.4 Marketing and Implementation Plans
One of our first and more aggressive marketing schemes to help promote the idea of
car-sharing is to demo it at the Huanglong Gym. The Huanglong Gym located in downtown
Hangzhou is a very congested and popular area. In order to get the people of Hangzhou familiar
with the concept of car-sharing we need to get them to understand what it is all about. One of
our main marketing techniques is to have a demo day of car-sharing outside of the Huanglong
Gym. This will open up any question people have about the car-sharing system and to let
people know what it is all about. We will set up panels that will help explain the idea of car-
sharing and what it can do to help the traffic and environment problems in Hangzhou. The
highlight of the demo day will allow any licensed driver to try the car-sharing system out with a
representative walking them through the whole process. We will have 10 cars available to

83
demonstrate to anyone willing to give car-sharing a try outside of the Huanglong Gym. The
potential customers will be walked through the whole car-sharing process from reserving the
car, driving the car, fueling the car, and leaving the car after your reservation is over. It will be a
time where we can demonstrate the car-sharing process the way an everyday user will use car-
sharing and give the potential customers the perspective of how the whole system works. This
marketing idea will target our white collar customers and will show the many ways on why
people should use car-sharing. We will focus car-sharing around three main aspects;
convenience, environmentally friendly, and cost saving. We will pitch the idea of car-sharing in
a way that will convince people of these three aspects and use the busy area of Hangzhou to
our advantage. Using this type of marketing will be both beneficial for the future of car-sharing
and the promotion of it as long as the government will accept our request to demonstrate
outside of the Huanglong Gym.
Our second marketing plan is to have an event at the Leisure Thematic Exhibition Hall.
The Leisure Thematic Exhibition Hall is located in the White Horse Lake Convention & Exhibition
Center. The Exhibition Hall is divided into 5 floors aboveground and 2 floors underground, with
an area of 45,000 square meters for exhibition. Booths and other functional and supporting
services will be organized within this area. (香港达泰投资咨询有限公司, 2011)
The Leisure Thematic Exhibition Hall plans to invite 50 cities and 50 leisure enterprises
from home and abroad, through the case exhibition of the leisure-featured cities from home
and abroad, and the leading leisure enterprises for product or service, to profoundly show the
theme of the Leisure EXPO, interpret the value of leisure in human life, and reveal the
importance that leisure industry plays in urban development.

84
The following is how we will represent the car-sharing service at the exhibition hall. The
car parking for the event organizers to provide shared services, will be provided free of charge
for five electric vehicles, limited distribution of data cards to have a driver's license test drive
free for tourists. There we will educate people on how car-sharing works and give them demos
in our electric vehicles to make them familiar of how the service works. The demoing provides
real life experience of how car-sharing actually works and will be our best way to express the
new service. By handing out brochures and having people sign up at the event will be a great
way for the service to get off its feet. We see both these marketing plans as great ways to get
the service implemented correctly in the city of Hangzhou to gain great publicity.
City Comparison in Hangzhou
In a car-sharing service, coming up with the correct amount of cars to implement into a
city and how to go about analyzing a city’s demographics to figure out the correct number can
be difficult. In figure 34 it shows how we went about finding the possible number of cars to
implement based on Zipcars information and city demographics. We took the population and
popular cities that Zipcar serves in order to help estimate this figure. By going on Zipcars
website we went to see how many Zipcar neighborhoods there were in each city. Zipcar
neighborhoods are areas within a city that can hold anywhere from 2 to 50 Zipcars parking lots.
We took the amount of neighborhoods within each city listed below and multiplied it by the
average Zipcars in the neighborhoods within the city to give us an approximate amount of
Zipcar vehicles the city has. Once we got this number we then go ratios from Bus to population,
Subway to population, and Zipcars to population in order to see if there were similarities in
ratios to see if this may have been to way Zipcar analyzed city demographics in order to find the

85
proper amount of Zipcars to implement into each city. We concluded that Zipcar may have not
used Bus and Subway ratios to find this figure, but may have used a city’s population to analyze
the number of cars. Meaning Zipcar may have taken a city’s population and said we want one
Zipcar per 5,000 people in that city’s population. So in the figure below we show some of the
popular Zipcar cities and their cars to population ratio to help prove our point. Most of the
cities averaged around 4656 people per Zipcar. We had some outliers such as Boston which was
lower ratio due to it being the founding city and also left out places such as London which was a
new city that Zipcar has entered. Then to follow up on our research we took Hangzhou, and
used the average Zipcar to population number to come up with the figure of about 1869 cars
implemented in Hangzhou according to the population density. We felt that this would be the
optimal amount of vehicles to implement into the system to have an adequate supply of Zipcars
to users. Zipcars system currently has no issues with demand for its cars using this number of
cars to population ratio, so it seems like it would be a great start for the car-sharing service in
Hangzhou. Like we said, these figures are estimates and may not work for every car-sharing
system. But it will give you an idea of how many cars should be implemented into a system.

86
Figure 34: City Comparison of Hangzhou

87
5.5 Technological Aspects of Car-sharing in Hangzhou
There are several technologies that are necessary to operate a successful car-sharing
business. Most car-sharing systems consist of the following technological components: central
database, user interface, on board vehicle system and communication system (City CarShare,
2005).
5.5.1 The Central Database
The central database integrates all components of car-sharing operation. The database
guards operation information such as member applications, members’ contact information,
member passwords and IDs, vehicle and pod data, vehicle availability, reservations, time and
mileage data and employee data (City CarShare, 2005). This database will also be used to keep
track of new members, vehicles and parking spaces. It will also do billing transactions at the end
of the month. These transactions can be accessed by the members and staff from the database.
The car share reservation database can also provide general information to the user, such as
customers who are students with driving violations, popular pickup locations, cars that hold a
certain number of passengers, and rental trends (The Car Share Reservation Database).
5.5.2 User Interfaces
User interfaces, another type of reservations technology, allows members to make a
reservation at all times. Most operators provide an internet interface allowing member to make
reservations at all times. Some operators provide phone reservations as well. Phone
reservations are allowed by either a live operator service or by an automated voice-activated
phone reservation. The customers may use these services to get help as well.

88
A user friendly interface will make it easy for customers to make reservations and get
help and information about the service. If it is not user friendly it might drive customers away
from the service.
The user control and freedom prevent users from submitting the wrong information or
unwanted data. The page should have several confirmation and cancellations options.
Consistency and standards is another quality that the interface should have. The same words
and expressions should be used to provide a consistent design of the page. The web site should
also provide the same kind of operations, and follow a sequence. This is useful for the user
when making reservations, since he/she should follow an order of steps using the same
process. Another quality, error prevention, should take into account since users tend to make
mistakes, especially when they are new users. There should be methods designed that check
for the users input. This connects with helping users recover from errors. There should be a
module that helps the users recover from errors by recognizing, diagnosing and then recovering
them from mistakes (Efis, 2007).
5.5.3 On Board Vehicle System
The vehicle involves an on board vehicle system, which allows members to open the car
with the system’s card reader and enable car ignition. The vehicle system includes an on-board
computer that stores and communicates the members information, such as member IDs, time,
and a mileage tracking device (City CarShare, 2005). In some cases this vehicle system may
include GPS receivers. According to City CarShare, this technology system provides more
convenience for members, more accurate billing, reduces staff costs, and avoids relying on
members’ honesty.

89
The access equipment which allows the members to enter the cars with their card
involves the Radio Frequency Identification technology. A typical RFID application consists of an
RFID tag, an RFID reader, and a backend system. An RFID tag is a fixed or mobile chip that can
be placed within cards, barcodes, and many other objects that needs to be tracked. The RFID
reader on the other hand, lets us read the information on the RFID tag. Once an RFID tag is
placed over an RFID reader, the backend system (system that processes RFID information)
analyzes what has been scanned. With a simple radio frequency (RF) chip and an antenna, an
RFID tag can store information that identifies the object to which it is attached. With this kind
of technology available, it makes it very convenient to process data and track anything you
need to (Min Chen, 2010).
RFID come in a few different configurations and need to be suited for the needs they
will be used for. The first aspect we need to compare is the difference between active and
passive RFID tags. Passive is an RFID tag that uses no battery and is activated by scanning it over
an RFID reader. The tag incorporates information which is put on by a computer and when it is
placed over the reader the backend system reads the information. On the other hand, the
active system incorporates a battery inside to power it. The battery is only activated when it is
brought over a RFID reader. Both of these configurations are helpful, its picking the correct one
for your needs that will make them the most effective.
Besides the configurations of tags, RFID readers can be used in both fixed and mobile
configurations. The fixed configurations are placed in certain areas for use and cannot be
moved. An example of fixed are the readers used in fast lane toll systems. On the other hand,
the mobile readers like the ones used in Zipcars, are able to be moved and still be read. Zipcar’s

90
readers also incorporate GPS and can communicate with the Zipcar server to let them know
what RFID chips to let in and at what times. Zipcar configures their readers on the top left
windshield of their cars for members to access the cars.
In Zipcar’s system they provide members with an RFID tag in the form of a membership
card which lets the customer unlock the cars. The way the system works is by placing your card
over the transponder on the cars reader and unlocks the cars. The RFID’s job is to provide
tracking assistant for the member and access to the service. Other than that the rest of the
Zipcar system incorporates actions that are all controlled by the user like driving the car.
The RFID system allows unattended access to the cars. This is one the unique
characteristics on car-sharing. Without the RFID system this would not be possible and
therefore this technology is very crucial for any car-sharing service.
5.5.4 Communication System
Most car-sharing businesses use Global Positioning System (GPS) technologies to allow
each vehicle to communicate with the central database. This communication link provides
useful information such as reservation information to each car, relay time and mileage data
from the cars to the central database. Also through GPS, the central database can locate each
car (City CarShare, 2005).
Global position system was invented by the U.S. Department of Defense in 1970s.The
system is composed of twenty four satellites in the space, and it provides users with
positioning, navigation, and timing services (U.S.government, 2011). In car-sharing business,
there are two purposes for GPS devices: one is for the driver to navigate, and another is for the
car-sharing central database to communicate with the cars.

91
In order to use GPS to navigate, you need a GPS receiver in your car. The GPS receiver
displays its location on the planet in terms of latitude, longitude, height and time. To locate its
position, the receiver gets signals from at least four satellites. In theory, using signals from
three satellites are sufficient, but in practice four satellites are used to improve accuracy (The
GPS Guid Website, 2009). The GPS receiver has an electronic map stored in the memory. Using
the location information obtained via the receiver, a GPS navigation system plots the position
of the user in an electronic map using mapping software.
A typical GPS navigation system provides the user with very useful features as follows:
The traveling distance between source and destination
Which road you are on
Optimization of route
Current speed
Time since departure
Estimated time of arrival
The use of GPS navigation systems in cars is becoming more popular every day. Many
people find the above mentioned information useful while driving. The ease provided by the GS
navigation system would attract people to become members of a car-sharing service.
Another use for the GPS is the communication between the central database and the
vehicles. It is important for the car-sharing company to know where their vehicles are, and
whether it is in good use. With the help of vehicle tracking system, they can even know the fuel
level of the vehicle, relay times, mileage data, engine temperature and etc. This information is
important for the company to operate the system smoothly.

92
There are two types of vehicle tracking devices: active tracking and passive tracking.
Passive tracking can be used when there is access to the car. The information on the locations
that car has been to can be obtained. Active tracking can get the location information in real-
time via GSM (Sonotronics Website, 2010). Vehicle tracking is also a good way of preventing the
car from stolen. If the car is stolen, police can simply follow the signal emitted by the tracking
system and locate the stolen vehicle. The GPS tracking device is hidden in the vehicle so that
car-sharing members can’t break it.
Without the aforementioned technologies it is not possible to operate a car-sharing
service. All of these technologies easily accessible in China and do not possess any barriers to
start a car-sharing business.

93
5.6 Financial Aspects of Car-sharing in Hangzhou
In this section of our project we prepared a financial plan for the car-sharing service in
Hangzhou; compared the cost of private car and car-sharing, cost of car-sharing and taxi and did
a location analysis to select good locations to have parking spots.
5.6.1 Financial Plan
The budget is the most critical component of a business plan. The initial budget is the
indicator for whether the organization has sufficient capital or how much funding it needs to
start the business. The financial plan will also show how the business plans to reach financial
self-sufficiency. Our team prepared the following financial plan for the first five years of the car-
sharing service in Hangzhou. The following figure is our financial plan for the first five years of
the car-sharing service in Hangzhou and the details of the preparation of the financial plan can
be found in Appendix C.

94
Figure 35: Financial Plan for Car-sharing in Hangzhou 2011

95
Based on our survey results our team concluded that 40¥ per hour charge would be
appropriate for the business. It is affordable and also generates enough income so that the
business is profitable. Other sources of income are the application fee, annual fee and the
interest income generated by the security deposit. Our team did a sensitivity analysis and found
out that “the per hour charge” has the highest impact on the revenue generated.
Final Reduced
Name Value Gradient
Application Fee (per new member) Assumption (per unit) 200 500
Annual Fees (per average member) Assumption (per unit) 100 250
Per Hour Charge Assumption (per unit) 50 36,000
Security Deposits Assumption (per unit) 2,000 9
Average # of Members Year 1 250 7,370
Figure 36: Sensitivity Analysis
The figure above illustrates the sensitivity analysis we conducted for the revenue
generated in the first year. High reduced gradient values mean that the variable has more
effect on the revenue generated. From the table, we can see that the revenue is mostly
dependent on the per hour charge.
As seen in the financial plan there is a significant cash flow deficit in the early years of
the service. The company requires funding from the local government, foundations, auto
manufacturers and similar organizations. However, the cash flow deficit is shrinks rapidly in the
following years for several reasons:
The significant obstacles such as determining initial locations, securing parking, building
partnerships and fund raising will be over. This way the company can focus on
improving the customer service and profitability.

96
Utilization rates of cars will increase as the organization reaches a critical mass of
members and vehicles.
Economies of scales will be realized as the company reaches a certain size. Discounts for
vehicles, insurance and similar costs can be obtained.
As the business grows, the fixed costs such as office space and salaries will be spread
over a large number of vehicles. For example the ratio of staff members to the number
of vehicles will decrease.
Through car-sharing, the cost of owning a car is moved from the individual to the car-
sharing business. Due to the reasons mentioned above the business can save money in places
where individual cannot. This makes the business profitable after the early stages of the
organization. With an initial investment of nearly 5,000,000¥, the business can break even in
the fourth year and achieve an internal rate of return of 18%. These calculations do not factor
in the time value of money.
Our team thought that having 500 members at the end of the first year may be too
conservative considering the population of Hangzhou. Therefore, we compared different
scenarios where we have different number of member at the end of the first year. We kept the
100% growth in the number of members the same. The following table shows this comparison.

97
Figure 37: Scenarios with Different Number of Members
From this comparison we can see that the rate of return is very sensitive to the number
of members the company has. With enough effort higher number of members can be achieved
and the business can be more profitable.
5.6.2 Car-sharing versus Private Cars
Private automobiles are the main competitors for any car-sharing service. The success of
the car-sharing service in Hangzhou will be dependent on the extent which people can be
persuaded to share cars instead of owning them.
Cost saving is one of the most important motivation for members to join a car-sharing
service. Car-sharing turns the use of automobiles into a service. This way the fixed costs of
owning a car become variable costs. Owning a car has high fixed costs associated with the
purchase price, insurance, maintenance and parking. Car-sharing however allows people to pay
according to how much they use the automobile. The fact that car-sharing turns fixed costs into
variable costs means that the greatest savings will be realized by people who drive
“occasionally”. In an attempt to put a definition on “occasionally”, our team analyzed the costs
of owning a car and sharing a car and found when car-sharing is more profitable for the
customer.
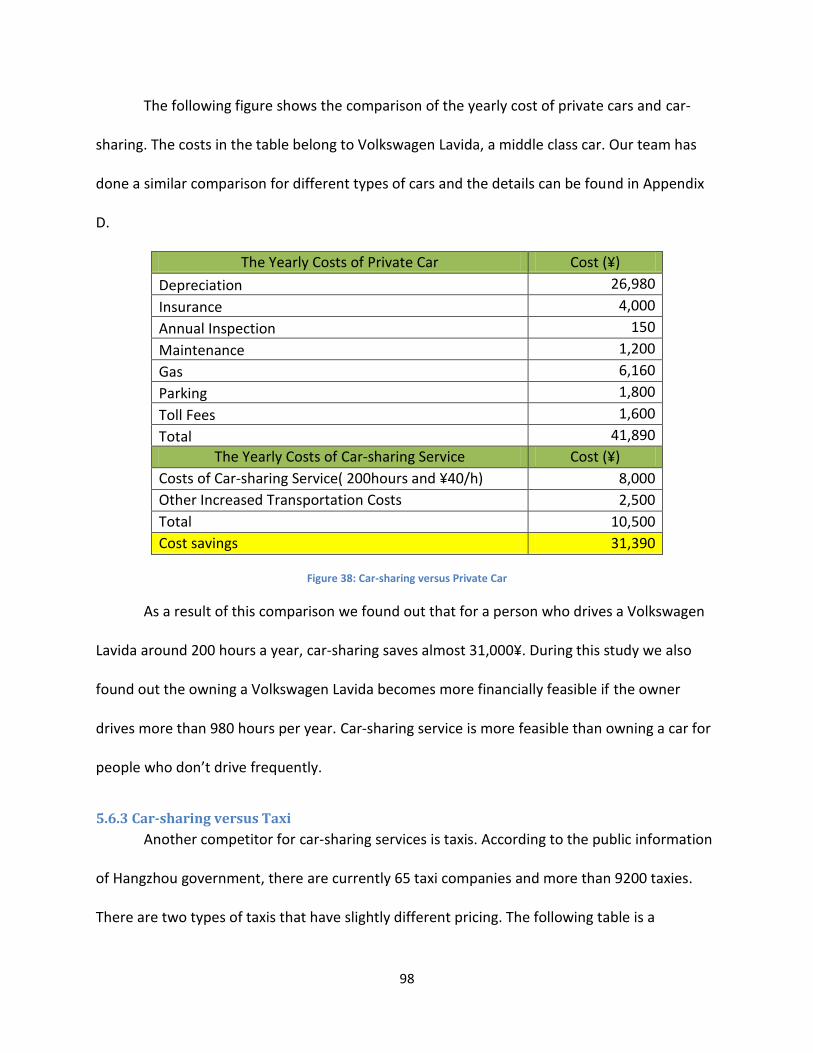
98
The following figure shows the comparison of the yearly cost of private cars and car-
sharing. The costs in the table belong to Volkswagen Lavida, a middle class car. Our team has
done a similar comparison for different types of cars and the details can be found in Appendix
D.
The Yearly Costs of Private Car Cost (¥)
Depreciation 26,980
Insurance 4,000
Annual Inspection 150
Maintenance 1,200
Gas 6,160
Parking 1,800
Toll Fees 1,600
Total 41,890
The Yearly Costs of Car-sharing Service Cost (¥)
Costs of Car-sharing Service( 200hours and ¥40/h) 8,000
Other Increased Transportation Costs 2,500
Total 10,500
Cost savings 31,390
Figure 38: Car-sharing versus Private Car
As a result of this comparison we found out that for a person who drives a Volkswagen
Lavida around 200 hours a year, car-sharing saves almost 31,000¥. During this study we also
found out the owning a Volkswagen Lavida becomes more financially feasible if the owner
drives more than 980 hours per year. Car-sharing service is more feasible than owning a car for
people who don’t drive frequently.
5.6.3 Car-sharing versus Taxi
Another competitor for car-sharing services is taxis. According to the public information
of Hangzhou government, there are currently 65 taxi companies and more than 9200 taxies.
There are two types of taxis that have slightly different pricing. The following table is a
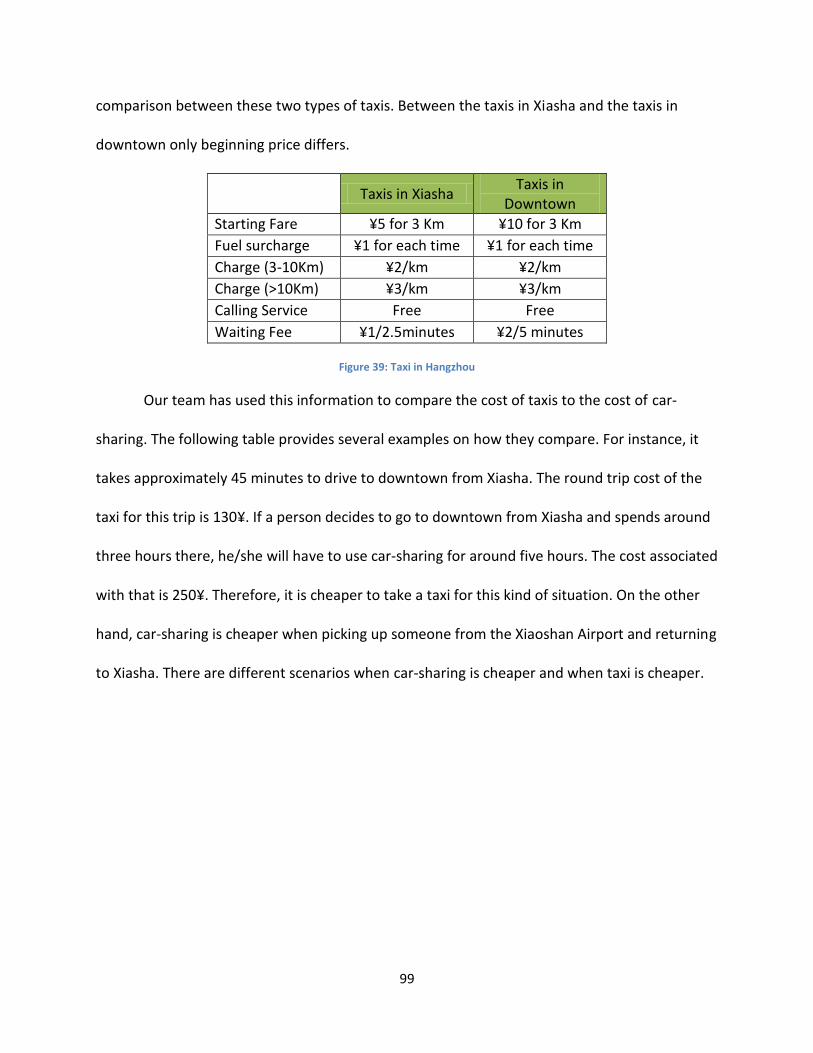
99
comparison between these two types of taxis. Between the taxis in Xiasha and the taxis in
downtown only beginning price differs.
Taxis in Xiasha
Taxis in Downtown
Starting Fare ¥5 for 3 Km ¥10 for 3 Km
Fuel surcharge ¥1 for each time ¥1 for each time
Charge (3-10Km) ¥2/km ¥2/km
Charge (>10Km) ¥3/km ¥3/km
Calling Service Free Free
Waiting Fee ¥1/2.5minutes ¥2/5 minutes
Figure 39: Taxi in Hangzhou
Our team has used this information to compare the cost of taxis to the cost of car-
sharing. The following table provides several examples on how they compare. For instance, it
takes approximately 45 minutes to drive to downtown from Xiasha. The round trip cost of the
taxi for this trip is 130¥. If a person decides to go to downtown from Xiasha and spends around
three hours there, he/she will have to use car-sharing for around five hours. The cost associated
with that is 250¥. Therefore, it is cheaper to take a taxi for this kind of situation. On the other
hand, car-sharing is cheaper when picking up someone from the Xiaoshan Airport and returning
to Xiasha. There are different scenarios when car-sharing is cheaper and when taxi is cheaper.

100
Explanation Distance (km) Hours of Travel
(Hours) Total Cost of
Car-sharing (¥) Round Trip
Cost Of Taxi (¥)
Xiasha - Downtown (One hour spent in downtown)
18.4 1.5 120 130
Xiasha - Downtown (Three hours spent in downtown)
18.4 1.5 200 130
Xiasha - Xiaoshan Airport (Picking up someone from the
airport) 22 1.33 80 180
Downtown - Xiaoshan Airport (Picking up someone from the
airport) 38 1.8 80 216
Grocery Shopping in Xiasha (Two hour spent during
shopping) 2.8 0.17 80 12
Grocery Shopping in Downtown (Two hour spent
during shopping) 3 0.17 80 22
Figure 40: Car-sharing versus Taxi
From this comparison our team concluded that car-sharing is usually cheaper when the
car is utilized efficiently. For example, if the car will be shared for five hours but only going to
be used for two hours, taking a taxi would be cheaper than car-sharing. On the other hand, if
the car is shared for five hour and driven most of that time, car-sharing would be cheaper than
taking a taxi.
5.6.4 Car-Sharing versus Car-Rental
Car-rental companies are another competitor for car-sharing business in Hangzhou. Car-
rental and car-sharing is very similar in nature. Since car-rental companies have been around

101
for a longer time in China, people may prefer to rent a car than share a car. However, car-
sharing can provide cost savings in several situations.
Car-rental companies offer a variety of cars like car-sharing. However, their pricing
changes greatly according to the type of the car they rent unlike car-sharing. With car-sharing
the hourly price changes only a little if it changes at all. Our team has compared the cost of
renting a car for a day to the price of sharing a car for a day. We assumed that the car will be
shared for ten hours. The following table shows the comparison between car-rental and car-
sharing in terms of daily costs.
Figure 41: Car-Sharing versus Car-Rental
As a result of this comparison we found out that low-end vehicles that can be rented
from car-rental companies can be cheaper than sharing a car. On the other hand, renting better
quality cars can be more expensive than sharing them. Both services include security deposits
that is returned when the service is no longer is used. Price of car-sharing could be lowered if
the car is shared for more than certain hours. This would allow the car-sharing service to be
better compete with the car-rental services.

102
5.7 Location Analysis
Car-sharing is a unique source of transportation for individuals and businesses. It
provides transportation for people who do not own a car and allows them to do occasional
trips. Car-sharing service is ideal for individuals who own a car and drive fewer than 5,000 miles
a year. This method is convenient for those individuals, since it provides cost savings.
Businesses can benefit from car-sharing by making it a transportation option to their
employees. In order for a car-sharing organization to succeed, the potential locations need to
have several qualities. “High density, a mix of land uses, good transit access, and already-low
vehicle ownership levels are important if car-sharing is to be viable.” All factors are equally
important when introducing car-sharing into a community (City CarShare, 2005).
5.7.1 Selection Criteria
Density is the first quality to take into consideration in an area when determining the
viability of that location. When providing car-sharing as an alternative to car ownership, it is
convenient to have a wide array of potential customers. It is also important to consider that
households living in dense neighborhoods tend to own fewer cars (City CarShare, 2005). Areas
with high density indicate quality of transit, a pedestrian environment, and local shops and
services. These qualities make car-free lifestyle a realistic option for local residents. High
density locations are more convenient for car-sharing than low density locations due to the
greater number of nearby destinations and the shorter trips (Transit Cooperative Research
Program (TCRP), 2005).
Urban neighborhoods that are dense offer the best potential locations for car-sharing.
These neighborhoods include characteristics such as mixed-use development, scarce parking,
and good transit. It is difficult to establish car-sharing without these elements. Low density

103
areas are most likely to have no convenient transit service which makes it difficult to serve
different modes of transportations. If the potential locations have low density, then the
company will have to spend more money in marketing and outreaching customers.
Another important factor, when introducing car-sharing, is to have land for both
residential and commercial purposes. This mix of land uses is important to ensure that cars are
utilized enough to make a profit. These lands are also beneficial in terms of having a variety of
customers. Business members have an important role in increasing utilization rates and evening
out the demand cycle since they tend to use car-sharing during work days (Transit Cooperative
Research Program (TCRP), 2005) . On the other hand, other people use car-sharing for personal
trips either on evenings or weekends. With different demand patterns, mixed-use
neighborhoods can attract both business and individual members. If there is a variety of
customer then the cars will be efficiently utilized most of the time. This helps avoid sharp
periods of peak demand.
Even though car-sharing has many benefits, it is usually not the best type of
transportation. Another quality of a possible location is to pick an area with good transit access.
Car-sharing will be introduced as another transportation alternative besides transit, taxis, rental
cars, walking, cycling, and more. These areas usually have a heavy flow of people. Having a car-
sharing location at these locations would provide great publicity and numbers of potential
customers.
Low vehicle ownership, another key location quality for car-sharing to succeed, indicates
that the area has potential car-sharing users. Car-sharing is most likely to succeed in areas
where people cannot afford to have a car but need mobility and travel choices. This quality
104
makes car-sharing a realistic option for many households. Since car-sharing includes fuel,
maintenance, insurance, and reserve parking, members will save money and continue avoiding
the difficulties of vehicle ownership; these are the key attractions for car-sharing users.
Vehicle ownership is also a competitor for car-sharing organizations. Car owners are the
largest potential market for car-sharing, and it is important to attract these individuals to
achieve environmental and social enhancement (City CarShare, 2005). In order for car-sharing
to be successful both financially and environmentally, having a population with low vehicle
ownership is important. Car-sharing also encourages individuals to sell their cars since users are
motived by the cost savings provided by the system. Therefore, areas with people who are
willing to sell their cars, car-free households, and people who are thinking about buying a car
are the potential target markets for car-sharing.
According to City CarShare, there are some ‘special niches’ where car-sharing are likely
to succeed. Car-sharing may work with lower densities in special niches such as transit stations,
university campuses and new development areas. Having car-sharing stations near transit
stations gives the option for those members that transit in the surrounding neighborhoods.
Stations in university campuses will attract the younger population and are the center of
activity for this market. Car-ownership is usually restricted in university campuses due to the
lack of parking space or university rules. New development areas are another ‘special niche’ for
car-sharing since businesses are potential customers for the service. In these areas, car-sharing
helps reduce parking demand and developers are often willing to include car-sharing in their
projects (City CarShare, 2005).

105
Taking these four key factors, high density, low vehicle ownership, transit locations and
mix of land uses, our team has come up with several locations in Hangzhou that would be
plausible for implementing car-sharing in Hangzhou.
5.7.2 Locations of Car-sharing Service in Hangzhou
There are eight districts in Hangzhou: Shangcheng district, Xiacheng district, Gongshu
district, Xihu district, JIanggan district, Binjiang district, Xiaoshan district and Yuhang district.
Figure 42 shows a map of Hangzhou and ten suggested locations for car-sharing stations. Seven
stations are in or close to the downtown area of Hangzhou and three stations are in the
suburban districts.
Figure 42: Car-sharing Locations in Hangzhou
Downtown has a higher population density, therefore a location in this area will be able
to reach more customers. Downtown is also a good area for car-sharing stations since people
living there have a higher income compared to the people in suburban areas. If these people do
not own a car, the chances of them using the car-sharing service are higher. Another advantage

106
for having locations in downtown is tourism. Hangzhou is famous for its tourism, and most of
the tourist attractions are located in the downtown. A large part of eHi’s business comes from
tourists (eHi, 2011). Downtown is known to be a safer area than suburban districts, meaning
that there will fewer problems with the security of the cars.
Parking space is limited and expensive in downtown; meaning that parking cost will be
expensive in this area. At the same time, there are many car-rental companies in downtown
which may affect the car-sharing business due to the stronger competition. Due to these
constraints we also selected three locations in the suburban area. Suburban areas have a lower
population density and a high concentration of companies. The target audience for the car-
sharing service in these areas is business members and university students. There are more
than 200,000 university students in the suburban areas, meaning that we can target a young
population. The following section explains the ten locations we recommend for the car-sharing
service.
Location 1- Qingchun Square
Qingchun Square, part of Qianjiang new town and Jianggan district, is located in the
center of Hangzhou, north of Qingchun road and east of the West Lake. With a total area is
43,000 square meters, the Qingchun Square is a public location that has many attractions such
as supermarkets, a shopping mall, several office buildings, and residential areas (Best, 2009).
Jianggan district, with a total area of 210.22 square kilometers has a permanent
population of 1,000,000 and a floating population of 380,283 (Assurewu, 江干区_百度百科,
2011). This is an indicator of an urban dense population and this is due to the great number of
nearby destinations shown in Figure 43 which shows a map of Qingchun Square. The red circle
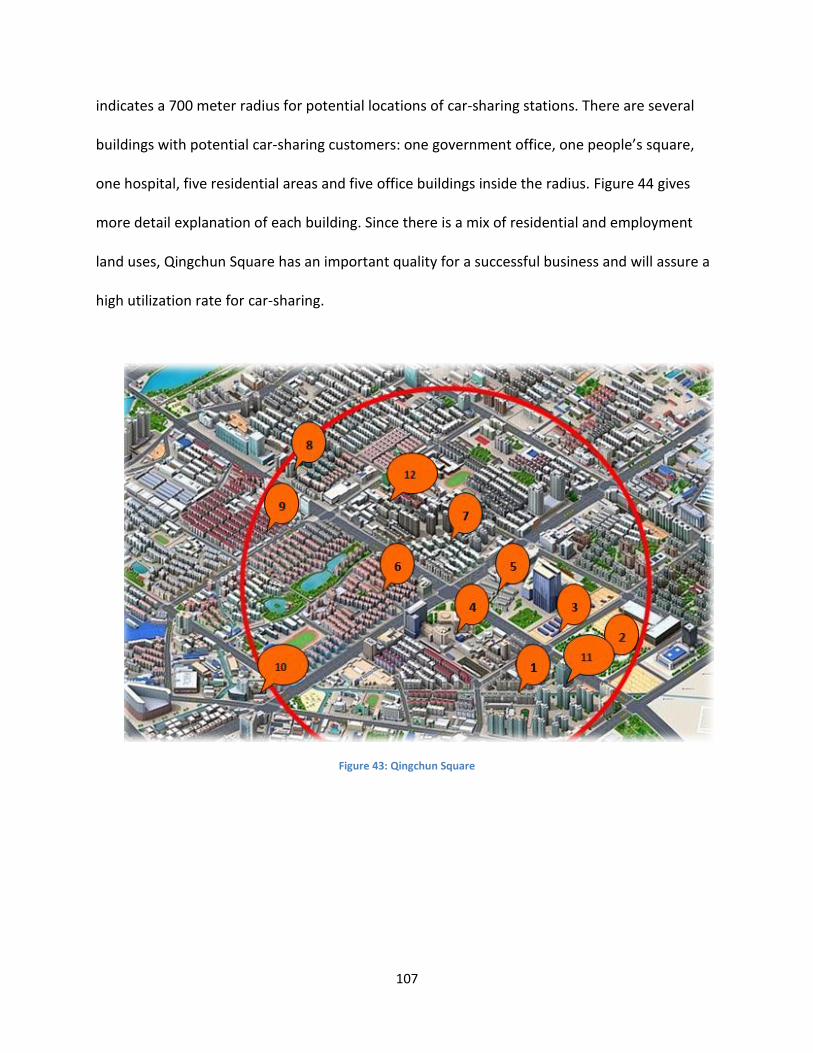
107
indicates a 700 meter radius for potential locations of car-sharing stations. There are several
buildings with potential car-sharing customers: one government office, one people’s square,
one hospital, five residential areas and five office buildings inside the radius. Figure 44 gives
more detail explanation of each building. Since there is a mix of residential and employment
land uses, Qingchun Square has an important quality for a successful business and will assure a
high utilization rate for car-sharing.
Figure 43: Qingchun Square

108
Location 1
# Name Description
1 Government of Jianggan Government Office
2 The Qingchun Square People's Square
3 Sanxin Building Office Building
4 Shaoyifu Hospital Hospital
5 Dinghai Residential Area Residential Area
6 Caihe Residential Area Residential Area
7 Qingchun Apartment Residential Area
8 Qingchun Fazhan Building Office Building
9 Shuanglin Residential Area Residential Area
10 Kongque Building Office Building
11 Sanxin Building Office Building
12 Nanxiaobu Yueji Apartment Residential Area
Figure 44: Qingchun Square Key Location
The district’s financial revenue was ¥4,598,830,000 in 2010 and the average annual
growth was 57.7% (余丽丽、傅一览, 2010) .The financial revenue indicates financial
sustainability for the car-sharing business because people are able to afford this service. Within
this population, the financial revenue of Qingchun Square area is ¥2,826,630,000, and the
percentage of financial revenue is 61.5 (白衣童生, 2010) .
There are seventeen bus stations in Qingchun Square, which indicate that there are
many points of transit access in this area. Outside the radius in Figure 43 there is a supermarket
and a shopping mall which are locations our customers will be interested in going. Car-sharing
is convenient for individuals who do not have a car because bus or taxis are not convenient
transportation methods when going shopping.

109
Location 2 - Hangzhou Tower
Hangzhou Tower, located in Wulin Square, is part of the Xiacheng district, center of
downtown in Hangzhou. North of the Hangzhou Tower is Beijing-Hangzhou old canal, to the
south is West Lake, to the west is provincial government and the east is the city river: Tiesha
River. The permanent population of Xiacheng district is 328,400 which is relatively small
compared to other areas in Hangzhou (assurewu, 2011) . Even though this is not a residential
area, there is high density at all times due to its attractions. The economy in Xiacheng district is
very wealthy. There are 743 factories in Xiacheng and the total industry output was
¥2,240,000,000 in 2001 (Assurewu, 下城区_百度百科, 2011). In 2009, the GDP in Xiacheng was
¥40,550,000,000 and the financial revenue was ¥9,811,000,000 (赵明、王成, 2008).
Hangzhou Tower Hotel has 1,485 employees which are good potential business
members for car-sharing. The Hangzhou Tower is a very profitable business with sales of
¥3,270,000,000 in 2007 (杭州大厦, 2008) .The 2007 sales made the Hangzhou Tower the
number one tower in China with the highest number of sales. In 2008, the operating income
was ¥1,950,000,000, and the profit was ¥257,000,000 (杭州大厦, 2008). The high number of
sales and good operating income show that many people visit Hangzhou Tower.
The Hangzhou Tower has a total area of 31.46 square kilometers (杭州大厦, 2008).
Figure 45 shows a map of the area surrounding the Hangzhou Tower. The red circle indicates
this surrounding area of 800 meters, which is our radius for the potential car-sharing location.
The map shows four residential areas, eight office buildings, one hotel, one shopping mall and
one government department. This area is a good option for a location of a car-sharing station
because many people visit this location for shopping, restaurants and it has a high population of

110
tourists due to its hotel. There are eighteen buses that transit around the Hangzhou Tower,
which shows it is a good transit area.
Figure 45: Hangzhou Tower
Location2
# Name Description
1 Hangzhou Tower Shopping Mall
2 Baima Residential Area Residential Area
3 Zhejiang Mobile Building Office Building
4 Hangzhou Wanhao Hotel Hotel
5 The City Government Government of City
6 Jinhui Building Office Building
7 Zhejiang Publish Building Office Building
8 Donghai Chuangyi Center Office Building
9 Zhedi Jewelry Building Office Building
10 Jinghu Residential Area Office Building
11 Zhejiang Global Center Office Building
12 Chaohui residential area Residential Area
13 CXizi garden residential area Residential Area
14 Taihe international building Office Building
Figure 46: Hangzhou Tower Key Locations
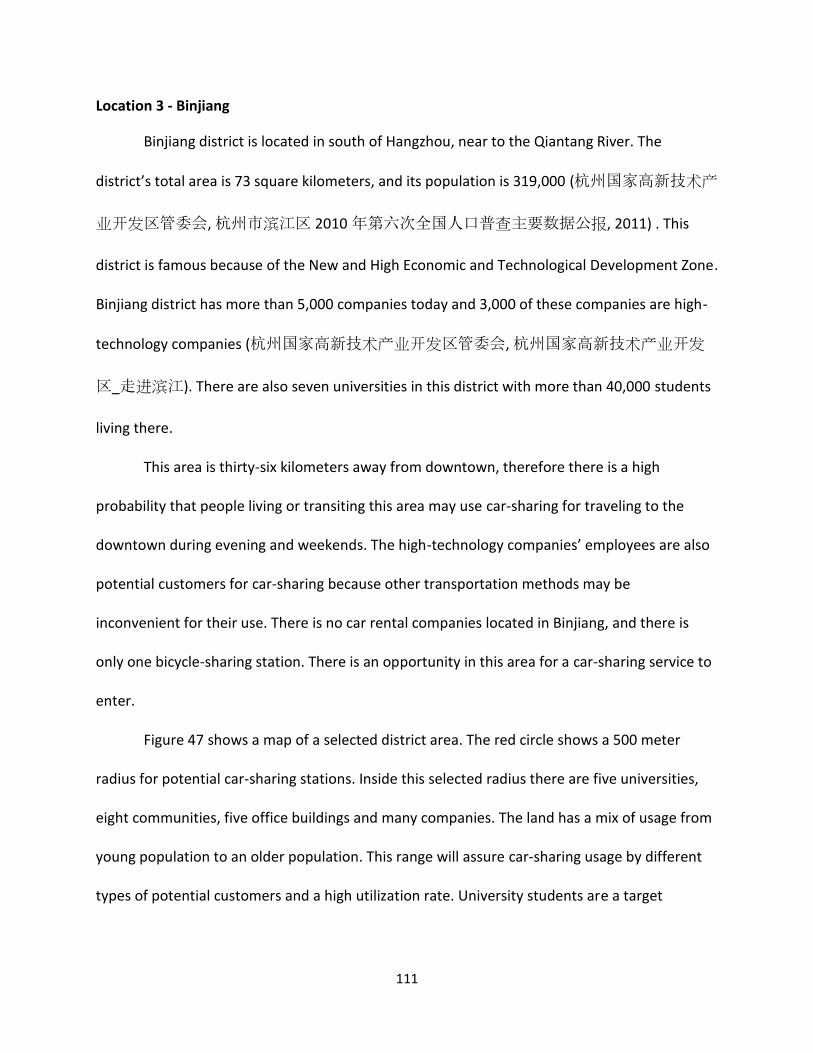
111
Location 3 - Binjiang
Binjiang district is located in south of Hangzhou, near to the Qiantang River. The
district’s total area is 73 square kilometers, and its population is 319,000 (杭州国家高新技术产
业开发区管委会, 杭州市滨江区 2010 年第六次全国人口普查主要数据公报, 2011) . This
district is famous because of the New and High Economic and Technological Development Zone.
Binjiang district has more than 5,000 companies today and 3,000 of these companies are high-
technology companies (杭州国家高新技术产业开发区管委会, 杭州国家高新技术产业开发
区_走进滨江). There are also seven universities in this district with more than 40,000 students
living there.
This area is thirty-six kilometers away from downtown, therefore there is a high
probability that people living or transiting this area may use car-sharing for traveling to the
downtown during evening and weekends. The high-technology companies’ employees are also
potential customers for car-sharing because other transportation methods may be
inconvenient for their use. There is no car rental companies located in Binjiang, and there is
only one bicycle-sharing station. There is an opportunity in this area for a car-sharing service to
enter.
Figure 47 shows a map of a selected district area. The red circle shows a 500 meter
radius for potential car-sharing stations. Inside this selected radius there are five universities,
eight communities, five office buildings and many companies. The land has a mix of usage from
young population to an older population. This range will assure car-sharing usage by different
types of potential customers and a high utilization rate. University students are a target
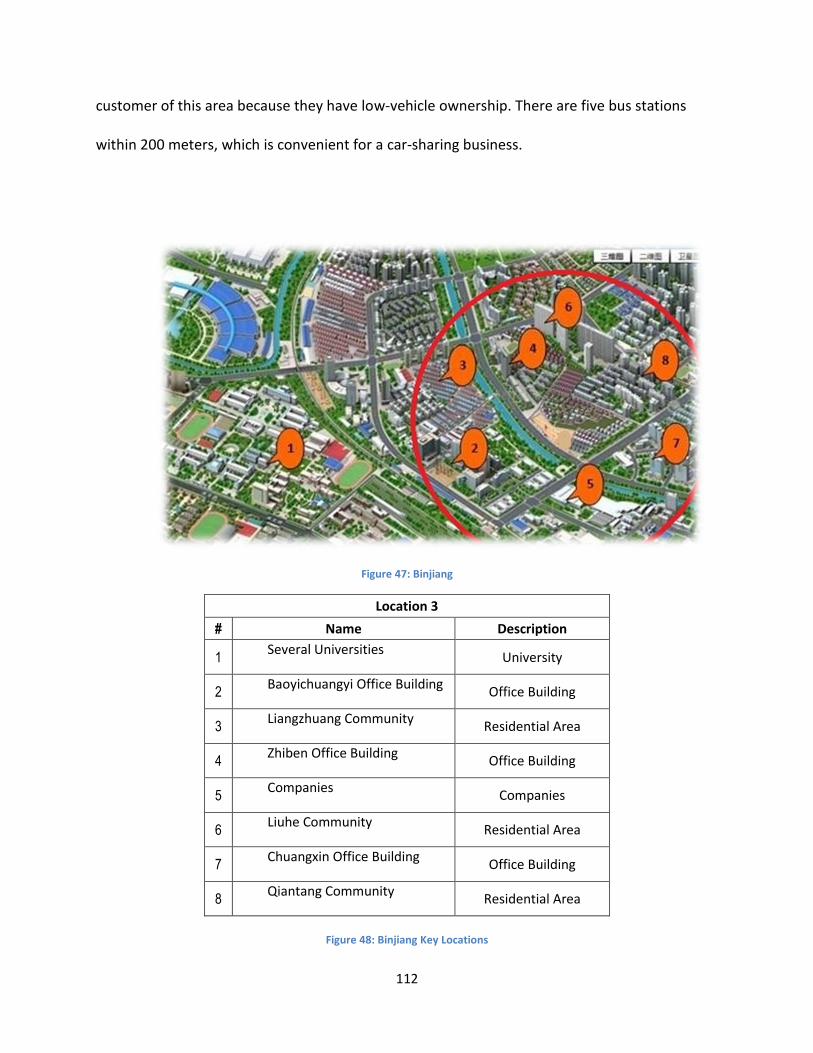
112
customer of this area because they have low-vehicle ownership. There are five bus stations
within 200 meters, which is convenient for a car-sharing business.
Figure 47: Binjiang
Location 3
# Name Description
1 Several Universities
University
2 Baoyichuangyi Office Building
Office Building
3 Liangzhuang Community
Residential Area
4 Zhiben Office Building
Office Building
5 Companies
Companies
6 Liuhe Community
Residential Area
7 Chuangxin Office Building
Office Building
8 Qiantang Community
Residential Area
Figure 48: Binjiang Key Locations

113
Location 4 - Heaven Software Park
The Heaven Software Center is located in West Lake district which is in the downtown of
Hangzhou. This area is unique because of its industrial and business activities. The Heaven
Software Center has a total area of 308.7 square kilometers and its registered population is
544,600 people (杭州宝葫芦电子商务有限公司, 2009) . The GDP of the West Lake district is
¥5,880,000,000 and the average annual growth is 17.08%. The financial revenue is
¥3,135,000,000 and the average annual growth is 27.9% (王瑛, 2010). These income levels
show that the area has high activity and there is opportunity for business.
There are around 140 companies in the Heaven Software Center and there is more than
5,000 people working. The types of companies include high-tech companies and network
marketing, meaning people working here have high income with high education levels. Figure
49 shows a map of the Heaven Software Center and its surrounding. The map shows a red
circle, 800 meter radius, which includes three residential areas, four office buildings, and one
university. There is a mix of land use in this area and high density of residents and employees
which show that this area has good qualities for car-sharing locations. There is also financial
potential for a car-sharing business to succeed due to the area’s yearly revenue. There are
5,000 people working there and not enough parking spaces. (杭州高新技术产业开发区资产经
营有限公司). The lack of parking space in the building is a good opportunity for car-sharing
company since it shows there is a low-vehicle ownership from workers in this area.

114
Figure 49: Heaven Software Park
Location 4
# Name Description
1 Heaven Software Center Office building
2 Hangzhou Digital Industry
Park
Office Building
3 Maojiaqiao Apartment Office Building
4 Hangzhou Radio and
Television University University
5 Cui Yuan New Village Residential Area
6 Qinglong Village Residential Area
7 Zhejiang Era Electronic
market
Office Building
8 Dengyun Road Residential Area Residential Area
Figure 50: Heaven Software Park Key Locations

115
Location 5 - Xiaoshan
Xiao Shan district is located south of Hangzhou and has a population of 1,209,935
people; which is the largest of all Hangzhou’s districts (百度百科, 2011). Xiao Shan
International Airport, the only airport located in Hangzhou, is located in this district. Hangzhou
South Station, one of two train stations located in Hangzhou, is also located in Xiao Shan
district. The total area of this district is 1420.22 square kilometers. This area contains 2, 485
corporate businesses 1,427 service-corporate businesses and 147 big markets (百度百科,
2011). This area is big in size and population compared to other districts in Hangzhou, therefore
there is many potential customers for car-sharing. Xiao Shan also has a tourism income of ¥10.8
billion (百度百科, 2011). Most of the tourism in Xiao Shan district is due to the Qiantang River
and Shu Mountain, which are natural attractions. The average income of people is ¥129,529 per
year (百度百科, 2011). There are 118 bus lines, 1168 buses and 778 taxis in Xiao Shan (百度百
科, 2011). These transportation methods show that the area has good transit access.
Xiao Shan has many modes of transportation and therefore there is a heavy flow of
people. The selected radius in Figure 51, of 500 meters (e 都市, 2011), is between the train
station and the airport. This area is convenient for car-sharing because it offers people to drive
to the station or airport to pick up some one. Near this area, there is a square, three office
buildings, one residential area and three government apartments, which are shown in Figure
51. The variety of locations in this area would provide a variety of potential customers for the
car-sharing service.

116
Figure 51: Xiaoshan
(e 都市, 2011)
Location 5
# Name Description
1 Government of Xiaoshan District Government Office
2 The Court House of Xiaoshan Government Office
3 Service Center of Government Government Office
4 Xinyi Building Office Building
5 International Business Center Office Building
6 Dikai Building Office Building
7 JinpumingYuan Residential Area
Figure 52: Xiaoshan Key Locations

117
Location 6 - Huanglong Stadium
Huanglong Stadium is located in Xihu district which is in the downtown of Hangzhou.
The Huanglong Stadum is located West of the Hangzhou Tower, and north of the West Lake.
Due to its location, the Huanglong Stadium has many advantages for a car-sharing station. West
Lake is a touristic place that attracts many people. The Zhejiang University, Zhejiang Library and
Zhejiang World Trade Center are in this area. These three places are the important places of
education, culture and business of Hangzhou. Many lectures, shows and exhibitions are held at
these locations. As a big tourism center, transportation is convenient and people usually walk
to their destination. Currently, there is a bus station center, a car rental company and three
future subway lines.
The main attraction in Xihu district is Huanglong Stadium. Since the area is near the
West Lake, people may use car-sharing to travel around the West Lake. The stadium is also near
a university campus with 39,000 students and workers (百度百科, 2011). Students may travel
in groups to different destinations. Having a station near the Zhejiang World Trade Center
opens the opportunity of attracting business members. A big electronic market, Bainaohui is
also located near the stadium. This market creates opportunity for employees to deliver goods.
Figure 53 shows a map of this area, with a 700 meter radius red line. There is a time
square, three office buildings, one residential areas and three government apartments. Right
outside this radius there is a government apartment which also can bring potential customers
for car-sharing (e 都市, 2011). Having a station near government property may build
relationship with different departments of the government. Having a car-sharing station near

118
Huanlong Stadium, an area with high population density will provide good publicity about the
car-sharing system in Hangzhou.
Figure 53: Huanglong Stadium
Location6
# Name Description
1 Huanglong Stadium Stadium
2 Bainaohui Market Electronic Market
3 Tongji Hospital Hospital
4 Huanglong Residential Area
5 Huahong Building Office Building
Figure 54: Huanglong Stadium Key Locations

119
Location 7 - Gongshu
The size of Gongshu district is eighty-seven square kilometers and it is very close to the
downtown. The population of Gongshu is 600,000 and there are ten sub-districts, forty
administrative villages and ninety-two communities with 383 companies and twenty-four
markets. 80% motor industry in Hangzhou is found in this district. Since many auto repair shops
and several vehicle dealerships are located at this location, it would be convenient to have a
car-sharing location close by (拱墅区人民政府, 2011).
Gongshu is an important district of Hangzhou because people with high income live in
the many residential areas. Individuals with cars may sell their cars due to the cost savings
motivation provided by car-sharing. Our target customers for this area are the high-tech
businesses and the government buildings. Savings in fuel, maintenance, insurance, and reserve
parking, are factors that may attract these organizations, while avoiding the difficulties of
vehicle ownership.
Figure 55 shows a map of Gongshu district and a radius of 400 meters for the potential
locations of car-sharing stations (e 都市, 2011). There are not many available parking spaces
near the high tech business center (location 2 on the map); therefore the circle is near the
residential areas, making parking space more available. There are three residential areas, one
office building and business center shown in the map meaning we can target different groups of
people.

120
Figure 55: Gongshu
Location 7
# Name Description
1 Yunhe Square People's Square
2 Silian Creation Center High-tech Business Center
3 Dengyunge Residential Area Residential Area
4 JingchangwenhuaYuan Residential Area Residential Area
Gongshu district Government Apartment
6 YuxingYuan Residential Area Residential Area
7 Lihua Building Office Building
Figure 56: Gongshu Key Locations

121
Location 8 - Lingwu Office Building
Figure 57: Lingwu Office Building
Location 8
# Name Description
1 Lingwu Office Building
Office Building
2 Sanxin Community
Residential Area
3 Qingchundushi Community
Residential Area
4 Jingfang Community
Residential Area
5 Nanxiaofuwen Community
Residential Area
6 Zhejiang University
University
7 Times Square
Square
Figure 58: Lingwu Office Building Key Locations
Lingwu Office Building is located in Jianggan district which is near to the downtown of
Hangzhou. Jianggan district is found at the north of the Qiantang River, and across the river is
the Bingjiang district. There is a bridge, Qianjiangsan Bridge, which connects the two districts
together. This facilitates mobility for many people living in Jianggan districts that have to work

122
in Binjiang district. To the east is Beijing-Hangzhou Canal which is very important for the
district’s economic wealth.
Figure 57 shows a map of the surrounding area of Lingwu Office Building. The figure
shows a red circle, a selected area of 500 meters as the radius, which covers four communities,
one university and one office building. The house price of the four communities is high, so most
of the people living in this area of Jianggan district have high income. They may be more willing
to accept the price of car-sharing. The university is the most famous one in Zhejiang province,
and the students there have low-vehicle ownership levels. This target group can use car-sharing
to meet their special demand, just like shopping or having a party with their friends on
weekends. It will be convenient for the car-sharing business to put a car in this university
campus due to its high population. The companies in the Lingwu Office Building are banks and
new energy companies (E 都市, 2008). People who work here have a strong consciousness to
protect the environment and therefore would like to use car-sharing.
About five kilometers from the Lingwu Office Building, there are two very important
transportation hubs. To the north-west there is a train station, Hangzhou Train Station, and to
the south-west there is a bus station, Hangzhou South Bus Station. Having this transportation
stations near this area increases the changes of people using car-sharing. The people here can
use car-sharing service to pick up or send their friends to each station. There are also two
hospitals to the north of the Lingwu Office Building and two big super markets. Both of these
locations have a high transit density, meaning that the area has important car-sharing location
qualities. There is also a cloth center called Sijiqing Cloth Center which is 526,000 square

123
meters, and it is the biggest cloth center in Hangzhou (百度, 2010). People can also use car-
sharing service for shopping, or moving around this area after going to these attractions.
Location 9 - Xiasha
Xiasha is located eighteen km east of West Lake, in the east of Hangzhou. This is a
suburban area and it is known as Hangzhou economic and technological zone. Xiasha is thirty-
six square kilometers, and area’s residential population is 310,733 (Information center of HEDA,
2011). There are fourteen universities with 200,000 students located in Xiasha and many
industries have their factories in this zone (Hangzhou Bureau of Statistics, 2011). This area can
be considered as a ‘special niche’ for car-sharing location due to its high student population.
Students will be the main target of car-sharing in this area.
People in Xiasha often travel to downtown for different reasons. Due to our surveys,
40% use bus as a transportation method. When taking a bus from Xiasha to downtown, an
individual pays ¥4 each way and it takes approximately one hour to arrive there. Car-sharing
will benefit people who go from Xiasha to downtown with limited time, since it takes forty
minutes to arrive there. This may also be an option for people who go to downtown for
shopping purposes since the buses are often crowded. Taxi, which takes the same amount of
transit time, will be a competitor for car-sharing. A taxi from Xiasha to downtown costs ¥65
each way, but taxis are hard to find at different times and are not convenient for transportation
in downtown at certain times. The surveys conducted in Xiasha show that 70% of people willing
to try the car-sharing service and 68% think the government should implement this project.
Figure 59 shows the map of the part we have selected of Xiasha. The figure shows a red
circle which is the selected radius for potential car-sharing stations. Inside this radius there are
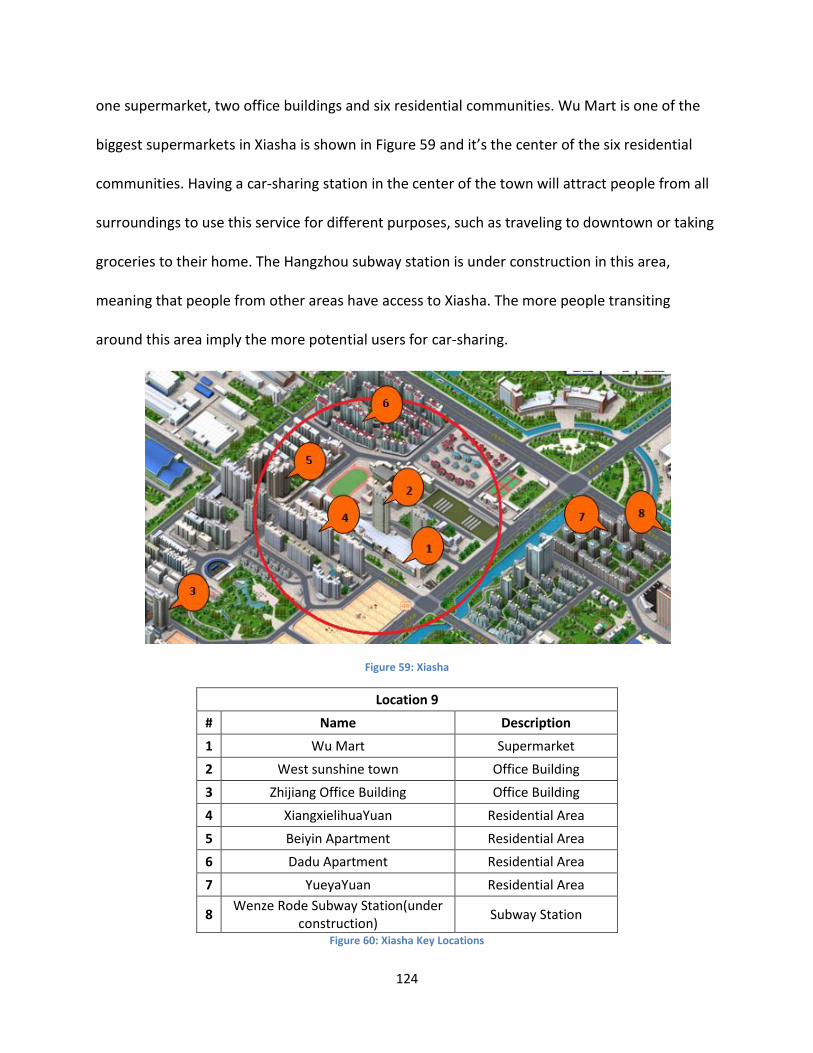
124
one supermarket, two office buildings and six residential communities. Wu Mart is one of the
biggest supermarkets in Xiasha is shown in Figure 59 and it’s the center of the six residential
communities. Having a car-sharing station in the center of the town will attract people from all
surroundings to use this service for different purposes, such as traveling to downtown or taking
groceries to their home. The Hangzhou subway station is under construction in this area,
meaning that people from other areas have access to Xiasha. The more people transiting
around this area imply the more potential users for car-sharing.
Figure 59: Xiasha
Location 9
# Name Description
1 Wu Mart Supermarket
2 West sunshine town Office Building
3 Zhijiang Office Building Office Building
4 XiangxielihuaYuan Residential Area
5 Beiyin Apartment Residential Area
6 Dadu Apartment Residential Area
7 YueyaYuan Residential Area
8 Wenze Rode Subway Station(under
construction) Subway Station
Figure 60: Xiasha Key Locations

125
Location 10 - West City Square
Figure 61: West City Square
Figure 62: West City Square Key Locations
West City Square, part of Xihu district, is located in the west of Hangzhou, and it is also
in the downtown. The total area is 18,000 square meters (罗建, 2011). In this area people can
shopping, go to entertainment places, relax, do sports and visit the scenery. It is the only
Location 10
# Name Description
1 Greentown Jingui Office Building Office Building
2 YijingYuan Office Building Office Building
3 Greentown Hospital Hospital
4 Guihua Town Residential Area
5 Technological villige Residential Area
6 ZiguihuaYuan Residential Area
7 Luojiazhuang Residential Area
8 MingshijiaYuan Residential Area
9 YijingYuan Residential Area

126
commercial center in the west of Hangzhou. It is five kilometers from West Lake and Xixi
Wetland, and both of the two places are important tourist attractions.
Figure 61 is a map of the West City Square. There are at least 98 companies inside the
red circle, which is the radius we selected for car-sharing station locations. These companies
are all technical companies and the employees are all with average income levels. Due to their
good income, employees are more willing to accept the price of car-sharing than in other areas.
West City Square is also a major residential zone with 1,153 households (住在杭州网, 2006).
The residents and company employees could be our target customers. This is a good
distribution of members since residents most likely will use car-sharing in the evenings and
weekends, and employees are most likely to use the service in working days. The communities
and residential areas are new and expensive; therefore most of the people living here have high
income to that afford the charge of car-sharing.

127
5.7.3 Parking Analysis
A reserved parking space for each vehicle is part of the car-sharing operator system. This
parking space provides its users where to pick up the car and have it returned. Picking the
where the car should be parked is an important aspect of running a car-sharing organization
and this location may determine potential members. To obtain maximum optimum unitization
should be the key when deciding the pods location. “Locating pods simply because parking is
free or cheap and easily available is a recipe for long-term disaster” (City CarShare, 2005). In the
case of Hangzhou the parking space location will be determined by government departments
due to the city laws and regulations.
There are several criteria for locating parking spaces. Vehicles and pods are the most
important marketing tools for an operator; therefore visibility of these resources is important
when selecting the parking space. In any transit station members and passing pedestrians
should clearly see the station. Underground spaces are not good locations to park the car-
sharing car due to the lack of visibility. The parking structure is also important when selecting
the parking space because the cars should be parked in the entrance of the place. Locating
them close to the entrance also helps for advertisement purposes (City CarShare, 2005).
Another important factor to consider when picking the parking location is the parking
facility access. The parking facilities should never close at night or have limited access to
residents or employees; they need to be accessible 24/7 (City CarShare, 2005). This factor is
important for customer convenience when accessing the vehicle.
Cost is also an important factor to take in consideration when picking the parking
location. It is important to consider the extra revenue that is generated from well-located
parking spots. This extra revenue may cover additional costs (City CarShare, 2005). In many

128
situations, transit agencies, developers and businesses will be providing free parking for car-
sharing. There are several good parking sources that will contribute to the company’s cost
savings for parking: developers, transit agencies, stores and other businesses, individual
members and private parking operators (City CarShare, 2005) .
It is also important to be aware of locations that are considered illegal parking, such as
on-street spaces and small lots in busy commercial districts. If the company isn’t aware of legal
issues concerning parking, there may be financial problems in the future. Another way to avoid
illegal parking is to get support from lot owners and local parking enforcement agencies. In the
case of Hangzhou City, to get support for the Public Transportation Group is essential for this
project. These connections create more convenient access to the car for members.

129
Chapter 6: Discussions and Recommendations The overall project posed many significant challenges in finding valid ways to allow car-
sharing implementation in the city of Hangzhou, China. We analyzed many key features about
car-sharing from its social impacts, marketing aspects, financial analysis, technological aspects,
locations analysis, and the overall risks of implementing such a system. Some of the data was
easier to analyze by using Zipcar Inc. business models and other data that was unattainable was
analyzed using our own techniques that we found to produce valid solutions. Overall, we
created a baseline of what needs to be done on Hangzhou in order to accept the car-sharing
service. But we still have many recommendations on other aspects that need to be further
researched and developed in order to make car-sharing in Hangzhou the way of the future.
6.1 Risks of Implementing Car-sharing
A major risk that a car-sharing organization faces is the pressure to expand their services
geographically and programmatically (City CarShare, 2005). Demand may arise in nearby cities
and towns, but to over commit in other areas, without analyzing the location may bring future
problems to the company. Even though this business plan show good business possibilities, the
proposal need to be analyzed such as previous locations. Making a decision because official,
transit agencies or citizens believe expanding is necessary is the wrong thing to do. Having
people, who are not familiar with the business development of car-sharing, make decisions may
affect the business since they are not familiar with the factors needed to be consider for the
business to succeed. These individuals may think there is a good business opportunity, but
different customer targets need to be involved to assure the utilization rate of the cars. There
needs to a viable market willing to use this service in order to make a profit.

130
Bringing new programs such as electric vehicles and special systems for business
companies is also a risk to take. Battery electric vehicles raise awareness of car-sharing and give
the organization an environmental image by their potential for emission reduction. For the
decision analysis of this project, electric vehicles are not introduced to the business plan until
year two, and this is if Hangzhou City provides the facilities needed, such as charging stations in
different locations around the city. Even though electric cars are a positive look for the car-
sharing organization, battery electric vehicle has many disadvantages. Cost is the main
disadvantage for the business. Electric vehicles need several hours of charging, most vehicles
require up to hours hours to be fully recharged which makes time a loss of potential profit.
Since vehicles will be out of service, they are unable to generate revenue which is inconvenient
for car-sharing (City CarShare, 2005). This affects the utilization rate of the vehicles and may
cause less desirable members of the service. Another disadvantage of battery electric vehicles
is reliability of the service it can offer. The technology of electric vehicles is not developed
enough to offer independence of the vehicle and this becomes an obstacle to car-sharing
success.
Another risk for car-sharing is to implement ‘station cars’ service, meaning a group of
users share one car to commute trips at different times a day. Based on early car-sharing
operations in the United States station cars are rarely cost effective and often used by only one
group of potential customers (City CarShare, 2005). Station market may work for a niche
location for some operators, but particularly if the employer is willing to cover the cost. This
method is not the best function because it has a limited market compared to other
opportunities of car-sharing.

131
One-way trips are another risk that car-sharing faces and it’s recommended not to do
when introducing the system to a community. One-way trips are often requested by members
since it can be a constraint for many users to return the car to the same location where it was
picked up. The company should not over commit to the customer demands. The one-way trips
option provides practical difficulties for the business. To avoid imbalances at a particular
location, staff would have to relocate the vehicle which is expensive for the company and time
consuming. One-way trips would also complicate reservations, and the reserved parking spaced
would need to be greater than the number of vehicle.
Picking wrong locations to build a car-sharing station is another risk a car-sharing
company faces when giving their customers the opportunity of car-renting similar to car-
ownership experience. Customers will often demand cars stations near a convenient location
for them, but this should never be the reason of locating a station. Different criteria, such as
high density, mix of land uses, good transit access, low-vehicle ownership and financial
sustainability, need to be considered for car-sharing stations.
If the car-sharing station is located in an area with low density, then the company will
not generate the approximate revenue to succeed. To generate revenue and customer
satisfaction should be the car-sharing company’s main goal, if this isn’t accomplish then the
company will face negative results. Another risk when picking a location is selecting an area
with no mix of land uses. In other words, there is no balance between different target
customers. This balance is needed to assure the utilization rate of the customers, since
different groups of individuals may use the vehicle for different purposes and at different times.
To maximize the probability of potential customers, the car-sharing station should be in an area

132
with good transit access. This is a risk for the organization since an area with different
transportation modes doesn’t always imply potential customers. For example, it wouldn’t be
useful to have a station next a bus station, if all potential customers transiting the area do not
own a driver license. Therefore, the area should also have low-vehicle ownership. These imply
households with only one car, or no car but the individuals own driver licenses. An analysis of
the area will need to be done in order to know if car-sharing will be a business in certain
communities. Private automobiles are car-sharing’s number one competitor, therefore it is
important for a community to have the need of alternative transportation options

133
6.2 Financial Recommendations
To analyze the profitability of car-sharing we prepared a financial plan for a car-sharing
service in Hangzhou. We determined what kinds of costs that the business would have and
found data on those costs. Taking these costs into consideration and the information we
obtained through our surveys we came up with a price scheme for the car-sharing service. We
recommend that every new member is charged a onetime application fee of 200¥ as well as a
2000¥ security deposit. The application fee will be used to cover the costs related to new
members such as background checks and outsourcing the membership card production. The
security deposit will be kept until the customer decides to no longer be a member. Revenue will
be generated through the interest income on the security deposit. The security deposit will be
used to cover any costs related to accidents and theft. The main source of income however is
the per hour charge. Our team recommends to have a 40¥ fee per hour. This price will make
car-sharing a very realistic option of transportation for many people. We did not include a per
distance fee for the service. In the future a combination of per hour and per distance charge
can be used if found more profitable.
The main competitors of car-sharing in Hangzhou will be private cars and taxis. To be
able better compete with these competitors we have some suggesting for the car-sharing
service. We found out that if a customer wants to travel a place and spend more than couple of
hours there, taxi becomes a cheaper option. To be able to compete with taxi the car-sharing
service could offer cheaper per hour charge after a certain amount of hours. For example after
the fourth hour the hourly fee can go down to 30¥. This price could be justified with the cost
reductions that can be achieved through partnerships.

134
6.3 Partnership Recommendations
Partnerships are recommended when introducing car-sharing into a community because
the business rarely succeeds in isolation (City CarShare, 2005). Participation with transit
agencies, parking authorities, and cities in car-sharing can bring a successful operation for the
business. Benefits of partnership include: funding, parking, advertising space, and more. The
benefits from other organization’s support help the car-sharing business have a better financial
outcome in the long-run.
Funding, such as usage fees and grants, can be used for either for general operating
support or specific projects. In order for an organization to qualify for funding the business plan
should establish principles of the organization and answer critical questions, including expenses
of the organization. Many government agencies have funded costs at the beginning of car-
sharing operations (City CarShare, 2005). We recommend that car-sharing in Hangzhou to be
government funded since it has brought a lot of benefits for bicycle sharing in Hangzhou.
Partnerships with parking authorities are recommended for this project since most of
our locations are located in downtown where parking is of high cost. Partnership with Public
Transportation Group in Hangzhou City will bring enormous cost savings to the company since
the group owns the land for parking space. Parking partnerships will often provide ideally free
use of land or discounts. If the car-sharing company accomplishes to get these benefits the
company will break even sooner, bringing more revenue to the company, as well as a faster
expansion of the service.
It is important when introducing a new concept to market the service to individuals. It is
recommended partnership with companies for advertisement and publicity purposes. As seen
in the bicycle sharing service provided in Hangzhou, high income is generated from

135
advertisement done by private companies; the stations provide three form of advertisement. If
other companies are willing to advertise for car-sharing as well, this partnership will save cost
to the car-sharing company as well as for the private company. The money saved will come
from discounts due to the partnership, or even free publicity.
Partnership with organizations, such as listed above, can also bring potential business
members. In locations around suburban areas, it was recommended stations to be near
government offices. If government offices become a business member of car-sharing, the
business will provide revenue and can accomplish a major improvement to the organization’s
membership. Hangzhou City has at least 50 different departments, which involve a large
number of employees.
6.4 Relationship between Price and Demand
Figure 63: Demand vs. Price
y = 0.07x2 - 0.544x + 1.085R² = 0.9999
0%
10%
20%
30%
40%
50%
60%
70%
45 55 65 75
Demand Vs. Price
Demand Vs. Price
Poly. (Demand Vs. Price)

136
A polynomial function shows the relationship between some variable to another
variable with few restrictions limiting its behavior (Wikidot, 2011). In the case for Figure we are
comparing the relationship between price and demand of car-sharing in Hangzhou. We selected
this regression type since polynomial functions tend to contain no discontinuities in their
behavior, have distinct slopes or features, and have multiple behaviors that approach infinity.
The input variable, in this case x= price, was selected from the survey options in question 9
found in Appendix A. Since the pricing options varied from <¥50 to >¥81, we decided to select
numbers to pick the numbers in the x-axis between this range.
The equation y = 0.07x2 - 0.544x + 1.085 is a sum of three terms, and it shows that the
degree of the polynomial function is 2. The degree is really important in a polynomial function
since it shows the number of possible roots, or x-intercepts (Wikidot, 2011). A degree 2 graph is
in the form of a parabola. We selected a polynomial function since the graph is half a parabola
and due to its even exponent it doesn’t go forever in both directions. The y stands for the
percentage of people who are willing to pay a specific price. This formula is useful since it helps
see a price scheme of the car-sharing service.
We also calculated the weighted average of these prices. “An average in which each
quantity to be averaged is assigned a weight (Investopedia, 2011) .” The selected values were
the prices and the occurrences were the percentage. The weighted average we calculated from
the percentages in Figure 16 is 50.3. This value will be influenced depending on the amount of
surveys being responded.
We recommend that before implementing a price for car-sharing service to do a further
study of this graph, as well as more surveys to get a more precise weight average. The
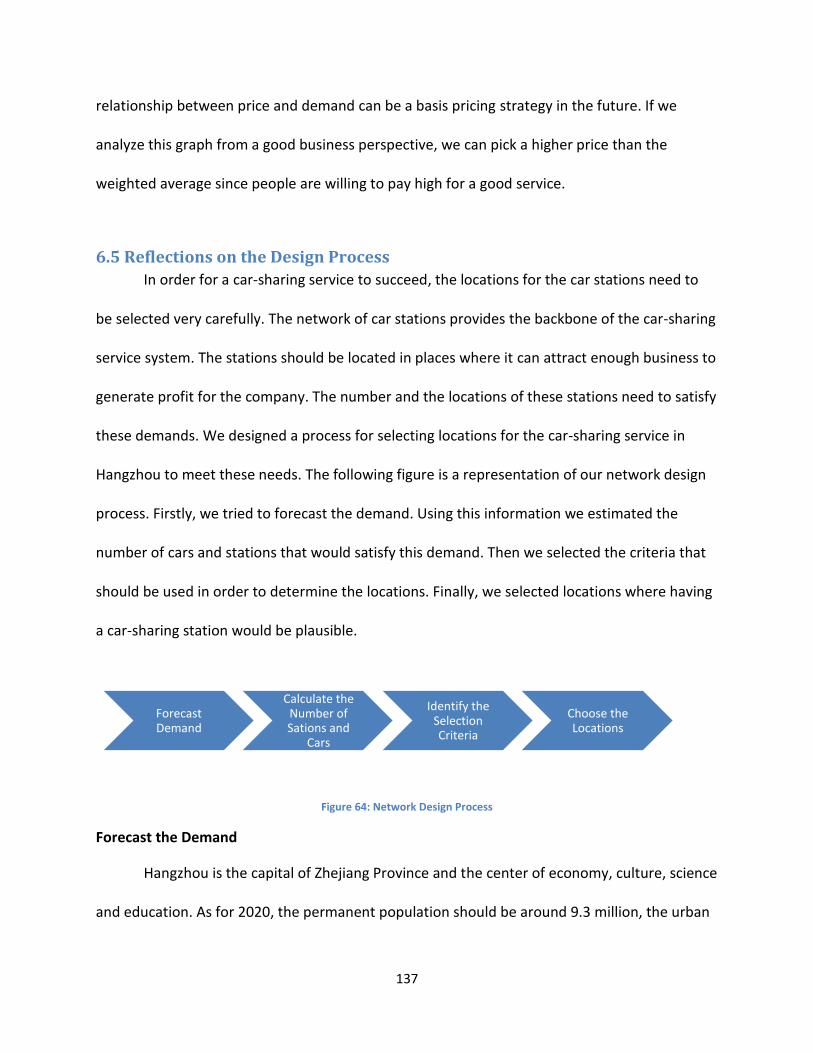
137
relationship between price and demand can be a basis pricing strategy in the future. If we
analyze this graph from a good business perspective, we can pick a higher price than the
weighted average since people are willing to pay high for a good service.
6.5 Reflections on the Design Process
In order for a car-sharing service to succeed, the locations for the car stations need to
be selected very carefully. The network of car stations provides the backbone of the car-sharing
service system. The stations should be located in places where it can attract enough business to
generate profit for the company. The number and the locations of these stations need to satisfy
these demands. We designed a process for selecting locations for the car-sharing service in
Hangzhou to meet these needs. The following figure is a representation of our network design
process. Firstly, we tried to forecast the demand. Using this information we estimated the
number of cars and stations that would satisfy this demand. Then we selected the criteria that
should be used in order to determine the locations. Finally, we selected locations where having
a car-sharing station would be plausible.
Figure 64: Network Design Process
Forecast the Demand
Hangzhou is the capital of Zhejiang Province and the center of economy, culture, science
and education. As for 2020, the permanent population should be around 9.3 million, the urban
Forecast Demand
Calculate the Number of Sations and
Cars
Identify the Selection Criteria
Choose the Locations

138
household population around 8.2 million (City Planning Board, 2001). Several surveys were
conducted around Hangzhou in order to estimate how many potential customers would be
interested in the service and what group of people will be willing to use it.
We decided that it would be helpful for our project and our sponsors if we identified
some characteristics of the population in Hangzhou. We prepared a survey that would help us
understand the opinion of potential customers towards car sharing. We asked questions on the
background of the customer as well as their opinions about the service. We surveyed people at
tourist attractions, supermarkets and busy streets. This way we aimed to get a mixture of the
population in Hangzhou. These surveys helped us to decide whether implementing such a
service in Hangzhou would be successful or not. It also helped us the come up with a price
scheme for the service. The overall data that we obtained from the surveys helped us better
analyze the feasibility of car sharing in Hangzhou.
The surveys were conducted in downtown, as well as in suburban areas. Due to time
constraints and limitation, surveys were not conducted in all areas of Hangzhou. Looking at
comments and responses from individuals from different sex, age and purpose of transiting
Hangzhou, helped us select several areas. Hangzhou Tower, West Lake area and Xiasha were
three areas were surveys were conducted. The survey responds in these show high interest for
car sharing and many people thought introducing an alternative transportation was a great
opportunity for the city to decrease it traffic crisis. However, we also noticed that many people
were not familiar with the idea of car-sharing.
To estimate the number of member at the end of the first year of the car-sharing service
in Hangzhou, we looked at the financial plan of Zipcar. Zipcar had 440 members at the end of its

139
first year. This number grew very slowly over the next five years. Our team thought that since
car-sharing is now a mature business plan and since Hangzhou has more than ten times of the
population of Boston, the number of members will increase much faster. We wanted to be
conservative with the beginning number of members since the car-sharing idea is very new in
China. We decided to have 500 members at the end of the first year and assumed that this
number will be doubled at the end of every year. Based on these numbers we calculated the
number of cars and stations we will have and prepared a financial plan.
We have also looked at other alternatives. What if we have 1000 or 2000 member at the
end of the first year? The fact that the bike-sharing service has five million members in
Hangzhou shows that there might be a greater number of potential customers for a car-sharing
service. If only 1% of these members use car-sharing then the business would have 50,000
members. We looked at different scenarios with different number of beginning members and
the impacts on the revenue, cost and the rate of return. This brief what-if analysis can be found
in section 5.6.1.
Calculate the Number of Cars and Stations
In a car-sharing service, coming up with the correct amount of cars to implement into a
city and how to go about analyzing a city’s demographics to figure out the correct number can
be difficult. In order to get an estimate on how many car-sharing will be needed to
accommodate for the population we looked at the cities that Zipcar has cars in. We looked at
each city’s population and the number of zipcars available in each city. We tried to compare
cities that have similar populations to Hanzghou. We compared New York to Hangzhou because

140
both cities have very similar populations. However, New York is a city where Zipcar hasn’t fully
grown yet and has a very low zipcar : population ratio. This is why we think that the population
to zipcar ration in New York is not a good indicator for Hangzhou. Therefore, we calculated the
population per zipcar in each city and averaged those numbers. We used that average to come
up with a number of car-sharing vehicles for Hangzhou. We estimated that when the car-
sharing service reaches maturity in Hangzhou there will be around 1800 cars. This calculation
doesn’t factor in the maturity of Zipcar in the cities. The details of these calculations can be
found in section 5.4.4.
During our research we found a study on car-sharing services done by the Institute of
transportation Studies UC-Davis. This study suggested that “although precise member-to-
vehicle ratio data are not available for car-sharing organizations worldwide, average national
ratios are approximately 20:1 and are lower in new markets in which operators must first
position their vehicles to gain membership”. Based on this information we decided to use a
10:1 ratio for the first year, 15:1 in the next three years and 20:1 in the fifth year. We estimated
the number of members at the end of year one to be 500. With the 10:1 ratio, we decided to
have fifty cars in the first year.
To calculate the number of stations we would need in the first year, we looked at the
number of cars Zipcar has in its stations. The number of zipcars in each station range from two
to fifty. However, expect for the very central locations zipcar has only a few cars in each station.
We decided to have no more than five cars in each station in Hangzhou. Since we decided to
have fifty cars, we came to the conclusion that ten locations would be sufficient. We think that
the number of cars in these stations can be adjusted after the first year performance results.

141
Having more than ten cars has several advantages and disadvantages. Having more
locations would mean better publicity for the company. Locations will spread to a larger area
and reach more people. This would help advertise the car-sharing idea better. Also at the end
of the first year, the company would have performance information on more locations if there
are more than ten locations. A disadvantage of having more locations is the financial burden on
the company. Parking spaces can be expensive and troublesome to obtain. Each parking lot
would add to the initial investment required to start the business.
Identify the selection criteria
Car sharing is a unique source of transportation for individuals and businesses. It
provides transportation for people who do not own a car and allows them to do occasional
trips. Car sharing service is ideal for individuals who own a car and drive fewer than 5,000 miles
a year. This method is convenient for those individuals, since it provides cost savings.
Businesses can benefit from car sharing by making it a transportation option to their
employees. In order for a car sharing organization to succeed, the potential locations need to
have several qualities. “High density, a mix of land uses, good transit access, and already-low
vehicle ownership levels are important if car sharing is to be viable.” All factors are equally
important when introducing car sharing into a community (City CarShare, 2005).
Density is the first quality to take into consideration in an area when determining the
viability of that location. When providing car sharing as an alternative to car ownership, it is
convenient to have a wide array of potential customers. It is also important to consider that
households living in dense neighborhoods tend to own fewer cars (City CarShare, 2005). Areas
with high density indicate quality of transit, a pedestrian environment, and local shops and

142
services. These qualities make car-free lifestyle a realistic option for local residents. High
density locations are more convenient for car sharing than low density locations due to the
greater number of nearby destinations and the shorter trips (Transit Cooperative Research
Program (TCRP), 2005).
Urban neighborhoods that are dense offer the best potential locations for car sharing.
These neighborhoods include characteristics such as mixed-use development, scarce parking,
and good transit. It is difficult to establish car sharing without these elements. Low density
areas are most likely to no have convenient transit service which makes it difficult to serve
different modes of transportations. If the potential locations have low density, then the
company will have to spend more money in marketing and outreaching customers.
Another important factor, when introducing car sharing, is to have land for both
residential and commercial purposes. This mix of land uses is important to ensure that cars are
utilized enough to make a profit. These lands are also beneficial in terms of having a variety of
customers. Business members have an important role in increasing utilization rates and evening
out the demand cycle since they tend to use car sharing during work days (Transit Cooperative
Research Program (TCRP), 2005) . On the other hand, other people use car sharing for personal
trips either on evenings or weekends. With different demand patterns, mixed-use
neighborhoods can attract both business and individual members. If there is a variety of
customer then the cars will be efficiently utilized most of the time. This helps avoid sharp
periods of peak demand.
Even though car sharing has many benefits, it is usually not the best type of
transportation. Another quality of a possible location is to pick an area with good transit access.

143
Car sharing will be introduced as another transportation alternative besides transit, taxis, rental
cars, walking, cycling, and more. These areas usually have a heavy flow of people. Having a car
sharing location at these locations would provide great publicity and numbers of potential
customers.
Low vehicle ownership, another key location quality for car sharing to succeed, indicates
that the area has potential car sharing users. Car sharing is most likely to succeed in areas
where people cannot afford to have a car but need mobility and travel choices. This quality
makes car sharing a realistic option for many households. Since car sharing includes fuel,
maintenance, insurance, and reserve parking, members will save money and continue avoiding
the difficulties of vehicle ownership; these are the key attractions for car sharing users.
Vehicle ownership is also a competitor for car sharing organizations. Car owners are the
largest potential market for car sharing, and it is important to attract these individuals to
achieve environmental and social enhancement (City CarShare, 2005). In order for car sharing
to be successful both financially and environmentally, having a population with low vehicle
ownership is important. Car sharing also encourages individuals to sell their cars since users are
motived by the cost savings provided by the system. Therefore, areas with people who are
willing to sell their cars, car-free households, and people who are thinking about buying a car
are the potential target markets for car sharing.
According to City CarShare, there are some ‘special niches’ where car sharing are likely
to succeed. Car sharing may work with lower densities in special niches such as transit stations,
university campuses and new development areas. Having car sharing stations near transit
stations gives the option for those members that transit in the surrounding neighborhoods.

144
Stations in university campuses will attract the younger population and are the center of
activity for this market. Car-ownership is usually restricted in university campuses due to the
lack of parking space or university rules. New development areas are another ‘special niche’ for
car sharing since businesses are potential customers for the service. In these areas, car sharing
helps reduce parking demand and developers are often willing to include car sharing in their
projects (City CarShare, 2005).
Taking these four key factors, high density, low vehicle ownership, transit locations and
mix of land uses, our team has come up with several locations in Hangzhou that would be
plausible for implementing car sharing in Hangzhou.
Choose the Locations
Our team has selected ten locations were selected to implement car sharing stations
into Hangzhou and its communities. The selection criteria were taken into consideration to
select these locations.
Seven locations were selected for downtown of Hangzhou: Qingchun Square, Hangzhou
Tower, Heaven Software Park, Huanglong Stadium, Gongshu district, Lingwu Office Building. All
locations share similar characteristics. There is high potential for car-sharing to succeed in
downtown due to its high density at all times. People enjoy moving through downtown because
of its high activity, and divers’ options of restaurants, shopping centers and attractions. The
area has a good balance of business and residential potential users for car-sharing. As an
advantage for car-sharing, traffic is a problem in downtown and as a transportation alternative
it has potential to be attracted to many users. As for the negative aspects, parking space is
expensive in downtown compared to suburban areas. This cost affects picking the location.

145
We analyzed future financial outcome of the station location, and how demand will
eventually balance the parking cost. We recommend doing this cost analysis when deciding to
expand the number of cars in each station, or to increase the number of stations in one area.
Purchasing a parking space in downtown costs around 400,000¥ (Pu, 2011). The rent for such a
parking space costs 5% of the purchasing price. Therefore, we calculated the parking fee per car
per year to be 20,000¥. Partnerships with parking authorities are recommended for this project
since most of our locations are located in downtown where parking is of high cost. Partnership
with Public Transportation Group in Hangzhou City will bring enormous cost savings to the
company since the group owns the land for parking space. Parking partnerships will often
provide ideally free use of land or discounts. If the car sharing company accomplishes to get
these benefits the company will break even sooner, bringing more revenue to the company, as
well as a faster expansion of the service.
Three locations were selected to implement car sharing in Hangzhou’s suburban areas:
Binjiang, Xiaoshan and Xiasha. The target customer for this area is different than in downtown.
Suburban areas in Hangzhou have high population of university students, business employees
and residents. This involve a young population, therefore a lot of this individuals do not own
drivers licenses or may only need a car on the weekends. The 3 locations have high density, mix
of land uses, good transit access, low-vehicle ownership, and financial sustainability; therefore
they show potential for car sharing to succeed. There are many government office located in
suburban areas, as shown in the location analysis. Having government officials be our potential
customers, open many opportunities for car sharing. Parking space is also cheaper in suburban

146
areas than in downtown, therefore there is a balance in parking space cost and revenue for
these areas.
Each location in the analysis shows a radius for potential parking stations. We were not
able to come up with exact parking locations due to several reasons. Constructing parking lots
requires special permissions from different government departments. For example, the police
department needs to approve the parking location in order to make sure it doesn’t block the
view of any security cameras and obstruct the police department in any way. We were not able
to get in touch with the departments in order to make a deeper analysis on the parking lots.
Also we were able to obtain specific information such as population and income levels of some
areas to be able to do a comparison. To be able overcome these obstacle we would need more
time.
We recommend taking the ten suggested locations into consideration if a car-sharing
service is to be implemented in Hangzhou. Also we suggest that the selection criteria we came
up with to be improved and used to select future locations. Picking locations, such as ‘special
niches’ or without any analysis are risk taking decision that the company will have to face in the
future. If the locations are selected without a rational analysis, the company may face more
expenses than expected and generate loss.
6.6 Suggestions for Future Studies
The analysis of car-sharing feasibility study in Hangzhou has brought us numerous
sources of information we need in order to successfully implement a car-sharing system in the
city. It has also led us to realize that there can be much more research analyses done in order to
further analyze the future opportunities of car-sharing in Hangzhou.

147
1. Examine more models of electric vehicles and analyze future development of the
electric cars to see if it will be a suitable vehicle for car-sharing’s future. Go beyond
Zoyte and see what other manufacturers are providing. A more detailed analysis on the
feasibility of electric cars should be done.
2. Future analysis can provide a more detailed analysis of how many cars should first be
implemented, how to go about finding the exact locations and the number of vehicles in
specific location.
3. We have several estimations for cost information in our financial plan. More detailed
cost data can be found for the financial analysis. This would provide a more accurate
financial plan.
4. The financial analysis can look more specifically into how much profit is made per hour
of car-sharing. Meaning analyze how much fuel, insurance, membership fees, etc. is
deducted for one hour of car-sharing in order to find the most optimal per hour charge.
5. To capture the population’s opinions on car-sharing better, surveys can be conducted
on a larger sample size. New questions can be added into or current questions can be
improved to get more specific results.

148
Appendices
Appendix A: Sample Survey
Car-sharing Service Questionnaire
Definition of car-sharing: Car-sharing service is a car rental model where people can rent a car for a
specific amount of time.
1. Gender:
□ Male □ Female
2. Age:
□ 18-25 years □ 26-40 years □ 41-50 years □ >50 years
3. Do you drive or have a driver’s license?
□ Yes □ No
4. Are you a:
□ Resident □ Tourist □ Other: _________________
5. If you are a tourist, what form of transportation do you prefer?
□ Car-sharing □ Renting a Car □ Taxi □ Other: _____________
6. What are your monthly transportation expenses (including maintenance for private cars)?
□ < ¥100-150 □ ¥150-300 □ ¥300-450 □ ¥450-600 □ >¥600
7. Your primary form of transportation in Hangzhou (check all that apply):
□ Car □ Taxi □ Bicycle □ Walk □ Bus □ Other: _________________
8. If a car-sharing service was provided, would you be interested in using it?
□ Yes □ No □ I do not know, why: ______________________________
9. How much would you be willing to pay per hour for car-sharing service?
□ <¥50 □ ¥50-60 □ ¥61-70 □ ¥71-80 □ > ¥81
10. Do you think the Hangzhou’s government should implement a car-sharing service?
Location: __________________ Date: _____________________

149
□ Yes □ No □ Not sure, why: ______________________________
Appendix B: Excel Data for Survey Results
150
Appendix C: Financial Plan Details
This appendix provides details on the financial analysis. Each source of income, fixed and
variable cost are explained individually. This appendix also includes the reasoning behind our
assumptions and sources of data.
Revenues
o Customer Characteristics
There were several assumptions that we needed to make before we could prepare a financial
plan. According to the research done by Zipcar’s founders “mature European companies had
found that 50% utilization of each vehicle (i.e., 360 hours per month) was the most that could
be achieved if customer satisfaction was to be maintained”. This is why Zipcar decided to target
40% utilization at the initial stages of the business. Based on this number, it is assumed that the
average member would take four trips per month at an average of four hours and 22 miles per
trip. (Myra Hart, 2005) Our team decided to use the same numbers for the car-sharing service
in China.
o Beginning Members
This number represents the number of members at the beginning of every year. It is equal to
the ending number of members of the previous year. At the beginning of the first year the
company has zero beginning members.
o Attrition
Attrition is the percentage of customers that the company will lose every year. We decided to
use 15% as attrition like Zipcar did in their financial plan. (Myra Hart, 2005) The beginning

151
number of members is multiplied by the percentage to calculate how many customers will be
lost every year.
o Ending Members
This number represents the number of members at the end of every year. Zipcar estimated that
they would have 440 members at the end of the first year and that this number would increase
by less than 50% every year. We have estimated to have 500 members at the end of the first
year. We picked a similar number because the idea of car-sharing is very foreign in China and
we do not expect a lot of members in the first year. Since the population of Hangzhou is more
than eight times the population of Boston we assumed that the number of members will grow
faster. Our team estimated that the number of ending members will be doubled every year.
o New Members
This number represents the number of new members the company gets in each year. It is
calculated by the following equation:
Ending Members + Attrition – Beginning Members
This number is important because each new member is charged a fee to become a member.
o Average # of Members
This number is calculated by taking the average of the beginning members and ending
members. This is done because customers can become members anytime during the year and
not just the beginning. This number captures the amount of members the company has better.

152
o Application Fee (per new member)
This is a one-time fee that every new member needs to pay to become a member. We
estimated this fee to be 200¥. This number was decided upon by taking into consideration
Zipcar’s financial plan and the transportation expenses from our surveys.
o Annual Fees (per average member)
This numbers is the annual fee that every member needs to pay to stay a member. We
estimated this fee to be also 200¥. This number was decided upon by taking into consideration
Zipcar’s financial plan and the transportation expenses from our surveys.
o Per Mile Charge
This is the fee that the customer is charged for every mile he/she travels with one of the
company cars. Currently this number is zero; meaning that we will not be charging according to
the distance that the customer travels. If in the future this decision is to be changed, it is
already incorporated in the financial plan. The income generated by this fee is calculated by the
following equation:
12 Months * 35Km/trip * 4 trips/member/month * Per Mile Charge * Average # of Members
o Per Hour Charge
Every customer will be charged depending on the number of hours they use the cars. According
to our surveys results 61% of the people said that they would be willing to pay less than 50¥
and 28% between 50¥ and 60¥. The revenue generated is very sensitive to the hourly charge.
Based on these results we used 40¥ as the hourly charge. The income generated by this fee is
calculated by the following equation:
12 Months * 4 Hours/trip * 4 Trips/member/month * Per Hour Charge * Average # of Members

153
o Security Deposits
This is a refundable deposit that will be charged every year. The amount is 2000¥, equivalent of
the 300$ that Zipcar planned to charge their customers. This deposit is very similar to the 200-
300¥ that bike sharing service deposit. This money will be kept by the business until the
member decides to no longer be a member. Then the money will be returned to the customer.
o Interest Income
This number represents the income that will be obtained from the interest of the security
deposits. The simple interest rate is currently 3.1% in China (中国工商银行, 2011). The income
generated through the interest on the security deposit is calculated by the following equation:
Security Deposit (2000¥) * Average # of Members * Interest Rate (3.1%)
Variable Costs
o Beginning Cars
This number represents the number of vehicles at the beginning of every year. It is equal to the
ending number of vehicles of the previous year. The numbers for regular cars and electric cars
are tracked separately because the costs associated with them are different. At the beginning
of the first year the company has zero cars.
o Ending Cars
This number represents the number of vehicles at the end of every year. The number of ending
cars is proportional with the number of customers. According to a study done by the Institute
of Transportation Studies the average national member-to-vehicle ratio in car-sharing services
is approximately 20:1. It is also shown in the study that this number is lower in markets in which
operators must first position their vehicles to gain membership. Based on this information our
154
team decided to use a 10:1 ratio in the first year, 15:1 ratio in the following three years and
20:1 ratio for the fifth year.
o Average # of Cars
This number is calculated by the taking the average of beginning cars and ending cars. New cars
can be added in to the system any time during the year and this number best captures the
number of cars the company has at all times. This number is also used to calculate the costs and
examples can be seen in the following bullet points.
o Lease Cost (car/year)
This is the cost of renting a car for one year. This number was calculated based on the costs to
purchase a Volkswagen Lavida (易车网, 2011). We chose this type of car because it is the most
commonly rented car in eHi. Through our research we found that the present value 152,000¥
and the residual cost after five years is 60,000¥ (汽车之家, 2011). The following calculation
shows how our team obtained the 20,300¥ lease cost per year.
Annual Worth = (152,000¥ - 60,000¥) * (A/P, 10%, 5) = 20,300¥
Through our interview with Zotye we found that it costs 24,000¥ to rent an electric car for a
year. The cost generated by this is calculated for each year with the following equation:
Lease Cost (car/year) * Average # of Cars
o Access Equipment (car/year)
This cost includes the implementing the RFID system into the cars which is roughly 3,000¥
(Chainway, 2011). Also for electric cars, this number includes the construction of a charging
station which is 200,000¥. These numbers are multiplied by the number of regular and electric
cars to find the total cost.
155
o Fuel (car/year)
According to Mr. Zhou’s study the fuel for an average car costs 6,000¥. Our team decided that a
car-sharing vehicle will be used three times more than a regular car. Therefore we used 18,000¥
as the yearly fuel cost (香港达泰投资咨询有限公司, 2011).
o Insurance (car/year)
The insurance cost for a regular car is 7,300¥ and 8,800¥ for an electric car. We obtained these
numbers through our interview with Zotye. From the information that we got from China
Pingan, an insurance company, fully insuring a Volkswagen Lavida costs 6,000¥. However, we
think that since car-sharing cars will be utilized much more than privately owned cars, the
insurance price will be higher. Therefore, we decided to use 8,000¥ for regular cars and 9,000¥
for electric cars.
o Maintenance (car/year)
The maintenance cost includes the cleaning and the basic needs of the car such as oil and tire
rotation. For a medium class car this number averages at 4,500¥ (香港达泰投资咨询有限公司,
2011). The maintenance cost also includes the annual inspection fee which is 100¥. This fee is
government mandated.
o Parking (car/year)
Purchasing a parking space in downtown costs around 400,000¥ (Pu, 2011). The rent for such a
parking space costs 5% of the purchasing price. Therefore, we calculated the parking fee per car
per year to be 20,000¥.
156
Fixed Costs
o Corporate Insurance
Business assets like manufacturing units, trading and service properties are covered under
corporate insurance. Emergencies occur unexpectedly, investment on corporate insurance
would safeguards the business. From our research online we found out that 4,800¥ is a
reasonable price for corporate insurance (与尔同轩, 2006).
o Reservation System
The business will need a system to keep track of customers, billing and information about cars.
A similar software system costs 580,000¥ for the bike sharing service in Hangzhou. Based on
this number we estimated that such a system would cost 600,000¥ for a car-sharing service.
This cost also includes the incorporation of the Global Planning System into the service.
o Administration
This number includes the salaries of all the employees. The different type of employees include
sales managers, marketing manager, operations manager, salespeople, technicians, call center
staff, human resources representatives and accountants. The number employees grow as the
business grows. The information on the salaries of different positions was researched online (金
静敏, 2010). The number of employees was determined by the current employee to vehicle and
employee to member ratios of Zipcar. Zipcar currently has a vehicle to employee ration of 31:1
and a member to employee ratio of 2,170:1. Our ratios are 12:1 and 242:1 respectively. We
think that this difference is reasonable in the fifth year of the car-sharing business in Hangzhou.

157
o Benefits
The company will be providing health insurance and other similar benefits to its employees.
35% of the salaries will be cost of benefits for the company (中国律师网, 2011).
o Office Space
The office space will be rented. Through our research we found that the annual rent for the
office space would be approximately 152,000¥ (金静敏, 2010).
o Office Equipment
Our team estimated the initial cost for the office equipment to be around 500,000¥. This
number includes the cost of furniture, decoration, printers, air conditioners and other
equipment. The cost for the following years is proportional with the number of new employees.
Our team estimated the equipment cost per new employee to be 10,000¥. This cost includes
desks, chairs, computers and phones (Yueqi, 2011).
o Phone
Through interviews we found out that the phone bill averages around 150¥ per person in a
company. To calculate the cost for the phone we multiplied the number of employees with this
number.
o Marketing
The cost of marketing is determined to be 700,000¥ each year and the reasoning can be found
in the marketing section of our paper.
o Background Checks
Background checks on every new member needs to be conducted in order to avoid unreliable
customers. The cost of conducting background checks is determined to be 120¥ (Myra Hart,

158
2005).
Net Income Before Tax
This number is calculated by subtracting total costs from revenues. It gives insight on the
profitability of the business.
Cumulative Income
The cumulative income is calculated to see when the business pays off the initial investment.
The following equations are examples of how cumulative income values are calculated:
Cumulative Income (Year 2) = Income before Tax (Year 1) + Income before Tax (Year 2)
Cumulative Income (Year 3) = Cumulative Income (Year 2) + Income before Tax (Year 3)
Net Income After Tax
When the business pays off the initial investment and starts making net profits, the profit will
be subject to tax. The tax rate was found to be 25%. Therefore, the net income after tax is 75%
of the cumulative income.
Initial Investment
Initial investment is the capital required to start the business and support it in the early stages.
In the first two years of the business there is a net loss. Initial investment is calculated by the
following formula:
Costs in Year 0 +ABS [ Net Income before Tax (Year 1) + Net Income before Tax (Year 2)]
Internal Rate of Return
The internal rate of return (IRR) is a rate of return used in capital budgeting. The term internal
refers to the fact that the calculation does not incorporate environmental factors (Fiebel, 2003).
The internal rate of return is calculated to decide whether this project is worth investing in. The

159
calculation was done using the IRR function in excel using our net income after tax values as the
input.
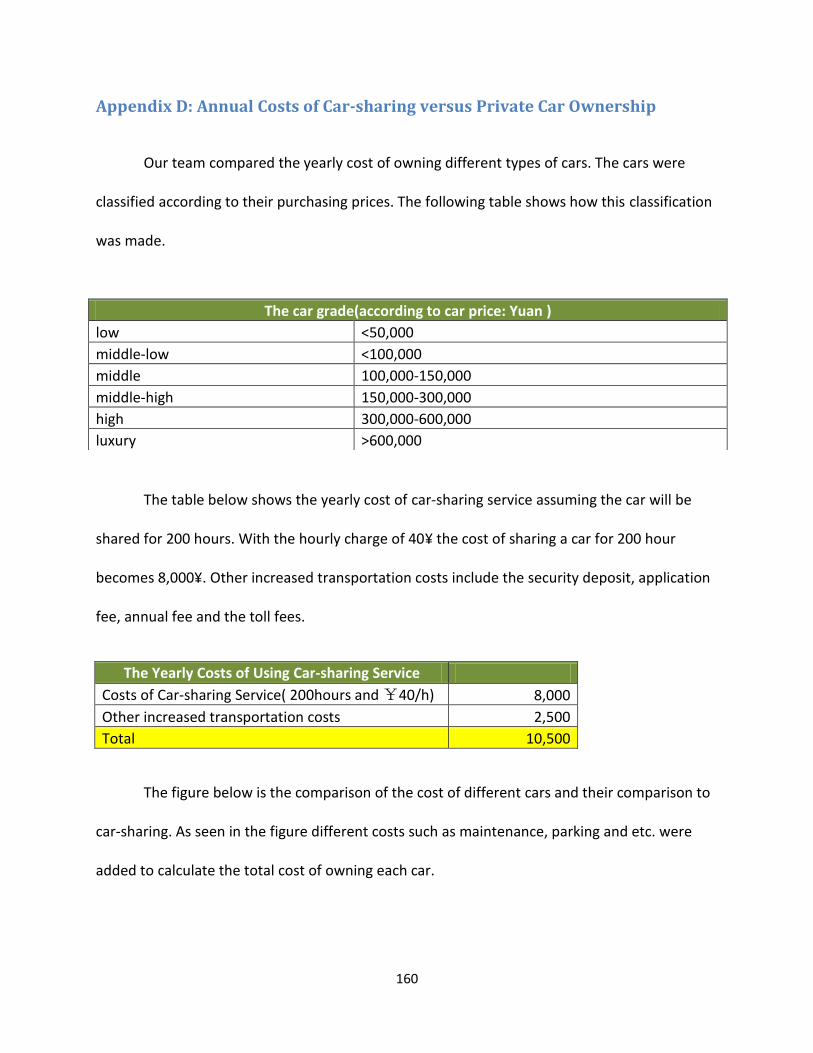
160
Appendix D: Annual Costs of Car-sharing versus Private Car Ownership
Our team compared the yearly cost of owning different types of cars. The cars were
classified according to their purchasing prices. The following table shows how this classification
was made.
The table below shows the yearly cost of car-sharing service assuming the car will be
shared for 200 hours. With the hourly charge of 40¥ the cost of sharing a car for 200 hour
becomes 8,000¥. Other increased transportation costs include the security deposit, application
fee, annual fee and the toll fees.
The Yearly Costs of Using Car-sharing Service
Costs of Car-sharing Service( 200hours and ¥40/h) 8,000
Other increased transportation costs 2,500
Total 10,500
The figure below is the comparison of the cost of different cars and their comparison to
car-sharing. As seen in the figure different costs such as maintenance, parking and etc. were
added to calculate the total cost of owning each car.
The car grade(according to car price: Yuan )
low <50,000
middle-low <100,000
middle 100,000-150,000
middle-high 150,000-300,000
high 300,000-600,000
luxury >600,000

161
These total costs were compared to the cost of car-sharing. These numbers were
calculated assuming the cars will be used for 200 hours per year. The cost saving of car-sharing
was calculated by the following formula:
Yearly Cost of Owning Private Car – Yearly Cost of Car-sharing
Our team also calculated the break even hour where the cost of owning a private car is
equal to car-sharing. This calculation was done through the following equation:
(Yearly Cost of Owning Private Car – Other Transportation Costs of Car-sharing) / Per Hour
Charge

162

163
Bibliography (n.d.). Retrieved from Cultural Dictionary: http://dictionary.reference.com/browse/air+pollution
(n.d.). Retrieved from U.S. Environmental Protection Agency: http://epa.gov/oar/oaqps/
(n.d.). Retrieved April 04, 2011, from Ecological Society of America:
http://www.esa.org/science_resources/issues/TextIssues/issue1.php
(n.d.). Retrieved April 10, 2011, from Alpha Online:
http://www.nutramed.com/environment/carsepa.htm
(n.d.). Retrieved May 31, 2011, from Waikato Regional Council:
http://www.waikatoregion.govt.nz/environmental-information/environmental-
indicators/Air/Air-quality/air1c-report/
(n.d.). Retrieved April 10, 2011, from Armstrong Monitoring: http://30139.vws.magma.ca/nitrogen-
dioxide-vehicle-exhaust-detection-equipment.html
(n.d.). Retrieved April 10, 2011, from Hamilton County Environmental Services:
http://www.hcdoes.org/airquality/Monitoring/CO.htm
(n.d.). Retrieved April 10, 2011, from MacroEvolution: http://www.macroevolution.net/air-pollution-
graphs.html
(n.d.). Retrieved from World Bank:
http://web.worldbank.org/WBSITE/EXTERNAL/COUNTRIES/EASTASIAPACIFICEXT/EXTEAPREGTO
PENVIRONMENT/0,,contentMDK:20266322~menuPK:537827~pagePK:34004173~piPK:3400370
7~theSitePK:502886,00.html
(n.d.). Retrieved April 10, 2011, from Espere: http://www.atmosphere.mpg.de/enid/23b.html
China Statistical Yearbook. (2004). Retrieved June 09, 2011, from
http://www.stats.gov.cn/english/statisticaldata/yearlydata/yb2004-e/indexeh.htm
(2005). Retrieved April 10, 2011, from Bereau of Air Quality:
http://www.maine.gov/dep/air/monitoring/carbonmonoxide.htm
City CarShare. (2005). Retrieved August 03, 2011, from Bringing Car-Sharing to your Community:
http://www.citycarshare.org/download/CCS_BCCtYC_Long.pdf
Houghton Mifflin Company. (2005). Retrieved 2011, from Cultural Dictionary:
http://dictionary.reference.com/browse/air+pollution
Transit Cooperative Research Program (TCRP). (2005, September). Retrieved August 03, 2011, from Car-
Sharing: How and Where to Succeed:
http://onlinepubs.trb.org/onlinepubs/tcrp/tcrp_rpt_108.pdf
164
(2006, June 06). Retrieved April 10, 2011, from PPRC:
http://www.pprc.org/hubs/subsection.cfm?hub=1008&subsec=10&nav=10&CFID=3182134&CF
TOKEN=95806902
Global Health Organization. (2006). Retrieved July 27, 2011, from
http://whqlibdoc.who.int/hq/2006/WHO_SDE_PHE_OEH_06.02_eng.pdf
Xinhua News Agency. (2006, August 06). Retrieved June 12, 2011, from
http://www.china.org.cn/english/2006/Aug/176872.htm
(2007, August 25). Retrieved March 29, 2011, from New York Times:
http://www.nytimes.com/2007/08/26/world/asia/26china.html
(2007, January 04). Retrieved April 10, 2011, from World Resources Institute:
http://earthtrends.wri.org/updates/node/135
(2007, June 12). Retrieved June 12, 2011, from China Daily: http://www.chinadaily.com.cn/china/2007-
06/12/content_891904.htm.
(2007). Retrieved 29 March, from New York Times :
http://www.nytimes.com/interactive/2007/08/26/world/asia/20070826_CHINA_GRAPHIC.html
#
China Cost of Pollution. (2007). Retrieved June 09, 2011, from The World Bank.
The World Bank. (2007, February). Retrieved June 08, 2011, from China Cost of Air Pollution:
http://siteresources.worldbank.org/INTEAPREGTOPENVIRONMENT/Resources/China_Cost_of_P
ollution.pdf
(2008, August 21). Retrieved April 04, 2011, from The Encyclopedia of Earth:
http://www.eoearth.org/article/Air_pollution_emissions?gclid=CKbtjv3NgagCFcJx5QodTCdCtA
(2008). Retrieved June 12, 2011, from
http://factsanddetails.com/china.php?itemid=392&catid=10&subcatid=66
(2008, July 17). Retrieved April 10, 2011, from Espere: http://www.atmosphere.mpg.de/enid/23b.html
(2009). Retrieved April 10, 2011, from Armstrong Monitoring: http://30139.vws.magma.ca/nitrogen-
dioxide-vehicle-exhaust-detection-equipment.html
(2010, November 04). Retrieved June 09, 2011, from Clean Biz : http://www.cleanbiz.asia/story/first-
report-china-vehicle-emissions-released
(2010, August). Retrieved April 10, 2011, from National Center for Biotechnology Information:
http://www.ncbi.nlm.nih.gov/pubmed/20716291
165
Green Boston. (2010, April). Retrieved July 28, 2011, from Sparking Boston's Climate Revolution:
http://www.cityofboston.gov/Images_Documents/BCA_full_rprt_r5_tcm3-19558.pdf
(2011, March 01). Retrieved April 10, 2011, from United Press International:
http://www.upi.com/Science_News/Resource-Wars/2011/03/01/Pollution-a-threat-to-Chinas-
growth/UPI-94781299004853/
(2011). Retrieved May 31, 2011, from Waikato Regional Council:
http://www.waikatoregion.govt.nz/environmental-information/environmental-
indicators/Air/Air-quality/air1c-report/
City of Boston. (2011). Retrieved July 28, 2011, from Green Business Awards:
http://www.cityofboston.gov/environmentalandenergy/greenawards/winners07.asp
City of Boston. (2011). Retrieved July 28, 2011, from
http://www.cityofboston.gov/transportation/modes.asp
City of Boston. (2011, April). Retrieved July 28, 2011, from A Climate of Progress:
http://www.cityofboston.gov/Images_Documents/A%20Climate%20of%20Progress%20-
%20CAP%20Update%202011_tcm3-25020.pdf
U.S. Environmental Protection Agency. (2011, March 23). Retrieved July 21, 2011, from
http://www.epa.gov/
Zipcar. (2011). Retrieved August 03, 2011, from Mission: http://www.zipcar.com/mission/
Zipcar. (2011). Retrieved August 03, 2011, from What is a Zipster: http://www.zipcar.com/is-it/zipster
American Lung Association. (n.d.). Retrieved from http://www.lungusa.org/associations/charters/mid-
atlantic/air-quality/outdoor-air-quality.html
Assurewu. (2011, August 3). 下城区_百度百科. Retrieved August 4, 2011, from 百度:
http://baike.baidu.com/view/706085.htm
assurewu. (2011, 8 3). 下城区_百度百科 . Retrieved 8 4, 2011, from 百度:
http://baike.baidu.com/view/706085.htm
Assurewu. (2011, July 10). 江干区_百度百科. Retrieved August 5, 2011, from 百度:
http://baike.baidu.com/view/581593.htm
Best. (2009, 7 15). 庆春广场 - 搜搜百科. Retrieved 8 5, 2011, from 搜搜:
http://baike.soso.com/v4292868.htm
Chainway. (2011, July).
Chase, K. J. (2011, 03 11). Another by-the-hour car renter rolls into Boston. Retrieved 04 01, 2011, from
Another by-the-hour car renter rolls into Boston:

166
http://www.boston.com/business/articles/2011/03/23/another_by_the_hour_car_renter_rolls
_into_boston/
ChinaAutoWeb. (2010, 09 05). How Many Cars are There in China? Retrieved 06 06, 2011, from
http://chinaautoweb.com/2010/09/how-many-cars-are-there-in-china/
ChinaAutoWeb. (2011, 03 02). Update: How Many Cars Are There in China? Retrieved 06 06, 2011, from
http://chinaautoweb.com/2011/03/update-how-many-cars-are-there-in-china/
Donkelaar, A. v. (2010, September 22). NASA. Retrieved April 10, 2011, from Map of air pollution graphs
dirty air worldwide: http://www.nasa.gov/topics/earth/features/health-sapping.html
eHi. (2011, 7 23). (Grop2, Interviewer)
E 都市. (2008, 8 29). 陵武大厦|杭州|建筑楼宇|黄页|E 都市. Retrieved 8 4, 2011, from E 都市:
http://hz.edushi.com/YP/OwnerDetail.aspx?ID=34795
e 都市. (2011). >杭州市地图|公交查询地图|旅游地图|三维地图|电子地图|E 都市. Retrieved 08 01,
2011, from e 都市:
http://hangzhou.edushi.com/?q=%u8427%u5C71%20%u65F6%u4EE3%u5E7F%u573A
e 都市. (2011). 杭州市地图|公交查询地图|旅游地图|三维地图|电子地图|E 都市. Retrieved 8 1,
2011, from e 都市: 杭州市地图|公交查询地图|旅游地图|三维地图|电子地图|E 都市
e 都市. (2011). 杭州市地图|公交查询地图|旅游地图|三维地图|电子地图|E 都市. Retrieved 08 01,
2011, from e 都市:
http://hangzhou.edushi.com/?q=%u8427%u5C71%20%u65F6%u4EE3%u5E7F%u573A
Fiebel, B. J. (2003). Investment Performance Measurement. New York.
Frei, F. X. (2005, 06 30). Zipcar: Influencing Customer Behaviour. Harvard Business School.
Goldman, S. (2008, 05). The North American Carsharing Industry Zipcar, Inc. and 3 Major Competitors.
Retrieved 04 03, 2011, from https://portfolio.du.edu/portfolio/getportfoliofile?fiuid=73397
Goodison, D. (2011, 03 31). Zipcar revs up to hit the street. Retrieved 04 01, 2011, from Zipcar revs up to
hit the street:
http://bostonherald.com/business/general/view.bg?articleid=1327324&position=0
Hangzhou Bureau of Statistics. (2011, 6 18). State-level Development zones. Retrieved 8 6, 2011, from
Statistical Information of Hangzhou:
http://www.hzstats.gov.cn/web/shownews.aspx?id=Y4mMozjDwXI=
Hayes, J. (2011, 04). AIR POLLUTION IN CHINA. Retrieved 07 11, 2011, from factsanddetails:
http://factsanddetails.com/china.php?itemid=392&catid=10&subcatid=66#3301
167
Hays, J. (2011, 04). AIR POLLUTION IN CHINA. Retrieved 07 11, 2011, from factsanddetails:
http://factsanddetails.com/china.php?itemid=392&catid=10&subcatid=66#3301
Information center of HEDA. (2011, 6 2). 杭州经济技术开发区门户网 杭州开发区 下沙开发区 经济开
发区 开发区. Retrieved 8 6, 2011, from Hangzhou Economic&technological Developemnt Zone:
http://www.heda.gov.cn/jpm/portal?action=infoDetailAction&eventSubmit_doInfodetail=doInf
odetail&id=8729
Jiong, G. (2008). The Impact of the Electric Car for Energy and Environment .
Li, X. (2011, 08 03). Car Salesman. (J. Papotto, Interviewer)
McNamara, M. (2006, October 26). CBS News. Retrieved June 06, 2011, from
http://www.cbsnews.com/stories/2006/10/26/fyi/main2126583.shtml
Min Chen, H. R.-C. (2010, 06). A Smart RFID System. IEEE International Workshop on Quality of Service.
South Korea.
Mull, C. (2011, May 11). Retrieved August 03, 2011, from Zip Car and Customer Loyalty:
http://mlcwideangle.exbdblogs.com/2011/05/11/zipcar-and-customer-loyalty/
Myra Hart, M. J. (2005, 05 09). Zipcar: Refining the Business Model. Harvard Business School.
Paster, X. Z. (2007, March 12). Retrieved June 12, 2011, from Sulfur Dioxide in China:
http://www.columbia.edu/~xzp1/Facts.html.
Pu, H. (2011, 08 03). Professor. (A. Humbaraci, Interviewer)
Qiyu, Z. (2010). Make a Chain of Electric Car .
Rachel Botsman, R. R. (2010, 10). Beyond Zipcar: Collaborative Consumption. Harvard Business School.
Rui, Z. (2010). Eletric Car and Life.
Shan Carter, A. C. (2007). Retrieved May 26, 2011, from
http://www.nytimes.com/interactive/2007/08/26/world/asia/20070826_CHINA_GRAPHIC.html
#
Sonotronics Website. (2010). Tracking Prouducts. Retrieved August 1, 2011, from Sonotronics:
http://www.sonotronics.com/?page_id=43
Tang, X. (2004). The Characteristics of Urban Air Pollution in China. Retrieved June 09, 2011, from The
National Academies Press: www.nap.edu/openbook.php
The GPS Guid Website. (2009, January 27th). GPS Basics - What is GPS? Retrieved August 1, 2011, from
The GPS Guid: http://thegpsguide.com/

168
Tian, H. (2003). Retrieved June 12, 2011, from CURRENT STATUS AND FUTURE TREND OF NITROGEN
OXIDES EMISSIONS IN CHINA:
http://www.anl.gov/PCS/acsfuel/preprint%20archive/Files/48_2_New%20York_10-03_0703.pdf
U.S.government. (2011, June 6). GPS Overview. Retrieved August 1, 2011, from Official U.S. Government
information about GPS: http://www.gps.gov/systems/gps/
Vitousek, P. M. (2007, August). Ecological Society of America. Retrieved April 04, 2011, from Ecological
Applications: http://www.esa.org/science_resources/issues/TextIssues/issue1.php
World Health Organization. (2008, 08). Air quality and health. Retrieved 04 05, 2011, from WHO:
http://www.who.int/mediacentre/factsheets/fs313/en/index.html
Yueqi, L. (2011, 08 04). Planning Director. (T. Hexin, Interviewer)
Zipcar, Inc. (n.d.). Car Sharing, an alternative to car rental and ownership - Zipcar. Retrieved 04 03, 2011,
from http://www.zipcar.com/
Zotye. (2011, 07). (T. Hexin, Interviewer)
与尔同轩. (2006, 10 18). 开一个公司要什么程序(要到那些部门登记)_百度知道 . Retrieved 8 3,
2011, from 百度知道: http://zhidao.baidu.com/question/14054687.html
中国工商银行. (2011, 7 7). 存贷利率-金融信息-中国工商银行中国网站. Retrieved 7 7, 2011, from
中国工商银行:
http://www.icbc.com.cn/ICBC/%e9%87%91%e8%9e%8d%e4%bf%a1%e6%81%af/%e5%ad%98%
e8%b4%b7%e6%ac%be%e5%88%a9%e7%8e%87%e8%a1%a8/%e4%ba%ba%e6%b0%91%e5%b8
%81%e5%ad%98%e6%ac%be%e5%88%a9%e7%8e%87%e8%a1%a8/
中国律师网. (2011, 4 30). 杭州五险一金 - 国律网. Retrieved 7 25, 2011, from 国律网:
http://www.chinalawyer.cc/zhishi/20100309030627_44968.html
住在杭州网. (2006, 8 30). 绿城·桂花城项目介绍--浙江在线-住在杭州. Retrieved 8 4, 2011, from 浙江
在线: http://zzhz.zjol.com.cn/05zzhz/system/2006/08/30/007841396.shtml
余丽丽、傅一览. (2010, 7 23). 江干区集聚新产业促转型升级 财政收入同比增 57.7%-转型升级,江干
区,新产业,财政,财政-浙江在线-浙商网. Retrieved 8 2, 2011, from 浙商网:
http://biz.zjol.com.cn/05biz/system/2010/07/23/016785819.shtml
拱墅区人民政府. (2011). “杭州·拱墅”门户网站——走进拱墅. Retrieved 08 01, 2011, from 拱墅区网
站:
http://www.gongshu.gov.cn/gongshucms/view/zjgs.jsp?siteunid=CEA370A5CBAB1D0539DEC81
C06CF723D&pid=58F5220594AE9A2C1D16DA826984C367&id=A869E082918EE4084478ACAE69
48DC94

169
易车网. (2011). 【朗逸】上海大众朗逸_朗逸报价_朗逸论坛_油耗-易车网. Retrieved 7 27, 2011,
from 易车网: http://car.bitauto.com/langyi/
杭州国家高新技术产业开发区管委会. (2011, 5 18). 杭州市滨江区 2010 年第六次全国人口普查主要
数据公报. Retrieved 8 4, 2011, from 杭州国家高新技术产业开发区:
http://www.hhtz.gov.cn/hhtz/DesktopDefault.aspx?TabID=5305a7c0-9139-44eb-ad68-
702073366f71&ID=1ac1c414-e1b8-47f4-9238-e04f406f12fc,5d3bf3c7-036d-4dfb-8bbb-
11cfd8984ea8,2011-5
杭州国家高新技术产业开发区管委会. (n.d.). 杭州国家高新技术产业开发区_走进滨江. Retrieved
August 4, 2011, from 杭州国家高新技术产业开发区:
http://www.hhtz.gov.cn/hhtz/DesktopDefault.aspx?tabid=8297157a-989f-4469-bef2-
b5aa1b2bd6f9
杭州大厦. (2008). 杭州大厦有限公司. Retrieved 8 5, 2011, from 杭州大厦官网:
http://www.hangzhou.com.cn/adv/hzwmw/hzds/
杭州宝葫芦电子商务有限公司. (2009, 2 7). 公司新闻. Retrieved 8 6, 2011, from 杭州宝葫芦电子商务
有限公司网站:
http://www.steelcbd.com/home/ehomedocs/resourceHtml/news/1233888865484.html
杭州高新技术产业开发区资产经营有限公司. (n.d.). 杭州高新技术产业开发区资产经营有限公司
(天堂软件园) - 大学生创业网. Retrieved 8 5, 2011, from 大学生创业网:
http://www.studentboss.com/yuanqu/yuanqujj.php?id=184
汽车之家. (2011, 6 22). 浙江二手标致 307|2006 年购买|行驶 8.50 万公里. Retrieved 8 2, 2011, from
汽车之家: http://2sc.autohome.com.cn/dealer/61228/136078.html
王瑛. (2010, 12 14). 杭州西湖区财政收入首破百亿 八年时间增长 9 倍-财政收入-浙江在线-浙商网.
Retrieved 8 5, 2011, from 浙商网:
http://biz.zjol.com.cn/05biz/system/2010/12/14/017161228.shtml
白衣童生. (2010, 7 10). 上半年财政收入西湖区跃居第一,江干区增幅第一 - 口水楼市 - 住在杭州网
-口水杭州论坛. Retrieved 8 5, 2011, from 口水杭州: http://zzhzbbs.zjol.com.cn/thread-
3363115-1-1.html
百度. (2010, 10 24). 中国四季青服装交易中心_百度百科. Retrieved 8 4, 2011, from 百度:
http://baike.baidu.com/view/4936136.htm
百度百科. (2011). >萧山_百度百科. Retrieved 08 01, 2011, from 百度百科:
http://baike.baidu.com/view/193141.htm
百度百科. (2011). 浙江大学玉泉校区_百度百科. Retrieved 08 01, 2011, from 百度百科:
http://baike.baidu.com/view/1455144daan

170
罗建. (2011). 西城广场调研. 杭州市.
赵明、王成. (2008, 4 30). 招商引资网. Retrieved 8 5, 2011, from 杭州招商引资网:
http://www.hzzsyz.com/NEWSDETIAL.asp?ID=2693
金静敏. (2010, 10). 一嗨租车连锁经营战略及实施策略研究. Retrieved 7 15, 2011, from 万方数据库:
http://d.g.wanfangdata.com.cn/Thesis_Y1846092.aspx
香港达泰投资咨询有限公司. (2011, 5). 杭州汽车共享项目建议书.