feasibility of sunflower oil cake degradation with three...
TRANSCRIPT
Feasibility of sunflower oil cake degradation with three different anaerobic consortia 1
2
3
4
5
6
7
8
9
10
11
12
13
14
15
16
17
18
19
20
21
22
23
BÁRBARA RINCÓN 1*; MARÍA DEL CARMEN PORTILLO 2; JUAN M. GONZÁLEZ 2;
VICTORIA FERNÁNDEZ-CEGRÍ 1; MARÍA ÁNGELES DE LA RUBIA 1 and RAFAEL BORJA1
1 Instituto de la Grasa, CSIC, Sevilla, Spain.
2 Instituto de Recursos Naturales y Agrobiología, CSIC, Sevilla, Spain.
ABSTRACT
Sunflower oil cake (SuOC) is the solid by-product from the sunflower oil extraction process and an
important pollutant waste because of its high organic content. For the anaerobic digestion of SuOC
three different industrial reactors were compared as inoculum sources. This was done using a
biochemical methane production (BMP) test. Inoculum I was a granular biomass from an industrial
reactor treating soft-drink wastewaters. Inoculum II was a flocculent biomass from a full-scale
reactor treating biosolids generated in an urban wastewater treatment plant. Inoculum III was a
granular biomass from an industrial reactor treating brewery wastes.
---------------------------------
*Address correspondence to Bárbara Rincón, Instituto de la Grasa (CSIC), Avda. Padre García
Tejero, 4, 41012-Sevilla, Spain; Phone: +34 95 4689654; Fax: +34 95 4691262; E-mail:
1
24
25
26
27
28
29
30
31
32
33
34
35
36
37
38
39
40
41
42
43
44
45
46
The highest kinetic constant for methane production was achieved using inoculum II. The inoculum
sources were analyzed through PCR amplification of 16S rRNA genes and fingerprinting before
(t=0) and after the BMP test (t=12 days). No significant differences were found in the bacterial
community fingerprints between the beginning and the end of the experiments. The bacterial and
archaeal communities of inoculum II were further analyzed. The main bacteria found in this
inoculum belongs to Alphaproteobacteria and Chloroflexi. Of the Archaea detected,
Methanomicrobiales and Methanosarcinales made up practically the whole archaeal community.
The results showed the importance of selecting an appropriate inoculum in short term processes due
to the fact that the major microbial constituents in the initial consortia remained stable throughout
anaerobic digestion.
Keywords: Sunflower oil cake, biochemical methane potential, microbial community, fingerprints,
methane yield, kinetics.
INTRODUCTION
Sunflower oil cake (SuOC) is the solid waste generated during the sunflower seed oil extraction
process. World sunflower seed production ranged between 29.1 and 31.1 million tonnes over the
last few seasons. [1] As a result, large quantities of SuOC are generated every year. In Spain alone,
between 4 and 5 million tonnes of this by-product are produced, giving rise to an important
environmental issue. [2] Current perspectives on how to obtain high value products from wastes
involve anaerobic digestion processes for biogas generation [(a mixture of methane and carbon
dioxide with a high energetic value (21.4 MJ per m3)]. These anaerobic processes are performed by
2
47
48
49
50
51
52
53
54
55
56
57
58
59
60
61
62
63
64
65
66
67
68
69
complex groups of microorganisms (Bacteria and Archaea) which coordinate the degradation of
organic matter. A relatively low percentage of these microorganisms present in anaerobic digestion
processes have been isolated. This lack of knowledge results sometimes in malfunctions and
unexplainable failures of biogas fermenters. For these reasons, it must be analyzed in more detail. [3]
Only a few studies have considered the potential influence of inoculum in anaerobic digestion
systems. Moreno-Andrade and Buitrón [4] studied the influence of five different inocula on an
anaerobic biodegradability test of two different substrates, one easily degradable (glucose) and the
other toxic (phenol). These authors emphasized the importance of using the appropriate inoculum to
obtain satisfactory results from anaerobic processes. After testing two different inocula, granular
and suspended, Pereira et al. [5] found granular inoculum to be the best option for the anaerobic
treatment of synthetic oleic acid-based effluent, since the methanogenic activity of the granular
inoculum was 2-7 times higher than that of the suspended biomass and was more resistant to long
chain fatty acid toxicity. Foster-Carneiro et al. [6] compared six different inoculum sources for the
anaerobic thermophilic digestion of the organic fraction of municipal solid wastes. Tabatabaei et al.
[7] studied the importance of the microbial community, focusing on the methanogenic archaea in the
anaerobic digestion of brewery wastewater, palm oil mill effluents, dairy wastes, cheese whey, dairy
wastewater, pulp and paper wastewaters and olive oil mill wastewaters with respect to their
dominant methanogenic population.
During the process of anaerobic digestion it is expected that the microbial communities adapt as a
consequence of the growth of microorganisms under the specific conditions of digestion and the
substrate treated. The dynamics of the acetoclastic methanogenic community have been evaluated
under the influence of different wastewater compositions and even under inhibitory conditions. [8, 9,
3

10] The microbial community structure has been studied under low temperature conditions and under
the influence of metal supplementation. [11, 12, 13] However, the transformations which occur in the
microbial communities during the anaerobic digestion of organic wastes and methane production
are still not fully understood.
70
71
72
73
74
75
76
77
78
79
80
81
82
83
84
85
86
87
88
89
90
91
92
It is clear that the efficiency of biogas production during the anaerobic digestion of organic residues
depends on the microorganisms involved in the process. The study of these microbial communities
represents an important step towards understanding and optimizing these anaerobic treatments.
Thus, the aim of this work was to study the influence of the inoculum type on the anaerobic
digestion of SuOC in terms of methane production. Microbial community fingerprints from the
initial inoculum source and after the biochemical methane potential test (BMP) were compared,
determining the major components of the communities involved in the process to achieve the best
methane production kinetics.
MATERIALS AND METHODS
Substrate
The substrate used in this study was SuOC. Prior to the experiments, a study of the different particle
sizes present in this solid waste was carried out by separation with a mechanical sieve. The most
abundant size found (29.4%) was 0.7-1.0 mm. Consequently, this size was used in the experiments.
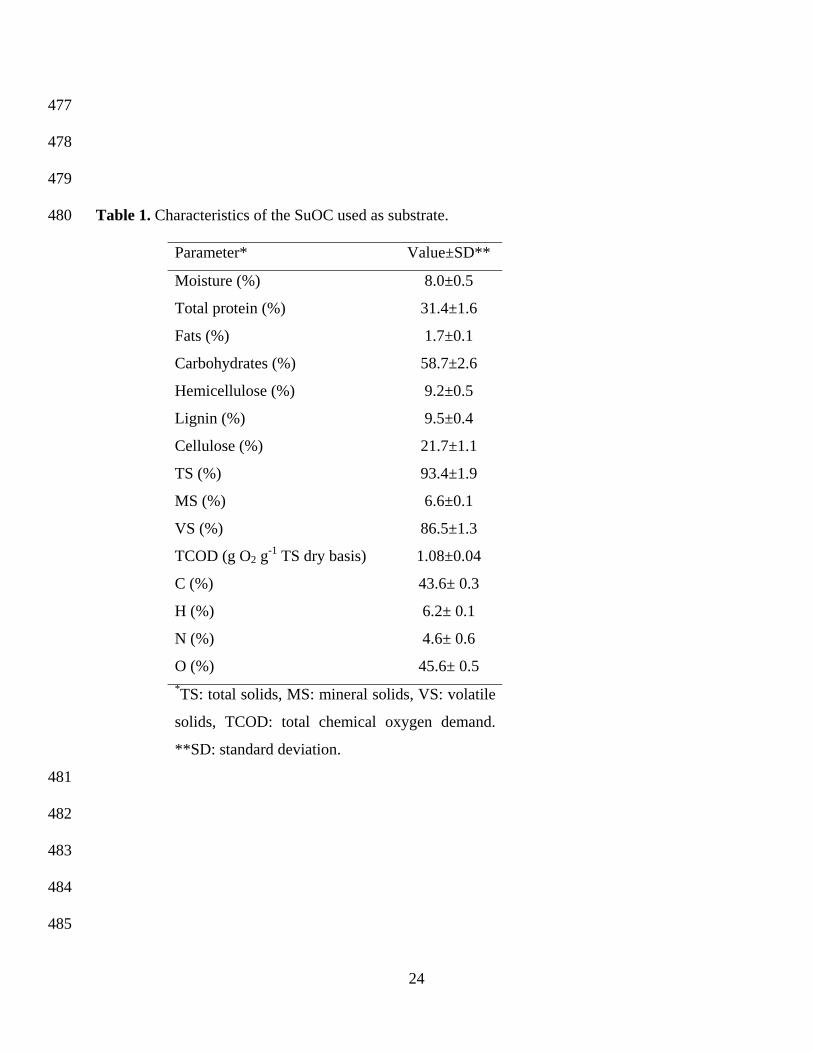
Table 1 shows the full composition and main features of the SuOC used in this study (mean values
are averages of four determinations).
4
93
94
95
96
97
98
99
100
101
102
103
104
105
106
107
108
109
110
111
112
113
114
Inocula
Three different inoculum sources were used: a) an anaerobic granular inoculum derived from a full-
scale upflow anaerobic sludge blanket (UASB) reactor treating wastewaters from a soft-drinks
industry (I); b) a flocculent anaerobic inoculum from a full-scale completely stirred tank reactor
(CSTR) treating biosolids from a conventional urban wastewater treatment plant (II); and c) an
anaerobic granular inoculum from a UASB reactor treating brewery wastes (III). Table 2 shows the
main characteristics of these three inocula. The experiments were carried out at an
inoculum:substrate ratio of 2:1. An inoculum concentration of 15 g VS L-1 was used for each
reactor.
Reactors and Operational Conditions
The experiments were carried out in a thermostatized water bath (35ºC) in batch mode. The reactors
were stirred at 250 rpm with a magnetic stirrer. The BMP test was run by triplicate. Two controls
without substrate were added in each run. A final working volume of 250 mL was used for each
treatment. Methane production was measured by a NaOH solution (3N) displacement (CO2
produced in the anaerobic process was kept in this sodium hydroxide solution).
Experimental Set up
5
115
116
117
118
119
120
121
122
123
124
125
126
127
128
129
130
131
132
133
134
135
136
The experiment was carried out by triplicate and two control reactors with no substrate added were
run for each different inoculum. The reactors were filled with 15 g VS L-1 of inoculum, the
corresponding quantity of SuOC to reach a ratio of 2:1 inoculum to substrate, 25 mL of a 50 g
NaHCO3 L-1 solution to keep pH stable, 50 mL of nutrient solution (Table 3) and distilled water to a
total volume of 250 mL. Methane production was measured for a period of 12 consecutive days.
Analytical Methods
Solids and moisture were determined according to the standard methods 2540B and 2540E. [14]
Total chemical oxygen demand was determined using the solid substrate open reflux method. [15]
Total protein was determined by multiplying the total Kjeldahl nitrogen (TKN) value by 6.25.[16]
Fat content was extracted by a soxhlet system using hexane (UNE-EN-ISO 659:2000). Cellulose,
hemicellulose and lignin were determined by the Goering and Van Soest method. [17]
The elemental composition of the SuOC (C, N, O and H) was measured using a Leco CHNS-932
(Leco Corporation, St Joseph, MI, EEUU) elemental analyzer. For particle size selection the
sunflower oil cake was sieved using a mechanical sieve (bio-meta, Retsch).
Methane Production Kinetics
A first-order kinetic model was used to estimate the specific rate constant according to Chen-
Hashimoto Equation 1: [18]
B=Bo [1-exp (-k t)] (1)
6

where: B is the methane yield (mL CH4 g-1 VS added), Bo is the ultimate or maximum methane
yield, asymptote to the production curve versus time, k (day-1) is the specific rate constant, and t is
the digestion time (days). Methane yield values (B) were calculated by subtracting methane
produced by the controls (inoculum only) from their corresponding treatment reactors. These
differences were divided by the VS of the substrate. [18] Bo and k were calculated from the
experimental data by non linear regression using Sigmaplot 9.0 (Systat Software. Inc., San Jose,
CA).
137
138
139
140
141
142
143
144
145
146
147
148
149
150
151
152
153
154
155
156
157
158
159
Molecular Characterization of Microbial Communities
Microbial communities, both Archaea and Bacteria, were studied by molecular fingerprinting
methods complemented with cloning and sequencing for the identification of the major components
of the bacterial and archaeal communities. DNA was extracted using the Nucleospin Food DNA
extraction kit (Macherey-Nagel, Düren, Germany) according to the manufacturer’s
recommendations. Fragments of the 16S ribosomal RNA (16S rRNA) genes from the Bacteria and
Archaea were amplified by PCR with different primer pairs. Fingerprints of the bacterial and
archaeal communities were obtained by Denaturing Gradient Gel Electrophoresis (DGGE)
following the method described by Muyzer et al. [19] DNA was directly amplified by PCR using the
primer pair 341F-GC (5’-CCT ACG GGA GGC AGC AG with a GC-rich tail attached to its 5’ end)
[19] and 518R for the Bacteria and the primer pair 344F-GC (5’- with a GC-rich tail attached to its 5’
end) and 518R for the Archaea. Relative quantification of molecular fingerprints from pairs of
community profiles was performed following the quantitative procedure described by Portillo and
Gonzalez. [20] Gels obtained by DGGE were digitalized using Kodak 1D image analysis software
7
160
161
162
163
164
165
166
167
168
169
170
171
172
173
174
175
176
177
178
179
180
181
182
(Kodak, New Haven, CT). The images were analyzed using the tnimage program
(http://entropy.brneurosci.org/tnimage.html) applying its densitometry function. Comparisons
between community fingerprints were carried out as described by Portillo and Gonzalez [20]
calculating a Cramér-von Mises-type statistic through a Monte-Carlo test procedure to determine
the significance of differences between microbial communities.
PCR products for 16S rRNA gene library construction were obtained with the primer pair 27F (5’-
AGA GTT TGA TYM TGG CTC) and 907R (5’-CCC CGT CAA TTC ATT TGA GTT T) for the
Bacteria [21] and the pair 20bF (5’-YTC CSG TTG ATC CYG CSR GA) and 1492bR (5’-GGY TAC
CTT GTK WCG ACT T) for the Archaea. [22] These PCR products were purified with the PCR
purification kit (JetQuick, Germany) and cloned using a TOPO-TA cloning kit (Invitrogen,
Carlsbad, USA). The 16S rRNA libraries obtained were used to identify the major components of
the bacterial and archaeal communities. A screening procedure based on the discrimination of
clones using PCR-DGGE previously described by Gonzalez et al. [23] was applied to these libraries
to identify the major DNA bands observed in DGGE analyses.
Sequence data were edited using Chromas software, version 1.45 (Technelysium, Tewantin,
Australia). Homology searches from the nucleic acid sequences were performed using the Blast
algorithm [24] at the NCBI (National Center for Biotechnology Information;
http://www.ncbi.nlm.nih.gov/Blast/). Sequences were inspected for the presence of chimeras using
the Ccode program as described by Gonzalez et al. [25]
RESULTS AND DISCUSSION
8

183
184
185
186
187
188
189
190
191
192
193
194
195
196
197
198
199
200
201
202
203
204
205
The volumes of methane (at standard temperature and pressure) obtained after 12 days of the BMP
test for inocula II and III were higher than that obtained for inoculum I (293, 360 and 387 mL CH4
for inocula I, II and III, respectively). Methane production for inoculum III was 7.5% higher than
for inoculum II and 31.1% higher than for inoculum I. The experimental methane yields per gram of
VS added (B) are shown in Figure 1. The best B values after 12 days were obtained for inocula II
and III (193 and 205 mL CH4 accumulated g-1 VS added, respectively), these yields being higher
than that obtained for inoculum I (156 mL CH4 accumulated g-1 VS added). The value of the
methane yield for inoculum III was 6.2% higher than for inoculum II, which in turn was 23.7%
higher than the value for inoculum I. The yield for inoculum III was 31.4% higher than for
inoculum I. Therefore, inocula II and III had similar methane yields and were both higher than for
inoculum I.
The percentage of volatile solids removed was 42% for inocula II and III and only 33% for
inoculum I. Inocula II and III from industrial reactors treating solid substrates showed better results
than inoculum I from wastewater treatment. This could be attributed to the higher
hydrolytic/enzymatic capacity of these inoculum sources which are used to break biosolids in urban
wastewater treatment plants (inoculum II) and to treat brewery wastes (inoculum III).
The cellulose, lignin and hemicellulose structure of SuOC is complex. Cellulose is a polymer with
low microbial degradability and is considered the rate-limiting substrate in the anaerobic digestion
of solid wastes. [26] In a comparative study for cellulose solubilisation in anaerobic reactors,
O’Sullivan et al [27] showed how differences in reactor configuration and operational conditions had
no significant impact on the solubilisation rate of cellulose, whereas the difference in composition
9

206
207
208
209
210
211
212
213
214
215
216
217
218
219
220
221
222
223
224
225
226
227
228
of the microbial communities showed a marked effect. This could be the reason why inoculum I,
which had thus far been used to treat wastewaters, had given the worst results as regards methane
production and kinetics for SuOC treatment. These findings should be studied in more detail.
The first-order kinetic model used to estimate the specific rate constants fit satisfactorily to the
obtained experimental data (with R2 values higher that 0.965; Fig. 1). The values obtained for k
were 0.11±0.02, 0.37±0.01 and 0.34±0.01 days-1 for inocula I, II and III, respectively (Table 4).
Therefore, the specific rate constant for inoculum II was 8.8% higher than that achieved for
inoculum III and 236.4% higher than that obtained for inoculum I.
Figures 2 and 3 show the molecular fingerprints obtained by PCR-DGGE and represent the major
components of the bacterial (Fig. 2) and archaeal (Fig. 3) communities from the different inoculum
sources (I, II and III) used during this study. For inoculum II, the taxonomic affiliation and the
accession numbers of the closest homologue for the major components of the bacterial and archaeal
communities are given in Tables 5 and 6, respectively. Comparisons of fingerprints from the
bacterial and archaeal communities for the three inoculum sources used in this study (Figs. 2 [A, C
and E] and 3 [G, I and K]) showed distinctive banding patterns which would indicate distinct
microbial communities among the three inocula, depending on their source.
Maximum methane production was reached after nine days for inocula II and III and after twelve
days for inoculum I. After 12 days’ digestion time, the bacterial communities (Fig. 2 [B, D and F])
established in the anaerobic digestion process of the SuOC, showed similar fingerprinting profiles
to those of the bacterial communities in their respective inocula (Fig. 2 [A, C and E]) before the
anaerobic process. Statistical comparison of fingerprints from the initially inoculated communities
10
229
230
231
232
233
234
235
236
237
238
239
240
241
242
243
244
245
246
247
248
249
250
251
and the final communities after the BMP test showed no significant differences (Table 7) in the
bacterial communities from the different inoculum sources used in this study.
After the anaerobic digestion process of sunflower oil cake (Table 7), no significant differences
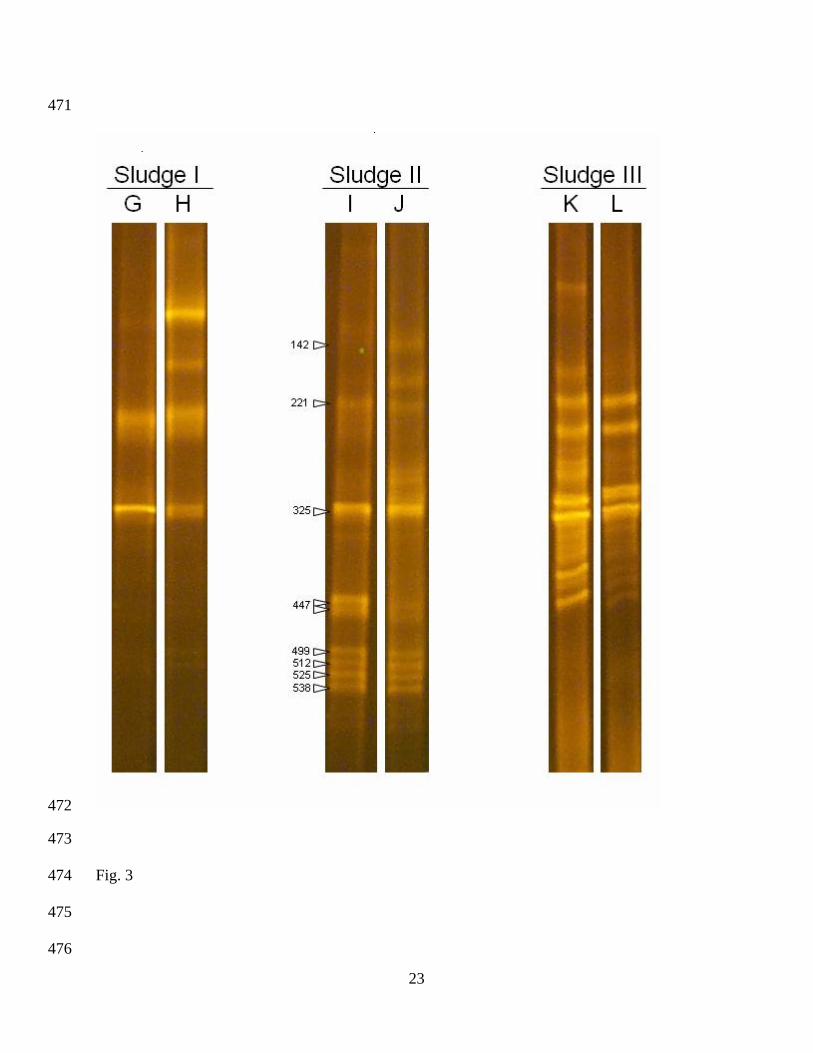
were found in the archaeal community fingerprints between the initial inoculum (Fig. 3 [I and K])
and inocula II and III (Fig. 3 [J and L]). However, significant differences were observed between
the initial inoculum (Fig. 3 [G]) and the archaeal community developed (Fig. 3 [H]) in inoculum I.
Despite this change in the structure of the archaeal communities in inoculum I, the major archaeal
components remained as important members of the final (after the anaerobic digestion process)
communities. Changes observed in specific archaeal phylotypes in inoculum I could be the cause of
a reduced performance of the process when compared to the evolution of inocula II and III which
were maintained during anaerobic digestion.
The bacterial and archaeal communities from inoculum II where the inoculum showed optimum
methane kinetic parameters, was studied in further detail to identify the major components of the
communities implicated in the anaerobic digestion and methane production. Table 5 shows the
proportion of the major bacterial constituents of the community in inoculum II. Alphaproteobacteria
(20.6% and 28.8% of the total identified DNA in the inoculum and after anaerobic digestion,
respectively), within the Rhodobacteraceae Family (e.g., Paracoccus), and Chloroflexi (22.6% and
23.4% of the total bacteria in the inoculum and in the community developed after anaerobic
treatment, respectively) were the dominant bacterial groups. Proteobacteria, identified through
members of the Alphaproteobacteria, Betaproteobacteria and Gammaproteobacteria, represented up
to 40.7% and 35% of the identified bacteria in the inoculum and in the anaerobic digester,
11

252
253
254
255
256
257
258
259
260
261
262
263
264
265
266
267
268
269
270
271
272
273
respectively. Other major bacterial groups identified in the community were Bacteroidetes (between
9.0% and 21.7% of identified bacterial phylotypes), Firmicutes (over 11%; e.g.,
Thermoanaerobacterium), Actinobacteria (3.4% to 2.5%), Synergistetes (e.g., Synergistes) (above
2%), and Candidate Division WS6 (between 3.0% and 5.7% of the identified phylotypes).
The major bacterial components constituting the community of the anaerobic digestion process of
sunflower oil cake coincide with the bacterial groups present in communities reported for other
wastes. [22, 28] Proteobacteria, Chloroflexi and Firmicutes have been reported as major components
in bacterial communities during the anaerobic digestion processes of organic wastes. [22, 29, 30]
Chloroflexi has recently been shown as a highly significant component in the transformation of
complex substrates such as olive residues from oil production and this bacterial phylum is being
increasingly recognized for its importance in anaerobic systems. [22, 29-31] In these communities,
numerous phyla which are not well-known, such as the Bacteroidetes, Synergistetes and the
Candidate Division WS6, were detected. At present, there is limited knowledge about the
metabolism of these phyla and they are generally detected only by their 16S rRNA gene sequences.
Furthermore, there is little or no availability of representative cultivated microorganisms belonging
to these bacterial phyla, which indicates that there is a significant portion of the bacterial
community in need of further physiological research. The importance of Synergistetes, for instance,
in anaerobic treatments has been highlighted in recent studies [32-33], as has the presence of
Candidate Division WS6 in anaerobic waste treatments and its relationship to methanogenic
Archaea. [34]
12
274
275
276
277
278
279
280
281
282
283
284
285
286
287
288
289
290
291
292
293
294
295
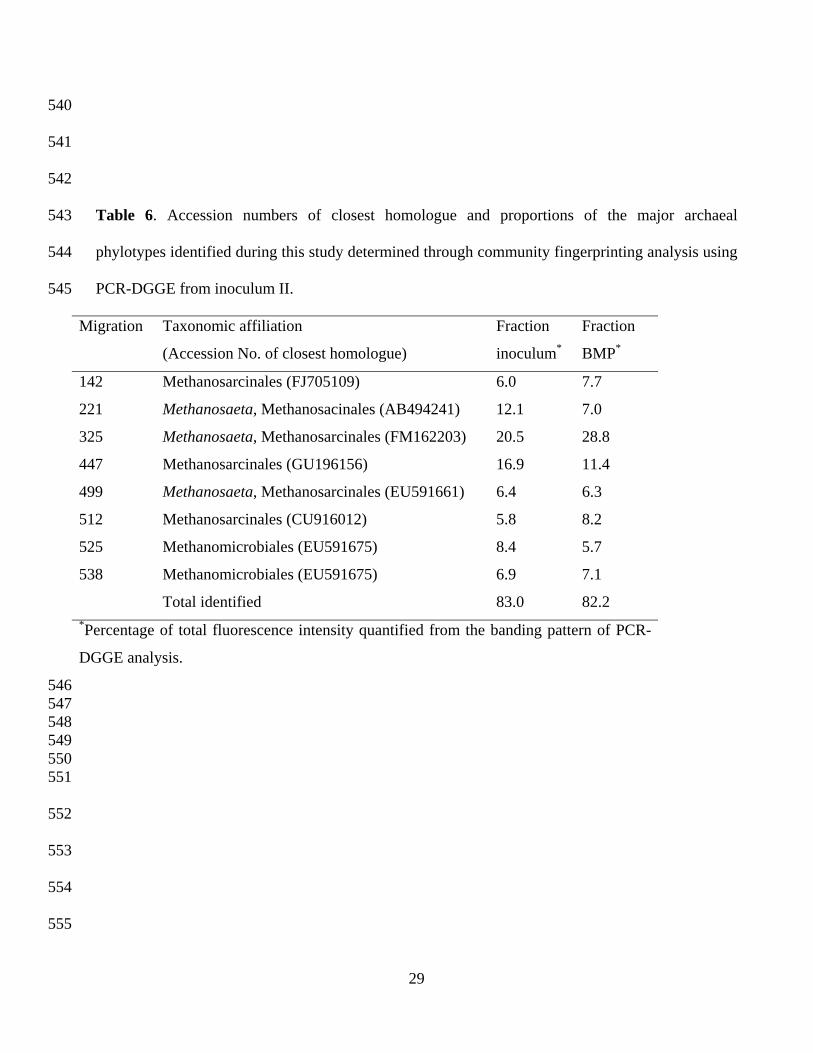
296
Archaea are the microorganisms responsible for the production of methane. The archaeal
communities represented by methanogenic groups constituted a critical component of the
prokaryotic communities leading to methane production. Table 6 shows the proportion of the major
archaeal phylotypes in inoculum II. The detected sequences from the archaeal community all
corresponded to methane-producing Archaea. Different archaeal phylotypes were detected in the
anaerobic digestion process of sunflower oil cake and belonged to the Methanosarcinales and
Methanomicrobiales orders. The Methanosarcinales, mainly represented by different phylotypes
belonging to the genus Methanosaeta, were the dominant methanogens, constituting over 67% of
the archaeal community.
A dominance of the methanogens Methanosarcinales and Methanomicrobiales has been previously
reported as indicators of well-established methane-producing anaerobic digestion processes. [22, 35, 36]
These methanogens are acetoclastic methane producers and confirm the importance of this pathway
in methanogenesis, as seen during the digestion of SuOC. As a consequence, a direct interaction
between bacteria and archaea is envisioned, the main role of the bacterial community during this
anaerobic process appeared to be the production of acetate from the polymers constituting the
SuOC. This acetate is the major substrate which is directly utilized by the methanogenic archaea as
the source for methane production.
CONCLUSIONS
The results obtained during this study underline the importance of using productive and active
inoculum sources to initiate anaerobic digestion processes of sunflower oil cake wastes. Microbial
13

297
298
299
300
301
302
303
304
305
306
307
308
309
310
311
312
313
314
315
316
317
318
communities showed no changes during short term experiments (12 days). Obtaining the highest
possible SuOC treatment efficiencies is a consequence of the conservation of the major components
of well-established bacterial and archaeal communities during the digestion treatments. Only when
an optimal inoculum is used can methane production and degradation of the processed substrate
(i.e., SuOC) be maximized. A loss or reduction in specific phylotypes during the anaerobic
treatments can be reflected by a diminishing efficiency both in methane production and organic load
degradation.
ACKNOWLEDGEMENTS
The authors wish to express their gratitude to “Junta de Andalucía” (“Plan Andaluz de
Investigación”) for the financial support to groups BIO288 and AGR204, to the Spanish Ministry of
“Ciencia and Innovación” (Project reference CTM2008-05772/ TECNO) and to the contracts JAE-
Doc from “Junta para la Ampliación de Estudios del CSIC” co-financed by European Social Funds.
The authors thank Dr. Fernando G. Fermoso for his valuable discussions during the preparation of
the manuscript.
REFERENCES
[1] FAO, 2010. Food outlook, Global market Analysis, June 2010.
[2] Bautista, J.; Parrado, J.; Machado, A. Composition and fractionation of sunflower meal: use of
the lignocellulosic fraction as substrate in solid-state fermentation. Biol. Wastes 1990, 32, 225-
233.
14
319
320
321
322
323
324
325
326
327
328
329
330
331
332
333
334
335
336
337
338
339
340
341
[3] Weiland, P. Biogas production: current state and perspectives. Appl. Microbiol. Biotechnol.
2010, 85, 849-860.
[4] Moreno-Andrade, I.; Buitrón, G. Influence of the origin of the inoculum on the anaerobic
biodegradability test. Water Sci. Technol. 2004, 49, 53-59.
[5] Pereira, M.A.; Mota, M.; Alves, M.M. Operation of an anaerobic filter and an EGSB reactor for
the treatment of an oleic acid-based effluent: influence of inoculum quality. Process Biochem.
2002, 37, 1025-1031.
[6] Foster-Carneiro, T.; Pérez, M.; Romero, L.I.; Sales, D. Dry-thermophilic anaerobic digestion of
organic fraction of the municipal solid waste: focusing on the inoculum sources. Bioresour.
Technol. 2007, 98, 3195-3203.
[7] Tabatabaei, M.; Rahim, R.A.; Abdullah, N.; Wright, A.G.; Shirai, Y.; Sakai, K., Sulaiman, A.;
Hassan, M.A. Importance of the methanogenic archaea populations in anaerobic wastewater
treatments. Process Biochem. 2010, 45, 1214-1225.
[8] Oz, N.A; Ince, O.; Kasapgil, I. Effect of wastewater composition on methanogenic activity in an
anaerobic reactor. J. Environ. Sci. Health A. 2005, 39 (11&12), 2941-2953.
[9] Oz, N.A.; Ince, O.; Kasapgil, I.; Akarsubaso, A.T.; Eyice, O. Microbial population dynamics in
an anaerobic CSTR treating a Chemical Synthesis-based pharmaceutical wastewater. J. Environ.
Sci. Health A. 2003, 38 (10), 2029-2042.
[10] Ince, O. ; Kolukirik, M.; Cetecioglu, Z.; Eyice, O.; Inceoglu, O.; Ince, B. Toluene inhibition on
an anaerobic reactor sludge in terms of potential activity and composition of acetoclastic
methanogens. J. Environ. Sci. Health A. 2009, 14, 1551-1556.
[11] Tsushima, I.; Yoochatchaval, W.; Yoshida, H.H.; Araki, N.; Syutsubo, K. Microbial
community structure and population dynamics of granules developed in expanded granular
15
342
343
344
345
346
347
348
349
350
351
352
353
354
355
356
357
358
359
360
361
362
363
sludge bed (EGSB) reactors for the anaerobic treatment of low-strength wastewater at low
temperature. J. Environ. Sci. Health A. 2010, 45, 754-766.
[12] Yoochatchaval, W.; Tsushima, I.; Ohashi, A.; Harada, H.; Yamaguchi, T.; Araki, N.; Syutsubo,
K. Changes in process performance and microbial characteristics of retained sludge during low-
temperatures operation of an EGSB reactor. J. Environ. Sci. Health A. 2008, 43, 1650-1656.
[13] Milan, Z; Montalvo, S.; Ruiz-Tagle, N.; Urrutia, H.; Chamy, R.; Sanchez, E.; Borja.R.
Influence of heavy metal suplementation on specific methanogenic activity and microbiol
communities detected in batch anaerobic digesters. J. Environ. Sci. Health A. 2010, 45, 1307-
1314.
[14] APHA (American Public Health Association), AWWA (American Water Works Association,
WPCF (Water Pollution Control Federation), 1989. Standards Methods for the Examination of
Water and Wastewater. 17 th ed. APHA, Washington, DC, USA.
[15] Raposo, F.; de la Rubia, M.A.; Borja, R.; Alaiz, M. Assessment of a modified and optimised
method for determining chemical oxygen demand of solid substrates and solutions with high
suspended solid content. Talanta 2008, 76, 448-453.
[16] Allen, S.E. Chemical analysis of ecological materials. Allen, S.E., Ed.; Blackwell Scientific:
Oxford, 1974.
[17] Goering, H.K.; Van Soest, P.J. Forage fiber analyses (apparatus, reagents, procedures and
some applications). Agricultural Handbook, no. 379, U.S. Agricultural Research Service:
Washington, D.C. 1970.
[18] Chen, T.H.; Hashimoto, A.G. Effects of pH and substrate: inoculum ratio on batch methane
fermentation. Bioresour. Technol. 1996, 56, 179-186.
16
364
365
366
367
368
369
370
371
372
373
374
375
376
377
378
379
380
381
382
383
384
[19] Muyzer, G., de Waal, EC., Uitterlinden, A.G. Profiling of complex microbial populations by
denaturing gradient gel electrophoresis analysis of polymerase chain reaction-amplified genes
coding for 16S rRNA. Appl. Environ. Microbiol. 1993, 5, 695-700.
[20] Portillo, M.C.; Gonzalez, J.M. Statistical differences between molecular fingerprints from
microbial communities. Antonie van Leeuwenhoek 2008, 94, 157-163.
[21] Portillo, M.C.; Sririn, V.; Kanoksilapatham, W.; Gonzalez, J.M. Differential microbial
communities in hot spring mats from Western Thailand. Extremophiles 2009, 13, 321-331.
[22] Rincón, B.; Borja, R.; González, J.M.; Portillo, M.C.; Saiz-Jiménez, C. Influence of organic
loading rate and hydraulic retention time on the performance, stability and microbial
communities of one-stage anaerobic digestion of two-phase olive mill solid residue. Biochem.
Eng. J. 2008, 40,253-261.
[23] Gonzalez, J.M.; Ortiz-Martinez, A.; Gonzalez-del Valle, M.A.; Laiz, L.; Saiz-Jimenez, C. An
efficient strategy for screening large cloned libraries of amplified 16S rDNA sequences from
complex environmental communities. J. Microbiol. Meth. 2003, 55, 459-463.
[24] Altschul, S.F.; Gish, W.; Miller, W.; Myers, E.W.; Lipman, D.J. Basic local alignment search
tool. J. Mol. Biol. 1990, 215, 403-410.
[25] Gonzalez, J.M.; Zimmermann, J.; Saiz-Jimenez, C. Evaluating putative chimeric sequences
from PCR amplified products and other cross-over events. Bioinformatics 2005, 21, 333-337.
[26] Noike, T.; Endo, G.; Chang, J.E.; Yagucji, J.I.; Matsumoto, J.I. Characteristics of carbohydrate
degradation and the rate limiting step in anaerobic digestion. Biotechnol. Bioeng. 1985, 27,
1482-1489.
17

385
386
387
388
389
390
391
392
393
394
395
396
397
398
399
400
401
402
403
404
405
406
407
[27] O’Sullivan, C.A.; Burrell, P.C.; Clarke, W.P.; Blackall, L.L. Comparison of cellulose
solubilisation rates in rumen and landfill leachate inoculated reactors. Bioresour. Technol. 2006,
97, 2356-2363.
[28] McMahon, K.D.; Stroot, P.G.; Mackie, R.I.; Raskin, L. Anaerobic codigestion of municipal
solid waste and biosolids under various mixing conditions—II: Microbial population dynamics.
Water Res. 2001, 35, 1817–1827.
[29] Kragelund, C.; Levantesi, C.; Borger, A.; Thelen, K.; Eikelboom, D.; Tandoi, V.; Kong, Y.;
van der Waarde, J.; Krooneman, J.; Rossetti, S.; Thomsen, T.R.; Nielsen, P.H. Identity,
abundance and ecophysiology of filamentous Chloroflexi species present in activated sludge
treatment plants. FEMS Microbiol. Ecol. 2007, 59, 671-682.
[30] Miura, Y.; Watanabe, Y.; Okabe, S. Significance of Chloroflexi in performance of submerged
membrane bioreactors (MBR) treating municipal wastewater. Environ. Sci. Technol. 2007, 41,
7787-7794.
[31] Levén, L.; Eriksson, A.R.B.; Schnürer, A. Effect of temperature on bacterial and archaeal
communities in two methanogenic bioreactors treating organic household waste. FEMS
Microbiol. Ecol. 2007, 59, 683-693.
[32] Hugenholtz, P.; Hooper, S.D.; Kyrpides, N.C. Focus: Synergistetes. Environ. Microbiol. 2009,
11, 1327-1329.
[33] Marchandin, H.; Damay, A.; Roudière, L.; Teyssier, C.; Zorgnitti, I.; Dechaud, H.; Jean-Pierre,
H.; Jumas-Bilak, E. Phylogeny, diversity and host specialization in the phylum Synergistetes
with emphasis on strains and clones of human origin. Res. Microbiol. 2010, 161, 91-100.
[34] Guermazi, S.; Daegelen, P.; Dauga, C.; Rivière, D.; Bouchez, T.; Godon, J.J.; Gyapar, G.;
Sghir, A.; Pelletier, E.; Weissenbach, J.; Le Paslier, D. Discovery and characterization of a new
18
408
409
410
411
412
413
414
415
416
417
418
419
420
421
422
423
424
425
426
427
428
429
430
bacterial candidate division by an anaerobic sludge digester metanogenomic approach. Environ.
Microbiol. 2008, 10, 2111-2123.
[35] Akarsubasi, A.T.; Ince, O.; Nilgun, A.O.; Kirdar, B.; Ince, B.K. Evaluation of performance,
acetoclastic methanogenic activity and archaeal composition of full-scale UASB reactors
treating alcohol distillery wastewaters. Process Biochem. 2006, 41, 28-35.
[36] Vavilin, V.A.; Qu, X.; Mazéas, L.; Lemunier, M.; Duquennoi, C.; He, P.; Bouchez, T.
Methanosarcina as the dominant aceticlastic methanogens during mesophilic anaerobic
digestion of putrescible waste. Antonie van Leeuwenhoek 2008, 94, 593-605.
19

431
432
433
434
435
436
437
438
439
440
441
442
443
444
445
446
447
448
449
450
451
452
453
FIGURE CAPTIONS
Figure 1. Variation of the volume of methane produced per gram of VS added over time for inocula
I, II and III.
Figure 2. Bacterial community fingerprints obtained by PCR-DGGE: (A, C, E) for the three
different inoculum sources used for the initial inoculation of reactors and (B, D, F) after the BMP
tests at the end of the anaerobic SuOC treatments.
Figure 3. Archaeal community fingerprints obtained by PCR-DGGE: (G, I, K) for the three
different inoculum sources used for the initial inoculation of reactors and (H, J, L) after the BMP
tests at the end of the anaerobic SuOC treatments.
20

454
455
456
Time (days)
0 2 4 6 8 10 12 14
B (
mL
CH
4 S
TP
g-1
VS
ad
ded
)
0
50
100
150
200
250
Sludge I Sludge I regressionSludge II Sludge IIregressionSludge IIISludge IIIregression
457
458
459
460
461
462
463
464
465
466
467
Fig. 1
21

468
469
470 Fig. 2
22
471
472
473
474
475
476
Fig. 3
23
477
478
479
480
Table 1. Characteristics of the SuOC used as substrate.
Parameter* Value±SD**
Moisture (%) 8.0±0.5
Total protein (%) 31.4±1.6
Fats (%) 1.7±0.1
Carbohydrates (%) 58.7±2.6
Hemicellulose (%) 9.2±0.5
Lignin (%) 9.5±0.4
Cellulose (%) 21.7±1.1
TS (%) 93.4±1.9
MS (%) 6.6±0.1
VS (%) 86.5±1.3
TCOD (g O2 g-1 TS dry basis) 1.08±0.04
C (%) 43.6± 0.3
H (%) 6.2± 0.1
N (%) 4.6± 0.6
O (%) 45.6± 0.5 *TS: total solids, MS: mineral solids, VS: volatile
solids, TCOD: total chemical oxygen demand.
**SD: standard deviation.
481
482
483
484
485
24

486
487
488
489
Table 2. Characteristics and origin of the inoculum sources used in the experiments.
Sludge Source Reactor volume pH TS VS
(Reactor type) (m3) (g L-1) (g L-1)
I UASB 450 7.4 30 25
II CSTR 2000 7.6 43 20
III UASB 550 7.5 83 47
TS: total solids; VS: volatile solids; UASB: upflow anaerobic sludge blanket; CSTR:
continuously stirred tank reactor.
490
491
492
493
494
495
496
497
498
499
500
501
502
503
25

504
505
506
507
Table 3. Composition of the nutrient and trace element solutions used.
Nutrient solution composition Concentration
(g L-1)
NH4Cl 1.4
K2HPO4 1.25
MgSO4 H2O 0.5
CaCl2 2H2O 0.05
Yeast extract 0.5
Trace element solution 5.0a
Trace element solution composition Concentration
(mg L-1)
FeCl34H
2O 2000
CoCl2·6H
2O 2000
MnCl2 4H2O 500
CuCl2 2H2O 38
ZnCl2 50
H3BO
3 50
(NH4)
6Mo
7O
24·4H
2O 50
AlCl3 6H2O 90
Units for the trace element solution added to the nutrient solution are in mL of trace solution per L of nutrient solution (mL L-1).
508
509
510
511
26

512
513
514
515
516
Table 4. Values of Bo and k obtained using the Chen-Hashimoto equation for the three sludges
studied and their variation coefficients.
Sludge R2 B0 ± SD k ± SD VCB0 VCk
(mL CH4 g-1 SV added) (days-1) (%) (%)
I 0.9648 172 ± 27 0.11 ± 0.02 15.5% 25.4%
II 0.9985 196 ± 1 0.37 ± 0.01 0.6% 2.1%
III 0.9964 214 ± 2 0.34 ± 0.01 1.1% 3.6%
SD: standard deviation; VC: variation coefficient
517
518 519 520
521
522
523
524
525
526
527
528
529
530
531
27
532
533
534
535
536
537
Table 5. Accession numbers of closest homologue and proportions of the major bacterial
phylotypes identified during this study determined through community fingerprinting analysis using
PCR-DGGE from inoculum II.
Migration Taxonomic affiliation
(Accession No. of closest homologue)
Fraction
inoculum*
Fraction
BMP*
139 Chloroflexi (CU926181) 3.4 3.8
215 Betaproteobacteria (GU454925) 1.9 0.8
248 Candidate Division WS6 (AF423183) 3.4 1.6
280 Chloroflexi (EF174275) 3.0 2.7
314 Chloroflexi (CU924314) 6.6 5.9
325 Actinobacteria (AY426438) 2.0 1.3
335 Alphaproteobacteria (AJ440751) 1.2 3.8
351 Alphaproteobacteria (GQ500763) 5.3 6.7
392 Thauera, Betaproteobacteria (DQ098974) 5.6 1.0
428 Bacteroidetes (CU922674) 2.7 6.1
460 Paracoccus, Alphaproteobacteria (FJ386516) 5.7 4.8
472 Chromatiales, Gammaproteobacteria (AM176837) 4.4 1.5
492 Thermoanaerobacteriales, Firmicutes (EU878332) 2.1 2.5
524 Synergistes, Synergistetes (FN436049) 2.4 1.4
544 Firmicutes (CU919983) 6.9 3.8
559 Bacteroidetes (AB330856) 2.6 5.4
Total identified 59.2 53.1
*Percentage of total fluorescence intensity quantified from the banding pattern of PCR-
DGGE analysis.
538
539
28
540
541
542
543
544
545
Table 6. Accession numbers of closest homologue and proportions of the major archaeal
phylotypes identified during this study determined through community fingerprinting analysis using
PCR-DGGE from inoculum II.
Migration Taxonomic affiliation
(Accession No. of closest homologue)
Fraction
inoculum*
Fraction
BMP*
142 Methanosarcinales (FJ705109) 6.0 7.7
221 Methanosaeta, Methanosacinales (AB494241) 12.1 7.0
325 Methanosaeta, Methanosarcinales (FM162203) 20.5 28.8
447 Methanosarcinales (GU196156) 16.9 11.4
499 Methanosaeta, Methanosarcinales (EU591661) 6.4 6.3
512 Methanosarcinales (CU916012) 5.8 8.2
525 Methanomicrobiales (EU591675) 8.4 5.7
538 Methanomicrobiales (EU591675) 6.9 7.1
Total identified 83.0 82.2 *Percentage of total fluorescence intensity quantified from the banding pattern of PCR-
DGGE analysis.
546 547 548 549 550 551
552
553
554
555
29

30
556
557
558
559
560
561
Table 7. Statistical results of the comparison between the microbial communities at the beginning
(inocula) and ending of the anaerobic treatment of sunflower oil cake for the three types of
inoculated sludges.
Archaea Bacteria
Inoculated sludge P CV (%) P CV (%)
I 0.023* 0.098 0.170 0.093
II 0.188 0.081 0.211 0.079
III 0.542 0.046 0.316 0.068
P: Probability values; CV: coefficient of variation. Asterisk indicates
significant differences (P<0.05).
562
563 564