f/c aetc faculty hiv/hcv thursday, june 26, 2014 | 1:30-2:30pm (edt) facilitator/didactic presenter...
TRANSCRIPT

F/C AETC FacultyHIV/HCV
Thursday, June 26, 2014 | 1:30-2:30pm (EDT)
Facilitator/Didactic PresenterDushyantha T. Jayaweera MD, MRCOG (UK), FACP
University of Miami
Case Discussant(s)Patrick Marsh, MD
University of South Florida

HIV/HCV: Highlights from EASLHCV Therapies in Cirrhosis/End-Stage Liver Disease
(Up to 1.0 hour of CE/CME)
Dushyantha T. Jayaweera MD, MRCOG (UK), FACP
Associate Vice Provost for Human Subject Research & Professor of Medicine, University of Miami, Miller School of Medicine, Division of Infectious DiseasesFaculty Member, Florida/Caribbean AIDS Education and Training Center

Liver Transplantation (OLT)
Treatment ofestablished disease
Treatment before histologic recurrence
Potential Strategies for Treatments of HCV in Peri-Transplant Population
Pre-OLT Rx

TURQUOISE-II Study Design: Phase 3 Trial Conducted Exclusively in GT1-Infected Cirrhotic
Patients (N=380)
3D: co-formulated ABT-450/r/ombitasvir, 150 mg/100 mg/25 mg QD; dasabuvir, 250 mg BID
RBV: 1000-1200 mg daily according to body weight (<75 kg and >75kg, respectively)
Day 0 Week 24Week 12
SVR12
SVR12
3D + RBV(N=208)
3D + RBV(N=172)
All patients to be followed through 48 weeks post-treatment
Poordad F, et al. 49th EASL; London, England; April 9-13, 2014. Abst. O163.

0
20
40
60
80
100
TURQUOISE-II Results:ITT SVR12 Rates of 92% to 96%
SVR1
2, %
Pati
ents
91.8
191/208
Non-inferiority threshold: 43%
Superiority threshold: 54%
95.9
165/172
P=0.089
Poordad F, et al. 49th EASL; London, England; April 9-13, 2014. Abst. O163.
12 Weeks3D + RBV
24 Weeks3D + RBV

TURQUOISE-II Results:ITT SVR12 Rates by HCV Subtype
Poordad F, et al. 49th EASL; London, England; April 9-13, 2014. Abst. O163.
0
20
40
60
80
10088.6 98.594.2 100
GT 1a GT 1b
SVR1
2, %
Pati
ents
124/140 67/68114/121 51/51
12-week arm
24-week arm
3D + RBV

TURQUOISE-II Results: ITT SVR12 Rates by Prior Treatment Response in
HCV Subtype 1a
0
20
40
60
80
100 92.2
12-week arm
24-week arm
92.9
Naïve Prior RelapseResponse
3D + RBV
SVR1
2, %
Pati
ents
59/64 14/1552/56 13/13
93.3 100 100 100 80.0 92.9
11/11 40/5010/10 39/42
Prior PartialResponse
Prior NullResponse
HCV Subtype 1aPoordad F, et al. 49th EASL; London, England; April 9-13, 2014. Abst. O163.
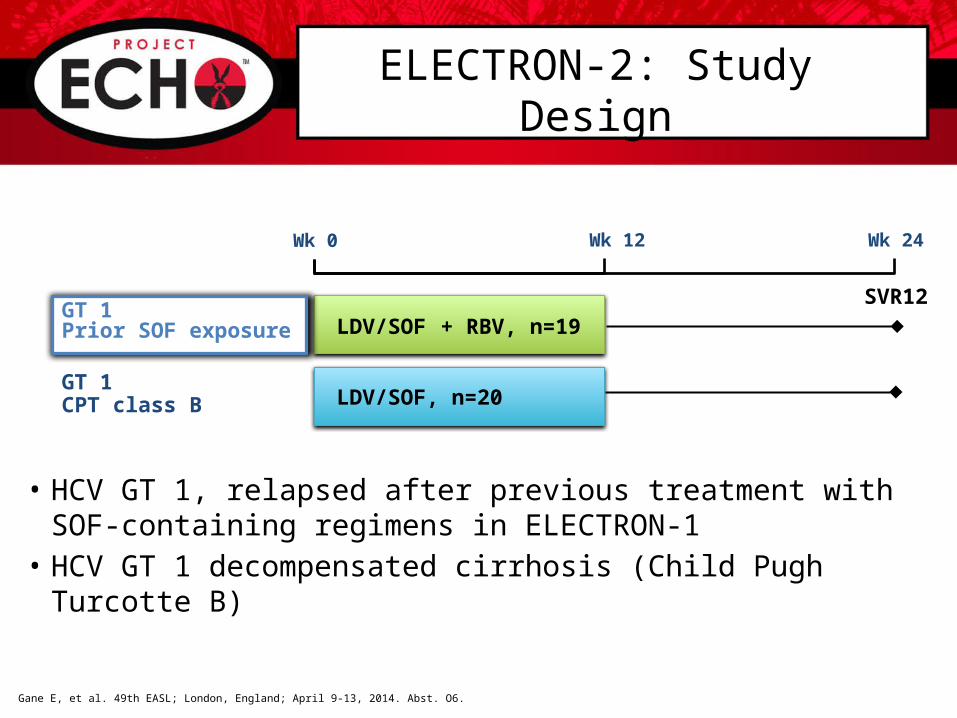
ELECTRON-2: Study Design
• HCV GT 1, relapsed after previous treatment with SOF-containing regimens in ELECTRON-1
• HCV GT 1 decompensated cirrhosis (Child Pugh Turcotte B)
Wk 0 Wk 12 Wk 24
SVR12
LDV/SOF, n=20GT 1CPT class B
LDV/SOF + RBV, n=19GT 1Prior SOF exposure
Gane E, et al. 49th EASL; London, England; April 9-13, 2014. Abst. O6.

SV
R12
(Per
cen
tag
e)
GT 1CPT Class B
Median total bilirubin,mg/dL (range)
1.5 (0.7-3.7)
Median serum albumin,g/dL (range)
3.1 (2.3-3.8)
Median INR (range)
1.2 (1.0-3.0)
Ascites, n (%) 4 (20)
Hepatic encephalopathy, n (%)
6 (30)
Median platelet count,103/µL (range)
84 (44-162)
ELECTRON-2 Results:Patients With CPT B Cirrhosis
Error bar represents the 95% confidence interval.Gane E, et al. 49th EASL; London, England; April 9-13, 2014. Abst. O6.
65
13/20
7 relapsers

SOF+RBV with portal hypertension + decompensation: Study Design and Aim
• Aim: To explore the safety and efficacy of SOF+RBV in HCV-infected patients with portal hypertension ± decompensated liver disease
• Primary objective: SVR12
• Secondary objectives– Effects of 48 weeks of treatment on hepatic portal pressure and function– Safety and clinical improvement as measured by clinical outcomes,
CPT, MELD, and biochemical test results
SOF 400 mg + RBV 1000‒1200 mgSVR12
Observation SOF 400 mg + RBV 1000‒1200 mg
SVR12
Arm 1n=25
Arm 2n=25
HVPG at Day 0 and Week 48
HVPG at Day 0, and Weeks 24 and 72
Afdhal N, et al. 49th EASL; London, England; April 9-13, 2014. Abst. O68.
Wk 0 Wk 24 Wk 48 Wk 96Wk 72
HC
V R
NA
< L
LO
Q (
Per
cen
tag
e)
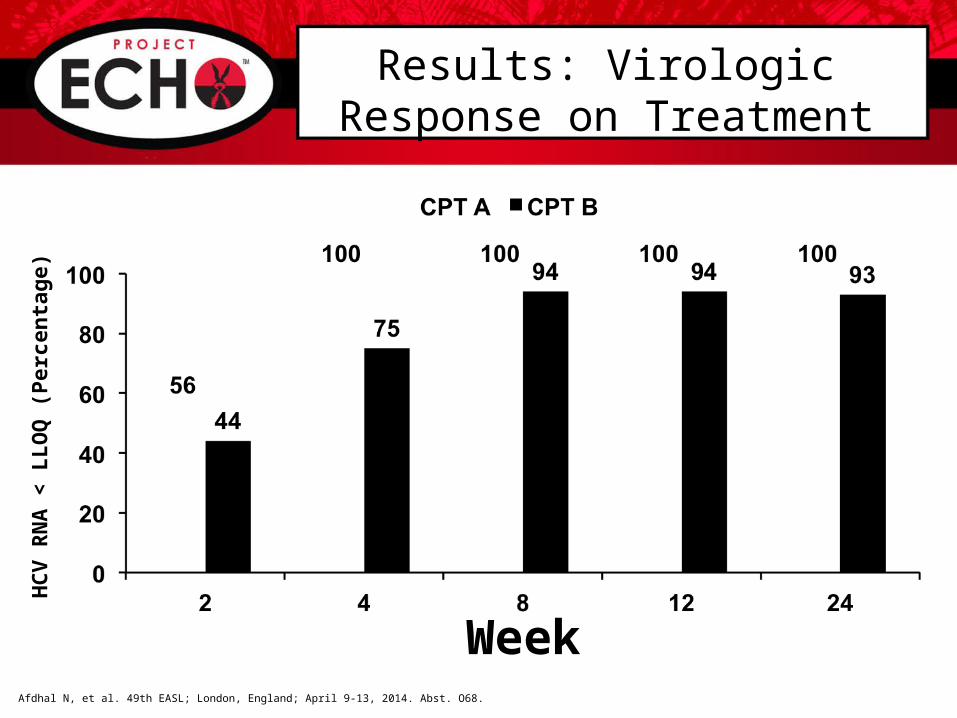
Results: Virologic Response on Treatment
WeekAfdhal N, et al. 49th EASL; London, England; April 9-13, 2014. Abst. O68.
5/9 9/97/16 12/16 8/8 8/8 7/715/16 15/16 14/15

Laboratory Results: Mean Change in MELD Score from Baseline through Week 24
-6
-4
-2
0
2
4
6
-6
-4
-2
0
2
4
6
CPT A Patients (n=20) CPT B Patients (n=29*)
ME
LD
ch
an
ge
fro
m b
asel
ine
SOF + RBV Observation 24 weeks
n=2 n=5 n=1 n=3
Afdhal N, et al. 49th EASL; London, England; April 9-13, 2014. Abst. O68.
1 patient had only a baseline MELD score before withdrawing consent and is not
depicted.
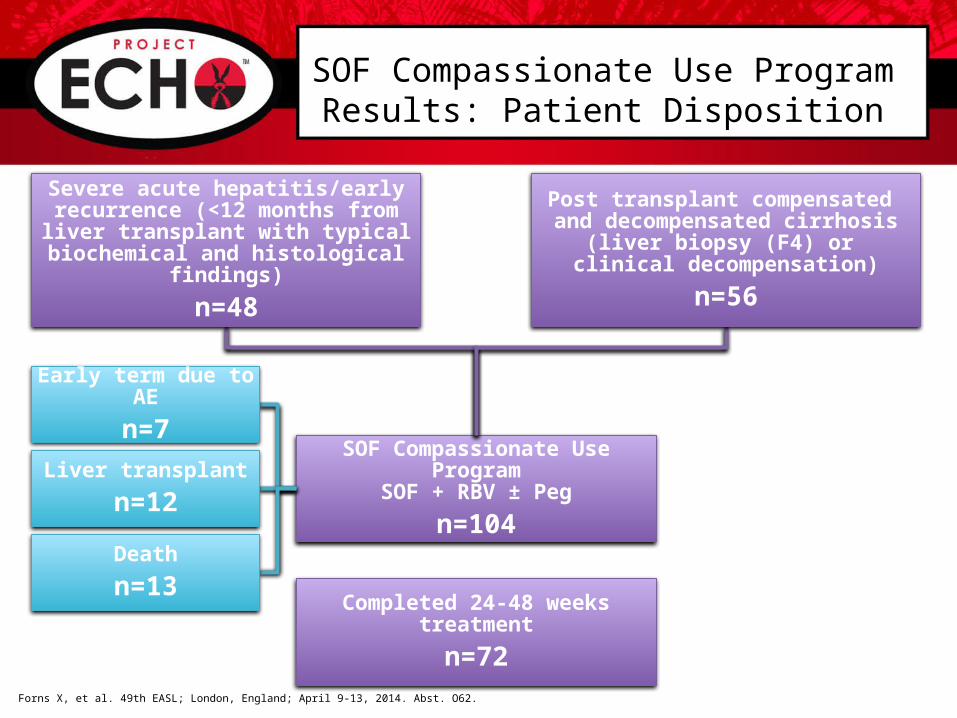
SOF Compassionate Use ProgramSOF + RBV ± Peg
n=104
Completed 24-48 weeks treatment
n=72
Forns X, et al. 49th EASL; London, England; April 9-13, 2014. Abst. O62.
SOF Compassionate Use Program Results: Patient Disposition
Severe acute hepatitis/early recurrence (<12 months from liver transplant with typical biochemical
and histological findings)
n=48
Post transplant compensated and decompensated cirrhosis
(liver biopsy (F4) or clinical decompensation)
n=56
Early term due to AE
n=7
Liver transplant
n=12
Death
n=13

Forns X, et al. 49th EASL; London, England; April 9-13, 2014. Abst. O62.
Results: Overall Virologic Response
Patients were excluded from this analysis if received a liver transplant (n=8 at EOT; n=12 at SVR12) and/or no data was available (n=3 at EOT; n=7 at SVR12).
81/93 53/85

Forns X, et al. 49th EASL; London, England; April 9-13, 2014. Abst. O62.
Results: Clinical Outcomes
*Significant decrease in hepatic encephalopathy, improvement or disappearance of ascites, or improvement in liver-related laboratory values.
• All patients who received ≥1 dose of SOF are included
60/104 22/104 22/104

Clinical Cases: Fibrosing Cholestatic Hepatitis (2 Patients with FCH)
• Viral load undetectable by Week 4 (Patient 1) and Week 12 (Patient 2) resulting in SVR12Forns X, et al. 49th EASL; London, England; April 9-13, 2014. Abst. O62.
0
5
10
15
20
25
0
500
1000
1500
2000
2500
3000
0 12 24 360
5
10
15
20
25
0
500
1000
1500
2000
2500
3000
0 12 24 36 48 60
Patient 1 (SOF + RBV 24 Weeks)
GG
T (
IU/L
)
GG
T (
IU/L
)Biliru
bin
(mg
/dL
)
Biliru
bin
(mg
/dL
)
HCV RNA 8.7 log10 IU/mL
4
HCV RNA 8 log10 IU/mL
SOF + RBVTreatment
SOF + RBVTreatment
OffTreatment
OffTreatment
Patient 2 (SOF + RBV 48 Weeks)
FU12
BLWeek 4BL
FU12

Study M12-999: Design
• 3D: co-formulated ABT-450/r/ombitasvir, 150 mg/100 mg/25 mg QD; dasabuvir, 250 mg BID
• RBV: dosing was managed at the discretion of the investigator and closely monitored per protocol
Day 0 Week 24
SVR12
To Week 72
3D + RBV(N=34)
Kwo P, et al. 49th EASL; London, England; April 9-13, 2014. Abst. O114.
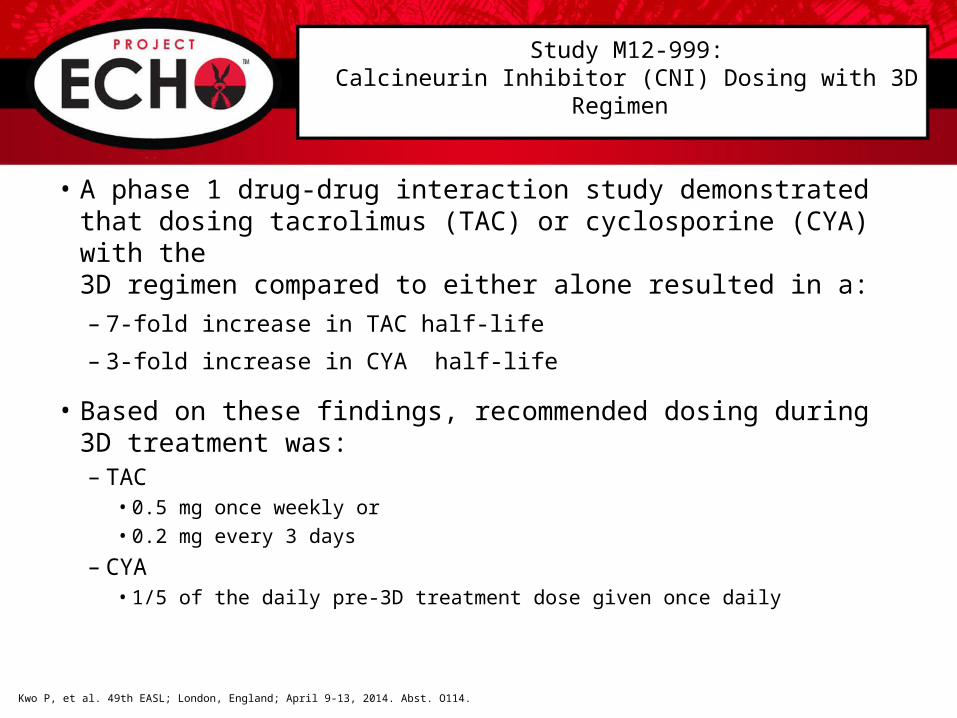
Study M12-999:Calcineurin Inhibitor (CNI) Dosing with 3D Regimen
• A phase 1 drug-drug interaction study demonstrated that dosing tacrolimus (TAC) or cyclosporine (CYA) with the 3D regimen compared to either alone resulted in a:
– 7-fold increase in TAC half-life
– 3-fold increase in CYA half-life
• Based on these findings, recommended dosing during 3D treatment was:– TAC
• 0.5 mg once weekly or
• 0.2 mg every 3 days
– CYA• 1/5 of the daily pre-3D treatment dose given once daily
Kwo P, et al. 49th EASL; London, England; April 9-13, 2014. Abst. O114.

Study M12-999:Preliminary Efficacy Results
• No patient had breakthrough• One patient had a relapse (post-treatment day 3)
– At the time of relapse, this patient had R155K in NS3 protease, M28T+Q30R in NS5A, and G554S+G557R in NS5B, none of which were present at baseline
Kwo P, et al. 49th EASL; London, England; April 9-13, 2014. Abst. O114.
Per
cen
tag
e P
atie
nts
34/34 34/34 32/33 25/26

Study M12-999: Pre-Treatment and On-Treatment Tacrolimus Ctrough Concentrations
• Ctrough levels were comparable pre-treatment and on-treatment
• TAC dose was 0.5 to 1.0 mg at 1-2 week intervals for most patients
• 4 patients experienced a TAC level >15 ng/mL (15.7-34.0 ng/mL)
– All 4 patients had TAC dosing errors
– 2 patients had associated creatinine increases (1.8 and 1.4 mg/dL), which normalized when dosing was corrected
Tacr
oli
mu
s C
on
cen
trat
ion
(n
g/m
L)
Kwo P, et al. 49th EASL; London, England; April 9-13, 2014. Abst. O114.
(Treatment Weeks 1-4)
Question & Answer Session