fault tree analysis of the causes of waterborne … tree analysis of the causes of waterborne...
TRANSCRIPT
Fault tree analysis of the causes of waterborne outbreaks
Helen L. Risebro, Miguel F. Doria, Yvonne Andersson, Gertjan Medema,
Keith Osborn, Olivier Schlosser and Paul R. Hunter
ABSTRACT
Helen L. Risebro (corresponding author)
Paul R. Hunter
School of Medicine,
Health Policy and Practice,
University of East Anglia,
Norwich NR4 7TJ,
UK
Tel.: +44 1603 591004
Fax: +44 1603 593752
E-mail: [email protected]
Miguel F. Doria
UNESCO/International Hydrological
Programme (IHP),
1 rue Miollis, F-75732, Paris Cedex 15,
France
Yvonne Andersson
Swedish Institute for Infectious Disease
Control (SMI),
SE-17182 Solna,
Sweden
Gertjan Medema
Kiwa Water Research, PO Box 1072,
3430 BB Nieuwegein,
The Netherlands
Keith Osborn
United Utilities Water PLC, Thirlmere House,
Lingley Mere Business Park, Greta Sankey,
Warrington WA5 3LP,
UK
Olivier Schlosser
Suez Environnement/CIRSEE, Water Quality
Technical & Research Division,
38 rue du President Wilson, F78230 Le Pecq,
France
Prevention and containment of outbreaks requires examination of the contribution and interrelation
of outbreak causative events. An outbreak fault tree was developed and applied to 61 enteric
outbreaks related to public drinking water supplies in the EU. A mean of 3.25 causative events
per outbreak were identified; each event was assigned a score based on percentage contribution per
outbreak. Source and treatment system causative events often occurred concurrently (in 34
outbreaks). Distribution system causative events occurred less frequently (19 outbreaks) but were
often solitary events contributing heavily towards the outbreak (a mean % score of 87.42). Livestock
and rainfall in the catchment with no/inadequate filtration of water sources contributed concurrently
to 11 of 31 Cryptosporidium outbreaks. Of the 23 protozoan outbreaks experiencing at least one
treatment causative event, 90% of these events were filtration deficiencies; by contrast, for bacterial,
viral, gastroenteritis and mixed pathogen outbreaks, 75% of treatment events were disinfection
deficiencies. Roughly equal numbers of groundwater and surface water outbreaks experienced at
least one treatment causative event (18 and 17 outbreaks, respectively). Retrospective analysis of
multiple outbreaks of enteric disease can be used to inform outbreak investigations, facilitate
corrective measures, and further develop multi-barrier approaches.
Key words | disease outbreaks, drinking water, pathogens, risk management
INTRODUCTION
Outbreaks of infectious intestinal disease (IID) caused by
contamination of drinking water supplies have resulted in
substantial human and economic cost (Laursen et al. 1994;
Andersson et al. 1997; Corso et al. 2003). In order to
minimise these costs, it is essential to promptly identify and
rectify the cause of an outbreak, or better still, to prevent the
onset of an outbreak altogether. By identifying the key and
potential threats to water quality, it is possible to formulate
an effective outbreak or contamination event prevention
strategy such as the multi-barrier approach. Multi-barrier
approaches to safe drinking water have been adopted in
recognition that failures can occur across different stages of
the drinking water system between source and tap. Key
elements of the multi-barrier approach include: source
water, treatment, distribution, management, and response
(Hrudey & Hrudey 2004, p 398).
Hrudey et al. (2003) examined five elements of the multi-
barrier approach in relation to 15 published waterborne
disease outbreaks. Most outbreaks had problems with the
source water (13 outbreaks), closely followed by treatment
doi: 10.2166/wh.2007.136
1 Q IWA Publishing 2007 Journal of Water and Health | 05.Suppl 1 | 2007
(12), then distribution (5), response (3) and monitoring (2).
Schuster et al. (2005) recently conducted an extensive review
of 288 waterborne disease outbreaks associated with public,
semi-public and private water supplies in Canada. Approxi-
mately 23 outbreak causative factors were grouped into 10
categories including weather events, animals, agriculture,
human factors and water treatment issues. Factors relating to
treatment and wildlife were cited the most often as contribut-
ing towards the outbreaks reviewed. The evidence cited thus
far demonstrates a large number of source waterand treatment
failures. However, these findings were not emulated in a
review of outbreaks and deficiencies in US public water
systems from 1991–1998 where distribution system
deficiencies were identified as the most frequent cause
(Craun et al. 2003). Such diversity is likely to reflect water
industry-, environmental- and country-specific differences in
the pool of outbreaks studied by these authors yet the
frequency of such causal events still merits further exploration.
Multiple events can concurrently contribute towards
outbreaks of waterborne disease and the multi-barrier
approach provides multiple levels of protection which
together attempt to reduce the risk of outbreaks or events.
For the majority of outbreaks reviewed by Schuster et al.
(2005), a single causative factor was involved, yet in 9
outbreaks, more than 3 factors contributed to the outbreak.
Furthermore, Deere et al.(2001) list a variety of scenarios
consisting of multiple events affecting drinking water systems
implicated in disease outbreaks in the UK (McCann 1999) and
US (Davison et al. 1999). However, to date, few attempts have
been made to study causal factors associated with multiple
outbreaks in more detail, to discuss the interrelation of such
causal factors or to assess their weighted contribution.
Therefore, it is the purpose of this paper to further examine
the causal factors involved in enteric disease outbreaks
related to public drinking water supplies in the EU.
METHOD
We searched for outbreaks of enteric waterborne disease
associated with EU public drinking water supplies using
electronic databases (including Medline, Embase and Cinahl)
and full reference list searches. Eighty-six outbreaks were
identified between the years 1990–2005. Full data extraction
was performed for each outbreak using a pro formawhich was
designed to gather information such as primary and secondary
reference sources, year and month of outbreak onset, country
of outbreak, descriptive and analytical epidemiology, environ-
mental investigations, details of water source and causal
factors. Individuals fluent in the language performed data
extraction for articles not published in the English language.
Authors or experts with knowledge about the outbreaks were
contacted and invited to provide crucial information which
was not available from published sources or to provide
outbreak control team reports which were not widely
distributed beyond the local level.
The fault tree approach has been discussed in relation to
water quality and identified as an approach which embraces
the concept that events need to be considered together as
scenarios (Stevens et al. 1995; Deere et al. 2001). Fault tree
analysis (FTA) was therefore adopted as a tool for further
investigating the relevance of specific outbreak causal factors.
A fault tree is a graphic model of various sequential and
parallel combinations of faults (or events) that will result in the
occurrence of the predefined undesired event (Haimes 2004,
pp 528–529). In this context, at the top of the tree is the
outbreak (the undesirable event); all preconditions for the
outbreak are determined until the primary causes are
identified (base events). All events are joined by a series of
gates and branches; an AND gate requires all input events to
occur and an inclusive OR gate requires one or more input
events to occur. The main assumption is that faults, such as
outbreaks, occur when multiple events take place.
A generic outbreak fault tree was developed using the key
elements of the multi-barrier approach (source, treatment,
distribution, monitoring and response) to fit all outbreaks of
enteric disease related to drinking water. Base events emerged
from appraisal of the outbreaks identified through the
reviewing process. A scoring system was developed to
encapsulate the severity and likelihood components of the
risk matrix. If a base event is reported to have occurred, this
base event is given a proportional score between 1 and 100
according to the magnitude of its contribution towards the
outbreak. The cumulative score of all base events contributing
towards the occurrence of a single outbreak is 100.
An outbreak fault tree validation meeting was held with
seven participants from five EU countries with expertise in
the field of water and health and working in industry,
2 H. L. Risebro et al. | Fault tree analysis of the causes of waterborne outbreaks Journal of Water and Health | 05.Suppl 1 | 2007

epidemiology, academia, microbiology and public health.
During this meeting participants reviewed 50 outbreaks of
waterborne disease and came to a collective decision on
scores for base events. Information about each outbreak
was often gathered from a number of sources; the data
extraction forms organised and gathered this information
into one place. Therefore, to ensure that all relevant
information was easily accessible, participants were given
the completed data extraction forms and the full text of all
information gathered concerning each outbreak. A copy of
the generic fault tree also accompanied this information.
Following the validation meeting a number of revisions
were made to the fault tree to further characterise the route
cause and effect of some outbreak scenarios. Figure 1
represents the final version of the generic outbreak fault
tree. Table 1 further defines the base and intermediary
events. Scoring was subsequently re-applied to 61 outbreaks
which contained sufficient detail on the cause(s) of the
outbreak. A minimum of three people have agreed scores
for each of the 61 outbreaks (the outcome of which is
documented in the fault tree analysis section of the results).
To inform readers of the information resources utilised and
the nature of outbreaks included in the fault tree analysis,
brief descriptive characteristics of the 61 included out-
breaks are provided as an introduction to the results
section. A list of the primary references used for each of
the 61 outbreaks can be found in the appendix.
RESULTS AND DISCUSSION
Outbreak characteristics
The strength of association (SOA) with water (as defined by
Tillet et al. (1998)) was already classified by the authors of
the paper in 44% of outbreaks (for the remainder, 38% were
classified by 1 reviewer and 18% by 2 reviewers). Fifty six
Figure 1 | Fault tree for waterborne outbreaks.
3 H. L. Risebro et al. | Fault tree analysis of the causes of waterborne outbreaks Journal of Water and Health | 05.Suppl 1 | 2007
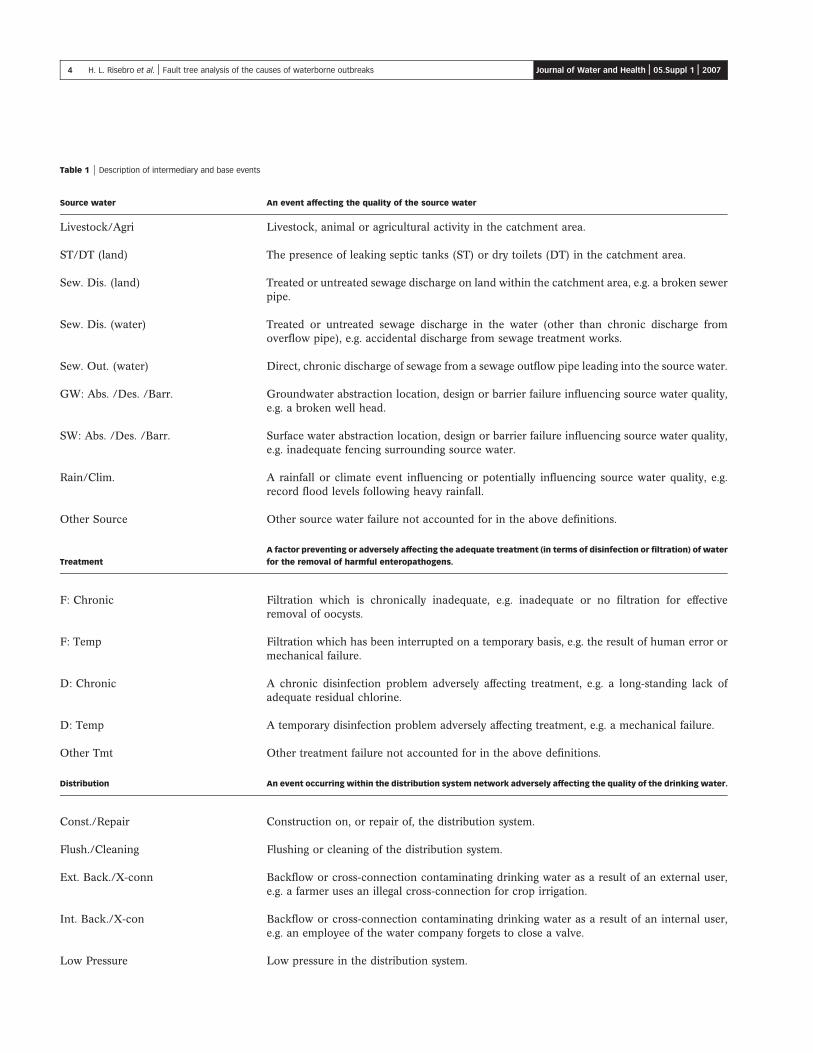
Table 1 | Description of intermediary and base events
Source water An event affecting the quality of the source water
Livestock/Agri Livestock, animal or agricultural activity in the catchment area.
ST/DT (land) The presence of leaking septic tanks (ST) or dry toilets (DT) in the catchment area.
Sew. Dis. (land) Treated or untreated sewage discharge on land within the catchment area, e.g. a broken sewerpipe.
Sew. Dis. (water) Treated or untreated sewage discharge in the water (other than chronic discharge fromoverflow pipe), e.g. accidental discharge from sewage treatment works.
Sew. Out. (water) Direct, chronic discharge of sewage from a sewage outflow pipe leading into the source water.
GW: Abs. /Des. /Barr. Groundwater abstraction location, design or barrier failure influencing source water quality,e.g. a broken well head.
SW: Abs. /Des. /Barr. Surface water abstraction location, design or barrier failure influencing source water quality,e.g. inadequate fencing surrounding source water.
Rain/Clim. A rainfall or climate event influencing or potentially influencing source water quality, e.g.record flood levels following heavy rainfall.
Other Source Other source water failure not accounted for in the above definitions.
Treatment
A factor preventing or adversely affecting the adequate treatment (in terms of disinfection or filtration) of water
for the removal of harmful enteropathogens.
F: Chronic Filtration which is chronically inadequate, e.g. inadequate or no filtration for effectiveremoval of oocysts.
F: Temp Filtration which has been interrupted on a temporary basis, e.g. the result of human error ormechanical failure.
D: Chronic A chronic disinfection problem adversely affecting treatment, e.g. a long-standing lack ofadequate residual chlorine.
D: Temp A temporary disinfection problem adversely affecting treatment, e.g. a mechanical failure.
Other Tmt Other treatment failure not accounted for in the above definitions.
Distribution An event occurring within the distribution system network adversely affecting the quality of the drinking water.
Const./Repair Construction on, or repair of, the distribution system.
Flush./Cleaning Flushing or cleaning of the distribution system.
Ext. Back./X-conn Backflow or cross-connection contaminating drinking water as a result of an external user,e.g. a farmer uses an illegal cross-connection for crop irrigation.
Int. Back./X-con Backflow or cross-connection contaminating drinking water as a result of an internal user,e.g. an employee of the water company forgets to close a valve.
Low Pressure Low pressure in the distribution system.
4 H. L. Risebro et al. | Fault tree analysis of the causes of waterborne outbreaks Journal of Water and Health | 05.Suppl 1 | 2007
percent of outbreaks were deemed to have a strong SOA
with water. Sixty-six percent of outbreaks were derived
from a report from the Outbreak Control Team (OCT) or
journal article(s) (solely dedicated to analysis of the
outbreak) and had a strong or probable SOA.
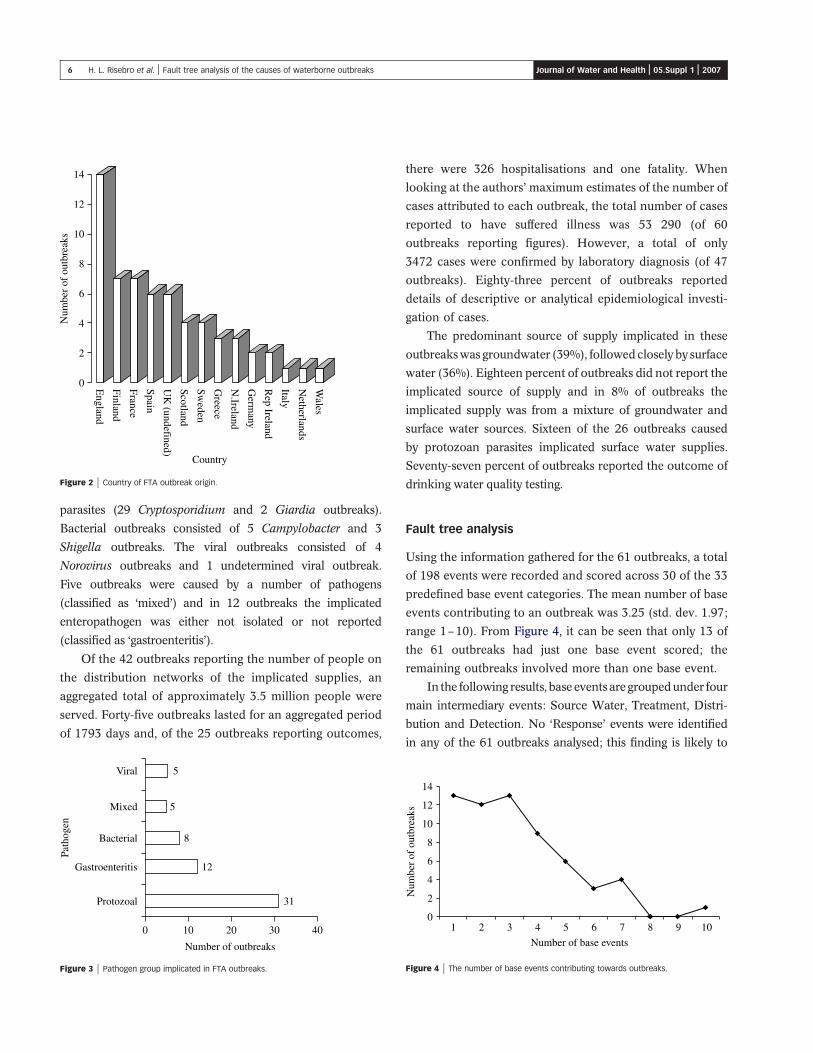
The number of outbreaks associated with each country
can be found in Figure 2. Data for the UK is provided for its
constituent countries to enhance detail; the exact location
of the outbreak was not reported for 6 outbreaks, which are
classified in Figure 2 under ‘UK (undefined)’. Most out-
breaks occurred in the year 2000 (10 outbreaks) and the
predominant months of outbreak onset were February and
April (each experiencing 9 outbreaks).
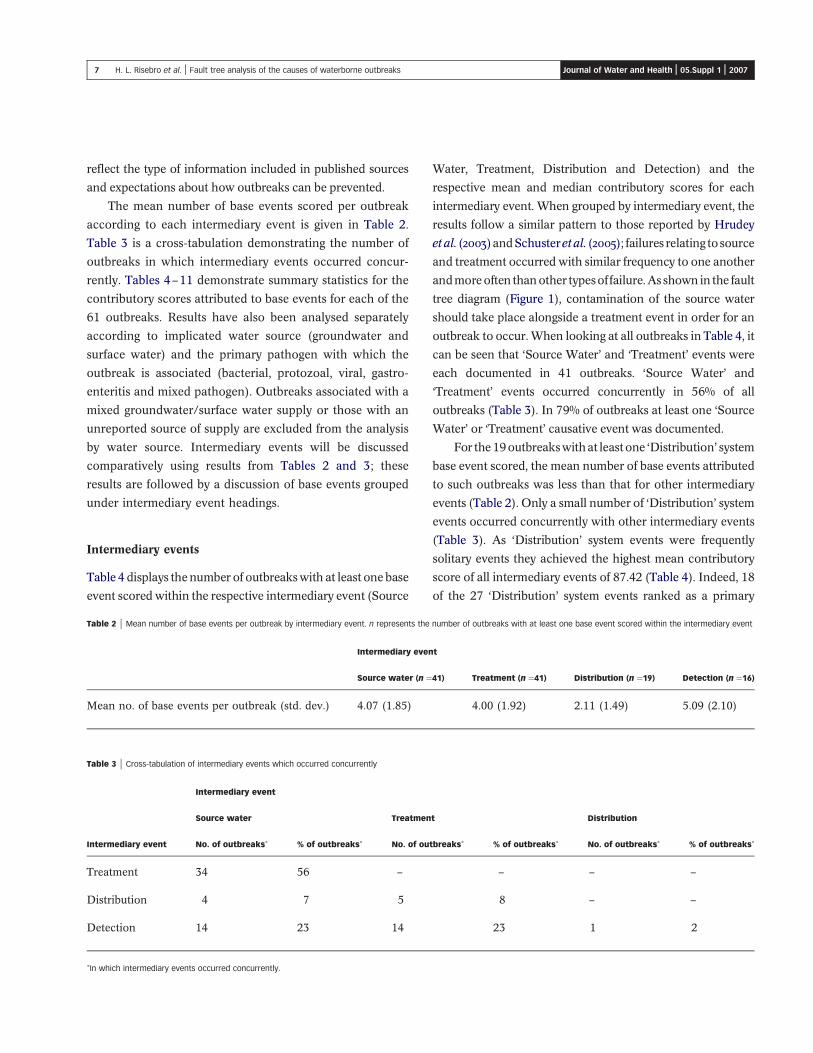
The number of outbreaks associated with each pathogen
group (isolated from human cases) is illustrated in Figure 3.
Over half of the outbreaks were associated with protozoan
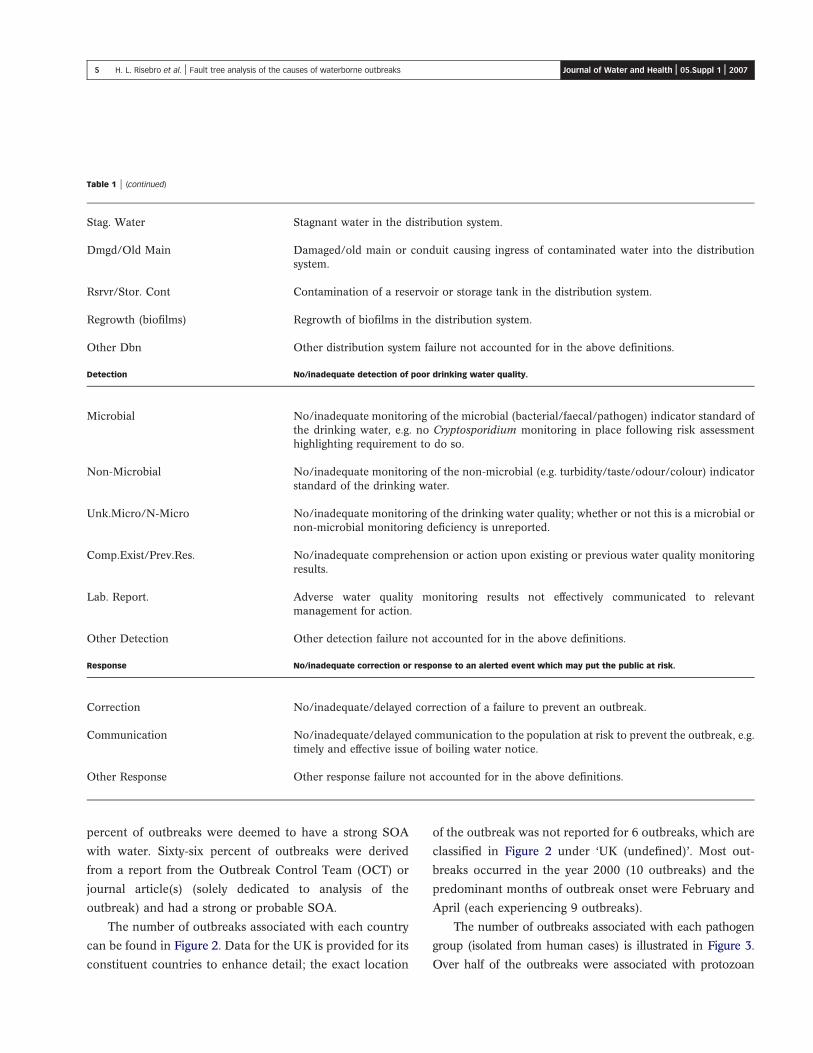
Table 1 | (continued)
Stag. Water Stagnant water in the distribution system.
Dmgd/Old Main Damaged/old main or conduit causing ingress of contaminated water into the distributionsystem.
Rsrvr/Stor. Cont Contamination of a reservoir or storage tank in the distribution system.
Regrowth (biofilms) Regrowth of biofilms in the distribution system.
Other Dbn Other distribution system failure not accounted for in the above definitions.
Detection No/inadequate detection of poor drinking water quality.
Microbial No/inadequate monitoring of the microbial (bacterial/faecal/pathogen) indicator standard ofthe drinking water, e.g. no Cryptosporidium monitoring in place following risk assessmenthighlighting requirement to do so.
Non-Microbial No/inadequate monitoring of the non-microbial (e.g. turbidity/taste/odour/colour) indicatorstandard of the drinking water.
Unk.Micro/N-Micro No/inadequate monitoring of the drinking water quality; whether or not this is a microbial ornon-microbial monitoring deficiency is unreported.
Comp.Exist/Prev.Res. No/inadequate comprehension or action upon existing or previous water quality monitoringresults.
Lab. Report. Adverse water quality monitoring results not effectively communicated to relevantmanagement for action.
Other Detection Other detection failure not accounted for in the above definitions.
Response No/inadequate correction or response to an alerted event which may put the public at risk.
Correction No/inadequate/delayed correction of a failure to prevent an outbreak.
Communication No/inadequate/delayed communication to the population at risk to prevent the outbreak, e.g.timely and effective issue of boiling water notice.
Other Response Other response failure not accounted for in the above definitions.
5 H. L. Risebro et al. | Fault tree analysis of the causes of waterborne outbreaks Journal of Water and Health | 05.Suppl 1 | 2007
parasites (29 Cryptosporidium and 2 Giardia outbreaks).
Bacterial outbreaks consisted of 5 Campylobacter and 3
Shigella outbreaks. The viral outbreaks consisted of 4
Norovirus outbreaks and 1 undetermined viral outbreak.
Five outbreaks were caused by a number of pathogens
(classified as ‘mixed’) and in 12 outbreaks the implicated
enteropathogen was either not isolated or not reported
(classified as ‘gastroenteritis’).
Of the 42 outbreaks reporting the number of people on
the distribution networks of the implicated supplies, an
aggregated total of approximately 3.5 million people were
served. Forty-five outbreaks lasted for an aggregated period
of 1793 days and, of the 25 outbreaks reporting outcomes,
there were 326 hospitalisations and one fatality. When
looking at the authors’ maximum estimates of the number of
cases attributed to each outbreak, the total number of cases
reported to have suffered illness was 53 290 (of 60
outbreaks reporting figures). However, a total of only
3472 cases were confirmed by laboratory diagnosis (of 47
outbreaks). Eighty-three percent of outbreaks reported
details of descriptive or analytical epidemiological investi-
gation of cases.
The predominant source of supply implicated in these
outbreaks was groundwater (39%), followed closely by surface
water (36%). Eighteen percent of outbreaks did not report the
implicated source of supply and in 8% of outbreaks the
implicated supply was from a mixture of groundwater and
surface water sources. Sixteen of the 26 outbreaks caused
by protozoan parasites implicated surface water supplies.
Seventy-seven percent of outbreaks reported the outcome of
drinking water quality testing.
Fault tree analysis
Using the information gathered for the 61 outbreaks, a total
of 198 events were recorded and scored across 30 of the 33
predefined base event categories. The mean number of base
events contributing to an outbreak was 3.25 (std. dev. 1.97;
range 1–10). From Figure 4, it can be seen that only 13 of
the 61 outbreaks had just one base event scored; the
remaining outbreaks involved more than one base event.
In the following results, base events are grouped under four
main intermediary events: Source Water, Treatment, Distri-
bution and Detection. No ‘Response’ events were identified
in any of the 61 outbreaks analysed; this finding is likely to
Figure 2 | Country of FTA outbreak origin.
Figure 3 | Pathogen group implicated in FTA outbreaks. Figure 4 | The number of base events contributing towards outbreaks.
6 H. L. Risebro et al. | Fault tree analysis of the causes of waterborne outbreaks Journal of Water and Health | 05.Suppl 1 | 2007
reflect the type of information included in published sources
and expectations about how outbreaks can be prevented.
The mean number of base events scored per outbreak
according to each intermediary event is given in Table 2.
Table 3 is a cross-tabulation demonstrating the number of
outbreaks in which intermediary events occurred concur-
rently. Tables 4–11 demonstrate summary statistics for the
contributory scores attributed to base events for each of the
61 outbreaks. Results have also been analysed separately
according to implicated water source (groundwater and
surface water) and the primary pathogen with which the
outbreak is associated (bacterial, protozoal, viral, gastro-
enteritis and mixed pathogen). Outbreaks associated with a
mixed groundwater/surface water supply or those with an
unreported source of supply are excluded from the analysis
by water source. Intermediary events will be discussed
comparatively using results from Tables 2 and 3; these
results are followed by a discussion of base events grouped
under intermediary event headings.
Intermediary events
Table 4 displays the number of outbreaks with at least one base
event scored within the respective intermediary event (Source
Water, Treatment, Distribution and Detection) and the
respective mean and median contributory scores for each
intermediary event. When grouped by intermediary event, the
results follow a similar pattern to those reported by Hrudey
etal. (2003)andSchusteretal. (2005); failures relating tosource
and treatment occurred with similar frequency to one another
andmoreoften than other typesoffailure.As shown in the fault
tree diagram (Figure 1), contamination of the source water
should take place alongside a treatment event in order for an
outbreak to occur. When looking at all outbreaks in Table 4, it
can be seen that ‘Source Water’ and ‘Treatment’ events were
each documented in 41 outbreaks. ‘Source Water’ and
‘Treatment’ events occurred concurrently in 56% of all
outbreaks (Table 3). In 79% of outbreaks at least one ‘Source
Water’ or ‘Treatment’ causative event was documented.
For the 19outbreakswithat leastone ‘Distribution’ system
base event scored, the mean number of base events attributed
to such outbreaks was less than that for other intermediary
events (Table 2). Only a small number of ‘Distribution’ system
events occurred concurrently with other intermediary events
(Table 3). As ‘Distribution’ system events were frequently
solitary events they achieved the highest mean contributory
score of all intermediary events of 87.42 (Table 4). Indeed, 18
of the 27 ‘Distribution’ system events ranked as a primary
Table 2 | Mean number of base events per outbreak by intermediary event. n represents the number of outbreaks with at least one base event scored within the intermediary event
Intermediary event
Source water (n ¼41) Treatment (n ¼41) Distribution (n ¼19) Detection (n ¼16)
Mean no. of base events per outbreak (std. dev.) 4.07 (1.85) 4.00 (1.92) 2.11 (1.49) 5.09 (2.10)
Table 3 | Cross-tabulation of intermediary events which occurred concurrently
Intermediary event
Source water Treatment Distribution
Intermediary event No. of outbreaksp % of outbreaksp No. of outbreaksp % of outbreaksp No. of outbreaksp % of outbreaksp
Treatment 34 56 – – – –
Distribution 4 7 5 8 – –
Detection 14 23 14 23 1 2
pIn which intermediary events occurred concurrently.
7 H. L. Risebro et al. | Fault tree analysis of the causes of waterborne outbreaks Journal of Water and Health | 05.Suppl 1 | 2007
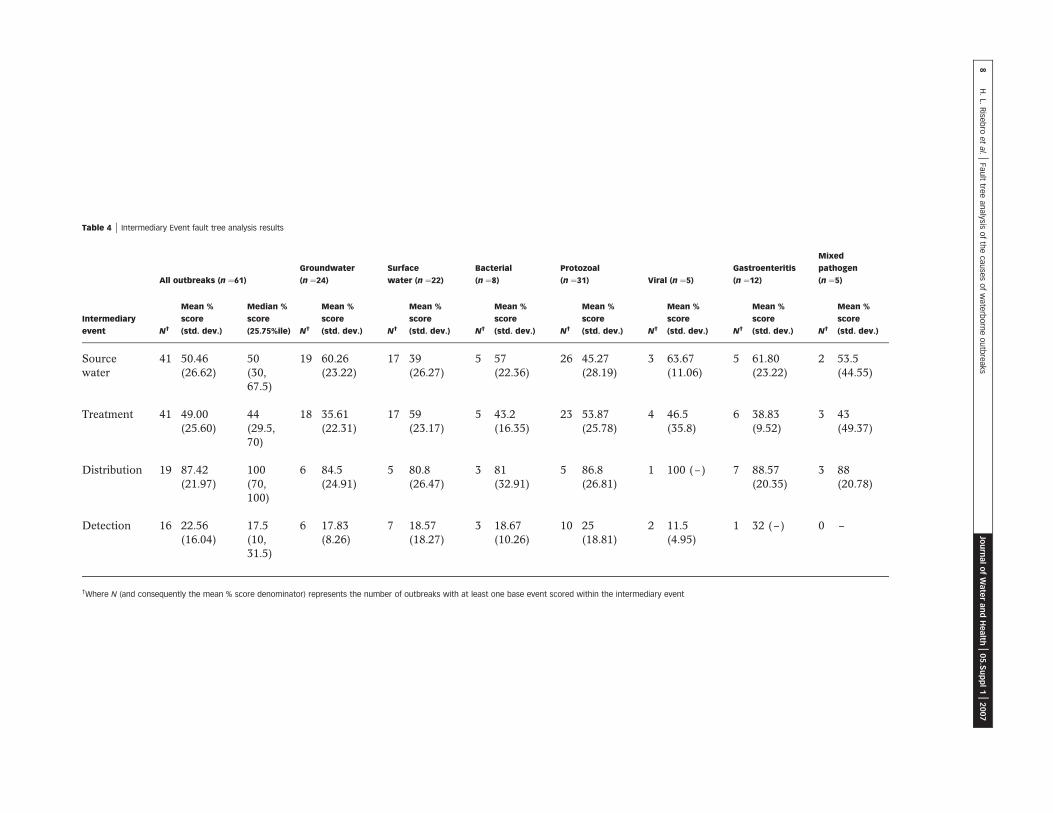
Table 4 | Intermediary Event fault tree analysis results
All outbreaks (n ¼61)
Groundwater
(n ¼24)
Surface
water (n ¼22)
Bacterial
(n ¼8)
Protozoal
(n ¼31) Viral (n ¼5)
Gastroenteritis
(n ¼12)
Mixed
pathogen
(n ¼5)
Intermediary
event N†
Mean %
score
(std. dev.)
Median %
score
(25.75%ile) N†
Mean %
score
(std. dev.) N†
Mean %
score
(std. dev.) N†
Mean %
score
(std. dev.) N†
Mean %
score
(std. dev.) N†
Mean %
score
(std. dev.) N†
Mean %
score
(std. dev.) N†
Mean %
score
(std. dev.)
Sourcewater
41 50.46(26.62)
50(30,67.5)
19 60.26(23.22)
17 39(26.27)
5 57(22.36)
26 45.27(28.19)
3 63.67(11.06)
5 61.80(23.22)
2 53.5(44.55)
Treatment 41 49.00(25.60)
44(29.5,70)
18 35.61(22.31)
17 59(23.17)
5 43.2(16.35)
23 53.87(25.78)
4 46.5(35.8)
6 38.83(9.52)
3 43(49.37)
Distribution 19 87.42(21.97)
100(70,100)
6 84.5(24.91)
5 80.8(26.47)
3 81(32.91)
5 86.8(26.81)
1 100 (–) 7 88.57(20.35)
3 88(20.78)
Detection 16 22.56(16.04)
17.5(10,31.5)
6 17.83(8.26)
7 18.57(18.27)
3 18.67(10.26)
10 25(18.81)
2 11.5(4.95)
1 32 (–) 0 –
†Where N (and consequently the mean % score denominator) represents the number of outbreaks with at least one base event scored within the intermediary event
8H
.L.
Rise
bro
etal. |
Fau
lttre
ean
alysis
of
the
cau
ses
of
wate
rbo
rne
ou
tbre
aks
Journ
alofWaterandHealth
|05.Suppl1|2007
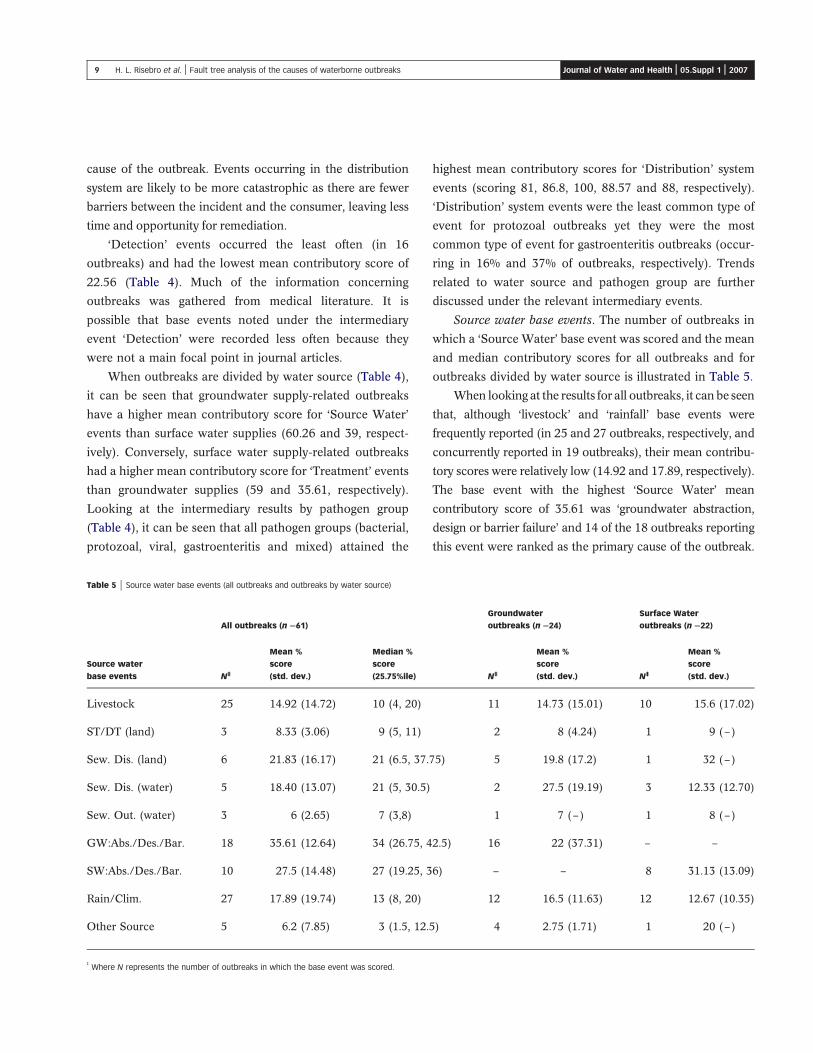
cause of the outbreak. Events occurring in the distribution
system are likely to be more catastrophic as there are fewer
barriers between the incident and the consumer, leaving less
time and opportunity for remediation.
‘Detection’ events occurred the least often (in 16
outbreaks) and had the lowest mean contributory score of
22.56 (Table 4). Much of the information concerning
outbreaks was gathered from medical literature. It is
possible that base events noted under the intermediary
event ‘Detection’ were recorded less often because they
were not a main focal point in journal articles.
When outbreaks are divided by water source (Table 4),
it can be seen that groundwater supply-related outbreaks
have a higher mean contributory score for ‘Source Water’
events than surface water supplies (60.26 and 39, respect-
ively). Conversely, surface water supply-related outbreaks
had a higher mean contributory score for ‘Treatment’ events
than groundwater supplies (59 and 35.61, respectively).
Looking at the intermediary results by pathogen group
(Table 4), it can be seen that all pathogen groups (bacterial,
protozoal, viral, gastroenteritis and mixed) attained the
highest mean contributory scores for ‘Distribution’ system
events (scoring 81, 86.8, 100, 88.57 and 88, respectively).
‘Distribution’ system events were the least common type of
event for protozoal outbreaks yet they were the most
common type of event for gastroenteritis outbreaks (occur-
ring in 16% and 37% of outbreaks, respectively). Trends
related to water source and pathogen group are further
discussed under the relevant intermediary events.
Source water base events. The number of outbreaks in
which a ‘Source Water’ base event was scored and the mean
and median contributory scores for all outbreaks and for
outbreaks divided by water source is illustrated in Table 5.
When looking at the results for all outbreaks, it can be seen
that, although ‘livestock’ and ‘rainfall’ base events were
frequently reported (in 25 and 27 outbreaks, respectively, and
concurrently reported in 19 outbreaks), their mean contribu-
tory scores were relatively low (14.92 and 17.89, respectively).
The base event with the highest ‘Source Water’ mean
contributory score of 35.61 was ‘groundwater abstraction,
design or barrier failure’ and 14 of the 18 outbreaks reporting
this event were ranked as the primary cause of the outbreak.
Table 5 | Source water base events (all outbreaks and outbreaks by water source)
All outbreaks (n ¼61)
Groundwater
outbreaks (n ¼24)
Surface Water
outbreaks (n ¼22)
Source water
base events N‡
Mean %
score
(std. dev.)
Median %
score
(25.75%ile) N‡
Mean %
score
(std. dev.) N‡
Mean %
score
(std. dev.)
Livestock 25 14.92 (14.72) 10 (4, 20) 11 14.73 (15.01) 10 15.6 (17.02)
ST/DT (land) 3 8.33 (3.06) 9 (5, 11) 2 8 (4.24) 1 9 (–)
Sew. Dis. (land) 6 21.83 (16.17) 21 (6.5, 37.75) 5 19.8 (17.2) 1 32 (–)
Sew. Dis. (water) 5 18.40 (13.07) 21 (5, 30.5) 2 27.5 (19.19) 3 12.33 (12.70)
Sew. Out. (water) 3 6 (2.65) 7 (3,8) 1 7 (–) 1 8 (–)
GW:Abs./Des./Bar. 18 35.61 (12.64) 34 (26.75, 42.5) 16 22 (37.31) – –
SW:Abs./Des./Bar. 10 27.5 (14.48) 27 (19.25, 36) – – 8 31.13 (13.09)
Rain/Clim. 27 17.89 (19.74) 13 (8, 20) 12 16.5 (11.63) 12 12.67 (10.35)
Other Source 5 6.2 (7.85) 3 (1.5, 12.5) 4 2.75 (1.71) 1 20 (–)
‡
Where N represents the number of outbreaks in which the base event was scored.
9 H. L. Risebro et al. | Fault tree analysis of the causes of waterborne outbreaks Journal of Water and Health | 05.Suppl 1 | 2007
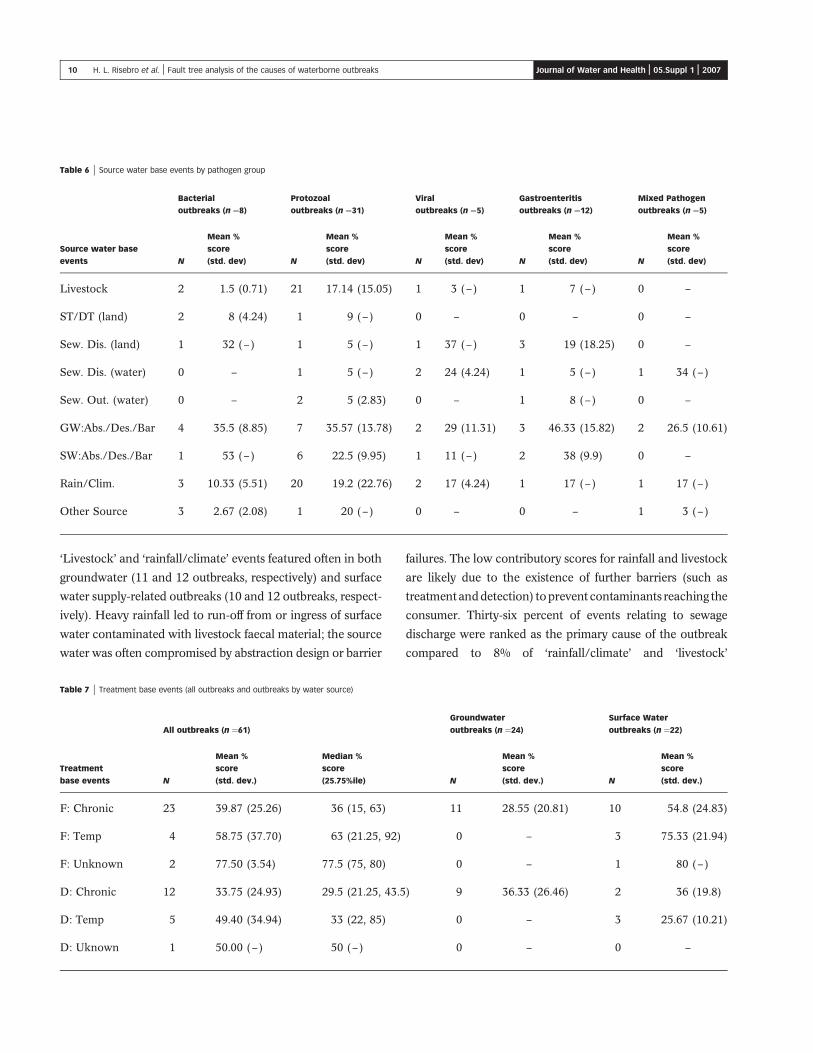
‘Livestock’ and ‘rainfall/climate’ events featured often in both
groundwater (11 and 12 outbreaks, respectively) and surface
water supply-related outbreaks (10 and 12 outbreaks, respect-
ively). Heavy rainfall led to run-off from or ingress of surface
water contaminated with livestock faecal material; the source
water was often compromised by abstraction design or barrier
failures. The low contributory scores for rainfall and livestock
are likely due to the existence of further barriers (such as
treatmentanddetection) toprevent contaminants reaching the
consumer. Thirty-six percent of events relating to sewage
discharge were ranked as the primary cause of the outbreak
compared to 8% of ‘rainfall/climate’ and ‘livestock’
Table 6 | Source water base events by pathogen group
Bacterial
outbreaks (n ¼8)
Protozoal
outbreaks (n ¼31)
Viral
outbreaks (n ¼5)
Gastroenteritis
outbreaks (n ¼12)
Mixed Pathogen
outbreaks (n ¼5)
Source water base
events N
Mean %
score
(std. dev) N
Mean %
score
(std. dev) N
Mean %
score
(std. dev) N
Mean %
score
(std. dev) N
Mean %
score
(std. dev)
Livestock 2 1.5 (0.71) 21 17.14 (15.05) 1 3 (–) 1 7 (–) 0 –
ST/DT (land) 2 8 (4.24) 1 9 (–) 0 – 0 – 0 –
Sew. Dis. (land) 1 32 (–) 1 5 (–) 1 37 (–) 3 19 (18.25) 0 –
Sew. Dis. (water) 0 – 1 5 (–) 2 24 (4.24) 1 5 (–) 1 34 (–)
Sew. Out. (water) 0 – 2 5 (2.83) 0 – 1 8 (–) 0 –
GW:Abs./Des./Bar 4 35.5 (8.85) 7 35.57 (13.78) 2 29 (11.31) 3 46.33 (15.82) 2 26.5 (10.61)
SW:Abs./Des./Bar 1 53 (–) 6 22.5 (9.95) 1 11 (–) 2 38 (9.9) 0 –
Rain/Clim. 3 10.33 (5.51) 20 19.2 (22.76) 2 17 (4.24) 1 17 (–) 1 17 (–)
Other Source 3 2.67 (2.08) 1 20 (–) 0 – 0 – 1 3 (–)
Table 7 | Treatment base events (all outbreaks and outbreaks by water source)
All outbreaks (n ¼61)
Groundwater
outbreaks (n ¼24)
Surface Water
outbreaks (n ¼22)
Treatment
base events N
Mean %
score
(std. dev.)
Median %
score
(25.75%ile) N
Mean %
score
(std. dev.) N
Mean %
score
(std. dev.)
F: Chronic 23 39.87 (25.26) 36 (15, 63) 11 28.55 (20.81) 10 54.8 (24.83)
F: Temp 4 58.75 (37.70) 63 (21.25, 92) 0 – 3 75.33 (21.94)
F: Unknown 2 77.50 (3.54) 77.5 (75, 80) 0 – 1 80 (–)
D: Chronic 12 33.75 (24.93) 29.5 (21.25, 43.5) 9 36.33 (26.46) 2 36 (19.8)
D: Temp 5 49.40 (34.94) 33 (22, 85) 0 – 3 25.67 (10.21)
D: Uknown 1 50.00 (–) 50 (–) 0 – 0 –
10 H. L. Risebro et al. | Fault tree analysis of the causes of waterborne outbreaks Journal of Water and Health | 05.Suppl 1 | 2007
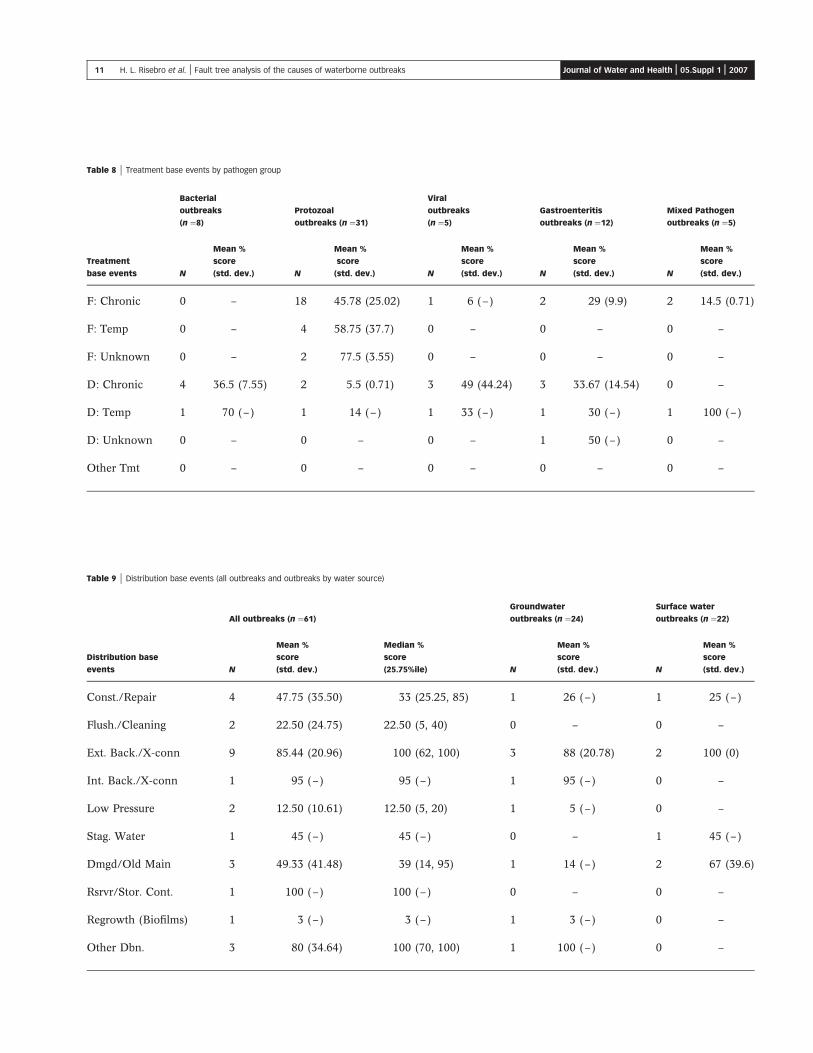
Table 8 | Treatment base events by pathogen group
Bacterial
outbreaks
(n ¼8)
Protozoal
outbreaks (n ¼31)
Viral
outbreaks
(n ¼5)
Gastroenteritis
outbreaks (n ¼12)
Mixed Pathogen
outbreaks (n ¼5)
Treatment
base events N
Mean %
score
(std. dev.) N
Mean %
score
(std. dev.) N
Mean %
score
(std. dev.) N
Mean %
score
(std. dev.) N
Mean %
score
(std. dev.)
F: Chronic 0 – 18 45.78 (25.02) 1 6 (–) 2 29 (9.9) 2 14.5 (0.71)
F: Temp 0 – 4 58.75 (37.7) 0 – 0 – 0 –
F: Unknown 0 – 2 77.5 (3.55) 0 – 0 – 0 –
D: Chronic 4 36.5 (7.55) 2 5.5 (0.71) 3 49 (44.24) 3 33.67 (14.54) 0 –
D: Temp 1 70 (–) 1 14 (–) 1 33 (–) 1 30 (–) 1 100 (–)
D: Unknown 0 – 0 – 0 – 1 50 (–) 0 –
Other Tmt 0 – 0 – 0 – 0 – 0 –
Table 9 | Distribution base events (all outbreaks and outbreaks by water source)
All outbreaks (n ¼61)
Groundwater
outbreaks (n ¼24)
Surface water
outbreaks (n ¼22)
Distribution base
events N
Mean %
score
(std. dev.)
Median %
score
(25.75%ile) N
Mean %
score
(std. dev.) N
Mean %
score
(std. dev.)
Const./Repair 4 47.75 (35.50) 33 (25.25, 85) 1 26 (–) 1 25 (–)
Flush./Cleaning 2 22.50 (24.75) 22.50 (5, 40) 0 – 0 –
Ext. Back./X-conn 9 85.44 (20.96) 100 (62, 100) 3 88 (20.78) 2 100 (0)
Int. Back./X-conn 1 95 (–) 95 (–) 1 95 (–) 0 –
Low Pressure 2 12.50 (10.61) 12.50 (5, 20) 1 5 (–) 0 –
Stag. Water 1 45 (–) 45 (–) 0 – 1 45 (–)
Dmgd/Old Main 3 49.33 (41.48) 39 (14, 95) 1 14 (–) 2 67 (39.6)
Rsrvr/Stor. Cont. 1 100 (–) 100 (–) 0 – 0 –
Regrowth (Biofilms) 1 3 (–) 3 (–) 1 3 (–) 0 –
Other Dbn. 3 80 (34.64) 100 (70, 100) 1 100 (–) 0 –
11 H. L. Risebro et al. | Fault tree analysis of the causes of waterborne outbreaks Journal of Water and Health | 05.Suppl 1 | 2007
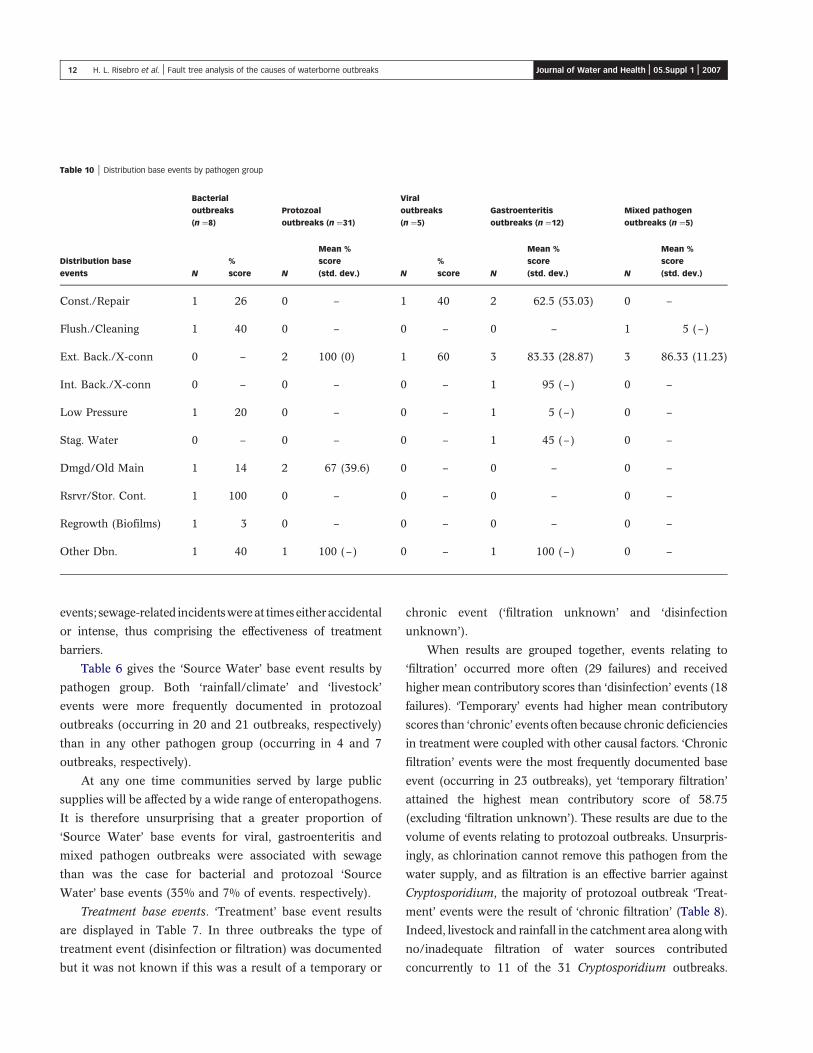
events; sewage-related incidentswereat timeseitheraccidental
or intense, thus comprising the effectiveness of treatment
barriers.
Table 6 gives the ‘Source Water’ base event results by
pathogen group. Both ‘rainfall/climate’ and ‘livestock’
events were more frequently documented in protozoal
outbreaks (occurring in 20 and 21 outbreaks, respectively)
than in any other pathogen group (occurring in 4 and 7
outbreaks, respectively).
At any one time communities served by large public
supplies will be affected by a wide range of enteropathogens.
It is therefore unsurprising that a greater proportion of
‘Source Water’ base events for viral, gastroenteritis and
mixed pathogen outbreaks were associated with sewage
than was the case for bacterial and protozoal ‘Source
Water’ base events (35% and 7% of events. respectively).
Treatment base events. ‘Treatment’ base event results
are displayed in Table 7. In three outbreaks the type of
treatment event (disinfection or filtration) was documented
but it was not known if this was a result of a temporary or
chronic event (‘filtration unknown’ and ‘disinfection
unknown’).
When results are grouped together, events relating to
‘filtration’ occurred more often (29 failures) and received
higher mean contributory scores than ‘disinfection’ events (18
failures). ‘Temporary’ events had higher mean contributory
scores than ‘chronic’ events often because chronic deficiencies
in treatment were coupled with other causal factors. ‘Chronic
filtration’ events were the most frequently documented base
event (occurring in 23 outbreaks), yet ‘temporary filtration’
attained the highest mean contributory score of 58.75
(excluding ‘filtration unknown’). These results are due to the
volume of events relating to protozoal outbreaks. Unsurpris-
ingly, as chlorination cannot remove this pathogen from the
water supply, and as filtration is an effective barrier against
Cryptosporidium, the majority of protozoal outbreak ‘Treat-
ment’ events were the result of ‘chronic filtration’ (Table 8).
Indeed, livestock and rainfall in the catchment area along with
no/inadequate filtration of water sources contributed
concurrently to 11 of the 31 Cryptosporidium outbreaks.
Table 10 | Distribution base events by pathogen group
Bacterial
outbreaks
(n ¼8)
Protozoal
outbreaks (n ¼31)
Viral
outbreaks
(n ¼5)
Gastroenteritis
outbreaks (n ¼12)
Mixed pathogen
outbreaks (n ¼5)
Distribution base
events N
%
score N
Mean %
score
(std. dev.) N
%
score N
Mean %
score
(std. dev.) N
Mean %
score
(std. dev.)
Const./Repair 1 26 0 – 1 40 2 62.5 (53.03) 0 –
Flush./Cleaning 1 40 0 – 0 – 0 – 1 5 (–)
Ext. Back./X-conn 0 – 2 100 (0) 1 60 3 83.33 (28.87) 3 86.33 (11.23)
Int. Back./X-conn 0 – 0 – 0 – 1 95 (–) 0 –
Low Pressure 1 20 0 – 0 – 1 5 (–) 0 –
Stag. Water 0 – 0 – 0 – 1 45 (–) 0 –
Dmgd/Old Main 1 14 2 67 (39.6) 0 – 0 – 0 –
Rsrvr/Stor. Cont. 1 100 0 – 0 – 0 – 0 –
Regrowth (Biofilms) 1 3 0 – 0 – 0 – 0 –
Other Dbn. 1 40 1 100 (–) 0 – 1 100 (–) 0 –
12 H. L. Risebro et al. | Fault tree analysis of the causes of waterborne outbreaks Journal of Water and Health | 05.Suppl 1 | 2007
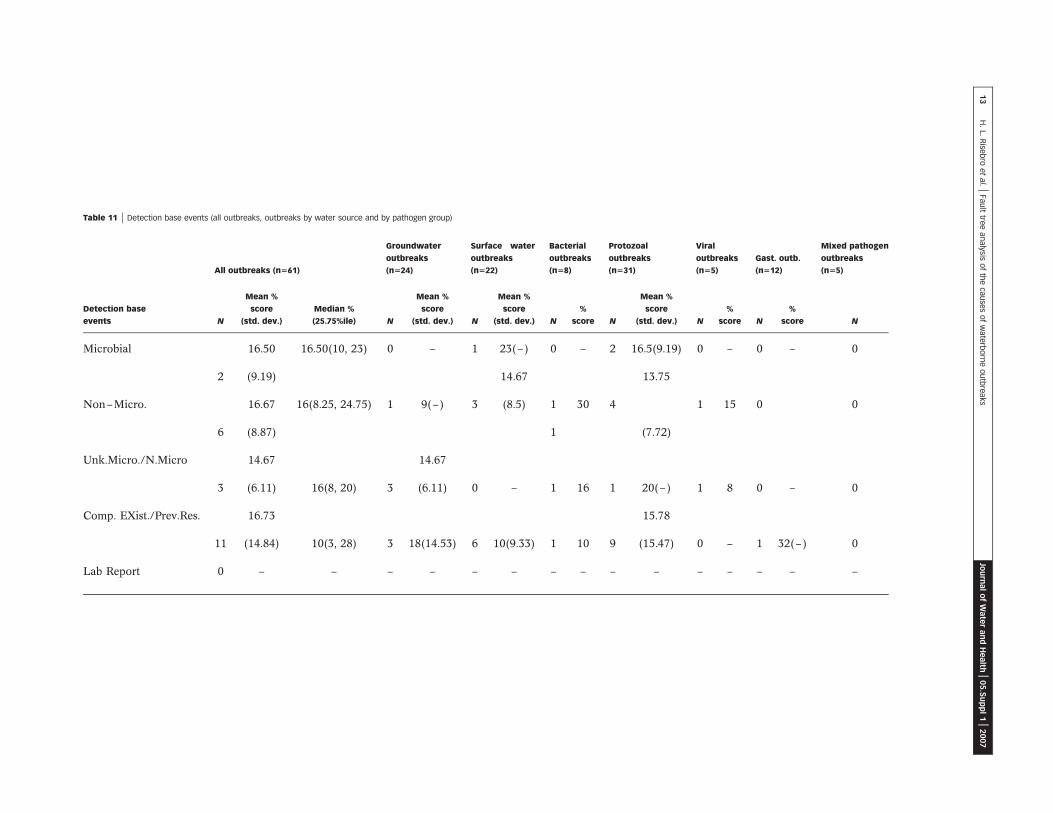
Table 11 | Detection base events (all outbreaks, outbreaks by water source and by pathogen group)
All outbreaks (n561)
Groundwater
outbreaks
(n524)
Surface water
outbreaks
(n522)
Bacterial
outbreaks
(n58)
Protozoal
outbreaks
(n531)
Viral
outbreaks
(n55)
Gast. outb.
(n512)
Mixed pathogen
outbreaks
(n55)
Detection base
events N
Mean %
score
(std. dev.)
Median %
(25.75%ile) N
Mean %
score
(std. dev.) N
Mean %
score
(std. dev.) N
%
score N
Mean %
score
(std. dev.) N
%
score N
%
score N
Microbial 16.50 16.50(10, 23) 0 – 1 23(–) 0 – 2 16.5(9.19) 0 – 0 – 0
2 (9.19) 14.67 13.75
Non–Micro. 16.67 16(8.25, 24.75) 1 9(–) 3 (8.5) 1 30 4 1 15 0 0
6 (8.87) 1 (7.72)
Unk.Micro./N.Micro 14.67 14.67
3 (6.11) 16(8, 20) 3 (6.11) 0 – 1 16 1 20(–) 1 8 0 – 0
Comp. EXist./Prev.Res. 16.73 15.78
11 (14.84) 10(3, 28) 3 18(14.53) 6 10(9.33) 1 10 9 (15.47) 0 – 1 32(–) 0
Lab Report 0 – – – – – – – – – – – – – – –
13
H.
L.R
iseb
roetal. |
Fau
lttre
ean
alysis
of
the
cau
ses
of
wate
rbo
rne
ou
tbre
aks
Journ
alofWaterandHealth
|05.Suppl1|2007

Three-quarters of viral and gastroenteritis ‘Treatment’ events
and all bacterial ‘Treatment ‘events were related to ‘disinfec-
tion’ as this is a key mode of pathogen removal (Table 8). The
highest mean contributory score for surface water supply-
related outbreaks was for ‘temporary filtration’ (excluding
‘filtration unknown’) and the highest mean contributory score
for groundwater supply-related outbreaks was for ‘chronic
disinfection’.
Eighteen of 24 groundwater outbreaks had treatment
deficiencies (Table 4); all of these deficiencies were chronic
(Table 7). The majority of surface water outbreak treatment
deficiencies were related to chronic filtration (53%), yet the
remaining causative events were more evenly distributed
through chronic and temporary deficiencies (Table 7).
These findings highlight the need for continual assessment
of groundwater sources and treatment regimes.
Distribution base events. Table 9 displays the results for 10
‘Distribution’ system base event categories. ‘Backflow/cross-
connection’ causedbyauser external to thewater supplier (such
as an irrigation user) had both a high frequency (occurring in 9
outbreaks) and a high mean contributory score of 85.44; indeed,
in all 9 outbreaks this event ranked as the primary cause. The
‘external backflow/cross-connection’ mean contributory score
remained high for both groundwater and surface water supply-
related outbreaks. These findings emphasise the need for
effective communication and monitoring strategies in relation
to stakeholders, landowners and vulnerable areas of the
distribution system. ‘Construction/repair’ and ‘damaged/old
main/conduit’ events were reported less often but warrant
similar internal communication, monitoring and alert strategies.
Table 10 displays summary results for the ‘Distribution’
base events by pathogen group. Distribution system base
events were fairly evenly dispersed across pathogen groups.
Nine ‘distribution system’ events were scored in 7 of the 12
gastroenteritis outbreaks; these events were distributed
across 6 base event categories. The 9 outbreaks with
‘external backflow/cross-connection’ events were distribu-
ted across 4 of the pathogen groups.
Detection base events. ‘Detection’ base events, organised
by water source and pathogen group, are depicted in Table 11.
In three outbreaks it was unclear whether the ‘inadequate
monitoring’ reported by authors was related to microbial or
non-microbial parameters. Mean contributory scores for the
four scoring base events were low (ranging from 14.67 to
16.73); indeed, there were no documented laboratory report-
ing events and no ‘Detection’ base events related to mixed
pathogen outbreaks. However, this may only reflect institu-
tionalised expectations about the relevance and role of water
analyses and reporting in outbreak prevention.
‘Comprehension of existing or previous results’ was the
most frequently identified base event occurring in 11 out-
breaks, 9 of which were protozoal outbreaks. This event
occurred most frequently in outbreaks related to surface water
supplies (6 outbreaks), and yet it was deemed more influential
in groundwater supply-related outbreaks (mean contributory
score of 18). Turbidity fluctuations and groundwater supplies
under the influence of surface water were events documented
by outbreak investigators; although these events were some-
times evident from data available to water suppliers, the
evidence was either not fully explored or understood. The
underlying message here is that many of the failures leading to
outbreaks are repeat incidents which could be avoided with
appropriate staff training and reappraisal of historical records.
As solitary events do not always lead directly to outbreaks,
familiaritywith these incidents ona day-to-day basis is likely to
reduce the perception of their relevance.
CONCLUSION
Analysis of a wide range of outbreaks associated with public
drinking water supplies has enabled the identification of key
causative factors involved in enteric disease outbreaks.
Most notably, distribution system failures were highlighted
as causative factors which often occur as a solitary events
contributing considerably towards the occurrence of indi-
vidual outbreaks (mean contributory score of 87.42).
Improving collaborative links with potential distribution
system users and increased monitoring in vulnerable areas
of the distribution system network may reduce the risk of a
cross-connection incident.
The results demonstrated that numerous causative
events are associated with such outbreaks (a mean of 3.25
events per outbreak). Source water contamination and
treatment system failures occurred frequently (each in
41 outbreaks) and concurrently (together in 34 outbreaks).
In 19 outbreaks, the presence of livestock in the catchment
area coupled with rainfall led to surface water run-off and
14 H. L. Risebro et al. | Fault tree analysis of the causes of waterborne outbreaks Journal of Water and Health | 05.Suppl 1 | 2007
ingress contaminating the groundwater or surface water
sources. Reflecting the key modes of pathogen removal,
90% of treatment events for protozoal outbreaks were
related to filtration yet 75% of treatment events for
bacterial, viral, gastroenteritis and mixed pathogen out-
breaks were related to disinfection deficiencies. No/inade-
quate comprehension or no action upon existing/previous
water quality monitoring results was recorded in 11
outbreaks. For some outbreaks it was noted by investigative
teams that chronic, long-term treatment deficiencies were
the result of poor understanding of or action upon microbial
and non-microbial results. Communicating with potential
water supply and catchment area users, and both monitor-
ing and acting upon fluctuations in rainfall and microbial
and non-microbial parameters, were areas highlighted for
improvement by outbreak investigation teams.
Of source water base events, ‘groundwater abstraction/
design/barrier failure’ received the highest mean contributory
score of 35.61 and all of the treatment base events for
groundwater outbreaks were chronic in nature (20 events).
Although groundwater is often considered to be of better
quality than surface water, this assumption can evoke a false
sense of security. Groundwater abstraction locations require
continual assessment to ensure that they are not damaged
and/or under the influence of surface water. Surface water
sources also require frequent assessment and inspection; the
majority of surface water outbreak treatment events were the
result of chronic filtration deficiencies (53%).
Inadequate correction and/or response to an alerted
event which may put the public at risk was not reported in
any of the 61 outbreaks examined. A failure to respond or
communicate risk to the public is suggestive of negligence
on the part of, for example, a water provider, treatment
operatives, the local council or the government; discussion
of these factors may not be a focal point in medical
literature – the scope may require expansion. Furthermore,
many borderline issues relating to prolonged negligence on
the part of water providers are likely to be classified under
detection failures (for example, inadequate action based
upon historical water quality results).
Many of the outbreaks identified and included in this
article were UK Cryptosporidium outbreaks. Different
approaches to waterborne disease surveillance can lead to
variation in the effectiveness and nature of outbreak
detection and reporting across member states (Risebro &
Hunter 2007). Not all outbreaks will be detected nor
reported let alone published. Information about outbreaks
in the UK was likely to be more complete as authors had
greater access to further information concerning these
outbreaks. Splitting the data by pathogen group attempts
to make the analysis more informative.
Only 61 of the 86 outbreaks identified had information on
the cause of the outbreak and so were included in the fault tree
analysis. The volume and nature of outbreaks and information
identified from literature sources and reported in articles is
subject to publication bias, hot-topic bias and outcome
reporting bias. O’ Brien et al. (2006) calculated various
Publication Bias Indices (PBI) in a comparison of information
about foodborne outbreaks from national surveillance data
and peer-reviewed literature sources. When categorised into
type of causative fault (e.g. cross-contamination or inadequate
heat treatment) most faults were over-represented in the
literature outbreaks compared to outbreaks from the surveil-
lance dataset.Whencategorised bypathogen/toxin,outbreaks
of Campylobacteriosis and Escherichia coli O157 were
reported more often by literature outbreaks than by surveil-
lance dataset outbreaks (PBI of 4.3 and 5.0 (p,0.001),
respectively). Although the study by O’Brien and colleagues
relates to foodborne rather than waterborne infections, it
nonetheless demonstrates that information gathered from
literature-based sources can provide a distorted viewpoint
which does not necessarily reflect reality. The level of detail
provided in literature sources used in this review of outbreaks
related to public water supplies varied substantially, as did the
documented accuracy and completeness of epidemiological
investigation. It was difficult to determine if certain investi-
gations had been overlooked or if they were simply not
reported (outcome reporting bias). Asa result, not all causative
factors may have been included in the fault tree analysis.
Although 13 outbreaks involved just one causal event,
unreported and undetected causal events may have contrib-
uted. Accurately recording and reporting events and investi-
gative findings from outbreaks generates an opportunity for
others to learn from hindsight; it may prove beneficial to
develop guidelines to standardise the reporting of outbreaks in
the literature.
In addition to unreported factors, legislation and guide-
lines for water quality and public health policy governing EU
15 H. L. Risebro et al. | Fault tree analysis of the causes of waterborne outbreaks Journal of Water and Health | 05.Suppl 1 | 2007
member states were not examined. It is likely that such
legislation and guidelines influenced the likelihood of certain
causal eventsat different historical time points. Equally so, over
the years scientific knowledge and expertise has advanced;
problems relating to the absence of certain treatment practices
and catchment protection programmes occurring in the early
1990s may not be seen in the early part of the 21st century.
Here the fault tree has been designed to be applicable to
multiple outbreaks of enteric disease related to public
drinking water supplies. However, the fault tree could be
tailored to suit different drinking water systems, pathways
and causative factors including human factors, mechanical
failures, and additional point and non-point contaminant
sources. In-depth analysis of further drinking water out-
breaks involving different etiologic agents and drinking
water supplies is required. Individual water companies
could use such information to prioritise areas of concern
and aid distribution of resources for outbreak prevention
strategies.
ACKNOWLEDGEMENTS
The authors would like to express their thanks to the
European Commission for funding the work presented in
this paper (contract no. EVK1-CT-2002-00123). MD was
also supported by the Gulbenkian Foundation and the
British Council. The authors would like to thank the many
professionals who provided further information and docu-
mentation on individual outbreaks, including: Volker
Gornik and Thomas Kisteman (Institute of Hygiene and
Public Health, University of Bonn, Germany); Henriette de
Valk and Pascal Beaudeau (Institute de Veille Sanitaire
(InVS), France); Jennifer Clay (North Cumbria Public
Health, UK); Richard Elson, Gordon Nichols, Bengu Said
and Bryan Smith (HPA, UK); Jean-Francois Loret (Suez
Environment, France); and Torbjorn Lindberg (National
Food Administration, Sweden).
This paper was presented in part at the International
Water Association (IWA) 13th International Symposium on
Health Related Water Microbiology (Watermicro), 4–9
September 2005, Swansea, Wales. This article also forms a
more detailed expansion to work summarised elsewhere
(Risebro et al. 2006).
DISCLAIMER
This paper was prepared while Miguel Doria was at the
Centre for Environmental Risk, University of East Anglia,
UK. The opinions and assertions contained in this paper
should not be considered as reflecting the views or carrying
the endorsement of the United Nations Educational,
Scientific and Cultural Organization.
REFERENCES
Andersson, Y., De Jong, B. & Studahl, A. 1997 Waterborne
Campylobacter in Sweden: the cost of an outbreak. Wat. Sci.
Technol. 35(11–12), 11–14.
Corso, P. S., Kramer, M. H., Blair, K. A., Addiss, D. G., Davis, J. P.
& Haddix, A. C. 2003 Cost of illness in the 1993 waterborne
Cryptosporidium outbreak Milwaukee, Wisconsin. Emerging
Infect. Dis. 9(4), 426–431.
Craun, G. F., Calderon, R. L. & Nwachuku, N. 2003 Causes of
waterborne outbreaks reported in the United States,
1991-1998. In Drinking Water and Infectious Disease:
Establishing the Links (ed. P. R. Hunter, M. Waite & E.
Ronchi), IWA, London. pp. 105–117.
Davison, A., Davis, S. & Deere, D. 1999 Quality assurance and due
diligence for water – Can HACCP deliver? In: AWWA/
WMAA Cleaner Production in the Food and Beverage
Industries Conference, Hobart, 1–3 September.
Deere, D., Stevens, M., Davison, A., Helm, G. & Dufour, A. 2001
Management strategies. In: World Health Organization (WHO)
Water Quality: Guidelines, Standards and Health. (ed. L.
Fewtrell & J. Bartram), IWA Publishing, London. pp. 257–288.
Haimes, Y. Y. 2004 Risk Modelling, Assessment, and Management,
2nd edn. Wiley, New York.
Hrudey, S. E. & Hrudey, E. J. 2004 Safe Drinking Water. IWA
Publishing, London.
Hrudey, S. E., Payment, P., Huck, P. M., Gillham, R. W. & Hrudey,
E. J. 2003 A fatal waterborne disease epidemic in Walkerton
Ontario: comparison with other waterborne outbreaks in the
developed world. Wat. Sci. Technol. 47(3), 7–14.
Laursen, E., Mygind, O., Rasmussen, B. & Ronne, T. 1994
Gastroenteritis: a waterborne outbreak affecting 1,600 people
in a small Danish town. J. Epidemiol. Community Health
48(5), 453–458.
McCann, B. 1999 UK counts cost of Crypto protection. Wat. Qual.
Int., 4 May/June.
O’Brien, S. J., Gillespie, I. A., Sivanesan, M. A., Elson, R., Hughes,
C. & Adak, G. K. 2006 Publication bias in foodborne
outbreaks of infectious intestinal disease and its implications
for evidence-based food policy. England and Wales
1992–2003. Epidemiol. Infect. 134(4), 667–674.
Risebro, H. L., Doria, M. F., Yip, H. & Hunter, P. R. 2006 Intestinal
illness through drinking water in Europe. In MicroRisk:
16 H. L. Risebro et al. | Fault tree analysis of the causes of waterborne outbreaks Journal of Water and Health | 05.Suppl 1 | 2007
Quantitative Microbial Risk Assessment in the Water Safety
Plan (ed. G. Medema). Funded by European Commission,
(contract no. EVK1-CT-2002-00123), ch 1. Available at:
http://217.77.141.80/clueadeau/microrisk/uploads/
microrisk_intestinal_illness_through_drinking_water.pdf.
Risebro, H. L. & Hunter, P. R. 2007 Surveillance of Waterborne
Disease in European Member States: A Qualitative Study.
J. Wat. Health 5 (Suppl 1), 19–38.
Schuster, C. J., Ellis, A. G., Robertson, W. J., Charon, D. F.,
Aramani, J. J., Marshall, B. J. & Medeiros, D. T. 2005
Infectious disease outbreaks related to drinking water in
Canada 1974-2001. Can. J. Public Health 96(4), 254–258.
Stevens, M., McConnell, S., Nadebaum, P.R., Chapman, M.,
Ananthakumar, S. & McNeil, J. 1995 Drinking water quality
and treatment requirements: a risk-based approach. Water 22
(November/December), 12–16.
Tillet, H. E., de Louvios, J. & Wall, P. G. 1998 Surveillance of
outbreaks of waterborne disease: categorizing levels of
evidence. Epidemiol. Infect. 120(1), 37–42.
APPENDIX: PRIMARY REFERENCES OF FTA
OUTBREAKS
Alamanos, Y., Maipa, V., Levidiotou, S. & Gessouli, E. 2000 A
community waterborne outbreak of gastro-enteritis attributed
to shigella sonnei. Epidemiol. Infect. 125 (3), 499–503.
Atherton, F., Newman, C. P. & Casemore, D. P. 1995 An outbreak
of waterborne cryptosporidiosis associated with a public water
supply in the UK. Epidemiol. Infect. 115 (1), 123–131.
Bouchier, I.A.D. 2001 Cryptosporidium in Water Supplies.
Department of the Environment, Transport and the Regions,
DWI, London.
Bridgman, S.A. et al. 1994 Report of an Outbreak of
Cryptosporidiosis in North Warrington between November
1992 and February 1993. North Cheshire Health, April.
Carrique-Mas, J. et al. 2003 A norwalk-like virus waterborne
community outbreak in a Swedish village during peak holiday
season. Epidemiol. Infect. 131 (1), 737–744.
Chover Lara, J.L. et al. 1995 Brote de Gastroenteritis Asociado al
Consumo de Agua, Posiblemente Producido Por Virus Tipo
Norwalk O Semejantes. (Gastroenteritis outbreak associated
with water consumption, possibly caused by Norwalk or
Norwalk-like virus) (in Spanish). Revista Espanola de Salud
Publica 69 (2), 243–254.
CDR 1996 Surveillance of waterborne disease and water quality:
January to June 1996. CDR 6 (34), 301.
CDR 2001 Surveillance of waterborne disease and water quality:
July to December 2000. CDR Weekly 15 Feb.
CDR 2003 Surveillance of waterborne disease and water quality:
July to December 2002. CDR Weekly 13 (26).
CDSC (Anglia and Oxford). 1997 An outbreak of Cryptosporidiosis
in North Thames, Spring. Report of the Incident Management
Team, July 1997. Chaired by Lorna Willocks, regional
Epidemiologist. CDSC, Cambridge.
de Jong, B. & Andersson, Y. 1997 Waterborne Cryptosporidiosis - a
single outbreak in Sweden. In: Proceedings of the
International Symposium on Waterborne Cryptosporidium,
March 1997, Newport Beach, CA (Fricker, C.R., Clancy, J.L. &
Rochelle, P.A. (Eds.)). American Water Works Association,
Denver, CO, p 367.
Department of Public Health Medicine 2000 Report of an Outbreak
of Cryptosporidiosis in the Eastern Board Area during April
and May 2000. Department of Public Health Medicine/
Eastern Health and Social Services Board.
Department of Public Health Medicine 2001 Report of an Outbreak
of Cryptosporidiosis during August and September 2000 in the
Lisburn, Poleglass and Dunmurry Areas of the Eastern Board.
Department of Public Health Medicine/Eastern Health and
Social Services Board. Available online: http://www.ehssb.n-i.
nhs.uk/ebweb.nsf/b683ba70390d0b5c8025700a00493642/
1e3f6b27892286c780256b14006593d7/$FILE/Cryprpt.pdf.
Deshayes, F. & Schmitt, M. 2001 Pollution de reseau d’eau potable a
Strasbourg et survenue concomitante de gastro-enterites - Mai
2000. BEH: Institut de veille sanitaire, 2, 5–8.
Fernandes, T.M.A., de Roda-Husman, A.M., Schout, C., Vennema,
H. & van Duynhoven, Y.T.H.P. 2007 Gastronenteritis
associated with accidental contamination of drinking water
with partially treated water. Epidemiol. Infect. 135(5), 818-26
Fogarty, J. et al. 1995 Illness in a community associated with an
episode of water contamination with sewage. Epidemiol.
Infect. 114 (2), 289–295.
Furtado, C., Adak, G.K., Stuart, J.M., Wall, P.G., Evans, H.S.,
Casemore, D.P. 1998 Outbreaks of waterborne infectious
intestinal disease in England and Wales, 1992-1995.
Epidemiol. Infect. 121(1), 109–119.
Gillooly, M. 2003 Outbreak of Cryptosporidium in a public water
supply in County Westmeath, Ireland. Environ. Health
Scotland 15 (4), 10–15.
Godoy, P. et al. 2002 Brote Comunitario de Gastroenteritis por
campylobacter Jejuni Originado por el Consumo de Agua del
Suministro Publico. (Outbreak of gastroenteritis caused by
campylobacter jejuni transmitted through drinking water) (in
Spanish). Medicina Clinica 119 (18), 695–698 (erratum 2003
Medicina Clinica 120 (5), 174).
Godoy, P. et al. 2003 Brote de Gastroenteritis por Agua Potable de
Sumiistro Publico. (Waterborne outbreak of gastroenteritis
transmitted through the public water supply) (in Spanish).
Gaceta Sanitaria 17 (3), 204–209.
Gofti-Laroche, L. et al. 2001 A new analytical tool to assess health
risks associated with the virological quality of drinking water
(EMIRA study). Wat. Sci. Technol. 43 (12), 39–48.
Gofti-Laroche, L. & Schmitt, M. 2003 Epidemie de gastro-enterites
liee a la pollution du reseau de distribution d’eau potable de
la commune de Divonne-les-Bains, Ain (01). Aout-Septembre
2003. (Gastro-enteritis outbreak related to a water distribution
system contamination in Divonne-les-Bains, Ain district) (in
French). Rhone-Alpes-Auvergne, CIRE, Novembre.
Gornik, V., Behringer, K., Kolb, B. & Exner, M. 2000 Ersta
giardiasisausbruch im zusammenhang mit kontaminiertem
17 H. L. Risebro et al. | Fault tree analysis of the causes of waterborne outbreaks Journal of Water and Health | 05.Suppl 1 | 2007
trinkwasser in Deutschland. (First giardiasis-outbreak
associated with contaminated water supply in Germany) (in
German). Bundesgesundheitsbl - Gesundheitsforsch –
Gesundheitsschutz 44, 351–357.
Gutteridge, W. & Haworth, E.A. 1994 An outbreak of
gastrointestinal illness associated with contamination of the
mains supply by river water. CDR Rev. 4 (4), R50–R51.
Guyonnet, J.P. & Claudet, J. 2002 Epidemie de gastro-enterite aigue a
cryptosporidium liee a la pollution des eaux d’alimentation de la
ville de Sete. Techniques Sciences Methodes 97 (1), 23–29.
Hanninen, M. L. et al. 2003 Detection and typing of campylobacter
jejuni and campylobacter coli and analysis of indicator
organisms in three waterborne outbreaks in Finland. Appl.
Environ. Microbiol. 69 (3), 1391–1396.
Hardie, R.M. et al. 1999 Infectious diarrhoea in tourists staying in a
resort hotel. Emerg. Infect. Dis. 5 (1), 168–171.
Institut de Veille Sanitaire et Ministere de l’emploi et de la
solidarite 2001 Epidemie de gastro-enterites a germes multiples
liee a la consommation de l’eau de distribution, Gourdon, Lot
(46). (Waterborne gastro-enteritis outbreaks due to multiple
organisms), 1–48.
Institut de Veille Sanitaire 2003 Epidemie de gastro-enterite a
cryptosporidium, Dracy-le-Fort, Saone et Loire (71), septembre
2001. (Water-borne outbreak of cryptosporidiosis). 1–72.
Irvine, H. 2001 Report of an Outbreak of Cryptosporidiosis in the
Area Supplied by Milngavie Treatment Works - Loch Katrine
Water. NHS Greater Glasgow, November.
Jimenez, M., Fuster, C., Raya, C., Diaz, A. & Carvajal, J. 1996 Brote
de Disenterıa por shigella boydii en la Comarca de El Bierzo.
(Outbreak of shigella boydii dysentery in the county of El
Bierzo) (in Spanish). Enfermedades Infecciosas y
Microbiologia Clinica 14(3), 155–159.
Jones, I.G. & Roworth, M. 1996 An outbreak of Escherichia coli
0157 and campylobacteriosis associated with contamination of
drinking water supply. Public Health 110, 277–282.
Joseph, C., Hamilton, G., O’Connor, M., Nicholas, S., Marshall, R.,
Stanwell-Smith, R., Sims, R., Ndawula, E., Casemore, D.,
Gallagher, P. & Harnett, P. 1991 Cryptosporidiosis in the Isle
of Thanet: an outbreak associated with local drinking water.
Epidemiol. Infect. 107, 509–519.
Kukkula, M., Arstila, P., Klossner, M.-L., Maunula, L, Bonsdorff,
C.H. & Jaatinen P. 1997 Waterborne outbreak of viral
gastroenteritis. Scand. J. Infect. Dis. 29 (4), 415–418.
Kukkula, M., Maunula, L., Silvennoinen, E. & von Bonsdorff, C. H.
1999. Outbreak of viral gastroenteritis due to drinking water
contaminated by Norwalk-like viruses. J. Infect. Dis. 180 (6),
1771–1776.
Kuusi, M. et al. 2004 An outbreak of gastroenteritis from a non-
chlorinated community water supply. J. Epidemiol. Community
Health 58 (4), 273–277.
Kuusi, M., Nuorti, J. P., Maunula, L., Miettenen, I., Pesonen, H. &
von Bonsdorff, C.H. 2004 Internet use and epidemiologic
investigation of gastroenteritis outbreak. Emerg. Infect. Dis. 10,
447–450.
Lopez, H. B. & Jimenez dlH, Maeso, V. J. 1996 Estudio de un
Brote de Gastroenteritis de Transmision Hıdrica. (Study of an
outbreak of gastroenteritis transmitted by water) (in Spanish).
Atencion Primaria 17 (3), 234–235.
Marsh, J. et al. 1992 Cryptosporidiosis Outbreak, Spring 1992. West
Cumbria Health Authority.
McCarthy, N., de Jong, B., Ziese, T., Sjlund, R., Hjalt, C.A. & Giesecke,
J. 1998 Epidemiological explanation of gastro-enteritis in Sweden
in the absence of detailed microbiological information. Eur.
J. Epidemiol. 14, 711–718.
Morton, S. et al. 2000 Report of an Outbreak of Cryptosporidiosis
in the Clitheroe Area, March. East Lancashire Health
Authority on behalf of the outbreak control team.
RKI 2004 Zu einer Haufung vo Norovirs-Erkrankungen als Folge
verunreinigten Trinkwassers. Epidemiologisches Buelltin,
Robert Koch-Institut. 36, 301–302. Available at:http://www.
rki.de/cln_011/nn_243990/DE/Content/Infekt/EpidBull/
Archiv/2004/
36__04,templateId ¼ raw,property ¼ publicationFile.pdf/
36_04 (last accessed: 01/09/2006)
Rodriguez-Salinas, P.E. et al. 2000 Brote de Criptosporidiosis en
Guadarrama (Comumidad Autonoma de Madrid). (Outbreak
of cryptosporidiosis in Guadarrama (Autonomous Community
of Madrid)) (in Spanish). Revista Espanola de Salud Publica
74 (5–6), 527–536.
Samonis, G., Elting, L., Skoulika, E., Maraki, S. & Tselentis, Y.
1994 An outbreak of diarrhoeal disease attributed to shigella
sonnei. Epidemiol. Infect. 112 (2), 235–245.
SCIEH 2002 Cryptosporidiosis in Grampian. SCIEH Weekly Rep.
36 (2002/14), 93.
Smyth, B. et al. 2002 The Report of the Outbreak Control Team of
an Outbreak of Cryptosporidiosis during February/April 2001.
Eastern and Northern Health and Social Services Boards.
South Cumbria Health Authority. Suspected outbreak of
waterborne cryptosporidiosis, Barrow-in-Furness, Zone 045,
Spring 1992 (unpublished).
Tillaut, H., Encrenaz, N., Checlair, E., Alexandre-Bird, A., Gomes
Do Esperito Santo, E. & Beaudeau, P. 2004 Epidemie de
gastro-enterite, Isere, novembre 2002. (Gastro-enteritis
outbreak in Isere) (in French). BEH: Institut de Veille
Sanitaire 12, 47–48.
Tramarin, A., Fabris, P., Bishai, D., Selle, V. & De Lalla, F. 2002
Waterborne infections in the era of bioterrorism. Lancet
(North American Edn) 360 (9346), 1699.
Vincent, R.J. 1997 Assessment of Water Supply and Associated
Matters in Relation to the Incidence of Cryptosporidiosis in
Torbay in 1992. Department of the Environment, Transport
and the Regions (DETR), Drinking Water Inspectorate (DWI),
London.
Waite, W.M. 1997 Assessment of Water Supply and Associated
Matters in Relation to the Incidence of Cryptosporidiosis in
Torbay in August & September 1995. Drinking Water
Inspectorate, London.
18 H. L. Risebro et al. | Fault tree analysis of the causes of waterborne outbreaks Journal of Water and Health | 05.Suppl 1 | 2007