fault-tolerant monitor placement for out-of-band - rmcet.com
TRANSCRIPT

Atmos. Chem. Phys., 10, 4795–4807, 2010www.atmos-chem-phys.net/10/4795/2010/doi:10.5194/acp-10-4795-2010© Author(s) 2010. CC Attribution 3.0 License.
AtmosphericChemistry
and Physics
CCN predictions using simplified assumptions of organic aerosolcomposition and mixing state: a synthesis from six differentlocations
B. Ervens1,2, M. J. Cubison1, E. Andrews1,2, G. Feingold2, J. A. Ogren2, J. L. Jimenez1,3, P. K. Quinn4, T. S. Bates4,J. Wang5, Q. Zhang6, H. Coe7, M. Flynn7, and J. D. Allan8
1Cooperative Institute for Research in the Environmental Sciences (CIRES), University of Colorado, Boulder, CO, USA2NOAA Earth System Research Laboratory, Boulder, CO, USA3Department of Chemistry and Biochemistry, University of Colorado, Boulder, CO, USA4NOAA Pacific Marine Environmental Laboratory, Seattle, WA, USA5Brookhaven National Laboratory, 75 Rutherford Drive, Upton, NY, USA6Department of Environmental Toxicology, University of California, Davis, CA, USA7School of Earth, Atmospheric and Environmental Science, The University of Manchester, UK8National Centre for Atmospheric Science, School of Earth, Atmospheric and Environmental Sciences, The University ofManchester, Manchester, UK
Received: 9 September 2009 – Published in Atmos. Chem. Phys. Discuss.: 9 October 2009Revised: 11 May 2010 – Accepted: 16 May 2010 – Published: 26 May 2010
Abstract. An accurate but simple quantification of the frac-tion of aerosol particles that can act as cloud condensationnuclei (CCN) is needed for implementation in large-scalemodels. Data on aerosol size distribution, chemical compo-sition, and CCN concentration from six different locationshave been analyzed to explore the extent to which simple as-sumptions of composition and mixing state of the organicfraction can reproduce measured CCN number concentra-tions.
Fresher pollution aerosol as encountered in Riverside, CA,and the ship channel in Houston, TX, cannot be representedwithout knowledge of more complex (size-resolved) compo-sition. For aerosol that has experienced processing (MexicoCity, Holme Moss (UK), Point Reyes (CA), and CheboguePoint (Canada)), CCN can be predicted within a factor of twoassuming either externally or internally mixed soluble or-ganics although these simplified compositions/mixing statesmight not represent the actual properties of ambient aerosolpopulations, in agreement with many previous CCN studiesin the literature. Under typical conditions, a factor of two un-certainty in CCN concentration due to composition assump-
Correspondence to:B. Ervens([email protected])
tions translates to an uncertainty of∼15% in cloud drop con-centration, which might be adequate for large-scale modelsgiven the much larger uncertainty in cloudiness.
1 Introduction
Aerosol-cloud interactions represent one of the largest uncer-tainties in estimating the effects of aerosol on radiative forc-ing. One key parameter for this estimate is to determine whatfraction of aerosol particles can act as cloud condensation nu-clei (CCN) and form cloud droplets. The propensity of a par-ticle to form CCN depends on its size, chemical compositionand the supersaturation to which it is exposed. Whereas sizedistributions are routinely measured in field experiments, thefull characterization of the chemical composition presents amajor challenge since, in particular, the organic fraction ofparticles can be composed of hundreds of compounds withdifferent physicochemical properties (e.g., surface tension,solubility, degree of dissociation, molecular weight). In lab-oratory and theoretical studies, it has been shown that theseproperties can enhance or reduce the CCN ability of organicparticles as compared to better-characterized inorganic parti-cles (Corrigan and Novakov, 1999; Cruz and Pandis, 2000).For ambient particle populations, it is not feasible to consider
Published by Copernicus Publications on behalf of the European Geosciences Union.

4796 B. Ervens et al.: CCN studies at six different locations
all individual compounds due to the far from complete char-acterization of the organic fraction at the molecular level, andthe computational burden the description of hundreds of in-dividual compounds represents in models.
There is no consensus about the importance of detailedknowledge of aerosol composition (including mixing state)in studies that compare measured and modeled CCN num-ber concentrations (“CCN closure”). Some studies reportthat this information is of minor importance for successfulCCN closure and that aerosol size distribution largely de-termines the fraction that can be activated at a given super-saturation (Conant et al., 2004; Dusek et al., 2006; Ervenset al., 2007). Other studies show that measured CCN num-ber concentrations can only be reproduced if detailed organicproperties/mixing state are taken into account (Mircea et al.,2005; Stroud et al., 2007; Cubison et al., 2008).
With increasing distance from emission sources, particlesbecome mixed by both physical processes (e.g., coagulationor condensation of semivolatile and low-volatility organicand inorganic compounds) or chemical processes (e.g., ox-idation of primary (organic) species yielding more water-soluble products, and particle-phase reactions). These age-ing processes lead to growth of the particles, i.e. an increasein their CCN ability at a given supersaturation, and/or to anincrease in the hygroscopic fraction and, thus, to a reductionin the size threshold (“critical diameter”) above which parti-cles can be activated at a given supersaturation (Petters et al.,2006; Furutani et al., 2008).
Most CCN studies published to date have been limited tosampling at one site and, thus, it is not clear how to gener-alize their conclusions about CCN activation as a functionof aerosol mixing state and organic solubility. In a globalmodel study, it has been shown that different assumptionson mixing state and organic solubility might significantly af-fect CCN number concentrations (Pierce et al., 2007). Themotivation of the current study is to explore the applicabil-ity of these simplifying composition/mixing state assump-tions in CCN closure studies, using a consistent model ap-proach, based on data sets collected at very different loca-tions and distances from sources. Unlike previous CCN stud-ies (some of which analyzed in detail the same data sets asthose considered here), it is not attempted to deduce exactsize/composition/mixing state parameters of the CCN-activeparticle population based on all measurements, but rather toevaluate the extent to which simple assumptions can repro-duce measured CCN number concentrations across all datasets. A simple treatment of CCN composition/mixing stateas a function of distance from sources would be highly use-ful for the description of aerosol-cloud interactions in large-scale models.
2 Data sets
CCN data sets at six locations that differ in proximity to pol-lution sources, aerosol loading and composition have beenanalyzed; details on these data sets and corresponding publi-cations are summarized in Table 1. Three data sets are splitinto two subsets: During the first period of the MASE experi-ment at Point Reyes, CA (PYE), air masses were transportedmainly from the west and did not have any land contact overthe three days prior to sampling, whereas air masses duringthe remainder of the experiment came from the north andnorth east and thus had continental influence (C. Berkowitz,personal communication, 2010). For some periods duringthe ICARTT experiment at Chebogue Point (CBG), analysisof the organic mass fraction (OMF) of the aerosol using theAerodyne aerosol mass spectrometer (AMS) allowed theirclassification as either anthropogenically or biogenically in-fluenced, respectively (Holzinger et al., 2007; Williams etal., 2007; Zhang, 2010). Note that not all data points couldbe unambiguously ascribed to such air masses. During Go-MACCS, CCN data were collected on the NOAA researchvessel Ronald H. Brown both in the Houston Ship Chan-nel (HSC) and along the Houston Gulf Coast (HGC). It hasbeen shown that aerosol composition and processing can dif-fer significantly in these two areas due to different emissions(Bates et al., 2008; Bahreini et al., 2009). At Mexico CityT0 (MEX) and Riverside (RVS), the sampling took place atground sites that were located near and downwind of sig-nificant pollution sources. Emissions at the mountain-top atHolme Moss, UK, (HOM) are characterized by the plumesof Manchester, a conurbation of 2.5 million people (distance∼35 km), and nearby towns.
3 Model
The CCN model employed here is described in detail in pre-vious studies (Ervens et al., 2007; Cubison et al., 2008).In brief, the model is initialized with measured size distri-butions and CCN number concentrations at a given super-saturation (S). In the current study, we compare calculatedand measured CCN number concentrations at oneS for eachstudy in the range of 0.27%≤ S ≤0.44% (Table 1). ThisS(range) is the only one available for all data sets. Such lowS
is encountered in stratus clouds that have a significant influ-ence on the global radiative forcing. Depending on the dataset, S is either a constant value for the whole time periodor variations in the CCN counter are taken into account. Atthis relatively lowS, CCN number concentrations are mostsensitive as only a small fraction of the aerosol populationis activated and, thus, any change in the number of activatedparticles (e.g., due to changes in hygroscopicity) could trans-late to a significant change in activated fraction (Ervens etal., 2007).
Atmos. Chem. Phys., 10, 4795–4807, 2010 www.atmos-chem-phys.net/10/4795/2010/
B. Ervens et al.: CCN studies at six different locations 4797
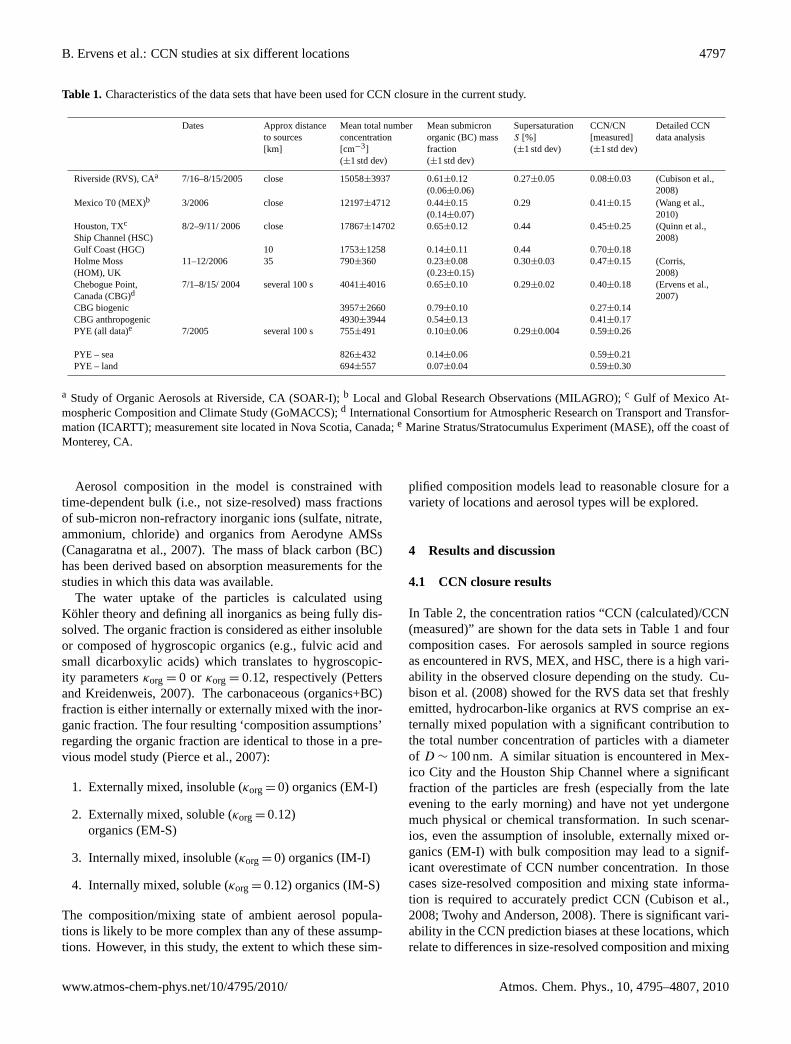
Table 1. Characteristics of the data sets that have been used for CCN closure in the current study.
Dates Approx distanceto sources[km]
Mean total numberconcentration[cm−3](±1 std dev)
Mean submicronorganic (BC) massfraction(±1 std dev)
SupersaturationS [%](±1 std dev)
CCN/CN[measured](±1 std dev)
Detailed CCNdata analysis
Riverside (RVS), CAa 7/16–8/15/2005 close 15058±3937 0.61±0.12(0.06±0.06)
0.27±0.05 0.08±0.03 (Cubison et al.,2008)
Mexico T0 (MEX)b 3/2006 close 12197±4712 0.44±0.15(0.14±0.07)
0.29 0.41±0.15 (Wang et al.,2010)
Houston, TXc
Ship Channel (HSC)8/2–9/11/ 2006 close 17867±14702 0.65±0.12 0.44 0.45±0.25 (Quinn et al.,
2008)Gulf Coast (HGC) 10 1753±1258 0.14±0.11 0.44 0.70±0.18Holme Moss(HOM), UK
11–12/2006 35 790±360 0.23±0.08(0.23±0.15)
0.30±0.03 0.47±0.15 (Corris,2008)
Chebogue Point,Canada (CBG)d
7/1–8/15/ 2004 several 100 s 4041±4016 0.65±0.10 0.29±0.02 0.40±0.18 (Ervens et al.,2007)
CBG biogenic 3957±2660 0.79±0.10 0.27±0.14CBG anthropogenic 4930±3944 0.54±0.13 0.41±0.17PYE (all data)e 7/2005 several 100 s 755±491 0.10±0.06 0.29±0.004 0.59±0.26
PYE – sea 826±432 0.14±0.06 0.59±0.21PYE – land 694±557 0.07±0.04 0.59±0.30
a Study of Organic Aerosols at Riverside, CA (SOAR-I);b Local and Global Research Observations (MILAGRO);c Gulf of Mexico At-mospheric Composition and Climate Study (GoMACCS);d International Consortium for Atmospheric Research on Transport and Transfor-mation (ICARTT); measurement site located in Nova Scotia, Canada;e Marine Stratus/Stratocumulus Experiment (MASE), off the coast ofMonterey, CA.
Aerosol composition in the model is constrained withtime-dependent bulk (i.e., not size-resolved) mass fractionsof sub-micron non-refractory inorganic ions (sulfate, nitrate,ammonium, chloride) and organics from Aerodyne AMSs(Canagaratna et al., 2007). The mass of black carbon (BC)has been derived based on absorption measurements for thestudies in which this data was available.
The water uptake of the particles is calculated usingKohler theory and defining all inorganics as being fully dis-solved. The organic fraction is considered as either insolubleor composed of hygroscopic organics (e.g., fulvic acid andsmall dicarboxylic acids) which translates to hygroscopic-ity parametersκorg = 0 or κorg = 0.12, respectively (Pettersand Kreidenweis, 2007). The carbonaceous (organics+BC)fraction is either internally or externally mixed with the inor-ganic fraction. The four resulting ‘composition assumptions’regarding the organic fraction are identical to those in a pre-vious model study (Pierce et al., 2007):
1. Externally mixed, insoluble (κorg= 0) organics (EM-I)
2. Externally mixed, soluble (κorg= 0.12)organics (EM-S)
3. Internally mixed, insoluble (κorg= 0) organics (IM-I)
4. Internally mixed, soluble (κorg= 0.12) organics (IM-S)
The composition/mixing state of ambient aerosol popula-tions is likely to be more complex than any of these assump-tions. However, in this study, the extent to which these sim-
plified composition models lead to reasonable closure for avariety of locations and aerosol types will be explored.
4 Results and discussion
4.1 CCN closure results
In Table 2, the concentration ratios “CCN (calculated)/CCN(measured)” are shown for the data sets in Table 1 and fourcomposition cases. For aerosols sampled in source regionsas encountered in RVS, MEX, and HSC, there is a high vari-ability in the observed closure depending on the study. Cu-bison et al. (2008) showed for the RVS data set that freshlyemitted, hydrocarbon-like organics at RVS comprise an ex-ternally mixed population with a significant contribution tothe total number concentration of particles with a diameterof D ∼ 100 nm. A similar situation is encountered in Mex-ico City and the Houston Ship Channel where a significantfraction of the particles are fresh (especially from the lateevening to the early morning) and have not yet undergonemuch physical or chemical transformation. In such scenar-ios, even the assumption of insoluble, externally mixed or-ganics (EM-I) with bulk composition may lead to a signif-icant overestimate of CCN number concentration. In thosecases size-resolved composition and mixing state informa-tion is required to accurately predict CCN (Cubison et al.,2008; Twohy and Anderson, 2008). There is significant vari-ability in the CCN prediction biases at these locations, whichrelate to differences in size-resolved composition and mixing
www.atmos-chem-phys.net/10/4795/2010/ Atmos. Chem. Phys., 10, 4795–4807, 2010

4798 B. Ervens et al.: CCN studies at six different locations
Table 2. Average ratios (±1 std dev) of calculated to measured CCN number concentrations for several locations and four different as-sumptions of composition/mixing state (κorg: hygroscopicity parameter of organic fraction). Best agreement is marked in gray shaded cells,poorest in bold for each location.
ext. mixed ext. mixed int. mixed int. mixed # data pointsκorg= 0 κorg= 0.12 κorg= 0 κorg= 0.12(EM-I) (EM-S) (IM-I) (IM-S)
RVS 4.4±1.8 4.9±1.7 4.6±1.7 6.0±2.1 306MEX 0.5±0.2 1.1±0.1 0.5±0.2 1.1±0.2 198HSC 2.4±1.9 4.0±3.0 4.0±3.0 4.2±3.2 120HGC 1.9±1.1 2.4±1.9 1.7±1.0 2.3±1.9 123HOM 1.0±0.5 1.2±0.6 0.8±0.5 0.9±0.5 769CBG – all data 0.7±0.3 1.2±0.3 0.9±0.4 1.4±0.4 717CBG anthrop. 0.8±0.3 1.2±0.4 1.2±0.4 1.6±0.4 194CBG biogenic 0.4±0.2 1.2±0.3 0.6±0.3 1.5±0.4 80PYE – all data 1.3±0.6 1.3±0.6 1.1±0.6 1.1±0.6 880PYE land 1.3±0.7 1.3±0.7 1.2±0.6 1.2±0.6 448PYE sea 1.3±0.5 1.4±0.5 0.8±0.4 0.9±0.4 432
Figure 1
Aerosol size distribution—————————————————————————————————————
I. External mixture,
κorg=0 (EM-I)
II. External mixture,
κorg=0.12 (EM-S)
III. Internal mixture,
κorg=0 (IM-I)
IV. Internal mixture,
κorg=0.12 (IM-S)
IV.
I.
III.
II.
Particle size
Num
be
r co
ncen
tra
tion
Fig. 1. Schematic of areas of activated number concentrations fordifferent composition/mixing state assumptions.
state which are not captured by any of the simplified assump-tions of this study. Whereas MEX and RVS resemble one an-other in terms of average organic fraction and distance fromsources, single particle analysis at both locations has shownthat the former location is more influenced by (aged) biomassburning particles (Moffet et al., 2008) whereas the latter oneshowed high fractions of elemental carbon in the diameterrange below 200 nm, i.e. around the critical diameter for par-ticles that activate atS = 0.3% (Spencer et al., 2007).
While inappropriate assumptions about organic composi-tion/mixing state could lead to the overprediction of the CCNnumber concentration, there is also the possibility that an ap-parent overprediction is really a result of the measured CCN
number concentration being too low due to instrumental lim-itations at high particle loading. However, atS ∼ 0.3% a sig-nificant underprediction only occurs for CCN number con-centrations on the order of 30 000 cm−3 (Droplet Measure-ment Technology Inc, 2004). Even though the total particlenumber concentration occasionally exceeded this value sig-nificantly, the average activated fraction atS ∼ 0.3% neverexceeded 0.2 (Cubison et al., 2008) which results in a maxi-mum CCN number concentration of∼ 6000 cm−3.
In Fig. 1, a schematic size distribution is shown and sub-populations that are predicted to activate for each of thefour composition assumptions are marked. If two compo-sition/mixing state assumptions result in similar predictedCCN number concentrations, it does not imply that the samesubset of the particle distribution is predicted to activate. Itis evident that canceling effects leading to comparable pre-dicted CCN numbers depend on the shape of the size dis-tribution and the magnitude of the organic fraction. Noneof the four suggested assumptions represents the real com-position/mixing state of an atmospheric particle population.There is an infinite number of other (more complex) compo-sition/mixing states that can lead to the same predicted CCNnumber.
At locations with small organic fractions (HGC, PYE,HOM), the different composition/mixing state assumptionsonly lead to small changes in the overall quality of the CCNclosure. At locations with higher organic fractions, inter-nally and externally mixed insoluble organics or internallyand externally mixed soluble organics, respectively, consis-tently give similar predicted CCN number concentrations,i.e. the areas I and III, and the areas II and IV, respectively,in Fig. 1 are similar on average for all observed size distri-butions which shows that the assumed mixing state is lessimportant than the assumed hygroscopicity of the organics.
Atmos. Chem. Phys., 10, 4795–4807, 2010 www.atmos-chem-phys.net/10/4795/2010/

B. Ervens et al.: CCN studies at six different locations 4799
In some cases canceling effects of predicting different partsof the size distribution to activate (Fig. 1) can lead to sim-ilar predicted CCN number concentrations that are within afactor of two to the measured ones with several assumptions.
With increasing distance from pollution sources, the pre-diction of CCN number concentration under the assumptionthat all particles contain some hygroscopic material is im-proved, but no clear statement can be made whether phys-ical or chemical mixing/ageing dominates as similar CCNratios are predicted by applying cases EM-S or IM-I. Therelative importance of mixing/ageing processes depends onfactors that cannot be quantified in the present study, such asdifferent photochemical activity and/or oxidant levels due toseasonal effects or concentration levels of precursors. Fieldstudies and model simulations using results from labora-tory experiments have suggested that chemical ageing of or-ganic aerosols is too slow and limited to account for effi-cient hydrophobic-to-hydrophilic conversion as compared tophysical mixing processes, especially condensation of hygro-scopic secondary inorganic species across the whole parti-cle population (Petters et al., 2006; DeGouw and Jimenez,2009).
4.2 Spatial scale of ageing
In large-scale models, a time scale on the order of 1–2 daysis assumed to convert particles from hydrophobic to hygro-scopic, and, thus into potential CCN (Wilson et al., 2001).Aerosol age depends not only on distance from source butalso on transport and processing time to the sampling site.However, wind data or highly time-resolved back trajecto-ries that could allow an estimate of transport age are onlyavailable for a subset of the data sets investigated here.The relative age of air masses is often characterized by its‘photochemical age’, which is calculated based on the ratioof NOx/NOy, benzene/toluene, BC/CO or oxidized/total or-ganic aerosol mass. This photochemical age is not an abso-lute value that can be compared for different locations since itis also function of oxidant levels. Since none of these param-eters is available for all the data sets used in this study, thepresent analysis explores spatial ageing scales by comparingdistances from sources.
In Fig. 2, the range of the CCN (calculated)/CCN (mea-sured) ratios, weighted by the frequency in the CCN closurestudies, is shown for internally and externally mixed organ-ics. No specific distance is ascribed to the sampling locationsclose to pollution sources (MEX, HSC, and RVS) because ofthe various pollution sources close to or within a few kilome-ters of the sampling location.
For studies downwind of but relatively close to majorsource areas (HOM and HGC), best CCN closure is achievedif all particles are assumed to be hygroscopic. This mightbe reasonable because of chemical and/or physical particleprocessing or due to the fact that the initial particle popu-lation dilutes and the resulting aerosol population is mostly
determined by aged background aerosol. Applying IM-I (orEM-I) for remote locations as has been done in many globalmodel applications will lead to an underestimate of CCNnumber concentrations. Our analysis indicates that, basedon two studies (HGC and HOM), the ageing scale of parti-cles is much shorter than several days and could be on theorder of hours in agreement with a recent model study thatexplores the ageing time scale for soot particles (Riemer etal., 2010). This result for locations where photochemistry isactive confirms studies that have shown that the addition of afew percent of soluble material to a hydrophobic particle sig-nificantly enhances its CCN ability (Bilde and Svenningsson,2004).
4.3 Role of organic fraction
The data sets explored here, cover a wide range of OMFranging from 7±4% to 79±10% (Table 1). For an aerosolwith small OMF, the assumption of organic composi-tion/mixing state is not crucial since the fractions of thesize distributions that are predicted to activate due to hygro-scopic and/or internally mixed organics are small (Fig. 1).For high OMF, however, predicted CCN number concen-trations are quite sensitive to the assumptions on mix-ing state/composition and quite different closure results arefound.
In Fig. 3a–d, the ranges of predicted CCN (calcu-lated)/CCN (measured) ratio are shown as a function ofOMF for all data sets and all composition cases. Despitemuch scatter around unity, the predicted CCN number agreeswithin a factor of two or better for small OMF under all as-sumptions (as also reflected in Table 2). As organic frac-tions increase above∼50% (MEX, CBG, HSC), it is evidentthat CCN number concentrations are increasingly underes-timated if insoluble organics (EM-I or IM-I) are assumed(Fig. 3a and b), but reasonably well predicted for the EM-S and IM-S assumptions. This is in agreement with the studyby Wang et al. (2008) who found that the best closure foraerosol with OMF>70% can be achieved if a hygroscopicityof κorg = 0.12 (IM-S) is assumed. The overestimate of CCNnumber concentration for some of the fresh aerosol (HSC,RVS), as discussed in Sect. 4.1, decreases slightly as OMFincreases but this improvement may be a fortuitous result ofcompensating factors.
5 Comparison to previous CCN studies
In Table 3, we have summarized results of multiple previousCCN studies together with the approximate distance frommajor pollution sources and the assumptions on organic hy-groscopicity and mixing state in the respective CCN stud-ies. Only a few studies have been performed very closeto major pollution sources (Broekhuizen et al., 2006; Cu-bison et al., 2008; Quinn et al., 2008; Lance et al., 2009).
www.atmos-chem-phys.net/10/4795/2010/ Atmos. Chem. Phys., 10, 4795–4807, 2010

4800 B. Ervens et al.: CCN studies at six different locations
Table 3. Summary of previous CCN closure studies. “Dist” is the approximate distance from major emission sources,κorg is the hygroscop-icity parameter of the organic fraction,κall is the hygroscopicity parameter of the total aerosol (ifκ was not provided in the original literatureit was derived here based on reported composition/hygroscopicity data); “slope” is the ratio of CCN (calculated)/CCN (measured), andS isthe supersaturation (range). If not otherwise noted, all studies assume bulk composition.
Location Dist [km] κ Mixing state “slope” S [%] Comment Reference
Riverside close κorg= 0κorg= 0κorg= 0
intextint/ext
2.8–7.10.79–4.11–3.7
0.1–0.90.1–0.90.1–0.9
hydrophobic org at∼100 nm (ext. mixed) size-resolved composition
(Cubison et al., 2008)
Houston (ship) close κorg= 0 ext 0.85–1.2 0.22-1 CCN prediction of particles∼200 nm
(Quinn et al., 2008)
Houston (aircraft) close κall = 0.6κorg= 0
intint
1.361.03
0.3–1.1 Hydrophobic org at∼100 nm
(Lance et al., 2009)
Toronto close κorg= 0κorg= 0κorg= 0.096
intextint
1.121.031.16
0.56-0.60.56–0.60.56–0.6
assumption: 10% of orgfraction soluble
(Broekhuizen et al., 2006)
Mexico City ≥ 10 km κorg= 0.15 intintint/extextext
0.99–1.760.89–1.450.85–1.120.74–1.030.82–1.08
0.11–0.35 bulk compositionsize-resolvedinorg+OOA and eBC+HOAext. mixedall components ext. mixed,size-resolvedall components ext. mixed,bulk
(Wang et al., 2010)
New Hampshire(Thompson Farm)
κorg= 0κorg= 0
intint
1.221.052
0.30.3
size-resolved composition (Medina et al., 2007)
Vancouver 45 0.001< κorg< 0.11
int ∼ 0.8−1 0.19–0.5 κall = 0.6, size-resovled (Shantz et al., 2008)
Guangzhou (China) 60 κall = 0.32±0.1 int 1.0±0.07 0.27 κ derived based onHTDMA
(Rose et al., 2010)
Toronto (rural) 70 κorg= 0κox = 0.2;κnon−ox = 0
intint
0.89 –1.141.23
0.420.42
(Chang et al., 2009)
Duke Forest (polluted) 10s κorg= 0.13κorg= 0
int 1.7–2.11.4–1.65
0.2 (Stroud et al., 2007)
Monterey κorg= 0κorg= 0.25κorg= 0.1κorg= 0.1
intintintext
0.94–0.951.1–1.151.170.89
0.20.20.20.2
boundary layer and free tro-posphereabove cloudsabove clouds
(Wang et al., 2008)
Californian Coast κall = 0.13 int ∼ 1 0.6 κ derived based onDcrit, mean(66.7 nm)
(Furutani et al., 2008)
Jeju Island 100 s κall =0.17κall =0.6
intint
0.731.16
0.1–1 (Kuwata et al., 2008)
North Sweden 100s κorg= 0.09 int 1.12 0.6 size-dependentκ derivedbased on HTDMA
(Kammermann et al., 2010)
N American CoastFree troposphereCentral Valley
80–1000s κall = 0.6 int ∼ 1−1.5 0.3 CCN closure resultsreported for whole data set(aircraft data)Assumption: pure(NH4)2SO4
(Roberts et al., 2010)
Northeast Atlantic κorg= 0 int 0.34 0.1 instrumental errors (?) (Chuang et al., 2000)Tasmania κorg= 0 int 1.26 (0.99) 0.5 Better agreement in air
masses with low aerosolloading and Rn
(Covert et al., 1998)
North Pacific κorg< 0.5 int 0.6–1.15 0.34 size-resolved (Shantz et al., 2008)Remote, marine κorg= 0
κorg= 0.158intint
0.920.98
0.38 (Bougiatoti et al., 2009)
Eastern Pacific κall = 0.6 int 1.78 0.3 (Roberts et al., 2006)Amazon κorg= 0
κorg∼ 0.1intint
0.2–0.30.5–1
0.2–1 (Mircea et al., 2002)
Amazon κorg= 0.1 int 1.17 0.1–0.82 size-resolved composition (Gunthe et al., 2009)Amazon κorg1= 0.03;
κorg2= 0.1intext
1.111.06
0.3–1 2 internally modes ofdifferent sizes
(Rissler et al., 2006)
Atmos. Chem. Phys., 10, 4795–4807, 2010 www.atmos-chem-phys.net/10/4795/2010/

B. Ervens et al.: CCN studies at six different locations 4801
Figure 2
10 100 1000
HGC HOM CBGPYE(land) PYE(sea)
0.1
2
4
6
1
2
4
6
10
CC
N(c
alc
)/C
CN
(me
as)
HSCRVS MEX
(a) κκκκorg = 0;
external mixture (EM-I)
0.1
2
4
6
1
2
4
6
10
CC
N(c
alc)/
CC
N(m
ea
s) HSCRVS MEX
(b) κκκκorg = 0.12;
external mixture (EM-S)
10 100 1000
HGC HOM CBGPYE(land) PYE(sea)
0.1
2
4
6
1
2
4
6
10
CC
N(c
alc
)/C
CN
(me
as)
(c) κκκκorg = 0;
internal mixture (IM-I)
RVS HSC MEX
10 100 1000
HGC HOM CBGPYE(land) PYE(sea)
0.1
2
4
6
1
2
4
6
10
CC
N(c
alc)/
CC
N(m
ea
s) HSCRVS MEX
(d) κκκκorg = 0.12;
internal mixture (IM-S)
Close to sources (not to scale) 10 100 1000
Approximate distance from sources [km]
HGC HOM CBGPYE(land) PYE(sea)
10 100 1000
HGC HOM CBGPYE(land) PYE(sea)
0.1
2
4
6
1
2
4
6
10
CC
N(c
alc
)/C
CN
(me
as)
HSCRVS MEX
(a) κκκκorg = 0;
external mixture (EM-I)
0.1
2
4
6
1
2
4
6
10
CC
N(c
alc)/
CC
N(m
ea
s) HSCRVS MEX
(b) κκκκorg = 0.12;
external mixture (EM-S)
10 100 1000
HGC HOM CBGPYE(land) PYE(sea)
0.1
2
4
6
1
2
4
6
10
CC
N(c
alc
)/C
CN
(me
as)
(c) κκκκorg = 0;
internal mixture (IM-I)
RVS HSC MEX
10 100 1000
HGC HOM CBGPYE(land) PYE(sea)
0.1
2
4
6
1
2
4
6
10
CC
N(c
alc)/
CC
N(m
ea
s) HSCRVS MEX
(d) κκκκorg = 0.12;
internal mixture (IM-S)
Close to sources (not to scale) 10 100 1000
Approximate distance from sources [km]
HGC HOM CBGPYE(land) PYE(sea)
Fig. 2. Ratio of calculated to measured CCN number concentration for seven different data sets. The symbol size corresponds to thefrequency of the respective ratio in the CCN closure. Horizontal lines denote the 1:1 line (solid line) and ratios of 0.5 and 2 (dashed lines),respectively.
These studies agree that best closure can be achieved ifsize-resolved chemical composition is taken into accountwith particular consideration of freshly emitted hydropho-bic organics. Size-resolved particle analysis of particle datasets in Tokyo and Guanzhou has confirmed the existenceof such a mode aroundD ∼ 100 nm (Kuwata and Kondo,2008; Rose et al., 2010). Several studies of hygroscopicgrowth factor measurements in urban environments confirmthe existence of a less hygroscopic mode that is composedof freshly-emitted hydrophobic particles (Swietlicki et al.,1999; Cocker et al., 2001; Vakeva et al., 2002). Since thecritical diameter of CCN is usually in the size range of∼50–200 nm (depending onS and composition), the considerationof this ’small-size’ mode is crucial for CCN closure studiesand ignoring it will lead to an overestimate of the CCN num-ber concentration. A recent CCN study of the data set inMexico City has shown that this mode is most prominent inthe morning and best closure is achieved if hydrocarbon-likeorganics (HOA) and BC is assumed to be externally mixedwith the inorganic and oxygenated organic fraction. In the
afternoon, this composition/mixing state assumption leads toan underestimate of CCN and the assumption of internallymixed, size-resolved composition gives best closure results(Wang et al., 2010). The good closure results in the latterstudy that are obtained by assuming bulk composition andan external mixture of all components might be fortuitousdue to canceling effects of an overestimate by assuming bulkcomposition and an underestimate due to externally mixedcomponents according to the schematic in Fig. 1.
These studies for polluted conditions and fresh emissionsare consistent with findings from a global model study whereit has been shown that the largest error in CCN prediction oc-curs under polluted conditions and CCN mixing state needsto be taken into account in order to reduce this error to<10%(Sotiropulou et al., 2007).
With increasing distance from pollution sources, goodCCN closure results (CCN (calculated)/CCN (measured)≤1.65) have been obtained if the organic fraction is assumedto be insoluble (κorg = 0) (Medina et al., 2007; Stroud et al.,2007; Shantz et al., 2008; Wang et al., 2008; Chang et al.,
www.atmos-chem-phys.net/10/4795/2010/ Atmos. Chem. Phys., 10, 4795–4807, 2010

4802 B. Ervens et al.: CCN studies at six different locations
Figure 3
0.0 0.2 0.4 0.6 0.8 1.0
0.1
1
10
0.0 0.2 0.4 0.6 0.8 1.0
0.1
1
10
0.0 0.2 0.4 0.6 0.8 1.0
0.1
1
10
0.0 0.2 0.4 0.6 0.8 1.0
0.1
1
10
RVSMEXHSCHGCHOMCBGPYE
(c) Internal mixture,
κ = 0 (IM-I)
(d) Internal mixture,
κ = 0.12 (IM-S)
(b) External mixture,
κ = 0.12 (EM-S)
Organic fraction Organic fraction
CC
N(c
alc
)/C
CN
(me
as)
CC
N(c
alc
)/C
CN
(me
as)
(a) External mixture,
κ = 0 (EM-I)
Fig. 3. Ratio of calculated to measured CCN number concentrations as a function of organic mass fraction for seven different data sets anddifferent assumptions of hygroscopicity and mixing state of the organic fraction. Each bar represents 20% of the respective data set, error barsshow±one standard deviation; mean value is marked in each bar. Horizontal black lines represent CCN (calculated)/CCN (measured)=0.5and 2, respectively.
2009). The assumption of an external mixture of solubleorganics leads to an underestimate of the CCN number butincreasing the hygroscopicity of the internally mixed modelorganics leads to better agreement (Wang et al., 2008). Aninternal mixture of insoluble organics suggests that indeedphysical mixing processes (i.e. condensation of soluble low-volatility or semivolatile compounds or coagulation) are pre-dominant rather than chemical ageing processes that wouldresult in an external mixture of soluble organics. The dom-inance of condensation and coagulation is also apparent infast size-resolved chemistry data (e.g., Zhang et al., 2004).
At remote continental locations with some impact of an-thropogenic emissions, CCN closure studies have been suc-cessful with the assumption of internally mixed organics withκorg ∼ 0.09 (Kammermann et al., 2010). In that study, com-position measurements were not available; however, the lowhygroscopicity parameters (0.07< κall < 0.21) determinedin their studies point to a small inorganic fraction. Thoseauthors have also shown that the sensitivity to the mixingstate is not of importance and very similar closure resultsare found by assuming externally mixed, soluble organics, inagreement with our results for EM-S and IM-S in Figs. 2 and3. In regions with very high organic fractions such as in theAmazon, the assumption of internally mixed organics with
κorg ≤ 0.1 leads to CCN overprediction of≤17% (Mircea etal., 2002; Rissler et al., 2006; Gunthe et al., 2009). Thisrange ofκorg is in agreement with the hygroscopicity sug-gested for secondary organic aerosol (Petters and Kreiden-weis, 2007).
During studies at remote locations, size-resolved compo-sition measurements were available. Even though all agedparticles are to some extent internally mixed, larger parti-cles generally exhibit a higher hygroscopicity due to theirgrowth by condensation of soluble compounds (sulfate, or-ganics) (Furutani et al., 2008; Gunthe et al., 2009; Kammer-mann et al., 2010). An average hygroscopicity might be bi-ased to larger values if it is averaged based on volume ofthe size distribution. If particles around the critical diam-eter have a distinctly smaller hygroscopicity, applying thisaverage value for the whole size distribution will lead to anoverestimate (Medina et al., 2007).
The trends inκorg in Table 3, together with the findingsin Fig. 2, can be used as general guidance for the treat-ment of the organic fraction in CCN studies. All data setsconfirm that size-resolved organic composition and mixingstate are of importance in highly polluted areas with freshemissions, whereas condensation and/or coagulation is effi-cient enough to convert hydrophobic organic particles within
Atmos. Chem. Phys., 10, 4795–4807, 2010 www.atmos-chem-phys.net/10/4795/2010/

B. Ervens et al.: CCN studies at six different locations 4803
Figure 4
Fig. 4. (a) and(b) Example size distributions that are used as input data to the cloud parcel model. D1 denotes the critical diameter forparticles that are activated atS = 0.3%, κ = 0.18 (“base case”).D05 andD2 denote the critical diameters for particles with a compositionthat result in 50% or 200%, respectively, of the activated number concentration as compared to the base case.(c) and(d) Relative differencebetween predicted drop number concentration for the compositionsκ05 andκ2 to predicted drop number concentration usingκ1 as a functionof updraft velocity in the cloud parcel model.
short distances into hygroscopic particles (internal mixture,κorg = 0). With increasing distance from pollutions sources,the initially hydrophobic organic particles become hygro-scopic due to additional hygroscopic material and the organicfraction can be represented with an overall organic hygro-scopicity 0< κorg< 0.2.
6 Effects of uncertainty in CCN number concentrationon drop number concentration (Nd)
While CCN studies are helpful in order to test our under-standing of the physico-chemical properties of aerosol par-ticles that affect their CCN ability, the supersaturation in acloud is not only controlled by the condensational sink of wa-ter vapour but to a large extent by dynamic processes, suchas the cooling rate due to the updraft. In previous theoreticalstudies, it has been shown that any chemical effects on CCNnumber concentration are reduced when cloud drop numbers(and not CCN in equilibrium) are compared (Ervens et al.,2005; Sotiropulou et al., 2007; Cubison et al., 2008; Wang etal., 2008).
By means of a theoretical model approach, we explore theextent to which an error of a factor of two due to inappropri-ate composition assumptions in CCN closure studies (Figs. 2
and 3) translates into an error in drop number concentration.This model approach has been used before to describe the ac-tivation of aerosol particles at a constant updraft velocity (Er-vens et al., 2005; Cubison et al., 2008). The initial size dis-tribution for these exemplary model runs is lognormal withgeometrically distributed diameters between 0.02–2 µm. It isassumed that all particles are internally mixed and have thesame composition throughout the size range.
A reference composition (κ = 0.18) has been defined thattranslates into a critical diameterD1 atS = 0.3% accordingto Kohler theory. The number concentration of the aerosoldistribution is chosen in a way that this base case has a CCNnumber concentration of 400 cm−3. In sensitivity studies tosimulate more/less polluted scenarios, the total particle num-ber has been scaled up/down by a factor 10 (4000 cm−3,40 cm−3; Fig. 4a, b).
For sensitivity studies, an error of two in the base caseCCN number is introduced by varyingκ in a way that theresulting critical diametersD2 andD05 describe a concen-tration that is twice/half as large as that constrained byD1at S = 0.3% (Fig. 4a, b). The two size distributions showthat the values ofD1 andD2 depend on the shape of thesize distribution since different fractions are predicted toactivate. The calculations are performed for two differentsize distributions in order to explore the impact of the size
www.atmos-chem-phys.net/10/4795/2010/ Atmos. Chem. Phys., 10, 4795–4807, 2010

4804 B. Ervens et al.: CCN studies at six different locations
distributions. Unlike in previous studies that have exploredthe effect on cloud drop number concentration due to an er-ror in aerosol number concentration (e.g., Feingold, 2003;Ervens et al., 2005), in the current study different composi-tions with a constant aerosol number concentration are inputparameters for the sensitivity runs and the difference in pre-dicted CCN number concentration only hold forS = 0.3%.At different S, the ratio of the predicted CCN number con-centration will differ from two.
The compositions (κ1, κ05,κ2) and size distributions areused as input to the cloud model and simulations are per-formed for updraft velocitiesw in the range of 10 cm s−1 <
w < 300 cm s−1. Drop number concentrations from eachsimulation (Nd(1), Nd(05), Nd(2)) are compared at a max-imum liquid water content of 0.3 g m−3. In Fig. 4c and d, theratios [Nd(05)/Nd(1)−1] and [Nd(2)/Nd(1)−1] are shownas a function ofw. A value of±100% corresponds to thesame uncertainty as in the comparison of the CCN numberconcentration whereas 50% denotes that the error in clouddrop number prediction is only half of that as in CCN numberprediction. Atw = 10 cm s−1, the difference in drop numberconcentration is greatest for both initial size distributions andmight be as large as a factor of two. As opposed to findingsthat suggested the largest effect at high particle number con-centration, i.e. if condensation might significantly impact thesupersaturation (Ervens et al., 2005), the results in Fig. 4cand d do not show a clear trend in terms of the total particlenumber concentration.
With increasing updraft velocity, the supersaturation ismostly controlled by the cooling rate and the sink term dueto condensation of water vapour becomes negligible. Atw ∼300 cm s−1, the change in drop number concentrationdue to different assumptions of particle composition (κ) isreduced to about 10–20% as compared to the ratio of 2 inthe CCN number concentrations. This range is in agree-ment with findings from similar studies (Ervens et al., 2005;Sotiropoulou et al., 2006). This uncertainty might translateinto an error of regional indirect forcing of∼0.5 W m−2;however, these are regions where the total indirect radiationis high, and thus the relative error in indirect forcing is small(Sotiropoulou et al., 2006; 2007). In the latter studies, it hasbeen concluded that the error in CCN prediction is small forthe indirect forcing because the clouds that contribute most tothe indirect effect are those at moderate pollution levels. Asshown in the current study, in these regions, however, CCNcan be predicted reasonably well without detailed knowledgeof composition and mixing state.
7 Summary and conclusions
CCN closure results for six different locations are comparedusing four simplified composition/mixing state assumptionsfor the carbonaceous (organics+BC) aerosol fraction (sol-uble/insoluble, internally/externally mixed with inorganic
fraction). Despite very different locations and air masses,the following trends can be identified:
– Very close to pollution sources, simple assumptions oforganic mixing state/ solubility and bulk compositionare not sufficient to predict CCN number concentra-tions. More complex assumptions about compositionand mixing state (e.g., size-resolved) need to be made.
– Externally mixed, hydrophobic organic particles arelikely to be sufficiently processed by chemical and/orphysical ageing within a few tens of kilometers down-wind of emission sources such that CCN compositioncan be reasonably well represented by externally mixed,hygroscopic organics.
– Different assumptions for organic solubility and mix-ing state often lead to similar CCN number concentra-tions since different subsets of the aerosol populationare predicted to activate. Thus, reasonable CCN closuremay be achieved due to such compensating factors eventhough the assumed composition/mixing state might notrepresent the true properties of the aerosol population.
– A factor of two error in CCN concentration due to com-position effects will translate to an error of about 10–20% in cloud drop concentration in agreement with pre-vious studies that compared effects on drop numberconcentration due to different aerosol number concen-trations (Ervens et al., 2005; Cubison et al., 2008).
Our results provide a general framework that allows predic-tion of CCN number concentrations to better than a factor oftwo on average for a variety of scenarios where the aerosolhas undergone some degree of ageing by making simple as-sumptions about the solubility and mixing state of the or-ganic fraction. Given the rather poor representation of cloudsin large-scale models, the error in drop number concentra-tion due to uncertainties in CCN number concentrations isrelatively small compared to radiative forcing uncertaintiesassociated with macroscale cloud properties such as cloudfraction and depth.
Acknowledgement.BE (MJC, JLJ and QZ) acknowledge fundingfrom the U.S. Department of Energy (BER, ASP Program), GrantDE-FG02-08ER64539 (DE-FG02-08ER64627).
Edited by: A. Nenes
References
Bahreini, R., Ervens, B., Middlebrook, A. M., Warneke, C., De-Gouw, J. A., DeCarlo, P., Jimenez, J. L., Brock, C. A., Neuman,J. A., Ryerson, T. B., Stark, H., Atlas, E., Brioude, J., Fried, A.,Holloway, J. S., Peischl, J., Richter, D., Walega, J., Weibring, P.,Wollny, A. G., and Fehsenfeld, F. C.: Organic aerosol formationin urban and industrial plumes in Houston, TX, J. Geophys. Res.,114, D00F16, doi:10.1029/2008JD011493, 2009.
Atmos. Chem. Phys., 10, 4795–4807, 2010 www.atmos-chem-phys.net/10/4795/2010/

B. Ervens et al.: CCN studies at six different locations 4805
Bates, T. S., Quinn, P. K., Coffman, D., Schulz, K., Covert, D.S., Johnson, J. E., Williams, E. J., Lerner, B. M., Angevine, W.M., Tucker, S. C., and Brewer, W. A., and Stohl, A.: Boundarylayer aerosol chemistry during TexAQS/GoMACCS 2006: In-sights into aerosol sources and transformation processes, J. Geo-phys. Res., 113, D00F01, doi:10.1029/2008JD010023, 2008.
Bilde, M. and Svenningsson, B.: CCN activation of slightly solubleorganics: the importance of small amounts of inorganic salt andparticle phase, Tellus, 56B, 128–134, 2004.
Bougiatioti, A., Fountoukis, C., Kalivitis, N., Pandis, S. N., Nenes,A., and Mihalopoulos, N.: Cloud condensation nuclei measure-ments in the marine boundary layer of the Eastern Mediter-ranean: CCN closure and droplet growth kinetics, Atmos. Chem.Phys., 9, 7053–7066, doi:10.5194/acp-9-7053-2009, 2009.
Broekhuizen, K., Chang, R.Y.-W., Leaitch, W. R., Li, S.-M., andAbbatt, J. P. D.: Closure between measured and modeled cloudcondensation nuclei (CCN) using size-resolved aerosol composi-tions in downtown Toronto, Atmos. Chem. Phys., 6, 2513–2524,doi:10.5194/acp-6-2513-2006, 2006.
Canagaratna, M. R., Jayne, J. T., Jimenez, J. L., Allan, J. D., Al-farra, M. R., Zhang, Q., Onasch, T. B., Drewnick, F., Coe, H.,Middlebrook, A., Delia, A., Williams, L. R., Trimborn, A. M.,Northway, M. J., DeCarlo, P. F., Kolb, C. E., Davidovits, P., andWorsnop, D. R.: Chemical and microphysical characterization ofambient aerosols with the Aerodyne Aerosol Mass Spectrometer,Mass Spectrometry Reviews, 26, 185–222, 2007.
Chang, R. Y.-W., Slowik, J. G., Shantz, N. C., Vlasenko, A., Liggio,J., Sjostedt, S. J., Leaitch, W. R., and Abbatt, J. P. D.: The hygro-scopicity parameter (κ) of ambient organic aerosol at a field sitesubject to biogenic and anthropogenic influences: Relationshipto degree of aerosol oxidation, Atmos. Chem. Phys. Discuss., 9,25323–25360, doi:10.5194/acpd-9-25323-2009, 2009.
Chuang, P. Y., Collins, D. R., Pawlowska, H., Snider, J. R., Jonsson,H. H., Brenguier, J. L., Flagan, R. C., and Seinfeld, J. H.: CCNmeasurements during ACE-2 and their relationship to cloud mi-crophysical properties, Tellus B, 52, 843–867, 2000.
Cocker, D., Whitlock, N., Flagan, R., and Seinfeld, J.: Hygroscopicproperties of Pasadena, California aerosol, Aerosol Sci. Technol.,35, 637–647, 2001.
Conant, W. C., T. M. VanReken, T. A. Rissman, V. Varutbangkul,H. H. Jonsson, A. Nenes, J. L. Jimenez, A. E. Delia, R. Bahreini,G. C. Roberts, R. C. Flagan, and Seinfeld, J. H.: Aerosol-clouddrop concentration closure in warm cumulus, J. Geophys. Res.,109, D13204, doi:10.129/2003JD004324, 2004.
Corrigan, C. E. and Novakov, T.: Cloud condensation nucleus activ-ity of organic compounds: a laboratory study, Atmos. Environ.,33, 2661–2668, 1999.
Corris, B.: Atmospheric aerosol: The link between compositionand physical behaviour, School of Earth, Atmospheric and Envi-ronmental Sciences, The University of Manchester, Manchester(UK), 2008.
Covert, D. S., Gras, J. L., Wiedensohler, A., and Stratmann, F.:Comparison of directly measured CCN with CCN modeled fromthe number-size distribution in the marine boundary layer duringACE 1 at Cape Grim, Tasmania, J. Geophys. Res., 103, D13,doi:10.1029/98jd01093, 1998.
Cruz, C. N. and Pandis, S. N.: Deliquescence and hygroscopicgrowth of mixed inorganic-organic atmospheric aerosols, Envi-ron. Sci. Technol., 34, 4313–4319, 2000.
Cubison, M. J., Ervens, B., Feingold, G., Docherty, K. S., Ulbrich,I. M., Shields, L., Prather, K., Hering, S., and Jimenez, J. L.:The influence of chemical composition and mixing state of LosAngeles urban aerosol on CCN number and cloud properties, At-mos. Chem. Phys., 8, 5649–5667, doi:10.5194/acp-8-5649-2008,2008.
DeGouw, J. and Jimenez, J. L.: Organic aerosols in the Earth’satmosphere: organic particles are abundant in the troposphereand important for air quality and climate – but what are theirsources?, Environ. Sci. Technol., 43, 20, 7614–7618, 2009.
Droplet Measurement Technology Inc: Manual, Operator CloudCondensation Nuclei Counter, Boulder, 2004.
Dusek, U., Frank, G. P., Hildebrandt, L., Curtius, J., Schneider, J.,Walter, S., Chand, D., Drewnick, F., Hings, S., Jung, D., Bor-rmann, S., and Andreae, M. O.: Size matters more than chem-istry for cloud-nucleating ability of aerosol particles, Science,312, 1375–1378, 2006.
Ervens, B., Feingold, G., and Kreidenweis, S. M.: Theinfluence of water-soluble organic carbon on cloud dropnumber concentration, J. Geophys. Res., 110, D18211,doi:10.1029/2004JD005634, 2005.
Ervens, B., Cubison, M. J., Andrews, E., Feingold, G., Ogren, J. A.,Jimenez, J. L., DeCarlo, P., and Nenes, A.: Prediction of cloudcondensation nucleus number concentration using measurementsof aerosol size distributions and composition and light scatteringenhancement due to humidity, J. Geophys. Res., 112, D10S32,doi:10.1029/2006JD007426, 2007.
Feingold, G.: Modeling of the first indirect effect: Analysisof measurement requirements, Geophys. Res. Lett., 30, 19,doi:10.1029/2003GL017967, 2003.
Furutani, H., Dall’osto, M., Roberts, G. C., and Prather, K. A.:Assessment of the relative importance of atmospheric aging onCCN activity derived from field observations, Atmos. Environ.,42, 3130–3142, 2008.
Gunthe, S. S., King, S. M., Rose, D., Chen, Q., Roldin, P., Farmer,D. K., Jimenez, J. L., Artaxo, P., Andreae, M. O., Martin, S.T., and Poschl, U.: Cloud condensation nuclei in pristine tropi-cal rainforest air of Amazonia: size-resolved measurements andmodeling of atmospheric aerosol composition and CCN activity,Atmos. Chem. Phys., 9, 7551–7575, doi:10.5194/acp-9-7551-2009, 2009.
Holzinger, R., Milet, D. B., Williams, B., Lee, A., Kreisberg, N.,Hering, S. V., Jimenez, J. L., Allan, J. D., Worsnop, D. R., andGoldstein, A. H.: Emission, oxidation, and secondary organicaerosol formation of volatile organic compounds as observed atChebogue Point, Nova Scotia, J. Geophys. Res., 112, D10S24,doi:10.129/2006JD007599, 2007.
Kammermann, L., Gysel, M., Weingartner, E., Herich, H., Cziczo,D. J., Holst, T., Svenningsson, B., Arneth, A., and Baltensperger,U.: Sub-arctic atmospheric aerosol composition 3: Measured andmodeled properties of cloud condensation nuclei (CCN), J. Geo-phys. Res., 115, D04202, doi:10.1029/2009JD012447, 2010.
Kuwata, M. and Kondo, Y.: Dependence of size-resolvedCCN spectra on the mixing state of nonvolatile coresobserved in Tokyo, J. Geophys. Res., 113, D19202,doi:10.1029/2007JD009761, 2008.
Kuwata, M., Kondo, Y., Miyazaki, Y., Komazaki, Y., Kim, J. H.,Yum, S. S., Tanimoto, H., and Matsueda, H.: Cloud conden-sation nuclei activity at Jeju Island, Korea in spring 2005, At-
www.atmos-chem-phys.net/10/4795/2010/ Atmos. Chem. Phys., 10, 4795–4807, 2010

4806 B. Ervens et al.: CCN studies at six different locations
mos. Chem. Phys., 8, 2933–2948, doi:10.5194/acp-8-2933-2008,2008.
Lance, S., Nenes, A., Mazzoleni, C., Dubey, M. K., Gates, H.,Varutbangkul, V., Rissman, T. A., Murphy, S. M., Sorooshian,A., Flagan, R. C., Seinfeld, J. H., Feingold, G., and Jonsson,H. H.: Cloud condensation nuclei activity, closure, and dropletgrowth kinetics of Houston aerosol during the Gulf of MexicoAtmospheric Composition and Climate Study (GoMACCS), J.Geophys. Res., 114, D00F15, doi:10.1029/2008jd011699, 2009.
Medina, J., Nenes, A., Sotiropoulou, R. P., Cottrell, L. D., Ziemba,L. D., Beckman, P. J., and Griffin, R. J.: Cloud condensationnuclei closure during the International Consortium for Atmo-spheric Research on Transport and Transformation 2004 cam-paign: Effects of size-resolved composition, J. Geophys. Res.,112, D10S31, doi:10.1029/2006JD007588, 2007.
Mircea, M., Facchini, M. C., Decesari, S., Fuzzi, S., and Charlson,R. J.: The influence of the organic aerosol component on CCNsupersaturation spectra for different aerosol types, Tellus B 54,74–81, 2002.
Mircea, M., Facchini, M. C., Decesari, S., Cavalli, F., Emblico, L.,Fuzzi, S., Vestin, A., Rissler, J., Swietlicki, E., Frank, G., An-dreae, M. O., Maenhaut, W., Rudich, Y., and Artaxo, P.: Im-portance of the organic aerosol fraction for modeling aerosol hy-groscopic growth and activation: a case study in the AmazonBasin, Atmos. Chem. Phys., 5, 3111–3126, doi:10.5194/acp-5-3111-2005, 2005.
Moffet, R. C., de Foy, B., Molina, L. T., Molina, M. J., and Prather,K. A.: Measurement of ambient aerosols in northern Mexico Cityby single particle mass spectrometry, Atmos. Chem. Phys., 8,4499–4516, doi:10.5194/acp-8-4499-2008, 2008.
Petters, M. D., Prenni, A. J., Kreidenweis, S. M., DeMott,P. J., Matsunaga, A., Lim, Y. B., and Ziemann, P. J.:Chemical aging and the hydrophobic-hydrophilic conversionof carbonaceous aerosol, Geophys. Res. Lett., 33, L24806,doi:10.1029/2006GL027249, 2006.
Petters, M. D. and Kreidenweis, S. M.: A single parameter repre-sentation of hygroscopic growth and cloud condensation nucleusactivity, Atmos. Chem. Phys., 7, 1961–1971, doi:10.5194/acp-7-1961-2007, 2007.
Pierce, J. R., Chen, K., and Adams, P. J.: Contribution of primarycarbonaceous aerosol to cloud condensation nuclei: processesand uncertainties evaluated with a global aerosol microphysicsmodel, Atmos. Chem. Phys., 7, 5447–5466, doi:10.5194/acp-7-5447-2007, 2007.
Quinn, P. K., Bates, T. S., Coffman, D. J., and Covert, D. S.:Influence of particle size and chemistry on the cloud nucleat-ing properties of aerosols, Atmos. Chem. Phys., 8, 1029–1042,doi:10.5194/acp-8-1029-2008, 2008.
Riemer, N., West, M., Zaveri, R., and Easter, R.: Estimating blackcarbon aging time-scales with a particle resolved aerosol model,J. Aerosol Sci., 1, 143–158, 2010.
Rissler, J., Vestin, A., Swietlicki, E., Fisch, G., Zhou, J., Artaxo,P., and Andreae, M. O.: Size distribution and hygroscopic prop-erties of aerosol particles from dry-season biomass burning inAmazonia, Atmos. Chem. Phys., 6, 471–491, doi:10.5194/acp-6-471-2006, 2006.
Roberts, G., Mauger, G., Hadley, O., and Ramanathan, V.: NorthAmerican and Asian aerosols over the eastern Pacific Ocean andtheir role in regulating cloud condensation nuclei, J. Geophys.
Res., 111, D13205, doi:10.1029/2005JD006661, 2006.Roberts, G. C., Day, D. A., Russell, L. M., Dunlea, E. J., Jimenez, J.
L., Tomlinson, J. M., Collins, D. R., Shinozuka, Y., and Clarke,A. D.: Characterization of particle cloud droplet activity andcomposition in the free troposphere and the boundary layer dur-ing INTEX-B, Atmos. Chem. Phys. Discuss., 10, 3499–3546,doi:10.5194/acpd-10-3499-2010, 2010.
Rose, D., Nowak, A., Achtert, P., Wiedensohler, A., Hu, M., Shao,M., Zhang, Y., Andreae, M. O., and Poschl, U.: Cloud conden-sation nuclei in polluted air and biomass burning smoke near themega-city Guangzhou, China – Part 1: Size-resolved measure-ments and implications for the modeling of aerosol particle hy-groscopicity and CCN activity, Atmos. Chem. Phys., 10, 3365–3383, doi:10.5194/acp-10-3365-2010, 2010.
Shantz, N. C., Leaitch, W. R., Phinney, L., Mozurkewich, M.,and Toom-Sauntry, D.: The effect of organic compounds on thegrowth rate of cloud droplets in marine and forest settings, At-mos. Chem. Phys., 8, 5869–5887, doi:10.5194/acp-8-5869-2008,2008.
Sotiropoulou, R. P., Medina, J., and Nenes, A.: CCN predictions: Istheory sufficient for assessments of the indirect effect?, Geophys.Res. Lett., 33, L05816, doi:10.1029/2005GL025148, 2006.
Sotiropulou, R.-E. P., Nenes, A., Adams, P. J., and Seinfeld, J. H.:Cloud condensation nuclei prediction error from application ofKohler theory: Importance for the aerosol indirect effect, J. Geo-phys. Res., 112, D12202, doi:10.1029/2006JD007834, 2007.
Spencer, M. T., Shields, L. G., and Prather, K. A.: Simultaneousmeasurements of the effective density and chemical compositionof ambient aerosol particles Environ. Sci. Technol., 41, 1303–1309, 2007.
Stroud, C., Nenes, A., Jimenez, J. L., DeCarlo, P., Huffman, J. A.,Bruintjes, R., Nemitz, E., Delia, A. E., Toohey, D. W., Guen-ther, A. B., and Nandi, S.: Cloud activating properties of aerosolobserved during CELTIC, J. Atmos. Sci., 64, 441–459, 2007.
Swietlicki, E., J. Zhou, O. H. Berg, B. G. Martinsson, G. Frank,S. Cederfeldt, U. Dusek, A. Berner, W. Birmili, A. Wieden-sohler, Yuskiewicz, B., and Bower, K. N.: A closure study ofsub-micrometer aerosol particle hygroscopic behaviour, Atmos.Res., 50, 205–240, 1999.
Twohy, C. H. and Anderson, J. R.: Droplet nuclei on non-precipitating clouds: composition and size matter, Environ. Res.Lett., 3, 4, doi:10.1088/1748-9326/1083/1084/0045002, 2008.
Vakeva, M., Kulmala, M., Stratmann, F., and Hmeri, K.: Fieldmeasurements of hygroscopic properties and state of mixingof nucleation mode particles, Atmos. Chem. Phys., 2, 55–66,doi:10.5194/acp-2-55-2002, 2002.
Wang, J., Lee, Y.-N., Daum, P. H., Jayne, J., and Alexander, M. L.:Effects of aerosol organics on cloud condensation nucleus (CCN)concentration and first indirect aerosol effect, Atmos. Chem.Phys., 8, 6325–6339, doi:10.5194/acp-8-6325-2008, 2008.
Wang, J., Cubison, M. J., Aiken, A. C., Jimenez, J. L., and Collins,D. R.: The importance of aerosol mixing state and size-resolvedcomposition on CCN concentration and the variation of the im-portance with atmospheric aging of aerosols, Atmos. Chem.Phys. Discuss., 10, 11751–11793, doi:10.5194/acpd-10-11751-2010, 2010.
Williams, B. J., Goldstein, A. H., Millet, D. B., Holzinger, R.,Kreisberg, N. M., Hering, S. V., White, A. B., Worsnop, D.R., Allan, J. D., and Jimenez, J. L.: Chemical speciation of
Atmos. Chem. Phys., 10, 4795–4807, 2010 www.atmos-chem-phys.net/10/4795/2010/
B. Ervens et al.: CCN studies at six different locations 4807
organic aerosol during the International Consortium for Atmo-spheric Research on Transport and Transformation 2004: Re-sults from in situ measurements, J. Geophys. Res., 112, D10S26,doi:10.1029/2006JD007601, 2007.
Wilson, J., Cuvelier, C., and Raes, F.: A modeling study of globalmixed aerosol fields, J. Geophys. Res., 106(D24), 34081–34108,2001.
Zhang, Q., Stanier, C. O., Canagaratna, M. R., Jayne, J. T.,Worsnop, D. R., Pandis, S. N., and Jimenez, J. L.: Insights intothe Chemistry of New Particle Formation and Growth Events inPittsburgh Based on Aerosol Mass Spectrometry, Environ. Sci.Technol., 38, 18, 4797–4809, doi:10.1021/es035417u, 2004.
www.atmos-chem-phys.net/10/4795/2010/ Atmos. Chem. Phys., 10, 4795–4807, 2010