fault detection in electric power
DESCRIPTION
Fault Detection in Electric PowerTRANSCRIPT
SERBIAN JOURNAL OF ELECTRICAL ENGINEERING
Vol. 10, No. 1, February 2013, 73-90
73
Fault Detection in Electric Power
Systems Based on Control Charts
Emilija Kisić1, Vera Petrović1, Miroslav Jakovljević2, Željko Đurović3
Abstract: This paper analyzes the control system of the combustion process and
protection from explosions in the boiler furnace of thermal power plant using the
techniques of control charts. The data from old and newly introduced system for
measuring under-pressure differences in boiler furnace at unit B2, TE Nikola
Tesla (TENT) Obrenovac, were analyzed. The signal of undepressure diference
is used for boiler protection function in thermal power plant TENT B. The results
that confirm the advantages of the newly introduced system of measurements are
presented. A detailed discussion about the benefits and the shortcomings of the
control charts application in industrial processes are given in the paper.
Keywords: Control chart, Statistical process control, Fault detection, Under-
pressure difference in boiler furnace.
1 Introduction
Process control and monitoring are becoming essential tasks in nowadays
industry. Today, all processes are automatized and they contain a lot of sensors
and actuators. Because of that, the control of these processes is sometimes very
difficult. There are two principal approaches to perform the process control,
namely, data driven techniques and analytical techniques [3]. In theory, the
analytical technique is the better approach. It is based on analytical (physical)
model of the system and permits to simulate the system. Though, at each
instant, the theoretical value of each sensor can be known for the normal
operating state of the system. As a consequence, it is relatively easy to see if the
real process values are similar to the theoretical values. But, the major drawback
of this approach is the fact that it requires detailed models of the process. An
effective detailed model can be very difficult, time consuming and expensive to
obtain, particularly for large scale systems with many variables. The data-driven
1School of Electrical Engineering and Computer Science of Applied Studies, Vojvode Stepe 283, Belgrade, Serbia; E-mails: [email protected], [email protected]
2CE, “Thermal Power Plants Nikola Tesla” d.o.o, TENT B, Bogoljuba Uroševića 44, Obrenovac, Serbia; E-mail: [email protected]
3School of Electrical Engineering, University of Belgrade, Bulevar Kralja Aleksandra 73, Belgrade, Serbia; E-mail: [email protected]
UDK: 621.311.24:658.562.3 DOI: 10.2298/SJEE1301073K
E. Kisić, V. Petrović, M. Jakovljević, Ž. Đurović
74
approaches are a family of different techniques based on the analysis of the real
data extracted from the process. These methods are based on rigorous statistical
development of the process data. In this paper we will work in the data-driven
monitoring framework.
Many data-driven techniques for the fault detection can be found in the
literature: univariate statistical process control [1], multivariate statistical
process control [2], and some PCA (Principal Component Analysis) based
techniques [5, 6]. Other important approaches are PLS (Projection to Latent
Structures) based approaches [7]. These fault detection techniques are able to
detect a fault (disturbance) in a univariate and multivariate processes. The fault
diagnosis procedure can also be seen as a classification task. Combination of
multivariate statistical process control and Bayesian network as classifier can be
found in literature [4, 8]. In this article we will describe implementation of
univariate statistical process control in electric power system.
Statistical process control (SPC) is a powerful collection of problem-
solving tools useful in achieving process stability and improving capability
through the reduction of variability. SPC can be applied to any process. It has
seven major tools, but the control chart is the most technically sophisticated. It
was developed in the 1920. by Walter A. Shewhart [9] of the Bell Telephone
Laboratories. Since then many types of control charts were developed and
univariate SPC is extended to multivariate SPC when there is need for
monitoring more than one variable. Control charts have had long history of use
in industries. There are many reasons for their popularity. Control charts are a
proven technique for improving productivity, as they are effective in defect
prevention, they prevent unnecessary process adjustment, they also provide
diagnostic information and they provide information about process capability.
Modern computer technology has made it easy to implement control charts in
any type of process, as data collection and analysis can be performed on a
microcomputer or a local area network terminal in real time.
Тhe main purpose of the control chart is to improve the process. In practice
it is generally found that most processes work out of statistical control. Routine
and careful use of control charts may help in successful identification of
failures. If the causes of failures can be eliminated, variability will be reduced,
and consequently the process will be improved [1].
The application of control chart techniques on real process in thermal
power plant is described in this article. The old and newly introduced system for
measuring under-pressure differences in boiler furnace at unit B2, Thermal
Power Plants Nikola Tesla, Obrenovac, Serbia, were analyzed. The main goal of
this analysis is to confirm advantages of the newly introduced system in regard
to old system of measurement. In electric power systems the most important
task is the increase of efficiency and reliability. Therefore, the analysis of the

Fault Detection in Electric Power Systems Based on Control Charts
75
control system of the combustion process and protection from explosions in the
boiler furnace with control charts aims to help in improving the whole system
and make it more reliable.
This paper is structured as follows: in the next section we present the
general theory of control charts. In Section 3 the control system of the
combustion process and the protection from explosions in the boiler furnaces of
thermal power plant is introduced, in details with its most important features. In
Section 4 we present the application of control charts on the old and newly
introduced system for measuring under-pressure differences in boiler furnace at
various altitudes, and experimental results are presented. In Section 5 the
conclusion and a short discussion about the advantageous and the shortcomings
of the application of control charts in industrial processes and possible solutions
to problems encountered are presented.
2 General Theory of Control Charts
The control chart is a statistical tool for fault detection in the system.
Control charts make a clear difference between changes that are result of
numerous, always present immeasurable disturbances in the process and
changes that are the result of system fault. Generally speaking, control charts
present graphical display of regular, e.g., irregular operation mode of process
during time.
In any production process, regardless of how well it is designed and
maintained, a certain amount of inherent or natural variability will always exist.
This natural variability or “background noise” is the cumulative effect of many
small, essentially unavoidable causes. In the framework of statistical quality
control, a system that has this natural variability is often called a “stable system
of common causes”. A process that is operating with only common causes of
variation is said to be in statistical control. In other words, the common causes
are an inherent part of the process. Other kinds of variability may occasionally
be present in the output of the process. Such variability is generally large when
compared to the background noise, and it usually represents an unacceptable
level of process performance. We refer to these sources of variability that are
not part of the chance cause pattern as “special causes”. A process that is
operating in the presence of special causes is said to be out of control.
The control chart is a graphical display of a quality characteristic that has
been measured or computed from a sample versus the sample number or time. A
typical control chart contains a center line that represents the average value of
the quality characteristic corresponding to the in-control state, e.g. only
common causes are present. Two other horizontal lines, called the upper control
limit (UCL) and the lower control limit (LCL), are also shown on the chart.
These control limits are chosen so that if the process is in control, nearly all of

E. Kisić, V. Petrović, M. Jakovljević, Ž. Đurović
76
the sample points will fall between them. It is customary to connect the sample
points on the control chart with straight-line segments, so that it is easier to
visualize how the sequence of points has evolved over time. On Fig. 1 typical
control chart is shown.
0 5 10 15 20 25422
424
426
428
430
432
434
436
438
440Control chart
Samples
Qualit
y c
hara
cte
ristic
Central Line
UCL
LCL
Fig. 1 – Typical control chart.
Even if all the points fall inside the control limits, if they behave a
systematic or nonrandom manner, then this could be an indication that the
process is out of control. If the process is in control, all the plotted points should
have an essentially random pattern.
There is a close connection between control charts and hypothesis testing.
The control chart is a test of the hypothesis that the process is in a state of
statistical control. A point plotting within the control limits is equivalent to
failing to reject the hypothesis of statistical control. One place where the
hypothesis testing framework is useful is in analyzing the performance of a
control chart. For example, we may think of the probability of type I error of the
control chart (concluding the process is out of control when it is really in
control) and the probability of type II error of the control chart (concluding the
process is in control when it is really out of control).
We now may give a general model for a control chart. Let w be a sample
statistic that measures some quality characteristic of interest, and suppose that
the mean of w is w
μ and the standard deviation of w is w
σ . Then the center line,
the upper control limit, and the lower control limit become

Fault Detection in Electric Power Systems Based on Control Charts
77
,
,
,
w w
w
w w
UCL L
CL
LCL L
= μ + σ
= μ
= μ − σ
(1)
where L is the “distance” of the control limits from the center line, expressed in
standard deviation units. This general theory of control charts was first proposed
by Walter A. Shewhart, and control charts developed according to these
principles are often called Shewhart control charts.
Specifying the control limits is one of the critical decisions that must be
made in designing a control chart. By moving the control limits further from the
center line, we decrease the risk of a type I error. However, widening the
control limits will increase the risk of a type II error. Commonly practice is to
take for L to be L = 3 making three-sigma control limits. If the distribution of
the quality characteristics is reasonably approximated by the normal
distribution, then it is assumed that 99.7% of points will fall inside the control
limits while the system is in statistical control. In this way it is made good
balance between type I error and type II error.
The first step in constructing the control chart requires analysis of
preliminary data set which is assumed to be in statistical control. This phase is
called phase I. In this phase it is very important to establish reliable control
limits for phase II. In phase II, we use the control chart to monitor the process
by comparing the sample statistic for each successive sample as it is drawn from
the process to the control limits.
Performance of the control chart can be expressed in terms of its average
run length (ARL). Essentially, the ARL is the average number of points that
must be plotted before a point indicates an out of control condition. If the
process observations are uncorrelated, then for any Shewhart control chart, the
ARL can be calculated easily from
1
ARLp
= , (2)
where p is the probability that any point exceeds the control limits. That means
for three-sigma control limits, p = 0.0027 is the probability that a single point
falls outside the limit when the proces is in control and ARL = 370. That is,
even if the process remains in control, an out-of-control signal will be generated
every 370 samples, on average.
When we monitor only one qualitative characteristic of interest, we use
univariate control charts. When we monitor more qualitative characteristics
which are correlated we use multivariate control charts which take this
correlation into account. There are many types of control charts which can be
chosen depending on the nature of the process. In this paper is performed

E. Kisić, V. Petrović, M. Jakovljević, Ž. Đurović
78
univariate analysis with MR (Moving Range) chart for individual measurements
which actually contains two charts-upper chart is chart for individual
measurements and lower chart is MR chart.
In many applications of the individuals control chart we use the moving
range of two successive observations as the basis of estimating the process
variability. The moving range is defined as
1
| |i i i
MR x x−
= − . (3)
Let the MR be mean value of all moving ranges and x mean value of
samples. Then the control lines for control chart for individual measurements
are:
2
2
3 ,
,
3 .
MRUCL x
d
CL x
MRUCL x
d
= +
=
= +
(4)
Control lines for MR control charts are:
4
3
,
,
.
UCL D MR
CL MR
LCL D MR
=
=
=
(5)
All constants in formulas (3) and (4) are in look up tables and depend on
sample size [1].
3 Case-study: Boiler Furnace in Thermal Power Plant
In thermal power plants the most important tasks are increasing of energy
efficiency and availability and reliability of existing power plants. The
replacement of old and the installation of new distributed control systems
improve the existing electric power systems and make them more effective and
reliable. On the other hand, these computer systems for acquisition, monitoring
and regulation of complex processes, such as boiler, turbine and generator in
power plants, are opening space for simple superstructure and further
optimization of some subsystems work, e.g., for the increase of availability and
reliability of whole system. SCADA systems with appropriate PLC computers
allow not only permanent monitoring and storing of all relevant physical
quantities, but on the basis of these systems we can develop reliable protection,
warning and regulation systems. The final goal of these computer architectures
is the forming of optimized, more autonomic, reliable and safe processes.
Fault Detection in Electric Power Systems Based on Control Charts
79
Because of that, analysis of the control system of the combustion process and
protection from explosions in the boiler furnace of thermal power plant helps in
achieving this goal.
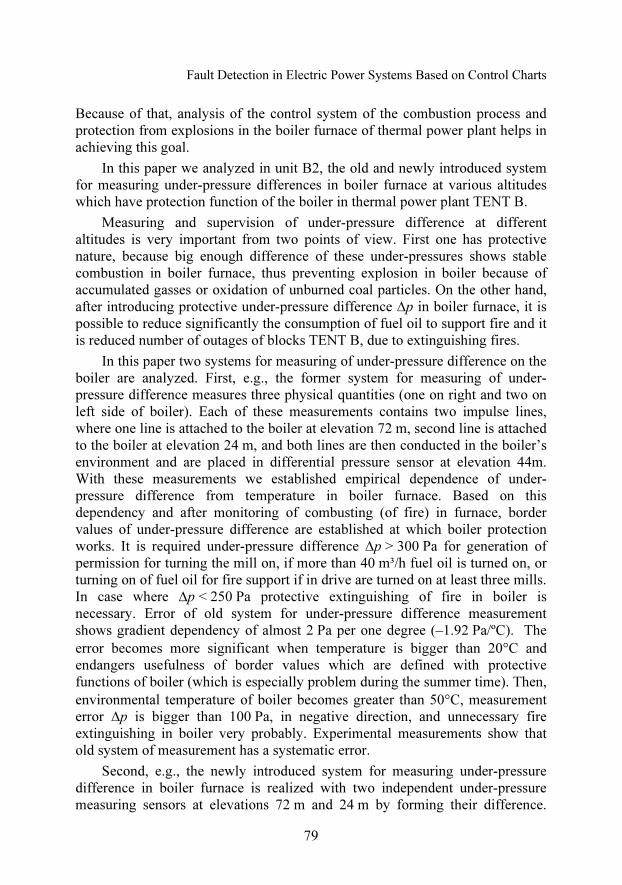
In this paper we analyzed in unit B2, the old and newly introduced system
for measuring under-pressure differences in boiler furnace at various altitudes
which have protection function of the boiler in thermal power plant TENT B.
Measuring and supervision of under-pressure difference at different
altitudes is very important from two points of view. First one has protective
nature, because big enough difference of these under-pressures shows stable
combustion in boiler furnace, thus preventing explosion in boiler because of
accumulated gasses or oxidation of unburned coal particles. On the other hand,
after introducing protective under-pressure difference ∆p in boiler furnace, it is
possible to reduce significantly the consumption of fuel oil to support fire and it
is reduced number of outages of blocks TENT B, due to extinguishing fires.
In this paper two systems for measuring of under-pressure difference on the
boiler are analyzed. First, e.g., the former system for measuring of under-
pressure difference measures three physical quantities (one on right and two on
left side of boiler). Each of these measurements contains two impulse lines,
where one line is attached to the boiler at elevation 72 m, second line is attached
to the boiler at elevation 24 m, and both lines are then conducted in the boiler’s
environment and are placed in differential pressure sensor at elevation 44m.
With these measurements we established empirical dependence of under-
pressure difference from temperature in boiler furnace. Based on this
dependency and after monitoring of combusting (of fire) in furnace, border
values of under-pressure difference are established at which boiler protection
works. It is required under-pressure difference ∆p > 300 Pa for generation of
permission for turning the mill on, if more than 40 m³/h fuel oil is turned on, or
turning on of fuel oil for fire support if in drive are turned on at least three mills.
In case where ∆p < 250 Pa protective extinguishing of fire in boiler is
necessary. Error of old system for under-pressure difference measurement
shows gradient dependency of almost 2 Pa per one degree (–1.92 Pa/ºC). The
error becomes more significant when temperature is bigger than 20°C and
endangers usefulness of border values which are defined with protective
functions of boiler (which is especially problem during the summer time). Then,
environmental temperature of boiler becomes greater than 50°C, measurement
error ∆p is bigger than 100 Pa, in negative direction, and unnecessary fire
extinguishing in boiler very probably. Experimental measurements show that
old system of measurement has a systematic error.
Second, e.g., the newly introduced system for measuring under-pressure
difference in boiler furnace is realized with two independent under-pressure
measuring sensors at elevations 72 m and 24 m by forming their difference.
E. Kisić, V. Petrović, M. Jakovljević, Ž. Đurović
80
Experimental results showed that new system for measuring under-pressure
difference eliminates systematic error, and as such presents reliable danger
quantifier from explosion, so it can be used in protection logic during blocks
starting, and also in theirs nominal regime of work.
In next section experimental results are shown in order to confirm
advantages of new system in regard to old system of measurement.
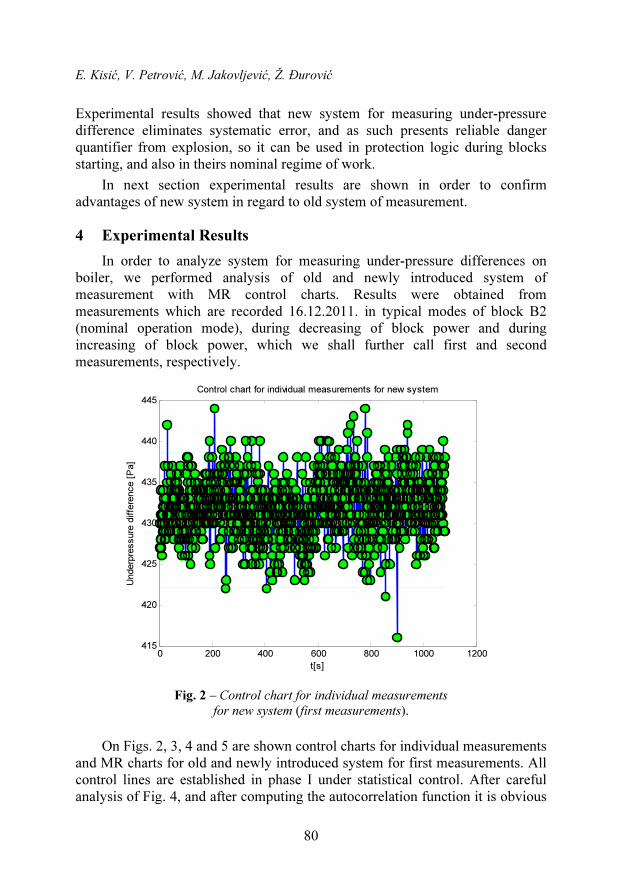
4 Experimental Results
In order to analyze system for measuring under-pressure differences on
boiler, we performed analysis of old and newly introduced system of
measurement with MR control charts. Results were obtained from
measurements which are recorded 16.12.2011. in typical modes of block B2
(nominal operation mode), during decreasing of block power and during
increasing of block power, which we shall further call first and second
measurements, respectively.
0 200 400 600 800 1000 1200415
420
425
430
435
440
445
t[s]
Underp
ressure
diffe
rence [
Pa]
Control chart for individual measurements for new system
Fig. 2 – Control chart for individual measurements for new system (first measurements).
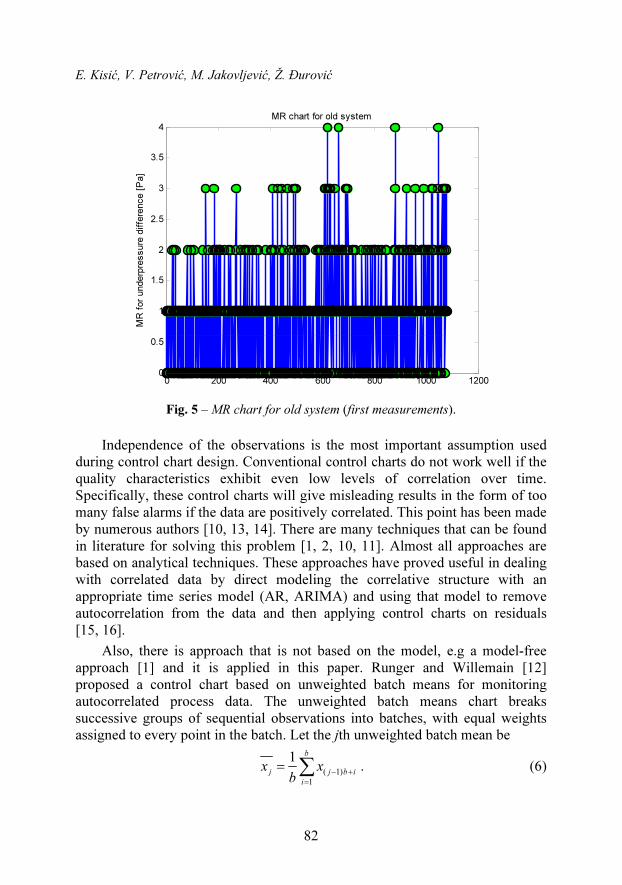
On Figs. 2, 3, 4 and 5 are shown control charts for individual measurements
and MR charts for old and newly introduced system for first measurements. All
control lines are established in phase I under statistical control. After careful
analysis of Fig. 4, and after computing the autocorrelation function it is obvious

Fault Detection in Electric Power Systems Based on Control Charts
81
that measurement of old system are correlated and that we cannot effectively
apply MR charts on these measurements until we do not solve the
autocorrelation issue.
0 200 400 600 800 1000 12000
5
10
15
20
25
MR
for
underp
ressure
diffe
rence [
Pa]
MR chart for new system
Fig. 3 – MR chart for new system (first measurements).
0 200 400 600 800 1000 1200356
358
360
362
364
366
368
t[s]
Underp
ressure
diffe
rence [
Pa]
Control chart for individual measurements for old system
Fig. 4 – Control chart for individual measurements for old system (first measurements).
E. Kisić, V. Petrović, M. Jakovljević, Ž. Đurović
82
0 200 400 600 800 1000 12000
0.5
1
1.5
2
2.5
3
3.5
4
MR
for
underp
ressure
diffe
rence [
Pa]
MR chart for old system
Fig. 5 – MR chart for old system (first measurements).
Independence of the observations is the most important assumption used
during control chart design. Conventional control charts do not work well if the
quality characteristics exhibit even low levels of correlation over time.
Specifically, these control charts will give misleading results in the form of too
many false alarms if the data are positively correlated. This point has been made
by numerous authors [10, 13, 14]. There are many techniques that can be found
in literature for solving this problem [1, 2, 10, 11]. Almost all approaches are
based on analytical techniques. These approaches have proved useful in dealing
with correlated data by direct modeling the correlative structure with an
appropriate time series model (AR, ARIMA) and using that model to remove
autocorrelation from the data and then applying control charts on residuals
[15, 16].
Also, there is approach that is not based on the model, e.g a model-free
approach [1] and it is applied in this paper. Runger and Willemain [12]
proposed a control chart based on unweighted batch means for monitoring
autocorrelated process data. The unweighted batch means chart breaks
successive groups of sequential observations into batches, with equal weights
assigned to every point in the batch. Let the jth unweighted batch mean be
( 1)
1
1b
j j b i
i
x xb
− +
=
= ∑ . (6)

Fault Detection in Electric Power Systems Based on Control Charts
83
The important implication of equation (6) is that although one has to
determine an appropriate batch size b, it is not necessary to construct an
ARIMA model of the data. This approach is quite standard in simulation output
analysis, which also focuses on inference for long time series with high
autocorrelation.
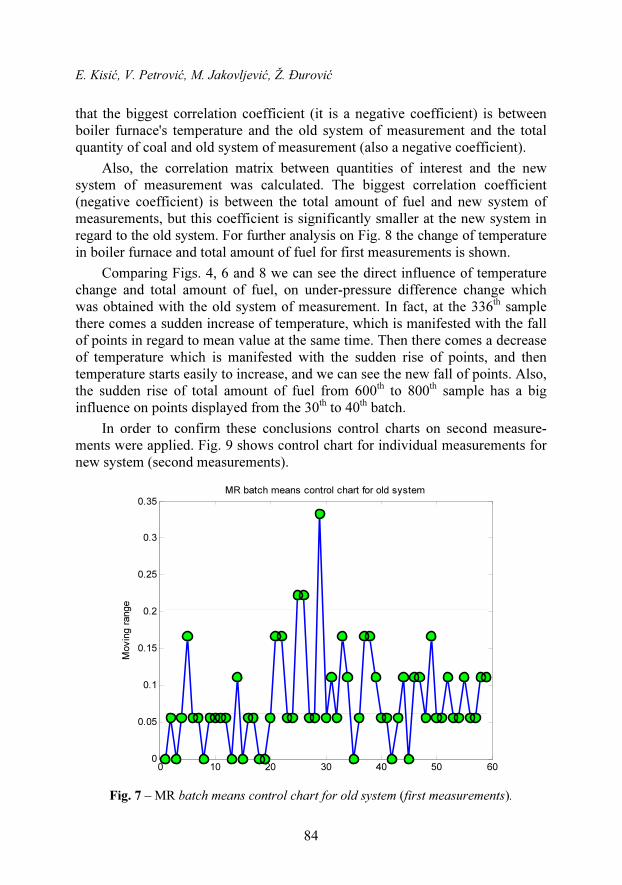
Using formula (6) we created batch means and applied MR control chart on
them. On Fig. 6 batch means control chart for individual values for old system
and first measurement is shown, while on Fig. 7 MR batch means control chart
for old system and first measurement is shown. b = 18 is chosen for batch size.
0 10 20 30 40 50 6019.8
19.85
19.9
19.95
20
20.05
20.1
20.15
20.2
20.25
20.3
Subgroup
Indiv
idual valu
e
Batch means control chart for individual value for old system
Fig. 6 – Batch means control chart for individual values for old system (first measurements).
After analysis of Figs. 6 and 7 we can conclude that the number of points
which are within control lines is much bigger in regard to MR control charts
from Figs. 4 and 5 where we could not apply control charts properly because of
correlated data.
On Figs. 6 and 7 we can see that, although most of the points are within
control lines, they do not form random pattern. We calculated the correlation
matrix between under-pressure difference which is measured with old system of
measurement and quantities of interest (block power at generator's output, boiler
furnace's temperature at elevation +79 m, total air flow and total quantity of
coal) so we could see which of these quantities has the biggest influence on old
system of measurements. After we computed correlation matrix it was obvious
E. Kisić, V. Petrović, M. Jakovljević, Ž. Đurović
84
that the biggest correlation coefficient (it is a negative coefficient) is between
boiler furnace's temperature and the old system of measurement and the total
quantity of coal and old system of measurement (also a negative coefficient).
Also, the correlation matrix between quantities of interest and the new
system of measurement was calculated. The biggest correlation coefficient
(negative coefficient) is between the total amount of fuel and new system of
measurements, but this coefficient is significantly smaller at the new system in
regard to the old system. For further analysis on Fig. 8 the change of temperature
in boiler furnace and total amount of fuel for first measurements is shown.
Comparing Figs. 4, 6 and 8 we can see the direct influence of temperature
change and total amount of fuel, on under-pressure difference change which
was obtained with the old system of measurement. In fact, at the 336th sample
there comes a sudden increase of temperature, which is manifested with the fall
of points in regard to mean value at the same time. Then there comes a decrease
of temperature which is manifested with the sudden rise of points, and then
temperature starts easily to increase, and we can see the new fall of points. Also,
the sudden rise of total amount of fuel from 600th to 800
th sample has a big
influence on points displayed from the 30th to 40
th batch.
In order to confirm these conclusions control charts on second measure-
ments were applied. Fig. 9 shows control chart for individual measurements for
new system (second measurements).
0 10 20 30 40 50 600
0.05
0.1
0.15
0.2
0.25
0.3
0.35
Movin
g r
ange
MR batch means control chart for old system
Fig. 7 – MR batch means control chart for old system (first measurements).

Fault Detection in Electric Power Systems Based on Control Charts
85
(a) (b)
Fig. 8 – (a) Change of temperature in boiler furnace (+79 m right) for first measurements (b) Time dependency for total amount of fuel for first measurements.
0 200 400 600 800 1000 1200 1400 1600 1800405
410
415
420
425
430
435
440
445
450
t[s]
Underp
ressure
diffe
rence [
Pa]
Control chart for individual measurements for new system
Fig. 9 – Control chart for individual measurements for new system (second measurements).
Fig. 10 shows MR chart for new system for second measurements. On Fig. 11
the batch means control chart for individual values for old system (second
measurement) is showed. On Fig. 12 MR batch means control chart for old
system for second measurements is shown. For batch size b = 22 is chosen.

E. Kisić, V. Petrović, M. Jakovljević, Ž. Đurović
86
0 200 400 600 800 1000 1200 1400 1600 18000
5
10
15
20
25
30M
R f
or
underp
ressure
diffe
rence [
Pa]
MR chart for new system
Fig. 10 – MR chart for new system (second measurements).
0 10 20 30 40 50 60 70 80 9016.1
16.2
16.3
16.4
16.5
16.6
16.7
Subgroup
Indiv
idual valu
e
Batch means control chart for individual value for old system
Fig. 11 – Batch means control chart for individual values for old system (second measurements).

Fault Detection in Electric Power Systems Based on Control Charts
87
0 10 20 30 40 50 60 70 800
0.05
0.1
0.15
0.2
0.25
0.3
0.35M
ovin
g r
ange
MR batch means control chart for old system
Fig. 12 – MR batch means control chart for old system (second measurements).
Again, in order to investigate which of quantities of interest has the biggest
influence on new and old system of measurements, the correlation matrix was
computed. Based on the correlation matrix it is obvious that on old and new
system of measurement the biggest influence has total air flow, except that this
correlation coefficient is significantly bigger for old, than for the new system.
For further analysis on Fig. 13 time dependency of total air flow is shown.
Comparing Figs. 11 and 13 a big dependence of total air flow and old system of
measurement is noticeable. This effect is especially expressed from the 800th to
1000th sample where sudden rise and fall of points on control chart happen. This
influence is also noticeable at the new system of measurement, but it is much
smaller compared to the old system of measurement.
Because of demonstrated strong influence of quantities of interest on old
system of measurement, many false alarms could be seen. We applied control
charts on measurements which are recorded during the nominal operation mode,
e.g., while the process was stable and in control, and, again, old system showed
irregularity of functioning. As we pointed out in Section 3 in case where under-
pressure difference is ∆p < 250 Pa protective extinguishing of fire in boiler is
necessary. That means if protective under-pressure difference is not reliable
than unnecessary extinguishing of fire is very probably which leads to block
outage and very big financial and material costs. This analysis confirmed the
unreliability of the old system of measurement.

E. Kisić, V. Petrović, M. Jakovljević, Ž. Đurović
88
0 200 400 600 800 1000 1200 1400 1600 18001250
1300
1350
1400
1450
1500
1550
1600
1650
t[s]
Tota
l air f
low
[N
m3/h
]
Total air flow
Fig. 13 – Time change of total air flow for second measurements.
5 Conclusion
After the detailed analysis of control charts that we applied on the old and new system of measurement, we can notice significantly stronger influence of quantities of interest (temperature in boiler furnace, total air flow and block power at generator's output) on the old system of measurement in regard to new system of measurement. Because of this fact reliability of the old system of measurement is questioned. Control charts confirmed that old system of measurement has a systematic error and endangers the reliability of the whole process.
The data from the new system of measurements have much noise, therefore the data have bigger variance and some points are outside of control limits. It is pretty sure that with adequate filtration of these data a big number of points that are outside of control limits would fall within the control limits. This is an explanation of false alarms on control charts for the new system of measurement.
During the control charts designing some problems were encountered. The first problem was the autocorrelation of data from the old system of measurements. We applied model-free approach and created batch means control charts in order to reduce the autocorrelation. In some future work there is possibility for constructing time series models and applying control charts on residuals.

Fault Detection in Electric Power Systems Based on Control Charts
89
The second problem that we had during the control chart designing was
nonnormality of data from the old system of measurement. General model of
control chart assume normal distribution of data and therefore if we choose
three-sigma control limits then it is assumed that 99.7% of points will fall inside
the control limits while the system is in statistical control. Very often this
assumption is not valid, so control charts that do not assume normality of data
are developed. They can be found in literature as distribution-free or
nonparamteric control charts [17 – 20]. A key advantage of distribution-free
charts is that the user does not need to assume any particular distribution (such
as the normal distribution) for the underlying process and the in-control
probability calculations and associated conclusions remain valid for any
continuous distribution. This distribution robustness could be an advantage,
particularly, in start-up situations where we usually do not have knowledge of
the underlying distribution.
Also, there is a big problem with control chart designing of dynamic-
behavior processes. A possible solution for this problem would be the making
of adaptive control limits that follow system dynamics in the sense that big
variation from central line which is consequence of system dynamics, not
system fault, is treated as the nominal operation mode. In the literature one can
find some solutions for this problem [21], but there is a lot of space for new
ideas.
Control charts could be used as one more type of boiler protection from
explosion in power plant. If we could collect big enough number of
measurements for reliable estimation of control limits in phase I, which would
be adaptive and totally follow process behavior, application of control charts in
phase II, e.g. online data monitoring would be very efficient. Analyzing of
points that are outside of control limits, or form nonrandom pattern on control
charts we could notice that something is wrong with sensor system or maybe we
could detect system fault. We could remove assignable causes and improve the
process which is the main purpose of control charts.
6 References [1] D.C. Montgomery: Introduction to Statistical Quality Control, 5th Edition, New York, John
Wiley and Sons, Hoboken, NJ, USA, 2005.
[2] R.L. Mason, J.C. Young: Multivariate Statistical Process Control with Industrial
Applications, ASA-SIAM, Philadelphia, PA, USA, 2002.
[3] L.H. Chiang, E.L. Russell, R.D. Braatz: Fault Detection and Diagnosis in Industrial
Systems, Springer-Verlag, NY, USA, 2001.
[4] S. Verron, T. Tiplica, A. Kobi: Multivariate Control Charts with a Bayesian Network,
4th International Conference on Informatics in Control, Automation and Robotics, Angers,
France, 09 – 12 May 2007, pp. 228 – 233.

E. Kisić, V. Petrović, M. Jakovljević, Ž. Đurović
90
[5] E.J. Jackson: Multivariate Quality Control, Communications in Statistics – Theory and
Methods, Vol. 14, No. 11, 1985, pp. 2657 – 2688.
[6] B.R. Bakshi: Multiscale PCA with Application to Multivariate Statistical Process
Monitoring, AIChE Journal, Vol. 44, No. 7, July 1998, pp. 1596 – 1610.
[7] T. Kourti, J.F. MacGregor: Multivariate SPC Methods for Process and Product Monitoring,
Journal of Quality Technology, Vol. 28, No. 4, Oct. 1996, pp. 409 – 428.
[8] S. Verron, J. Li, T. Tiplica: Identification of Faults in a Multivariate Process with Bayesian
Network, Journal of Process Control, Vol. 20, No. 8, Sept. 2010, pp. 902 – 911.
[9] W.A. Shewhart: Economic Control of Quality of Manufactured Product, D. Van Nostrand
Co., NY, USA, 1931.
[10] D.C. Montgomery, C.M. Mastrangelo, F.W. Faltin, W.H. Woodall, J.F. Macgregor, T.P.
Ryan: Some Statistical Process Control Methods for Autocorrelated Data (with
Discussions), Journal of Quality Technology, Vol. 23, No. 3, July 1991, pp. 179 – 204.
[11] S.H. Park, G.G. Vining: Statistical Monitoring and Optimization for Process Control,
Marcel Dekker, NY, USA, 1999.
[12] G.C. Runger, T.R. Willemain: Batch Means Control Charts for Autocorrelated Data, IIE
Transactions, Vol. 28, No. 6, 1996, pp. 483 – 487.
[13] L.C. Alwan: Effects of Autocorrelation on Control Charts, Communications in Statistics –
Theory and Methods, Vol. 21, No. 4, 1992, pp. 1025 – 1049.
[14] T.J. Harris, W.H. Ross: Statistical Process Control Procedures for Correlated Observations,
Canadian Journal of Chemical Engineering, Vol. 69, No. 1, Feb. 1991, pp. 48 – 57.
[15] D.C. Montgomery, L.A. Johnson, J.S. Gardiner: Forecasting and Time Series Analysis,
2nd Edition, McGraw-Hill, NY, USA, 1990.
[16] G.E.P. Box, G.M. Jenkins, G.C. Reinsel: Time Series Analysis, Forecasting, and Control,
3rd Edition, Prentice-Hall, Englewood Cliffs, NJ, USA, 1994.
[17] S. Chakraborti, P. van der Laan, M.A. van der Wiel: A Class of Distribution-free Control
Charts, Journal of the Royal Statistical Society Series C – Applied Statistics, Vol. 53, No. 3,
Sept. 2004, pp. 443 – 462.
[18] N. Das: A Non-parametric Control Chart for Controlling Variability based on Squared rank
Test, Journal of Industrial and System Engineering, Vol. 2, No. 2, 2008, pp. 114 – 125.
[19] G.J. Janacek, S.E. Meikle: Control Charts Based on Medians, Journal of the Royal
Statistical Society: Series D (The Statistician), Vol. 46, No. 1, April 1997, pp. 19 – 31.
[20] S. Chakraborti, P. van der Laan, S.T. Bakir: Nonparametric Control Charts: An Overview
and Some Results, Journal of Quality Technology, Vol. 33, No. 3, July 2001, pp. 304 – 315.
[21] S. Haridy, Z. Wu: Univariate and Multivariate Control Charts for Monitoring Dynamic-
behavior Processes: A Case Study, Journal of Industrial Engineering and Management,
Vol. 2, No. 3, 2009, pp. 464 – 498.