fats and oils: prod., consumption & stocks of the 1998 manufacturing profiles, ... 1,170.1 447.3...
TRANSCRIPT

Fats and Oils: Production, Consumption, December
and Stocks 2000Issued February 2001
M311K(00)-12
Information about the scope of the survey, These data are also available through the U.S. Current methodology, explanation of terms and historical Department of Commerce and STAT-USA Industrialnotes for this survey may be found in the Electronic Bulletin Board by subscription. To Reportsintroduction of the 1998 Manufacturing Profiles, access, dial 202-482-3870 and follow the issued December 2000. prompts to register. Also, you may call
202-482-1986 or 1-800-STAT-USA, for Current data are released electronically on Internet further information. The Internet address is:for all individual surveys as they become avail- www.stat-usa.gov/.able. Use: http://www.census.gov/econ/www/ manumenu.html. Individual reports can be NOTEaccessed by choosing "Current Industrial Reports (CIR's)," clicking on "Report Number Index;" from Data are now published on the new Norththe "Industrial Products by Numeric Index," American Industry Classification System (NAICS)choose the survey of interest. Follow the basis and therefore are not always comparablemenu to view the PDF file or to download the to the old Standard Industrial Classificationworksheet file (WK format) to your personal (SIC) code. For further information on NAICS,computer. see www.census.gov/epcd/www/naics.html.
Address inquiries concerning these data to Consumer Goods Industries Branch, Manufacturing and Construction Division (MCD), Washington, DC 20233-6900, or call Thomas Hook, 301-457-1320.
For mail or fax copies of this publication, please contact the Information Services Center, MCD, Washington, DC 20233-6900, or call 301-457-4673.
U S C E N S U S B U R E A U U.S. Department of Commerce Economics and Statistics Administration
Helping You Make Informed Decisions U.S. Census Bureau

Table 1a. Selected Items of Fats and Oil Consumption, Seasonally Adjusted: 1998 to 2000[Millions of pounds]
Edible oils consumed in-- TotalYear and month Other inedible
Baking or Salad or edible oilsTotal frying fats cooking oil Margarine products consumed
Year-to-date: 2000 .....................16,052.5 5,748.6 8,116.2 1,764.7 423.0 6,341.2 1999 ........................15,593.7 5,843.3 7,677.7 1,654.5 418.2 6,788.0
2000
December ...........................................1,170.1 447.3 528.8 162.1 31.9 489.8November ...........................................1,168.7 447.6 528.7 159.7 32.7 488.3October ...........................................1,432.5 491.0 745.3 159.5 36.7 534.9September ...........................................1,341.5 475.3 693.3 134.5 38.4 513.1August ...........................................1,405.8 522.3 698.5 150.6 34.4 549.1July.................................... 1,352.3 484.7 696.0 139.9 31.7 499.6
June .................................. 1,363.4 477.5 703.5 144.2 38.2 544.8May .....................................1,380.5 479.2 712.5 153.8 35.0 546.5April ................................... 1,306.7 449.2 688.4 136.0 33.1 530.1March .............................. 1,398.9 477.0 736.2 142.4 43.3 547.5February ...............................1,373.5 499.2 692.5 146.3 35.5 545.6January................................1,358.6 498.3 692.5 135.7 32.1 551.9
1999
Total .........................15,593.7 5,843.3 7,677.7 1,654.5 418.2 6,788.0
December ....................................1,345.3 499.8 682.5 126.7 36.3 574.8November ...........................1,372.6 514.7 688.6 133.4 35.9 585.6October ...............................1,307.6 500.9 642.0 127.1 37.6 547.4September ......................... 1,334.2 494.6 657.8 144.0 37.8 577.2August ............................... 1,312.9 476.8 653.2 150.0 32.9 573.2July ............................................1,309.4 471.7 661.0 141.5 35.2 559.4
June ....................................1,291.3 479.7 630.0 143.4 38.2 576.3May ........................................1,263.0 475.6 617.7 135.2 34.5 526.0April ................................... 1,267.0 476.6 619.6 140.0 30.8 558.9March ............................... 1,312.8 485.0 652.4 138.4 37.0 590.5February ..............................1,233.0 474.0 589.6 138.1 31.3 573.1January ................................1,244.6 493.9 583.3 136.7 30.7 545.6
1998
Total .........................15,317.6 5,755.2 7,500.0 1,697.7 364.7 6,577.2
December ....................................1,227.2 464.3 599.8 130.2 32.9 559.2November ...........................1,314.3 474.3 669.8 139.5 30.7 557.6October ...............................1,332.7 491.2 668.4 141.5 31.6 534.7September ......................... 1,268.3 484.2 602.4 146.1 35.6 556.6August ............................... 1,266.1 472.4 625.2 138.8 29.7 536.2July ............................................1,289.5 495.7 623.1 144.4 26.3 546.6
June ....................................1,286.8 482.7 623.2 144.8 36.1 537.2May ........................................1,287.2 486.7 629.6 140.7 30.2 530.4April ................................... 1,219.2 483.1 566.1 142.0 28.0 546.3March ............................... 1,260.8 475.1 604.3 146.7 34.7 567.0February ..............................1,293.1 474.6 651.2 143.9 23.4 534.0January ................................1,272.4 470.9 636.9 139.1 25.5 571.4

Table 1b. Selected Items of Fats and Oil Consumption, Not Seasonally Adjusted: 1998 to 2000[Millions of pounds]
Edible oils consumed in-- TotalYear and month Other inedible
Baking or Salad or edible oilsTotal frying fats cooking oil Margarine products consumed
Year-to-date: 2000 .....................16,289.8 5,834.1 8,345.8 1,686.9 423.0 6,416.9 1999 ........................15,595.7 5,838.3 7,689.7 1,649.5 418.2 6,785.8
2000
December ...........................................1,290.1 477.3 646.5 134.4 31.9 515.9November ...........................................1,353.1 511.7 680.0 128.7 32.7 522.0October ...........................................1,526.5 552.0 758.5 179.3 36.7 538.9September ...........................................1,369.7 505.2 679.5 146.6 38.4 529.1August ...........................................1,463.8 550.3 725.5 153.6 34.4 555.1July.................................... 1,294.3 465.7 674.0 122.9 31.7 509.6
June .................................. 1,318.3 463.5 681.4 135.2 38.2 556.8May ..................................... 1,385.5 474.2 731.5 144.8 35.0 551.5April ................................... 1,289.7 439.2 691.4 126.0 33.1 532.1March .............................. 1,445.2 490.0 758.5 153.4 43.3 571.4February ............................... 1,257.0 443.7 641.5 136.3 35.5 512.6January................................ 1,296.6 461.3 677.5 125.7 32.1 521.9
1999
Total .........................15,595.7 5,838.3 7,689.7 1,649.5 418.2 6,785.8
December ....................................1,338.3 485.8 678.5 137.7 36.3 567.8November ........................... 1,421.6 528.7 709.6 147.4 35.9 567.4October ............................... 1,390.6 552.9 654.0 146.1 37.6 556.4September ......................... 1,371.2 524.6 654.8 154.0 37.8 594.2August ............................... 1,368.9 508.8 679.2 148.0 32.9 572.2July ............................................1,253.4 454.7 640.0 123.5 35.2 572.4
June .................................... 1,248.3 468.7 611.0 130.4 38.2 585.3May ........................................1,267.0 473.6 634.7 124.2 34.5 537.0April ................................... 1,272.0 468.6 639.6 133.0 30.8 567.9March ............................... 1,353.8 501.0 668.4 147.4 37.0 606.5February .............................. 1,132.0 419.0 553.6 128.1 31.3 547.1January ................................ 1,178.6 451.9 566.3 129.7 30.7 511.6
1998
Total .........................15,302.6 5,749.2 7,497.0 1,691.7 364.7 6,573.2
December ....................................1,225.2 453.3 593.8 145.2 32.9 548.2November ........................... 1,353.3 487.3 678.8 156.5 30.7 537.6October ............................... 1,422.7 541.2 688.4 161.5 31.6 549.7September ......................... 1,304.3 515.2 598.4 155.1 35.6 569.6August ............................... 1,323.1 505.4 651.2 136.8 29.7 537.2July ............................................1,229.5 475.7 602.1 125.4 26.3 555.6
June .................................... 1,245.8 472.7 605.2 131.8 36.1 545.2May ........................................1,287.2 483.7 645.6 127.7 30.2 542.4April ................................... 1,221.2 475.1 585.1 133.0 28.0 556.3March ............................... 1,299.8 491.1 619.3 154.7 34.7 573.0February .............................. 1,186.1 418.6 612.2 131.9 23.4 512.0January ................................ 1,204.4 429.9 616.9 132.1 25.5 546.4
Note: Totals may not match Table 3a because of independent rounding.

Table 2. Production and Stocks of Edible and Inedible Fats[Thousands of pounds]
December 2000 November 2000
Product description 1/ Stocks, Stocks,Pro- end of Pro- end of
duction month duction month
Lard .......................................................................... (NA) 16,006 (NA) 16,806
Edible tallow ............................................................127,744 36,943 r/ 132,386 36,013
Inedible tallow and grease .............................................546,376 336,490 r/ 585,004 377,137 Inedible tallow ........................................................289,909 203,218 r/ 314,843 225,069 Greases ..................................................................254,113 129,238 267,783 147,330 Inedible tallow and grease, n.s.k. ...............................2,354 4,034 2,378 4,738
Meat meal and tankage ...........................................452,372 (NA) r/ 476,931 (NA) Meat and bone meal ................................................340,349 48,487 r/ 354,352 62,087 Dry rendered tankage ..........................................108,665 14,611 r/ 118,777 17,532 Meat meal and tankage, n.s.k. .......................................3,358 (NA) r/ 3,802 (NA)
Feather meal .................................................................64,146 7,345 r/ 65,896 r/ 6,760
All other products 2/..................................................193,785 20,333 r/ 198,827 18,526
Crude tall oil ................................................................81,400 117,035 91,591 105,405
Vegetable foots ..........................................................28,416 8,942 29,722 8,262
NA Not available. n.s.k. Not specified by kind. r/Revised by 5 percent or more from previously published data.
1/Data for production are rendered fats only. Those for end-of-month's stocks include rendered and refined fats. 2/Includes poultry fat and by-products meal, blood meal, and raw products for pet food.

Table 3a. Total Quantity of Consumption of Fats and Oils in Edible and Inedible Products [Thousands of pounds]
December NovemberProduct description 2000 2000
Consumption in edible products 1/................ 1,290,123 1,352,840
Baking or frying fats ................................................ 477,325 511,710Salad or cooking oil ................................................ 646,548 679,698Margarine ................................................................. 134,399 r/ 128,700Other edible products 2/ ...................................... 31,851 32,732
Consumption in inedible products 1/........... 515,868 522,027
Soap ............................................................................. 24,145 27,755Paint and varnish ...................................................... 10,396 8,563Feed ........................................................................... 268,806 277,555Resins and plastics ................................................... 11,290 12,587Lubricants ................................................................. 10,117 11,231Fatty acids ................................................................. 149,830 143,549Other inedible products ................................................ 41,284 40,787
r/Revised by 5 percent or more from previously published data.
1/Includes hydrogenated fats (vegetable and animal) and other fats and oils in process. 2/Includes confectioner's fats.

Table 3b. Total Consumption of Fats and Oils in Edible and Inedible Products[Thousands of pounds]
Edible products Inedible products
Product description 1/ December November December November2000 2000 2000 2000
All oils................................1,290,123 1,352,840 515,868 522,027
Cottonseed................................ 34,727 34,669 (D) (D)Soybean..................................... 1,032,287 r/ 1,087,813 48,229 51,929Corn............................................ 48,586 51,561 4 3Peanut......................................... 24,010 30,063 (D) (D)Tall.................................................. - - 96,301 89,439Safflower seed.............................. (D) (D) (D) (D)Palm.............................................. (D) (D) 3,218 2,204Coconut...................................... 17,633 17,980 25,438 26,277Linseed........................................ - - 5,822 6,479Inedible tallow................................... - - 297,878 303,706Tung.............................................. - - 802 700Castor........................................... - - 2,432 4,601Palm kernel................................. (D) (D) (D) (D)Rapeseed....................................... 57,076 53,495 (D) (D)Edible tallow.................................. 23,374 25,232 12,373 12,696Lard............................................... 25,040 22,943 6,665 6,622Sunflower..................................... (D) 5,507 (D) 223Vegetable oil foots......................... - - 7,996 9,520Fish............................................... - - 205 146Other fats and oils.......................... (D) (D) (D) (D)
- Represents zero. D Withheld to avoid disclosing data for individual companies. r/Revised by 5 percent or more from previously publisheddata.
1/Includes hydrogenated fats (vegetable and animal) and other fats and oils in process.
Continued 1
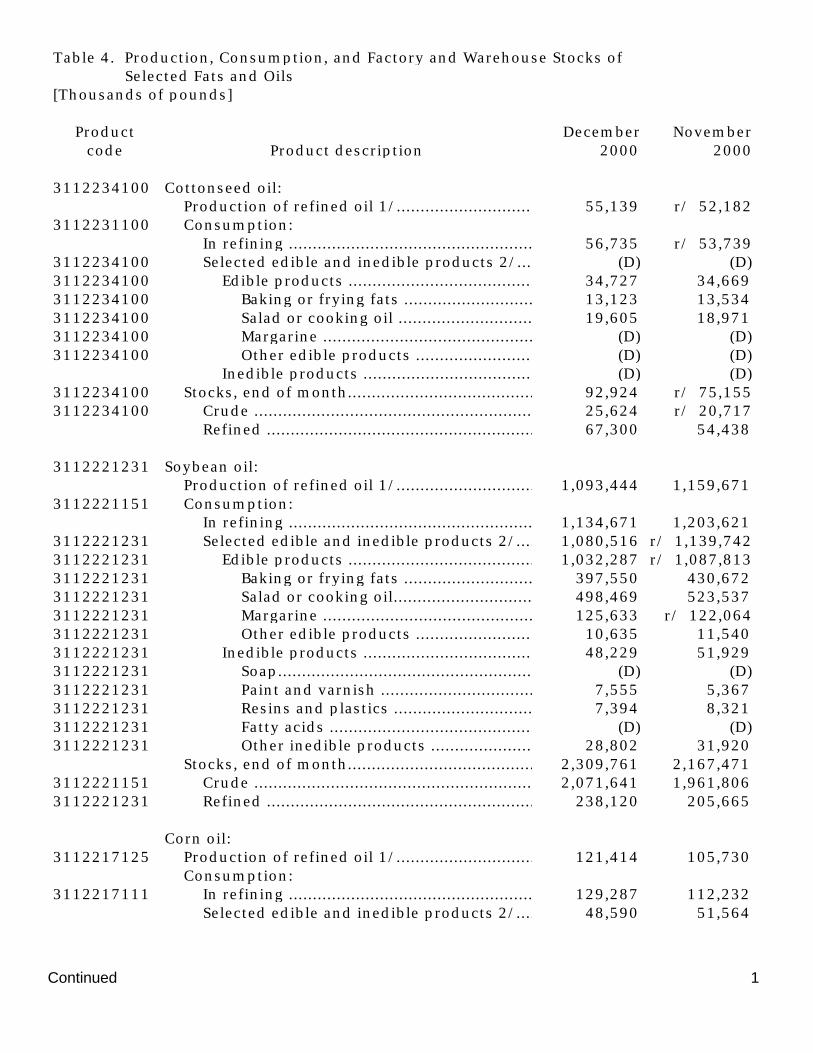
Table 4. Production, Consumption, and Factory and Warehouse Stocks of Selected Fats and Oils[Thousands of pounds]
Product December Novembercode Product description 2000 2000
3112234100 Cottonseed oil: Production of refined oil 1/........................................55,139 r/ 52,182
3112231100 Consumption: In refining ..............................................................56,735 r/ 53,739
3112234100 Selected edible and inedible products 2/............... (D) (D)3112234100 Edible products .................................................34,727 34,6693112234100 Baking or frying fats ........................................13,123 13,5343112234100 Salad or cooking oil .........................................19,605 18,9713112234100 Margarine .......................................................... (D) (D)3112234100 Other edible products .............................................................................................................................................. . . . . (D) (D)
Inedible products ............................................................. ............................................................. . . . . . . . . . . . . . . (D) (D)3112234100 Stocks, end of month............................................................. ............................................................. . . . . . . . . . . . . . . . 92,924 r/ 75,1553112234100 Crude ............................................................. ............................................................. . . . . . . . . . . . . . . . . . . . . . 25,624 r/ 20,717
Refined ............................................................. ............................................................. . . . . . . . . . . . . . . . . . . . . 67,300 54,438
3112221231 Soybean oil: Production of refined oil 1/............................................................. ............................................................. . . . . . . . . . . . . 1,093,444 1,159,671
3112221151 Consumption: In refining ............................................................. ............................................................. . . . . . . . . . . . . . . . . . . . 1,134,671 1,203,621
3112221231 Selected edible and inedible products 2/............................................................. ............................................................. . . . . . 1,080,516 r/ 1,139,7423112221231 Edible products ............................................................. ............................................................. . . . . . . . . . . . . . . . 1,032,287 r/ 1,087,8133112221231 Baking or frying fats ............................................................. ............................................................. . . . . . . . . . . . 397,550 430,6723112221231 Salad or cooking oil............................................................. ............................................................. . . . . . . . . . . . . 498,469 523,5373112221231 Margarine ............................................................. ............................................................. . . . . . . . . . . . . . . . . . 125,633 r/ 122,0643112221231 Other edible products ............................................................. ............................................................. . . . . . . . . . . . 10,635 11,5403112221231 Inedible products ............................................................. ............................................................. . . . . . . . . . . . . . . 48,229 51,9293112221231 Soap............................................................. ............................................................. . . . . . . . . . . . . . . . . . . . . (D) (D)3112221231 Paint and varnish ............................................................. ............................................................. . . . . . . . . . . . . . 7,555 5,3673112221231 Resins and plastics ............................................................. ............................................................. . . . . . . . . . . . . 7,394 8,3213112221231 Fatty acids ............................................................. ............................................................. . . . . . . . . . . . . . . . . (D) (D)3112221231 Other inedible products ............................................................. ............................................................. . . . . . . . . . . 28,802 31,920
Stocks, end of month............................................................. ............................................................. . . . . . . . . . . . . . . . 2,309,761 2,167,4713112221151 Crude ............................................................. ............................................................. . . . . . . . . . . . . . . . . . . . . . 2,071,641 1,961,8063112221231 Refined ............................................................. ............................................................. . . . . . . . . . . . . . . . . . . . . 238,120 205,665
Corn oil:3112217125 Production of refined oil 1/............................................................. ............................................................. . . . . . . . . . . . 121,414 105,730
Consumption:3112217111 In refining .......................................................................................................................... 129,287 112,232
Selected edible and inedible products 2/............................................................. ............................................................. . . . . 48,590 51,564
Continued 2
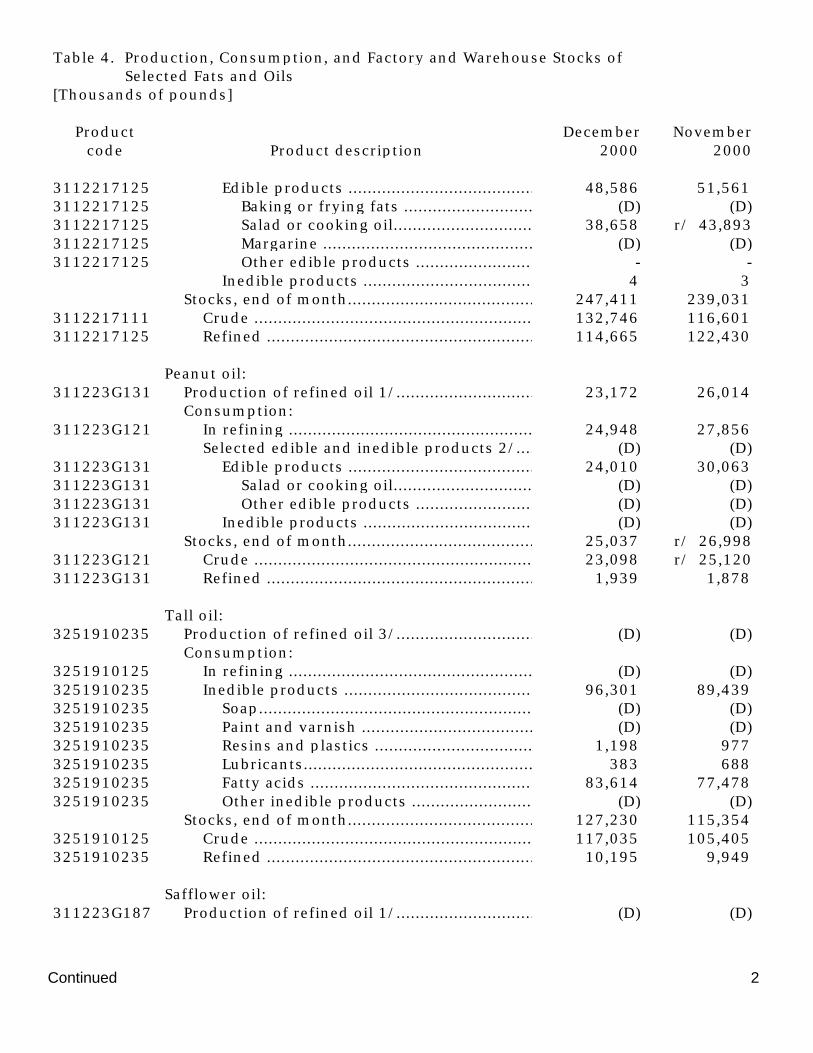
Table 4. Production, Consumption, and Factory and Warehouse Stocks of Selected Fats and Oils[Thousands of pounds]
Product December Novembercode Product description 2000 2000
3112217125 Edible products ............................................................. ............................................................. . . . . . . . . . . . . . . . 48,586 51,5613112217125 Baking or frying fats ............................................................. ............................................................. . . . . . . . . . . . (D) (D)3112217125 Salad or cooking oil............................................................. ............................................................. . . . . . . . . . . . . 38,658 r/ 43,8933112217125 Margarine ............................................................. ............................................................. . . . . . . . . . . . . . . . . . (D) (D)3112217125 Other edible products ............................................................. ............................................................. . . . . . . . . . . . - -
Inedible products ............................................................. ............................................................. . . . . . . . . . . . . . . 4 3 Stocks, end of month............................................................. ............................................................. . . . . . . . . . . . . . . . 247,411 239,031
3112217111 Crude ............................................................. ............................................................. . . . . . . . . . . . . . . . . . . . . . 132,746 116,6013112217125 Refined ............................................................. ............................................................. . . . . . . . . . . . . . . . . . . . . 114,665 122,430
Peanut oil:311223G131 Production of refined oil 1/............................................................. ............................................................. . . . . . . . . . . . 23,172 26,014
Consumption:311223G121 In refining ............................................................................................................. 24,948 27,856
Selected edible and inedible products 2/............................................................. ............................................................. . . . . (D) (D)311223G131 Edible products ............................................................. ............................................................. . . . . . . . . . . . . . . . 24,010 30,063311223G131 Salad or cooking oil............................................................. ............................................................. . . . . . . . . . . . . (D) (D)311223G131 Other edible products ............................................................. ............................................................. . . . . . . . . . . . (D) (D)311223G131 Inedible products ............................................................. ............................................................. . . . . . . . . . . . . . . (D) (D)
Stocks, end of month............................................................. ............................................................. . . . . . . . . . . . . . . . 25,037 r/ 26,998311223G121 Crude ............................................................. ............................................................. . . . . . . . . . . . . . . . . . . . . . 23,098 r/ 25,120311223G131 Refined ............................................................. ............................................................. . . . . . . . . . . . . . . . . . . . . 1,939 1,878
Tall oil:3251910235 Production of refined oil 3/............................................................. ............................................................. . . . . . . . . . . . (D) (D)
Consumption:3251910125 In refining ............................................................. ............................................................. . . . . . . . . . . . . . . . . . . (D) (D)3251910235 Inedible products ............................................................. ............................................................. . . . . . . . . . . . . . . . 96,301 89,4393251910235 Soap............................................................. ............................................................. . . . . . . . . . . . . . . . . . . . . . (D) (D)3251910235 Paint and varnish ............................................................. ............................................................. . . . . . . . . . . . . . . (D) (D)3251910235 Resins and plastics ............................................................. ............................................................. . . . . . . . . . . . . . 1,198 9773251910235 Lubricants............................................................. ............................................................. . . . . . . . . . . . . . . . . . . 383 6883251910235 Fatty acids ............................................................. ............................................................. . . . . . . . . . . . . . . . . . 83,614 77,4783251910235 Other inedible products ............................................................. ............................................................. . . . . . . . . . . . (D) (D)
Stocks, end of month............................................................. ............................................................. . . . . . . . . . . . . . . . 127,230 115,3543251910125 Crude ............................................................. ............................................................. . . . . . . . . . . . . . . . . . . . . . 117,035 105,4053251910235 Refined ............................................................. ............................................................. . . . . . . . . . . . . . . . . . . . . 10,195 9,949
Safflower oil:311223G187 Production of refined oil 1/............................................................. ............................................................. . . . . . . . . . . . (D) (D)

Continued 3
Table 4. Production, Consumption, and Factory and Warehouse Stocks of Selected Fats and Oils[Thousands of pounds]
Product December Novembercode Product description 2000 2000
Consumption:311223G169 In refining ..................................................................................................... (D) (D)
Selected edible and inedible products 2/............................................................. ............................................................. . . . . (D) (D)311223G187 Edible products.............................................................. ............................................................. . . . . . . . . . . . . . . . (D) (D)311223G187 Salad or cooking oil/ ............................................................. ............................................................. . . . . . . . . . . . (D) (D)311223G187 Other edible products ............................................................. ............................................................. . . . . . . . . . . . (D) (D)311223G187 Inedible products ............................................................. ............................................................. . . . . . . . . . . . . . . (D) (D)311223G187 Paint and varnish ............................................................. ............................................................. . . . . . . . . . . . . . (D) (D)311223G187 Resins and plastics ............................................................. ............................................................. . . . . . . . . . . . . (D) (D)311223G187 Other inedible products ............................................................. ............................................................. . . . . . . . . . . (D) (D)
Stocks, end of month............................................................. ............................................................. . . . . . . . . . . . . . . . 20,292 r/ 29,298311223G169 Crude ............................................................. ............................................................. . . . . . . . . . . . . . . . . . . . . . 18,448 r/ 27,816311223G187 Refined ............................................................. ............................................................. . . . . . . . . . . . . . . . . . . . . 1,844 1,482
Palm oil:311223G171 Production of refined oil 1/............................................................. ............................................................. . . . . . . . . . . . (D) (D)
Consumption:311223G166 In refining ............................................................. ............................................................. . . . . . . . . . . . . . . . . . . (D) (D)311223G171 Selected edible and inedible products 2/............................................................. ............................................................. . . . . (D) (D)311223G171 Edible products ............................................................. ............................................................. . . . . . . . . . . . . . . . (D) (D)311223G171 Baking or frying fats ............................................................. ............................................................. . . . . . . . . . . . (D) (D)311223G171 Other edible products ............................................................. ............................................................. . . . . . . . . . . . (D) (D)311223G171 Inedible products ............................................................. ............................................................. . . . . . . . . . . . . . . 3,218 2,204311223G171 Stocks, end of month............................................................. ............................................................. . . . . . . . . . . . . . . . 75,874 72,344311223G166 Crude ............................................................. ............................................................. . . . . . . . . . . . . . . . . . . . . . 16,092 15,899311223G171 Refined ............................................................. ............................................................. . . . . . . . . . . . . . . . . . . . . 59,782 56,445
Coconut oil:311223G111 Production of refined oil 1/............................................................. ............................................................. . . . . . . . . . . . 47,361 44,162
Consumption:311223G165 In refining ............................................................. ............................................................. . . . . . . . . . . . . . . . . . . 49,422 46,170
Selected edible and inedible products 2/............................................................. ............................................................. . . . . 43,071 44,257311223G111 Edible products ............................................................. ............................................................. . . . . . . . . . . . . . . . 17,633 17,980311223G111 Baking or frying fats ............................................................. ............................................................. . . . . . . . . . . . (D) (D)311223G111 Other edible products ............................................................. ............................................................. . . . . . . . . . . . (D) (D)311223G111 Inedible products ............................................................. ............................................................. . . . . . . . . . . . . . . 25,438 26,277311223G111 Soap............................................................. ............................................................. . . . . . . . . . . . . . . . . . . . . 2,938 r/ 3,881311223G111 Paint and varnish ............................................................. ............................................................. . . . . . . . . . . . . . (D) (D)311223G111 Resins and plastics ............................................................. ............................................................. . . . . . . . . . . . . 315 355311223G111 Lubricants............................................................. ............................................................. . . . . . . . . . . . . . . . . . (D) (D)

Continued 4
Table 4. Production, Consumption, and Factory and Warehouse Stocks of Selected Fats and Oils[Thousands of pounds]
Product December Novembercode Product description 2000 2000
311223G111 Fatty acids ............................................................. ............................................................. . . . . . . . . . . . . . . . . (D) (D)311223G111 Other inedible products ............................................................. ............................................................. . . . . . . . . . . (D) (D)
Stocks, end of month............................................................. ............................................................. . . . . . . . . . . . . . . . 200,251 161,622311223G165 Crude ............................................................. ............................................................. . . . . . . . . . . . . . . . . . . . . . 126,287 118,431311223G111 Refined ............................................................. ............................................................. . . . . . . . . . . . . . . . . . . . . 73,964 43,191
Linseed oil: Consumption:
311223D151 In refining ............................................................. ............................................................. . . . . . . . . . . . . . . . . . . (D) (D)311223D121 Inedible products ............................................................. ............................................................. . . . . . . . . . . . . . . . 5,822 6,479311223D121 Paint and varnish ............................................................. ............................................................. . . . . . . . . . . . . . . 2,221 2,656311223D121 Resins and plastics ............................................................. ............................................................. . . . . . . . . . . . . . 1,558 2,067311223D121 Lubricants............................................................. ............................................................. . . . . . . . . . . . . . . . . . . (D) (D)311223D121 Fatty acids ............................................................. ............................................................. . . . . . . . . . . . . . . . . . (D) (D)311223D121 All other inedible products ............................................................. ............................................................. . . . . . . . . . (D) (D)
Stocks, end of month............................................................. ............................................................. . . . . . . . . . . . . . . . 62,415 87,030311223D151 Crude 4/............................................................. ............................................................. . . . . . . . . . . . . . . . . . . . . 39,919 65,861311223D121 Refined 5/............................................................. ............................................................. . . . . . . . . . . . . . . . . . . . 22,496 21,169
Inedible tallow and grease: Consumption:
31161311XX Inedible products ............................................................. ............................................................. . . . . . . . . . . . . . . . 297,878 303,70631161311XX Soap............................................................. ............................................................. . . . . . . . . . . . . . . . . . . . . . 6,577 r/ 8,27331161311XX Feed 6/ ............................................................. ............................................................. . . . . . . . . . . . . . . . . . . . 231,439 235,38831161311XX Inedible tallow ............................................................. ............................................................. . . . . . . . . . . . . . . 79,345 77,35031161311XX Greases ............................................................. ............................................................. . . . . . . . . . . . . . . . . . . 152,094 158,03831161311XX Inedible tallow and greases, n.s.k. ............................................................ ............................................................. . . . . . . - -31161311XX Lubricants and similar oils ............................................................. ............................................................. . . . . . . . . . 8,531 9,04531161311XX Fatty acids ............................................................. ............................................................. . . . . . . . . . . . . . . . . . 46,593 45,72231161311XX Other inedible products ............................................................. ............................................................. . . . . . . . . . . . 4,738 5,27831161311XX Stocks, end of month............................................................. ............................................................. . . . . . . . . . . . . . . . 337,194 376,5793116131111 Inedible tallow ............................................................. ............................................................. . . . . . . . . . . . . . . . . 203,218 225,0693116131121 Greases ............................................................. ............................................................. . . . . . . . . . . . . . . . . . . . . 129,238 147,33031161311XX Inedible tallow and greases, n.s.k. ............................................................ .............................................................4,738 4,180
Tung oil: Consumption:
311223G152 Inedible products ............................................................. ............................................................. . . . . . . . . . . . . . . . 802 700311223G152 Paint and varnish ............................................................. ............................................................. . . . . . . . . . . . . . . 253 147311223G152 Resins and plastics ............................................................. ............................................................. . . . . . . . . . . . . . 463 427

Continued 5
Table 4. Production, Consumption, and Factory and Warehouse Stocks of Selected Fats and Oils[Thousands of pounds]
Product December Novembercode Product description 2000 2000
311223G152 Other inedible products ............................................................. ............................................................. . . . . . . . . . . . 86 126311223G152 Stocks, end of month............................................................. ............................................................. . . . . . . . . . . . . . . . 707 827
Castor oil: Consumption:
311223G196 Inedible products 2/............................................................. ............................................................. . . . . . . . . . . . . . . 2,432 4,601311223G196 Soap............................................................. ............................................................. . . . . . . . . . . . . . . . . . . . . . (D) (D)311223G196 Paint and varnish ............................................................. ............................................................. . . . . . . . . . . . . . . 12 16311223G196 Resins and plastics ............................................................. ............................................................. . . . . . . . . . . . . . (D) (D)311223G196 Lubricants............................................................. ............................................................. . . . . . . . . . . . . . . . . . . (D) (D)311223G196 Other inedible products ............................................................. ............................................................. . . . . . . . . . . . (D) (D)311223G196 Stocks, end of month............................................................. ............................................................. . . . . . . . . . . . . . . . 24,732 30,058
Palm kernel oil:311223G185 Production of refined oil 1/............................................................. ............................................................. . . . . . . . . . . . (D) (D)
Consumption: 311223G167 In refining ............................................................. ............................................................. . . . . . . . . . . . . . . . . . . (D) (D)
Selected edible and inedible products ............................................................. ............................................................. . . . . . (D) (D)311223G185 Edible products ............................................................. ............................................................. . . . . . . . . . . . . . . . (D) (D)311223G1XX Inedible products ............................................................. ............................................................. . . . . . . . . . . . . . . (D) (D)311223G1XX Stocks, end of month............................................................. ............................................................. . . . . . . . . . . . . . . . 92,144 87,845
Rapeseed oil:311223G186 Production of refined oil 1/............................................................. ............................................................. . . . . . . . . . . . 54,163 52,591
Consumption:311223G168 In refining ............................................................. ............................................................. . . . . . . . . . . . . . . . . . . 55,209 53,667
Selected edible and inedible products ............................................................. ............................................................. . . . . . (D) (D)311223G186 Edible products ............................................................. ............................................................. . . . . . . . . . . . . . . . 57,076 53,495311223G186 Baking or frying fats ............................................................. ............................................................. . . . . . . . . . . . (D) (D)311223G186 Salad or cooking oil............................................................. ............................................................. . . . . . . . . . . . . 45,412 40,781311223G186 Margarine ............................................................. ............................................................. . . . . . . . . . . . . . . . . . (D) (D)311223G186 Other edible products ............................................................. ............................................................. . . . . . . . . . . . - -311223G1XX Inedible products ............................................................. ............................................................. . . . . . . . . . . . . . . (D) (D)
Stocks, end of month............................................................. ............................................................. . . . . . . . . . . . . . . . 148,889 148,539311223G168 Crude ............................................................. ............................................................. . . . . . . . . . . . . . . . . . . . . . 124,595 116,842311223G186 Refined ............................................................. ............................................................. . . . . . . . . . . . . . . . . . . . . 24,294 r/ 31,697
Edible tallow: Consumption: Selected edible and inedible products 2/............................................................. ............................................................. . . . . 35,747 37,928
Continued 6
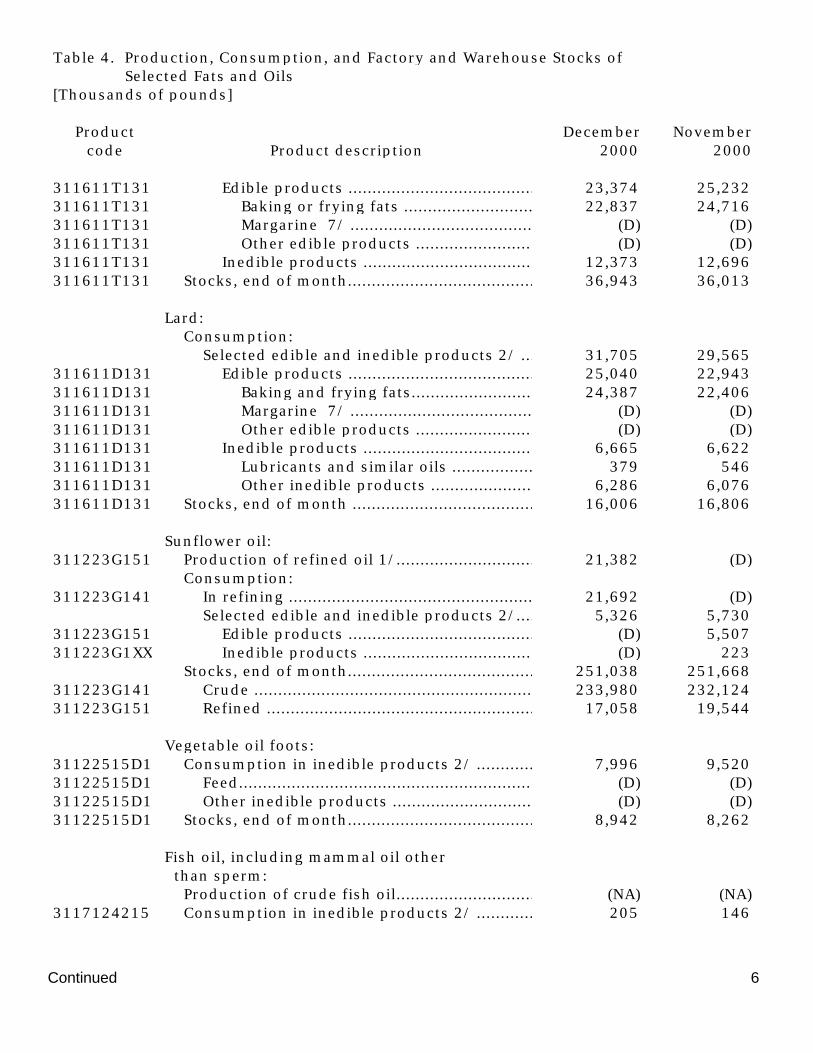
Table 4. Production, Consumption, and Factory and Warehouse Stocks of Selected Fats and Oils[Thousands of pounds]
Product December Novembercode Product description 2000 2000
311611T131 Edible products ............................................................. ............................................................. . . . . . . . . . . . . . . . 23,374 25,232311611T131 Baking or frying fats ............................................................. ............................................................. . . . . . . . . . . . 22,837 24,716311611T131 Margarine 7/ ............................................................. ............................................................. . . . . . . . . . . . . . . . (D) (D)311611T131 Other edible products ............................................................. ............................................................. . . . . . . . . . . . (D) (D)311611T131 Inedible products ............................................................. ............................................................. . . . . . . . . . . . . . . 12,373 12,696311611T131 Stocks, end of month............................................................. ............................................................. . . . . . . . . . . . . . . . 36,943 36,013
Lard: Consumption: Selected edible and inedible products 2/ ............................................................. ............................................................. . . . . 31,705 29,565
311611D131 Edible products ............................................................. ............................................................. . . . . . . . . . . . . . . . . 25,040 22,943311611D131 Baking and frying fats............................................................. ............................................................. . . . . . . . . . . . . 24,387 22,406311611D131 Margarine 7/ ............................................................. ............................................................. . . . . . . . . . . . . . . . . (D) (D)311611D131 Other edible products ............................................................. ............................................................. . . . . . . . . . . . . (D) (D)311611D131 Inedible products ............................................................. ............................................................. . . . . . . . . . . . . . . . 6,665 6,622311611D131 Lubricants and similar oils ............................................................. ............................................................. . . . . . . . . . 379 546311611D131 Other inedible products ............................................................. ............................................................. . . . . . . . . . . . 6,286 6,076311611D131 Stocks, end of month ............................................................. ............................................................. . . . . . . . . . . . . . . . 16,006 16,806
Sunflower oil:311223G151 Production of refined oil 1/............................................................. ............................................................. . . . . . . . . . . . 21,382 (D)
Consumption:311223G141 In refining ............................................................. ............................................................. . . . . . . . . . . . . . . . . . . 21,692 (D)
Selected edible and inedible products 2/............................................................. ............................................................. . . . . 5,326 5,730311223G151 Edible products ............................................................. ............................................................. . . . . . . . . . . . . . . . (D) 5,507311223G1XX Inedible products ............................................................. ............................................................. . . . . . . . . . . . . . . (D) 223
Stocks, end of month............................................................. ............................................................. . . . . . . . . . . . . . . . 251,038 251,668311223G141 Crude ............................................................. ............................................................. . . . . . . . . . . . . . . . . . . . . . 233,980 232,124311223G151 Refined ............................................................. ............................................................. . . . . . . . . . . . . . . . . . . . . 17,058 19,544
Vegetable oil foots:31122515D1 Consumption in inedible products 2/ ............................................................. ............................................................. . . . . . . . 7,996 9,52031122515D1 Feed..........................................................................................................................(D) (D)31122515D1 Other inedible products ............................................................. ............................................................. . . . . . . . . . . . . (D) (D)31122515D1 Stocks, end of month............................................................. ............................................................. . . . . . . . . . . . . . . . 8,942 8,262
Fish oil, including mammal oil other than sperm: Production of crude fish oil............................................................. ............................................................. . . . . . . . . . . . (NA) (NA)
3117124215 Consumption in inedible products 2/ ............................................................. ............................................................. . . . . . . . 205 146

Continued 7
Table 4. Production, Consumption, and Factory and Warehouse Stocks of Selected Fats and Oils[Thousands of pounds]
Product December Novembercode Product description 2000 2000
3117124215 Paint and varnish ............................................................. ............................................................. . . . . . . . . . . . . . . . (D) (D)3117124215 Resins and plastics ............................................................. ............................................................. . . . . . . . . . . . . . . (D) (D)3117124215 Lubricants............................................................. ............................................................. . . . . . . . . . . . . . . . . . . . (D) (D)3117124215 Other inedible products ............................................................. ............................................................. . . . . . . . . . . . . (D) (D)3117124215 Stocks, end of month............................................................. ............................................................. . . . . . . . . . . . . . . . (NA) (NA)
Other fats and oils:311223G195 Consumption in selected edible and inedible
products 2/............................................................. ............................................................. . . . . . . . . . . . . . . . . . . . 5,544 4,402311223G195 Edible products ............................................................. ............................................................. . . . . . . . . . . . . . . . . (D) (D)311223G195 Inedible products ............................................................. ............................................................. . . . . . . . . . . . . . . . (D) (D)311223G195 Stocks, end of month............................................................. ............................................................. . . . . . . . . . . . . . . . 9,048 8,246
- Represents zero. D Withheld to avoid disclosing data for individual companies. NA Not available. r/Revised by 5 percent or more from previously published data.
1/Production of refined oils covers only once-refined oils. Degummed soybean oil is reported as crude oil. 2/Includes hydrogenated fats (vegetable and animal) and other fats andoils in process (for example, refined cottonseed includes stocks of stearin). 3/The use of whole or crude tall oil in the distillation or fractionationprocess is reported as consumed in fatty acids, and use in the acid refining process is reported as consumed in refining. The production represents refined tall oil and distilled tall oil containing less than 90 percent free fatty acids not including resin acids. 4/Includes raw and boiled linseed oil. 5/Includes linseed oil other than raw and boiled. 6/Consumption in feed is reported by renderers and fat reprocessors as shipments for consumption of inedible tallow and grease for use in livestock and poultry feed. Data are not collected regarding other oils provided for or consumed in animal feed. 7/ 896 thousand pounds of lard and edible tallow consumed in margarine for December 2000 and 759 thousand pounds for November 2000.

Table 5. Production and Producers' and Warehouse Stocks of Selected Fats and Oils Products[Thousands of pounds]
December 2000 November 2000
Product description Producers' Producers'and and
Product warehouse warehousecode Production stocks Production stocks
Baking or frying fats, including shortening....................................475,650 94,627 509,640 94,0183112251111 100 percent vegetable oil............................................................. .437,255 87,599 465,908 86,1163112251221 100 percent animal fat or blends of vegetable
oil and animal fats............................................................. . . . . . . . . . . . . .38,395 7,028 43,732 7,902
Salad and cooking oil ............................................................. . . . . . . . . . .643,088 162,694 677,121 154,1413112251445 Soybean salad and cooking oil.............................................................496,667 97,949 521,334 74,3823112251585 Other salad and cooking oil............................................................. 146,421 64,745 155,787 79,759
3112254100 Margarine......................................................................................183,568 81,801 r/ 175,740 35,773
325611A111 Glycerin, crude (100 percent basis) 1/.......................................29,681 29,477 34,617 32,339325611A131 Glycerin, refined (all grades, 100 percent basis)..........................35,995 33,708 38,245 35,1983251991191 Fatty acids (all grades)............................................................. . . . . . . . .167,391 148,537 137,485 142,668
1/ 36,139 thousand pounds consumed in refining for December 2000 and 38,387 thousand poundsconsumed in refining for November 2000.
r/ Data revised by 5 percent or more from previously published data.
Table 6. Warehouse Stocks of Selected Fats and Oils and Fats and Oils Products[Thousands of pounds]
Product December Novembercode Product description 2000 2000
311611D131 Lard................................................................................................................. (D) (D)31122XXXXX Cottonseed and soybean oil (all grades except
salad or cooking oil)............................................................. ............................................................. . . . . . . . . . . . . . . 650,968 670,0023116131111 Tallow, inedible, including inedible animal
stearin..................................................................................................... 77,402 91,7863116131121 Grease (other than wool grease)............................................................. . . . . .9,320 (D)3112251445 Soybean salad and cooking oil............................................................. . . . . . . . .(D) (D)3112251585 Other salad and cooking oil............................................................. ............................................................. . . . . . . . . . . . . (D) (D)3112251XXX Baking or frying fats, including shortening............................................................. ............................................................. . . . . (D) (D)
D Withheld to avoid disclosing data for individual companies.
Note: Includes all stocks reported on Census Form M311H, which covers public warehouses, port terminals, and warehouses of companies producing fats and oils products, except wholesale branches of meat packers. Does not include stock held at retail stores, bakeries, restaurants, or private warehouses of retail and wholesale distributors. Does not includestocks reports on Census forms M311J, M311M, and M311N, which cover crushingmills, refineries, and certain consuming establishments.

Table 7. Supply and Distribution of Selected Fats and Oils: October 2000[Millions of kilograms]
Exports of Product description Imports for domestic Apparent
Beginning Quantity consump- Ending merchan- consump-stock produced tion 1/ stock dise 2/ tion 3/
Cottonseed oil: Crude .................................................. . 3.8 38.2 - 6.7 2.0 33.3 Refined.................................................. . . . . . . . . . . . . . . . . 17.3 25.0 - 22.2 - 20.1
Soybean oil: Crude ................................................................................................... . . . . . . . . . . . . . . . . 450.8 758.0 0.2 471.4 6.0 731.6 Refined.................................................. . . . . . . . . . . . . . . . . . . . . . . . . . . . . . . . . . . . . . . . . . 100.7 571.7 - 84.9 4.6 582.9
Corn oil: Crude .................................................. . . . . . . . . . . . . . . . . . . . . . . . . . . . . . . . . . . . . . . . . . 9.3 94.6 - 9.4 20.8 73.7 Refined.................................................. . . . . . . . . . . . . . . . . . . . . . . . . . . . . . . . . . . . . . . . . . 56.4 58.2 - 55.2 0.1 59.3
Edible tallow.................................................. . . . . . . . . . . . . . . . . . . . . . . . . . . . . . . . . . . . . . . . 18.1 66.5 0.2 15.1 11.2 58.4
Inedible tallow .................................................. . . . . . . . . . . . . . . . . . . . . . . . . . . . . . . . . . . . . . 116.8 152.0 2.5 103.2 68.3 99.9
- Represents zero. 1/Source: Census Bureau report IM 146, U.S. Imports for Consumption. 2/Source: Census Bureau report EM 545, U.S. Exports. 3/Source: Apparent consumption represents new domestic supply and is derived by subtracting exports from the total of manufacturer's production plus imports, and adjusting for changes in stocks.