fatigue biography summary resistance of accelerated bridge ... · pdf fileaccelerated bridge...
TRANSCRIPT

FATIGUE
RESISTANCE OF
CLUSTERED
SHEAR STUDS
JASON PROVINES, P.E.
JUSTIN OCEL, PhD, P.E.
BIOGRAPHY
Jason Provines received his BS
degree from Michigan State
University and MS from Purdue
University. He is a Staff
Engineer employed by
Professional Service Industries,
Inc. currently working at the
Federal Highway
Administration Turner-Fairbank
Highway Research Center in
McLean, VA. His research is
focused on steel structures in the
areas of fatigue and fracture,
metallographic evaluation, and
corrosion.
Dr. Justin Ocel received his BS
degree from the University of
Minnesota, MS from Georgia
Institute of Technology, and
PhD from the University of
Minnesota. He is an employee
of the Federal Highway
Administration working at the
Turner-Fairbank Highway
Research Facility in McLean,
VA as the Structural Steel
Research Program Manager.
Since arriving at FHWA he has
researched a diverse range of
topics including creep in epoxy
anchors, fatigue strength of
ultra-high performance
concrete, fatigue of galvanized
sign pole details, behavior of
steel bridge gusset plated
connection, and participating in
the NTSB investigation of the I-
35W bridge collapse.
SUMMARY
Accelerated bridge construction
(ABC) is an increasingly
common bridge construction
technique in which large
modular bridge elements are
fabricated off-site and then are
connected on-site to form the
bridge. One such technique is
the use of full-depth precast
concrete deck panels placed on
top of steel girders and
connected via shear studs. The
panels typically have pockets to
fit around the shear studs, which
are then filled with grout to
form a composite connection
with the girder. When using
precast concrete panels, it is
advantageous to cluster shear
studs closer together and
increase the distance between
these clusters. Reducing the
number of pockets in the panels
simplifies panel fabrication and
constructability.
This paper describes large- and
small-scale fatigue tests
constructed with steel beams
and precast concrete deck
panels. The shear stud
configurations on the large-scale
tests range from a more typical
detail with studs spaced every
12 or 24 inches, to a detail more
conducive to precast panels with
cluster spacings of 36 or 48 in.,
which are currently not
permitted by AASHTO. The
small-scale tests are similar to
other historical tests on shear
studs will provide a comparison
to the large-scale tests. The
testing described herein will be
used to evaluate the current
LRFD shear stud provisions for
the fatigue limit state as well as
the shear stud spacing limits to
recommend if either can be
adjusted to more effectively
accommodate the use of precast
deck panels.
Page 1 of 12
FATIGUE RESISTANCE OF CLUSTERED SHEAR STUDS
Introduction
A common accelerated bridge construction practice
is the use of large prefabricated bridge elements,
which are fabricated off-site and then connected
together on-site to construct the bridge. One such
construction method of this practice is using full-
depth precast concrete deck panels placed on top of
steel girders and connected with shear studs. The
concrete panels typically have pockets, which are
formed to fit around the shear studs. These pockets
are then filled with grout in the field to form a
composite connection between the concrete deck and
the steel girder.
On a typical bridge with a conventional cast in place
deck, shear studs are spaced in regular intervals
along the length of a girder, with a maximum
longitudinal spacing of 24 inches according to the
AASHTO LRFD Bridge Design Specifications (1).
When precast concrete panels are used, it is
advantageous to place individual shear studs close
together in clusters and increase the distance
between these clusters. This reduces the number of
pockets in the deck panels, which helps to simplify
panel fabrication and constructability.
To provide full composite action between the
concrete deck and steel girder, shear studs must be
designed for the fatigue and strength limit states (1).
For short spans (ie. 120’ or less) and near the
supports, the fatigue limit state typically governs the
number of studs and can require a significantly
larger number of studs than the strength limit state.
Depending on the length of the span, a large number
of shear studs can lead to a very small longitudinal
spacing between studs, making it difficult to use
precast deck panels. The current AASHTO LRFD
shear stud fatigue specifications will be compared to
three international shear stud fatigue design
provisions to determine if there are opportunities for
improvement to better accommodate precast decks.
Shear Stud Fatigue Design Provisions
The current AASHTO shear stud fatigue design
provisions are based on 44 small-scale tests
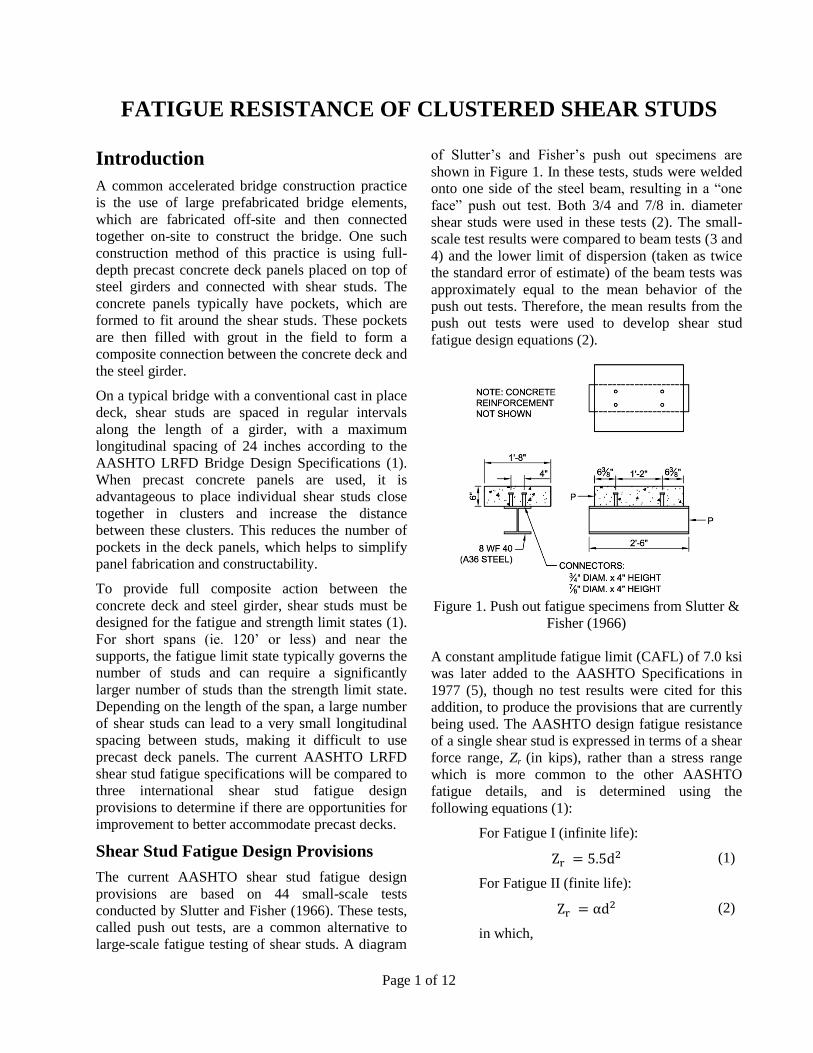
conducted by Slutter and Fisher (1966). These tests,
called push out tests, are a common alternative to
large-scale fatigue testing of shear studs. A diagram
of Slutter’s and Fisher’s push out specimens are
shown in Figure 1. In these tests, studs were welded
onto one side of the steel beam, resulting in a “one
face” push out test. Both 3/4 and 7/8 in. diameter
shear studs were used in these tests (2). The small-
scale test results were compared to beam tests (3 and
4) and the lower limit of dispersion (taken as twice
the standard error of estimate) of the beam tests was
approximately equal to the mean behavior of the
push out tests. Therefore, the mean results from the
push out tests were used to develop shear stud
fatigue design equations (2).
A constant amplitude fatigue limit (CAFL) of 7.0 ksi
was later added to the AASHTO Specifications in
1977 (5), though no test results were cited for this
addition, to produce the provisions that are currently
being used. The AASHTO design fatigue resistance
of a single shear stud is expressed in terms of a shear
force range, Zr (in kips), rather than a stress range
which is more common to the other AASHTO
fatigue details, and is determined using the
following equations (1):
For Fatigue I (infinite life):
(1)
For Fatigue II (finite life):
(2)
in which,
Figure 1. Push out fatigue specimens from Slutter &
Fisher (1966)

Page 2 of 12
(3)
where, d = shear stud diam. (in.), and N = number of
cycles.
When compared to the international shear stud
fatigue design equations, the AASHTO provisions
are quite different. Figure 2 shows the stud fatigue
design curves according to AASHTO (1), the
Eurocode 4 (6), Australian Standard (7), and the
Japan Society of Civil Engineers (JSCE) (8). The
AASHTO fatigue detail Category C is also included
in the figure for reference. Since the JSCE design
equation depends on various geometric and material
properties, the following typical values were
assumed: shear stud diameter and height of 7/8” and
6”, respectively, and a concrete compressive design
strength of 4.0 ksi.
As shown in Figure 2, the AASHTO stud fatigue
curve is in a semi-log format, while the other three
specifications follow a log-log format, with slopes
ranging from -8 to -9.5. These slopes are much
shallower than the slope of -3 for the typical
AASHTO fatigue details. This difference in slope is
expected due to the different types of stress ranges
used for these different detail types: when designing
shear studs, shear stresses are used, while typical
AASHTO details are designed based on normal
stresses. Since the AASHTO stud curve is semi-log,
the fatigue design stress range decreases more
rapidly as the number of cycles increase. This is
clearly evident at approximately 6.0 million cycles,
where the infinite life fatigue equation controls, and
where most new bridges are likely designed. The
AASHTO stud CAFL of 7.0 ksi also appears to be
generally conservative since the international
provisions do not have CAFLs for shear studs.
Research Objectives
Based on a review of the current domestic and
international shear stud specifications, it is clear that
the AASHTO provisions warrant further
examination. The shear stud fatigue design
provisions appear too conservative, thereby limiting
the potential benefits of using precast concrete deck
panels. This paper will discuss large- and small-scale
fatigue tests to evaluate the fatigue behavior of shear
studs. The large-scale tests are comprised of a 30 ft.
long rolled steel beam with shear studs welded in
one of four different configurations of shear pocket
spacings, along with a precast concrete deck. The
shear stud configurations vary from a typical cast-in-
place deck construction detail with studs every 12 or
24 in. to configurations more conducive to precast
panels with clustered shear studs spaced at 36 and 48
in. The small-scale tests are used as a means of
comparison to the large-scale tests, as well as a
comparison to the historical push out test data
including those used to develop the current
AASHTO shear stud fatigue provisions. An
additional motivation for the small-scale tests was to
evaluate the CAFL of the AASHTO provisions since
the small-scale tests could be loaded at a faster rate
than the large-scale tests, and thus could be tested at
lower stress ranges for longer fatigue lives.
Large-Scale Fatigue Tests
Specimens & Test Setup
The large-scale tests consist of a 30 ft. long W27x84
rolled steel beams and two concrete deck panels
fabricated by a PCI certified precaster. Pockets were
cast into the deck panels and were sized depending
on the number of studs per pocket. Table 1 shows
the experimental test matrix with the four different
shear stud cluster spacings.
Regardless of stud cluster spacing, each of the
beams has 12 studs per shear span, which
corresponds to 38% composite action. Although
AASHTO only allows for fully composite beams,
these partially composite beams were chosen to
ensure failure of the shear studs. Since the beams are
partially composite, section properties were
determined using AISC specifications (9).
1
10
100
1.E+03 1.E+04 1.E+05 1.E+06 1.E+07 1.E+08
Str
ess R
ange (
ksi)
Number of Cycles
AASHTO (2010)
Eurocode (2005)
Australian Standard (2004)
JSCE (2009)
Cat C
Slopes: -8 to -9.5
Slope: -3
Figure 2. Shear stud S-N design provisions from
AASHTO and various international codes

Page 3 of 12
Table 1. Large-scale experimental test matrix
Stud
Cluster
Spacing
# Longitudinal
Shear Studs /
Cluster
Total #
Studs /
Shear Span
# of
Fatigue
Tests
12” 1 12 3
24” 2 12 3
36” 3 12 3
48” 4 12 3
Shear studs are placed longitudinally along the
length of the beam in clusters at a pitch of 3.5 in. (4
times the stud diameter, d), which is less than the
minimum AASHTO spacing of 6d. This smaller
pitch was selected to allow for smaller pockets and
is currently allowed in Texas (10). The shear studs
were welded onto the steel beams in accordance with
AASHTO/AWS D1.5 specifications (11).
Before setting the concrete deck panels in place on
top the steel beams, the top flange is coated with a
thin layer of grease to reduce any friction between
the flange and the deck panel so that nearly all of
horizontal shear force transferred between the steel
beam and the deck panels is carried by shear studs.
Grout with an expected strength of approximately
8.0 ksi is used to fill the pockets, haunch, and
transverse joint in the center of the beam. Slutter and
Fisher concluded that the strength of the concrete
around the studs does not significantly influence the
fatigue resistance of the studs (2); therefore it is
believed that these test beams can be representative
of bridge girders with both pre-cast and cast-in-place
concrete decks. Figure 3 shows a plan, elevation,
and typical section view of the 36 in. cluster spacing
specimen. The other specimens are similar to that
shown in the figure, but differ in the number of studs
per cluster and cluster spacing.
The beams have two load points with 11’-6” shear
span on each end of the beam. Load was applied
using a 220-kip servo-hydraulic actuator at each load
point. The actuators were cycled under a constant
load range to produce the desired average stress
range at the base of all the studs in each shear span,
while still maintaining elastic behavior in the beam.
The beams were cyclically loaded until it was clear
that at least one of the precast decks had completely
separated from the beam.
Instrumentation
There are a total of 54 strain gauges used along the
steel beam and concrete deck for each test. Six strain
gauges are used at each of four cross sections on
each shear span and one cross section at midspan.
Each section contains of three gauges installed on
the steel beam and three gauges on the concrete
deck. Of the four cross sections with strain gauges
along each shear span, two are located at a pocket
and two are halfway between pockets.
An additional 32 strain gauges are used for some of
the large-scale tests and were installed on selected
shear studs in each shear span prior to grouting the
concrete deck in place. For these tests, all 12 of the
shear studs within the east shear span and the 4 end-
most studs in the west shear span had strain gauges
installed on them. For each of these studs, strain
gauges were installed on the east and west side near
the base of the stud. These strain gauges were used
Figure 3. Large-scale fatigue beam with 36" stud cluster spacing

Page 4 of 12
in hopes of determining the order in which shear
studs failed in fatigue during testing.
Twelve linear variable differential transducers
(LVDTs) are used on each beam. Nine are used to
record the relative slip between the deck panel and
the top flange of the beam, and are mounted at the
same sections as the strain gauges. Two LVDTs
measure the relative uplift, or vertical separation,
between the deck and the top flange. These uplift
LVDTs are located in the mid-point of each shear
span. The last LVDT measures vertical deflection at
midspan of the beam.
A unique instrumentation feature used for the large-
scale tests is the FARO Laser Tracker ION; this
laser system uses a centralized head unit and a prism
to record highly accurate 3-D coordinates on
demand. In this case, the FARO is used to determine
the relative slip and uplift between the haunch and
the top flange of the steel beam. This is achieved by
mounting aluminum spacers to the haunch and to the
edge of the flange every 6 in. along the length of the
beam, as shown in Figure 5. FARO measurements
were recorded by stopping the fatigue tests at
predetermined cyclic intervals (depending on
expected fatigue life of the test) and applying a static
load equal to the maximum fatigue load. The FARO
prism was then nested into each of the aluminum
spacers and measurements could be recorded. From
the measurements, the relative slip and uplift
between the haunch and the top flange could be
calculated.
Test Results & Discussion
To date, 10 of the 12 anticipated fatigue tests are
complete, with another test currently underway.
Selected stress ranges for the tests include 20, 16,
12, and 10 ksi. The larger stress ranges (20 and 16
ksi) were selected to produce a fatigue failure in the
shear studs within a reasonable timeframe, while the
smaller stress ranges (12 and 10 ksi) were selected in
hopes of producing “long-life” fatigue failures.
Selected data from some of these tests, as well as
criterion for defining a fatigue failure, will be
presented in the following sections.
Strain Gauge & LVDT Results
During testing, strain gauge measurements from the
steel beam were used to determine the location of
the neutral axis (N.A.). The calculated N.A.
locations were used to determine how composite
action was affected during cycling. Figure 4 shows
an example of this for beam 4F2, which has a stud
cluster spacing of 48” and was tested at a stress
range of 16 ksi. The plot shows the location of the
N.A., referenced from the bottom of the bottom
flange of the steel beam, at three different cross
sections over the duration of the cyclic loading. The
cross sections shown include one from the east shear
span (E4), west shear span (W4), and midspan (M).
The composite section and bare steel beam N.A. are
also provided for reference. The composite N.A. in
the figure refers to the partially composite section
N.A.
As shown in the figure, the N.A. for all three
sections starts near the composite section N.A. As
the beam is cyclically loaded, the location of the
N.A. for each section gradually drops down into the
steel beam. The rate at which the N.A. decreases is
relatively similar for all three sections until about
Figure 4. Location of N.A. for both shear spans on
beam 4F2
Figure 5. FARO Laser Tracker instrumentation

Page 5 of 12
600k cycles. This shows that gradual fatigue damage
is occurring at the shear studs along the entire length
of the beam. After about 600k cycles, the N.A. for
the west shear span (W4) drops rapidly, whereas the
N.A. for the east shear span (E4) continues to
decrease at the same rate. The midspan (M) N.A.
also drops rapidly, similar to W4. This is likely
because the studs in the west shear span had failed
so the studs near midspan were now carrying the
shear force that was once carried by the studs in the
west shear span. These studs at midspan failed rather
quickly due to the large shear stress range.
At first glance, this descent of the N.A. in W4 may
not appear to be significant, especially since the
N.A. is still well above that of the bare steel beam.
However, the test was stopped at 700k cycles and,
indeed, it was clear that the shear studs in the west
shear span had failed such that the concrete deck
was completely separated from the steel beam. This
shows that the rapid shift in the N.A. in W4 does
signify a fatigue failure of the shear studs within a
shear span. The N.A. of W4 likely did not approach
the bare steel beam N.A. because shear force is still
being transferred between the deck and the beam by
friction of the cracked stud surfaces and, to a lesser
extent, any friction which may be present between
the greased top flange and the bottom of the concrete
deck. Field studies have shown that even a very
small amount of friction, such as rivet heads against
a cast-in-place concrete deck, can provide full
composite action under service level loads (12).
It is even more apparent that the west shear span
studs failed first when examining the slip data
recorded from the LVDTs across two different cross
sections of the same beam, shown in Figure 6. The
two selected sections include one from the east shear
span (E1) and west shear span (W1). Slip values are
shown near the ends of the shear spans because this
is where the slip is maximized. Both sections
experience a moderate increase in slip from the
beginning of the test until about 250k cycles, at
which point the slip increase becomes more gradual.
At about 600k cycles, the slip in W1 experiences a
drastic increase, similar to how the N.A. saw a rapid
shift. This again illustrates that the studs in the west
shear span failed in fatigue before those in the east
shear span.
The N.A. and slip results shown in the previous two
figures were fairly typical of all of the large-scale
beams tests. It was apparent that the N.A. results
could be used to determine the shear span that had
failed. More importantly, the N.A. results from the
strain gauges and the LVDT results correlated well
to the physical evidence of the concrete deck
separating from the steel beam. For the larger stress
range (20 ksi), the rapid increase in the N.A. and slip
was more obvious than for the smaller stress ranges.
The N.A. in the beams under the 20 ksi stress range
also typically decreased until it was approximately
equal to the N.A. of the bare steel beam. This likely
occurred because the loads in these tests were large
enough to overcome any friction causing composite
action to remain in the beam after the studs had
cracked.
Once it was clear which shear span had failed in a
test, the N.A. from each of the sections in that shear
span were examined. Figure 7 shows the N.A.
Figure 6. LVDT slip results from beam 4F2
Figure 7. Location of N.A. for west shear span on
beam 4F2

Page 6 of 12
location along three sections of the west shear span
in the same beam, 4F2. Similar to the previous N.A.
plot, the composite section and bare steel beam N.A.
are also included for reference.
The figure shows that each of the three sections lose
composite action in a similar fashion. The N.A. in
all three sections experience an initial decrease from
the beginning of the test until about 250k cycles.
Clearly, there is some noise in the strain gauges in
section W2 at the beginning of the test that is likely
due to the small stresses in this section, which
become magnified when the N.A. is calculated using
these stresses. From about 250k-600k cycles, the
N.A. in all three sections continues to decrease at a
gradual rate. Although the three sections do behave
similarly, the sections closer to the end of the beam
do begin to lose composite action sooner than those
closer to midspan. This is reasonable because
sections near the end of the beam have to resist a
larger horizontal slip to maintain compatibility than
those closer to midspan. Although sections closer to
the end of the beam do begin to lose composite
action sooner, all of the sections lose composite
action at a much faster rate after approximately 600k
cycles. The N.A. for all of the sections also appear to
level off just before 700k cycles.
All of the beams experienced similar N.A. behavior
to that shown in Figure 7. In general, the sections
closer to the ends of the beam lost composite action
sooner than the sections closer to midspan, but
typically all sections within a shear span reached a
point of no composite action at about the cycle
count. Typically, there was not a significant
difference in the location of the N.A. between
sections either at a stud cluster or between stud
clusters. In other words, composite action along the
length of a shear span did not seem to be affected by
placing shear studs in clusters with a spacing of up
to 4 ft. between clusters.
Using the strain gauge data to calculate the location
of the steel beam neutral axis, a definition of failure
for the fatigue tests was developed and is defined as
the following: A beam is considered to have reached
“failure” if one or more cross sections experience a
complete loss in composite action. In beam 4F2, this
was determined to have occurred at 680k cycles.
This is when the neutral axis appears to have leveled
out such that it was clear the shear studs in the west
shear span had exhausted their fatigue lives. This
definition of failure is somewhat similar to that used
in some of the few other large-scale fatigue tests on
shear studs. Toprac et. al. (4) defined failure as the
point at which the rate of loss in composite action
increases considerable. This is similar to the failure
definition in this study since the rate of composite
action remains fairly constant until just before the
beam fails completely. Using the definition of failure
developed for this study, stress range and fatigue life
(S-N) data were constructed from the large-scale
fatigue tests, and are shown in Table 2. In addition to
S-N data, the table also includes the basic naming
convention for each beam as well as stud cluster
spacing. Stress ranges in the table represent the
initial average stress range on all of the shear studs
within a shear span.
Table 2. S-N data for large-scale fatigue tests
Beam
name
Stud cluster
spacing (in)
Stud stress
range (ksi)
Cycles to
failure
1F1 12 20 175,000
2F1 24 20 174,000
3F1 36 20 51,000
4F1 48 20 91,000
1F2 12 16 130,000
2F2 24 16 260,000
3F2 36 16 747,000
4F2 48 16 680,000
1F3 12 12 yet to test
2F3 24 12 ongoing
3F3 36 12 4,048,000
4F3 48 10 25,000,000a
a – Test declared a run out
In the table, tests are placed into three stress range
groups: large (20 ksi), medium (16 ksi), and small
(10 and 12 ksi). Within each stress range group, a
test was conducted at each of the four stud cluster
spacings. One test, beam 4F3, was declared a run out
since composite action still remained and the shear
studs were still intact after 25 million cycles of
loading at a stress range of 10 ksi.
Using the data from Table 2, an S-N plot was
constructed for the completed tests and is shown in
Figure 9. Beams with different stud spacings are
shown using different shaped data points. Also
included in the figure are the AASHTO LRFD shear
stud fatigue design equation (12) and upper- and
lower-bound regression curves for the S-N data of
the large-scale tests. The mean regression is shown
as a solid line, while the +2σ (2 x standard

Page 7 of 12
deviation) and -2σ bounds are shown as dashed
lines. These represent the 95% and 5% confidence
intervals, respectively.
In some cases on the figure, two data points (1F1
and 2F1) are close enough together that on the plot,
they might appear as a single point. The slope of the
regression line for the 10 completed tests is -6.7. It is
interesting to note that the 5% confidence interval
falls nearly on top of the AASHTO (2010) shear
stud design equation from approximately 10k-1.0
million cycles. Over this range, the AASHTO stud
design equation seems to accurately represent the S-
N test data. However, after 1.0 million cycles, due to
the semi-log nature of the AASHTO curve, the
design provisions underestimate the fatigue life of
the test beams, especially at the CAFL of 7.0 ksi.
This is especially apparent since the 4F3 test was
declared a run out under a 10 ksi stress range after
25.0 million cycles.
Another observation from the S-N plot is that there
does not appear to be any strong correlation between
the shear stud cluster spacing and its fatigue life. In
particular, the extended cluster spacings of 36” and
48” did not seem to negatively affect the shear studs’
fatigue performance due to shear lag. Any difference
in fatigue behavior appears only to be scatter, as is
common with any fatigue test data.
FARO Slip Results
Since the relative slip and uplift between the top
flange of the beam and grouted haunch was recorded
at predetermined cycle intervals, generally every
100k cycles depending on the expected fatigue
failure, fatigue damage could be observed
throughout testing. This section will present selected
data recorded using the FARO laser system since it
provided good resolution of slip and uplift along the
entire length of a beam. The LVDT data did provide
good agreement with the FARO data, but are not
presented for brevity.
Figure 8 shows the FARO slip results for beam 4F2.
In the figure, slip values were recorded at the
maximum loads of the fatigue loading. Cyclic
loading was stopped and the beam was loaded
statically to record measurements every 100k cycles.
Positive values represent a slip toward each end of
the beam, away from midspan. The values are
referenced from measurements recorded of the beam
under self-weight only. Shaded vertical columns are
included to indicate the location of the shear stud
clusters.
In general, the slip values confirm the behavior seen
in the strain gauge and neutral axis data. This is most
easily seen when examining the slip values of the
west shear span, which was determined to have
failed first. The slip increases at a moderate,
relatively consistent rate for each cyclic interval
until 300k cycles. From 300k-600k cycles, the slip
increases at a much slower rate. Then, between
600k-700k cycles, there is a much larger slip
increase; this agrees with the fatigue life of this
beam, which was defined to have occurred at 680k
cycles.
One interesting feature to note in the figure is the
shape of the slip plot. It appears almost step-like,
with most of the drastic slip increases occurring on
1
10
100
1.E+03 1.E+04 1.E+05 1.E+06 1.E+07 1.E+08
Str
ess R
ange (
ksi)
Number of Cycles
12" spacing
24" spacing
36" spacing
48" spacing
7.0 ksi
Mean regression with 2σ bounds
AASHTO (2010)
-0.02
0
0.02
0.04
0.06
0.08
0.1
0 40 80 120 160 200 240 280 320 360
Sli
p b
etw
een
hau
nch
& f
lan
ge
(in
)
Distance from east end of beam (in)
0 cyc 100k 200k 300k 400k 500k 600k 700k
C/L
Beam
C/L
West
Load
C/L
East
Load
stud cluster
(typ.)
+ +
Figure 9. S-N data for large-scale tests
Figure 8. Slip results taken at peak loads for 100k
cycle intervals for beam 4F2

Page 8 of 12
the beam-end side of each of the stud clusters. For
example, in the west shear span, the slip increases
very sharply at each cyclic interval directly to the
west of the stud cluster closest to the west load
point. This indicates that there is slip damage in the
two stud clusters closest to the west end of the beam
since the slip increases after the first cluster. At the
second stud cluster, there is another, though smaller,
sharp increase in slip on the west side of the cluster,
indicating slip damage in the cluster closest to the
west end of the beam. From there, the slip remains
relatively constant toward the west end of the beam.
This step-like slip behavior was present in the beams
with larger cluster spacings (36” and 48”). In the
more typical stud spacing beams (12” and 24”), the
slip values increased gradually in a more continuous
fashion from each load point toward the end of the
beam. A more detailed discussion of this behavior
can be found in Provines and Ocel (2014) (13).
FARO Uplift Results
Similar to the slip results, the FARO laser system
was also used to determine the relative uplift
between the top flange of the beam and the haunch
at predetermined cycle counts. Figure 10 presents
the uplift results for beam 4F2, in which
measurements were recorded at the maximum load
of the fatigue cycles every 100k cycles. Similar to
the slip figure, the stud clusters are shown by the
presence of shaded columns and values are
referenced from the beam under self weight only.
Positive values indicate that the haunch is moving
upward relative to the top flange. Note that the
“negative” uplift, especially in the west end of the
west shear span, is likely due to degradation of the
grout during fatigue loading.
The damage progression of the uplift is somewhat
different than was shown with the other data
presented. According to the plot, there was little
uplift damage done within the first 100k cycles.
From 100k-300k cycles, there is a moderate amount
of damage done in both shear spans, with the east
shear span, interestingly, accumulating the
maximum value. From 300k-500k cycles, little
increase in uplift is present in both shear spans. Then
from 500k-700k cycles, a greater increase in uplift is
present in the west shear span, while the east shear
span uplift remains relatively constant. Although the
progression is different, the uplift data still does
agree with the result that the west shear span failed
first.
The overall uplift behavior is quite different from the
slip behavior. There is little to no uplift in the
constant moment region and then reaches a
maximum at about the mid-shear span before
decreasing to approximately zero at the ends of the
beam. This behavior demonstrates that the concrete
deck panel is arching somewhat over the steel beam
along the shear spans. This arching behavior was
present in all of the beams tested, though it was
more pronounced in some than in others.
The figure also clearly show the presence of peaks,
or local maximums, in the uplift at each of the stud
clusters. These peaks are occurring since the shear
studs are trying to maintain vertical compatibility
between the deck and the beam. The uplift tends to
decrease between pockets since there are no studs at
these locations for damage to occur. These uplift
peaks were not present in the 1 ft. spacing beams,
but were in other spacings. The peaks were clearly
more apparent in the larger cluster spacings (36” and
48”).
Small-Scale Fatigue Tests
Specimens & Test Setup
Small-scale push out tests were also conducted in
conjunction with the large-scale testing. These test
specimens are similar to historical push out tests, but
with some adjustments. Each of the small-scale tests
consists of a 24” long W10x60 steel beam and two
small precast concrete decks with a pocket cast into
-0.01
0
0.01
0.02
0.03
0.04
0.05
0.06
0 40 80 120 160 200 240 280 320 360
Up
lift
bet
wee
n h
aun
ch &
fla
nge
(in
)
Distance from east end of beam (in)
0 cyc 100k 200k 300k 400k 500k 600k 700k
C/L
Beam
C/L
West
Load
C/L
East
Load
stud cluster
(typ.)
+
Figure 10. Uplift results taken at peak loads for 100k
cycle intervals for beam 4F2

Page 9 of 12
each of them. One shear stud is welded to each
flange of the steel beam and the concrete deck
panels are placed around the shear stud and grouted
into place. Figure 11 shows a drawing of these
specimens.
Some of the key differences between push out tests
in this study and those used in some previous tests
include the presence of shear studs on both sides of
the steel beam and the number of studs per side.
Some previous push out tests, such as those done by
Slutter and Fisher (2), were “one face” push out
tests, meaning they only had a slab on one side of
the steel beam. An analytical study has shown that
these types of tests can induce up to 20% more
tensile forces in the studs, which could result in a
reduced fatigue life of the studs (14). It is for this
reason that the push out tests conducted in this study
have slabs on both sides of the steel beam. Doing so
allows for a comparison of the tests in this study and
the majority of the historical data (15, 16, and 17 ).
The other main difference between the push out tests
in the current study and in previous testing is that
only one shear stud is welded per side of the steel
beam. Many other push out tests have either two or
four studs per side. In most push out tests, a
specimen is considered to have reached failure when
all of the shear studs on one side of the beam have
cracked such that the slab is detached from the steel
beam. In these cases, failure of the test is actually the
fatigue failure of all of the shear studs on one side of
the steel beam, which is typically either two or four
studs. For the present study, one stud is used per side
so that failure of a specimen would be the fatigue
failure of a single shear stud. Because of the single
stud configuration, there were concerns that the
concrete slabs could rotate about the shear stud when
loaded. Therefore, the decision was made to load the
specimens in tension, rather than compression.
Loading the specimens in tension would allow the
concrete slabs to essentially be “self-leveling” to
prevent any unwanted rotation.
The set up for loading the fatigue push out tests is
shown in Figure 12. A previous test specimen is also
included in the figure for reference. The fatigue push
out tests are loaded using a 55-kip servo-hydraulic
actuator. A loading fixture was constructed out of C-
shape channels to act as reactions on the tops of the
concrete slabs. Steel plates were grouted into plate
on top of both concrete slab to ensure the reactions
were being applied evenly between the two slabs.
The actuator was cycled under a constant load range
to produce the desired stress range at the base of
both shear studs while still maintaining elastic
behavior. The specimens were loaded until one or
both of the slabs had completely separated from the
steel beam. Typically one of the slabs became
separated first because one of the studs failed in
fatigue before the other. There were cases, however,
Figure 12. Test set up for small-scale fatigue test
Figure 11. Small-scale test specimens

Page 10 of 12
in which both studs failed in fatigue at
approximately the same time.
Instrumentation
There are a total of four strain gauges and two
LVDTs on each push out test. The strain gauges are
placed on the top and bottom (in the direction of
force) of each shear stud, located close to the base of
the stud. Since similar strain gauges were placed on
the large-scale tests, they were placed on the small-
scale tests as a means of comparing the two results.
One LVDT is installed on each deck panel to
measure the relative slip between the concrete and
the steel beam.
Test Results & Discussion
To date, 9 of the 14 anticipated fatigue tests are
complete. Initial stress ranges were selected in hopes
of reaching a fatigue failure within a reasonable
amount of time. Once a few tests had been
completed, stress ranges could be selected to
essentially fill in the gaps in the data. Because one of
primary goals of the push out tests was to evaluate
the current AASHTO LRFD shear stud CAFL, most
of the stress ranges for the push out tests were
selected to produce “long life” fatigue tests.
S-N Data
Unlike the large-scale tests, a fatigue failure was
much easier to define in the small-scale tests. For
these tests, a fatigue failure is defined to have
occurred once one or both of the two slabs is
completely separated from the steel beam. Table 3
shows the S-N data from the small-scale tests.
Table 3. S-N data for small-scale fatigue tests
Test name Stud stress
range (ksi) Cycles to failure
PO-F1 14 50,000,000a
PO-F2 20 148,935
PO-F3 18 817,519
PO-F4 16 7,472,601
PO-F5 15 1,792,647
PO-F6 13 50,000,000a
PO-F7 15 712,456
PO-F8 15 12,884,837
PO-F9 15 2,846,232
PO-F10 15 ongoing a – Test declared a run out
As seen in the table, two of the tests were stopped
after 50 million cycles without ever reaching failure;
these tests were considered run out tests. The stress
ranges that produced these run out tests were 13 and
14 ksi. All tests cycled at load ranges greater than 14
ksi produced tests with fatigue failures. Data from
the table were used to develop an S-N plot shown in
Figure 13.
Figure 13. S-N data for small-scale tests
Similar to the S-N plot for the large-scale tests,
Figure 13 includes the S-N test results as well as
three regression lines, which include the mean
regression and 95% and 5% confidence intervals.
The slope of the regression lines is -9.3. The 5%
confidence interval bears a close resemblance to the
AASHTO stud fatigue design curve at about 1k-
100k cycles. After this point, the AASHTO curve
decreases more rapidly until reaching the 7.0 ksi
CAFL.
Comparison of Test Results
One effective means of comparing the large- and
small-scale test results is to compare the regression
lines developed from each respective data set. This
comparison is shown in an S-N plot in Figure 14.
Also included in the figure are the shear stud fatigue
design equations for AASHTO and the Eurocode.
From the figure, it is easy to see that the large-scale
test regression has a steeper slope (-6.7) than the
small-scale regression (-9.3), with the two mean
regressions crossing at around 10k cycles. The
difference in slopes could be due to the difference in
loading. In the large-scale tests, the loading on the
shear studs, though idealized to be pure shear, is
1
10
100
1.E+03 1.E+04 1.E+05 1.E+06 1.E+07 1.E+08
Str
ess R
ange (
ksi)
Number of Cycles
Test Results 7.0 ksi
Mean regression with 2σ bounds
AASHTO (2010)

Page 11 of 12
more likely a combination of shear and tension
forces. For the small-scale tests, the loading on the
shear studs is much more like pure shear. In the case
of fatigue, tensile loading is more severe since it
causes a crack to open up and extend when loaded.
Other than the difference in slope, the behavior of
the two data sets is relatively similar and the
confidence intervals of the two overlap for a large
portion of the plot. The standard deviations for the
two data sets also appear similar since the distance
from mean regression to the confidence intervals for
both data sets is similar. This indicates that the
scatter between the two tests is on a similar scale.
The two data sets also appear much more similar to
the Eurocode stud fatigue design equation than to the
AASHTO equation. The Eurocode equation has a
slope of -8.0, which places it in between the large-
and small-scale regression slopes. Over the cycle
range displayed in Figure 14, the Eurocode equation
falls within the 95% and 5% confidence intervals for
the large-scale tests and nearly within the mean
regression and 5% confidence interval for the small-
scale tests. This suggests that shear stud fatigue
behavior appears to be more similar to the Eurocode
design equation, rather than the semi-log AASHTO
equation.
Summary of Tests & Future Work
This paper describes the results of ongoing testing to
investigate the fatigue resistance of using clustered
shear studs in clusters as a means of providing
composite action between a steel beam and a precast
concrete deck panel. To date, 10 of the 12
anticipated large-scale fatigue tests are complete,
with 1 more test ongoing. A failure criterion for the
large-scale tests has been defined as a complete loss
in composite action, as indicated by the movement
of the neutral axis in the steel beam. Using this
definition of failure, S-N data for the large-scale
tests has been developed. A regression analysis
reveals that the slope this data is approximately -6.7
and that the 5% confidence interval appears similar
to that AASHTO stud design curve over a fatigue
life of 10k-1.0 million cycles. At cycles greater than
this, AASHTO appears too conservative compared
to the test data due to the semi-log nature of the
design curve.
Strain gauge, LVDT, and FARO slip data suggested
that fatigue damage occurred at moderate rate at the
beginning of a test, then the rate of damage
decreased to a relatively steady state, then increased
once again before reaching failure. Strain gauge data
revealed that composite action was initially lost at a
faster rate near the ends of the beams, but that an
entire shear span seemed to reach a point of no
composite action at approximately the same time.
The extended stud cluster spacings of 36” and 48”
did not appear to have a negative impact on the
fatigue performance of the shear studs, both in terms
of the stud spacing greater than the current
AASHTO spacing limit of 24” and using shear studs
in clusters rather than a uniform longitudinal spacing
as is typically done in conventional bridge
construction.
At this point, 9 of the 14 anticipated small-scale tests
are complete, with 1 more test ongoing. A regression
analysis of the S-N data revealed a slope of -9.3,
which is slightly shallower than the large-scale test
regression. The increased slope is likely due to the
pure shear loading of the small-scale tests rather than
the combined shear and tension loading of the large-
scale tests. The large- and small-scale test
regressions equations were relatively similar to the
Eurocode stud design equation, providing more
evidence that the AASHTO stud fatigue design
equation is too conservative, and the semi-log nature
of the curve warrants re-examination. The overly
conservative nature of the AASHTO provisions are
especially problematic for the use of precast
concrete deck panels.
In addition to completing the remaining large- and
small-scale fatigue tests as described in this paper, a
1
10
100
1.E+03 1.E+04 1.E+05 1.E+06 1.E+07 1.E+08
Str
ess R
ange (
ksi)
Number of Cycles
Large-Scale
Small-Scale 7.0 ksi
Eurocode 4
AASHTO (2010)
Figure 14. Comparison of Large- & Small-Scale
Test Regression Equations

Page 12 of 12
partial composite action analysis will be performed
as a means for comparison to the large-scale test
data. Forensic examination, including non-
destructive evaluation, of many shear studs in both
tests is being conducted. This includes examining
the grout around the shear studs to determine the
extent of damage sustained during testing, as well as
examining the size and initiation point of the fatigue
cracks found in the shear studs. Metallographic
analysis of the shear stud welds is also anticipated.
In addition to the fatigue testing described in this
paper, static tests have also been conducted as part
of this study. Large-scale testing is complete, while
small-scale static tests will commence in the near
future. The large-scale static tests utilized similar
deck panels and shear stud cluster spacings as used
in the large-scale fatigue tests as described in this
paper. The push out static tests will consist of both
cast-in-place and precast concrete deck panels. The
static tests will examine the current AASHTO shear
stud strength and spacing provisions.
Acknowledgements
This work presented in this paper was conducted the
FHWA Turner-Fairbank Highway Research Center
(TFHRC) under FHWA Contract #DTFH61-10-D-
00017. The authors would like to thank the
Structure’s Laboratory staff for their ongoing
assistance throughout this project.
References
1. AASHTO (2010). AASHTO LRFD Bridge
Design Specifications. 5th Edition. American
Association of State Highway and
Transportation Officials. Washington, D.C.
2. Slutter, R.G., and Fisher, J.W. (1966). “Fatigue
Strength of Shear Connectors.” Highway
Research Record No. 147. National Research
Council. Washington, D.C.
3. King, D.C., Slutter, R.G., and Driscoll, G.C.
(1965). “Fatigue Strength of 1/2 Inch Diameter
Stud Shear Connectors.” Highway Research
Record No. 103. National Research Council.
Washington, D.C.
4. Toprac, A.A. (1965). “Fatigue Strength of 3/4
Inch Stud Shear Connectors”. Highway
Research Record No. 103. National Research
Council. Washington, D.C.
5. AASHTO (1977). Interim Specifications for
Bridges. American Association of State
Highway and Transportation Officials.
Washington, D.C.
6. Eurocode 4 (2005). 1994-2:2005. Design of
Composite Steel and Concrete Structures, Part
2-General Rules and Rules for Bridges.
7. Australian Standard. (2004). Bridge Design. Part
6: Steel and Composite Construction. Sydney,
Australia.
8. Japan Society of Civil Engineers. (2009).
Standard Specifications for Steel and Composite
Structures. 1st Edition.
9. AISC. (2005). Steel Construction Manual. 13th
Edition. American Institute of Steel
Construction, Inc.
10. Texas DOT. (2011). Bridge Design Manual –
LRFD. Texas Department of Transportation.
Revised December 2011.
11. AASHTO/AWS D1.5M/D1.5:2010. (2010).
Bridge Welding Code. American Association of
State Highway and Transportation Officials &
American Welding Society.
12. Sherman, R. J., Mueller, J. M., Connor, R. J.,
and Bowman, M. D. (2011). “Evaluation of
Effects of Super-Heavy Loading on the US 41
Bridge Over the White River.” Publication
FHWA/IN/JTRP-2011/15. Joint Transportation
Research Program, Indiana Department of
Transportation and Purdue University, West
Lafayette, IN.
13. Provines, J., and Ocel, J. (2014). “Strength &
Fatigue Resistance of Shear Stud Connectors.”
Accelerated Bridge Construction Conference,
Miami, FL. December 4-5.
14. Lee, K.-C., Abbas, H.H., and Ramey, G.E.
(2010). “Review of Current AASHTO Fatigue
Design Specifications for Stud Shear
Connectors.” Structures Congress 2010
Proceedings.
15. Mainstone, R.J., and Menzies, J.B. (1967).
“Shear connectors in steel-concrete composite
beams for bridges, Part I.” Concrete (9), pp.
291-302.
16. Hallan, M.W. (1976). “The behaviour of stud
shear connectors under repeated loading.”
Research Report No, R281, University of
Sydney, School of Civil Engineering, Sydney,
Australia.
17. Mundie, D.L. (2011). “Fatigue Testing and
Design of Large Diameter Shear Studs Used in
Highway Bridges.” Masters Thesis, Auburn
University, Auburn, AL.