fatigue behavior of high-strength steel welded …eeme.ntua.gr/proceedings/6th/2b_7.pdf · fatigue...
TRANSCRIPT

196
FATIGUE BEHAVIOR OF HIGH-STRENGTH STEEL WELDED PLATE CONNECTIONS
P. C. Perdikaris1, K. S. Papachristou
Department of Civil Engineering
University of Thessaly, Volos 38334, Greece 1e-mail : [email protected]
S. Houliara, A. D. Zervaki, S. A. Karamamos2, G. N. Haidemenopoulos
Department of Mechanical & Industrial Engineering
University of Thessaly, Volos 38334, Greece 2e-mail: [email protected]
1. ABSTRACT
The paper examines the fatigue behavior of SAW welded T-joints from high-strength steel
plates. Material characterization testing is conducted first, followed by fracture toughness CTOD measurements. Subsequently, nine T-joint specimens have been tested under fatigue loading. The experimental results were compared with S-N fatigue curves used in welded plated connection design, and indicated a very good fatigue performance of those joints. Finite element simulations showed a stress concentration very close to the vicinity of the weld toe, responsible for crack initiation. The good performance of those joints is very promising for the use of high-strength steel in bridge and in marine/offshore applications.
2. INTRODUCTION
Recent technological demands, mainly motivated by offshore exploration and marine engineering applications, point out a trend towards an increasing use of high-strength steel with yield stress higher than 460 MPa (Lotsberg & Bergan, 2006). The use of high-strength steel has also become an important issue for onshore applications, such as buildings and bridges (Miki et al. 2002). On the other hand, standards/recommendations available for fatigue design of welded connections do not account for the use of high grade steels. Therefore, the development of a specific know-how on the fatigue behavior of high-strength steel welded connections constitutes a important issue.
The present research is mainly experimental, and consists of a series of experiments on high-strength T-shaped welded plated connections, towards determining their fatigue strength. Plate thickness is 15 mm, and the nominal yield stress of the plates is 690 MPa. High-cycle fatigue is considered, with more than 200,000 number of load cycles for each specimen. The

197
experiments are supported by numerical simulations, aimed at determining local stress concentrations.
In particular, the research described in this paper is a part of an extensive research program, which is aimed at determining experimentally the fatigue strength of welded connections of high-strength steel plates, extending the fatigue database for high-strength steel specimens and proposing guidelines/recommendations towards a safe and efficient fatigue design of high-strength welded steel structures. The research in this paper consists mainly of a series of nine (9) high-cycle fatigue tests on T-joint plate specimens under four-point bending, with a ratio
min max 0.50R σ σ= = . Characterization of the steel material in the weld vicinity and
determination of its fracture toughness are also conducted. Finite element simulations are performed to determine stress concentrations at the weld toe. Finally, comparison of the fatigue results with existing design specifications and recommendations would indicate whether it is possible to extend existing design tools, developed for the fatigue design of regular-strength steel, to the case of high-strength steel.
L = 300mm W = 100mm
H = 120mm gap G=3mmangle a=45o root face R=2 mm
double bevel,welded from both sides
Figure 1: T-joint specimen geometry and welding preparation.
3. MATERIAL CHARACTERIZATION AND TESTING
The T-joint specimens are shown in Figure 1 and were manufactured by CORUS UK. The steel plate material is S690 Q (specified minimum yield stress equal to 690 MPa). Tensile tests conducted at CORUS labs indicated yield and tensile strengths of 840 MPa and 890 MPa respectively. The plates were laser cut and beveled, and full penetration SAW fillet welding was performed. The preparation of the specimen is also shown in Figure 1.
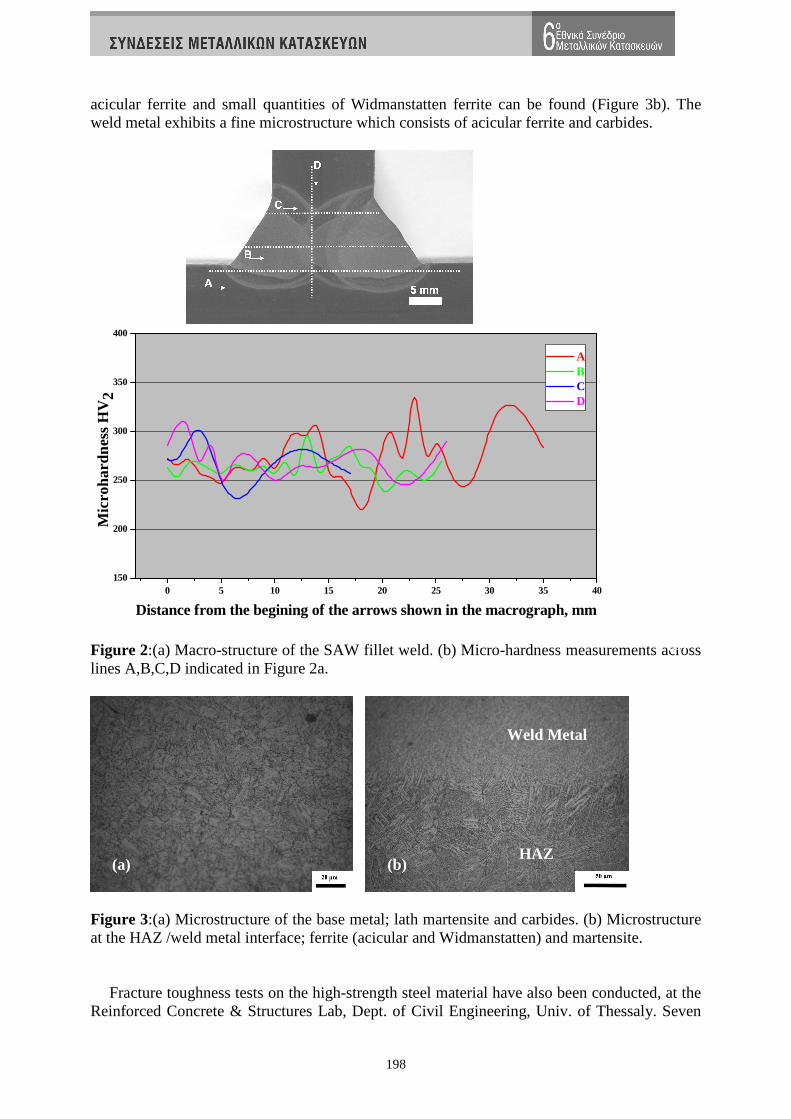
Macroscopic and microspopic evaluations of the welded specimens were performed at the Laboratory of Materials, Dept. of Mechanical & Industrial Engineering, Univ. of Thessaly, by employing the standard procedure of metallographic preparation and examination under Optical Metallographic Microscope. Microhardness measurements were also conducted on the same specimens at a load of 2kgr on Vickers scale. The macrostructure of the weld is shown in Figure 2a. The weld metal, as well as the HAZ is clearly highlighted. The weld is free of macro-defects, and there is a smooth transition from the weld metal to the HAZ and the base metal. The microhardness measurements are depicted in Figure 2b. All measurements are within the range of 220-335 HV2.
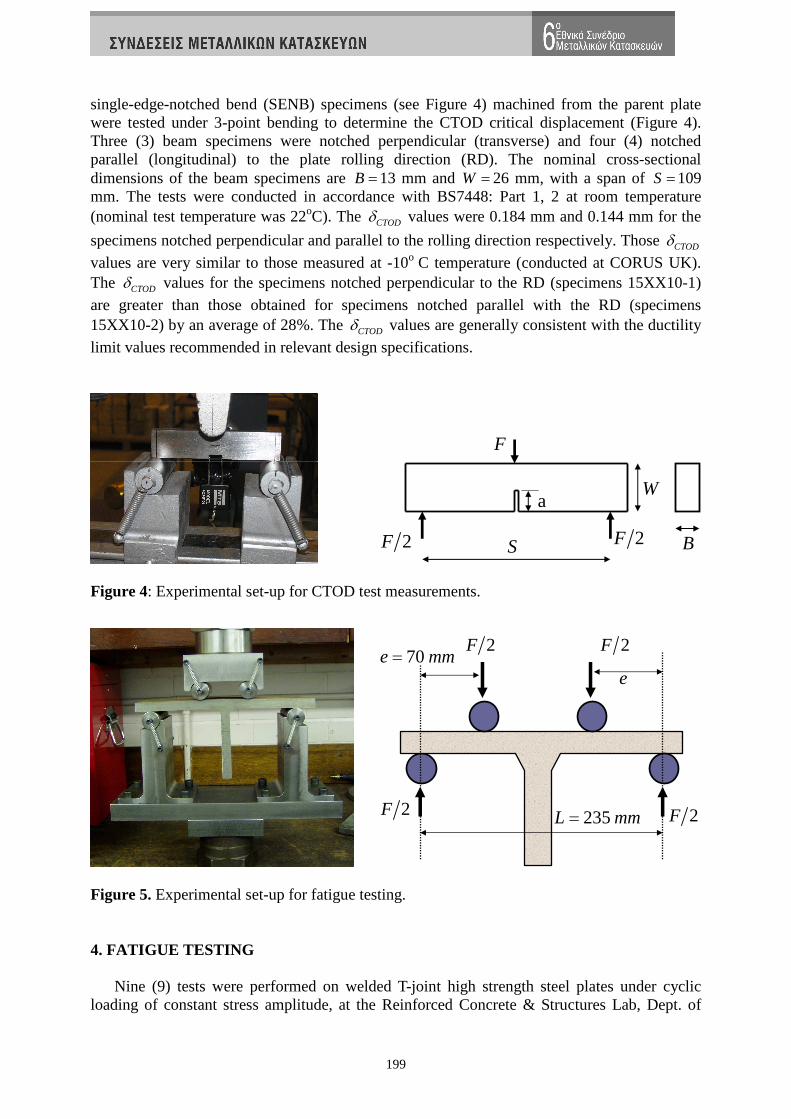
The base plate exhibits a fine microstructure, consisting of tempered lath martensite and carbides (Figure 3a). In the HAZ, adjacent to the boundary with the base plate aggregated carbides and ferrite can be observed while towards the weld metal the microstructure contains plate martensite and ferrite. At the interface with the weld metal a mixture of martensite,
198
acicular ferrite and small quantities of Widmanstatten ferrite can be found (Figure 3b). The weld metal exhibits a fine microstructure which consists of acicular ferrite and carbides.
0 5 10 15 20 25 30 35 40150
200
250
300
350
400
Mic
roha
rdne
ss H
V2
Distance from the begining of the arrows shown in the macrograph, mm
A B C D
Figure 2:(a) Macro-structure of the SAW fillet weld. (b) Micro-hardness measurements across lines A,B,C,D indicated in Figure 2a.
Figure 3:(a) Microstructure of the base metal; lath martensite and carbides. (b) Microstructure at the HAZ /weld metal interface; ferrite (acicular and Widmanstatten) and martensite.
Fracture toughness tests on the high-strength steel material have also been conducted, at the
Reinforced Concrete & Structures Lab, Dept. of Civil Engineering, Univ. of Thessaly. Seven
HAZ
Weld Metal
(b)
(a) (b)
199
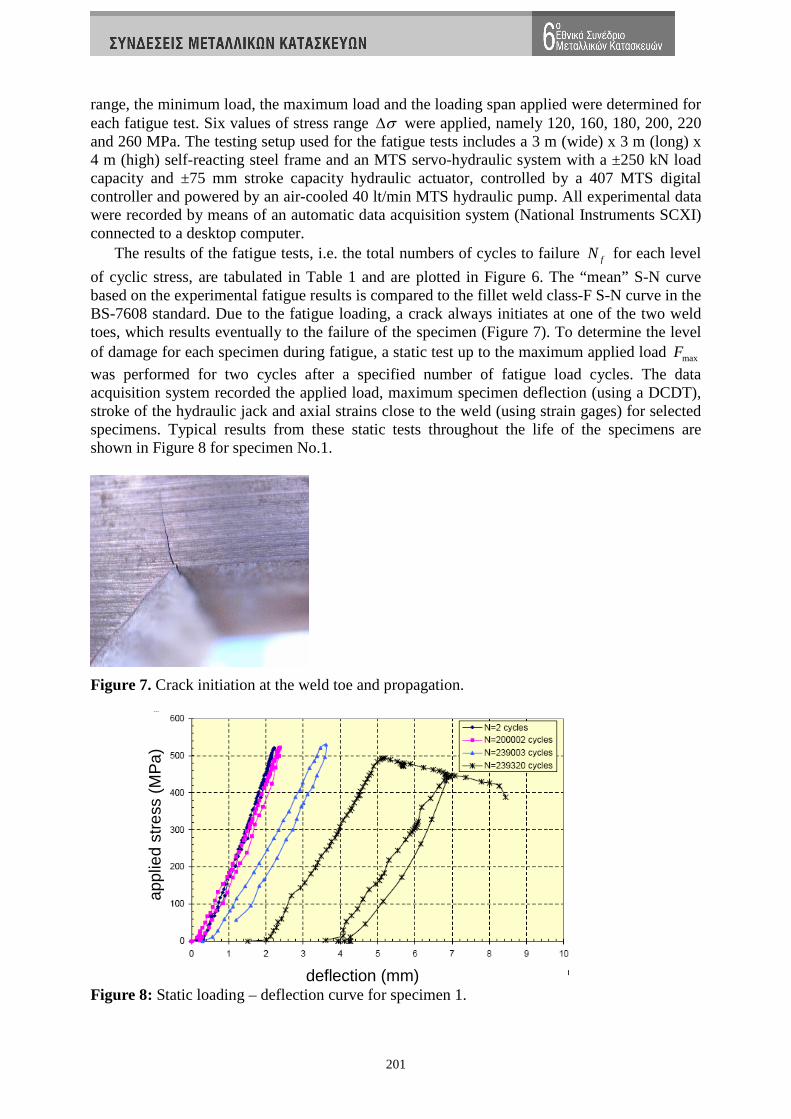
single-edge-notched bend (SENB) specimens (see Figure 4) machined from the parent plate were tested under 3-point bending to determine the CTOD critical displacement (Figure 4). Three (3) beam specimens were notched perpendicular (transverse) and four (4) notched parallel (longitudinal) to the plate rolling direction (RD). The nominal cross-sectional dimensions of the beam specimens are B =13 mm and W = 26 mm, with a span of S=109 mm. The tests were conducted in accordance with BS7448: Part 1, 2 at room temperature (nominal test temperature was 22oC). The CTODδ values were 0.184 mm and 0.144 mm for the
specimens notched perpendicular and parallel to the rolling direction respectively. Those CTODδ
values are very similar to those measured at -10o C temperature (conducted at CORUS UK). The CTODδ values for the specimens notched perpendicular to the RD (specimens 15XX10-1)
are greater than those obtained for specimens notched parallel with the RD (specimens 15XX10-2) by an average of 28%. The CTODδ values are generally consistent with the ductility
limit values recommended in relevant design specifications.
F
2F 2FS B
Wa
Figure 4: Experimental set-up for CTOD test measurements.
2F 2F
2F 2F
235L mm=
70e mm=
e
Figure 5. Experimental set-up for fatigue testing. 4. FATIGUE TESTING
Nine (9) tests were performed on welded T-joint high strength steel plates under cyclic
loading of constant stress amplitude, at the Reinforced Concrete & Structures Lab, Dept. of

200
Civil Engineering, Univ. of Thessaly. The purpose of this experimental investigation was to determine the fatigue life of high strength welded steel plates subjected to a specified stress range. Based on the test results, the corresponding S–N curve was obtained and compared with the fillet weld class-F S-N mean curve given in the BS-7608 design standard.
Test
No.
σmax
(MPa)
σmin
(MPa)
∆σ
(MPa)
Cycles to failure,
Nf log∆σ logNf
1 520 260 260 239,320 2.41 5.38
9 520 260 260 229,858 2.41 5.36
2 440 220 220 369,964 2.34 5.57
3 400 200 200 731,500 2.30 5.86
8 400 200 200 615,530 2.30 5.79
4 360 180 180 918,282 2.26 5.96
5 320 160 160 957,866 2.20 5.98
7 320 160 160 867,672 2.20 5.94
6 240 120 120 3,440,910 2.08 6.54
Table 1. Test results: total number of cycles to failure versus applied stress range.
1,90
1,95
2,00
2,05
2,10
2,15
2,20
2,25
2,30
2,35
2,40
2,45
2,50
5,00 5,25 5,50 5,75 6,00 6,25 6,50 6,75 7,00 7,25 7,50logΝ
log∆σ
load cycles (logN)
appl
ied
stre
ss r
ange
(lo
g∆σ
)
test results
mean test results
BS 7608Class F (mean)
Figure 6: Fatigue test results; comparison with mean curve F from BS 7608 specification.
Specimens of welded T-joint high strength steel plates were tested under cyclic loading with constant stress amplitude, under 4-point bending with load control (see Figure 5). All specimens had the same geometric, material properties, and type of welding yield strength. The span length of the specimen is L = 235 mm, the thickness is t = 15 mm, the width b = 95 mm and the moment arm of the applied concentrated load e=70 mm, as shown in Figure 5. A constant stress ratio, min max 0.50R σ σ= = , is used with a test frequency of 5 Hz. For each
specimen tested under fatigue loading a different stress range σ∆ is applied. Given the stress
201
range, the minimum load, the maximum load and the loading span applied were determined for each fatigue test. Six values of stress range σ∆ were applied, namely 120, 160, 180, 200, 220 and 260 MPa. The testing setup used for the fatigue tests includes a 3 m (wide) x 3 m (long) x 4 m (high) self-reacting steel frame and an MTS servo-hydraulic system with a ±250 kN load capacity and ±75 mm stroke capacity hydraulic actuator, controlled by a 407 MTS digital controller and powered by an air-cooled 40 lt/min MTS hydraulic pump. All experimental data were recorded by means of an automatic data acquisition system (National Instruments SCXI) connected to a desktop computer.
The results of the fatigue tests, i.e. the total numbers of cycles to failure fN for each level
of cyclic stress, are tabulated in Table 1 and are plotted in Figure 6. The “mean” S-N curve based on the experimental fatigue results is compared to the fillet weld class-F S-N curve in the BS-7608 standard. Due to the fatigue loading, a crack always initiates at one of the two weld toes, which results eventually to the failure of the specimen (Figure 7). To determine the level of damage for each specimen during fatigue, a static test up to the maximum applied load maxF
was performed for two cycles after a specified number of fatigue load cycles. The data acquisition system recorded the applied load, maximum specimen deflection (using a DCDT), stroke of the hydraulic jack and axial strains close to the weld (using strain gages) for selected specimens. Typical results from these static tests throughout the life of the specimens are shown in Figure 8 for specimen No.1.
Figure 7. Crack initiation at the weld toe and propagation.
appl
ied
stre
ss (
MP
a)
deflection (mm) Figure 8: Static loading – deflection curve for specimen 1.

202
Fractographic evaluation of the fracture surfaces revealed the typical appearance of fatigue fracture, i.e. a fatigue fracture area and a final fast fracture area, as shown in Figures 9 and 10. Due to fatigue loading, one or two cracks initiate at the weld toe, and progressively by propagating through the base metal leads the specimens to failure. In specimen 9 ( MPa520max =σ ), cracks initiate on both sides of the T-joint, between the weld metal and the
HAZ (Figure 10), while at lower stress levels crack initiates only at one of the weld toes (Figure 9).
Test No.6
Test No.3
Figure 9. Typical macrographs of fracture surfaces; arrows indicate the fracture origins.
HAZweld metal
Test No. 9
Figure 10. Secondary fatigue crack (test No. 9) 5. FINITE ELEMENT SIMULATION
Finite element simulations have been conducted the Laboratory of Mechanics & Strength of Materials, Dept. of Mechanical & Industrial Engineering, Univ. of Thessaly, in order to examine the existence of local stress and strain raises in the vicinity of the weld toe, responsible for the fatigue failure (geometric stresses). A plane-strain two-dimensional model is employed Figure 11. The variation of longitudinal normal stress normalized by the nominal stress, denoted as stress concentration factor (SCF), is also shown in Figure 11 in terms of its distance from the weld toe. The results indicate stress concentration at the small vicinity of the weld, which is responsible for the fatigue failure (geometric stress). It is interesting to note that a very fine mesh is necessary for obtaining this stress concentration, whereas using a coarse FE mesh (Lotsberg & Sigurdsson, 2006), stress extrapolation from a region between 50% and 150% of the plate thickness results in a geometric stress equal to the nominal stress. 6. CONCLUSIONS
The results from the present study indicated that the welded joints exhibited an excellent fatigue performance. The fatigue life observed at the tested specimens was considerable higher

203
than the one predicted by relevant design specifications, such as BS 7608 mean curve. This constitutes a very promising result for the use of high-strength steel in applications where fatigue is a major design factor. The research is of particular importance for the fatigue design of welded steel structures subjected to repeated loading conditions, such as highway or railway bridges, marine structures (tankers, FPSO’s etc.), towards safeguarding their structural integrity
0.8
1.0
1.2
1.4
1.6
1.8
0.0 0.5 1.0 1.5 2.0 2.5distance from weld/plate thickness
SC
F
Hot spot stress Figure 11. Variation of stress in terms of distance from the weld toe.
7. ACKNOWLEDGMENTS
The authors would like to thank C. Davies, D. Shuter and M. Large, CORUS, Rotherham, UK, for manufacturing the specimens and for conducting tensile material testing.
8. REFERENCES
[1] BS 7608 (1993), Code of practice for fatigue design and assessment of steel structures, British Standards Institute, London, UK.
[2] BS 7448 (1997), Fracture Toughness tests – Parts 1 and 2: Method for the determination of KIC, critical CTOD and critical J values of welds in metallic materials, British Standards Institute, London, UK.
[3] Lostberg, I. and Bergan, P. G. (2006), “Fatigue Capacity of FPSO Structures”, ASME J. Offshore Mechanics and Arctic Engineering, Vol. 128, No. 2, pp. 156-161
[4] Miki C., Homma K. & Tominaga T. (2002), “High strength and high performance steels and their use in bridge structures”, J. Constr. Steel Research, Vol. 58, No. 1, pp. 3-20.
[5] Lostberg, I. and Sigurdsson, G. (2006), “Hot-Spot S-N Curve for Fatigue Analysis of Plated Structures”, ASME J. Offshore Mechanics & Arctic Engineering, Vol. 128, No. 4, pp. 330-336.
204
ΚΟΠΩΣΗ ΣΥΓΚΟΛΛΗΤΩΝ ΣΥΝ∆ΕΣΕΩΝ ΕΠΙΠΕ∆ΩΝ ΕΛΑΣΜΑΤΩΝ ΑΠΟ ΧΑΛΥΒΑ ΥΨΗΛΗΣ ΑΝΤΟΧΗΣ
Φ. Κ. Περδικάρης1, Κ. Σ. Παπαχρήστου Τµήµα Πολιτικών Μηχανικών
Πανεπιστήµιο Θεσσαλίας, Βόλος 38334 1email: [email protected]
Σ. Χουλιαρά, Α. Ζερβάκη, Σ. Α. Καραµάνος2, Γ. Ν. Χαϊδεµενόπουλος
Τµήµα Μηχανολόγων Μηχανικών Βιοµηχανίας Πανεπιστήµιο Θεσσαλίας, Βόλος 38334
2email: [email protected]
ΠΕΡΙΛΗΨΗ Η παρούσα εργασία είναι πρωτίστως πειραµατική και περιλαµβάνει έναν αριθµό 9 πειραµάτων κόπωσης σε κόµβους επίπεδων ελασµάτων µορφής Τ από χάλυβα υψηλής αντοχής. Η κόπωση είναι πολύ-κυκλική, και τα χαλύβδινα ελάσµατα έχουν πάχος 15 mm και ονοµαστικό όριο διαρροής 690 MPa. Τα πειραµατικά αποτελέσµατα υποστηρίζονται από αριθµητικές αναλύσεις πεπερασµένων στοιχείων. Η έρευνα περιλαµβάνει:
• Μακροσκοπική και µικροσκοπική αξιολόγηση των συγκολλητών συνδέσεων. Αυτό συνίσταται στην µεταλλογραφική εξέταση του µητρικού µετάλλου, της θερµο-επηρεαζόµενης ζώνης και του µετάλλου της συγκόλλησης, καθώς και σε δοκιµές µικρο-σκλήρυνσης.
• Πειράµατα προσδιορισµού της δυσθραυστότητας του µετάλλου υψηλής αντοχής, και την τιµή του αντίστοιχου CTOD.
• Πειράµατα κόπωσης σε 9 δοκίµια µορφής Τ µε στόχο τον προσδιορισµό της διάρκειας ζωής (κύκλων φόρτισης) για διάφορες τιµές εύρους διακύµανσης της τάσης, και για λόγο min max 0.50R σ σ= = .
• Θραυστο-γραφική αξιολόγηση των δοκιµίων µετά την κόπωση για τον προσδιορισµό της µορφής της αστοχίας.
• Αναλύσεις πεπερασµένων στοιχείων για τον προσδιορισµό της τοπικής τάσης στην γειτονία της συγκόλλησης και τις συγκεντρώσεις τάσεων που είναι υπεύθυνες για την αστοχία σε κόπωση.
• Σύγκριση µε υπάρχοντες κανονισµούς κόπωσης, ώστε να εξεταστεί η επέκταση των ισχυόντων κανονισµών κόπωσης για το σχεδιασµό σε κόπωση συγκολλητών συνδέσεων υψηλής αντοχής.
Τα αποτελέσµατα δείχνουν πως η αντοχή σε κόπωση των εν λόγω συνδέσεων είναι πολύ υψηλή, σε σχέση µε τις προβλέψεις των αντίστοιχων κανονισµών. Αυτό είναι πολύ ενθαρρυντικό για την χρήση των χαλύβων υψηλής αντοχής σε κατασκευές όπου η κόπωση αποτελεί σηµαντικό παράγοντα σχεδιασµού (γέφυρες, θαλάσσιες κατασκευές κτλ.).