fatigue analysis of an aluminium radial impeller - lth€¦ · fatigue analysis of an aluminium...
TRANSCRIPT

Fatigue Analysis of an
Aluminium Radial Impeller
AUTHOR: DAVID JIMÉNEZ GARCIA
SUPERVISORS: SRINIVASAN IYENGAR, LTH
LARS LUNDIN, VOLVO POWERTRAIN AB
EXAMINER: SOLVEIG MELIN
ISRN
MASTER THESIS
DEPARTMENT OF MECHANICAL ENGINEERING
DIVISION OF MATERIAL’S ENGINEERING
LUND UNIVERSITY
SPRING 2011
Fatigue Analysis of an Aluminium Radial Impeller David Jiménez Garcia
-I-
Abstract
High cycle and low cycle fatigue properties have been determined for Al2618-
T8511. HCF testing has been performed with stress control and LCF with strain
control. Both types of fatigue test were performed at 200ºC. With strain-lifespan
data points, cyclic stress-strain curve is obtained.
Fatigue data has been scaled to other temperatures and used to redesign the
back-disc of a radial impeller of a turbocharger of a truck. Lifespan of the
impeller depends on the type of use. If the truck is driven at high altitude the
impeller can only withstand 10421 cycles. When the truck is driven at sea level,
the cycles that the impeller can withstand vary from 85406 (maximum
requirements) to more than 10 Million cycles (normal-low requirements).
Due to trade secret, stress, strain and temperature scales have been removed
from the results.
Fatigue Analysis of an Aluminium Radial Impeller David Jiménez Garcia
-II-
Acknowledgements
I would like to address a few kind words of thanks to the following people for
aiding me throughout the process of this Master Thesis.
Srinivasan Iyengar from LTH, who supported me throughout the Master
Thesis process and encouraged me to persevere when everything seemed
to go wrong and slow with some troubles.
Lars Lundin from VOLVO Powertrain AB, who provided me with the
opportunity to do this Master Thesis, in addition to helping me with the
simulations and furnishing me with all the useful information and data he
could.
Zivorad Zivkovic from LTH, who helped me with all the material testing
experiments and provides me with assistance in solving the problems I
encountered while executing them.
Håkan Torstensson from VOLVO Powertrain AB, who helped me with the
simulations by showing me how to introduce the temperature field.
Ulf Karlsson from SIMULIA Scandinavia [19], who let me use a free-of-
charge special license of ABAQUS 6.10 CAE to run the simulations.
Antonio and Marta, my parents, who made this happen by encouraging me
throughout my entire life to study hard, financing my education and this
year abroad.
Lauren Scamuffa, who helped me to proofread and edit this report any
time I asked.
Sergio, Raquel, Juanjo and friends who had a constant concern about this
Master Thesis, making sure to constantly ask me where I was in the
process while encouraging and supporting me to complete it swiftly and
promptly.
Fatigue Analysis of an Aluminium Radial Impeller David Jiménez Garcia
-III-
List of figures
Figure 1: Wohler’s curve. ............................................................................................................ 3
Figure 2. Ultimate tensile strength variation with temperature. ............................................... 8
Figure 3. Yield tensile strength variation with temperature. ..................................................... 9
Figure 4. Elongation at break variation with temperature. εbreak(T) ....................................... 10
Figure 5. Modulus of elasticity variation with temperature. E(T). ........................................... 10
Figure 6: Schematic diagram of a turbocharger. ..................................................................... 11
Figure 7: Dimensions of the sample used for fatigue testing. .................................................. 13
Figure 8: General view of fatigue experimental facilities......................................................... 14
Figure 9: View of mounting the sample’s process. ................................................................... 15
Figure 10: View of the machine ready to heat the sample and perform the test. ................... 15
Figure 11: View of the ready heater controller. ....................................................................... 16
Figure 12: View of grips hydraulic pressure controller. ............................................................ 16
Figure 13: Left: Hydraulic press controller. Right: Detail of the controlling panel. .................. 17
Figure 14: Rockwell B hardness testing equipment. ................................................................ 19
Figure 15: Struers Rotopol-2. .................................................................................................... 21
Figure 16: XL 30 ESEM microscope. .......................................................................................... 22
Figure 17: Stress level versus cycles. All obtained points’ data. ............................................... 24
Figure 18: Stress level versus cycles. No run-outs obtained points’ data. ................................ 25
Figure 19: Stress level versus cycles. Used obtained points’ data. ........................................... 26
Figure 20: Total, plastic and elastic strain amplitude versus reversals. ................................... 27
Figure 21: Plastic strain amplitude versus reversals. ............................................................... 28
Figure 22: Stress amplitude versus reversals. .......................................................................... 29
Fatigue Analysis of an Aluminium Radial Impeller David Jiménez Garcia
-IV-
Figure 23: Strain versus reversals with plastic and elastic straight lines. ................................ 30
Figure 24: Cyclic stress-strain. Comparison between experimental and used data. ............... 32
Figure 25: LCF. Comparison between strain and strain&load-controlled curves. .................... 33
Figure 26: Cyclic stress-strain. Scaling at different temperatures............................................ 34
Figure 27: LCF Curve. Scaling at different temperatures. ......................................................... 35
Figure 28: Tensile test’s graph at room temperature. ............................................................. 36
Figure 29: Tensile test’s graph at 200ºC. ................................................................................. 36
Figure 30: Comparison between the 2 tensile tests’ graphs. ................................................... 37
Figure 31: Zoom of the comparison between the 2 tensile tests’ graphs. ............................... 37
Figure 32: Microstructure at different magnification factors. ................................................. 40
Figure 33: Microstructure at 2000X magnification factor. ..................................................... 41
Figure 34: Surface of a HCF tested sample at different magnification factors. ....................... 42
Figure 35: Surface of a LCF tested sample at different magnification factors. ........................ 43
Figure 36: Spectrum of the matrix phase. ................................................................................ 45
Figure 37: Spectrum of the precipitate phase. ......................................................................... 45
Figure 38: Worst impeller’s back-disc design regarding centrifugal forces. ............................ 47
Figure 39: Best impeller’s back-disc design regarding centrifugal forces. ............................... 47
Figure 40: Temperature field of the impeller. .......................................................................... 48
Figure 41: Stress distribution caused by only the temperature. .............................................. 49
Figure 42: Stress distribution of the impeller used at high altitude. ........................................ 50
Figure 43: Log(life) distribution of the impeller used at high altitude. .................................... 51
Figure 44: Impeller’s stress distribution used at sea level with normal-low requirements. .... 52
Figure 45: Impeller’s log(life) distribution used at sea level with normal-low requirements. . 53

Fatigue Analysis of an Aluminium Radial Impeller David Jiménez Garcia
-V-
Figure 46: Impeller’s stress distribution used at sea level with maximum requirements. ....... 54
Figure 47: Impeller’s log(life) distribution used at sea level with maximum requirements. .... 55
Fatigue Analysis of an Aluminium Radial Impeller David Jiménez Garcia
-VI-
List of tables
Table 1. Composition of AL2618-T851 ....................................................................................... 5
Table 2. Main properties at room temperature ......................................................................... 7
Table 3. Keller’s etch composition. ........................................................................................... 21
Table 4. Rm and Re values. ....................................................................................................... 38
Table 5. Hardness values. ......................................................................................................... 39
Table 6. Weight percentage of each element in the matrix phase. ......................................... 44
Table 7. Weight percentage of each element in the precipitate phase. .................................. 44
Table 8. Simulation’s results depending on the use assembled together. ............................ 56
Fatigue Analysis of an Aluminium Radial Impeller David Jiménez Garcia
-VII-
Table of Contents
1 Introduction ............................................................................................................... 1
1.1 Background ................................................................................................................... 1
1.2 Problem Description ...................................................................................................... 1
1.3 Objectives ..................................................................................................................... 1
1.4 Limitations .................................................................................................................... 1
2 Theoretical Work ....................................................................................................... 2
2.1 Fatigue .......................................................................................................................... 2
2.2 AL2618-T8511 ................................................................................................................ 5
2.2.1 General Description........................................................................................................................... 5
2.2.2 Composition ...................................................................................................................................... 5
2.2.3 Thermo-Mechanical Treatments ....................................................................................................... 6
2.2.4 Properties .......................................................................................................................................... 6
2.3 Turbocharger ............................................................................................................... 11
3 Experimental Work .................................................................................................. 13
3.1 Fatigue Testing ............................................................................................................ 13
3.1.1 Sample Used .................................................................................................................................... 13
3.1.2 Testing Process and Facilities Used ................................................................................................. 14
3.2 Tensile Test ................................................................................................................. 18
3.3 Hardness Testing ......................................................................................................... 19
3.4 Microscope .................................................................................................................. 20
3.4.1 Bare Sample’s Preparation .............................................................................................................. 20
3.4.2 Microstructure analysis ................................................................................................................... 22
3.4.3 Fractography ................................................................................................................................... 23
3.4.4 Energy Dispersive Spectroscopy (EDS) ............................................................................................ 23
Fatigue Analysis of an Aluminium Radial Impeller David Jiménez Garcia
-VIII-
4 Results ..................................................................................................................... 24
4.1 Fatigue Testing ............................................................................................................ 24
4.1.1 HCF. Load-Controlled ...................................................................................................................... 24
4.1.2 LCF. Strain-Controlled ..................................................................................................................... 27
4.1.3 Data for Fatigue Simulations ........................................................................................................... 28
4.1.3.1 Scaling at different temperatures .......................................................................................... 34
4.2 Tensile Tests ................................................................................................................ 36
4.3 Hardness Testing ......................................................................................................... 39
4.4 Microscope .................................................................................................................. 40
4.4.1 Microstructure Analysis .................................................................................................................. 40
4.4.2 Fractography ................................................................................................................................... 42
4.4.3 EDS .................................................................................................................................................. 44
5 Impeller Design Process ............................................................................................ 46
5.1 Design Steps ................................................................................................................ 46
5.1.1 Optimizing the Design Regarding Centrifugal Forces ...................................................................... 46
5.1.2 Introducing the Temperature Field ................................................................................................. 48
5.1.3 Regarding Life (Fatigue Analysis) ..................................................................................................... 49
5.2 Optimized Design ........................................................................................................ 50
5.2.1 From 30% to 100% of Top Speed .................................................................................................... 50
5.2.2 From 30% to 75% of Top Speed ...................................................................................................... 52
5.2.3 From 30% to 90% of Top Speed ...................................................................................................... 54
5.2.4 Results Assembled Together ........................................................................................................... 56
6 Conclusions .............................................................................................................. 57
7 References ............................................................................................................... 58
Fatigue Analysis of an Aluminium Radial Impeller David Jiménez Garcia
-1-
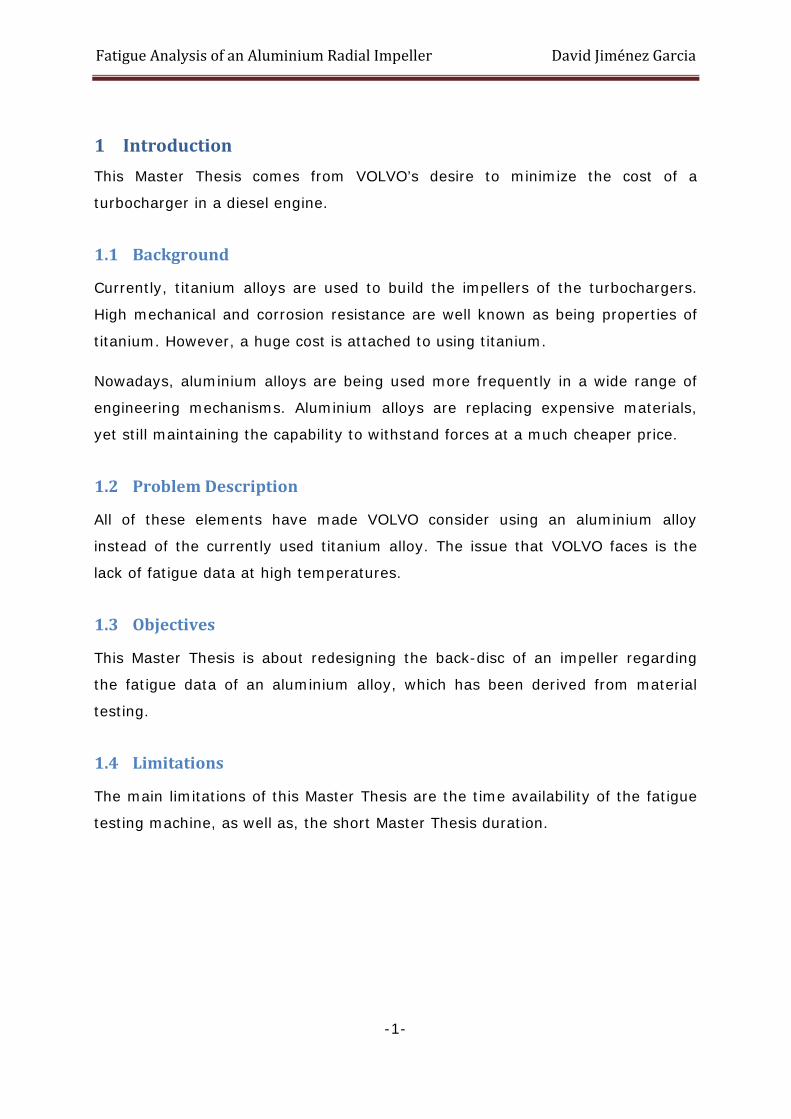
1 Introduction This Master Thesis comes from VOLVO’s desire to minimize the cost of a
turbocharger in a diesel engine.
1.1 Background
Currently, titanium alloys are used to build the impellers of the turbochargers.
High mechanical and corrosion resistance are well known as being properties of
titanium. However, a huge cost is attached to using titanium.
Nowadays, aluminium alloys are being used more frequently in a wide range of
engineering mechanisms. Aluminium alloys are replacing expensive materials,
yet still maintaining the capability to withstand forces at a much cheaper price.
1.2 Problem Description
All of these elements have made VOLVO consider using an aluminium alloy
instead of the currently used titanium alloy. The issue that VOLVO faces is the
lack of fatigue data at high temperatures.
1.3 Objectives
This Master Thesis is about redesigning the back-disc of an impeller regarding
the fatigue data of an aluminium alloy, which has been derived from material
testing.
1.4 Limitations
The main limitations of this Master Thesis are the time availability of the fatigue
testing machine, as well as, the short Master Thesis duration.
Fatigue Analysis of an Aluminium Radial Impeller David Jiménez Garcia
-2-
2 Theoretical Work As one can read in the title of this Master Thesis, the three main topics that will
be discussed are: what exactly does fatigue mean, the aluminium alloy and the
turbochargers.
2.1 Fatigue
Security factors are used to avoid reaching, among other properties, the yield
tensile strength of the material of an element and avoid the situation that the
mechanic limit is exceeded. However, that is not the only property to be
considered.
Fatigue is highly important especially when dynamic cyclic loads are applied.
Actually, around the 90% of failures in metallic elements are caused by fatigue.
Fatigue is shown up as a fracture. At the beginning it can only be a microscopic
fracture, but once it has appeared, it starts to grow until it can be perceived by
human eye. The fracture is propagated until the breakage is reached. The
breakage of one element of a machine can be the cause of the breakage of other
components of the machine or even the cause of an accident involving human
beings. Ref. [8]
Then, it is clear that being the main cause of a machine failure and being able to
cause unexpected dangerous accidents make fatigue knowledge be of high
importance in the engineering area.
Fatigue appears on a material when a load is repeatedly applied. The most
dangerous effect is that a dynamic cyclic load can make the failure appear below
the yield tensile strength of the material. This kind of failure is completely
unexpected if fatigue has not been taken into account in the design process.
Stress and strain are the two different approaches regarding fatigue life that can
be used when designing. Stress-approach is more often used because more data
can be found and experiments are easier and cheaper to perform because no
extensometer is needed.
Fatigue Analysis of an Aluminium Radial Impeller David Jiménez Garcia
-3-
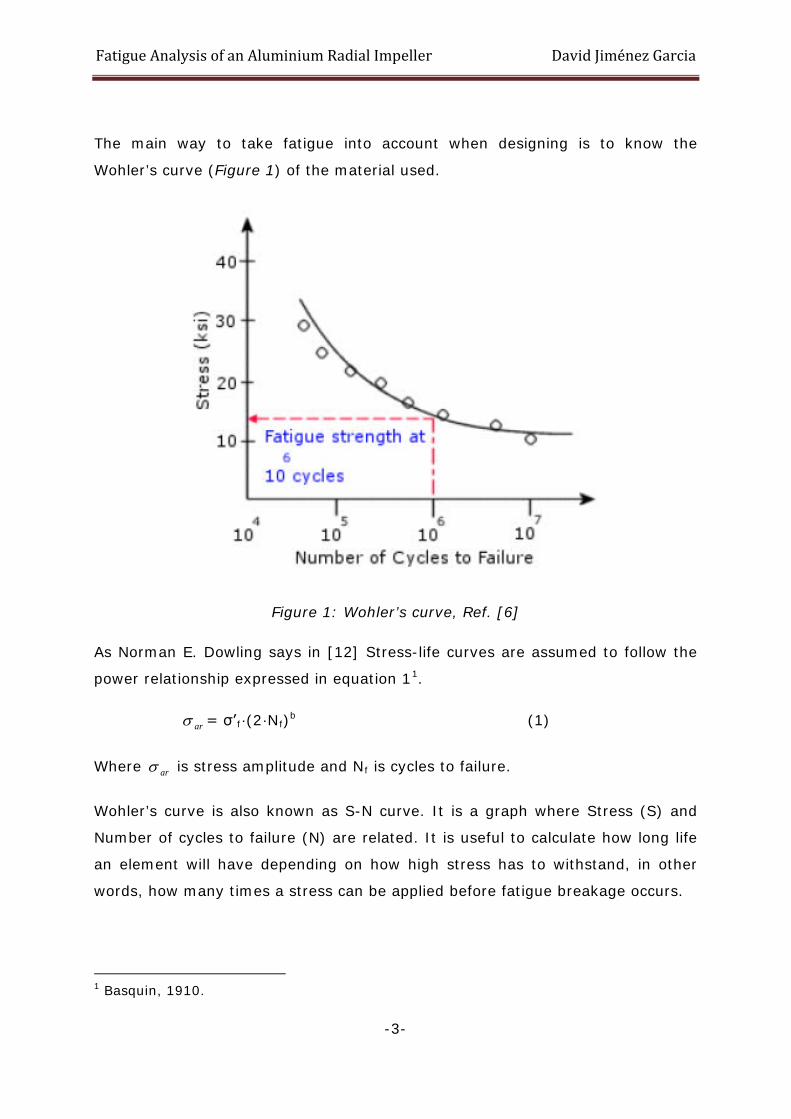
The main way to take fatigue into account when designing is to know the
Wohler’s curve (Figure 1) of the material used.
Figure 1: Wohler’s curve, Ref. [6]
As Norman E. Dowling says in [12] Stress-life curves are assumed to follow the
power relationship expressed in equation 11.
arσ = σ’f·(2·Nf)b (1)
Where arσ is stress amplitude and Nf is cycles to failure.
Wohler’s curve is also known as S-N curve. It is a graph where Stress (S) and
Number of cycles to failure (N) are related. It is useful to calculate how long life
an element will have depending on how high stress has to withstand, in other
words, how many times a stress can be applied before fatigue breakage occurs.
1 Basquin, 1910.
Fatigue Analysis of an Aluminium Radial Impeller David Jiménez Garcia
-4-
In Wohler’s curve two different regions are noticeable: High Cycle Fatigue (HCF)
and Low Cycle Fatigue (LCF). On one hand, HCF corresponds to the right region
which is about low stress levels and elastic deformation and, therefore, a high
number of cycles of life. On the other hand, LCF corresponds to the left region
which is about high stress levels and plastic deformation and, therefore, a low
number of cycles of life.
Although strain-approach is not as commonly used as stress-approach, in this
Master Thesis, the redesign of the back-disk of the impeller is performed using
strain-approach.
Strain-approach (Ref. [9-12]) consists on splitting the plastic deformation from
the elastic deformation to be able to calculate an accurate strain-life curve that
fits both HCF and LCF. Different regressions, equations and corrections have to
be used during this data evaluating process2.
2 Further explanation can be found in section 4.1.
Fatigue Analysis of an Aluminium Radial Impeller David Jiménez Garcia
-5-
2.2 AL2618-T8511
The alloy to be analysed is the AL2618-T8511. The following remarks provide
useful information regarding this alloy.
2.2.1 General Description
AL2618-T8511 is wrought aluminium, which contains copper and magnesium. It
is age-hardenable and commonly used for pistons, large rotating aircraft engines
components and compressor blades. Until 315°C, it has good elevated
temperature properties.
2.2.2 Composition
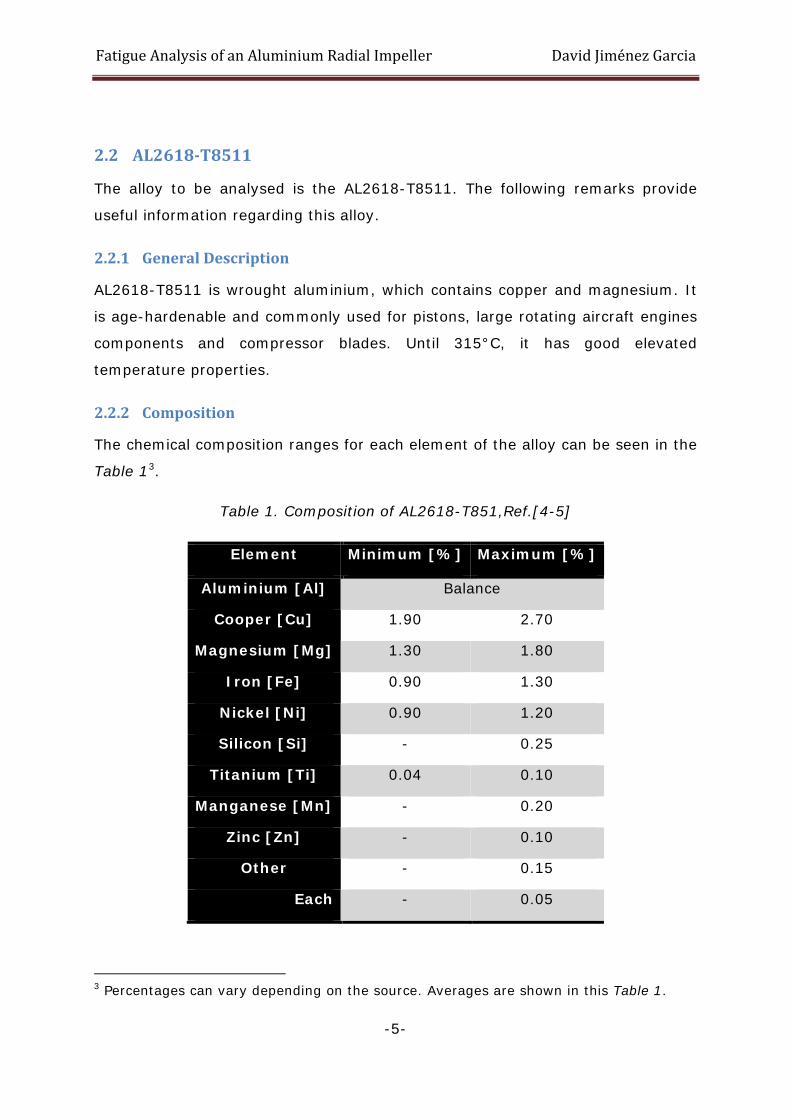
The chemical composition ranges for each element of the alloy can be seen in the
Table 13.
Table 1. Composition of AL2618-T851,Ref.[4-5]
3 Percentages can vary depending on the source. Averages are shown in this Table 1.
Element Minimum [%] Maximum [%]
Aluminium [Al] Balance
Cooper [Cu] 1.90 2.70
Magnesium [Mg] 1.30 1.80
Iron [Fe] 0.90 1.30
Nickel [Ni] 0.90 1.20
Silicon [Si] - 0.25
Titanium [Ti] 0.04 0.10
Manganese [Mn] - 0.20
Zinc [Zn] - 0.10
Other - 0.15
Each - 0.05
Fatigue Analysis of an Aluminium Radial Impeller David Jiménez Garcia
-6-
2.2.3 Thermo-Mechanical Treatments
Certain treatments are performed over the alloy in order to obtain its final
properties, Ref. [3-4].
Essentially, a solution heat treatment is executed at 529°C for a period as long
as 24 hours. In addition, an age hardening heat treatment is performed at 199°C
varying from 5 to 20 hours depending on the section. A stretching to relieve
stress is performed in between both processes.
Apart from that, additional treatments can be applied to get some different as
well as improved properties.
2.2.4 Properties
To understand why this alloy is used for aircraft engines, it is important to
discuss its properties, Ref. [1-5].
Physical, mechanical and thermal properties have a lot of significance when a
fatigue analysis is wanted.
In Table 2 the main properties at room temperature are shown.
Fatigue Analysis of an Aluminium Radial Impeller David Jiménez Garcia
-7-
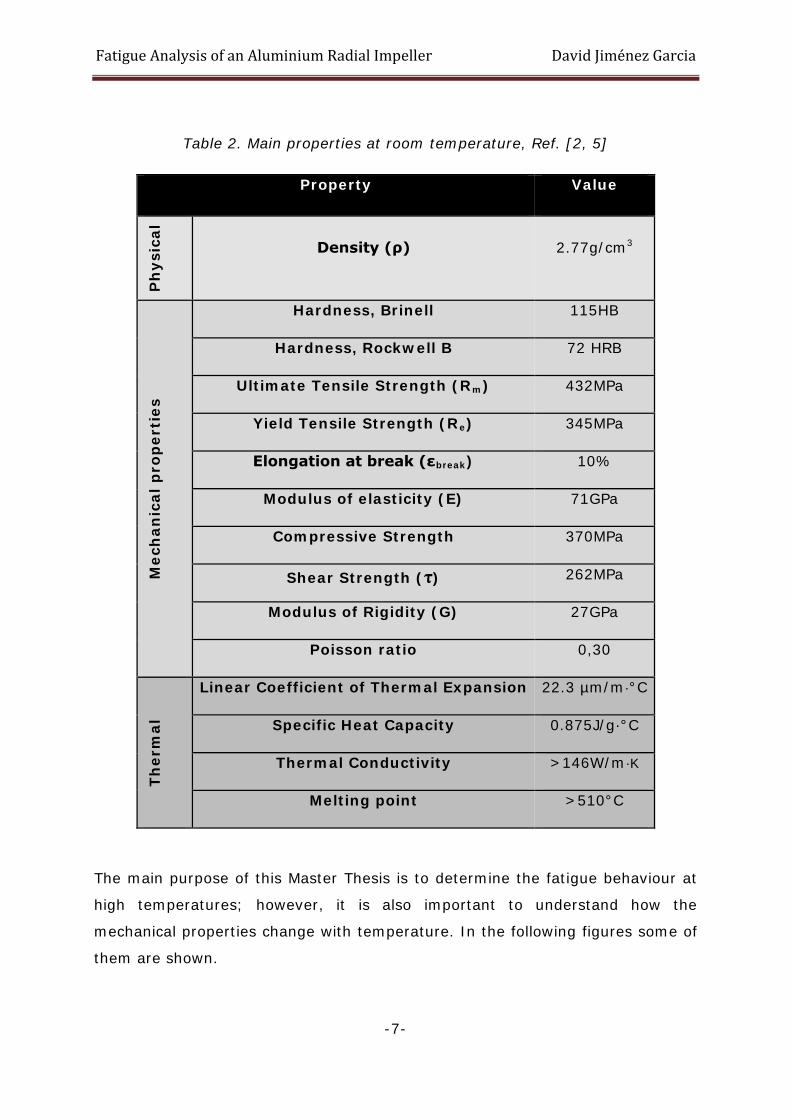
Table 2. Main properties at room temperature, Ref. [2, 5]
Property Value
Ph
ysic
al
Density (ρ) 2.77g/cm3
Mec
han
ical
pro
per
ties
Hardness, Brinell 115HB
Hardness, Rockwell B 72 HRB
Ultimate Tensile Strength (Rm) 432MPa
Yield Tensile Strength (Re) 345MPa
Elongation at break (εbreak) 10%
Modulus of elasticity (E) 71GPa
Compressive Strength 370MPa
Shear Strength (τ) 262MPa
Modulus of Rigidity (G) 27GPa
Poisson ratio 0,30
Ther
mal
Linear Coefficient of Thermal Expansion 22.3 µm/m·°C
Specific Heat Capacity 0.875J/g·°C
Thermal Conductivity >146W/m·K
Melting point >510°C
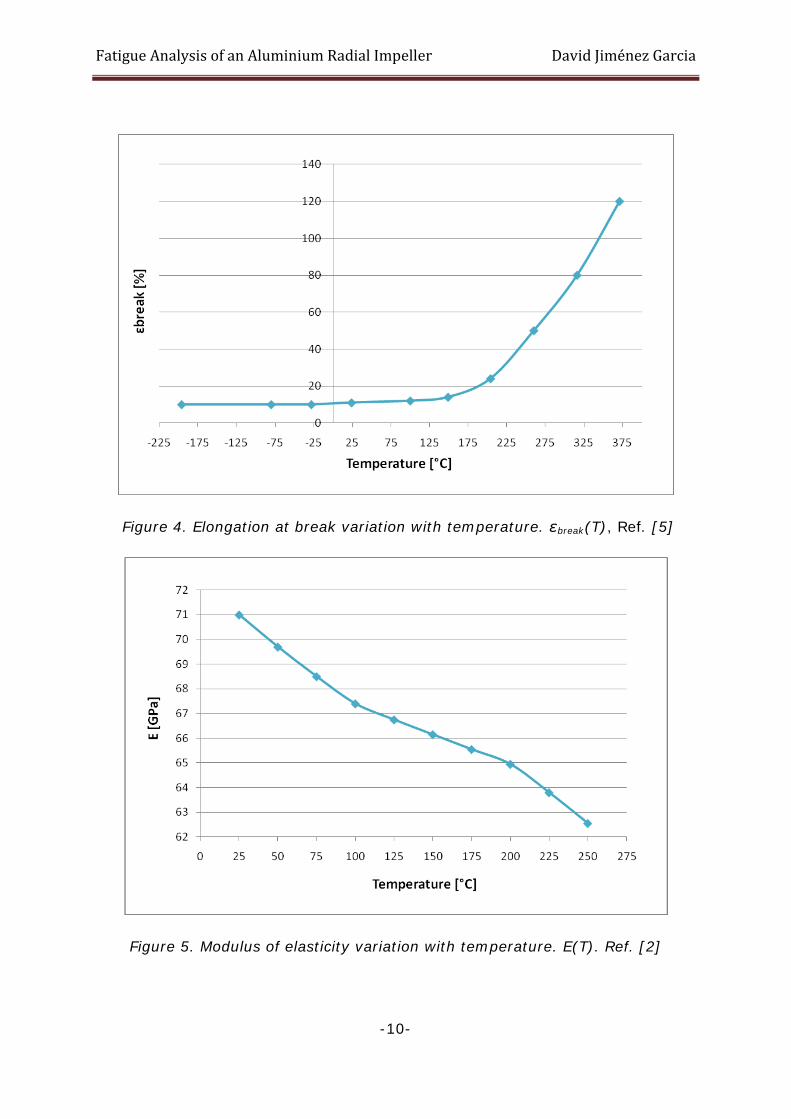
The main purpose of this Master Thesis is to determine the fatigue behaviour at
high temperatures; however, it is also important to understand how the
mechanical properties change with temperature. In the following figures some of
them are shown.
Fatigue Analysis of an Aluminium Radial Impeller David Jiménez Garcia
-8-
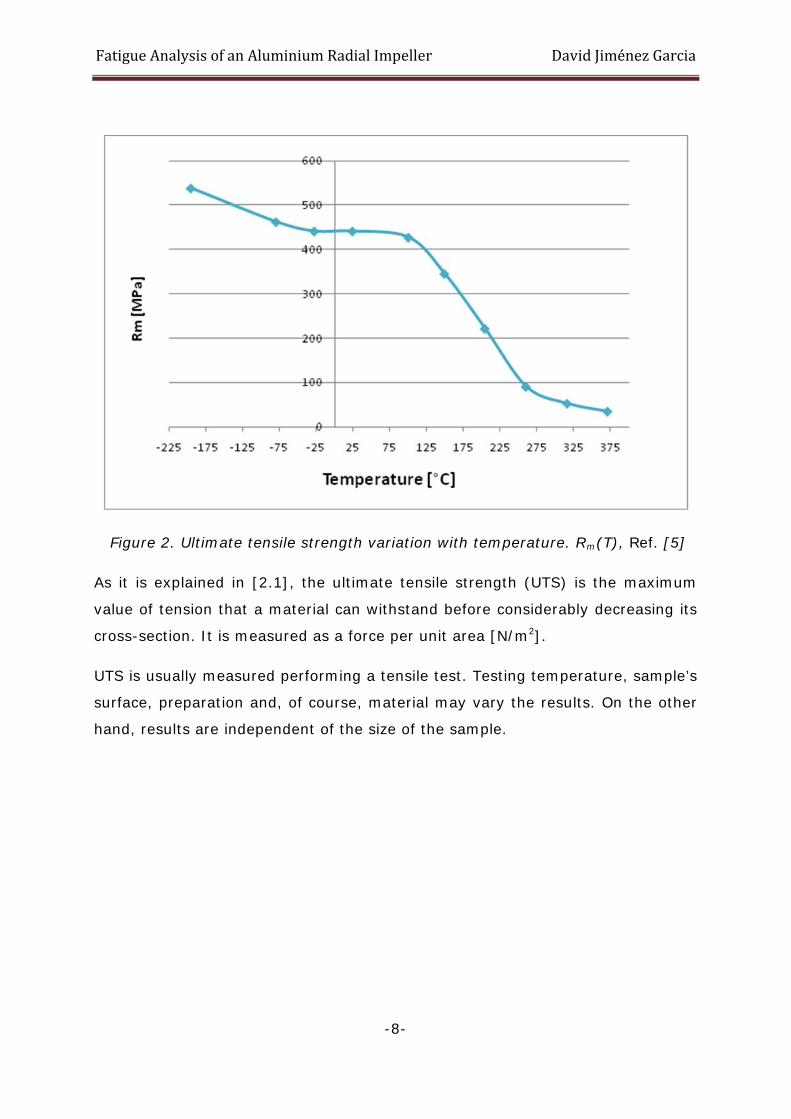
Figure 2. Ultimate tensile strength variation with temperature. Rm(T), Ref. [5]
As it is explained in [2.1], the ultimate tensile strength (UTS) is the maximum
value of tension that a material can withstand before considerably decreasing its
cross-section. It is measured as a force per unit area [N/m2].
UTS is usually measured performing a tensile test. Testing temperature, sample’s
surface, preparation and, of course, material may vary the results. On the other
hand, results are independent of the size of the sample.
Fatigue Analysis of an Aluminium Radial Impeller David Jiménez Garcia
-9-
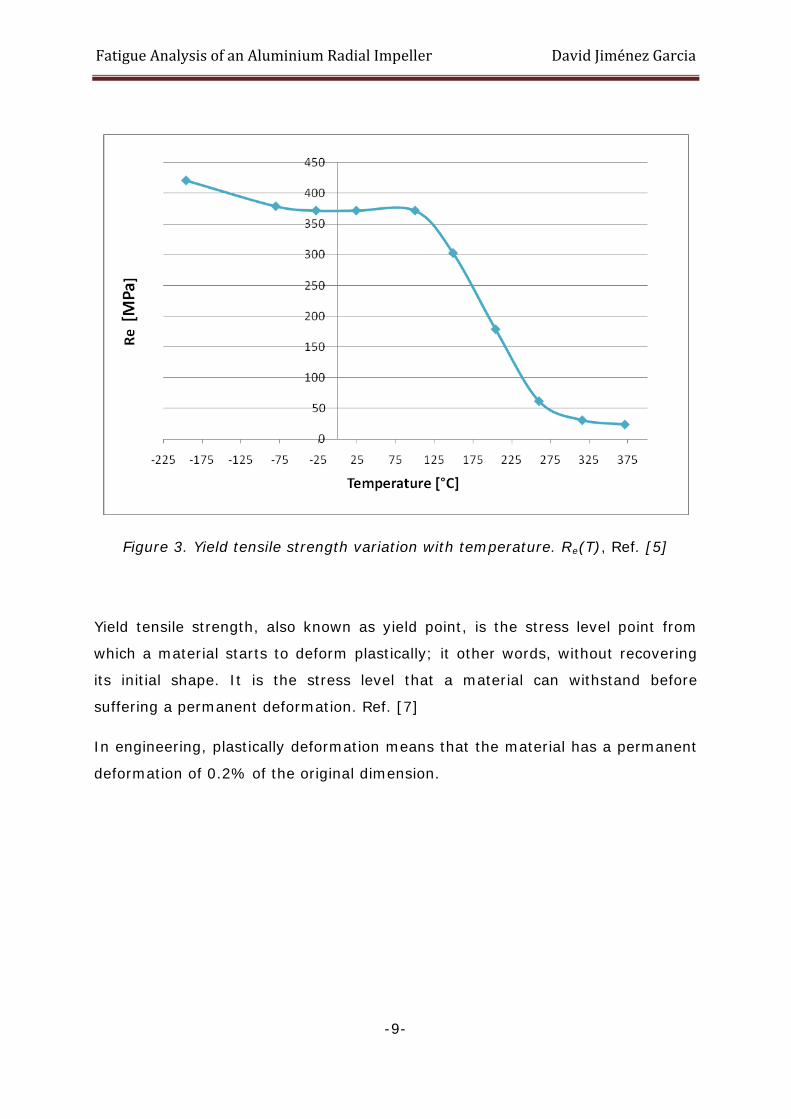
Figure 3. Yield tensile strength variation with temperature. Re(T), Ref. [5]
Yield tensile strength, also known as yield point, is the stress level point from
which a material starts to deform plastically; it other words, without recovering
its initial shape. It is the stress level that a material can withstand before
suffering a permanent deformation. Ref. [7]
In engineering, plastically deformation means that the material has a permanent
deformation of 0.2% of the original dimension.
Fatigue Analysis of an Aluminium Radial Impeller David Jiménez Garcia
-10-
Figure 4. Elongation at break variation with temperature. εbreak(T), Ref. [5]
Figure 5. Modulus of elasticity variation with temperature. E(T). Ref. [2]
Fatigue Analysis of an Aluminium Radial Impeller David Jiménez Garcia
-11-
2.3 Turbocharger
As authors said in [14] and [15], the purpose of a turbocharger is to recover part
of the waste energy from an engine’s exhaust gases and use it to compress air
and push it into the engine.
Once the air pushed into an engine is compressed, more air can be squeezed.
More air inside the cylinders means more fuel allowed inside. Once the engine
burns the air-fuel mixture, power is generated. The more mixture used, the more
powerful engine. In addition, the efficiency of the combustion is improved.
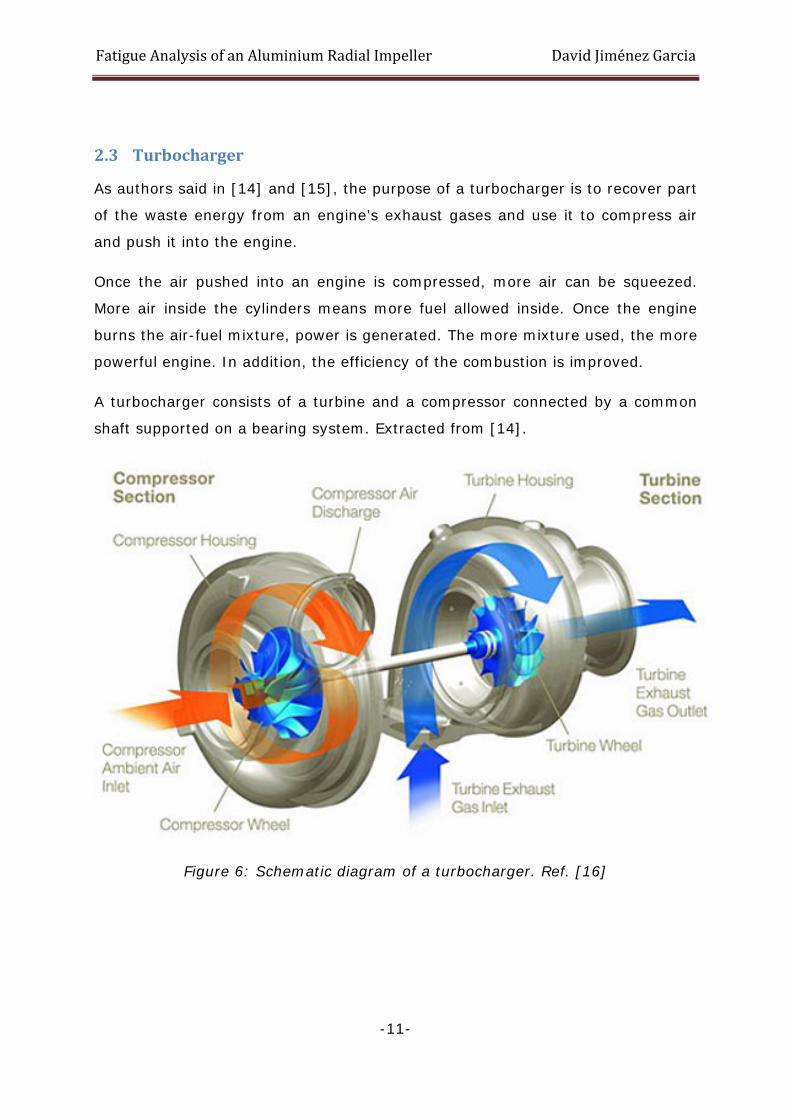
A turbocharger consists of a turbine and a compressor connected by a common
shaft supported on a bearing system. Extracted from [14].
Figure 6: Schematic diagram of a turbocharger. Ref. [16]
Fatigue Analysis of an Aluminium Radial Impeller David Jiménez Garcia
-12-
The turbine recovers the waste energy. The exhaust gases are collected in the
turbine housing and guided into the turbine wheel. The gases make the turbine
wheel spin by pushing its blades in an adiabatic expansion. The speed of the
gases is decreased and they leave the turbine housing via the exhaust outlet
area.
As the turbine wheel spins, so does the impeller. Air is guided through the
compressor housing to the impeller, which converts the low-pressure airstream
into a high-pressure airstream. Compressing air means making its temperature
rise. In fact, air leaves the compressor housing at temperatures up to 200ºC4.
The bearing system is lubricated by oil from the engine, which also acts as a
coolant. This is another important function due to the high temperatures reached
in the turbine and impeller.
To conclude, turbochargers give some benefits such as increased engine power
output and improved fuel consumption. However, turbochargers also improve the
engine’s emissions due to the fact that they use exhaust gas to compress air in
order to augment the mixture without having to burn extra fuel.
4 As a reminder, material testing of an alloy for an impeller is done at this temperature in
this thesis.
Fatigue Analysis of an Aluminium Radial Impeller David Jiménez Garcia
-13-
3 Experimental Work Although fatigue data is the most important part for the goal of this Master
Thesis, other testing has been performed.
The following paragraphs explain how fatigue, tensile test, hardness and
microstructure data have been obtained.
3.1 Fatigue Testing
In this Master Thesis two different types of fatigue have been studied. For both
high cycle fatigue (HCF) and low cycle fatigue (LCF) the same samples and
experimental facilities were used.
The only facility difference when testing HCF or LCF is the controlled variable:
load and strain, respectively. This difference makes it necessary to additionally
use an extensometer for the strain-controlled LCF.
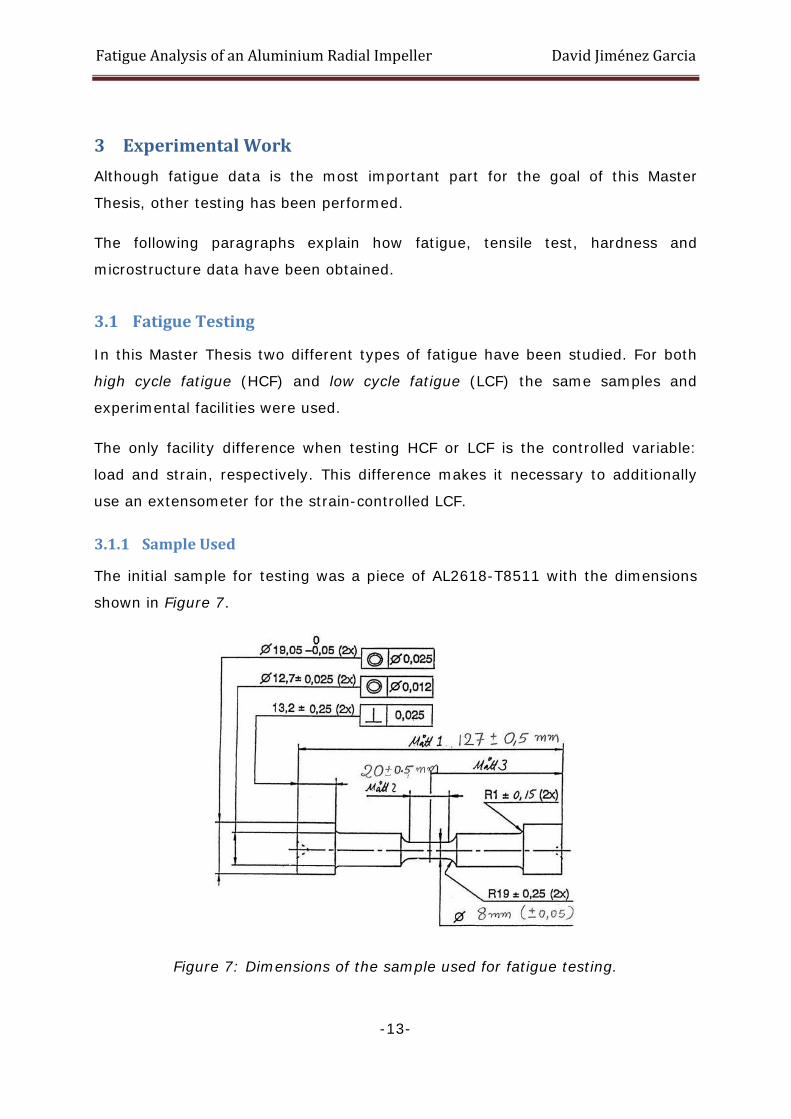
3.1.1 Sample Used
The initial sample for testing was a piece of AL2618-T8511 with the dimensions
shown in Figure 7.
Figure 7: Dimensions of the sample used for fatigue testing.
Fatigue Analysis of an Aluminium Radial Impeller David Jiménez Garcia
-14-
However, when running the experiments [13], it was observed that the said
dimensions caused some problems: samples did not break in the thin section,
but in the down base.
After several trials, it was decided to shorten the bases and decrease the
medium diameter around 1 mm. This decision resulted in having different
dimensions on each experiment, but all of them had a diameter between 6.42
and 7.02mm5.
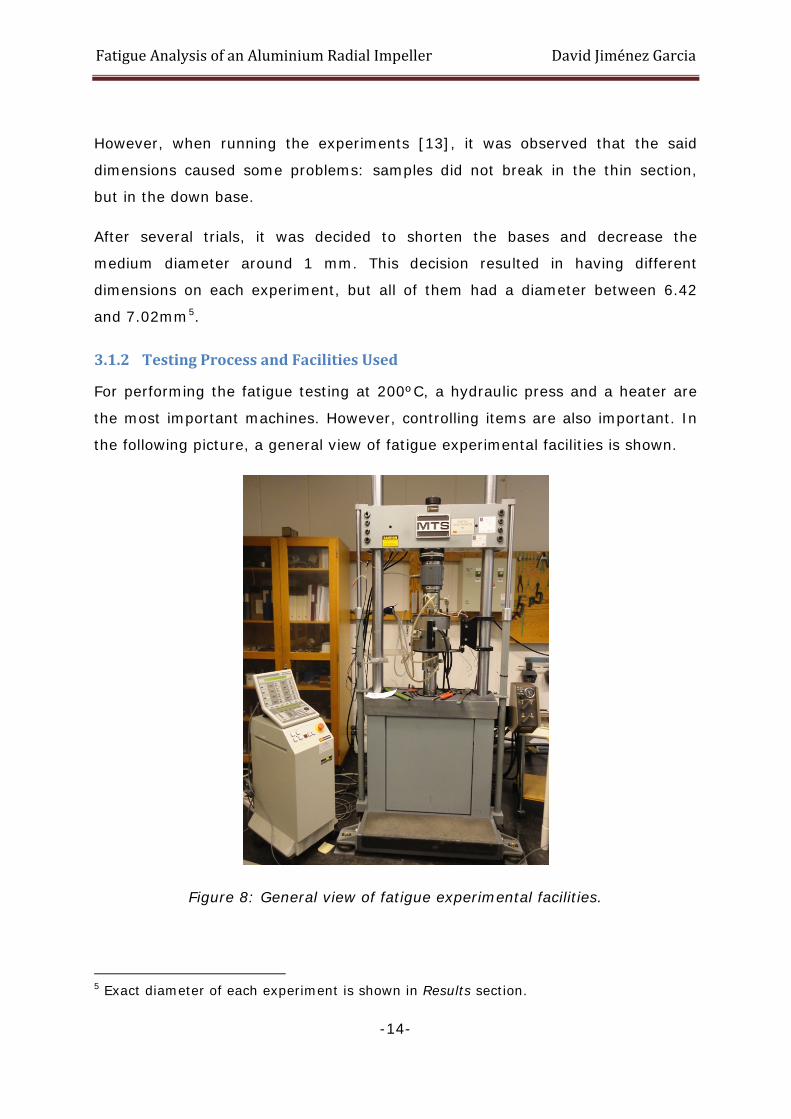
3.1.2 Testing Process and Facilities Used
For performing the fatigue testing at 200ºC, a hydraulic press and a heater are
the most important machines. However, controlling items are also important. In
the following picture, a general view of fatigue experimental facilities is shown.
Figure 8: General view of fatigue experimental facilities.
5 Exact diameter of each experiment is shown in Results section.
Fatigue Analysis of an Aluminium Radial Impeller David Jiménez Garcia
-15-
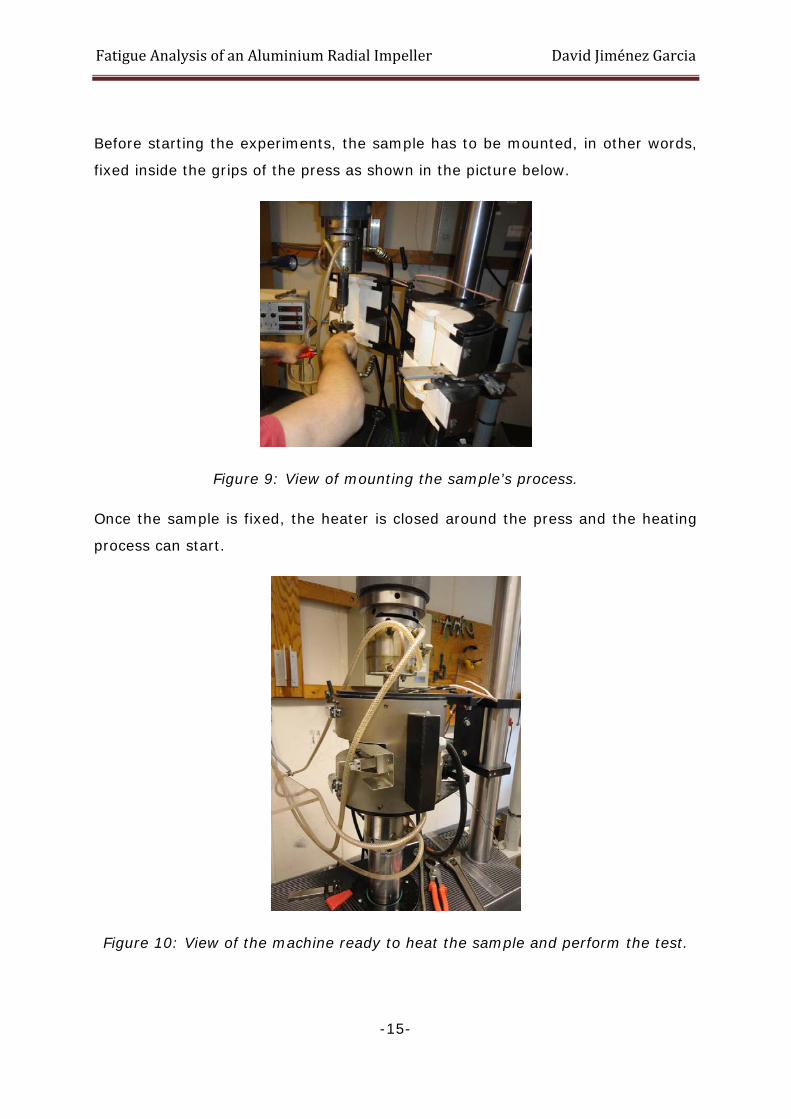
Before starting the experiments, the sample has to be mounted, in other words,
fixed inside the grips of the press as shown in the picture below.
Figure 9: View of mounting the sample’s process.
Once the sample is fixed, the heater is closed around the press and the heating
process can start.
Figure 10: View of the machine ready to heat the sample and perform the test.
Fatigue Analysis of an Aluminium Radial Impeller David Jiménez Garcia
-16-
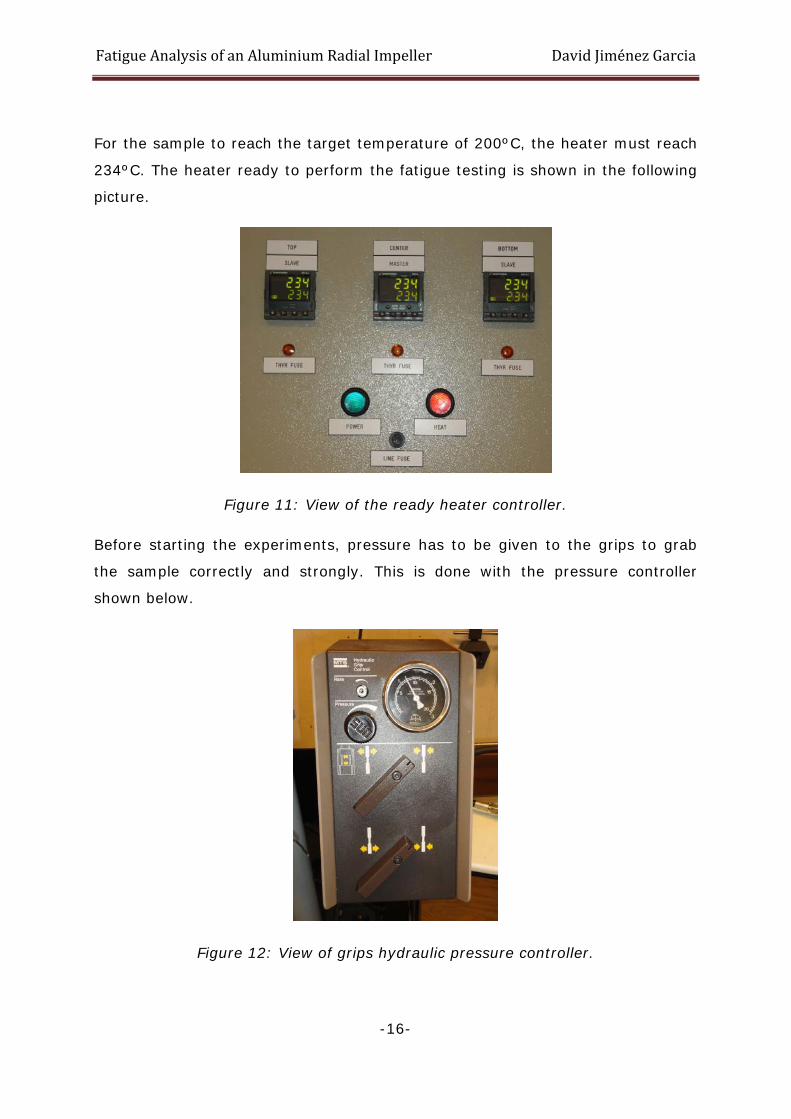
For the sample to reach the target temperature of 200ºC, the heater must reach
234ºC. The heater ready to perform the fatigue testing is shown in the following
picture.
Figure 11: View of the ready heater controller.
Before starting the experiments, pressure has to be given to the grips to grab
the sample correctly and strongly. This is done with the pressure controller
shown below.
Figure 12: View of grips hydraulic pressure controller.

Fatigue Analysis of an Aluminium Radial Impeller David Jiménez Garcia
-17-
For both the HCF and LCF testing, the process up to this point is done. The
difference lies on how to start the experiment.
HCF testing is controlled with the hydraulic press controller shown in the
following picture. It is only necessary to introduce the desired load cyclic
waveform, run the experiment and read the total number of cycles when it is
finished.
Figure 13: Left: Hydraulic press controller. Right: Detail of the controlling panel.
LCF testing is controlled with the help of an extensometer, which is attached to
the sample and connected to the hydraulic press controller. In addition, a
computer is also connected to the controller and the desired strain waveform is
introduced through it. When the experiment is over, load waveform data used to
calculate the stress level, is taken from the stored data in the computer.
Fatigue Analysis of an Aluminium Radial Impeller David Jiménez Garcia
-18-
3.2 Tensile Test
With the aim of confirming that the AL2618-T8511 was the suspected alloy, 3
tensile tests6 were carried out: two tensile tests at room temperature and one
test at 200ºC. In addition, they provided useful data for starting the fatigue
experiments.
Tensile tests were done with the same facilities as the fatigue testing; in fact,
using the same than with LCF (the extensometer was obviously needed). The
only difference between tensile tests and fatigue experiments is that the load is
not cyclic. In that case, samples are pulled until it breaks.
6 Tensile test graphs can be found in Results section.
Fatigue Analysis of an Aluminium Radial Impeller David Jiménez Garcia
-19-
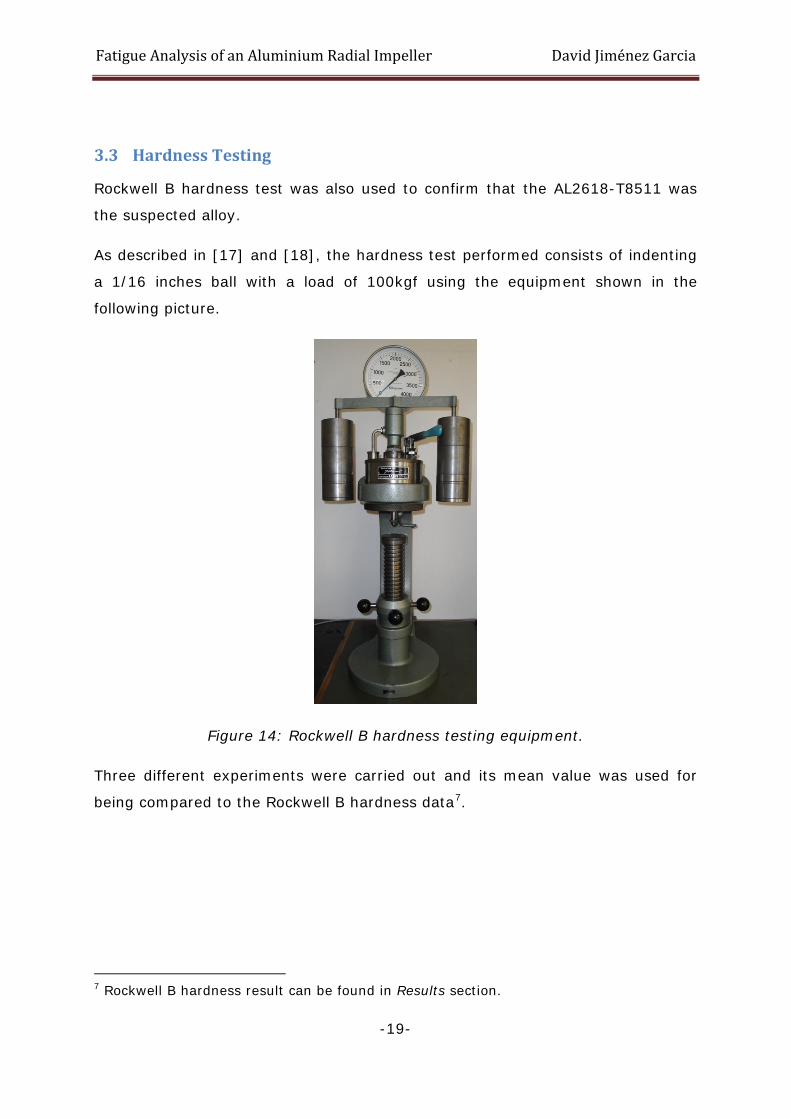
3.3 Hardness Testing
Rockwell B hardness test was also used to confirm that the AL2618-T8511 was
the suspected alloy.
As described in [17] and [18], the hardness test performed consists of indenting
a 1/16 inches ball with a load of 100kgf using the equipment shown in the
following picture.
Figure 14: Rockwell B hardness testing equipment.
Three different experiments were carried out and its mean value was used for
being compared to the Rockwell B hardness data7.
7 Rockwell B hardness result can be found in Results section.
Fatigue Analysis of an Aluminium Radial Impeller David Jiménez Garcia
-20-
3.4 Microscope
When analysing the microstructure8, it is important to obtain a high quality
surface in order to investigate it with precision.
The surface of the bare sample does not show enough quality to look at its
microstructure. That makes it compulsory to prepare the sample before using the
microscope.
3.4.1 Bare Sample’s Preparation
The goal of preparing the bare sample is to have a well-polished surface that
facilitates the picture taking process of the microstructure.
First of all, rugosity has to be decreased. To do that, two different grinding
processes are performed with two different grinding discs. The first one leaves
the sample ground at a rugosity of 4000 µm and the second one at a rugosity of
1000 µm.
After being ground, the sample needs to be as good polished as possible. For this
process, a 3 µm diamond particles’ suspension disc is used.
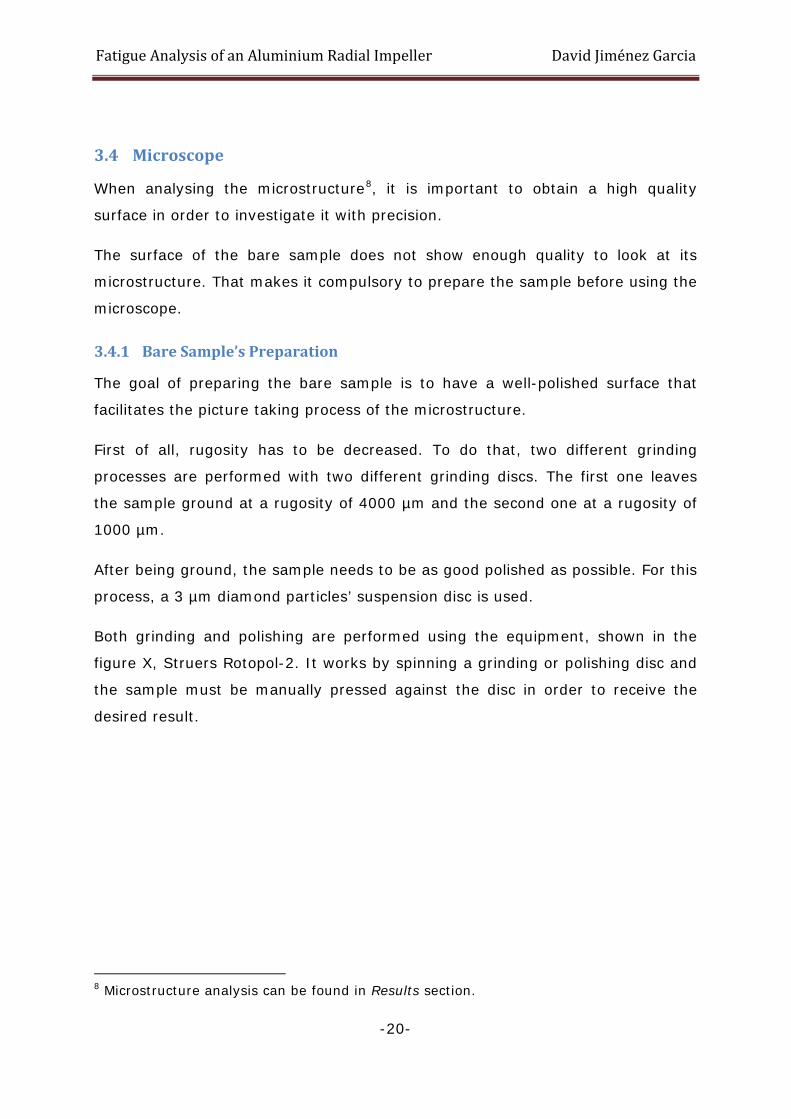
Both grinding and polishing are performed using the equipment, shown in the
figure X, Struers Rotopol-2. It works by spinning a grinding or polishing disc and
the sample must be manually pressed against the disc in order to receive the
desired result.
8 Microstructure analysis can be found in Results section.
Fatigue Analysis of an Aluminium Radial Impeller David Jiménez Garcia
-21-
Figure 15: Struers Rotopol-2.
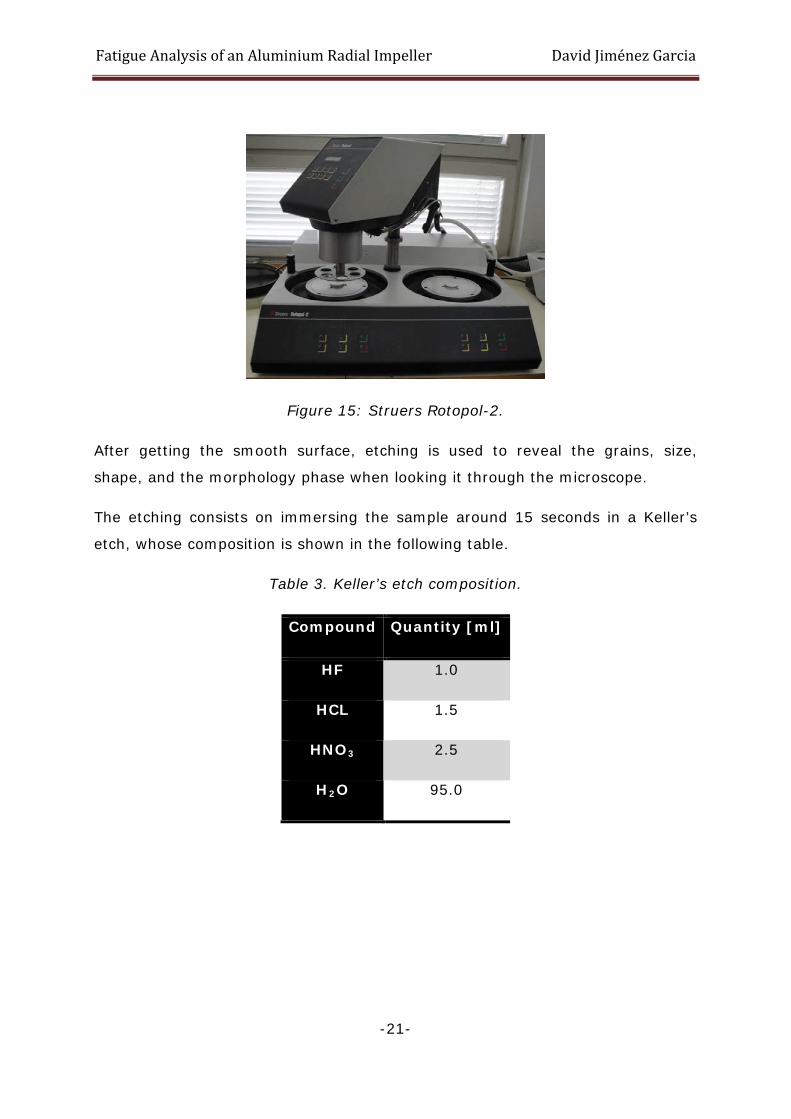
After getting the smooth surface, etching is used to reveal the grains, size,
shape, and the morphology phase when looking it through the microscope.
The etching consists on immersing the sample around 15 seconds in a Keller’s
etch, whose composition is shown in the following table.
Table 3. Keller’s etch composition.
Compound Quantity [ml]
HF 1.0
HCL 1.5
HNO3 2.5
H2O 95.0
Fatigue Analysis of an Aluminium Radial Impeller David Jiménez Garcia
-22-
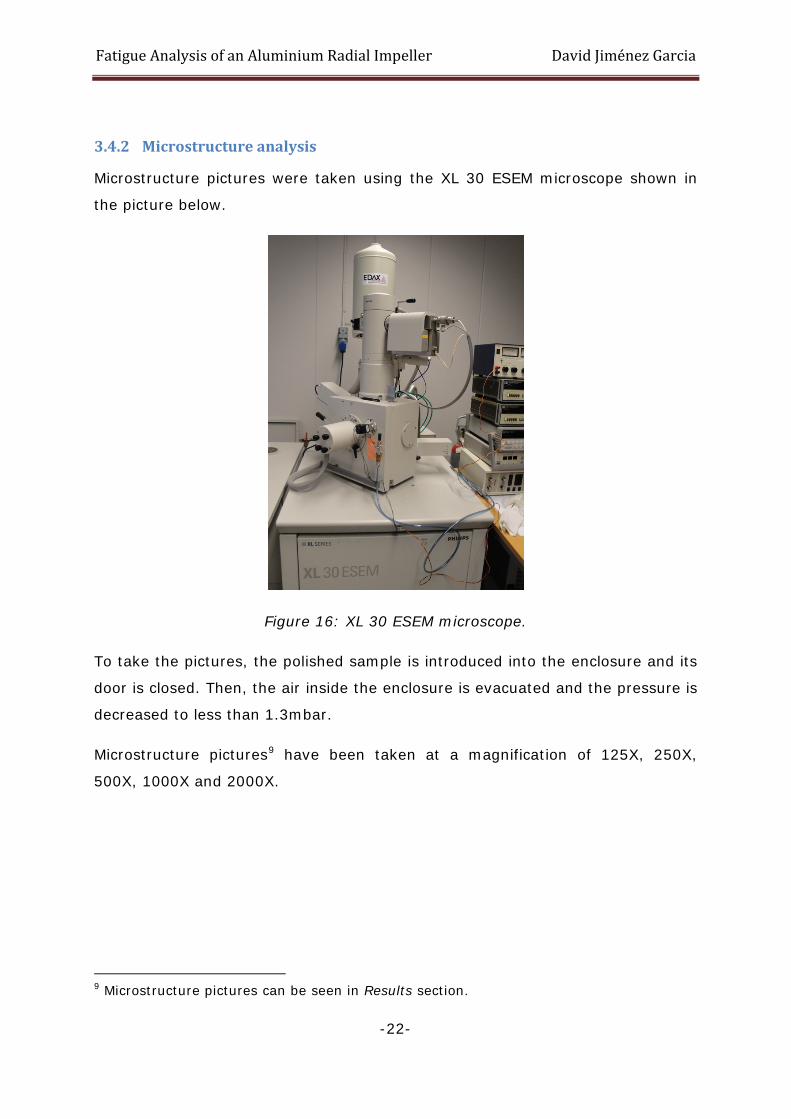
3.4.2 Microstructure analysis
Microstructure pictures were taken using the XL 30 ESEM microscope shown in
the picture below.
Figure 16: XL 30 ESEM microscope.
To take the pictures, the polished sample is introduced into the enclosure and its
door is closed. Then, the air inside the enclosure is evacuated and the pressure is
decreased to less than 1.3mbar.
Microstructure pictures9 have been taken at a magnification of 125X, 250X,
500X, 1000X and 2000X.
9 Microstructure pictures can be seen in Results section.
Fatigue Analysis of an Aluminium Radial Impeller David Jiménez Garcia
-23-
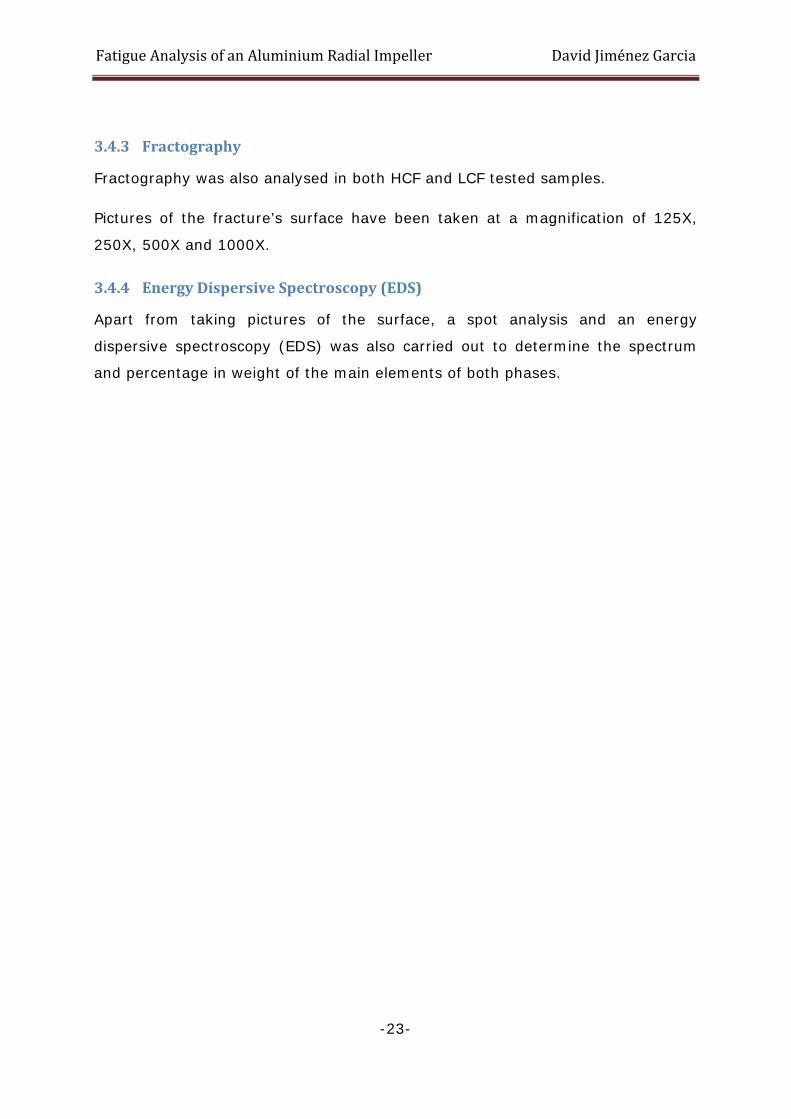
3.4.3 Fractography
Fractography was also analysed in both HCF and LCF tested samples.
Pictures of the fracture’s surface have been taken at a magnification of 125X,
250X, 500X and 1000X.
3.4.4 Energy Dispersive Spectroscopy (EDS)
Apart from taking pictures of the surface, a spot analysis and an energy
dispersive spectroscopy (EDS) was also carried out to determine the spectrum
and percentage in weight of the main elements of both phases.
Fatigue Analysis of an Aluminium Radial Impeller David Jiménez Garcia
-24-
4 Results In this section, all the results obtained while performing this Master Thesis are
presented.
4.1 Fatigue Testing
For better understanding of how and why each result been used, it is necessary
to split this section into three subsections: data from the HCF, data from the LCF
tests and data obtained for the fatigue simulations.
Due to trade secret, scales are removed from the graphs in this section.
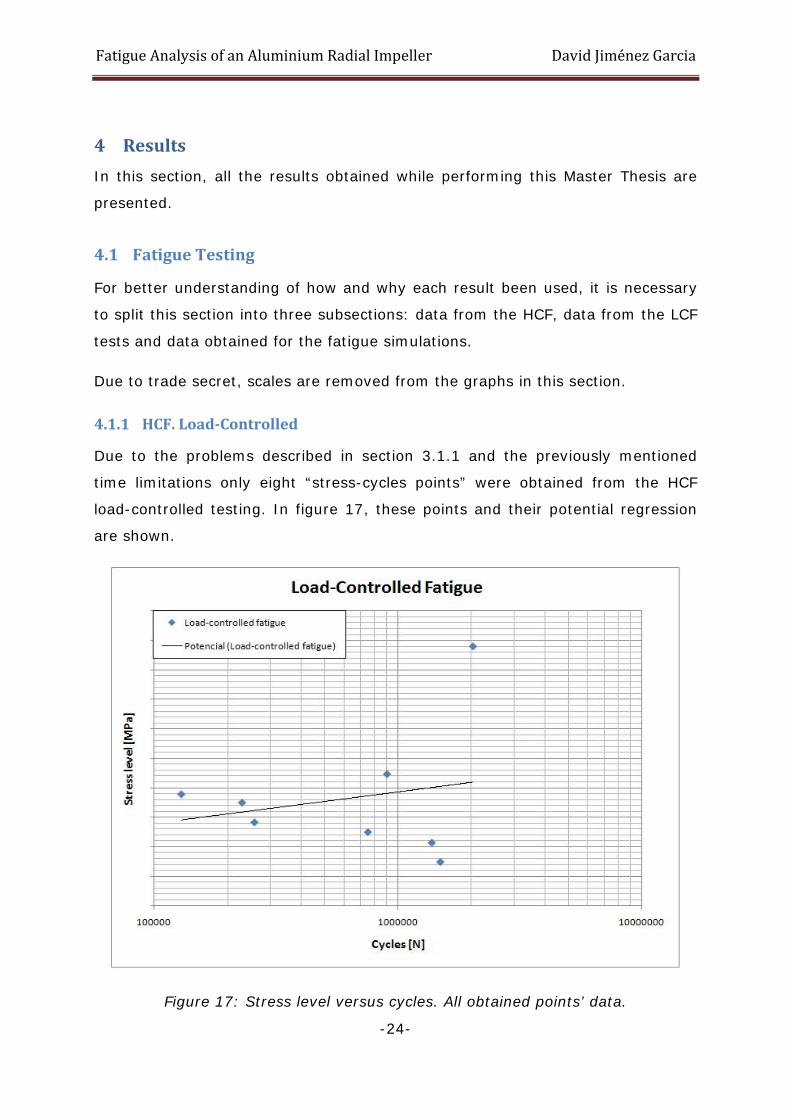
4.1.1 HCF. Load-Controlled
Due to the problems described in section 3.1.1 and the previously mentioned
time limitations only eight “stress-cycles points” were obtained from the HCF
load-controlled testing. In figure 17, these points and their potential regression
are shown.
Figure 17: Stress level versus cycles. All obtained points’ data.
Fatigue Analysis of an Aluminium Radial Impeller David Jiménez Garcia
-25-
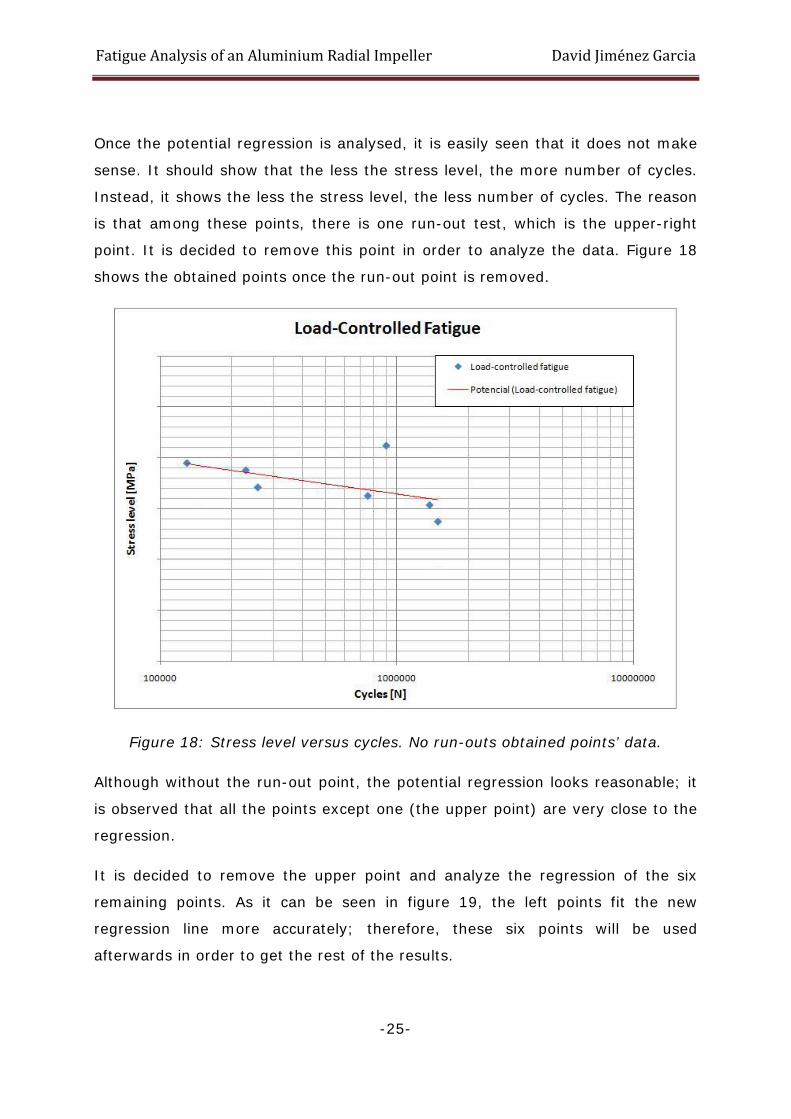
Once the potential regression is analysed, it is easily seen that it does not make
sense. It should show that the less the stress level, the more number of cycles.
Instead, it shows the less the stress level, the less number of cycles. The reason
is that among these points, there is one run-out test, which is the upper-right
point. It is decided to remove this point in order to analyze the data. Figure 18
shows the obtained points once the run-out point is removed.
Figure 18: Stress level versus cycles. No run-outs obtained points’ data.
Although without the run-out point, the potential regression looks reasonable; it
is observed that all the points except one (the upper point) are very close to the
regression.
It is decided to remove the upper point and analyze the regression of the six
remaining points. As it can be seen in figure 19, the left points fit the new
regression line more accurately; therefore, these six points will be used
afterwards in order to get the rest of the results.
Fatigue Analysis of an Aluminium Radial Impeller David Jiménez Garcia
-26-
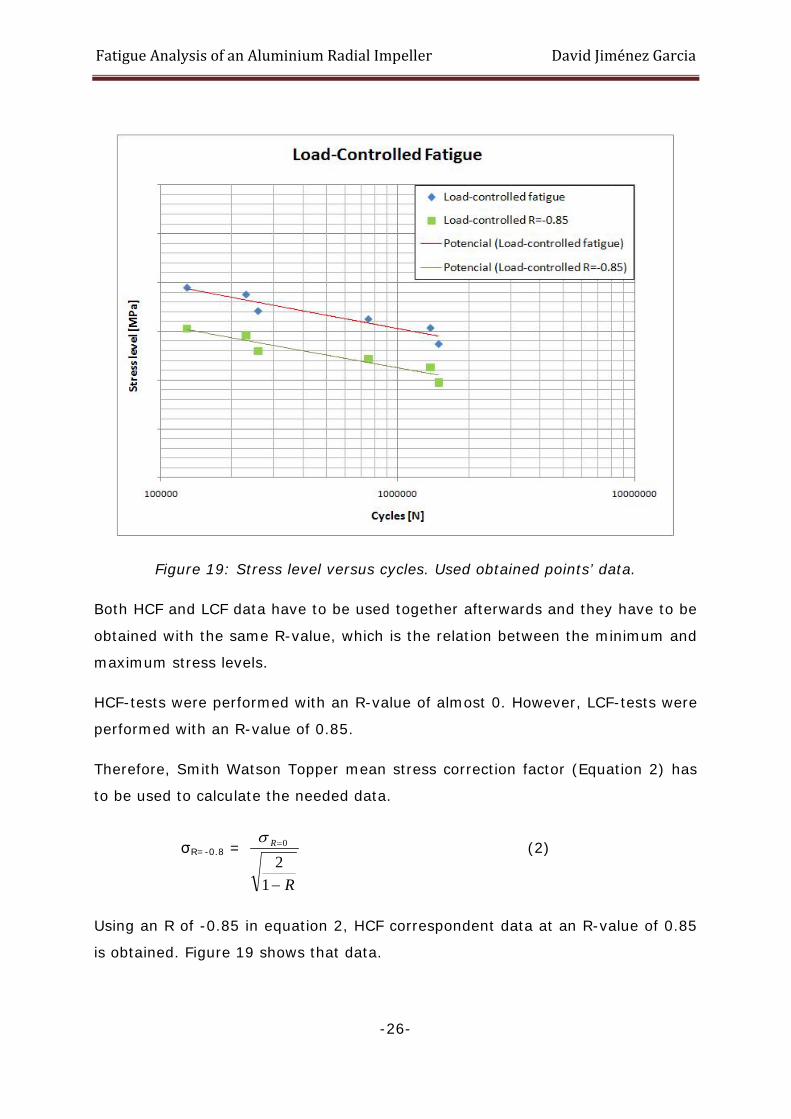
Figure 19: Stress level versus cycles. Used obtained points’ data.
Both HCF and LCF data have to be used together afterwards and they have to be
obtained with the same R-value, which is the relation between the minimum and
maximum stress levels.
HCF-tests were performed with an R-value of almost 0. However, LCF-tests were
performed with an R-value of 0.85.
Therefore, Smith Watson Topper mean stress correction factor (Equation 2) has
to be used to calculate the needed data.
σR=-0.8 =
R
R
−
=
12
0σ (2)
Using an R of -0.85 in equation 2, HCF correspondent data at an R-value of 0.85
is obtained. Figure 19 shows that data.
Fatigue Analysis of an Aluminium Radial Impeller David Jiménez Garcia
-27-
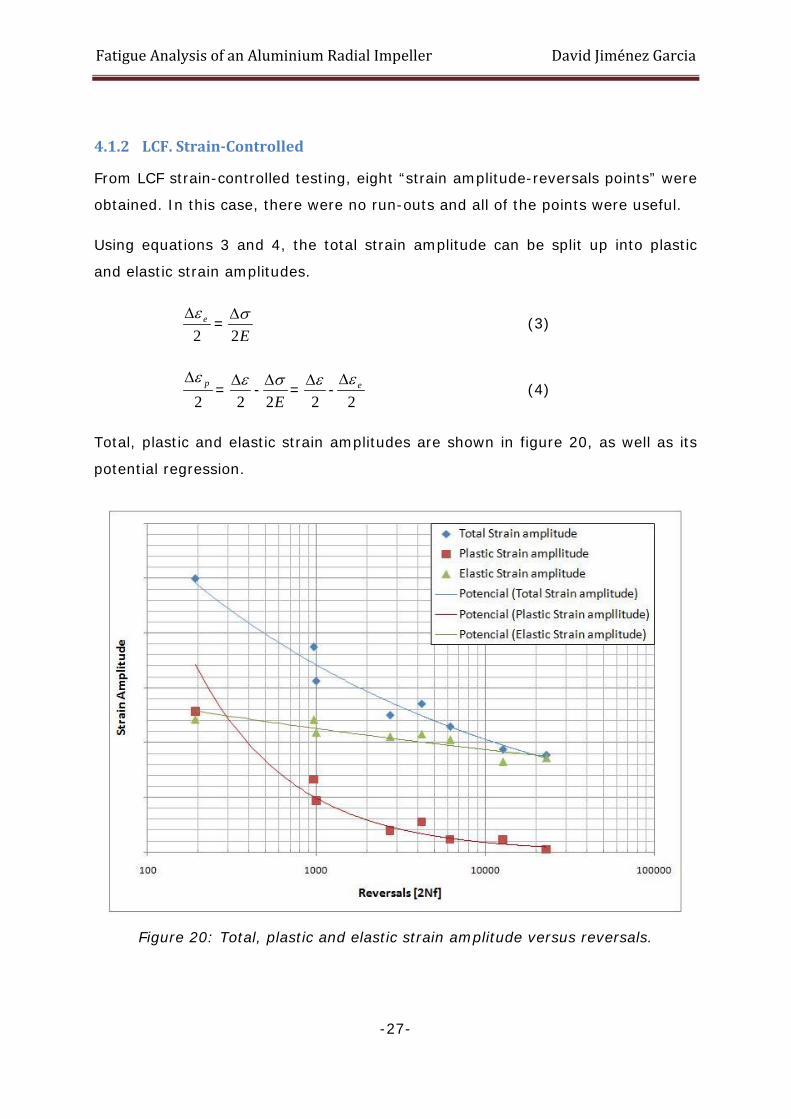
4.1.2 LCF. Strain-Controlled
From LCF strain-controlled testing, eight “strain amplitude-reversals points” were
obtained. In this case, there were no run-outs and all of the points were useful.
Using equations 3 and 4, the total strain amplitude can be split up into plastic
and elastic strain amplitudes.
2ee∆ =
E2σ∆
(3)
2pe∆ =
2e∆
-E2σ∆
=2e∆
-2
ee∆ (4)
Total, plastic and elastic strain amplitudes are shown in figure 20, as well as its
potential regression.
Figure 20: Total, plastic and elastic strain amplitude versus reversals.
Fatigue Analysis of an Aluminium Radial Impeller David Jiménez Garcia
-28-
4.1.3 Data for Fatigue Simulations
To run the fatigue simulations with CUMFAT5810, it is necessary to introduce
strain-life and cyclic stress-strain points. To get more of these points, more data
is needed. This section deals with the data needed for fatigue simulations.
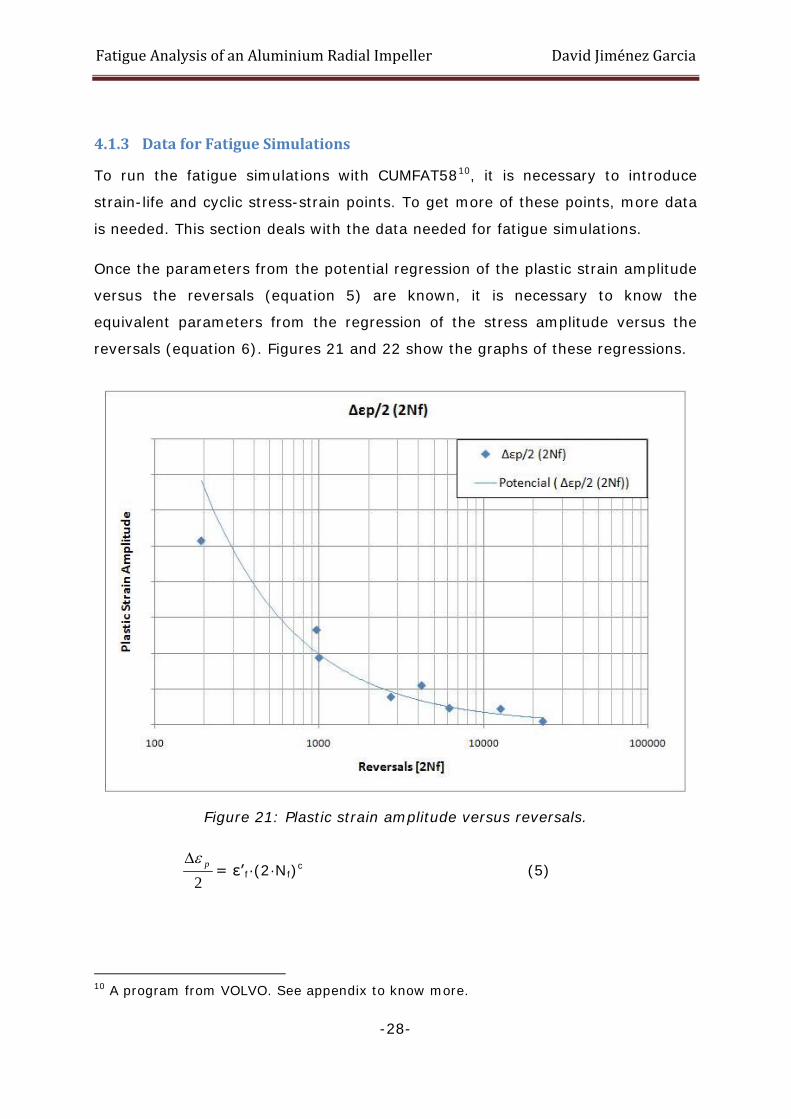
Once the parameters from the potential regression of the plastic strain amplitude
versus the reversals (equation 5) are known, it is necessary to know the
equivalent parameters from the regression of the stress amplitude versus the
reversals (equation 6). Figures 21 and 22 show the graphs of these regressions.
Figure 21: Plastic strain amplitude versus reversals.
2pe∆ = ε’f·(2·Nf)c (5)
10 A program from VOLVO. See appendix to know more.

Fatigue Analysis of an Aluminium Radial Impeller David Jiménez Garcia
-29-
Figure 22: Stress amplitude versus reversals.
2σ∆
= σ’f·(2·Nf)b (6)
Knowing the parameters of both potential regressions, it is possible to calculate
the total strain versus the reversals using the equation 7.
2e∆
= E
f'σ· (2Nf)b + ε’ f·(2Nf)c (7)
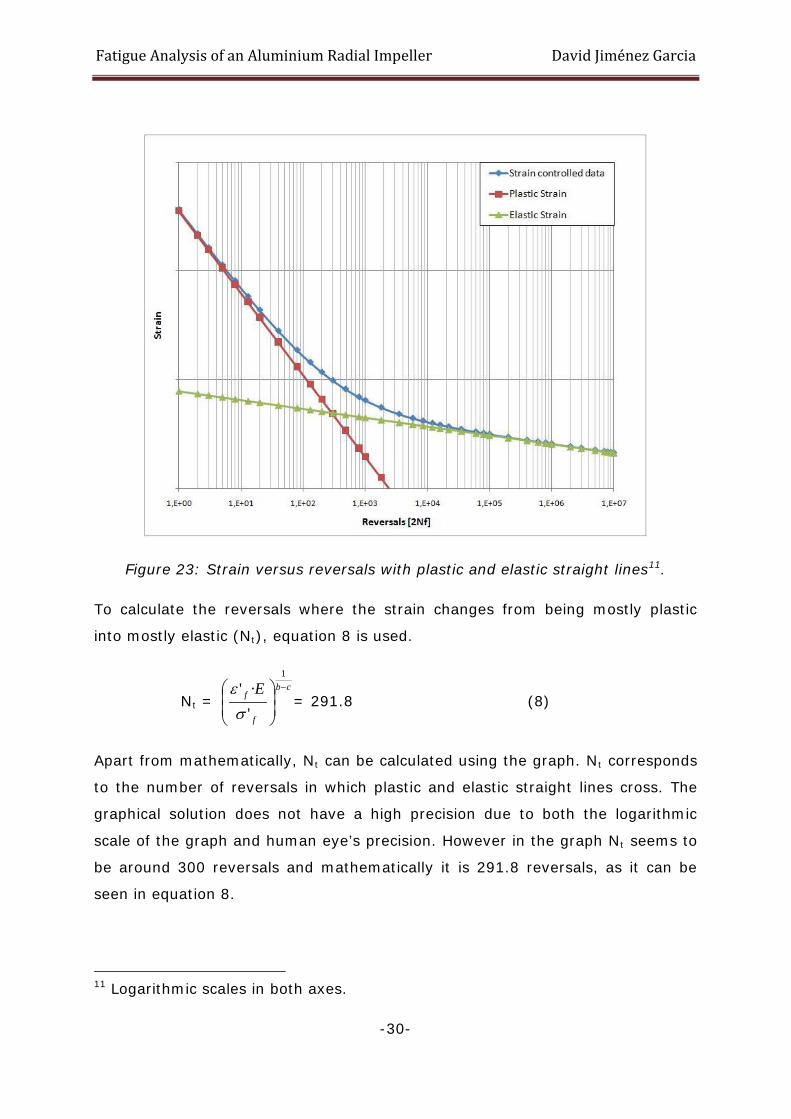
Figure 23 shows the graph of the total strain versus reversals, as well as the
plastic and elastic straight lines whose sum results in the total strain plot.
Fatigue Analysis of an Aluminium Radial Impeller David Jiménez Garcia
-30-
Figure 23: Strain versus reversals with plastic and elastic straight lines11.
To calculate the reversals where the strain changes from being mostly plastic
into mostly elastic (Nt), equation 8 is used.
Nt = cb
f
f E −
1
'·'
σe
= 291.8 (8)
Apart from mathematically, Nt can be calculated using the graph. Nt corresponds
to the number of reversals in which plastic and elastic straight lines cross. The
graphical solution does not have a high precision due to both the logarithmic
scale of the graph and human eye’s precision. However in the graph Nt seems to
be around 300 reversals and mathematically it is 291.8 reversals, as it can be
seen in equation 8.
11 Logarithmic scales in both axes.
Fatigue Analysis of an Aluminium Radial Impeller David Jiménez Garcia
-31-
With the parameters from the potential regressions of the plastic strain
amplitude versus the reversals and the stress amplitude versus the reversals, it
is also possible to calculate the cyclic stress-strain points.
First of all cyclic strain hardening exponent (n’) and cyclic strength coefficient
(K’) have to be calculated using equations 9 and 10.
n’ = cb
(9)
K’ = ( ) ''
'n
f
f
e
σ (10)
Then, using equation 11, cyclic stress-strain is calculated.
εt = Eσ +
'1
'n
K
σ (11)
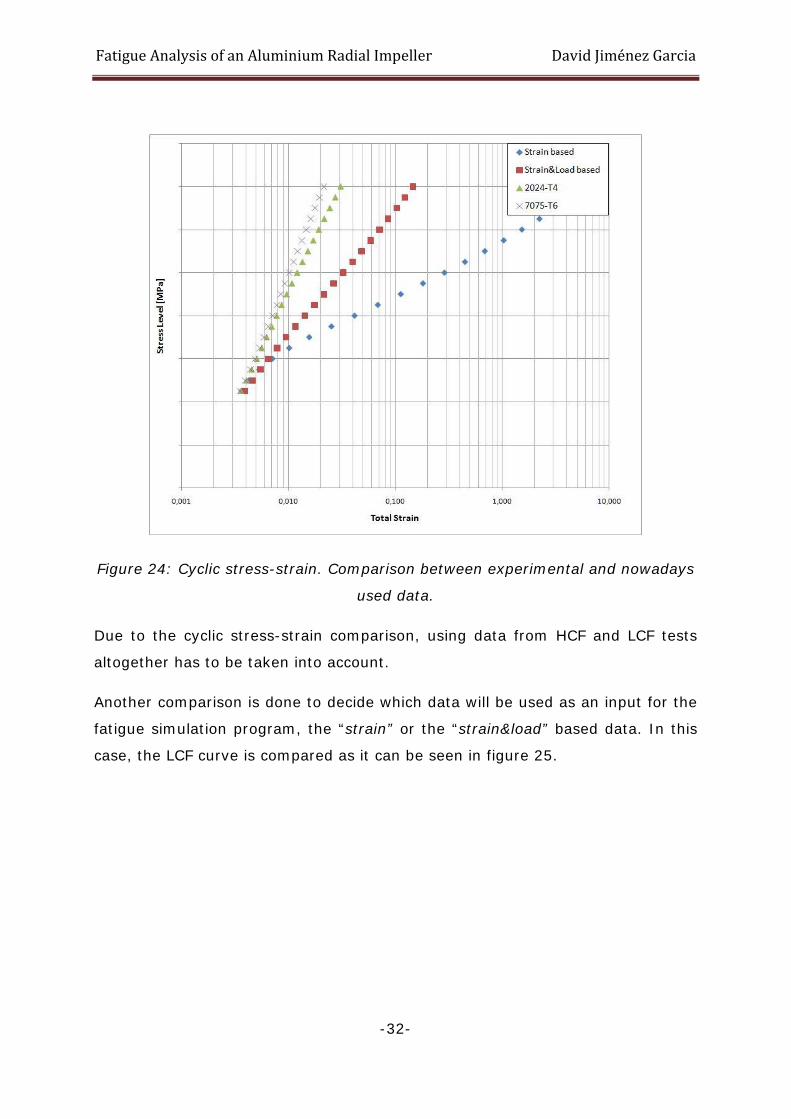
Cyclic stress-strain has been calculated using the regressions from the LCF data
(called “Strain based” in figure 24), as well as, the regression using LCF stress
data and HCF stress data altogether (called “Strain&Load based” in figure 24).
Then, both plots are compared to the data from other alloys that VOLVO is using
nowadays (2024-T4 and 7075-T6).
Figure 24 shows the four plots in the same graph. It can be noticed that the
“Strain&Load based” plot is between the nowadays used data and the “Strain
based” plot, with a shape more similar to the nowadays used data than to the
“Strain based” data.
Fatigue Analysis of an Aluminium Radial Impeller David Jiménez Garcia
-32-
Figure 24: Cyclic stress-strain. Comparison between experimental and nowadays
used data.
Due to the cyclic stress-strain comparison, using data from HCF and LCF tests
altogether has to be taken into account.
Another comparison is done to decide which data will be used as an input for the
fatigue simulation program, the “strain” or the “strain&load” based data. In this
case, the LCF curve is compared as it can be seen in figure 25.

Fatigue Analysis of an Aluminium Radial Impeller David Jiménez Garcia
-33-
Figure 25: LCF. Comparison between strain and strain&load-controlled curves.
Due to the little difference between the strain-controlled and the “strain&load”
controlled data LCF curve, and that literature says that strain-controlled data has
to be used; it is decided to discard the “strain&load” based data and use the
strain-controlled data.
Fatigue Analysis of an Aluminium Radial Impeller David Jiménez Garcia
-34-
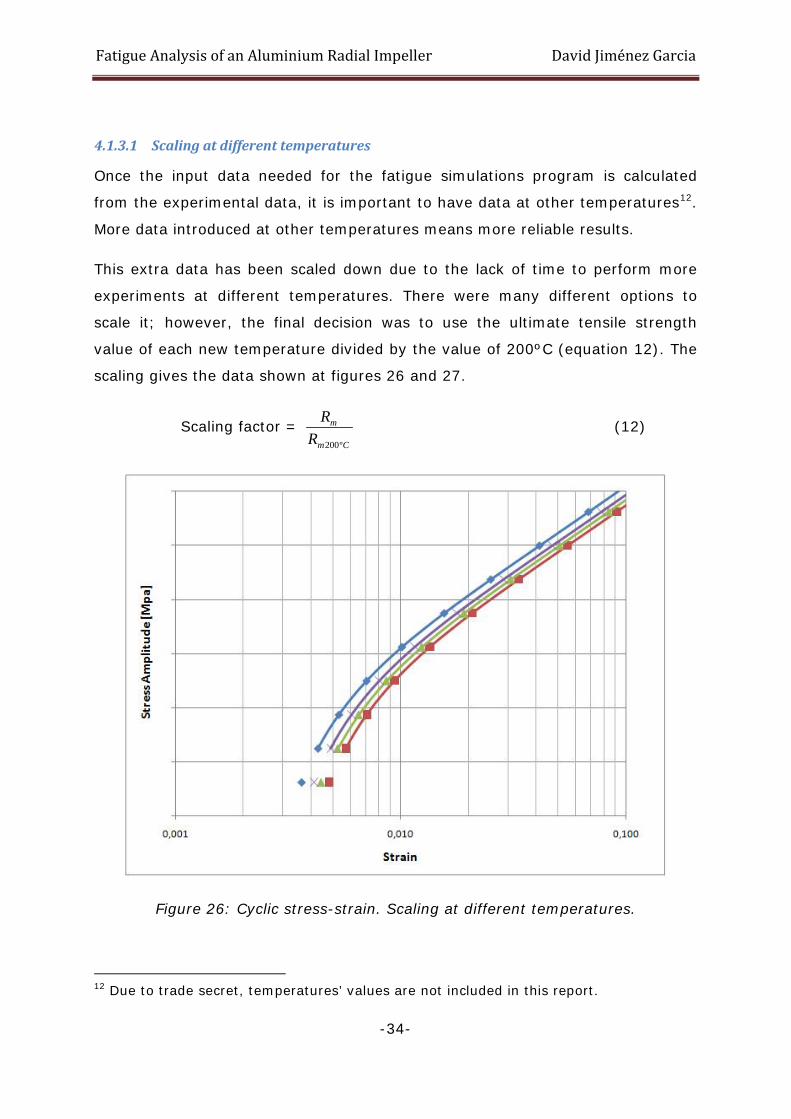
4.1.3.1 Scaling at different temperatures
Once the input data needed for the fatigue simulations program is calculated
from the experimental data, it is important to have data at other temperatures12.
More data introduced at other temperatures means more reliable results.
This extra data has been scaled down due to the lack of time to perform more
experiments at different temperatures. There were many different options to
scale it; however, the final decision was to use the ultimate tensile strength
value of each new temperature divided by the value of 200ºC (equation 12). The
scaling gives the data shown at figures 26 and 27.
Scaling factor = Cm
m
RR
º200
(12)
Figure 26: Cyclic stress-strain. Scaling at different temperatures.
12 Due to trade secret, temperatures’ values are not included in this report.
Fatigue Analysis of an Aluminium Radial Impeller David Jiménez Garcia
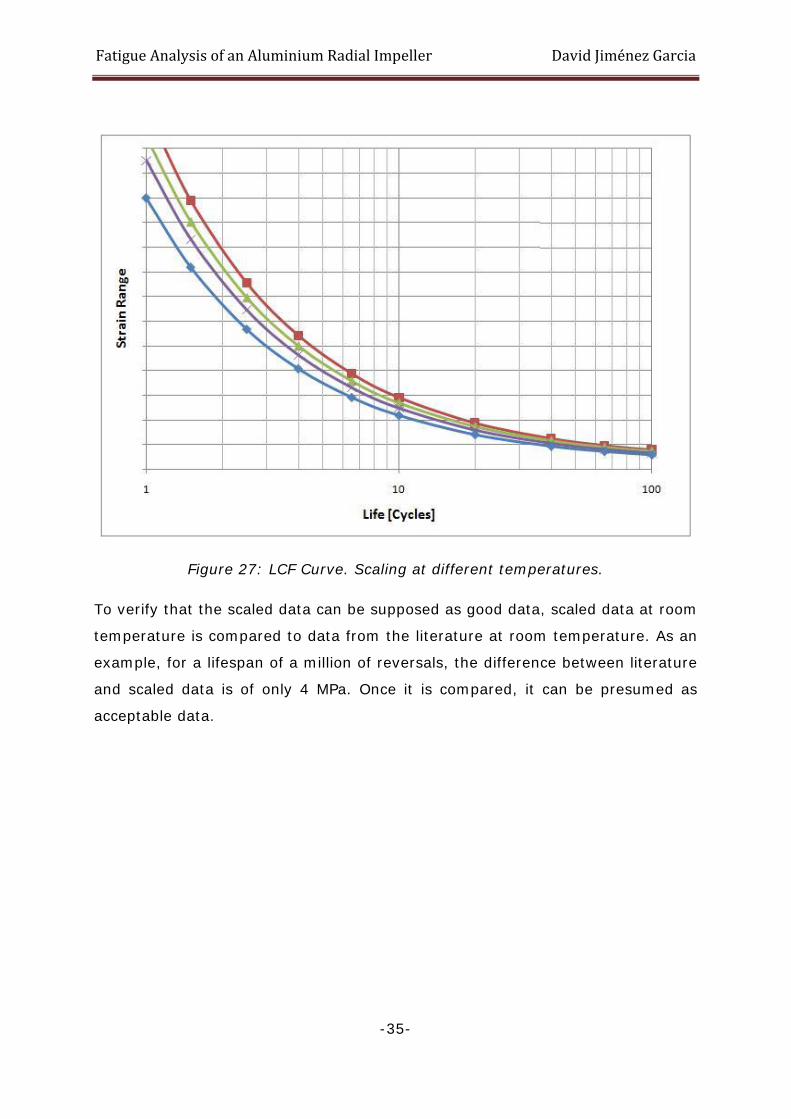
-35-
Figure 27: LCF Curve. Scaling at different temperatures.
To verify that the scaled data can be supposed as good data, scaled data at room
temperature is compared to data from the literature at room temperature. As an
example, for a lifespan of a million of reversals, the difference between literature
and scaled data is of only 4 MPa. Once it is compared, it can be presumed as
acceptable data.
Fatigue Analysis of an Aluminium Radial Impeller David Jiménez Garcia
-36-
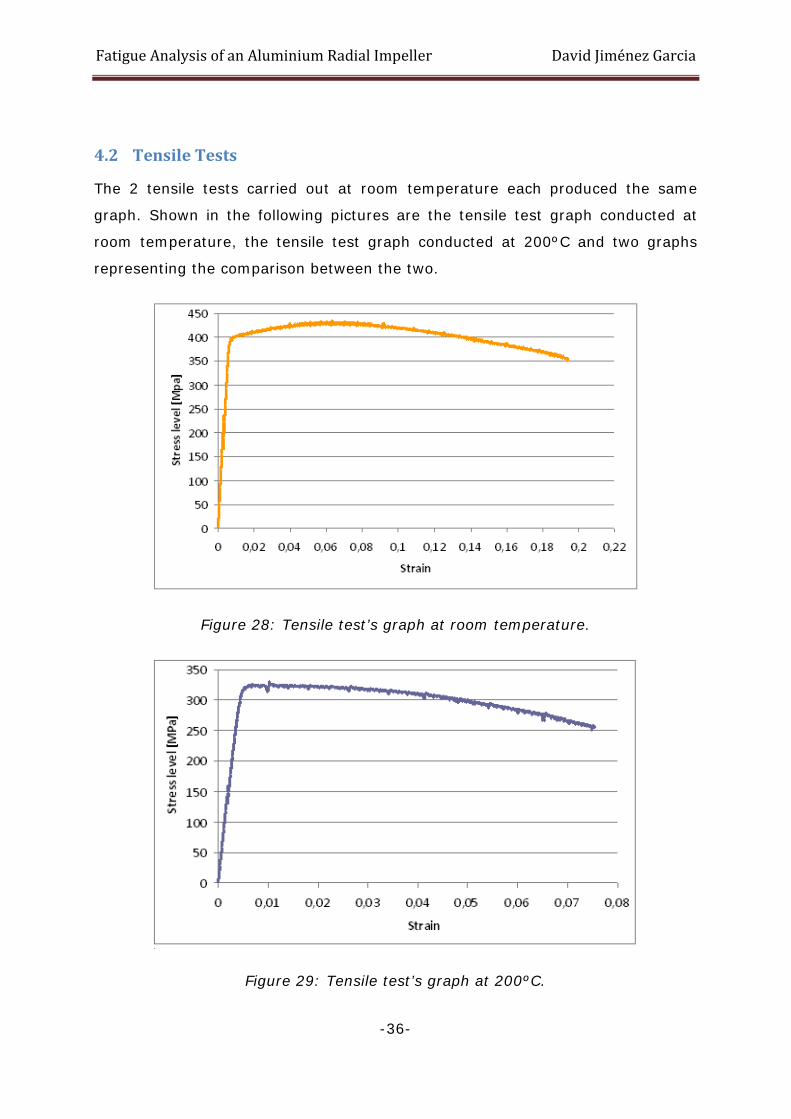
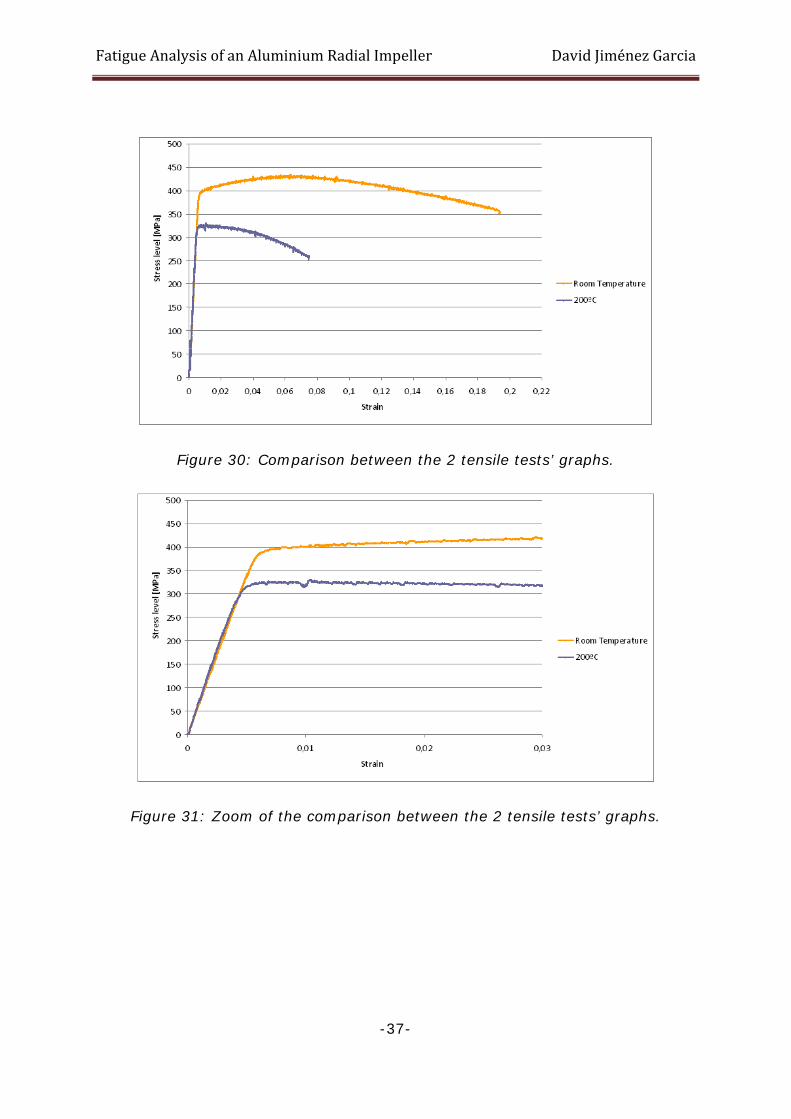
4.2 Tensile Tests
The 2 tensile tests carried out at room temperature each produced the same
graph. Shown in the following pictures are the tensile test graph conducted at
room temperature, the tensile test graph conducted at 200ºC and two graphs
representing the comparison between the two.
Figure 28: Tensile test’s graph at room temperature.
Figure 29: Tensile test’s graph at 200ºC.
Fatigue Analysis of an Aluminium Radial Impeller David Jiménez Garcia
-37-
Figure 30: Comparison between the 2 tensile tests’ graphs.
Figure 31: Zoom of the comparison between the 2 tensile tests’ graphs.
Fatigue Analysis of an Aluminium Radial Impeller David Jiménez Garcia
-38-
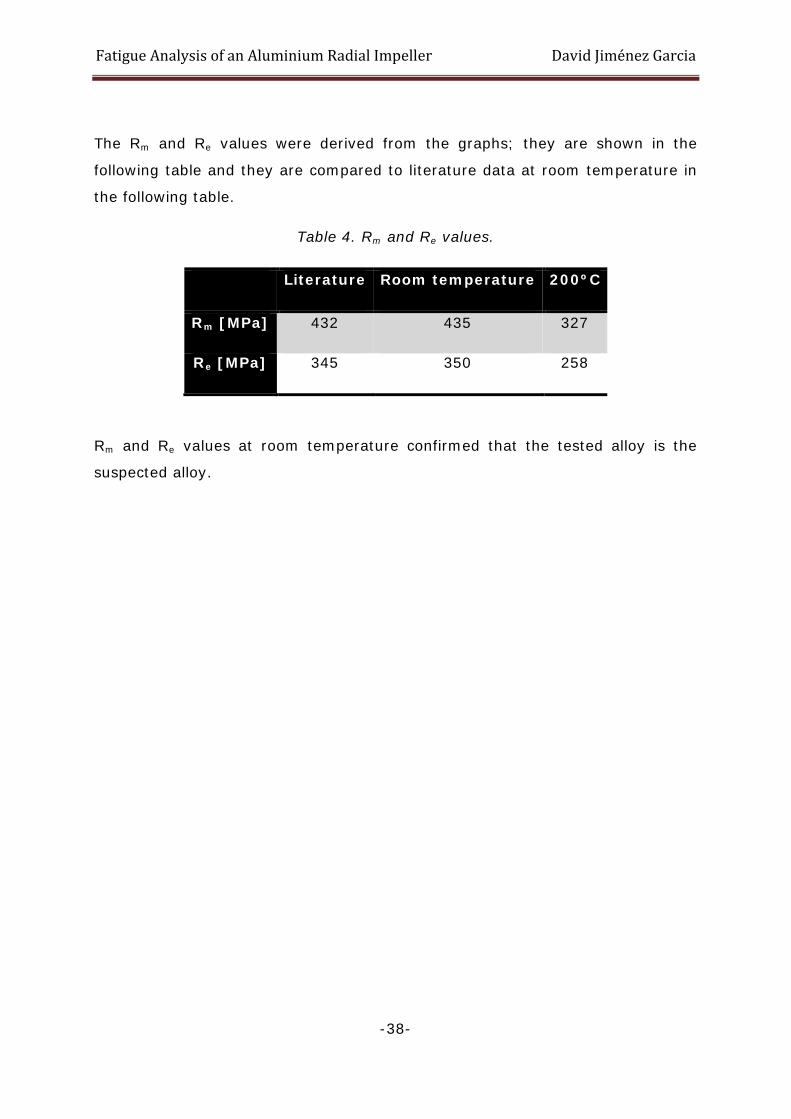
The Rm and Re values were derived from the graphs; they are shown in the
following table and they are compared to literature data at room temperature in
the following table.
Table 4. Rm and Re values.
Literature Room temperature 200ºC
Rm [MPa] 432 435 327
Re [MPa] 345 350 258
Rm and Re values at room temperature confirmed that the tested alloy is the
suspected alloy.

Fatigue Analysis of an Aluminium Radial Impeller David Jiménez Garcia
-39-
4.3 Hardness Testing
Shown in the following table are the results from the three hardness tests carried
out with medium derived from all three tests as well as the literature data.
Table 5. Hardness values.
Source Hardness, Rockwell B [HRB]
Literature 72
Experiment 1 73,9
73,93 Experiment 2 73,6
Experiment 3 74,3
Experimental hardness is similar to literature data; therefore, samples material is
accepted as the suspected alloy.
Fatigue Analysis of an Aluminium Radial Impeller David Jiménez Garcia
-40-
4.4 Microscope
In this section, the results obtained with the microscope are shown.
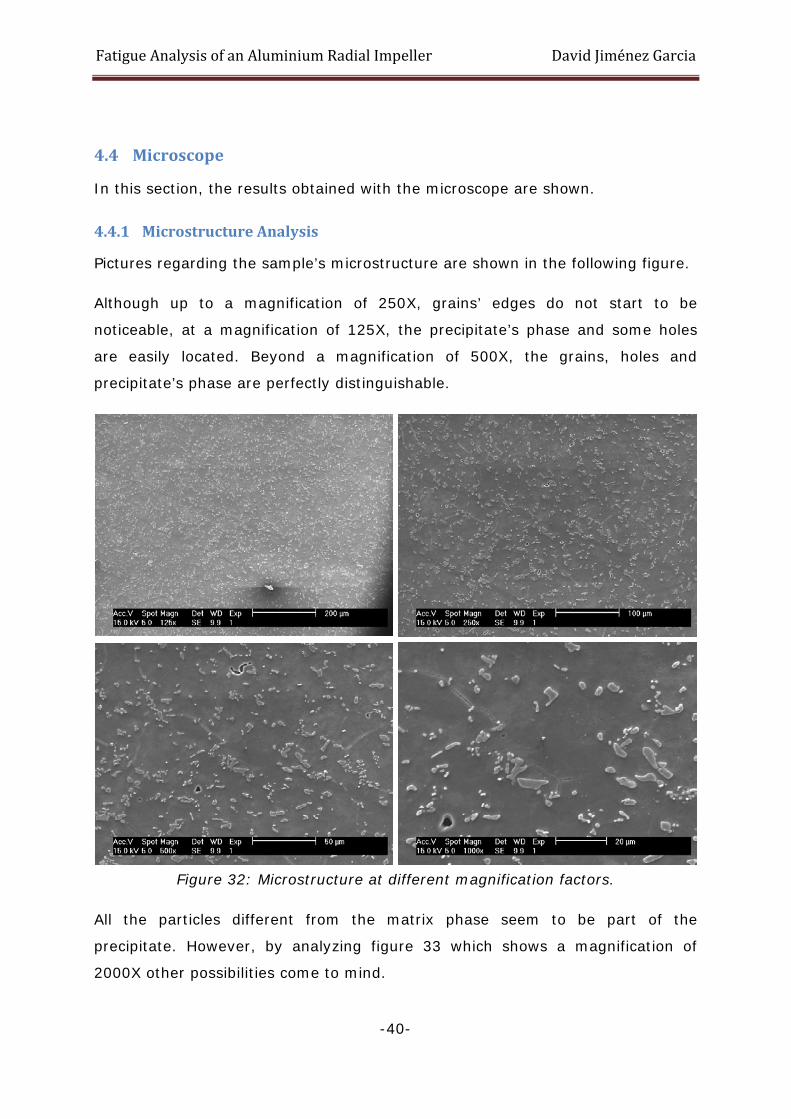
4.4.1 Microstructure Analysis
Pictures regarding the sample’s microstructure are shown in the following figure.
Although up to a magnification of 250X, grains’ edges do not start to be
noticeable, at a magnification of 125X, the precipitate’s phase and some holes
are easily located. Beyond a magnification of 500X, the grains, holes and
precipitate’s phase are perfectly distinguishable.
Figure 32: Microstructure at different magnification factors.
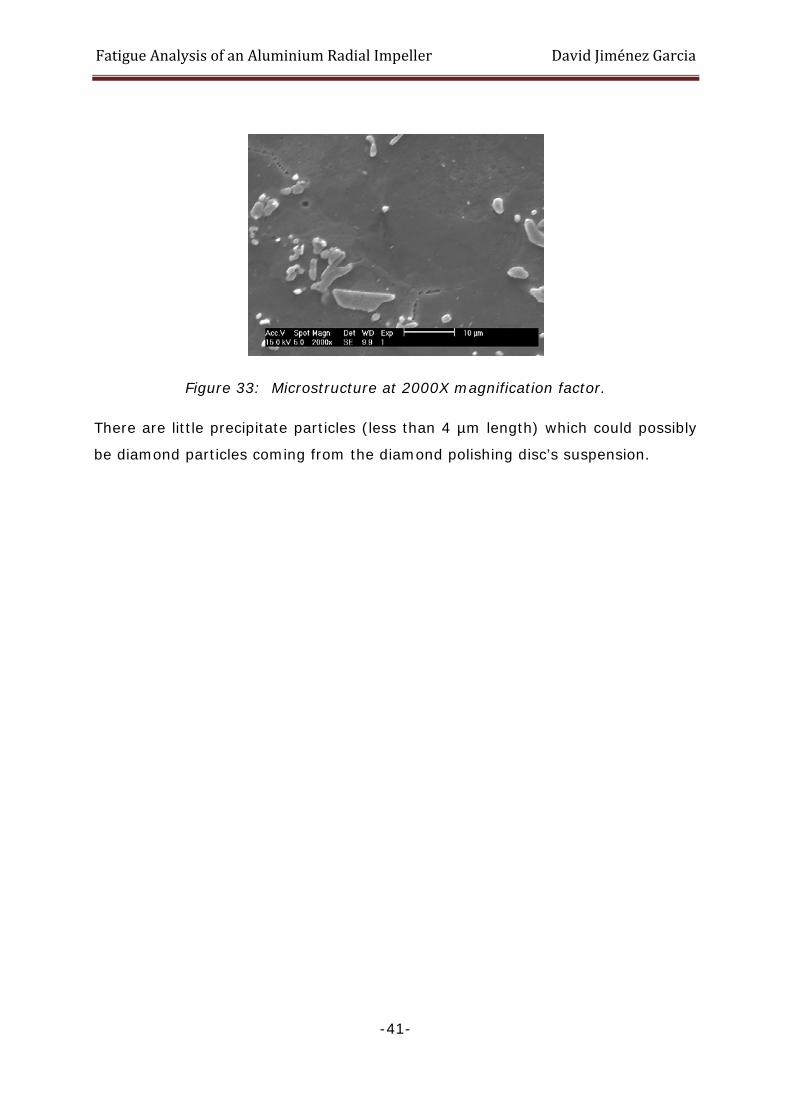
All the particles different from the matrix phase seem to be part of the
precipitate. However, by analyzing figure 33 which shows a magnification of
2000X other possibilities come to mind.
Fatigue Analysis of an Aluminium Radial Impeller David Jiménez Garcia
-41-
Figure 33: Microstructure at 2000X magnification factor.
There are little precipitate particles (less than 4 µm length) which could possibly
be diamond particles coming from the diamond polishing disc’s suspension.
Fatigue Analysis of an Aluminium Radial Impeller David Jiménez Garcia
-42-
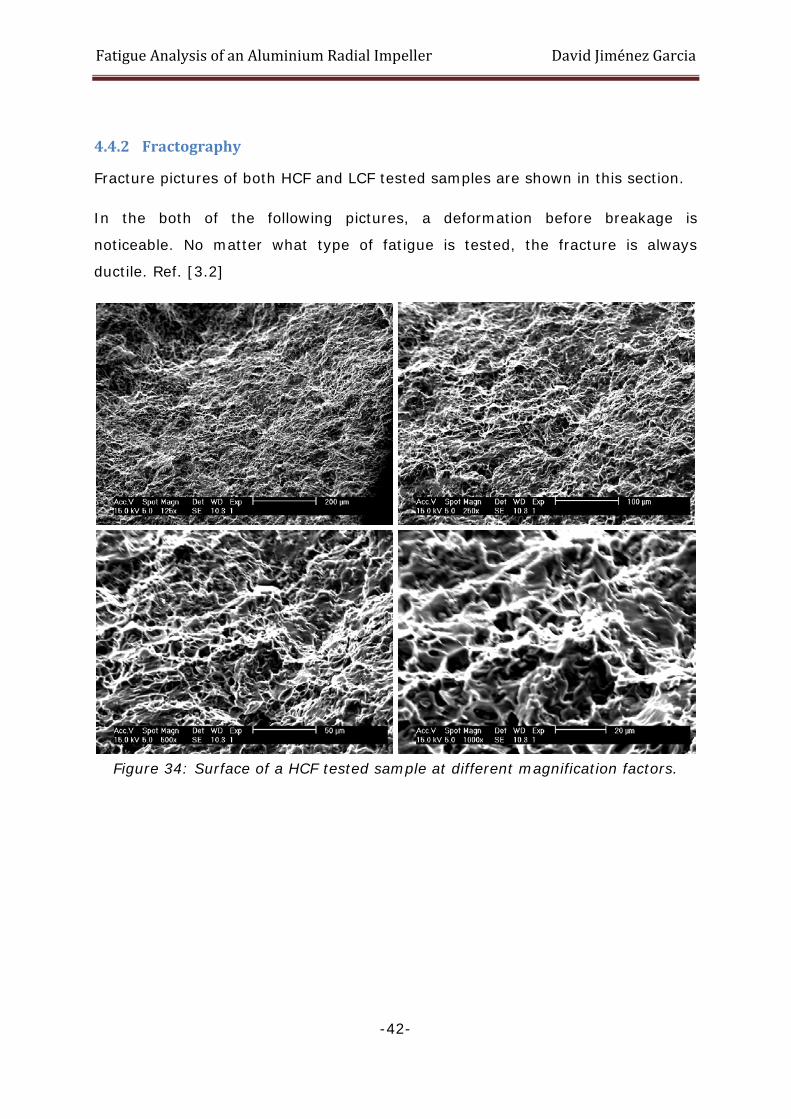
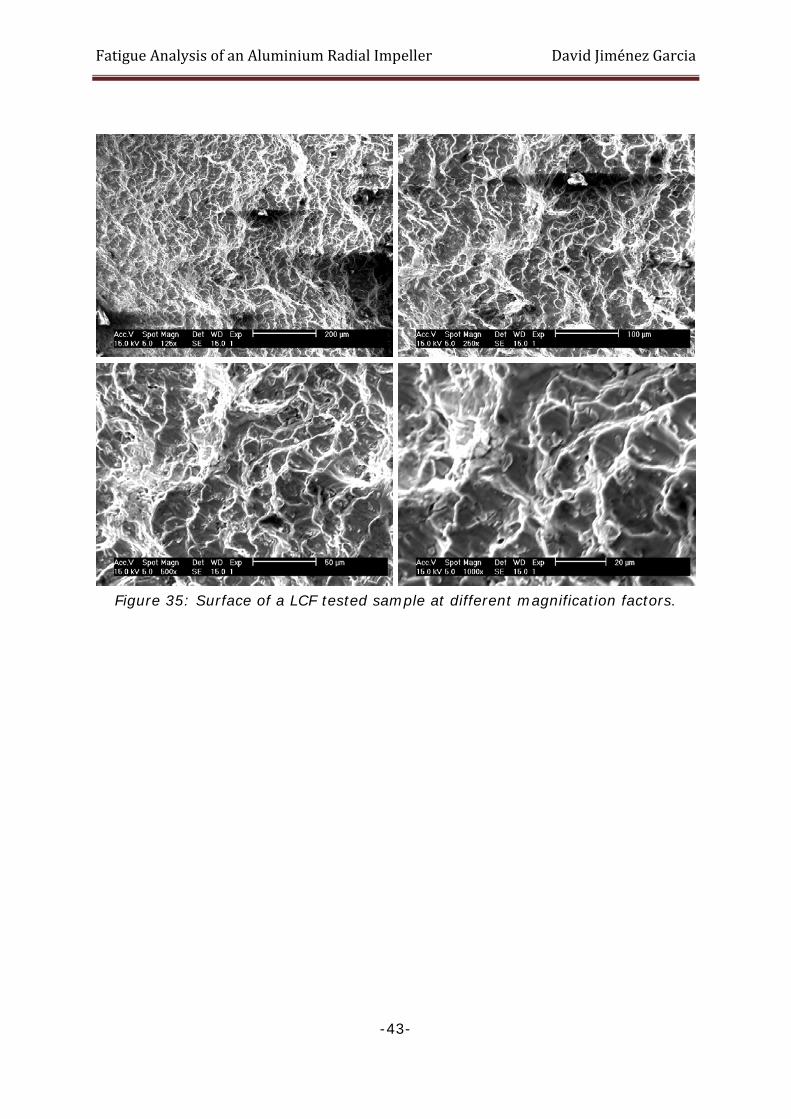
4.4.2 Fractography
Fracture pictures of both HCF and LCF tested samples are shown in this section.
In the both of the following pictures, a deformation before breakage is
noticeable. No matter what type of fatigue is tested, the fracture is always
ductile. Ref. [3.2]
Figure 34: Surface of a HCF tested sample at different magnification factors.
Fatigue Analysis of an Aluminium Radial Impeller David Jiménez Garcia
-43-
Figure 35: Surface of a LCF tested sample at different magnification factors.
Fatigue Analysis of an Aluminium Radial Impeller David Jiménez Garcia
-44-
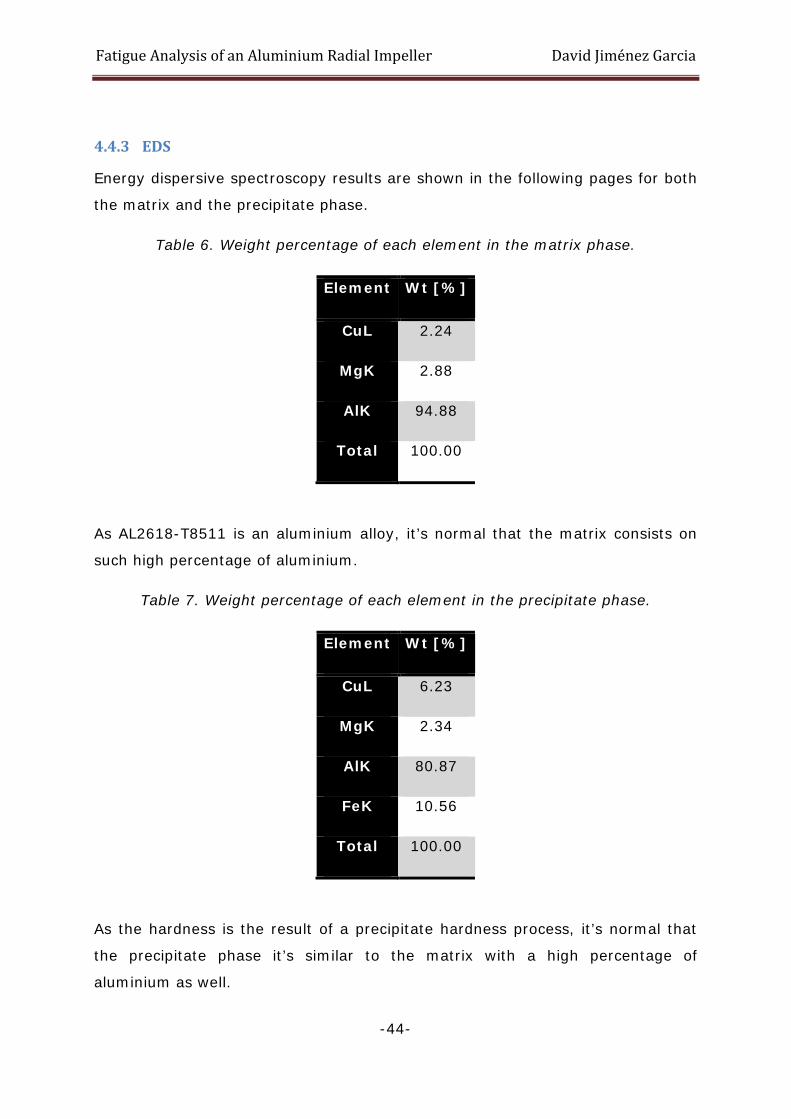
4.4.3 EDS
Energy dispersive spectroscopy results are shown in the following pages for both
the matrix and the precipitate phase.
Table 6. Weight percentage of each element in the matrix phase.
Element Wt [%]
CuL 2.24
MgK 2.88
AlK 94.88
Total 100.00
As AL2618-T8511 is an aluminium alloy, it’s normal that the matrix consists on
such high percentage of aluminium.
Table 7. Weight percentage of each element in the precipitate phase.
Element Wt [%]
CuL 6.23
MgK 2.34
AlK 80.87
FeK 10.56
Total 100.00
As the hardness is the result of a precipitate hardness process, it’s normal that
the precipitate phase it’s similar to the matrix with a high percentage of
aluminium as well.

Fatigue Analysis of an Aluminium Radial Impeller David Jiménez Garcia
-45-
Figure 36: Spectrum of the matrix phase.
Figure 37: Spectrum of the precipitate phase.
The idea was to identify where each element was located. However, due to the
fact that the composition of the matrix and the phase were similar, it was
decided that it was neither interesting nor useful.
Fatigue Analysis of an Aluminium Radial Impeller David Jiménez Garcia
-46-
5 Impeller Design Process The design process consists of an iterative process in which the sketch of the
shape of the back-disc is changed at every simulation. The goal of the iterations
is to see how stress distribution changes, as well as, its maximum value to be
able to define the most optimized design. The program used to perform the
simulations is ABAQUS 6.10 CAE. [19]
5.1 Design Steps
The design process consists of different steps in which different aspects are
regarded. The design steps are explained in this section.
5.1.1 Optimizing the Design Regarding Centrifugal Forces
The first design step is done regarding the maximum principal stress level
generated when the impeller spins at the top speed, which is the worst case.
The optimization process is started regarding the centrifugal forces because the
majority of the stresses in the impeller are caused by the high spinning speed.
In this step, the following observations are detected:
• The more material at the back-disc of the impeller, the higher the
maximum principal stress value.
• The more material in the outer region, the less stress level on that region,
but the more stress level at the centre hole.
• The more curved the back-disc of the impeller, the more concentrated
stress at this region with the more maximum principal stress value.
• The less the impeller’s length, the more the maximum principal stress
value.
The mesh is more refined in the regions prone to have more stress level. It is
changed while first designs are simulated.
A lot of different sketches are simulated but only the worst (figure 38) and the
best (figure 39) stress distribution designs are shown.
Fatigue Analysis of an Aluminium Radial Impeller David Jiménez Garcia
-47-
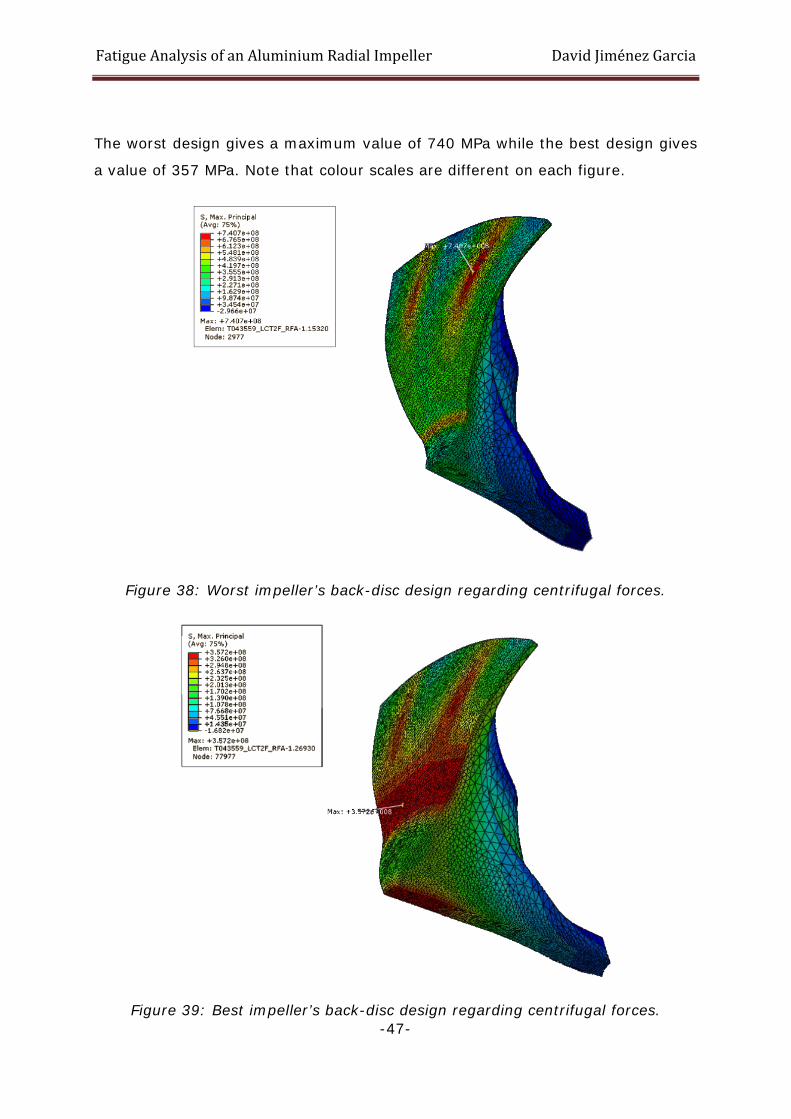
The worst design gives a maximum value of 740 MPa while the best design gives
a value of 357 MPa. Note that colour scales are different on each figure.
Figure 38: Worst impeller’s back-disc design regarding centrifugal forces.
Figure 39: Best impeller’s back-disc design regarding centrifugal forces.
Fatigue Analysis of an Aluminium Radial Impeller David Jiménez Garcia
-48-
5.1.2 Introducing the Temperature Field
Once the optimized back-disc design regarding centrifugal forces is reached, it is
decided to introduce the temperature field.
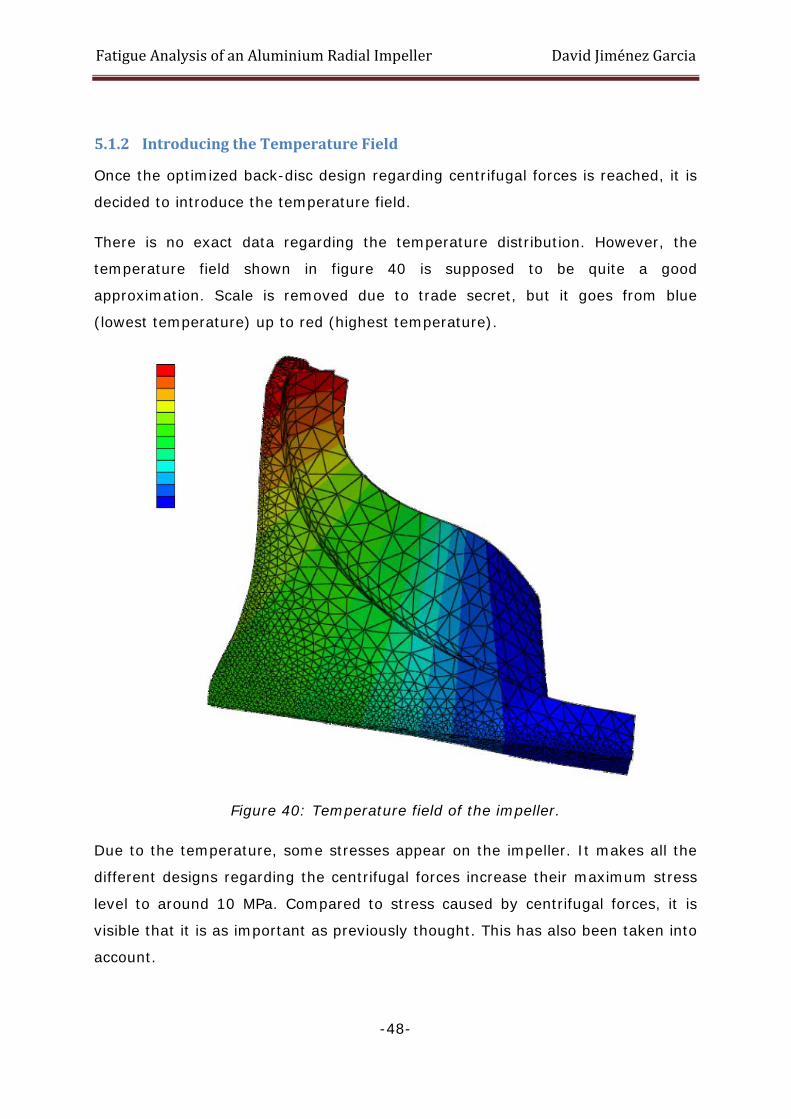
There is no exact data regarding the temperature distribution. However, the
temperature field shown in figure 40 is supposed to be quite a good
approximation. Scale is removed due to trade secret, but it goes from blue
(lowest temperature) up to red (highest temperature).
Figure 40: Temperature field of the impeller.
Due to the temperature, some stresses appear on the impeller. It makes all the
different designs regarding the centrifugal forces increase their maximum stress
level to around 10 MPa. Compared to stress caused by centrifugal forces, it is
visible that it is as important as previously thought. This has also been taken into
account.
Fatigue Analysis of an Aluminium Radial Impeller David Jiménez Garcia
-49-
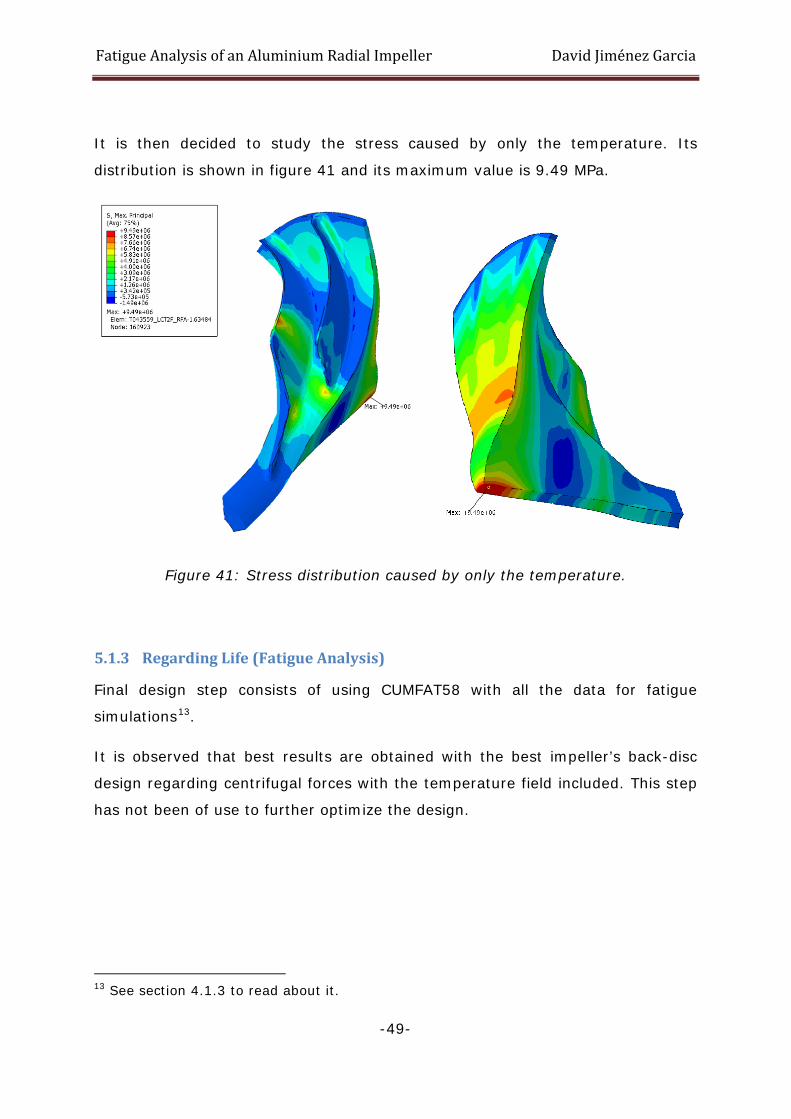
It is then decided to study the stress caused by only the temperature. Its
distribution is shown in figure 41 and its maximum value is 9.49 MPa.
Figure 41: Stress distribution caused by only the temperature.
5.1.3 Regarding Life (Fatigue Analysis)
Final design step consists of using CUMFAT58 with all the data for fatigue
simulations13.
It is observed that best results are obtained with the best impeller’s back-disc
design regarding centrifugal forces with the temperature field included. This step
has not been of use to further optimize the design.
13 See section 4.1.3 to read about it.
Fatigue Analysis of an Aluminium Radial Impeller David Jiménez Garcia
-50-
5.2 Optimized Design
Up to this point, simulations of the optimized design have been performed as if
the impeller was constantly spinning at its top speed. A further study was
performed analyzing three different types of use that can have the impeller.
These three situations are explained in this section. All of them have a similar
stress distribution, with the maximum principal stress value located in the
medium region. The differences among them is the stress scale and impeller’s
lifespan.
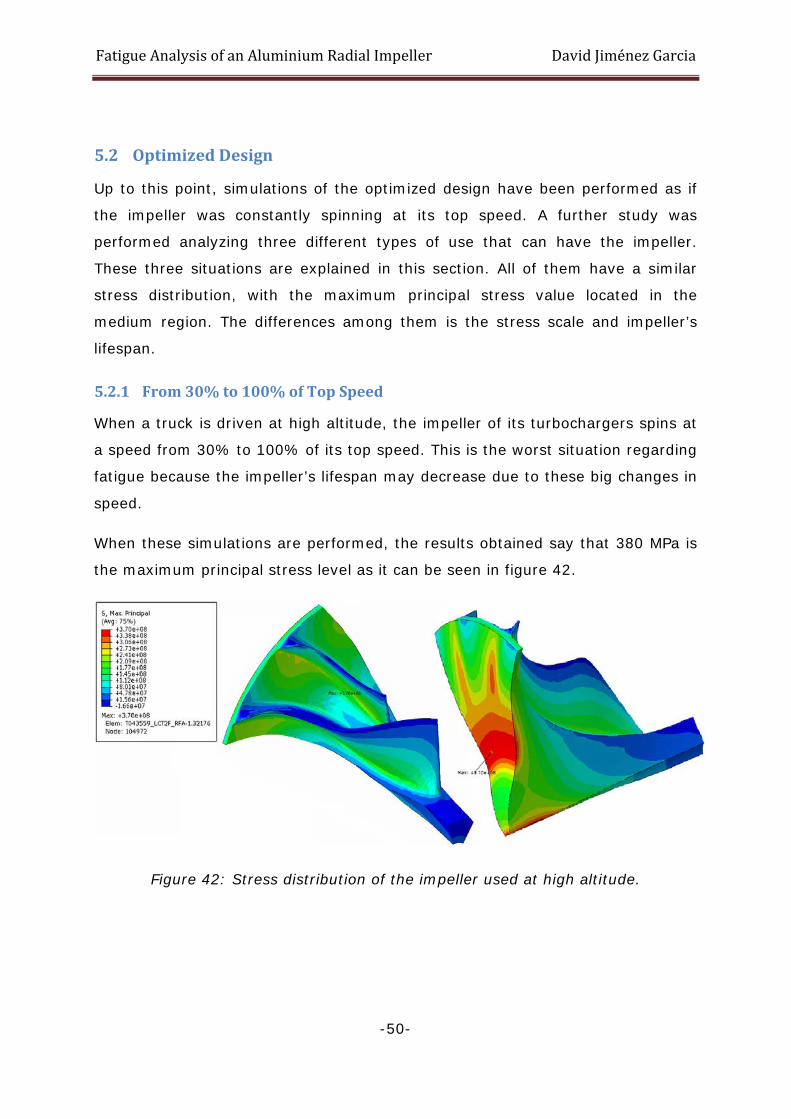
5.2.1 From 30% to 100% of Top Speed
When a truck is driven at high altitude, the impeller of its turbochargers spins at
a speed from 30% to 100% of its top speed. This is the worst situation regarding
fatigue because the impeller’s lifespan may decrease due to these big changes in
speed.
When these simulations are performed, the results obtained say that 380 MPa is
the maximum principal stress level as it can be seen in figure 42.
Figure 42: Stress distribution of the impeller used at high altitude.
Fatigue Analysis of an Aluminium Radial Impeller David Jiménez Garcia
-51-
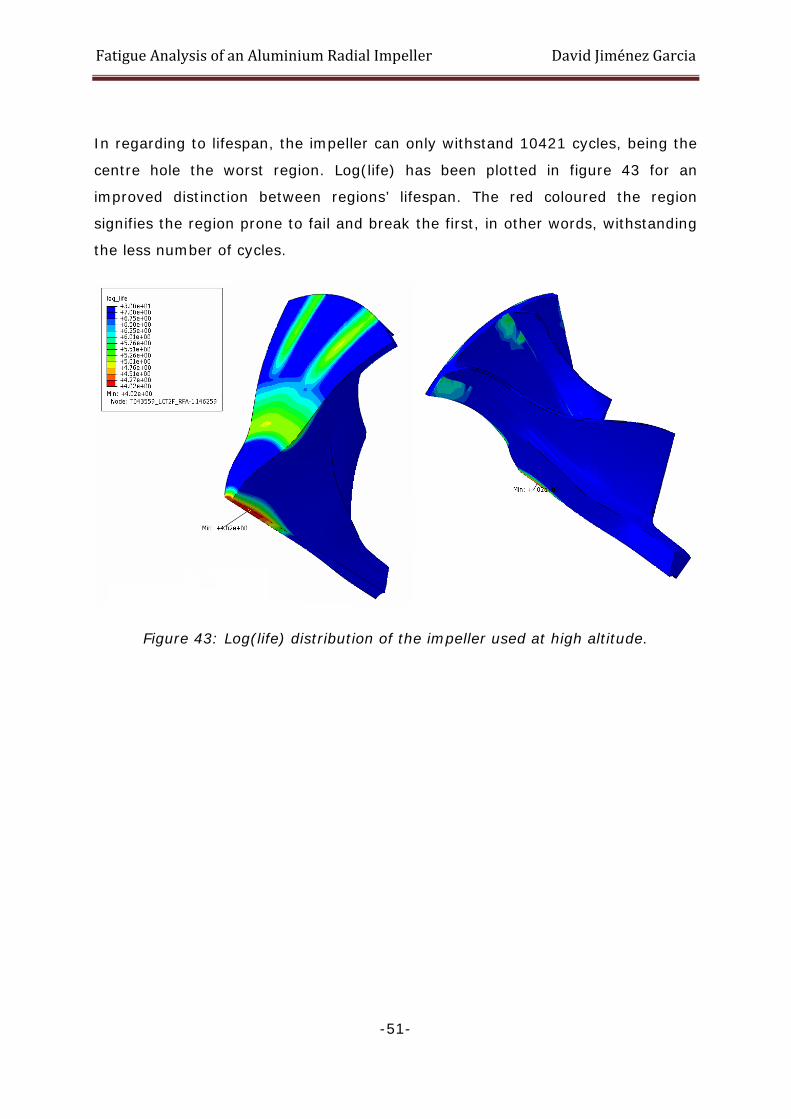
In regarding to lifespan, the impeller can only withstand 10421 cycles, being the
centre hole the worst region. Log(life) has been plotted in figure 43 for an
improved distinction between regions’ lifespan. The red coloured the region
signifies the region prone to fail and break the first, in other words, withstanding
the less number of cycles.
Figure 43: Log(life) distribution of the impeller used at high altitude.
Fatigue Analysis of an Aluminium Radial Impeller David Jiménez Garcia
-52-
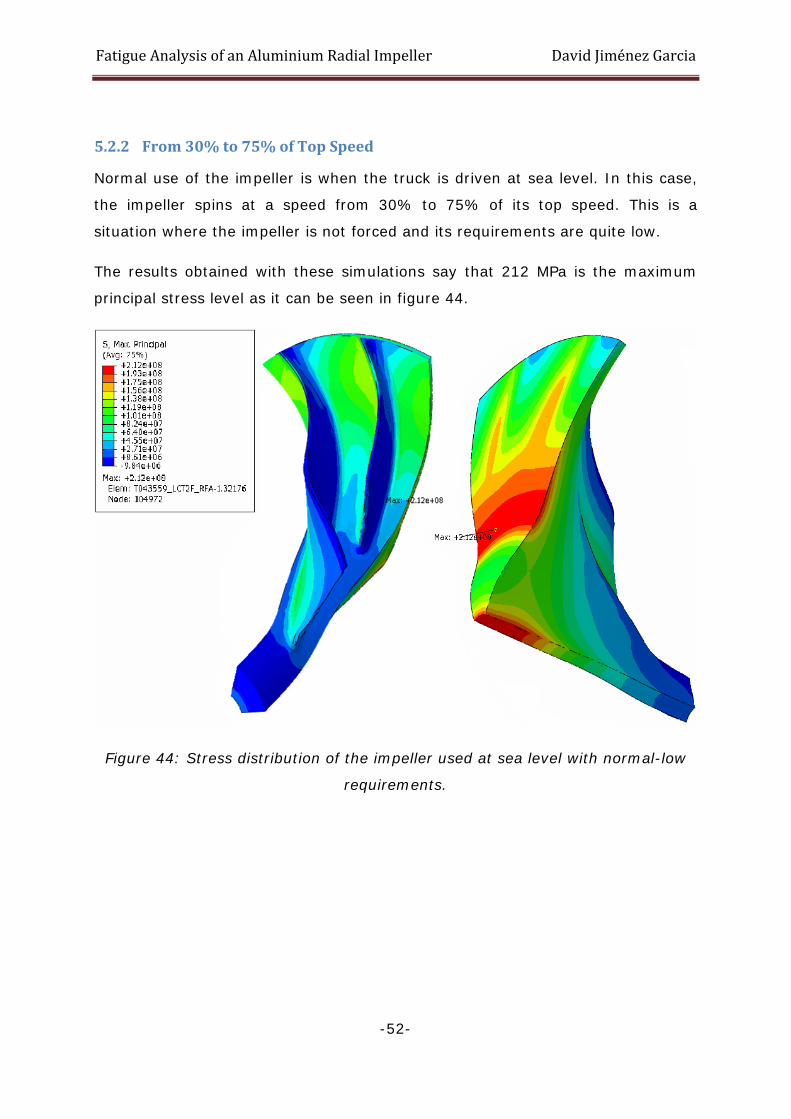
5.2.2 From 30% to 75% of Top Speed
Normal use of the impeller is when the truck is driven at sea level. In this case,
the impeller spins at a speed from 30% to 75% of its top speed. This is a
situation where the impeller is not forced and its requirements are quite low.
The results obtained with these simulations say that 212 MPa is the maximum
principal stress level as it can be seen in figure 44.
Figure 44: Stress distribution of the impeller used at sea level with normal-low
requirements.

Fatigue Analysis of an Aluminium Radial Impeller David Jiménez Garcia
-53-
In regard to lifespan, the impeller can only withstand 10729630 cycles, with the
centre hole again being the worst region. Log(life) is shown in figure 45.
Figure 45: Log(life) distribution of all the impeller used at sea level with
normal-low requirements.
Fatigue Analysis of an Aluminium Radial Impeller David Jiménez Garcia
-54-
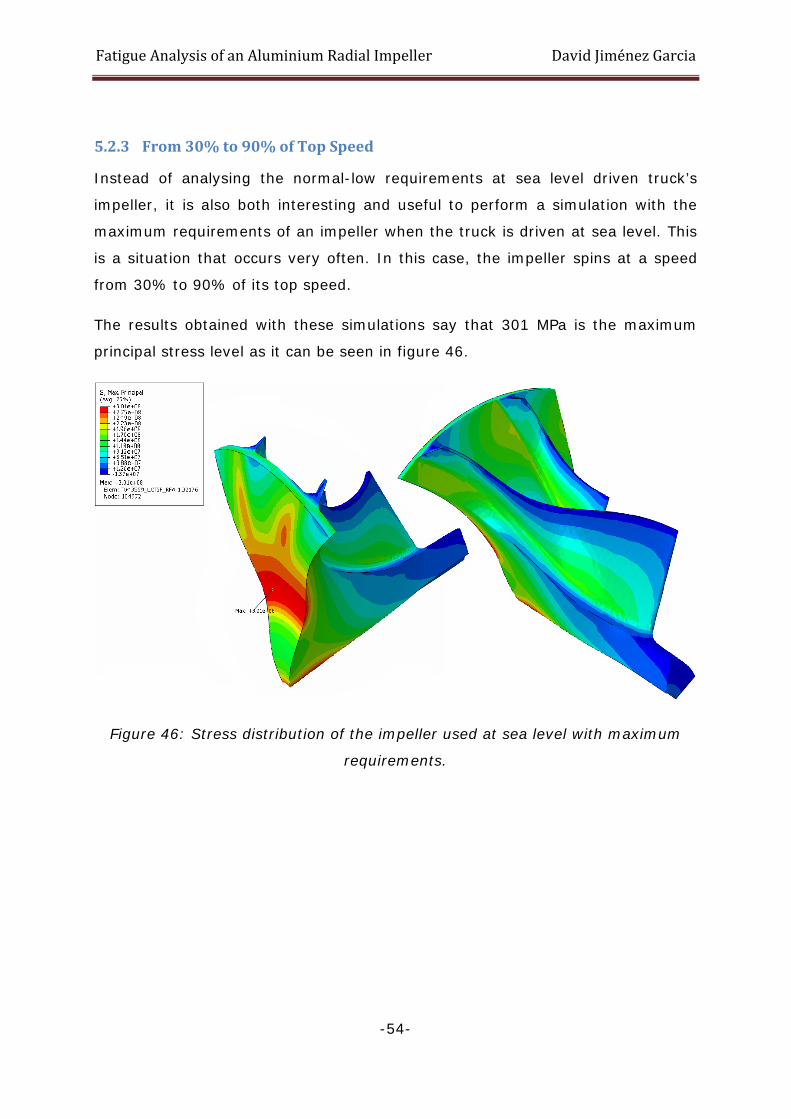
5.2.3 From 30% to 90% of Top Speed
Instead of analysing the normal-low requirements at sea level driven truck’s
impeller, it is also both interesting and useful to perform a simulation with the
maximum requirements of an impeller when the truck is driven at sea level. This
is a situation that occurs very often. In this case, the impeller spins at a speed
from 30% to 90% of its top speed.
The results obtained with these simulations say that 301 MPa is the maximum
principal stress level as it can be seen in figure 46.
Figure 46: Stress distribution of the impeller used at sea level with maximum
requirements.
Fatigue Analysis of an Aluminium Radial Impeller David Jiménez Garcia
-55-
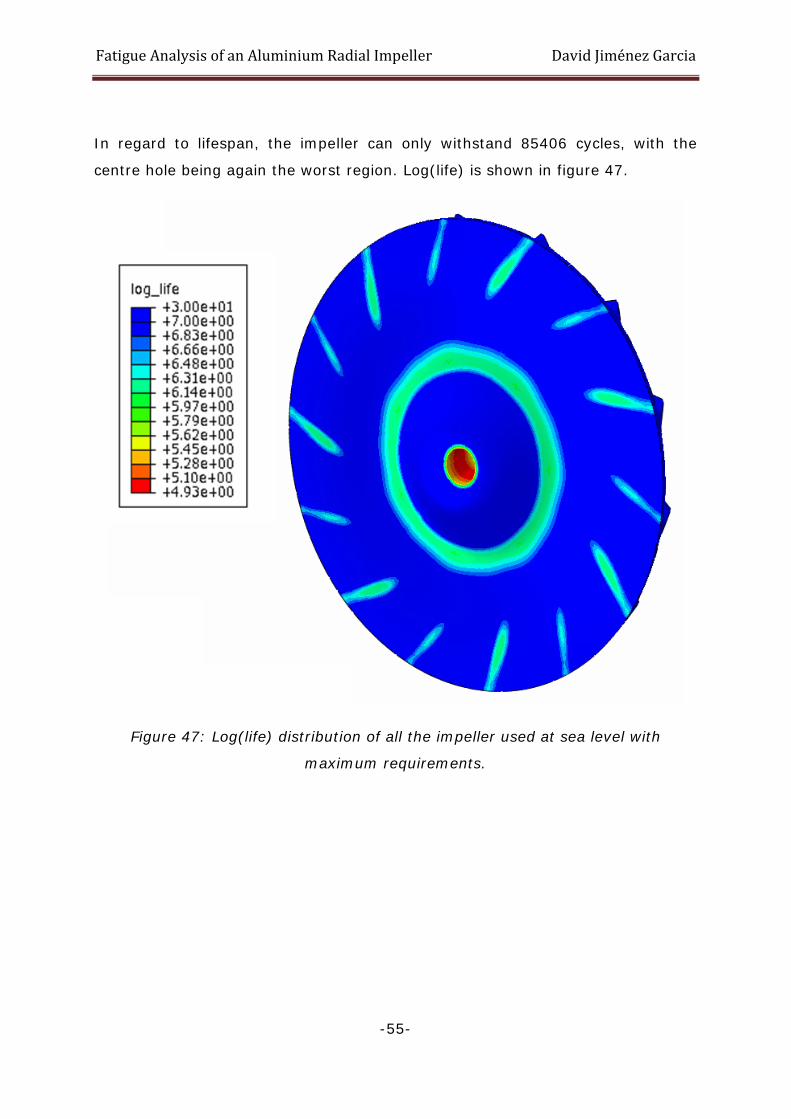
In regard to lifespan, the impeller can only withstand 85406 cycles, with the
centre hole being again the worst region. Log(life) is shown in figure 47.
Figure 47: Log(life) distribution of all the impeller used at sea level with
maximum requirements.
Fatigue Analysis of an Aluminium Radial Impeller David Jiménez Garcia
-56-
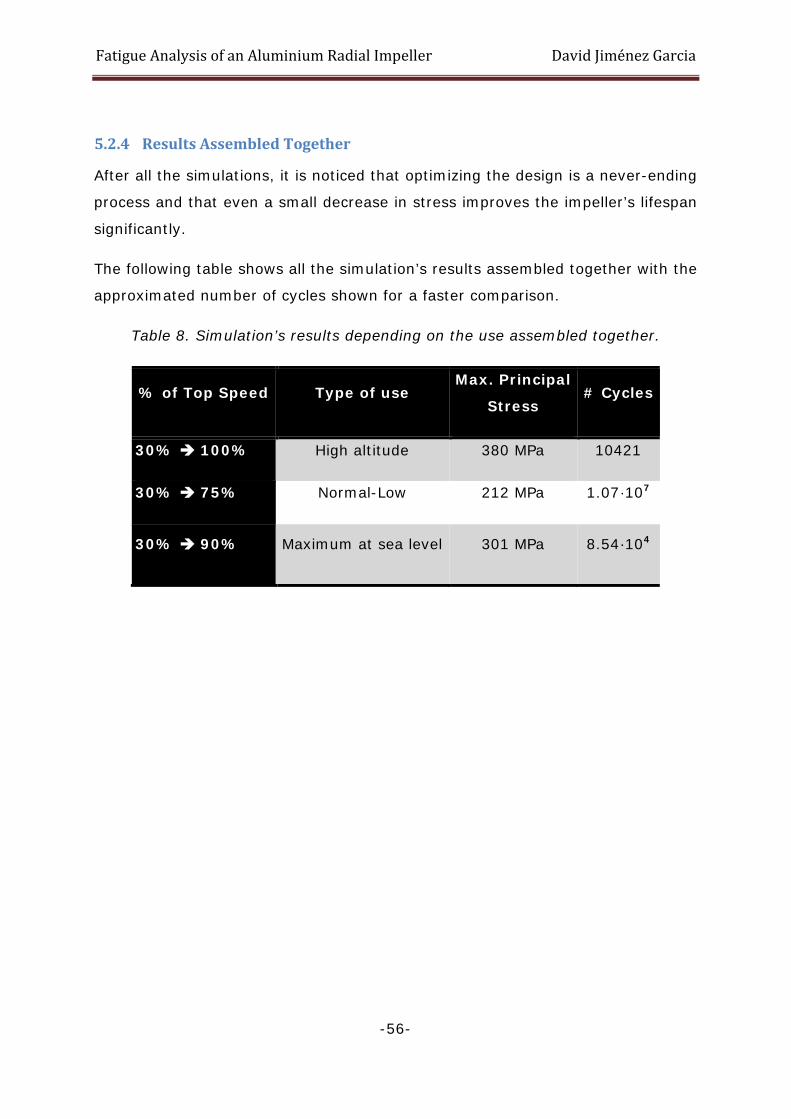
5.2.4 Results Assembled Together
After all the simulations, it is noticed that optimizing the design is a never-ending
process and that even a small decrease in stress improves the impeller’s lifespan
significantly.
The following table shows all the simulation’s results assembled together with the
approximated number of cycles shown for a faster comparison.
Table 8. Simulation’s results depending on the use assembled together.
% of Top Speed Type of use Max. Principal
Stress # Cycles
30% 100% High altitude 380 MPa 10421
30% 75% Normal-Low 212 MPa 1.07·107
30% 90% Maximum at sea level 301 MPa 8.54·104
Fatigue Analysis of an Aluminium Radial Impeller David Jiménez Garcia
-57-
6 Conclusions In this Master Thesis material testing of AL2618-T8511 has been performed to
obtain the fatigue data. With this data, some graphs have been obtained and
more data has been calculated with a scaling factor. This collected data has been
used to redesign the back disc of a radial impeller. The following conclusions
have been reached:
• The lifespan of the impeller is affected by fatigue failure at high
temperatures
• AL2618 has reasonably good mechanical properties at 200ºC
• Optimized design of the back-disc of the impeller is essential for long
lifespan
• Even a small decrease in stress improves the impeller’s lifespan
significantly
• Life of the impeller is also affected by type of use (Table 8).
Future work could be performed using the lower 2-σ or 3-σ design curve in order
to redesign the back disc of the radial impeller. These curves consist of shifting
the median S-N curve in logarithmic coordinates to the left by 2 or 3 times the
standard deviation. In addition, statistical studies would be needed.
Fatigue Analysis of an Aluminium Radial Impeller David Jiménez Garcia
-58-
7 References
[1] J. Gilbert Kaufman, 1999, Properties of Aluminum Alloys: Tensile, Creep and
Fatigue Data at High and Low Temperatures, ASM International, pages 88-93.
[2] MIL-HDBK-5H, 1 December 1998.
[3] Engineers Edge, Aluminum Tempers. Retrieved from the internet April 2011.
http://www.engineersedge.com/aluminum_tempers.htm
[4] Metal Suppliers Online, 2618 Aluminum Material Property Data Sheet.
Retrieved from the internet February 2011.
http://www.suppliersonline.com/propertypages/2618.asp
[5] MatWeb Material Property Data, Aluminium 2618-T61. Retrieved from the
internet February 2011.
http://www.matweb.com/search/DataSheet.aspx?MatGUID=f6d0bebbfc72488
38243b7fa141431ba
[6] Wohler’s curve drawing. Retrieved from the internet February 2011.
http://www.cad-cae.com/images2/022.jpg()
[7] DOE-HDBK-1017, January 1993, Properties of Metals, Physical Properties. Retrieved
from the internet February 2011.
http://www.tpub.com/content/doe/h1017v1/css/h1017v1_73.htm
[8] Shawn M. Kelly, April 1997, Fatigue. Retrieved from the internet March 2011.
http://www.sv.vt.edu/classes/MSE2094_NoteBook/97ClassProj/anal/kelly/fati
gue.html
[9] Cavaliere, Nobile, Panella, Squillace, 2005, Mechanical and microstructural
behaviour of 2024-7075 Aluminium Alloy sheets joined by friction stir
welding. International Journal of Machine Tools & Manufacture. Pages 592 –
593.
[10] S. Suresh, 1998, Fatigue of materials, 2nd ed, Cambridge University Press,
London, UK. Chapter 8.
Fatigue Analysis of an Aluminium Radial Impeller David Jiménez Garcia
-59-
[11] Bannantine, Comer, Handrock, Fundamentals of Metal Fatigue Analysis,
Prentice Hall, Englewood Cliffs, N. J. 07632.
[12] Norman E. Dowling, Mechanical Behaviour of Materials. Engineering
Methods for Deformation, Fracture, and Fatigue. Third Edition. Upper Saddle
River, New Jersey 07458. Chapter 14.
[13] Mechanical Testing and Evaluation, Volume 8 of ASM Handbook.
[14] Cummins Turbo Technologies, How a Turbocharger Works. Retrieved from
the internet March 2011. http://www.holset.co.uk/mainsite/files/2_3_1-
how%20a%20turbocharger%20works.php
[15] Floyd G. West, Turbocharger System, US Patent 3576102, April 1971.
[16] Turbocharger scheme. Retrieved from internet March 2011.
http://www.cap-ny153.org/Turbocharger%2002.jpg
[17] S.P. Rockwell, Hardness-Testing Machine, US Patent 1516207, Nov 1924.
[18] ASTM test method E 18.
[19] Abaqus 6.10 CAE and tutorials. http://www.simulia.com