fate of bulk hypochlorite solutions in two water …
TRANSCRIPT

FATE OF BULK HYPOCHLORITE SOLUTIONS IN TWO WATER TREATMENT FACILITIES
by
ANNA BREYTUS
Presented to the Faculty of the Graduate School of
The University of Texas at Arlington in Partial Fulfillment
of the Requirements
for the Degree of
MASTER OF SCIENCE IN ENVIRONMENTAL ENGINEERING
THE UNIVERSITY OF TEXAS AT ARLINGTON
MAY 2015

ii
Copyright © by Anna Breytus 2015
All Rights Reserved
iii
Acknowledgements
I would like to thank my parents, Vladimir and Larisa, and my dear husband, Tom, for always
encouraging me to move forward and believing in me. Also, I would like to thank my daughter, Ronel, for
her beautiful smile that brings so much joy into my life.
I would like to give special thanks to Dr. Kruzic for the opportunity to gain this invaluable research
experience. I also thank Dr. Prabakar for the guidance and advice throughout this study. I acknowledge
Wasiu Lawal for the training with ion chromatograph that was necessary for starting my work and Charles
Philip Shelor for his guidance in the development and validation of hypochlorite pre-treatment procedure
and in ion chromatography analysis and troubleshooting.
I wish to thank water treatment facilities personnel, especially Brent Jordan, David Hinshaw, and
Frank Beasley who assisted in samples collection and provided all the necessary information for the
study on plants operation.
I am grateful for funding made available through the Tarrant Regional Water District Project.
April 9, 2015

iv
Abstract
FATE OF BULK HYPOCHLORITE SOLUTIONS IN TWO WATER TREATMENT FACILITIES
Anna Breytus, MS
The University of Texas at Arlington, 2015
Supervising Professor: Andrew Kruzic
Measurement of oxyhalides in various strength hypochlorite solutions has been an issue of
importance in the last decade, especially in view of the current aim of Homeland Security to reduce the
usage of chlorine gas. Hypochlorite solutions have a potential of introducing disinfection by-products
when used for water treatment. Previous works have shown the possibility of high levels of chlorate and
perchlorate in high strength hypochlorite solutions. Perchlorate is an endocrine disruptor that inhibits
iodide intake by the thyroid, thus reducing the production of essential thyroid hormones. Chlorate also has
several adverse effects on the blood and thyroid systems. Perchlorate is regulated in the states of
Massachusetts and California at the levels of 2 ppb and 6 ppb respectively, and is being considered for
federal regulation at the level of 15 ppb. Chlorate has a health reference limit (HRL) of 210 ppb and a
proposed action level of 200 ppb in California, with a current notification level of 800 ppb in California.
Chlorate is also being considered for federal regulation with a level yet to be determined.
Chlorate and perchlorate measurement was done using ion chromatograph (IC) with carbonate
eluent and conductivity detector. Due to the sensitivity limitations of the system, it was desired to measure
some of the samples without dilution. This required the removal of free chlorine from the solution
(quenching) to prevent destruction of system components, such as the column and the suppressor.
Chlorine removal was achieved by addition of 20% excess hydrogen peroxide, based on molar ratio of
1:1 to chlorine and subsequent catalytic removal of residual hydrogen peroxide, which is also detrimental
to IC equipment, using manganese dioxide. The process showed consistent and reproducible results.
One objective of this study was to investigate the degree to which hypochlorite solutions degrade,
and the increase in chlorate and perchlorate levels in storage tanks. This was accomplished by

v
comparing chlorine, chlorate and perchlorate levels in storage tanks to newly delivered solutions. Two
facilities that had different suppliers were sampled. For both suppliers, variations in chlorine and chlorate
levels were found in different hypochlorite deliveries. One of the suppliers generally had a much higher
chlorate level in hypochlorite than the other supplier. Chlorine concentrations were equal or greater than
the declared trade percent for both suppliers. Variations were also found in hypochlorite and chlorate
concentrations stored at each facility. From a comparison between stored and newly delivered material it
was found that significant hypochlorite degradation takes place. This results in increase of chlorate and
perchlorate levels in the tanks.
Based on the results from tank samples and using an assumed chlorine dose of 5 mg/L, chlorate
concentrations in the tanks are high enough that it would probably cause the concentrations in water to
exceed the HRL. Nevertheless, despite perchlorate concentrations increasing during the storage, residual
concentrations in finished water would probably be significantly below typical standards and therefore do
not seem to be of a concern.
In previous studies, a model that predicts hypochlorite degradation and chlorate production has
been generated based on laboratory results. In this study, field data of hypochlorite degradation and
chlorate formation in storage tanks was compared to this model (available in AWWA website as
Hypochlorite Assessment Model). Using the average of sample temperatures as an input to the model,
most of the data points from this study were found to deviate from the values predicted by the model by
less than 10%.
Dilution of high strength hypochlorite solutions with softened water and low strength hypochlorite
was examined. The two dilution sources produced similar levels of hypochlorite degradation and chlorate
formation. Most of the data in the dilution experiment was within 10% deviation from the values predicted
by Hypochlorite Assessment Model. This study also confirmed the results from previous work that dilution
decreases hypochlorite degradation and chlorate formation.

vi
Table of Contents
Acknowledgements ....................................................................................................................................... iii
Abstract ........................................................................................................................................................ iv
List of Illustrations ......................................................................................................................................... x
List of Tables ................................................................................................................................................ xi
Chapter 1 Background and Objectives ......................................................................................................... 1
1.1 Transition from Chlorine Gas to Hypochlorite .................................................................................... 1
1.2 Scope of the Study ............................................................................................................................. 2
1.3 Research Objectives........................................................................................................................... 2
Chapter 2 Literature Review ......................................................................................................................... 3
2.1 Hypochlorite Manufacture ................................................................................................................... 3
2.1.1 Commercial Hypochlorite and its Decomposition ........................................................................ 3
2.1.1.1 Chlorate formation mechanism: ........................................................................................... 4
2.1.1.2 Perchlorate formation mechanism: ...................................................................................... 4
2.1.2 Influence of Hypochlorite Manufacture on Chlorate and Oxygen Formation .............................. 5
2.1.3 Sodium Hydroxide and Chlorine Gas Manufacture ..................................................................... 6
2.1.3.1 Mercury cell .......................................................................................................................... 6
2.1.3.2 Diaphragm cell ..................................................................................................................... 7
2.1.3.3 Membrane cell...................................................................................................................... 7
2.2 Health and Regulatory Aspects .......................................................................................................... 8
2.2.1 Perchlorate .................................................................................................................................. 8
2.2.2 Chlorate ....................................................................................................................................... 9
2.3 Hypochlorite Decay Model ................................................................................................................ 11
2.3.1 Hypochlorite Decomposition and Chlorate Formation ............................................................... 12
2.3.2 Perchlorate Formation ............................................................................................................... 13
2.3.3 Limitations of the Model............................................................................................................. 14
2.4 Summary of Factors Affecting Hypochlorite Decomposition ............................................................ 15

vii
2.4.1 pH .............................................................................................................................................. 15
2.4.2 Ionic Strength ............................................................................................................................ 15
2.4.3 Dilution ....................................................................................................................................... 15
2.4.4 Temperature .............................................................................................................................. 15
2.4.5 Effect of Matrix Ions ................................................................................................................... 15
2.5 Previous Field Studies ...................................................................................................................... 16
2.6 Analytical Methods ............................................................................................................................ 17
2.6.1 Quenching Agents ..................................................................................................................... 17
Chapter 3 Materials and Methods ............................................................................................................... 19
3.1 Materials and Water.......................................................................................................................... 19
3.2 Samples Collection ........................................................................................................................... 19
3.3 Chlorine and Hydrogen Peroxide Measurement .............................................................................. 19
3.4 Chloride, pH and Conductivity Measurements for Model Inputs ...................................................... 20
3.5 Quenching Agent Selection .............................................................................................................. 20
3.6 Quenching Procedure ....................................................................................................................... 22
3.7 Qualification and Quantification of the Analytes ............................................................................... 25
3.8 Calibration Curves ............................................................................................................................ 27
3.9 Limit of Detection (LOD) ................................................................................................................... 28
Chapter 4 Laboratory Results ..................................................................................................................... 29
4.1 Calibration Curves ............................................................................................................................ 29
4.1.1 Perchlorate ................................................................................................................................ 29
4.1.2 Chlorate ..................................................................................................................................... 31
4.2 Limit of Detection .............................................................................................................................. 34
4.2.1 Perchlorate ................................................................................................................................ 35
4.2.2 Chlorate ..................................................................................................................................... 35
4.3 Spiking Experiments ......................................................................................................................... 36
4.4 Incubation Experiment ...................................................................................................................... 38
4.4.1. Description and Results ........................................................................................................... 38

viii
4.4.2 Comparison to the Model .......................................................................................................... 42
4.4.2.1 - 100% High strength hypochlorite ..................................................................................... 43
4.4.2.2 - 50% High strength hypochlorite + 50% Softened water .................................................. 44
4.4.2.3 - 50% High strength hypochlorite + 50% Low strength hypochlorite ................................. 45
4.4.2.4 - 25% High strength hypochlorite + 75% Softened water .................................................. 46
4.4.2.5 - 25% High strength hypochlorite + 75% Low strength hypochlorite ................................. 47
4.4.2.6 - Conclusions from comparison to the model .................................................................... 49
Chapter 5 Water Treatment Facilities ......................................................................................................... 50
5.1 Facility #1 Details .............................................................................................................................. 50
5.1.1 Tank Properties ......................................................................................................................... 50
5.1.2 Operation Details ....................................................................................................................... 51
5.1.3 Sample Collection ...................................................................................................................... 51
5.2 Facility #2 Details .............................................................................................................................. 52
5.2.1 Tank Properties ......................................................................................................................... 52
5.2.2 Operation Details ....................................................................................................................... 53
5.2.3 Sample Collection ...................................................................................................................... 54
5.3 Stored and Delivered Hypochlorite Measurements .......................................................................... 54
5.3.1 Assumed chlorine application dose ........................................................................................... 54
5.3.2 Measurement at Peak Temperatures ........................................................................................ 55
5.3.3 Chlorate Measurement in Hypochlorite in Conjunction with Measurement in
Finished Water ................................................................................................................................... 57
5.3.4 Comparison Between Samples Collected From the Top and Bottom at Facility 2 ................... 58
5.3.5 Comparison Between Suppliers and the Composition of Hypochlorite ..................................... 60
5.3.5 Comparison Between Hypochlorite Degradation in Both Facilities ........................................... 61
5.4 Comparison to Hypochlorite Assessment Model .............................................................................. 63
Chapter 6 Summary and Conclusions ........................................................................................................ 69
6.1 Pre-treatment procedure .................................................................................................................. 69
6.2 Dilution experiment and comparison to the Hypochlorite Assessment Model ................................. 69

ix
6.3 Water treatment facilities .................................................................................................................. 70
Chapter 7 Recommendations for future research ....................................................................................... 72
Appendix A E-mail conversation with OEHHA representative concerning chlorate notification
and action levels in California ..................................................................................................................... 73
Appendix B Simulation of hypothetical conditions with the use of the Hypochlorite
Assessment Model ...................................................................................................................................... 76
Appendix C Temperatures during field measurements period ................................................................... 82
Appendix D Attempt to measure bromate in hypochlorite .......................................................................... 85
References .................................................................................................................................................. 87
Biographical Information ............................................................................................................................. 90

x
List of Illustrations
Figure 2.1: AWWA Hypochlorite Assessment Model interface ................................................................... 14
Figure 3.1: DPD Hach® kit .......................................................................................................................... 21
Figure 3.2: Hach® hypochlorite titration kit ................................................................................................. 22
Figure 3.3: Hach® hydrogen peroxide test kit ............................................................................................ 23
Figure 3.4: Reaction of hypochlorite with hydrogen peroxide ..................................................................... 23
Figure 3.5: Addition of manganese dioxide................................................................................................. 24
Figure 3.6: Chloride removal cartridges used with vacuum manifold ......................................................... 25
Figure 3.7: Ion chromatograph .................................................................................................................... 26
Figure 4.1: Sample perchlorate calibration curve ....................................................................................... 30
Figure 4.2: Perchlorate chromatogram ....................................................................................................... 31
Figure 4.3: Sample chlorate calibration curve ............................................................................................. 32
Figure 4.4: Chlorate chromatogram ............................................................................................................ 33
Figure 4.5: Hypochlorite solutions degradation as a function of time at 40ºC ............................................ 39
Figure 4.6: Chlorate formation in hypochlorite solutions as a function of time at 40ºC .............................. 40
Figure 4.7: Perchlorate formation in hypochlorite solutions as a function of time at 40ºC ......................... 41
Figure 5.1: Tank dimensions at Facility I .................................................................................................... 50
Figure 5.2: Tank dimensions at Facility II ................................................................................................... 52
Figure 5.3: Comparison of predicted and measured FAC concentrations at Facility II .............................. 65
Figure 5.4: Comparison of predicted and measured chlorate concentrations at Facility II ......................... 65
Figure 5.5: Comparison of predicted and measured FAC concentrations at Facility I
during 10/29-11/7 ........................................................................................................................................ 66
Figure 5.6: Comparison of predicted and measured chlorate concentrations at Facility I
during 10/29-11/7 ........................................................................................................................................ 66
Figure 5.7: Comparison of predicted and measured FAC concentrations at Facility I
during 11/12-11/24 ...................................................................................................................................... 67
Figure 5.8: Comparison of predicted and measured chlorate at Facility I during 11/12-11/24 ................... 67

xi
List of Tables
Table 3.1: Quenching agents ...................................................................................................................... 20
Table 4.1: Concentration vs. response of perchlorate ................................................................................ 29
Table 4.2: Regression analysis performed for perchlorate data using statistical software ......................... 30
Table 4.3: Concentration vs. response of chlorate ..................................................................................... 31
Table 4.4: Regression analysis performed for chlorate data using statistical software .............................. 32
Table 4.5: Regression analysis performed for low concentrations of chlorate ........................................... 34
Table 4.6: Hypochlorite samples spiked with perchlorate ........................................................................... 37
Table 4.7: Hypochlorite samples spiked with chlorate ................................................................................ 37
Table 4.8: Hypochlorite model inputs for the incubation experiment .......................................................... 42
Table 5.1: Chlorine degradation and disinfection by-products formation in hypochlorite storage tanks in
the month of August .................................................................................................................................... 56
Table 5.2: Calculated chlorate concentration in finished water vs. measured concentrations in finished
water ............................................................................................................................................................ 57
Table 5.3: Free chlorine in samples collected from the top and the bottom of the tank ............................. 58
Table 5.4: Comparison between freshly delivered hypochlorite from both suppliers ................................. 60
Table 5.5: Comparison between samples from the storage tanks at both facilities.................................... 62
Table B.1: Hypochlorite model assessment considering initial chlorate concentration of 4 g/L ................. 78
Table B.2: Hypochlorite model assessment considering initial chlorate concentration of 1.5 g/L .............. 79
Table B.3: Hypochlorite model assessment considering addition of new material every 5 days (at the
degree of ¼ of the tank active volume) with initial chlorate concentration of 1.5 g/L ................................. 80
Table C.1: reported high and low ambient temperatures and measured temperatures for Facility II......... 83
Table C.2: reported high and low ambient temperatures and measured temperatures for Facility I.......... 84

1
Chapter 1
Background and Objectives
1.1 Transition from Chlorine Gas to Hypochlorite
Chlorine gas had been used for water disinfection since 1893. In 1974, following the Safe
Drinking Water Act, all the public water supplies in US were required to disinfect water and provide a
chlorine residual. However, chlorine gas can also be a deadly weapon. It was used as a chemical weapon
in World War I, and recently in Iraq. In addition, accidents occurring because of chlorine gas can be very
dangerous. In the US, several accidents associated with chorine gas occurred in last ten years. Due to
these reasons, reducing the usage of chlorine gas became one of the aims of the Homeland Security
Department (DHS). In 2007, the Department initiated Chemical Facility Anti-Terrorism Standards
Program. The program required high-risk facilities to make improvements to decrease the risk, especially
if the treatment plant is located in a highly populated area (DHS 2007, Desing 2008)
As a result, many water treatment facilities have switched to hypochlorite solution as an
alternative to chlorine gas as a secondary disinfectant. Some facilities chose to install an onsite
hypochlorite generation systems (OSG), which typically produce 0.8% hypochlorite solutions, and some
use a high concentration hypochlorite provided by an external supplier, which is typically 10-12.5%. The
focus of the current study was on the high concentration hypochlorite solutions.
Hypochlorite manufacture and quality can vary and it also degrades during storage, thus reducing
chlorine concentration and producing chlorate and perchlorate, that are disinfection by-products. The loss
of the chlorine means that more of the solution needs to be applied to achieve desirable chlorine residual,
therefore longer periods of storage will lead to higher levels of chlorate and perchlorate in drinking water.

2
1.2 Scope of the Study
The interest of the current study was to investigate the storage of hypochlorite in real field
conditions. There is a model in the literature that addresses the storage of hypochlorite, however, there is
relatively little data from real hypochlorite storage systems. Therefore, the focus of the study was
collection of real system information. There was a need to address the issue in Texas specifically and to
gain understanding in processes taking place locally. There could be numerous applications of the study
in addition to usage of hypochlorite for secondary disinfection, and one of them is usage of high strength
hypochlorite for raw lake water application to control biofilm and zebra mussels.
1.3 Research Objectives
The research objectives of this study are:
Investigate real local systems using hypochlorite in water treatment (in Dallas Ft-Worth Metroplex,
Texas), primarily focusing on hypochlorite decomposition, chlorate and perchlorate formation.
Compare chlorate and perchlorate levels against existing and proposed regulations.
Come to a better understanding of real world conditions.
Check how well the Hypochlorite Assessment model predicts the results from local water treatment
facilities.
Test for possible practical ways to decrease the generation of chlorate, such as dilution of high-
strength hypochlorite with softened water produced by an industrial softening system and low
strength on-site generated hypochlorite.
To achieve the objectives of the research, it was first necessary to find an efficient way to quench the
hypochlorite solution and to measure the analytes in ion chromatograph available in the laboratory.

3
Chapter 2
Literature Review
2.1 Hypochlorite Manufacture
2.1.1 Commercial Hypochlorite and its Decomposition
Most of the time, the strength of commercial hypochlorite is defined by the manufacturer using a
trade percent:
2 ( )%
10
gAvailable chlorine as Cl
LTrade
Other terms that can be used:
2 ( )%
10
gAvailable chlorine as Cl
LWeight available chlorinespecific gravity
2
% % ( 1.05)NaOCl
Cl
MWWeight sodium hypochlorite Weight available chlorine
MW
(Odyssey 2012)
Once hypochlorite is added to water, the following reaction occurs:
2NaOCl H O HOCl Na OH
Over time, hypochlorite solution decomposes, forming oxygen, chlorate and perchlorate.
(Snyder 2009)

4
2.1.1.1 Chlorate formation mechanism:
The chlorate formation is a result of a slow reaction of two hypochlorite ions followed by a
relatively fast reaction of the hypochlorite ion with chlorite:
2 ( )OCl OCl ClO Cl slow
2 3 ( )OCl ClO ClO Cl fast
At pH above 11 chlorate formation is a second order reaction:
33 2OCl ClO Cl
2
2[ ]rate k OCl
At pH below 11 chlorate formation is a third order reaction:
32 2 2HOCl OCl ClO H Cl
2[ ] [ ]obsrate k HOCl OCl
(Adam 1994, Adam 1999)
2.1.1.2 Perchlorate formation mechanism:
Perchlorate is formed as a result of hypochlorite ion reaction with chlorate:
3 4OCl ClO ClO Cl
1 1
3[ ] [ ]rate k OCl OCl
(Snyder 2009)

5
2.1.2 Influence of Hypochlorite Manufacture on Chlorate and Oxygen Formation
High strength sodium hypochlorite is typically produced by passing chlorine gas through the
sodium hydroxide solution:
2 22Cl NaOH NaOCl NaCl H O
(Snyder 2009, Odyssey 2012)
Sodium hypochlorite can be produced either in a batch or continuous production. Solutions that
are manufactured in a batch production, will commonly produce high levels of chlorate due to the
challenge in controlling the pH and the temperature in every part of the reactor. Even though the batch
process originated during 1950’s, and is not currently favored, it is still in use to some extent by many
manufacturers to recover as much chlorine gas as possible from a tanker truck. If the pH is allowed to
drop below 10 at any location in the reactor during the production, which can easily happen in a batch
reaction, hypochlorous acid will form and lead to higher chlorate formation. Also, batch productions are
likely to have temperature variations that can lead to high local temperatures, which will accelerate
chlorate formation. Continuous manufacture provides better control over temperature and pH, which
reduces chlorate formation. (Odyssey 2012)
The quality of produced hypochlorite as well as the amount of metals depends on the sodium
hydroxide used in the process. High level of metals will catalyze the breakdown of hypochlorite during
storage to oxygen and chloride:
2 2 ( )OCl OCl O Cl very slow
Usually this reaction is very slow, but it is facilitated by transition metal ions. They serve as a
“catalyst” of the reaction and can facilitate the reaction even at very low concentrations. On the occasion
that oxygen is produced, it can cause problems in pumps and piping, such as “oxygen lock”, which will
result in problems with the flow. (Adam 1994, Odyssey 2012)
The quality of hypochlorite will also depend on the quality of precursors used for its production.

6
2.1.3 Sodium Hydroxide and Chlorine Gas Manufacture
Commercial production of sodium hydroxide and chlorine gas utilizes electrolytic chlor-alkali cells
and includes one of the three main types of processes: mercury cells, diaphragm cells, and membrane
cells.
The overall reaction that takes place in the process:
2 2 22 2 2NaCl H O Cl H NaOH
All the three processes use nearly saturated NaCl brine for the electrolysis reaction.
Chlorine gas is produced at the anode:
22 2Cl Cl e
The reaction at the cathode is unique to each process.
2.1.3.1 Mercury cell
Sodium amalgam is produced at the cathode, then reacted with water in a decomposer, to
produce hydrogen gas and caustic soda solution. Traces of heavy metals and magnesium need to be
removed from the brine. Typically, evaporated salt is used. If mined salt is used it should be highly
purified. The brine in the process must be relatively pure and this results in pure products.
However, due to the environment and safety considerations, this process had become less
popular throughout the years.
Cathode reaction:
x xNa e Hg NaHg
Followed by separation in a decomposer:
2 2( )2 2 2 2x g xNaHg H O NaOH H Hg

7
2.1.3.2 Diaphragm cell
The cathode cell is separated from the anode cell by a permeable, usually asbestos based
diaphragm. Less expensive brine of mined salt can be used. The caustic solution that is produced at the
cathode contains 11%wt sodium hydroxide and 18%wt sodium chloride. Sodium chloride concentration is
reduced to 1% by evaporation and subsequent removal of sodium chloride salt. Chlorine gas contains
oxygen and must be purified.
The reaction at the cathode is:
2 22 2 2H O e H OH
2.1.3.3 Membrane cell
Cathode cell is separated from the anode cell by a cation permeable membrane. Only sodium
ions can pass through the membrane. The lifetime of this membrane depends on the purity of the brine.
The caustic solution needs to be concentrated after it is produced. Similarly to the mercury process,
chloride ions concentration in the caustic solution is relatively low. Chlorine gas contains some oxygen
and needs to be purified. The brine also needs to contain low concentrations of calcium, magnesium,
sulfite, and other divalent ions to avoid their build up on the membrane. To achieve this goal, calcium is
precipitated as calcium carbonate, magnesium and iron as hydroxides. Use of evaporated salt can reduce
the price of brine pre-treatment.
Hydrogen evolves at the cathode:
2 22 2 2H O e H OH
That results in the remaining sodium hydroxide solution.
In conclusion, sodium hydroxide produced in the mercury cell process has the highest purity out
of the three. Membrane cell sodium hydroxide is almost as high in purity as the mercury process. The
diaphragm process provides the lowest purity of the product. However, the diaphragm process also

8
provides the least expensive product. Production of chlorine and sodium hydroxide other than in a
chlor-alkali process exist, though is not as common.
(Schmittinger 2000, Adam 1994)
2.2 Health and Regulatory Aspects
2.2.1 Perchlorate
Perchlorate is an oxygen chlorine compound that consists of four oxygen atoms and one chlorine
atom. In perchlorate ion, chlorine has an oxidation state of +7.
Perchlorate is an endocrine disruptor that inhibits iodide intake by the thyroid, thus reducing the
production of essential thyroid hormones that are also very important for neurodevelopment (Kirk 2006).
Perchlorate is a common contaminant in food and water. It can come from different sources, such as
rocket fuel, fireworks and in Chilean nitrate used for agricultural purposes, where it occurs naturally
(Greer 2002, Snyder 2011, USEPA 2002, USEPA 2011). In addition to other possible sources, usage of
hypochlorite as a disinfectant has a potential of significantly increasing perchlorate levels in drinking
water, depending on its concentration in the hypochlorite.
Even though perchlorate is not yet regulated on the federal level, it is regulated in the states of
Massachusetts and California at the levels of 2 ppb and 6 ppb respectively. The value of the
Massachusetts regulatory limit is based on a reference dose of 0.00003 mg/kg/day, which was derived
from earlier animal toxicological studies. Reference dose of 0.00003 mg/kg/day will translate to the
drinking water equivalent level (DWEL) of 1 µg/L. (USEPA 2002). In setting the MCL of perchlorate to

9
2 µg/L rather than 1 µg/L, the state of Massachusetts was seeking to retain safety for vulnerable
populations, while also considering disinfection benefits. (MassDEP 2006).
Later, based on human toxicology studies (Greer 2002), the new EPA reference dose was
established at 0.0007 mg/kg/day. It would imply a drinking water equivalent of 15 µg/L, calculated for an
average weight of an adult person, which stands at 70kg. (USEPA 2008, USEPA 2011)
In 2004, the Office of Environmental Health Hazard Assessment (OEHHA) recommended to set
the Public Health Goal (PHG) of perchlorate to 6 µg/L, based on the same human toxicology studies
(Greer 2002), but made adjustments to the primary vulnerable population, which was defined as pregnant
women and their fetuses. This value was a basis for perchlorate regulation in the state of California,
which became effective in 2007. In 2012, OEHHA changed the PHG to 1 µg/L, now defining the primary
vulnerable population as infants 0-6 month, with a goal to protect them from any decrease in iodide
uptake by the thyroid as a result of perchlorate exposure (OEHHA 2012). However, California MCL was
not yet changed to the new proposed PHG.
2.2.2 Chlorate
Chlorate is an oxygen chlorine compound that consists of three oxygen atoms and one chlorine atom. In
chlorate ion, chlorine has an oxidation state of +5.
Chlorate is used in agriculture as an herbicide, and as a bleaching agent in the textile and paper
industry. Chlorate is also a disinfection by-product that is introduced into the water during hypochlorite
and chlorine dioxide usage. In addition, chlorate can occur in foods along with chlorine dioxide and

10
chlorite, due to its use in flour treatment, as decolorizing and bleaching agent (Alfredo 2014). Chlorate is
stable in the environment under aerobic conditions, but undergoes decomposition to chloride under
anaerobic conditions (Borodinsky 2011).
Chlorate can be introduced via chlorine dioxide use as an antimicrobial agent in the processing of
poultry, fruits, and vegetables (Borodinsky 2011). It can be also introduced indirectly, through the
disinfection of surfaces and lines in the food industry. Studies also indicate that chlorate entering water
supply as a result of hypochlorite application is equal to or exceeds the amount entering as a result of the
chlorine dioxide application (Gordon 1997).
Intake of high levels of chlorate has resulted in kidney failure and hemolysis (breaking down of
red blood cells) (USEPA 2014b). Animal studies prove that chronic and sub-chronic exposure to chlorate
has an adverse effect on blood and thyroid (McCauley 1995, Hooth 2001, USEPA 2014b).
A study performed in Italy between years 2002-2005 showed that women exposed to chlorate levels
exceeding 200 µg/L in drinking water had an elevated risk of having newborns with obstructive urinary
defects, cleft palate and spina bifida. (Righi 2012)
Chlorate was published in the EPA CCL3 list, and has a health reference limit (HRL) of 210 µg/L
(Alfredo 2014). EPA used a study of chronic exposure of rats to chlorate that was published by the
National Toxicology Program (NTP) in 2005 (NTP 2005) to perform the Benchmark Dose Method (BDM),
which constitutes an alternative to NOAEL approach for risk estimation of non-carcinogenic compounds.
The method involves adapting a mathematical model to the data of the study with a special benchmark
dose software package (Filipsson 2003). BMDL (lower 95% confidence limit of BMD) set by EPA
corresponded to 0.9 mg/kg/day for rats. Afterwards, an uncertainty factor (UF) of 30 is applied. This is a
common uncertainty factor that is applied to account for interspecies and intraspecies differences (usually
10 for interspecies differences and 3 for intraspecies). (Hardy 2009, ATSDR 2008). In this way, 0.03
mg/kg/day exposure limit for humans was derived, which resulted in HRL of 210 µg/L.
Though chlorate is not yet regulated on the national level, the state of California established the
notification level of 800 µg/L, while the proposed action level is 200 µg/L in drinking water, as
11
recommended by OEHHA. This recommendation is primarily established on no observed adverse health
effect (NOAEL) in rats. This value is believed to protect humans from any adverse effects. (OEHHA 2002)
When recommending a proposed action level of 200 µg/L, OEHHA used a Relative Source Contribution
(RSC) factor of 0.2 for drinking water, as follows:
30 / 70 0.2210
2 /
g kg day kg gC
LL day
However, current RSC that is used by the California Department of Public Health (CDPH) is 0.8, resulting
in the notification limit of 800 µg/L:
30 / 70 0.8840
2 /
g kg day kg gC
LL day
(EPA 2014, CEPA 2010, OEHHA 2015)
A complete EPA review of chlorate is expected to be published by the end of 2015, after
consideration of chlorate and other unregulated disinfection by-products (DBP) together with reviewing
currently existing microbial and DBP regulations. (USEPA, 2014). Also, it appears that new monitoring
data has to be collected for a chlorate regulation decision. The existing monitoring data was collected at
the time of the Information Collection Rule, in 1997-98. This data showed that 22/59 facilities using
hypochlorite had chlorate levels that exceed HRL. (Robertson, 2012). Since then, hypochlorite had
become more widely used and therefore reevaluation is required.
2.3 Hypochlorite Decay Model
Several studies were performed in the last two decades that allowed the development of the
Hypochlorite Assessment Model. Currently, the model is available in the American Water Works
Association (AWWA) website and incorporates the prediction of hypochlorite degradation, and chlorate
and perchlorate formation.

12
2.3.1 Hypochlorite Decomposition and Chlorate Formation
Hypochlorite decay model was developed using mainly laboratory data, from which kinetics of the
reactions was inferred. Initially, the model was developed to express hypochlorite decomposition and
chlorate formation (Adam 1994, Adam 1999, Gordon 1997)
As shown earlier, the reaction rate of hypochlorite can be expressed as follows:
]2
2
[[ ]
3
d OClk OCl
dt
The model incorporates numerical calculations and describes the effect of the temperature and ionic
strength on the decomposition of OCl
.
10 5
2log 0.149 log[2.083 10 exp( 1.018 10 / )exp( 56.5 / )k T RT R
- Ionic strength
T – Temperature
2k In the units of 1
secM
Concentrations and temperatures for which the model was developed are reported in the referenced
studies.
(Adam 1999, Adam 1994)
The model was developed using the Eyring equation that describes the variation of chemical
reaction rate with temperature:
10
0log log[2.083 10 exp( / ) exp( / )k T H RT S R ‡ ‡
Plot of 0 1
.kvs
T T allows to determine H ‡
and S‡
.
The observed rate constant includes two independent decomposition pathways of hypochlorite, chlorate
pathway and oxygen pathway.

13
Values of H‡
and S ‡were found for different hypochlorite solutions, and extrapolated to
infinite dilution. Then, the ionic strength term was incorporated and numerical values were set for H‡
and S ‡ at infinite dilution. The agreement between the rate constant in tested solutions had an average
error of 10 percent. As it can be seen, this model is based on a chemical description of the system.
Kinetic information was used to develop chemical and thermodynamic equations that show hypochlorite
break-down in pH 11-14 range. (Adam 1994, Gordon 1997)
The model was confirmed with one field study, where degradation in a storage tank was
measured and compared to the model. The deviation between predicted and measured values was
13-24% (Gordon 1997). Based on these studies, a model software called Bleach 2001 was developed.
2.3.2 Perchlorate Formation
Later, the model was extended to predict perchlorate formation also. (Snyder 2009, Pisarenko
2009). The rate law used is as follows:
51.01 10 10
14
6
10
1
3
0.0788( ) (2.084 10 )RT Rcal
calc
c
dClORate k OCl
log k I log e
d
e
ClOt
T
The agreement between the observed and measured perchlorate concentrations was 10% or better
Perchlorate formation predicted by the model was not compared to real field studies
Based on the study, the model software was upgraded, and currently is available as a tool in the
AWWA website under the name of Hypochlorite Assessment Model.

14
Figure 2.1: AWWA Hypochlorite Assessment Model interface (Copyright AWWA 2011)
2.3.3 Limitations of the Model
Hypochlorite Assessment Model does not take into account the effect of transition metals that
catalyze the breakdown of hypochlorite to chloride and oxygen. The model does not consider transition
metals activity, because their role is complex. It is known that they serve as catalysts in the pathway of
hypochlorite decomposition to oxygen. Decomposition of hypochlorite assignable to the metals depends
15
on their concentrations, joint effect with other transition ions, and the exposure to UV light.
(Gordon 1997, Adam 1994)
2.4 Summary of Factors Affecting Hypochlorite Decomposition
2.4.1 pH – decomposition of hypochlorite and chlorate formation are minimal in the pH range of 11.86-13.
At pH higher than 13 the concentration of hydroxide ion contributes to the ionic strength of the solution. At
pH levels lower than 10.5, the hypochlorous acid mechanism of decomposition, which is a third order
reaction, is still very significant, which results in higher decomposition rates of hypochlorite and chlorate
formation.
2.4.2 Ionic Strength - it had been shown that ionic strength contributes to hypochlorite decomposition.
Increase in ionic strength will reduce the stability of the solution.
2.4.3 Dilution - dilution decreases the decomposition by decreasing the hypochlorite ion concentration
and also by decreasing the ionic strength that contributes to decomposition. The decrease of the
hypochlorite ion concentration by the factor of 2 should slow down the decomposition rate by the factor of
4 (second order reaction), but in fact the decomposition is reduced by more than the factor of 4. It can be
explained by the fact that decrease in hypochlorite concentration also decreases ionic strength, which is
another factor that decreases the decomposition.
2.4.4 Temperature – decomposition rates are derived from Eyring equation, which shows a strong
dependence on the temperature. The higher the temperature, the higher hypochlorite decomposition rate
and as a result, higher chlorate and perchlorate formation.
2.4.5 Effect of Matrix Ions – sulfate and carbonate at concentrations below 1 g/L did not influence
decomposition rates at pH=13. At pH close to 11, presence of carbonate ion actually stabilizes the

16
solution. Chloride - elevated concentrations of chloride ion increase decomposition as a result of increase
in ionic strength.
2.2.6 Transition Metal Ions – facilitate the breakdown to oxygen and chloride as discussed earlier.
(Adam 1994, Gordon 1997)
2.5 Previous Field Studies
Other studies that measured chlorate and perchlorate in water treatment facilities (in addition to
Adam 1994, Gordon 1997, Adam 1999) are as follows:
Assessment of chlorate concentrations in hypochlorite, finished and raw water at 7 different facilities,
including bulk and OSG hypochlorite (Alfredo 2014)
Chlorate, perchlorate and bromate concentrations measured in several OSG and bulk hypochlorite
facilities (Stanford 2011)
Chlorate, perchlorate and bromate concentrations in OSG systems (Stanford 2013)
Most of these studies found elevated chlorate levels (that would exceed HRL) at least in some of
the facilities. Perchlorate levels were elevated occasionally only. Some of these studies also did
laboratory experiments that confirmed degradation of hypochlorite dependence on the temperature and
dilution. Results that were compared to the model showed deviation up to 10% from model prediction.
Studies in Florida showed that the investment in softening equipment and even bigger storage
tanks are almost equivalent to the savings in sodium hypochlorite consumption that will result from its
dilution and lower degradation. (Odyssey 2012)

17
2.6 Analytical Methods
Chlorate has been measured in drinking water with the use of ion chromatography for many
years, and details of the measurement are described in EPA method 300.1 that was published in 1997.
The analysis is done with conductivity detector and carbonate eluent. Perchlorate measurement is
described in EPA method 314 from 1999. This method also uses a conductivity detector, however, using
sodium hydroxide eluent and an appropriate column. Liquid chromatography-mass spectrometry (LCMS)
and ion chromatography-mass spectrometry (ICMS) have been used more recently for chlorate and
perchlorate measurement in drinking water.
Ion chromatography has been used for chlorate measurements in hypochlorite for about two
decades. In the earlier studies, hypochlorite samples were analyzed directly by ion chromatography
(Adam 1999). High dilution ratios have been used in these cases (Adam 1994). Innovate LCMS method
was also developed for measurement of chlorate and perchlorate in hypochlorite (Pisarenko 2009).
However, mass spectroscopy is not always an available or affordable option. Therefore, ion
chromatography with conductivity detector remains the most feasible option for many laboratories.
2.6.1 Quenching Agents
In previous studies, the primary goal of hypochlorite ion removal (quenching) was to stop the
formation of chlorate and perchlorate over time and preserve the sample for further analysis (Pisarenko
2010, Snyder 2009). However, analytical chemistry department advice for the current study was not to
inject strong oxidizing agents with concentrations higher than 10 mg/L directly in ion chromatograph, as
those will significantly reduce the performance of the analytical column by reacting with its components.
Precautions should also be taken with the suppressor as it is also a very sensitive device. It was very
important especially due to the fact that the goal was to measure hypochlorite without any dilution for
perchlorate analysis (if it would be diluted, it would become undetectable due to sensitivity limitations).
Several quenching agents were tested in the past, and it was found that malonic acid is the best
option for LCMS. On the other hand, it was causing peaks that interfere with analytes when used with ion
chromatography and thus was not recommended for it. The most appropriate quenching agent for ion

18
chromatography was found to be hydrogen peroxide (Stanford 2013). The ability of peroxide to quench
chlorine is explained by the fact that the standard reduction potential of H2O2 (E0 = 1.77V) is higher than
of OCl− (E0 = 0.89V) (Liu 2003). However, there are reports of a problematic character of chlorine use for
peroxide removal and vice versa (Liu 2003). This problematic character arises from mutual interference of
those two chemicals in most of the tests.

19
Chapter 3
Materials and Methods
3.1 Materials and Water
Chlorate and perchlorate 1000µg/ml standards were purchased from Sigma Aldrich (analytical grade).
Hydrogen peroxide 30% wt. in water, ACS reagent, was obtained from Sigma Aldrich.
Manganese dioxide (>99%) was also purchased from Sigma Aldrich
Ag On-Guard II and H On-Guard II Cartridges were obtained from Thermo Scientific/Dionex
Water used for eluent and standards preparation: Carbon-Free water, purified using APEC WATER
Reverse Osmosis System coupled with MILLIPORE Milli-Q water system.
3.2 Samples Collection
Hypochlorite samples were collected into HDPE bottles and then directly taken to the laboratory
using ice chest filled with ice and then were stored in refrigerator in the laboratory. In some cases, when
the samples were collected by the plant staff, they were stored in the facility refrigerator before they were
taken to the lab.
3.3 Chlorine and Hydrogen Peroxide Measurement
Measurement of chlorine concentration in hypochlorite was performed by using Hach® digital titrator
and hypochlorite titration kit, Model CN-HR (Hach® 2013)
Hydrogen peroxide concentration was measured with the Hach® hydrogen peroxide kit, Model HYP-1
(Hach® 1991)
Quenched hypochlorite samples were tested with the Hach® DPD colorimetric test (DR-890
Colorimeter), which is intended for residual total chlorine measurements (Method 10070, Hach 2009)

20
3.4 Chloride, pH and Conductivity Measurements for Model Inputs
pH was measured with Accumet AP85 pH meter from Fisher Scientific, equipped with pH probe. The
meter was pre-calibrated with pH standards before each set of measurements.
Chloride concentration was measured by the sensION MM374 from Hach®, equipped with chloride
specific electrode ISE CI-9652C, which was also pre-calibrated before each set of measurements.
There was an attempt of measuring conductivity with Accumet AP85 using a conductivity probe,
which however, was encountered with several problems that require more investigation. Therefore,
conductivity was not used as an input for the model in this case.
3.5 Quenching Agent Selection
Measurement of chlorate and perchlorate in hypochlorite solutions requires pre-treatment of the
sample before the analysis in ion chromatography (IC). The chlorine needs to be removed prior to the
measurement as it is damaging to IC columns. Quenching agents tested in the current study are
presented in Table 3.1.
Table 3.1: Quenching agents
Quenching agent Quenching ability Interferences in the IC
Hydrogen peroxide Good Not detected
Acetic acid Poor Moderate
Malonic acid Good High
Methanosulfonic acid Good High
Conclusion: hydrogen peroxide as a quenching agent is the most appropriate solution for the
analytical system used in the study – IC with conductivity detection.

21
However, several problems arose with peroxide quenching:
Hydrogen peroxide is unstable over time and therefore its concentration decreases over time.
Hydrogen peroxide and chlorine are mutual interferences in their measurements.
High hydrogen peroxide residuals have the same harming effects on the system components as
chlorine.
Nearly impossible to determine whether hydrogen peroxide was under dosed or overdosed during the
reaction.
Out of ten reactions with the same sample and the same amounts of hydrogen peroxide added, only
about one gave a final result of less than 10 mg/L in the DPD Hach® test.
Figure 3.1: DPD Hach® kit
The solution was to overdose the hydrogen peroxide and then catalytically remove the residual
with small amount of manganese dioxide. Manganese dioxide has been used for the removal of excess
hydrogen peroxide remaining after the reaction in previous studies, but not in an application of chlorine
removal (Shelor 2011, Shelor 2012)

22
3.6 Quenching Procedure
The quenching procedure was done in the following manner:
1. Hypochlorite solution concentration is measured by Hach® digital titration kit, Model CN-HR
Figure 3.2: Hach® hypochlorite titration kit
2. Hydrogen peroxide solution concentration is measured by Hach® hydrogen peroxide titration kit,
Model HYP-1.
Hydrogen peroxide concentration does not have to be checked each time if it is stored in
refrigerator. However, it would be a good practice to check it from time to time, at least once in a
month. The concentrated hydrogen peroxide needs to be diluted by a factor of 10,000 prior to titration
to achieve the suitable range for the test, because this test is intended for low peroxide concentrations.
This was achieved by adding 5 µL with a 10 µL pipet into a 50ml volumetric flask and dilution with
milli-q water.

23
Figure 3.3: Hach® hydrogen peroxide test kit
3. 10ml of the hypochlorite solution are placed in a 50ml beaker with a small magnetic stirrer
4. Hydrogen peroxide 30% wt. is added carefully in portions of 100 µL using 100 µL pipet. It is continued
to be added to reach about 20% excess to the calculated amount, based on measured concentrations
of hypochlorite and peroxide solutions. The reaction is vigorous and exothermic.
Figure 3.4: Reaction of hypochlorite with hydrogen peroxide: left-initial hypochlorite solution; middle-
vigorous reaction with hydrogen peroxide that is added; right-clear solution after the reaction is over

24
If the hypochlorite samples that are tested have similar chlorine concentration, it is possible to
skip the calculation step. The overdose can also be done visually by watching the reaction. Reaction
of hydrogen peroxide with hypochlorite is vigorous, therefore when no more bubbles are noticed after
addition of subsequent 100 µL peroxide, the reaction is over.
5. A small amount of manganese dioxide powder is added (about 1.5 mg for 10ml sample), as it removes
the residual hydrogen peroxide. It is set on slow mixing overnight.
Figure 3.5: Addition of manganese dioxide
6. The contents of the beaker are transferred into a 10 mL volumetric flask and the volume is completed
to the 10 ml mark, as some of the sample evaporates during the procedure. Prior to addition of the
deionized water to the volumetric flask, it is used to wash the residual sample out of the reaction
beaker.
7. If chloride concentrations in the sample are too high, On Guard II Ag and H cartridges can be used for
its removal. However, in case of high chlorate concentration, 1:100 dilution is needed. Therefore,
chloride peak does not interfere with chlorate peak. In a case of lower dilution ratios, it would be
recommended to use the cartridges prior to the measurement in the ion chromatograph.

25
Figure 3.6: Chloride removal cartridges used with vacuum manifold
8. All the samples are filtered using 0.45µm syringe filter
3.7 Qualification and Quantification of the Analytes
Samples were analyzed using the following analytical system:
DX500 Ion Chromatograph
CD25 Conductivity Detector
AS23 Analytical Column
AG23 Guard Column
ESRS 500 Suppressor
Sample Loop: 25 µL
Eluent: Carbonate

26
External standards were used for the qualification and quantification of the analytes. Each set that
was analyzed contained at least five calibration points at the appropriate concentration ranges. In
addition, a standard was injected between about each 10 samples of the same set. Most of the samples
were prepared and ran in triplicates.
Figure 3.7: Ion chromatograph
Even though AS23 column and carbonate eluent are not intended for perchlorate measurement in
water, it was possible to measure perchlorate in hypochlorite samples, due to relatively high
concentrations. Samples measured for perchlorate were not diluted or passed through the cartridges, but

27
analyzed following the quenching procedure. It was possible to detect perchlorate down to 0.25 ppm level
in the treated hypochlorite samples, which was sufficient to meet the goals of the study.
3.8 Calibration Curves
Construction of calibration curve is usually done by injecting the known concentrations of
standard solutions of the relevant compounds, and collecting the response that each concentration
caused in the chromatograph. Typically, at least 5 points should be present to construct a calibration
curve. Then, the concentration is plotted against the response and the linear regression line is fitted. The
higher the linearity of the curve, the better precision can be achieved in the measurement. Afterwards,
samples with unknown concentration are tested, and the concentration is found from the equation of the
calibration curve. It is important that the concentrations of the samples stay within the calibration curve
limits since the extrapolation can bring a large error. If the concentrations fall outside of the calibration
curve, dilution should be done (for high concentrations) or new calibration curve constructed for the
required concentration range.
Two main possibilities for construction of the calibration curve are:
I. Forcing the y-intercept to zero
II. Letting the regression model to have a non-zero y-intercept
Though both of these methods are widely used, Dylan et al gives some guidelines for making a
decision which method to choose. For making the decision, the Standard Error of y-intercept (SEy) should
be found. It can be found using the regression function in any statistical software. The following will apply:
0
y
y
y intercept SE b y intercept value
if y intercept SE
if
b
The proper choice of the method will reduce the error associated with the regression model.
(Dylan 2009a)

28
3.9 Limit of Detection (LOD)
LOD is the smallest concentration of the analyte at which it can be confidently stated that the
analyte is present.
Three main methods exist to determine the LOD:
I. Visual evaluation
Visual evaluation is not a quantitative technique, and is based on the visual confidence of the analyst
that the peak is present.
II. Signal-to-noise relation
Value of signal to noise (S/N) = 3 is usually used to determine LOD. This technique is also subject to
analyst bias, due to manual measurement of the signal and the noise levels.
III. Standard deviation of the response and the slope
This technique relies on the overall performance of the calibration curve:
3.3
'
'
:
: y
L
x variable slope
estimat
ODS
y S
S
ed b E
The third method of standard deviation of the response and the slope seems to be the preferred
method according to the author. (Dylan 2009b)

29
Chapter 4
Laboratory Results
4.1 Calibration Curves
For preparation of each calibration curve, at least five points were used in an appropriate range,
as mentioned earlier. To decide whether to set the intercept as zero for the calibration curve, the strategy
recommended by Dylan et al. was performed, as described earlier.
4.1.1 Perchlorate
Table 4.1: Concentration vs. response of perchlorate
Concentration[ppm] Response (peak area)
[µS*t]
1 0.067
2.5 0.1437
5 0.2897
7.5 0.4385
10 0.5972
25 1.5155
50 3.1733
75 4.8858
100 6.3591

30
Table 4.2: Regression analysis performed for perchlorate data using statistical software (Sigma Plot 12.5)
From the data given in Table X:
0.5248
0.3300
0.5248 0.3300 0.5248
y
y
y intercept
SE
y intercept SE b y intercept value
b
Figure 4.1: Sample perchlorate calibration curve
y = 15.528x + 0.5248R² = 0.9996
0
20
40
60
80
100
120
0 1 2 3 4 5 6 7
C[p
pm
]
Peak area
Perchlorate calibration curve

31
Figure 4.2: Perchlorate chromatogram
Retention time for perchlorate – 38min
4.1.2 Chlorate
Table 4.3: Concentration vs. response of chlorate
Concentration[ppm] Response (peak area)
[µS*t]
10 0.7976
25 2.0871
50 4.3934
75 6.7011
100 9.2529

32
Table 4.4: Regression analysis performed for chlorate data using statistical software
2.4688
0.9308
2.4688 0.9308 2.4688
y
y
y intercept
SE
y intercept SE b y intercept value
b
Figure 4.3: Sample chlorate calibration curve
y = 10.66x + 2.4688R² = 0.9993
0
20
40
60
80
100
120
0 1 2 3 4 5 6 7 8 9 10
C[p
pm
]
Peak area
Chlorate calibration curve

33
Figure 4.4: Chlorate chromatogram
Retention time for chlorate – 7.9min
In a similar manner, appropriate calibration curves were developed for other concentration
ranges. For the majority of the curves, b could not be set at zero.
For the low chlorate concentrations calibration curve, which was intended for the measurement of
the compound in finished water, the conditions for setting intercept as zero applied, as shown in
Table 4.5.

34
Table 4.5: Regression analysis performed for low concentrations of chlorate
0.0072
0.0095
0
0.0072 0.0095 0
y
y
y intercept
SE
y intercept SE b
b
Calibration curves for both chlorate and perchlorate had correlation coefficients (R2) higher
than 0.99. There was a slight difference between the regression equations at each run, but they stayed
relatively close to each other. In addition, during the run of a set, a standard was injected in approximately
each 10 samples (in accordance with EPA method 300.1). The deviation between peak areas of
standards in the same set stayed within 5%.
4.2 Limit of Detection
As explained earlier, there are several methods for finding the limit of detection. Analytical
chemistry experts at UTA have advised two of these methods: the visual evaluation and the standard
deviation of the response and the slope. As a result, it was decided to check both and select the
conservative result.

35
4.2.1 Perchlorate
Standard deviation of the response and the slope method:
3.3 3.3 0.33000.07
' 15.529
' :
: y
LOD ppmS
S x variable slope
estimated by SE
The values were taken from Table 4.2 for perchlorate regression analysis.
Visual evaluation:
Visual evaluation showed that the lowest concentration at which perchlorate peak could be recognized
with the current system capability was 0.25ppm.
Therefore, 0.25ppm was the LOD value for perchlorate
4.2.2 Chlorate
For the calibration curve intended for the measurement of chlorate in hypochlorite solutions
(relatively high concentrations):
Standard deviation of the response and the slope method:
3.3 3.3 0.93080.288
' 10.66LOD ppm
S
The values were taken from Table 4.4
Visual evaluation:
Visual evaluation showed that the lowest concentration at which chlorate peak could be recognized
with the current system capability was 0.03ppm.

36
Therefore, 0.3ppm (0.288ppm rounded up) was the LOD value for chlorate, when detecting its
concentrations in hypochlorite solutions.
For calibration curve intended for measurement of chlorate in water (relatively low concentrations):
3.3 3.3 0.00950.0023
' 13.597LOD ppm
S
However, as mentioned, visual evaluation can recognize chlorate peak only at 0.03ppm.
Therefore, LOD for chlorate detection in water was 0.03ppm.
4.3 Spiking Experiments
Hypochlorite samples were spiked with standards to check the recoveries of the process and to
validate the whole method. The results of the tests for perchlorate and chlorate recoveries from the
spiked samples are presented in Tables 4.6 and 4.7. The samples were spiked with three different
concentrations, in triplicates for each sample. As can be seen in these tables, spike recoveries were
above 90%. These are very acceptable results and it was concluded that the method could be used in a
subsequent testing of chlorate and perchlorate in hypochlorite samples from the field. Spike recoveries
were calculated using the following formula, which accounts for volume corrections (needed when the
volume of the added standard is significant):
. . % 100
.
spiked sample conc measured sample conc volume fractionrecovery
standard added conc volume fraction

37
Table 4.6: Hypochlorite samples spiked with perchlorate
Perchlorate (ppm)
not spiked spiked 1 spiked 2 spiked 3
Duplicate 1 Not detectable 4.974 9.921 23.24
Duplicate 2 Not detectable 4.918 9.887 23.44
Duplicate 3 Not detectable 4.814 9.045 23.42
Average 4.902 9.617 23.37
SD 0.081 0.496 0.111
Average % recovery 98.0% 96.2% 93.5%
%RSD 1.66 5.16 0.48
Table 4.7: Hypochlorite samples spiked with chlorate (after dilution)
Chlorate (ppm)
not spiked spiked 1 spiked 2 spiked 3
Duplicate 1 35.56 38.42 40.29 50.07
Duplicate 2 35.89 38.77 42.53 53.35
Duplicate 3 35.36 38.23 40.94 50.29
Average 35.60 38.48 41.25 51.24
SD 0.268 0.274 1.152 1.837
Average % recovery 93.1 92.1 98.1
%RSD 0.75 0.71 2.79 3.59

38
4.4 Incubation Experiment
4.4.1. Description and Results
Two practical ways for diluting high strength hypochlorite were tested and then compared to the
Hypochlorite Assessment Model: dilution with softened water and low strength hypochlorite. Both
solutions used for dilution were collected from an OSG water treatment plant. While it is more likely that
softened water will be used for dilution, low strength hypochlorite was also tested to see if it yields better
results. The use of low strength hypochlorite for dilution is possible only for plants that produce OSG
hypochlorite, but desire to store bulk hypochlorite for emergency purposes. Therefore, the intention was
to check the possibility of a bulk hypochlorite dilution with OSG hypochlorite for such a facility.
A sample of high strength was collected from a delivery truck at one of the facilities that uses high
strength hypochlorite. Two samples were collected from a facility that is generating on-site low strength
hypochlorite (0.8%) for the purposes of dilution. The facility generates low strength hypochlorite using a
water softening system for the purpose of brine preparation. Both low strength hypochlorite (0.8%) and
softened water were collected.
Hypochlorite samples at different dilution ratios were incubated to check the impact of dilution on
the stored material. Five samples at different dilution ratios were incubated at temperature of 40ºC for 63
days:
100% High strength hypochlorite
50% High strength hypochlorite + 50% Softened water
50% High strength hypochlorite + 50% Low strength hypochlorite
25% High strength hypochlorite + 75% Softened water
25% High strength hypochlorite + 75% Low strength hypochlorite
Samples were placed into 2L HDPE bottles, and every 7 days a 100ml sample was collected
from each bottle. All the samples were analyzed for chlorine and chlorate. High strength and some of the
medium strength samples were analyzed for perchlorate.

39
It should be noted that in this experiment the samples were not analyzed in triplicates for chlorate
and perchlorate due to the vast number of samples and laboratory limitations, and because the primary
goal of this experiment was to determine the trends rather than exact concentrations. Due to this reason,
standard deviation could not be calculated and added to the graphs.
Total chlorine measurements were done in triplicates. However, these measurements were done
with the DPD Hach® kit because at that stage of the experiment, the digital titrator and cartridges were
not available. The use of the DPD kit required very high dilutions (x 20,000), which can introduce an error
into the results, especially when dealing with low concentrations. This could be a possible reason for
several points with deviation from the trend, especially in the four fold dilution. Results from various
dilution experiments are presented in Figures 4.5-4.7.
Figure 4.5: Hypochlorite solutions degradation as a function of time at 40ºC
It can be seen that the undiluted sample starts with relatively high chlorine concentration, and after 60
days degrades to about 1/3 of initial chlorine concentration. The degradation is much slower for solutions
0
20000
40000
60000
80000
100000
120000
0 7 14 21 28 35 42 49 56 63 70
Fre
e A
vaila
ble
Ch
lori
ne
(m
g/L)
Days
Hypochlorite solution degradation as a function of time and initial concentration at 40°C
100% High conc. NaOCl
50% High conc. NaOCl + 50% LowConc NaOCl (0.8%)
50% High conc. NaOCl + 50%Softened Water
25% High conc. NaOCl + 75% LowConc NaOCl (0.8%)
25% High conc. NaOCl + 75%Softened Water

40
that were diluted with 1:1 dilution ratio, and slows down even more for solutions with 2:1 dilution ratio.
This means that at high temperatures the decrease in chlorine strength will be higher for higher strength
hypochlorite solutions, a fact that corresponds to the previous studies. Also, no significant difference can
be seen in samples diluted with low strength hypochlorite (0.8%) and samples diluted with softened water
at the same ratios.
Figure 4.6: Chlorate formation in hypochlorite solutions as a function of time at 40ºC
Similarly to hypochlorite degradation, chlorate formation is much higher in high strength solutions. There
is an about 30 fold increase in the chlorate concentration in the high strength solution relatively to the
initial chlorate concentration. Chlorate formation slows down significantly at 1:1 dilution ratio, and even
more at 2:1 dilution. Samples diluted with low strength hypochlorite (0.8%) and samples diluted with
softened water at the same ratios have similar chlorate formation trends.
0
5
10
15
20
25
30
0 7 14 21 28 35 42 49 56 63 70
Ch
lora
te (
g/L)
Days
Chlorate formation in hypochlorite solution as a function of time and initial concentration at 40°C
100% High conc. NaOCl
50% High conc. NaOCl + 50% LowConc NaOCl (0.8%)
50% High conc. NaOCl + 50%Softened Water
25% High conc. NaOCl + 75% LowConc NaOCl (0.8%)
25% High conc. NaOCl + 75%Softened Water

41
Figure 4.7: Perchlorate formation in hypochlorite solutions as a function of time at 40ºC
The formation of perchlorate in the high strength sample was compared to a sample diluted with softened
water at 1:1 dilution ratio. Perchlorate comparison was limited to these two samples due to laboratory
constraints. However, these two samples are sufficient to show that there is a significant decrease in
perchlorate formation even at 1:1 dilution ratio.
0.00
5.00
10.00
15.00
20.00
25.00
30.00
35.00
40.00
0 7 14 21 28 35 42 49 56 63 70
Pe
rch
lora
te (
pp
m)
Days
Perchlorate formation in hypochlorite solution as a function of time and initial concentration at 40°C
100% High conc. NaOCl
50% High conc. NaOCl + 50%Softened Water

42
4.4.2 Comparison to the Model
Incubation results were compared to the Hypochlorite Assessment Model available in AWWA
website. Model calculations are based on predictive algorithms derived from earlier research on the
subject and user-defined inputs, such as storage conditions. Other inputs that define the initial solution
are recommended, such as pH, chloride concentration, conductivity and the initial chlorate and
perchlorate concentrations. If some of the values are not inputted, model defaults will be used. However,
the initial chlorine concentration and temperature are required inputs. Comparison of hypochlorite
degradation and chlorate formation in each of the experiments to the model is shown in Figures 4.8-4.17.
In this experiment, chlorine, temperature, pH, chloride, chlorate concentrations were inputted.
Inputs for each of the five initial samples are summarized in the following table:
Table 4.8: Hypochlorite model inputs for the incubation experiment
Description
100% High
strength
hypochlorite
50% High
strength + 50%
Low strength
50% High
strength + 50%
softened water
25% High
strength + 75%
Low strength
25% High
strength +
75% softened
water
Chlorine [g/L] 112.0
60.0
54.67
36.0
26.67
Temperature 40ºC 40ºC 40ºC 40ºC 40ºC
Chlorate [g/L] 0.906
0.578
0.412
0.452
0.155
pH 12.75
12.49
12.46 12.12 12.12
Chloride[M]
[mol/L]
1.60
0.7941
0.6971
0.4292
0.2923

43
4.4.2.1 - 100% High strength hypochlorite
Figure 4.8: Hypochlorite degradation in concentrated hypochlorite incubated at 40ºC
Figure 4.9: Chlorate formation in concentrated hypochlorite incubated at 40ºC
0.000
20.000
40.000
60.000
80.000
100.000
120.000
140.000
0 7 14 21 28 35 42 49 56 63 70
Fre
e A
vaila
ble
Ch
lori
ne
(g/
L)
Days
Hypochlorite degradation: measured vs. modelConcentrated NaOCl
100% Conc. NaOCl
100% Model
0.000
5.000
10.000
15.000
20.000
25.000
30.000
35.000
0 7 14 21 28 35 42 49 56 63 70
Ch
lora
te (
g/L)
Days
Chlorate: measured vs. modelConcentrated NaOCl
100% Conc. NaOCl
Model

44
4.4.2.2 - 50% High strength hypochlorite + 50% Softened water
Figure 4.10: Hypochlorite degradation in high strength hypochlorite diluted 1:1 with softened water (used
for OSG hypochlorite production), incubated at 40ºC
Figure 4.11: Chlorate formation in high strength hypochlorite diluted 1:1 with softened water (used for
OSG hypochlorite production), incubated at 40ºC
0.000
10.000
20.000
30.000
40.000
50.000
60.000
70.000
0 7 14 21 28 35 42 49 56 63 70
Free
Ava
ilab
le C
hlo
rin
e (g
/L)
Days
Hypochlorite degradation measured vs. model50% Conc. NaOCl + 50% Softened water
50% Conc. NaOCl + 50%Softened water
Model
0.0000
1.0000
2.0000
3.0000
4.0000
5.0000
6.0000
7.0000
8.0000
9.0000
0 7 14 21 28 35 42 49 56 63 70
Ch
lora
te (
g/L)
Days
Chlorate measured vs. model50% Conc. NaOCl + 50% Softened water
50% Conc. NaOCl + 50%Softened water
Model

45
4.4.2.3 - 50% High strength hypochlorite + 50% Low strength hypochlorite
Figure 4.12: Hypochlorite degradation high strength hypochlorite diluted 1:1 with low strength (OSG) hypochlorite incubated at 40ºC
Figure 4.13: Chlorate formation in high strength hypochlorite diluted 1:1 with low strength (OSG)
hypochlorite incubated at 40ºC
0.000
10.000
20.000
30.000
40.000
50.000
60.000
70.000
0 7 14 21 28 35 42 49 56 63 70
Free
Ava
ilab
le C
hlo
rin
e (g
/L)
Days
Hypochlorite degradation measured vs. model50% Conc NaOCl+ 50% Low Conc NaOCl
50% Conc NaOCl + 50% LowConc NaOCl
Model
0.0000
2.0000
4.0000
6.0000
8.0000
10.0000
12.0000
0 7 14 21 28 35 42 49 56 63 70
Ch
lora
te (
g/L)
Days
Chlorate measured vs. model50% Conc NaOCl+ 50% Low Conc NaOCl
50% Conc NaOCl+ 50% LowConc NaOClModel

46
4.4.2.4 - 25% High strength hypochlorite + 75% Softened water
Figure 4.14: Hypochlorite degradation in high strength hypochlorite diluted 2:1 with softened water (used
for OSG hypochlorite production), incubated at 40ºC
Figure 4.15: Chlorate formation in high strength hypochlorite diluted 2:1 with softened water (used for
OSG hypochlorite production), incubated at 40ºC
0.000
5.000
10.000
15.000
20.000
25.000
30.000
35.000
0 7 14 21 28 35 42 49 56 63 70
Fre
e a
vaila
ble
ch
lori
ne
Ch
lori
ne
(g/
L)
Days
Hypochlorite degradation measured vs. model25% Conc. NaOCl + 75% Softened water
25% NaOCl + 75%Softened water
Model
0.000
0.500
1.000
1.500
2.000
2.500
0 7 14 21 28 35 42 49 56 63 70
Ch
lora
te (
g/L)
Days
Chlorate measured vs. model25% Conc. NaOCl + 75% Softened water
25% Conc NaOCl + 75%Softened water
Model

47
The deviation from the model is within 10% for most of the data points for all the four experiments.
Some of the points have higher deviation, which can be attributed to experimental error that can be more
significant because incubation measurements were not done in triplicates (as a result of experiment
constraints). The main goal of the experiment was to see the degradation trend in different concentrations
of hypochlorite.
4.4.2.5 - 25% High strength hypochlorite + 75% Low strength hypochlorite
Figure 4.16: Hypochlorite degradation in high strength hypochlorite diluted 2:1 with low strength (OSG)
hypochlorite incubated at 40ºC
0.000
5.000
10.000
15.000
20.000
25.000
30.000
35.000
40.000
45.000
0 7 14 21 28 35 42 49 56 63 70
Fre
e A
vaila
ble
ch
lori
ne
(g/
L)
Days
Hypochlorite degradation measured vs. model25% Conc. NaOCl + 75% Low Conc NaOCl
25% Conc NaOCl + 75%Low Conc NaOCl
Model

48
Figure 4.17: Chlorate formation in high strength hypochlorite diluted 2:1 with low strength (OSG)
hypochlorite incubated at 40ºC
25% High strength hypochlorite + 75% Low strength hypochlorite experiment has the highest
deviation from the model out of the five experiments. As can be seen in Figure 4.16, hypochlorite
degradation seems to be higher than predicted. On the other side, as shown in Figure 4.17, chlorate
formation is slower than predicted. Deviation from the model can be attributed to various factors:
Low strength hypochlorite constitutes 75% of the solution and the model is not designed for on-site
generated hypochlorite due to the pH range (the model is designed for pH 11-13). Even though that
after the mixing with 25% of high strength hypochlorite the pH was in a range suitable for the model
(12.12), it is possible that some elements in the low strength hypochlorite are slowing down the
formation of chlorate. On the other hand, trace metals, for example, could cause higher hypochlorite
degradation via oxygen pathway, without an increase in the formation of chlorate.
No attempts in the literature to dilute high strength hypochlorite with low strength hypochlorite were
found. Therefore, the outcome of such a dilution is not completely predicted.
0.000
0.500
1.000
1.500
2.000
2.500
3.000
3.500
4.000
0 7 14 21 28 35 42 49 56 63 70
Ch
lora
te (
g/L)
Days
Chlorate measured vs. model25% Conc. NaOCl + 75% Low Conc NaOCl
25% Conc NaOCl+ 75% LowConc NaOClModel

49
4.4.2.6 - Conclusions from comparison to the model
1. For high strength hypochlorite, the incubation experiment data lays within 10% deviation from the
Hypochlorite Assessment Model prediction. Therefore, the model can be considered as reliable for
prediction of hypochlorite behavior at constant temperatures and the experiment can proceed to
the next stage – comparison of real field data to the model prediction.
2. Most of the data in the incubation experiment was within 10% deviation from the Hypochlorite
Assessment Model prediction, both for hypochlorite degradation and chlorate formation (except
the solution that contained 75% of low strength hypochlorite). These results are satisfactory for the
purpose of the experiment and show in an unambiguous way that the model can show the
difference in degradation for various dilution ratios of hypochlorite. This will help with the
assessment of the dilution impact in field storage conditions.
3. The data for the solution that contained 75% low strength hypochlorite (and 25% high strength
hypochlorite) deviates from the model at a degree exceeding 10%. There could be various
possible reasons for that, however, the exact cause is not known. In order to make a conclusion,
reproducibility of the experiment has to be checked by repeating the experiment and comparing to
the model again.

50
Chapter 5
Water Treatment Facilities
5.1 Facility #1 Details
5.1.1 Tank Properties
The hypochlorite storage tank at Facility I is made of fiberglass-reinforced plastic (FRP), with
sidewall thickness of 0.210" and bottom thickness of 0.271". Hypochlorite height level can be measured
up to about 14.5ft, however, maximum operating height is 14ft. If hypochlorite reaches a level higher than
the maximum operating height, the “high” alarm will sound. The facility is equipped with two identical
tanks.
Figure 5.1: Tank dimensions at Facility I

51
5.1.2 Operation Details
Hypochlorite deliveries are usually received in 10 days to 2 weeks periods.
Hypochlorite is used as an only disinfectant at the facility, e.g. for contact time (CT) and for chorine
residual. The facility switched from chlorine gas to hypochlorite about 10 years ago.
The tanks are usually refilled once they reach about 3ft. One truck load will add about 3ft more to
each tank. Next delivery is received once the operating tanks level (about 6ft) is emptied by half.
This facility receives hypochlorite from Supplier I at a declared 10% (trade percent) available chlorine.
Deliveries are usually made in the early mornings, at about 7am. Typically, the truck is filled a night
before the delivery.
There is a constant outflow from the tank. However, comparing to the size of the tank, it can be
considered negligible (it will take a very long time to empty the tank) for the purposes of degradation
measurements.
Hypochlorite is pulled from 6’’ above the bottom point
Hypochlorite flow rate: ~1000ml/min
Hypochlorite is pulled out of both tanks simultaneously or from one tank at a time, depending on the
operating personnel decision.
Peristaltic pumps are used for supplying the hypochlorite from the tank to the application point.
Because the deliveries are not very frequent, most of the time this tank is operating close to a batch
mode.
5.1.3 Sample Collection
The tank samples were collected from the pipeline that comes out of the tank, right after the
pump. The truck samples were collected from the pipe that is used for filling the tank. No possibility of
collecting from the top of the tank or truck was available.

52
5.2 Facility #2 Details
5.2.1 Tank Properties
The hypochlorite storage tank at the Facility II is made out of concrete, with wall thickness of 1’3”, and
inner Teflon lining 4mm thick. Maximum operating height in the tank is 13ft. The tank has a square door
at the top that can be opened by the operator, and is also equipped with a venting pipe at the top. The
facility is equipped with two identical tanks.
Figure 5.2: Tank dimensions at Facility II

53
5.2.2 Operation Details
The “dead volume” is 3ft (the level in the tank has to be above 3ft for proper pumping). However, the
goal is to keep the tank level around 6ft.
The deliveries are usually received every other day (during the week) or at an interval of two days.
Each truckload adds 1ft to hypochlorite level in the tank.
This facility receives hypochlorite from Supplier II at the declared 12.5% (trade percent) available
chlorine.
Hypochlorite is used as a secondary disinfectant, only for chlorine residual, while ozone is the primary
disinfectant at the facility. The facility switched from chlorine gas to ozone and hypochlorite about two
years ago.
Hypochlorite flow rate: ~1.5gal/min
Deliveries can be done either during the first part of the day (anytime between 5am to noon) or
afternoon (1pm to 5pm). If the delivery is in the afternoon, the truck is filled in the morning. For
morning deliveries it was not confirmed when the truck is filled. However, it is reasonable to assume
that it is filled a night before, similar to Facility I. The tank filling line is equipped with a filter for solids.
Only one of the two tanks was filled with hypochlorite and was in use at the time of the experiment.
Gear pumps are used for supplying the hypochlorite from the tank to the application point.
This facility can operate in a three modes:
1. Regular mode - operates in a manner that hypochlorite deliveries are ordered at the frequent
(relatively constant) intervals, in order to keep hypochlorite level at the tank constant. Therefore, at
the regular operation mode, the tank can be considered close to a CSTR (Continuously Stirred Tank
Reactor).
2. Unexpected delay in deliveries mode - it happens that due to various reasons (such as truck that
broke on the way) there might be no delivery for a period of time. At the periods when there are no
deliveries, the tank can be considered close to a batch reactor, similar to Facility I.

54
3. Very frequent deliveries mode - when the period of no deliveries is over, the facility will receive very
frequent deliveries to bring the tank to the desired level. At the times of very frequent deliveries,
neither batch nor CSTR can be considered.
5.2.3 Sample Collection
Most of the tank samples were collected from the pipeline that comes out of the tank, right after
the pump. Some samples (for comparison) were collected from the top of the tank through the top door,
with the help of small bottle connected to a wire that was dipped into the tank. The truck samples were
collected from the top of the truck, to avoid collecting crystallized material that might be in the filling pipe
of the truck (offered by the driver).
5.3 Stored and Delivered Hypochlorite Measurements
5.3.1 Assumed chlorine application dose
Chlorine application dosage was assumed to be 5mg/L based on the data from the water
treatment facilities. Facility I targets chlorine residual of about 3.5 mg/L leaving the plant, and 1.0-1.5mg/L
goes toward chlorine demand at the plant. That brings the total chlorine application dose to about 5mg/L.
Facility II targets a chlorine residual of 3.90 mg/L at the exit from the plant, and 1.10 mg/L is consumed
for chlorine demand. That also brings the total chlorine application dose to 5mg/L. Based on the previous
experience of the facilities, the targeted residual at the exit from the plants is required to keep the
chloramine residual in the distribution system above 0.5mg/L, as required by Texas Commission of
Environmental Quality (TCEQ 2007).

55
5.3.2 Measurement at Peak Temperatures
Samples from both facilities were measured in the month of August, a time when the
temperatures usually reach the highest point. On average, in August 2014, for the Dallas Fort-Worth area,
the high and the low temperatures were 34ºC and 24ºC respectively. Theoretical chlorate and perchlorate
concentrations in drinking water were calculated based on the hypochlorite strength and the application of
5mg chlorine for a liter of water. At that point of study, no water samples were collected from the plants.
Later, some of the hypochlorite samples were collected in conjunction with finished water samples.
However, this was done during the months of September-November, when the temperatures are not as
high. Table 5.1 presents the results from August 2014.
Expected chlorate concentration was calculated as follows:
[ / ]
[ / ]
Chlorate mghypochlorite
hypochlor
LExpected chlorate
FAC mg LApplication
ie
tedos
Expected perchlorate concentration was calculated in a similar way.

56
Table 5.1: Chlorine degradation and disinfection by-products formation in hypochlorite storage tanks in
the month of August
Facility Description Chlorine Chlorate Perchlorate
Facility I
Delivered 108 g/L 947ppm <250ppb
Tank 96 g/L 6476ppm 486ppb
Percent
degradation/increase 11% 584% >94%
Concentration in
water assuming
5mg/L FAC
5mg/L 338ppb* 0.025ppb**
Facility II
Delivered 133 g/L 1315ppm <250ppb
Tank 106 g/L 9900ppm 3237ppb
Percent
degradation/increase 21% 653% >1195%
Concentration in
water assuming
5mg/L FAC
5mg/L 467ppb* 0.153ppb**
* California proposed action level for chlorate: 200ppb
** Currently regulated at MCL of 2ppb and 6ppb in Massachusetts and California respectively
Based on the results from the tank and the truck samples from August and considering chlorine
dose of 5 mg/L, chlorate concentrations in the tanks are high enough that it would probably cause the
concentrations in water to exceed the proposed action level.
Despite perchlorate concentrations rising during the storage, residual concentrations in finished
water would probably be below the typical standards and therefore seem to be not of a concern.

57
5.3.3 Chlorate Measurement in Hypochlorite in Conjunction with Measurement in Finished Water
Table 5.2 presents calculated chlorate concentrations in finished water, based on the chlorine
dosage of 5mg/L compared to measured concentrations in finished water. Water samples were collected
right after the hypochlorite samples collection. However, the actual residence time can be up to a day
before the concentration in finished water can be changed accordingly to the hypochlorite concentration.
This fact can cause some deviations between the expected and measured concentrations. In addition,
there was no possibility to collect raw water samples, because it would require the shut down of the
system (in one of the facilities). Therefore, it was assumed that the concentration of chlorate in raw water
is negligible in comparison to its increase in finished water as a result of hypochlorite application.
Table 5.2: Calculated chlorate concentration in finished water vs. measured concentrations in finished
water.
Facility Date Chlorate measured [ppm] Chlorate expected [ppm]
Facility I
9.29.14 0.203 0.287
11.24.14 0.094 0.115
Facility II
9.26.14 0.468 0.536
10.13.14 0.740 0.744
10.20.14 0.340 0.360
10.22.14 0.361 0.377
10.27.14 0.442 0.451

58
It can be clearly seen from Table 5.2 that in most of the cases, the expected chlorate
concentrations are close to the measured concentrations. Therefore, chlorate concentration in water can
be assessed with reasonable accuracy by its measurement in hypochlorite and calculation based on free
chlorine concentration and application dosage.
The differences between measured and expected concentrations can also be attributed to the
fact that the amount of applied chlorine is sometimes a little less than 5mg/L, depending on the amount
needed to achieve the desired residual.
5.3.4 Comparison Between Samples Collected From the Top and Bottom at Facility 2
To confirm the well-mixing assumption, several samples were collected from the bottom and the
top of the tank at Facility II. There was no possibility to collect samples from the top of the tank at
Facility I.
Chlorine measurements were done by titration in duplicates, as shown in the following table:
Table 5.3: Free chlorine in samples collected from the top and the bottom of the tank
Date Location in
tank
Measurement 1
Chlorine [g/L]
Measurement 2
Chlorine [g/L]
Average
Chlorine [g/L]
10.13.14
noon
Bottom 99.5 99 99.2
Top 98.5 99 98.8
10.13.14
evening
Bottom 103.5 103 103.3
Top 97.5 97 97.3
10.15.14 Bottom 107.5 108.5 108
Top 107.3 109 108.1
10.17.14 Bottom 112 114 113
Top 112 113 112.5
Results presented in Table 5.3 confirm that the tanks can be considered well mixed for the
purposes of the study. In other words, no significant difference was found between the samples collected

59
from the top of the tank and from the bottom. The only exception can be the measurement that was done
on 10.13.14 evening, which can be attributed to the fact that the sample was collected shortly after a
delivery of the new material, and there was not enough time for the tank to reach good mixing.

60
5.3.5 Comparison Between Suppliers and the Composition of Hypochlorite
Most of the field samples were pre-treated and analyzed in triplicates.
Table 5.4: Comparison between freshly delivered hypochlorite from both suppliers
Facility Date
Chlorine (FAC) Chlorate
Average
concentration
[g/L]
%RSD
Average
concentration
[ppm]
%RSD
Supplier I
5.16.14 110.7±6.1* 5.5% 1202±24 2%
8.1.14 108.1±1.7 1.5% 947** N/A
9.29.14 108.6±0.6 0.6% 1555±34 2.2%
11.7.14 123.7±1.0 0.8% 1412±14 1.0%
11.24.14 125.0±0.9 0.7% 808±16 1.9%
Supplier I range 108-125 N/A 808-1555 N/A
Mean 115.2 1185
Supplier II
8.8.14 133.3±2.3 1.7% 1315** N/A
9.25.14 134.9±2.3 1.7% 1571±35 2.2%
10.13.14 125.3±0.4 0.3% 4899±9 0.18
10.15.14 129.0±1.4 1.1% 2985±74 2.5%
10.17.14 137.0±2.1 1.5% 1410±12 0.82%
Supplier II range 125-137 N/A 1315-4899 N/A
Mean 131.9 2436
%RSD – relative standard deviation
*Total chlorine was tested using Hach® DPD kit for this sample
**These samples were not done in triplicates, therefore SD could not be calculated

61
From the data presented in Table 5.4, it can be seen that chlorate concentrations in hypochlorite
from Supplier II are generally higher than in hypochlorite from Supplier I. The difference can possibly be
attributed to the processes of hypochlorite production and the quality of reactants used by the different
suppliers.
Alterations in chlorate concentrations from the same supplier could also be attributed to the
production process (there might be variation in the process conditions, especially if it is a batch process)
and reactants. In addition to the process, the difference can be contributed by variations in storage times
in the delivery truck, e.g. the time between the filling of the truck with hypochlorite and the delivery. For
example, if the truck was loaded before the weekend and delivered only after the weekend, it could be
exposed to high temperatures without proper isolation. It can cause degradation of hypochlorite and
excessive formation of chlorate. The two highest values of chlorate in both suppliers support this
assumption: both deliveries with the highest values were done on Monday: 10/13/14 and 9/29/14.
According to Odyssey Manufacturing (Odyssey 2012), delivered bleach typically has a limit of
1500ppm chlorate. Most of the Supplier I measured values stay below 1500ppm. However, this is not the
case with Supplier II, which has several measurement significantly exceeding 1500ppm.
5.3.5 Comparison Between Hypochlorite Degradation in Both Facilities
It is known that at the higher levels of chlorine in the hypochlorite solutions, hypochlorite
degradation rate increases (2nd order), and chlorate formation too. It would be expected that a solution
with a higher percent of hypochlorite would degrade faster. However, the operation of the facility is also a
very meaningful factor. Comparison between samples collected from the tanks at both facilities is shown
in Table 5.5.
Most of the field samples were pre-treated and analyzed in triplicates.

62
Table 5.5: Comparison between samples from the storage tanks at both facilities
Facility Date/Description
Chlorine (FAC) Chlorate
Average
concentration
[g/L]
%RSD
Average
concentration
[ppm]
%RSD
Facility I
5.16.14
Tank before delivery 102.4±8.4* 8.2% 4652±131 2.8%
8.1.14
Before delivery 95.8±0.4 0.5% 6476**
8.1.14
After delivery 103.2±0.6 0.6% 3276**
9.29.14
Before delivery 97.5±1.0 1.0% 5596±35 0.63%
10.29.14
After delivery 118.2±1.5 1.3% 2503±28 1.1%
11.3.14 114.5±3.0 2.6% 2827±31 1.1%
11.7.14
Before delivery 114.7±4.2 3.6% 3426±54 1.6%
11.12.14 116.7±2.1 1.8% 2529±42 1.6%
11.17.14 117.3±2.0 1.7% 2633±22 0.8%
11.24.14 117.3±1.8 1.5% 2690±59 2.2%
Facility I range 95-118 2503-6476
Mean 109.8 3792
Facility II
8.8.14 105.9±0.9 0.9% 9900**
9.26.14 103.8±0.7 0.6% 11120±56 0.51%
10.13.14 99.2±0.3 0.3% 14763±210 1.4%
10.20.14 124.5±0.0 0% 8965±91 1.0%
10.22.14 124.5±0.5 0.4% 9390±91 0.97%
10.24.14 122.0±1.0 0.8% 10034±81 0.81%
10.27.14 120.0±1.3 1.1% 10832±180 1.7%
10.29.14 117.3±1.0 0.9% 12311±548 4.5%
11.10.14 105.8±0.3 0.3% 13025±370 2.8%
Facility II range 99-125 8965-14763
Mean 113.7 11149
*Total chlorine was tested using Hach® DPD kit for this sample
**These samples were not done in triplicates, therefore SD could not be calculated

63
From the data presented in Table 5.5, it can be clearly seen that chlorate levels in Facility II are
much higher than in Facility I. There are several possible reasons that can contribute to that:
1. Facility II stores higher strength hypochlorite, which degrades faster
2. There is a higher chlorate concentration in the material delivered to Facility II
3. Concrete has a two-orders higher thermal conductivity than fiberglass
4. Relatively long residence times of hypochlorite in the Facility II tank can contribute to the higher
degradation ratios
5.4 Comparison to Hypochlorite Assessment Model
Field results that were collected in between the deliveries were compared to the results that the
model would predict. In such periods storage tanks could be considered “batch reactors”. In Facility II it
was possible only at the period before the plant shuts down for winter, because there were no deliveries
of the new material at this time. The real field data collected at the beginning of such periods was entered
into the assessment software as an initial condition. Temperatures of the samples and the ambient
temperatures at the time of the collection were recorded.
To make the comparison to the model possible, storage temperatures had to be approximated. In
the real world, outside temperatures are constantly changing. Temperatures in the tank will change
accordingly, but at a much slower rate than the outside temperatures, depending, among other factors, on
the thermal conductivity of the tank. Radiation is also a component that will influence the heating rate
(e.g. If the tank is exposed to the sun, the heating of its contents will be faster). Another factor is the
volume of the tank and level of solution in it (and the thermal conductivity of the solution itself). However,
measurement of all these factors would require big resources. As a result, simplified approximation was
required.
Initially, the average season temperatures were calculated using the “weather underground”
(http://www.wunderground.com/history) website. However, no agreement between those temperatures

64
and the sample temperatures was found. Therefore, it seemed that taking an average of the sample
temperatures in different periods would be a better approximation.
Tables C.1 and C.2 in Appendix C summarize the temperatures during the measurement period.
Figures 5.5-5.10 present the field results compared to the model. Facility II data is shown first because
the measurements were done at a higher temperatures: middle of October to beginning of November.
Facility I is shown next because the measurements were done during the month of November, when the
temperatures were much lower.

65
Figure 5.3: Comparison of predicted and measured FAC concentrations at Facility II
Figure 5.4: Comparison of predicted and measured chlorate concentrations at Facility II
60
70
80
90
100
110
120
130
140
150
0 7 14 21
FAC
(g/
L)
Days
FAC Facility II data vs. model
Tank 10/20-11/10 FAC
Model FAC
0.000
2.000
4.000
6.000
8.000
10.000
12.000
14.000
0 7 14 21
Ch
lora
te (
g/L)
Days
Chlorate Facility II data vs. model
Tank 10/20-11/10 Chlorate
Model Chlorate
Tave=25°C Tave=19°C

66
Figure 5.5: Comparison of predicted and measured FAC concentrations at Facility I during 10/29-11/7
Figure 5.6: Comparison of predicted and measured chlorate concentrations at Facility I during 10/29-11/7
60
70
80
90
100
110
120
130
140
0 3 6 9
FAC
(g/
L)
Days
FAC Facility I data vs. model
Tank 10/29-11/7 FAC
Model FAC
0.000
0.500
1.000
1.500
2.000
2.500
3.000
3.500
4.000
0 3 6 9
Ch
lora
te (
g/L)
Days
Chlorate Facility I data vs. model
Tank 10/29-11/7 Chlorate
Model Chlorate
Tave=21°C Tave=17°C

67
Figure 5.7: Comparison of predicted and measured FAC concentrations at Facility I during 11/12-11/24
Figure 5.8: Comparison of predicted and measured chlorate at Facility I during 11/12-11/24
60
70
80
90
100
110
120
130
140
0 3 6 9 12
FAC
(g/
L)
Days
FAC Facility I data vs. model
Tank 11/12-11/24 FAC
Model FAC
0.000
0.500
1.000
1.500
2.000
2.500
3.000
3.500
0 3 6 9 12
Ch
lora
te (
g/L)
Days
Chlorate Facility I data vs. model
Tank 11/12-11/24 Chlorate
Model Chlorate
Tave=9°C

68
As can be seen from the comparison to the model, most of the data is within 10% variation from
the values predicted by the model. Some of the points have larger deviation, yet it is still a reasonably
good fit considering the simplifying assumptions for the storage temperatures. The comparison shows
that the degradation trend for the real storage conditions can be approximated by the model prediction.
However, as mentioned earlier, the model is limited to the periods in between the deliveries only. Also,
knowing the solution temperatures over a period of time might be challenging. In addition, as mentioned
earlier, the model does not take into account quality of hypochlorite, such as suspended solids and
transition metals content.

69
Chapter 6
Summary and Conclusions
Many water treatment plants are abandoning chlorine gas and switching over to hypochlorite due
to the safety concerns. Therefore, there is more need in assessment of hypochlorite degradation and by-
products formation. Some facilities that consider hypochlorite as an alternative desire to know possible
adverse effects before the transition, such as in the case of the current study. To estimate the effect of
such a transition in Texas conditions, two water treatment plants that use bulk hypochlorite were studied.
Samples were collected and measured for the chlorine and chlorate levels, and some of them were
measured for perchlorate. However, in order to measure chlorate and perchlorate there was a need to
develop a reliable procedure for the sample pre-treatment that would be suitable for the ion
chromatograph that the laboratory is equipped with. The main conclusions of this study are summarized
below.
6.1 Pre-treatment procedure
Pre-treatment procedure with hydrogen peroxide and manganese dioxide allows a slight overdose of
hydrogen peroxide and subsequent removal of the residual without changing the concentration of the
analytes
The procedure gives consistent and reproducible results
6.2 Dilution experiment and comparison to the Hypochlorite Assessment Model
No significant differences in hypochlorite and chlorate can be seen in samples diluted with low
strength hypochlorite and samples diluted with softened water at the same ratios
Hypochlorite degradation, chlorate and perchlorate formation were significantly slower in the diluted
solutions, which is in agreement to the previous work
There is a significant decrease in perchlorate formation even with a dilution of 1:1

70
There was a good agreement of the data with the Hypochlorite Assessment Model (only solution that
contained 75% low strength hypochlorite and 25% high strength hypochlorite deviated from the model
for over 10%)
6.3 Water treatment facilities
Concentrations in the storage tank can be considered uniform for the purpose of the study (no high
deviations in chlorine levels were found between the top and bottom of the tank)
In the month of August:
- The degradation of the hypochlorite solution was found to be 10-20% comparing to new delivered
material
- Considering a chlorine dose of 5 mg/L, chlorate concentrations in the tanks at both facilities would
probably cause the concentrations in water to exceed the health reference limit of 210ppb
- Perchlorate levels at both facilities seem to be not of a concern considering current regulation
The chlorate concentration in finished water can be estimated with reasonable accuracy based on its
concentration in storage tanks
Chlorate levels in supplied hypochlorite can vary. One of the two suppliers had chlorate levels below
the recommended level of 1500ppm, while another supplier sometimes had chlorate levels two times
higher than 1500ppm
Chlorate levels at Facility II were much higher than at Facility I, which could be the result of higher
chlorate concentrations in the supplied material and also of the way the facility is operating.
Chlorine content from both suppliers was equal or higher than a declared trade percent
Not much difference was seen in chlorine content between the two facilities, even though hypochlorite
delivered to Facility II has a higher strength
Chlorate levels in the storage tanks increase as a function of time in the periods between the
deliveries, whereas chlorine levels decrease as a function of storage time
Comparison of the field data to the model:

71
- Ambient air temperatures cannot be considered representative of the hypochlorite temperature
inside the tank
- Most of the field data was within 10% deviation of the values predicted by the model. Therefore,
real storage conditions can be approximated by model prediction

72
Chapter 7
Recommendations for future research
The recommendations for future research are as follows:
Develop a framework for understanding the impacts of the residual storage volume (a volume that is
never drained) and the frequency of deliveries on chlorine decay, chlorine use and chlorate
production. The goal is to help make future design decisions concerning the extent of residual storage
volume needed. This includes the use of the model for prediction of various scenarios of the residual
volume and frequency of deliveries. Preliminary part of this work is shown in Appendix B.
Measure bromate concentrations in hypochlorite produced by local suppliers and its concentrations in
storage tanks
Measure chlorate in local facilities that use OSG systems
Test how well the Hypochlorite Assessment Model predicts perchlorate formation for real field data

73
Appendix A
E-mail conversation with OEHHA representative concerning
chlorate notification and action levels in California

74

75

76
Appendix B
Simulation of hypothetical conditions with the use of the
Hypochlorite Assessment Model

77
For the model simulation, trade percent of 12.5% available chlorine was considered.
Initial chlorate concentrations that were considered are 1.5g/L and 4 g/L. 1.5 g/L is a reasonable value
based on the data from both plants (this value is slightly higher than average for Supplier I and close to
lower values of Supplier II) and 4g/L as an average of the two highest values from Supplier II.
In addition, the dilution factors of 2:1 and 4:1 were considered for each scenario. It is assumed that the
dilutions were done with softened water that does not contain analytes.
Scenarios 1 and 2 show the situation in the tank if no new material is added for a period of 30 days. In
scenario 3, however, addition of new material on a regular basis is considered. In this case, the
assumption was that ¼ of the tank is used at the end of each 5 days and then there is a delivery of new
material that fills up ¼ of the tank volume to bring it to the initial volume. The value of 5 days was
considered as it is an intermediate value between the two facilities (one facility receives deliveries every
10-14 days and another one every 1-2 days). Initial concentration was chosen as 125g/L chlorine and
1.5g/L chlorate. The assumption is that the newly delivered material has the same concentration each
time, which is equal to the initial concentration.
In all the cases, the temperature of 30ºC was chosen as an average between the high and the low
temperatures during the month of August in Dallas Fort-Worth Metroplex.
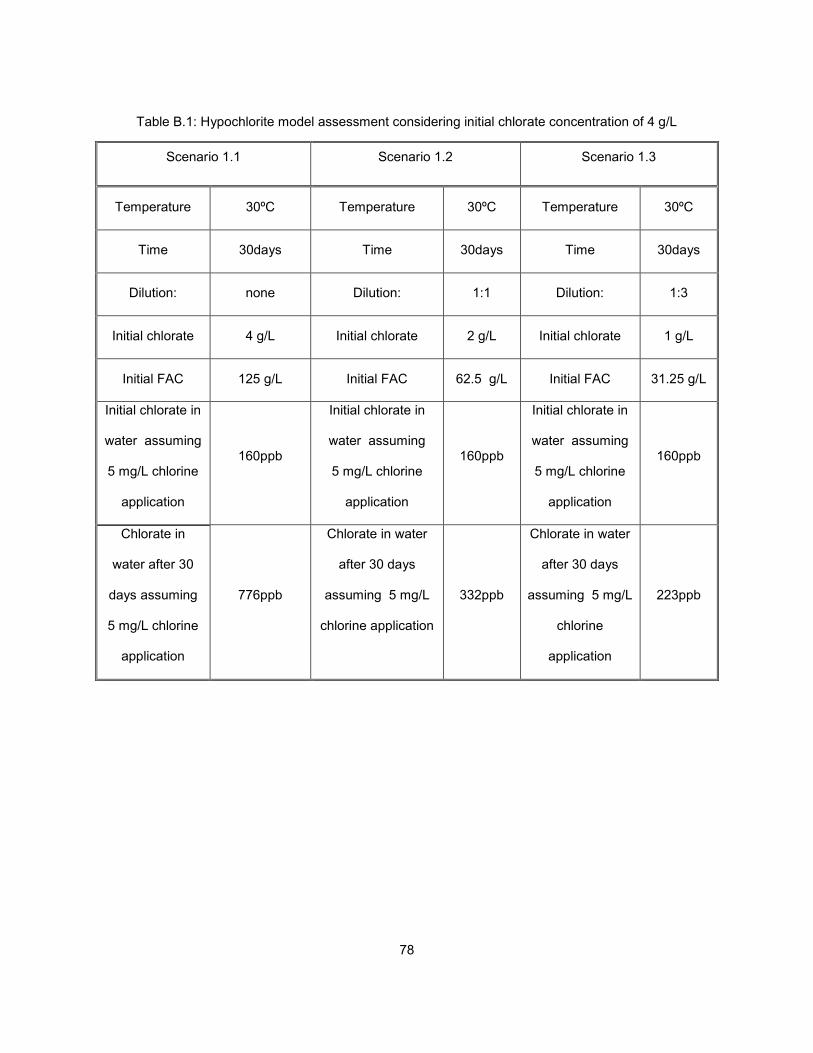
78
Table B.1: Hypochlorite model assessment considering initial chlorate concentration of 4 g/L
Scenario 1.1 Scenario 1.2 Scenario 1.3
Temperature 30ºC Temperature 30ºC Temperature 30ºC
Time 30days Time 30days Time 30days
Dilution: none Dilution: 1:1 Dilution: 1:3
Initial chlorate 4 g/L Initial chlorate 2 g/L Initial chlorate 1 g/L
Initial FAC 125 g/L Initial FAC 62.5 g/L Initial FAC 31.25 g/L
Initial chlorate in
water assuming
5 mg/L chlorine
application
160ppb
Initial chlorate in
water assuming
5 mg/L chlorine
application
160ppb
Initial chlorate in
water assuming
5 mg/L chlorine
application
160ppb
Chlorate in
water after 30
days assuming
5 mg/L chlorine
application
776ppb
Chlorate in water
after 30 days
assuming 5 mg/L
chlorine application
332ppb
Chlorate in water
after 30 days
assuming 5 mg/L
chlorine
application
223ppb

79
Table B.2: Hypochlorite model assessment considering initial chlorate concentration of 1.5 g/L
Scenario 2.1 Scenario 2.2 Scenario 2.3
Temperature 30ºC Temperature 30ºC Temperature 30ºC
Time 30 days Time 30 days Time 30 days
Dilution: none Dilution: 1:1 Dilution: 1:3
Initial chlorate 1.5 g/L Initial chlorate 0.75 g/L Initial chlorate 0.375 g/L
Initial FAC 125 g/L Initial FAC 62.5 g/L Initial FAC 31.25 g/L
Initial chlorate in
water assuming
5 mg/L chlorine
application
60 ppb
Initial chlorate in
water assuming 5
mg/L chlorine
application
60 ppb
Initial chlorate in
water assuming
5 mg/L chlorine
application
60 ppb
Chlorate in
water after 10
days assuming
5 mg/L chlorine
application
255 ppb
Chlorate in water
after 10 days
assuming 5 mg/L
chlorine application
87 ppb
Chlorate in water
after 10 days
assuming 5
mg/L chlorine
application
70 ppb
Chlorate in
water after 30
days assuming
5 mg/L chlorine
application
646 ppb
Chlorate in water
after 30 days
assuming 5 mg/L
chlorine application
220 ppb
Chlorate in water
after 30 days
assuming 5
mg/L chlorine
application
119 ppb

80
Table B.3: Hypochlorite model assessment considering addition of new material every 5 days (at the
degree of ¼ of the tank active volume) with initial chlorate concentration of 1.5 g/L
From Tables B.1-B.3, the following can be concluded:
1. As seen in Table B.1, material delivered with 4g/L chlorate will result in 160ppb in water even if fed
directly, a value that is not far from HRL of 210 ppb.
2. For hypochlorite delivered with 1.5 g/L of initial chlorate and stored for 30 days, fourfold dilution will
keep the level of chlorate below 200ppb for 30 days. Without the dilution, chlorate levels will exceed
Scenario 3.1 Scenario 3.2 Scenario 3.3
Temperature 30ºC Temperature 30ºC Temperature 30ºC
Time 30 days Time 30 days Time 30 days
Dilution: none Dilution: 1:1 Dilution: 1:3
Initial chlorate 1.5 g/L Initial chlorate 0.75 g/L Initial chlorate 0.375 g/L
Initial FAC 125 g/L Initial FAC 62.5 g/L Initial FAC 31.25 g/L
Initial chlorate in
water assuming
5 mg/L chlorine
application
60 ppb
Initial chlorate in
water assuming
5 mg/L chlorine
application
60 ppb
Initial chlorate in
water assuming
5 mg/L chlorine
application
60 ppb
Chlorate in water
after 30 days
assuming 5 mg/L
chlorine
application
351 ppb
Chlorate in water
after 30 days
assuming 5 mg/L
chlorine
application
146 ppb
Chlorate in water
after 30 days
assuming
5 mg/L chlorine
application
92 ppb
Chlorate in water
after 40 days
assuming 5 mg/L
chlorine
application
370 ppb
Chlorate in water
after 40 days
assuming 5 mg/L
chlorine
application
N/A
Chlorate in water
after 40 days
assuming 5
mg/L chlorine
application
N/A

81
HRL after 10 days. In addition to the impact of the direct chlorate increase in hypochlorite, it is
important to note that due to the degradation of hypochlorite, dilution factor required to achieve
application of 5 mg/L of chlorine to water is reduced (larger volume of hypochlorite is needed),
therefore chlorate levels in water will increase according to this factor.
3. From comparison of results in Tables B.2 and B.3 it is obvious that the addition of the new material on
a regular basis will yield lower chlorate levels than storing for 30 days without addition of fresh
material.
4. Storing hypochlorite only for emergencies has disadvantages and is likely to be a problem.
5. For Scenario 3.1, the system will reach a steady state after about 40 days, e.g. change in chlorine
and chlorate concentrations will be less than 1% between the deliveries.
6. More simulations with different scenarios are needed for making conclusions.

82
Appendix C
Temperatures during field measurements period

83
Table C.1: reported high and low ambient temperatures and measured temperatures for Facility II
Date High[C] Low[C] Taverage[C] Tsample[C] Tambient[C] Tsample_average[C]
(used for the model)
10/20/2014 27.8 15.6 21.7
26.5 24
25
10/21/2014 27.8 15.6
10/22/2014 27.8 16.7 22.8
25.8
10/23/2014 27.8 18.9
10/24/2014 30.0 16.7
24.5
25 16.7
10/25/2014 32.2 17.8
10/26/2014 31.7 18.9
10/27/2014 30.0 18.9 23.3
25.4
10/28/2014 26.7 17.8
10/29/2014 25.6 12.2
15.6
20.9
10/30/2014 26.7 12.8
19
10/31/2014 20.0 10.0
11/1/2014 17.2 3.9
11/2/2014 20.6 8.9
11/3/2014 23.9 13.9
11/4/2014 22.2 11.7
11/5/2014 13.9 10.6
11/6/2014 22.2 7.8
11/7/2014 21.1 7.2
11/8/2014 22.2 10.0
11/9/2014 23.9 6.1
11/10/2014 27.2 12.8 16.7 20
*Dates of samples collection are highlighted

84
Table 0.2: reported high and low ambient temperatures and measured temperatures for Facility I
Date High[C] Low[C] Taverage[C] Tsample[C] Tambient[C] Tsample_average[C]
(for the period)
10/29/2014 25.0 13.9
15.7
24 21.5
21
10/30/2014 26.1 13.9
10/31/2014 18.9 10.6
11/1/2014 16.7 5.0
11/2/2014 20.0 7.2
11/3/2014 23.9 12.8
15.6
18 16
17
11/4/2014 21.1 12.2
11/5/2014 13.9 11.1
11/6/2014 22.2 7.2
11/7/2014 20.0 6.1 16 8
11/12/2014 3.9 0.0
2.2
11.7 3.3
9
11/13/2014 3.9 -1.1
11/14/2014 3.9 -2.2
11/15/2014 7.2 3.9
11/16/2014 5.0 -2.2
11/17/2014 6.7 -3.3
11.7
6.1 0.6
9
11/18/2014 12.8 -2.2
11/19/2014 17.8 3.9
11/20/2014 21.7 5.6
11/21/2014 20.0 15.0
11/22/2014 17.2 13.9
11/23/2014 25.0 10.0
11/24/2014 15.6 5.6 11 6
*Dates of samples collection are highlighted

85
Appendix D
Attempt to measure bromate in hypochlorite

86
At the beginning of the study, there was an attempt to measure bromate in hypochlorite samples.
However, no consistent results were reached due to the interference of bromate peak with chlorite peak
at high chlorite concentrations, which are present in hypochlorite especially during the summer months.
Though chlorite peak was not confirmed with a standard, based on the previous studies chlorite is the
cause of such an interference and mass spectroscopy would provide the proper separation (DeBorba
2012, Pisarenko 2009, Stanford 2013).

87
References
Adam, L.C., 1994. An investigation of the factors involved in the decomposition of sodium hypochlorite,
PhD. Dissertation, Miami University, Oxford, OH.
Adam, L.C., Gordon, G., 1999. Hypochlorite Ion Decomposition: Effects of Temperature, Ionic Strength,
and Chloride Ion, Inorganic Chemistry, 38:1299-1304.
Agency for Toxic Substances and Disease Registry, 2008. Toxicological Profiles, Dichloropropenes,
Regulations and Advisories, September 2008, http://www.atsdr.cdc.gov/toxprofiles/tp40-c8.pdf
Alfredo, K., Adams, C., Eaton, A., Roberson, J.A., Stanford, B., 2014. The Potential Regulatory
Implications of Chlorate, AWWA.
AWWA, Hypochlorite Assessment Model, 2011. Available on AWWA website:
http://www.awwa.org/resources-tools/water-and-wastewater-utility-management/hypochlorite-
assessment-model
Borodinsky L., 2011. Environmental Assessment, Report by Keller and Heckman LLP., FDA.
http://www.fda.gov/downloads/Food/FoodIngredientsPackaging/FEnvironmentalDecisions/UCM3
00059.pdf
California Environmental Protection Agency (CEPA), 2014. Perchlorate in Drinking Water,
http://www.waterboards.ca.gov/drinking_water/certlic/drinkingwater/Perchlorate.shtml.
California Environmental Protection Agency (CEPA), 2010. Drinking Water Notification Levels: an
Overview.
DeBorba, B; Rohrer, J., 2012. Determination of Trace Concentrations of Chlorite, Bromate, and Chlorate
in Bottled Natural Mineral Waters, Thermo Fisher Scientific, Sunnyvale, CA, USA.
Desing, B; Kinshella, P; Dewhist, S., 2008. Chlorine gas: balancing public health and security. AWWA
Webcast.
Department of Homeland Security (DHS), 2007. Rules and Regulations, Federal Register, 72:223: 65396-
65435.
Dolan, J.W., 2009. Calibration Curves, Part I: To b or Not to b, LCGC, March 1.
Dolan, J.W. 2009. Calibration Curves, Part II: What are the Limits, LCGC, April 1.
Filipsson AF1, Sand S, Nilsson J, Victorin K., 2003. The benchmark dose method-review of available
models, and recommendations for application in health risk assessment. Critical Reviews in
Toxicology, 33(5):505-42.
Greer, M.A; Goodman, G; Pleus, R.C.; Greer, S.E., 2002. Health Effects Assessment for Environmental
Perchlorate Contamination: The Dose Response for Inhibition of Thyiroidal Radioiodine Uptake
in Humans. Environmental Health Perspectives, 110:9:927-937.
Gordon, G.; Adam L.C.; Bubnis, B.P.; Kuo, C. Cushing, R.S.; Sakaji, R., 1997. Predicting liquid bleach
decomposition, Journal AWWA, 89:4.

88
Hach®, 1991. Hydrogen peroxide test kit manual, Model HYP-1.
Hach®, 2009. DR/890 Colorimeter Procedures Manual.
Hach®, 2013. Digital titrator manual, Model 16900.
Hardy ML , Banasik M, Stedeford T., 2009. Toxicology and human health assessment of
decabromodiphenyl ether. Critical Reviews in Toxicology, Nov;39 Suppl 3:1-44.
Hooth, M.J., A.B. DeAngelo, M.H. George, Gaillard, E.T., Travlos, G.S., Boorman, G.A., Wolf, D.C., 2001.
Subchronic sodium chlorate exposure in drinking water results in a concentration-dependent
increase in rat thyroid follicular cell hyperplasia, Toxicologic Pathology, 29(2):250–259.
Kirk, A.B., 2006. Environmental Perchlorate: Why it matters. Analytica Chimica Acta, 567:4-12.
Liu, W.; Andrews, S.A.; Stefan, M.I.; Bolton, J.R., 2003. Optimal methods for quenching H2O2 residuals
prior to UFC testing. Water Research, 37:3697-3703.
Massachusetts Department of Environmental Protection, 2006. MassDEP Final Perchlorate Regulations,
Response to Comments.
McCauley, P.T., M. Robinson, F.B. Daniel, Olson, G.R., 1995. The effects of subchronic chlorate
exposure in Sprague-Dawley rats. Drug and Chemical Toxicology, 18(2–3):185–199.
National Toxicology Program (NTP), 2005. NTP Technical Report on the Toxicology and Carcinogenesis
Studies of Sodium Chlorate (CAS No. 7775–09–9) in Rats and Mice (Drinking Water
Studies). NTP TR 517 NIH Publication No. 06–4457 National Institutes of Health, Public Health
Service, U.S. Department of Health and Human Services. December, 2005.
Odyssey Manufacturing Co., Sodium Hypochlorite – General Information for the Consumer, Revised,
2012. www.odysseymanufacturing.com
Office of Environmental Health Hazard Assessment (OEHHA), 2002. Proposed Action Level for Chlorate.
OEHHA, 2012. Draft of Public Health Goal for Perchlorate in drinking water.
OEHHA, e-mail conversation with OEHHA representative, Feb 2015, attached in Appendix A
Pisarenko, A.N., 2009. Analytical measurements and predictions of perchlorate ion concentration in
sodium hypochlorite solutions and drinking water: kinetics of perchlorate ion formation and
effects of associated contaminants, PhD. Dissertation, Miami University, Oxford, OH.
Pisarenko, A.N.; Stanford, B.D.; Quinones, O.; Pacey, G.E.; Gordon, G.; Snyder, S.A., 2010. Rapid
analysis of perchlorate, chlorate and bromate ions in concentrated sodium hypochlorite
solutions. Analytica Chimica Acta, 659:1-2:216.
Righi E., Bechtold P., Tortorici D., Lauriola P., Calzolari, E., Astolfi, G., Nieuwenhuijsen M.J., Fantuzzi, G.,
Aggazzotti, G., 2012. Trihalomethanes, chlorite, chlorate in drinking water and risk of congenital
anomalies: A population based case-control study in Northern Italy. Environmental Research,
116: 66–73.
Robertson, J.A., 2012. Informing regulatory decisions using national occurrence data. Journal AWWA,
104:3:E194-E203.

89
Schmittinger, P. Chlorine: principles and industrial practice, Weinheim: Wiley-VCH, 2000, p. 19-106, 171
Shelor, C.P.; Campbell, C.A.; Kroll, M.; Dasgupta, P.K.; Smith, T.L.; Abdalla, A.; Hamilton, M.;
Muhammad, T.W., 2011. Fenton Digestion of milk for iodinalysis. Analytical Chemistry, 83:8300-
8307.
Shelor, C.P.; Kirk, A.B.; Dasgupta, P.K.; Kroll, M.; Campbell, C.A.; Choudhary, P. K., 2012. Breastfed
Infants Metabolize Perchlorate. Environmental Science and Technology, 46:5151−5159.
Snyder, S.A; Stanford, B.D.; Pisarenko, A.N.; Gordon, G.; Asami, M., 2009. Hypochlorite, an assessment
of factors that influence the formation of perchlorate and other contaminants. AWWA and Water
Research foundation study report.
Stanford, B.D.; Pisarenko, A.N.; Snyder, S.A.; Gordon, G., 2011. Perchlorate, Bromate and chlorate in
hypochlorite solutions: Guidelines for utilities. Journal AWWA, 103:6
Stanford, B.D.; Pisarenko, A.N.; Dryer, D.J.; Zeigler-Holady, J.C.; Gamage, S.; Quinones, O.; Vanderford,
B.J.; Dickenson, E.R.V. 2013. Chlorate, perchlorate, and bromate in onsite-generated
hypochlorite systems. Journal AWWA, 105:14.
Texas Commission on Environmental Quality (TCEQ), 2007. Disinfectant Residual Reporting for Public
Water Systems, Water Supply Division, July 2007
US Environment protection agency (USEPA), 1997. Method 300.1, Determination of inorganic anions in
drinking water by ion chromatography, US EPA Office of Water.
USEPA, 1999. Method 314, Determination of perchlorate in drinking water using ion chromatography, US
EPA Office of Water.
USEPA, 1999. Alternative Disinfectants and Oxidants Guidance Manual. US EPA Office of Water,
EPA 815-R-99-014.
USEPA, 2002. Perchlorate Environmental Contamination: Toxicological Review and Risk
Characterization (2002 External Review Draft) NCEA-1-0503, Washington, DC.
USEPA, 2006. National Primary Drinking Water Regulations: Stage 2 Disinfectants and Disinfection
Byproducts Rule. Federal Register, 71:2:388-492.
USEPA, 2008. Drinking water: Preliminary Regulatory Determination on Perchlorate, Federal Register,
73:198:60262-60282.
USEPA, 2011. Drinking water: Regulatory Determination on Perchlorate, Proposed rules, Federal
Register, 76:29:7662-7667.
USEPA, 2014. Preliminary Regulatory Determinations for the Third Drinking Water Contaminant
Candidate List (CCL 3), Fact Sheet.
USEPA, 2014b. Announcement of Preliminary Regulatory Determinations for Contaminants on the Third
Drinking Water Contaminant Candidate List, Federal Register, 2014, 79:202:62716-62750.
Weather underground website, temperatures in Dallas and Fort Worth during the months of October and
November 2014, http://www.wunderground.com/history.

90
Biographical Information
Anna graduated cum laude with a bachelor degree in Chemical Engineering from the Technion –
Israel Institute of Technology in 2008. Following her graduation, she worked in industry for a few different
companies and gained some industrial valuable experience.
In 2013, Anna decided to continue into higher education in Environmental Engineering field, due
to the desire to meet the need for clean water all over the world. She enrolled into Environmental
Engineering program at University of Texas at Arlington. During her studies, Anna held a graduate
research assistant position, and was involved in different projects in water quality field, with primary
emphasis on disinfection by-products.
Anna is interested in working for improvement of drinking water quality in developed and
developing countries.