fate of adsorbed arsenate during phase transformation of ...€¦ · fate of adsorbed arsenate...
TRANSCRIPT

Chemical Geology 411 (2015) 69–80
Contents lists available at ScienceDirect
Chemical Geology
j ourna l homepage: www.e lsev ie r .com/ locate /chemgeo
Fate of adsorbed arsenate during phase transformation of ferrihydrite inthe presence of gypsum and alkaline conditions
Soumya Das ⁎, Joseph Essilfie-Dughan, M. Jim HendryDepartment of Geological Sciences, University of Saskatchewan, 114 Science Place, Saskatoon, SK S7N 5E2, Canada
⁎ Corresponding author.E-mail address: [email protected] (S. Das).
http://dx.doi.org/10.1016/j.chemgeo.2015.06.0310009-2541/© 2015 Elsevier B.V. All rights reserved.
a b s t r a c t
a r t i c l e i n f oArticle history:Received 28 January 2015Received in revised form 29 June 2015Accepted 30 June 2015Available online 3 July 2015
Keywords:FerrihydriteMine tailingsHematiteArsenicStructural incorporation
We investigated the fate of adsorbed arsenate during phase transformation of ferrihydrite in the presence of cal-cium (Ca2+) and sulfate (SO4
2−), a condition frequently encountered in oxic mine tailings, waste rocks, and met-allurgical operations. Ferrihydrite transformation under conditions that mimic those present during milling atthe Key Lake uranium mine, Canada (i.e., pH, porewater chemistry, Fe/As molar ratio) was examined usingbatch experiments. Solid samples were analyzed using X-ray diffraction (XRD), Raman spectroscopy (RS), scan-ning electron microscopy (SEM), transmission electron microscopy (TEM), Brunauer–Emmett–Teller surfacearea analyses (BET), inductively coupledplasmamass spectrometry (ICP-MS), andX-ray absorption spectroscop-ic analyses (XAS). Aqueous sampleswere analyzed for arsenic (As) and iron (Fe) concentrations using ICP-MS. X-ray diffraction and Raman spectroscopy analyses show that ferrihydrite completely transforms to hematite (withtraces of goethite) after 168 h of aging (75 °C and pH ~ 10). Hematite generated in the presence of As is spindleshaped, in contrast to the hexagonal or rhomb shaped morphology in the absence of As. The rate of ferrihydritetransformation is enhanced in the presence of partially dissolved gypsum (possibly due to an ionic strength ef-fect) and the kinetics of transformation follow a logistic decaymodel. BET analyses suggest that the reactive sur-face area is reduced by ~94% by the end of the batch experiment. Despite the loss of the reactive surface area, theaqueous concentrations of As decreased from1.4 to 0.1mg/L during 168 h of aging. XAS analyses suggest theAs isincorporated into the newly formed hematite via both bidentate-mononuclear and binuclear corner sharingcomplexes. Although this transformation is a slow process and could take years to complete, this structural incor-poration mechanism could nevertheless be a relevant pathway of As sequestration in the environment.
© 2015 Elsevier B.V. All rights reserved.
1. Introduction
Two-line ferrihydrite, hereafter termed ferrihydrite (nominal for-mula: 5Fe2O3·9H2O), is one of the most common iron (Fe) phases inmining and metallurgical operations where it plays an important rolein geochemical cycling (Jambor and Dutrizac, 1998). Ferrihydrite isalso a common constituent of soil and sediment, usually as a precursorto more crystalline and stable hematite and/or goethite (Schwertmannand Cornell, 1991; Jambor and Dutrizac, 1998; Cudennec and Lecerf,2006). Ferrihydrite also occurs in sediments receiving acid mine drain-age and mine tailings, as exemplified at sites in Ontario, Canada (Mannand Fyfe, 1989; Jambor and Dutrizac, 1998) and Cornwall, England(Bowell and Bruce, 1995). Its presence is also reported in mine wastesranging from coalfields in the USA (Bigham et al., 1990) to Pb–Zn tail-ings in England (Hudson-Edwards et al., 1996) to U–Th deposits inAustralia (Airey, 1986; Milnes et al., 1992).
Ferrihydrite can sequester trace metals and metalloids by surfaceadsorption (Michel et al., 2007) and thus controls the aqueousconcentration of many toxic elements in surface and ground waters,including uranium (U) (Payne et al., 1994), copper and zinc(Johnson, 1986; Fuller and Davis, 1989), lead (Erel and Morgan,1992), cadmium (Fuller and Davis, 1989), and arsenic (Costonet al., 1995; Belzile and Tessier, 1990; Fuller and Davis, 1989).Adsorption and retention of these toxic elements by ferrihydriteoccur at the sediment–water interface and are the result of its largespecific surface area and high affinity for these elements (Michelet al., 2007). Although ferrihydrite plays an important role in tracemetal partitioning in the environment, it is metastable and proneto transformation to more stable, crystalline phases such as hematiteand/or goethite (Das et al., 2011a; Cudennec and Lecerf, 2006).Neither the long-term stability of ferrihydrite under a range ofenvironmental conditions nor the ability of the more stable ironhydroxides to retain elements initially adsorbed to the ferrihydriteis well understood. Laboratory experiments under pristineconditions (i.e., using deionized water) demonstrate that transfor-mation of ferrihydrite to hematite results in a significant decrease

70 S. Das et al. / Chemical Geology 411 (2015) 69–80
in surface area (Das et al., 2011a). However, solutes (e.g., aqueousarsenic) can inhibit or limit the rate of ferrihydrite transformationunder highly alkaline conditions (pH 10–12) (Das et al., 2011b;Paige et al., 1996).
Mining and metallurgical operations are a major anthropogenicsource of arsenic (As) to the environment (Smedley and Kinniburgh,2002; Donahue and Hendry, 2003; Paktunc et al., 2003; Morin andCalas, 2006;Vaughan, 2006). Improved understandingof As partitioningin mining and metallurgical environments is important as the healthrisks associated with As toxicity, particularly its carcinogenic effects,prompted both the World Health Organization (WHO, 1993) and theUnited States Environmental Protection Agency (US EPA, 2001) to setdrinking water standards as low as 10 μg/L.
During Umilling, a significant amount of aqueous As (~99%) is re-moved from the raffinate (acidic waste solution) via adsorption tofreshly precipitated ferrihydrite at Cameco Corporation's Key Lakemill, located in northern Saskatchewan, Canada. Specifically, oxic,sulfuric acid leach solutions are neutralized during U ore processingwith lime (Ca(OH)2); ferric iron is added to increase Fe/As ratios,resulting in the precipitation of gypsum and ferrihydrite. Ferrihy-drite acts as a dominant sink for As in both the mill and the resultingtailings and thus controls the porewater concentrations of Asthroughout the tailings body (Essilfie-Dughan et al., 2013). Dissolvedcalcium (Ca2+) and sulfate ions (SO4
2−) are also present in substan-tial quantities in this system due to the high solubility of gypsum.As such, understanding this ferrihydrite–gypsum–arsenate systemis important to understanding the long-term fate of As in theseenvironments.
The U tailings from the Key Lake mill have been deposited in theDeilmann Tailings Management Facility (DTMF) since 1996. These tail-ings are alkaline and oxic (mean pH 9.8; mean Eh +200 mV) with anambient temperature of 1–2 °C (Shaw et al., 2011). Mean Ca2+ andSO4
2− concentrations in the porewaters are ~600 and ~1500 mg/L, re-spectively, and Fe/As molar ratios of solid samples from the two tailingsbodies in the DTMF are ~52 and ~10 (Shaw et al., 2011). Ferrihydrite ishighly stable under the pH conditions and Fe/As ratios present at theDTMF (Das et al., 2011b). However, ferrihydrite shows signs of transfor-mation to hematite at slightly higher Fe/As ratios (e.g., ~60). In spite ofthis transformation, aqueous As concentrations decrease (Das et al.,2014). This observation is supported by other recent studies and at-tributed to the structural incorporation of As into hematite (Bolanzet al., 2013; Muramatsu et al., 2012). Although the mechanism ofthis incorporation and bonding environment is different (due to dif-ferent experimental conditions: pH, co-precipitation vs. adsorption,Fe/As molar ratios), all of these studies indicate that As should notbe released to the aqueous phase if ferrihydrite transforms to hema-tite. In spite of these observations, the fate of adsorbed As during fer-rihydrite transformation in the presence of dissolved Ca2+ and SO4
2−
is not known even though these two competing ions are frequentlyencountered in many alkaline mine tailings porewaters includingthe DTMF.
The goal of this study is to understand the sequestration of As duringand after the phase transformation of ferrihydrite in the presence of dis-solved gypsum under alkaline conditions. The transformation experi-ment was conducted under oxic conditions (open to the atmosphere)at a pH of ~10, temperature of ~75 °C (to enhance the transformationprocess), and Ca2+ and SO4
2− concentrations of ~600 and ~1440 mg/L,respectively, to mimic porewater concentrations in the DTMF. Solidsamples were analyzed via X-ray diffraction (XRD), Raman spectrosco-py, scanning electron microscopy (SEM), transmission electron micros-copy (TEM), BET surface area, inductively coupled plasma-massspectrometry (ICP-MS), and X-ray absorption spectroscopy (XAS) anal-yses. Aqueous samples were analyzed by ICP-MS for As and Fe. The re-sults of the study will improve our understanding of the long-termgeochemical control of As in alkaline mine tailings found in NorthAmerica and elsewhere.
2. Materials and methods
2.1. Preparation of ferrihydrite, arsenate adsorption, and aging experiment
Ferrihydrite was prepared according to Schwertmann and Cornell(1991) withminormodifications. In brief, 20 g of FeCl3 (instead of ferricnitrate) was dissolved in 250mL of Milli-Q water in a polyethylene ves-sel on a stir plate. A pH electrode was immersed in the FeCl3 solutionand titrated with 1 M NaOH (instead of KOH) solution with vigorousstirring until the pH stabilized at ~7.5. The resulting ferrihydrite precip-itate was then transferred to 50 mL vials and centrifuged for 10 min at3000 rpm. The supernatants were discarded, 30–40 mL Milli-Q wateradded to each of the vials, then the wet ferrihydrite precipitate re-homogenized and re-centrifuged. This process was repeated fourtimes to ensure a relatively chloride-free ferrihydrite precipitate.
The thoroughly washed wet ferrihydrite precipitate was transferredto a polyethylene vessel and re-suspended in 200mLMilli-Q water andhomogenized on a stir plate. Once homogenized, ~0.6412 g of sodiumhydrogen arsenate hepta hydrate (Na2HASO4·7H2O) was added to thereaction vessel to achieve an Fe/As molar ratio of ~60. Then 0.517 g ofgypsum (CaSO4·2H2O) was added to the reaction vessel and stirredfor anhour to achieve a homogenized solutionwithCa2+ andSO4
2− con-centrations of ~600 and ~1440 mg/L, respectively. The pH of the slurrywas subsequently raised to ~10 by dropwise addition of 0.1 M NaOH.Once the pH stabilized (less than 0.05 drift in the pH reading within5 min), a 50 mL aliquot was sampled from the ferrihydrite slurry (t =0; sample before aging was conducted) and centrifuged at 3000 rpmfor 10 min. The supernatants were syringe filtered (0.2 μm filter) andthe aqueous samples stored in the refrigerator for future testing. Thesolidwet precipitateswere freeze-dried and also kept in the refrigeratorfor future analyses.
The vessel containing the ferrihydrite–arsenate–gypsum slurry wasthen covered with aluminum foil and transferred to a water bathpreheated to a temperature of ~75 °C. pHmeasurements were conduct-ed after 53, 71, 97, 120, 144, and 168 h, and samples taken at these timepoints were processed and stored in a similar fashion to the t = 0sample.
Another batch of ferrihydrite was prepared following the same pro-cedure to compare with results obtained from solid analyses (XRD andTEM) of the ferrihydrite–arsenate–gypsum system. After repeatedwashing of the wet ferrihydrite precipitate in 200 mL of Milli-Q water,0.517 g of gypsum (CaSO4·2H2O) was added to the reaction vessel con-taining the ferrihydrite slurry and homogenized on a stir plate. The ves-sel containing the ferrihydrite–gypsum slurry was sampled (~50 mLaliquot) at t = 0 and then transferred to a water bath preheated to atemperature of ~75 °C. After 24 h of aging, the slurry was then centri-fuged, the supernatant discarded, and the solid wet precipitate freeze-dried for further testing.
2.2. Preparation of pure phase ferrihydrite and hematite for quantificationvia XRD
Ferrihydrite was synthesized again as described above for character-ization and quantification for respective phases during the time seriestransformation. Hematite was synthesized following the method inSchwertmann and Cornell (1991) via hydrolysis of Fe(NO3)3 solution.Briefly, 8.3 g of Fe(NO3)3·9H2O was dissolved (by stirring on a stirplate) in 1 L 0.002 M HNO3 in a polyethylene vessel preheated to~98 °C in awater bath. After complete dissolution, the polyethylene ves-sel containing the Fe(NO3)3 solutionwas tightly capped and returned tothe water bath and held at ~98 °C for 7 d. After the synthesis was com-plete, the bright red hematite precipitate was centrifuged and washedfour times to remove any nitrate impurities.
Ferrihydrite and hematite mixtures were quantified following themethod described in Das et al. (2011a). In brief, XRD analyseswere con-ducted on known mixtures of ferrihydrite and hematite (0, 1, 5, 10, 20,

71S. Das et al. / Chemical Geology 411 (2015) 69–80
30, 40, 50, 60, 70, 80, and 90%), with the integrated intensities (maxi-mum intensitymultiplied by half width) plotted against the percentageof the known phases to create a calibration curve.
2.3. XRD
XRD analyseswere performed on all solid and ground samples (syn-thesized ferrihydrite, hematite, transformed ferrihydrite phases offerrihydrite–gypsum and ferrihydrite–gypsum–arsenate system) usinga PANalytical Empyrean X-ray diffractometer set to 40 kV and 45 mA.XRD analyses were also conducted on the known mixtures of ferrihy-drite and hematite (Section 2.2). The instrument was equipped with aSpellman generator and Co X-ray tube and configured with an incidentbeampath Fe β-filter and using a 1 degree anti-scatter slit and 0.02 mmSoller slits. The divergence and receiving slits were fixed at 0.5°. Groundsamples weremounted on a glass plate and the analysis performed on aspinning reflection/transmission stage. Spectral patterns were acquiredfrom 10 to 80° (step size of 0.0167°, scan speed of 1°/min). All raw XRDdata files (XY files) were converted to Excel files and the data plotted asintensity (arbitrary units) versus degrees two theta.
Rietveld analyses were also conducted on a 168 h sample from theferrihydrite–gypsum–arsenate system and a 24 h sample from theferrihydrite–gypsum system to identify the “a” and “c” parameters ofhematite. Analyses were conducted using PANalytical's Highscore Plussoftware. Spectra were initially compared to the Inorganic CrystalStructure Database (ICSD; FIZ Karlsruhe) to accurately identify phasesand choose the appropriate point group to use in Rietveld refinement(XPERT HIGHSCORE PLUS LTU, 3.0). A spectral baseline was thenestablished and the refinement performed using semi-automatic mode.
2.4. Raman spectroscopy
Raman spectroscopic analyses were performed on control samplesas well as transformed phases from the ferrihydrite–gypsum–arsenatesystem using a Renishaw InVia Raman microscope with a solidstate laser diode (Renishaw) configured at 785 nm (A1 lens) and a1200 line/mm (633/780) grating. The instrument was calibrated usingan internal Si sample, which was measured at a Raman shift of~520 cm−1 prior to actual analyses. Once calibrated, a few grains offreeze-dried ground samples were placed onto a glass slide using ametal spatula and viewed under the microscope using a Leica 20× NPLAN objective lens (NA = 0.40). The instrument was set in the linefocus confocal mode at a 10 s detector exposure time. The instrumentwas also set to remove cosmic ray interference and 32 spectral accumu-lations were collected with a Peltier cooled CCD detector. The laserpower was set at 0.1% (N300 mW measured at the output aperture ofthe laser) to minimize fluorescence in the associated scans and thespectral patterns were collected in a range from 100–2000 Ramanshift/cm−1. Raw data (.wxd) files were converted to Excel (.xls) filesand the resulting spectra plotted as wavenumber (cm−1) versus inten-sity (arbitrary units).
2.5. SEM
SEM imaging was conducted on selected solid samples from the fer-rihydrite–gypsum–arsenate system (168 h) using a JEOL JSM-840Ascanning electron microscope operating at 25 kV. A few milligrams ofeach sample (dried and ground) were mounted on 10 mm pin stubswith double-sided carbon tape. Once mounted, samples were coatedwith 200 Å of gold by an Edwards S150B plasma sputter coater for~2 h. SEM imagingwas conducted on the gold-coated samples via GellarMicroanalytical's dPict digital image acquisition system using amagnifi-cation less than 1500× with a working distance of 25 mm.
2.6. TEM
TEM images were acquired for two dried and ground solid samples(a 168 h sample from the ferrihydrite–gypsum–arsenate system and a24 h sample from the ferrihydrite–gypsum system) to determine grainsize distribution and morphology of individual hematite nanoparticles.In brief, each ground sample was placed on a separate Cu-grid (diame-ter of 3.0mm). Imagingwas conducted using a Philips CM200 transmis-sion electron microscope operating at 200 kV. Selected area diffractionpatterns (SADP)were also acquired for the individual hematite particleswherever applicable using a camera length of 240 mm.
2.7. BET
To evaluate the reduction of the reactive surface areas of the ferrihy-drite phases during aging, BET surface area measurements were per-formed on solid samples from the ferrihydrite–gypsum–arsenatesystem (freeze-dried and ground) on a Quantachrome NOVA 2200eSurface Area and Pore Size Analyzer. All solid samples were degassedfor 24 h at 80 °C and multi-point BET (11-pt BET-nitrogen isotherms)surface area measurements (m2/g) were then conducted under atmo-spheric pressure. Cumulative pore volume (cm3/g) was also measuredfor all solid phases. Adsorption isotherms were achieved at a p/po
range of 0.05–0.35.
2.8. ICP-MS
To examine the partitioning of arsenic onto the solid aswell as to theaqueous phases during the time series transformation of ferrihydrite,ICP-MS analyseswere conducted onboth solid (freeze-dried and ground)and aqueous samples (syringed filtered) from the ferrihydrite–gypsum–arsenate system via a Perkin Elmer NexIon 300D. Aqueous sampleswere spiked with a known volume of standards before analysis. An in-ternal standard (indium) was used to overcome the matrix effect andalso to avoid any signal drift over time. Solid samples (~100 mg) weredissolved using ~5 mL double distilled HF (48–51%) in Teflon® jarsfollowed by ~5 mL of double distilled (16 N) HNO3 to ensure completedigestion. After digestion was compete, all Teflon® jars were cappedtightly and heated to ~100–150 °C for 3 d and then cooled to room tem-perature. The solutions were refluxed using an additional 1–2 mL ofconcentrated HNO3 and HF for 3 d to ensure complete dissolution ofthe solid precipitates. Lids of all of the Teflon® jars were rinsed threetimes with a few mL of 16 N HNO3 to remove undigested residues andthen evaporated to dryness. Then 2.5 mL of 8 N HNO3 and 0.5 mLH2O2 were added to the jars, which were covered and warmed gently.The lids were rinsed with Milli-Q water and all samples were trans-ferred to sample bottles. Milli-Q water was subsequently added toeach sample bottle to bring the final weight to 100 g and analyzed viaICP-MS.
2.9. XAS
To identify changes in the bonding environment of As during aging,three freeze-dried solid samples from the ferrihydrite–gypsum–arsenate system (arsenate adsorbed on ferrihydrite at time 0 h andtransformed phases at times 97 and 168 h) were loaded onto Kapton®tape over a Teflon® sample holder. As K-edge XAS spectra were collect-ed for each sample (at ambient temperature and pressure) on the HardX-ray Microanalysis beamline (HXMA-06ID-1) at the Canadian LightSource (CLS; University of Saskatchewan, Canada). The CLS is a third-generation synchrotron facility operating at electron energy of 2.9 GeVand injection current of ~250 mA. The synchrotron source is asuperconducting wiggler equipped with a double-crystal Si(111)monochromator and Rh-coated collimating mirror. Before any spectralacquisition, the HXMA beam was detuned to ~50% to remove higher-order harmonic frequencies and prevent detector saturation. XAS data

72 S. Das et al. / Chemical Geology 411 (2015) 69–80
for all three samples were collected in fluorescence mode using 32-element solid-state germanium with simultaneous measurement ofAu reference spectra for energy calibration of each sample spectra. Toenhance the fluorescence signal of As in the samples reaching the detec-tor, 16 layers of Al foil were placed between the sample and the detectorto reduce scattering and limit fluorescence from Fe in the samplereaching the detector. XAS spectra were also collected on three refer-ence standards (arsenate adsorbed on ferrihydrite, arsenate adsorbedon hematite, and scorodite) to aid in the characterization of changesin the bonding environment of arsenate during the phase transforma-tion of ferrihydrite. These spectra were also collected in fluorescencemode (with the exception of scorodite, whichwas collected in transmis-sionmode) under ambient conditions. X-ray absorption spectra for bothsamples and reference standards were collected from −200 to+800 eV about the K-edge of As (11,867 eV). The monochromatorstep size was reduced to 0.4 eV in the X-ray absorption near-edge spec-troscopy (XANES) region and 0.05 Å in the extended X-ray absorptionfine structure (EXAFS) region. Three XAS scans were collected for eachsample and averaged to increase the signal-to-noise ratio.
The XAS data were modeled using IFFEFIT (ATHENA & ARTEMIS)(Ravel and Newville, 2005). ATHENA was used for data reduction, in-cluding the standard procedures of energy calibration, averaging ofmultiple scans, background subtraction, per atom normalization, andextraction of the EXAFS. ARTEMIS was used for EXAFS data analysis ofthe As K-edge spectra. The k3-weighted χ(k) function [χ(k)k3] in k-space (Å−1) was Fourier transformed (FT) to generate the radial struc-ture function (RSF) in R-space (Å) at a k-range of ~3–13Å−1. Theχ(k)k3
in k-space (Å−1) and FT RSF in R-space (Å) of the As K-edge of bothsamples were all fitted with ab initio phase and amplitude functionsgenerated with FEFF version 6L that comes with the IFFEFIT package(Rehr et al., 1992).
2.10. Modeling approach
Kineticmodelingwas conducted on the % ferrihydrite remaining as afunction of time using Sigmaplot® for the ferrihydrite–arsenate (Daset al., 2014), ferrihydrite–gypsum (Das et al., 2010), and ferrihydrite–
20 30 40 50
inte
nsi
ty /
co
un
ts p
er s
eco
nd
degrees t
H H H H
H
GG
0 h
53 h
71 h
97 h
120 h
144 h
168 h
Fig. 1. XRD scans of solids from the ferrihydrite–gypsum–arsenate system at time (a) 0 h; (b)hematite peaks respectively.
gypsum–arsenate systems (present study) according to:
Ct ¼ Cm
1þ Aekt; ð1Þ
whereA ¼ Cm−C0C0
, Ct is the amount of ferrihydrite remaining at time t, Cmis the maximum possible ferrihydrite at time t = 0 (determined fromfit), C0 is the initial amount of ferrihydrite present before phase transfor-mation (determined fromexperiment), and k is a rate constant. Similar-ly, kinetics of the % reduction in surface area of the ferrihydrite aswell as% reduction in pore volume as a function of time for the ferrihydrite–gypsum–arsenate system were also fitted using Sigmaplot®. R2 valuesindicative of the goodness of the fits were also computed, where R2
values closer to 1 indicate a better fit.
3. Results and discussion
3.1. Characterization of ferrihydrite and hematite
Two broad peaks in the XRD spectra at ~40 and ~74° two thetaconfirm the purity and amorphous nature of ferrihydrite in both theferrihydrite–gypsum (data not presented) and ferrihydrite–gypsum–arsenate systems (Schwertmann and Cornell, 1991) before aging wasinitiated (Fig. 1a). The first sign of transformation was noticed after53 h of aging (Fig. 1b) for the ferrihydrite–gypsum–arsenate system,with all characteristic hematite peaks (~28, ~39, ~41, ~48, ~58, ~64,~68, ~74, and ~76° two theta) starting to develop. All hematite peakscontinued to increase with time (e.g., 71, 97, 120, and 144 h of aging;Fig. 1c–f). An additional minor hematite peak was identified after 71 hof aging and continued to increase as aging progressed. Three veryminor goethite peaks were also observed in the 144 h sample (Fig. 1f)at ~25, ~31, and ~32° two theta; however, all three disappeared after168 h of aging. By the end of the aging experiment, only hematitepeakswere identified (Fig. 1g), indicating that hematite is the dominantphase resulting from ferrihydrite transformation. Rietveld analyses indi-cate that ferrihydrite is completely converted to hematite (with tracesof goethite) after 24 h of aging for the ferrihydrite–gypsum system
60 70 80wo theta
a
b
c
d
e
f
g
H H
H
H
H H
53 h; (c) 71 h; (d) 97 h; (e) 120 h; (f) 144 h; and (g) 168 h. G and H signify goethite and

Table 1Percent transformation and changes in surface area and cumulative pore volume duringphase transformation of ferrihydrite (Fe/As = 60) in the presence of gypsum at pH ~ 10.
SampleID
% ferrihydritetransformed
Surface area(m2/g)
Cumulative pore volume(cm3/g)
t = 0 0.00 230 0.113553 h 10.36 220 0.107971 h 20.89 208 0.101997 h 34.98 150 0.0735120 h 72.72 60 0.0303144 h 99.00 14 0.0067168 h 100.00 13 0.0066
100 200 300 400 500 600 700 800 900 1000
inte
nsi
ty (
arb
itrar
y u
nits
)
wavenumber / cm-1
~650 cm-1
abc
d
e
f
g
0 h53 h71 h97 h120 h144 h
168 h
Fig. 3. Raman spectral patterns of solid samples from the ferrihydrite–gypsum–arsenate system at time (a) 0 h; (b) 53 h; (c) 71 h; (d) 97 h; (e) 120 h; (f) 144 h; and (g) 168 h. All bandpositions were identified as hematite.
(a) (b)
Fig. 2. SEM images of hematite produced in the ferrihydrite–gypsum–arsenate system after 168 h of aging: (a) 1 μm and (b) 0.1 μm.
73S. Das et al. / Chemical Geology 411 (2015) 69–80
(data not presented), corroborating findings reported by Das et al.(2010).
SEM images of the final product in the ferrihydrite–gypsum–arsenate system reveal that hematite particles produced by aging areslightly elongated in nature, with a fairly well developed crystal outline.They are roughly ~100 nmwide and ~200–300 nm long (Fig. 2a–b). Noadditional morphological characteristics could be determined from theSEM images due to the aggregated nature of the particles. As such, weconducted TEM on the 168 h sample (see Section 3.3).
Raman spectral analyses of the ferrihydrite in the ferrihydrite–gypsum–arsenate system show three distinct band positions, at ~360,~508, and ~707 cm−1; these coincide well with previous studies (Dasand Hendry, 2011), confirm its purity, and corroborate the XRD findings(Fig. 3a). The first sign of transformation is evident in the 71 h sample(similar to XRD), with one minor and four major hematite bands(~220, ~290, ~403, ~493, and ~608 cm−1) clearly noticeable (Fig. 3b).The strength of the signal at these band positions grew as agingprogressed (Fig. 3c–g). These band positions are also in good agreementwith Das and Hendry (2011)with two exceptions: they report a band at~230 cm−1, which is absent in this study, and our observation of aminor but distinctive bandposition at ~650 cm−1, which is not reportedeither by Das and Hendry (2011) or others (de Faria et al., 1997; Legodiand de Waal, 2007). The significance of the band at ~650 cm−1 isdiscussed in Section 3.3.
BET analyses for the ferrihydrite–gypsum–arsenate system indicatethat ferrihydrite (t= 0) has a large surface area (~230m2/g), consistentwith Schwertmann and Cornell (1991) (200–300 m2/g; Table 1). How-ever, a steady decrease in surface area was observed with time, from~220 at 71 h to as low as ~13 m2/g at 168 h (Table 1); this reflects thetransformation of ferrihydrite to hematite with time. The loss of surfacearea is accompanied by a steady reduction in pore volume from0.1135 cm3/g at t = 0 to 0.0066 cm3/g after 168 h (Table 1) of aging;this reflects the porous and compact natures of ferrihydrite and hema-tite, respectively.

Table 2Kineticfit parameters of ferrihydrite transformation for ferrihydrite–gypsum, ferrihydrite–arsenate, and ferrihydrite–gypsum–arsenate systems at pH ~ 10.
System k (day−1) Cm R2
Ferrihydrite + gypsum (% ferrihydrite) 13.9 ± 1.5 101.4 ± 3.6 0.99Ferrihydrite + arsenate (% ferrihydrite) 0.7 ± 0.02 100.4 ± 0.8 0.99Ferrihydrite + gypsum + arsenate(% ferrihydrite)
1.6 ± 0.05 96.2 ± 4.5 0.98
Ferrihydrite + gypsum + arsenate(% surface area)
1.6 ± 0.01 99.1 ± 1.6 0.99
Ferrihydrite + gypsum + arsenate(% pore volume)
1.6 ± 0.03 98.9 ± 1.8 0.99
0 1 2 3 4 5 6 7 8
0
20
40
60
80
100 Data Fit
% P
ore
Vo
um
e
Time, Days
0 1 2 3 4 5 6 7 8
0
20
40
60
80
100Data
Fit
% S
urf
ace
Are
a
Time, Days
0 1 2 3 4 5 6 7 8
0
20
40
60
80
100
Ferrihydrite+Gypsum
Ferrihydrite+Gypsum+Arsenate
Ferrihydrite+Arsenate
Fit
% F
erri
hyd
rite
Time (Days)
(a)
(b)
(c)
Fig. 4.Kinetic fit of (a) % ferrihydrite remaining as a function of time (open triangle); (b) %reduction of surface area of the ferrihydrite as a function of time (open circle); and (c) %reduction in pore volume as function of time (open hexagon) for the ferrihydrite–gypsum–arsenate system. Kinetic fit of % ferrihydrite remaining as a function of time forthe ferrihydrite–arsenate (open square) and ferrihydrite–gypsum–arsenate (open dia-mond) systems was derived from Das et al. (2010, 2014), respectively, and included in(a) for comparison.
74 S. Das et al. / Chemical Geology 411 (2015) 69–80
3.2. Time series transformation and kinetics
Time series based on the XRD data indicate that ferrihydrite beginsto transform after 53 h of aging, with ~10% converted to hematite forthe ferrihydrite–gypsum–arsenate system (Table 1). A near completeconversion (~99% calculated) was achieved after 144 h of aging; 100%conversion was estimated to occur after 168 h of aging (Table 1). The
rate of ferrihydrite transformation to hematite for the ferrihydrite–gypsum–arsenate system follows the logistic decay model (Fig. 4a);the ferrihydrite–gypsum (Das et al., 2010) and ferrihydrite–arsenate(Das et al., 2014) systems (Fig. 4a; Eq. (1)) were described using first-order decay. It is postulated that the direct adsorption of Ca2+ ontothe ferrihydrite surface invokes this induction period and thus retardsthe initial rate of transformation (Baltpurvins et al., 1997). A plausiblemechanism explaining this induction period is the interaction of Ca2+
ions with the ferrihydrite surface at pH values higher (~10.2, the initialpH conditions before the aging tests were conducted) than the pzc offerrihydrite (e.g., ~8) (Baltpurvins et al., 1997). However, the intrinsicstability constants (best estimates) for Ca2+ adsorption onto ferrihy-drite surface are significantly lower (logK1 = 4.97; logK2 = −5.85)than for As (logK1 = 29.31; logK2 = 23.51) (Dzombak and Morel,1990). Thus, the structure of the ferrihydrite is more easily destabilizedafter the induction period, and the transformation, once initiated, pro-ceeds even faster than in a gypsum-free system. For example, only~55% conversion occurs in a gypsum-free system (Das et al., 2014) com-pared to 100% conversion in the presence of gypsum (current study)after 7 d of aging. The kinetic fit for the % reduction in surface area of fer-rihydrite (Fig. 4b) and % reduction in pore volume (Fig. 4c) as a functionof time for the ferrihydrite–gypsum–arsenate system can be explainedusing the logistic decay model. The kinetic constants obtained fromthe fits are listed in Table 2.
3.3. As partitioning during ferrihydrite aging
Despite the decrease in the specific surface area of ferrihydrite dur-ing phase transformation in the ferrihydrite–gypsum–arsenate system,concentration of As continuously decreases in the aqueous phase withtime (Table 3). For example, the aqueous concentration of As measuredvia ICP-MS at t = 0 was 1.4 mg/L but decreased to 0.5 mg/L at 53 h andthen to 0.1 mg/L by the end of the experiment (168 h) (Table 3). Nota-bly, the initial aqueous concentration was slightly lower (~1.4 mg/L)than in the ferrihydrite–arsenate system reported by Das et al. (2014)(~1.5 mg/L). This can be explained by the adsorption of Ca2+ on thephase transforming solids increasing the net positive charge, thusallowing more As (negatively charged ions) to be sequestered (in-creased/enhanced uptake) at the solid–water interface (Jia andDemopoulos, 2005). The ICP-MS analyses on the respective solid sam-ples show increasing As sequestration. At t = 0, the As concentrationwas 11,034 μg/g and at 168 h was 13,494 μg/g (Table 3); thus,~2500 μg/g (±1%) of As was partitioned to the solid phase during thetransformation process (Table 3). As a consequence, the Fe/As ratios ofthe solids decreased from ~64 (t = 0 h) to ~52 (t = 168 h) (Table 3),which also suggests partitioning of As to the solid phase during aging.Notably, the pH of the slurry was ~10.2 at the beginning of theexperiment and increased to 10.4 after 168 h (Table 3). In such highlyalkaline conditions, re-adsorption to the hematite solid phase (whichhas a ~90% lower surface area compared to ferrihydrite) may not be aplausible mechanism to explain the continued decrease of aqueous Asconcentrations.

Fig. 5. Comparison of hematite crystallographic planes in solids synthesized in the ferrihydrite(e) 202; (f) 024; (g) 116; (h) 018; (i) 214; and (j) 300.
Table 3Changes inpH, aqueous and solid As concentrations, and Fe/Asmolar ratioswith respect totimeduringphase transformation of ferrihydrite to hematite for the ferrihydrite–gypsum–arsenate system at pH ~ 10.
Sample ID pH As (s)(ppm, μg/g)
As (aq)(ppm, mg/L)
Fe/As(molar ratios)
t = 0 10.2 11,034 1.4 63.753 h 9.9 12,184 0.5 58.171 h 9.9 12,088 0.5 57.597 h 10.0 12,639 0.3 55.6120 h 10.7 13,230 0.1 52.9144 h 10.9 13,503 0.1 52.1168 h 10.4 13,494 0.1 52.1
75S. Das et al. / Chemical Geology 411 (2015) 69–80
To explain the observed partitioning of As from the aqueous to solidphase, we compared the XRD patterns of hematite synthesized inferrihydrite–gypsum and ferrihydrite–gypsum–arsenate systems.These analyses indicate continuous shifting in the hematite peak posi-tions towards lower values for each crystallographic plane in theferrihydrite–gypsum–arsenate system vs. the ferrihydrite–gypsumsystem (Fig. 5a–j; Table 4); this is indicative of higher d-spacing withinthe hematite lattice. This shifting is attributed to the incorporation of Asinto the hematite structure. A similar observation was made bySchwertmann and Cornell (1991) for their aluminum substituted hema-tite compared to pure hematite synthesized from Fe(NO3)3.
To further assess this structural incorporation, Rietveld analyseswere conducted on a 168 h sample from the ferrihydrite–gypsum–arsenate system and a 24 h sample from the ferrihydrite–gypsum sys-tem to identify the “a” and “c” parameters of hematite. Analyses suggest
–gypsum and ferrihydrite–gypsum–arsenate systems: (a) 012; (b) 104; (c) 110; (d) 113;
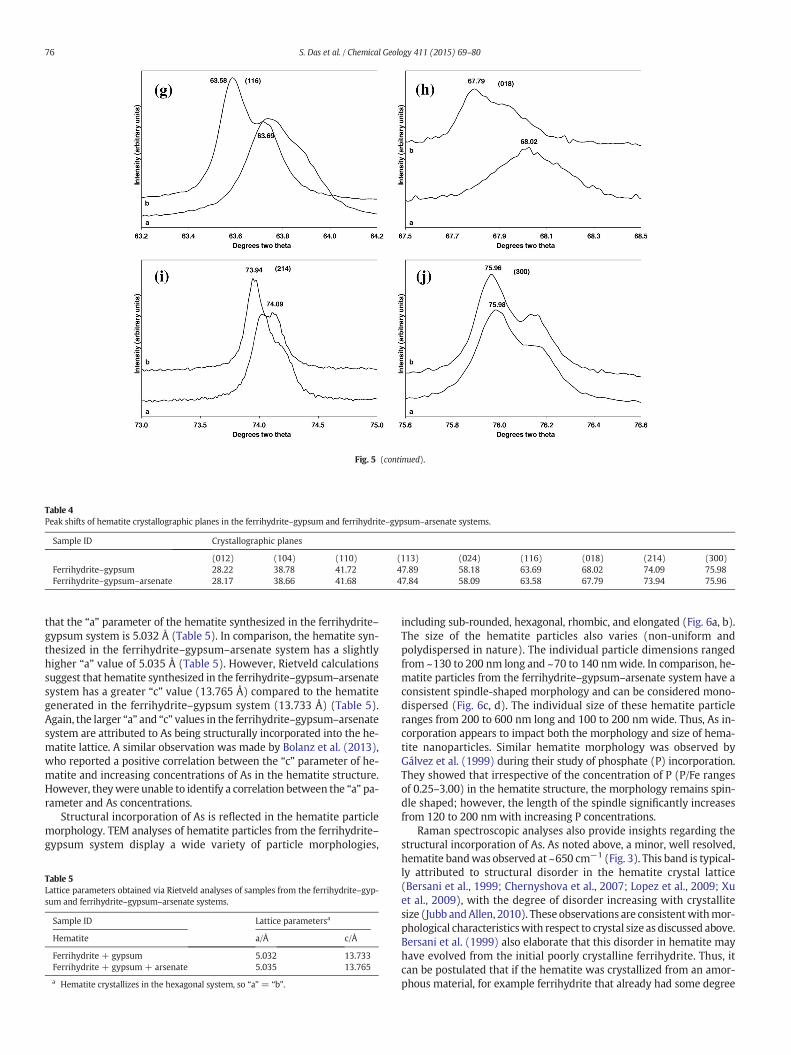
Table 4Peak shifts of hematite crystallographic planes in the ferrihydrite–gypsum and ferrihydrite–gypsum–arsenate systems.
Sample ID Crystallographic planes
(012) (104) (110) (113) (024) (116) (018) (214) (300)Ferrihydrite–gypsum 28.22 38.78 41.72 47.89 58.18 63.69 68.02 74.09 75.98Ferrihydrite–gypsum–arsenate 28.17 38.66 41.68 47.84 58.09 63.58 67.79 73.94 75.96
Fig. 5 (continued).
76 S. Das et al. / Chemical Geology 411 (2015) 69–80
that the “a” parameter of the hematite synthesized in the ferrihydrite–gypsum system is 5.032 Å (Table 5). In comparison, the hematite syn-thesized in the ferrihydrite–gypsum–arsenate system has a slightlyhigher “a” value of 5.035 Å (Table 5). However, Rietveld calculationssuggest that hematite synthesized in the ferrihydrite–gypsum–arsenatesystem has a greater “c” value (13.765 Å) compared to the hematitegenerated in the ferrihydrite–gypsum system (13.733 Å) (Table 5).Again, the larger “a” and “c” values in the ferrihydrite–gypsum–arsenatesystem are attributed to As being structurally incorporated into the he-matite lattice. A similar observation was made by Bolanz et al. (2013),who reported a positive correlation between the “c” parameter of he-matite and increasing concentrations of As in the hematite structure.However, theywere unable to identify a correlation between the “a” pa-rameter and As concentrations.
Structural incorporation of As is reflected in the hematite particlemorphology. TEM analyses of hematite particles from the ferrihydrite–gypsum system display a wide variety of particle morphologies,
Table 5Lattice parameters obtained via Rietveld analyses of samples from the ferrihydrite–gyp-sum and ferrihydrite–gypsum–arsenate systems.
Sample ID Lattice parametersa
Hematite a/Å c/Å
Ferrihydrite + gypsum 5.032 13.733Ferrihydrite + gypsum + arsenate 5.035 13.765
a Hematite crystallizes in the hexagonal system, so “a” = “b”.
including sub-rounded, hexagonal, rhombic, and elongated (Fig. 6a, b).The size of the hematite particles also varies (non-uniform andpolydispersed in nature). The individual particle dimensions rangedfrom ~130 to 200 nm long and ~70 to 140 nmwide. In comparison, he-matite particles from the ferrihydrite–gypsum–arsenate system have aconsistent spindle-shaped morphology and can be considered mono-dispersed (Fig. 6c, d). The individual size of these hematite particleranges from 200 to 600 nm long and 100 to 200 nm wide. Thus, As in-corporation appears to impact both the morphology and size of hema-tite nanoparticles. Similar hematite morphology was observed byGálvez et al. (1999) during their study of phosphate (P) incorporation.They showed that irrespective of the concentration of P (P/Fe rangesof 0.25–3.00) in the hematite structure, the morphology remains spin-dle shaped; however, the length of the spindle significantly increasesfrom 120 to 200 nm with increasing P concentrations.
Raman spectroscopic analyses also provide insights regarding thestructural incorporation of As. As noted above, a minor, well resolved,hematite bandwas observed at ~650 cm−1 (Fig. 3). This band is typical-ly attributed to structural disorder in the hematite crystal lattice(Bersani et al., 1999; Chernyshova et al., 2007; Lopez et al., 2009; Xuet al., 2009), with the degree of disorder increasing with crystallitesize (Jubb andAllen, 2010). These observations are consistentwithmor-phological characteristicswith respect to crystal size as discussed above.Bersani et al. (1999) also elaborate that this disorder in hematite mayhave evolved from the initial poorly crystalline ferrihydrite. Thus, itcan be postulated that if the hematite was crystallized from an amor-phous material, for example ferrihydrite that already had some degree

(a) (b)
(c) (d)
Fig. 6. TEM images of hematite synthesized in the ferrihydrite–gypsum system (a, 200 nm; b, 20 nm) and ferrihydrite–gypsum–arsenate system (c, 200 nm; d, 50 nm).
77S. Das et al. / Chemical Geology 411 (2015) 69–80
of disorder in its structure (i.e., lack of long-range order and large num-ber of atoms in the surface layers), this may contribute disorder to thecrystalline successor (hematite) and thus allow it to accommodate for-eign ions (such as As) in its structure without any lattice destruction.However, the type, nature, or degree of disorder in the hematite crystallattice could not be estimated or identified.
3.4. As incorporation into the hematite structure: spectroscopic evidence
Further and final confirmation of As structural incorporation into thehematite structurewas acquired fromXAS spectral analyses of the ferri-hydrite–gypsum–arsenate system solids from 0, 97, and 168 h. TheXANES spectra for As in all three samples match the edge position ofthe As5+ standard (Na2HAsO4·7H2O) (Fig. 7a), indicating that the oxi-dation state of As is preserved during adsorption onto ferrihydrite aswell as during the phase transformation of ferrihydrite to hematite.XANES is also sensitive to the coordination environment (geometricalarrangement of atoms) of the absorber atom (George and Pickering,2007; Kelly et al., 2008). Although not conclusive, an overlap compari-son of all three normalized XANES spectra shows changes in spectralfeatures between 11,875 and 11,890 eV (as indicated by the arrow inFig. 7a) aswell as increase in intensity of the “white line” (sharp intensepeak) with time (i.e., from 0 to 168 h), suggesting a possible change inthe coordination environment of As during the transformation of ferri-hydrite to hematite.
The EXAFS region of the XAS spectra of the three samples was ana-lyzed to obtain details on bond distances, bonded atoms, and coordina-tion number of the absorber atom (McNear et al., 2005). Fig. 7b and cshows the χ(k)k3 in k-space (Å−1) and Fourier transform radial struc-ture function (FT RSF) in R-space (Å), respectively, of the 0 h (arsenateadsorbed on ferrihydrite), 97 h, and the 168 h (arsenate incorporated
into hematite formed from the ferrihydrite transformation) samples.The observed k-space spectra are attributed to backscattering associat-ed with the nearest bonded oxygen atoms (i.e., As–O shell), and thepresence of the shoulders and peak splitting on the wave pattern is at-tributed to backscattering from distant bonded atoms (i.e., As–Feshell). Conspicuous on the 168 h k-space spectra is a split peak between4 and 5 Å−1, the presence of a peak between 6 and 6.5 Å−1, the absenceof the plateau feature between 6.5 and 7.5 Å−1, and the presence of apeak at 9 Å−1 (indicated by arrows). This is in contrast to the k-spacespectra for the 0 h sample, where these regions flatten out and are con-sistent with previously published EXAFS studies on arsenate adsorbedon ferrihydrite (Foster et al., 1998; Moldovan et al., 2003; Paktuncet al., 2004, 2008; Chen et al., 2009). The observed differences aremore evident in the FT in R-space (Å) (Fig. 7c), which can provide esti-mates of bond distances between the central absorber atom (As) and itsnearest neighbors. The first and the most pronounced peak in FT R-space is at ~1.5 Å (uncorrected for phase shifts) for both samples, andrepresents the scattering from oxygen atoms directly bonded to the Asatom (Das et al., 2014). The second peak in the 0 h FT R-space at~3.0 Å (uncorrected for phase shifts) corresponds to As–Fe bonding(Das et al., 2014). However, the 168 h FT R-space contains second andthird peaks at ~2.7 and ~3.25 Å, respectively, both of which correspondto As–Fe bonding (Das et al., 2014). This suggests that the coordinationenvironment of the adsorbed arsenate changed upon transformation ofthe ferrihydrite to hematite.
The spectral features present in 168 h k-space as well as FT R-spacespectra are also observed but are less conspicuous in respective spectrafor the 97 h sample. This suggests that the 97 h sample made up of amixture of arsenate adsorbed on ferrihydrite as well as arsenate thathas been incorporated into hematite. To determine the amount of arse-nate associated with each of the iron phases present in the 97 h sample,

(a) (c)
11840 11860 11880 11900 11920 11940
0
1
2
3
4
5
Sodium Arsenate (As5+)
Ab
sorp
tio
n
Energy (eV)
0 h 97 h 168 h
Sodium Arsenite (As3+)
0 1 2 3 4 5 6
0
5
10
15
20
25
30
35
40
0 h 97 h 168 h
ed
utin
gaM
demr
ofsnar
Treir
uo
F
R (Å)
As-O
As-Fe
As-Fe1As-Fe2
As-Fe1As-Fe2
2 3 4 5 6 7 8 9 10 11 12 13-15
-10
-5
0
5
10
15
20
25
30
35
40
k3(k
)
k (Å)
0 h 97 h 168 h
(b)
χ
Fig. 7. (a) As K-edge X-ray absorption near-edge spectra (XANES) for ferrihydrite–gypsum–arsenate system solids from 0 h (arsenate adsorbed on ferrihydrite), 97 h, and 168 h (arsenateincorporated into hematite formed from the transformed ferrihydrite) aswell as reference compoundswith As oxidation states of+3 (arsenite) and+5 (arsenate). (b) Arsenic K-edge k3-weighted EXAFS and (c) Fourier transform (FT) spectra for a k interval of 3–13 Å−1 for 0, 97, and 168 h samples. The first major peak in the FT spectra is from the nearest neighbor As–Oshell and the secondmajor peak ismainly from the As–Fe shell. However, the 97 and 168 h samples demonstrate two As–Fe peaks (As–Fe1 and As–Fe2). The Fourier transformed spectrahave not been corrected for phase shift.
78 S. Das et al. / Chemical Geology 411 (2015) 69–80
linear combination fitting (LCF) analysis conducted on both the XANESand k-space spectra of the 97 h sample, using the spectra of the 0 and168 h as standards. The results (Fig. 8a, b) indicate that the 97 h sampleis made up 30–32% arsenate adsorbed on ferrihydrite and 68–70% arse-nate incorporated into hematite. Interestingly, the XRD analysis indicat-ed that only 35% of ferrihydrite has transformed to hematite(Section 3.3) after 97 h (Table 1), yet the LCF analysis indicates that68–70%of the arsenate present had been incorporated into the hematiteformed.
To determine the change in coordination environment (averagebond distances as well coordination numbers) associated with thetransformation of arsenate adsorbed on ferrihydrite to arsenate incor-porated into hematite, quantitative EXAFS analysis was conducted onthe As spectra of the 0 and 168 h samples. Non-linear least square fitanalysis of the calculated ab initio phase and amplitude functions(using FEFF 6L) to the χ(k)k3 in k-space (Å−1) and FT RSF in R-space(Å) (Fig. 9, Table 6) indicates that the first shell (As–O) in both sampleshas a coordination number (CN) of 4 and an average As–O bond dis-tance of 1.69 ± 0.02 Å. In both samples, the CN and bond lengths corre-spond to a tetrahedral coordination of the oxygen atoms around the As.This is in excellent agreement with published EXAFS analysis of
11840 11860 11880 11900 11920 11940
0.0
0.5
1.0
1.5
2.0
2.5
3.0
3.5
Ab
sorp
tio
n
Energy (eV)
97 h Data Fit 0 h (30.2 %) 168 h (69.8 %)
3
(a)
χ
Fig. 8. Experimental and linear combination fits for (a) As K-edge near-edge and (b) k space spedenoting the fractional contributions of the components used to generate the fitted spectra.
arsenate (AsO43−) (Moldovan et al., 2003; Chen et al., 2009;
Essilfie-Dughan et al., 2013). The results of the fit analyses indicatethat the second shell (As–Fe) of the 0 h sample has a CN of 1.9 withan average bond distance of 3.26 ± 0.02 Å, which is typical of arsenateadsorbed on ferrihydrite via bidentate binuclear bridging (Waychunaset al., 1993;Moldovan et al., 2003; Foster, 2003; Chen et al., 2009). How-ever, the second (As–Fe1) and third (As–Fe2) shells of the 168 h samplehave CNs of 1.2 and 2.1 and average bond distances of 2.84 ± 0.02 and3.35 ± 0.02 Å, respectively. The As–Fe1 bond length of 2.84 and CN of1.2 indicate that the arsenate tetrahedron is bonded to an edge sharingferric iron octahedral through a bidentate-mononuclear complex(Fendorf et al., 1997; Ladeira et al., 2001), whereas the As–Fe2 bondlength of 3.35 and CN of 2.1 indicate that the arsenate tetrahedron isbonded to two ferric iron octahedra through a bidentate binuclearcorner-sharing complex (Foster, 2003; Sherman and Randall, 2003;Wang and Mulligan, 2008). These results suggest that arsenateadsorbed onto ferrihydrite during the transformation to hematite doesnot merely remain adsorbed on the surface, but is incorporated intothe hematite structure via both a bidentate-mononuclear complex anda bidentate binuclear corner-sharing complex. The above descriptionof the coordination environment of arsenate incorporated into the
2 3 4 5 6 7 8 9 10 11 12 13-10
-5
0
5
10
15
20
25
30
35
k(k
)
k (Å)
97 h Data Fit 0 h (32.4 %) 168 h (67.6 %)
(b)
ctra of ferrihydrite–gypsum–arsenate system solids after 97 h of aging, alongwith spectra

0 1 2 3 4 5 6
0
10
20
30
40
50
ed
utin
gaM
mrofs
narT
reiru
oF
R (Å)
FitsScoroditeAs(V)-Hematite0 hr168 hr
Fig. 9.Quantitative non-linear least square fit analysis of the calculated ab initio phase andamplitude functions to the As EXAFS spectra in R-space of ferrihydrite–gypsum–arsenatesystem solids after 0 and 168 h of aging aswell that of scorodite and arsenate adsorbed onhematite.
79S. Das et al. / Chemical Geology 411 (2015) 69–80
hematite structure differs from the fit analysis results from As K-edgeEXAFS of arsenate adsorbedonhematite (Fig. 9; Table 6),which featurestwo shells. The first coordination shell (As–O) with a bond distance of1.69 Å and a CN of four is consistent with the tetrahedral molecularstructure of arsenate as described above but the second shell, which
Table 6Arsenic K-edge EXAFS curve-fitting results for the ferrihydrite–gypsum–arsenate systemsummarizing the local coordination environment around the arsenic atom on day 0 (Asadsorbed on ferrihydrite), day 7 (As incorporated into hematite), As adsorbed on hema-tite, and scorodite. Per atomamplitude andphase parameters for fitting adsorbed arsenatewere obtained from mineral scorodite [FeAsO4·2H2O]. The fitting was done over the k-range of 3–13 Å−1 and R-range of 1–4 Å using the Hanning window in all cases.
Sample CN R (Å) σ2 (Å2) ΔE0 (eV) R-factor
0 hAs–O 4.0a 1.69 0.0031 6.57 0.023As–Fe 1.9 3.26 0.0057 b
168 hAs–O 4.0a 1.69 0.0028 4.52 0.028As–Fe1 1.2 2.84 0.0039 b
As–Fe2 2.1 3.35 0.0063 b
As–hematiteAs–O 4.0a 1.69 0.0027 2.99 0.023As–Fe 0.9 2.84 0.0047 b
ScoroditeAs–O 4.0a 1.68 0.0041 3.55 0.021As–Fe 4.0 3.35 0.0069 b
Amplitude reduction factor was constrained to 0.9.R, interatomic distance (±0.02 Å).CN, coordination number (±20%).σ2, Debye–Waller factor (disorder parameter).
a Constrained value.b Value was constrained to the 1st shell.
corresponds to the As–Fe shell, has a CN of 0.9 and a bond distance of2.83 Å, indicating that arsenate is adsorbed onto the hematite througha bidentate mononuclear complex (Fendorf et al., 1997; Ladeira et al.,2001; Arai et al., 2004). Similarly, the fit analysis results from As K-edge EXAFS (Fig. 9; Table 6) show that the coordination environmentof arsenate incorporated into the hematite structure during the phasetransformation is different from that of scorodite (a common ferric arse-nate mineral), which also has the typical tetrahedral first coordinationAs–O shell at an average bond distance of 1.68 Å but a second shellAs–Fe with CN of 4.0 and an average bond distance of 3.35 Å. This indi-cates that the scorodite local structure is highly symmetrical and madeup of the arsenate tetrahedron coordinatedwith four ferric iron octahe-dra (Foster, 2003; Moldovan et al., 2003; Chen et al., 2009). The differ-ences in the As–Fe shell results for the three arsenic–iron mineralphases described above suggest that they have considerably differentlocal structures.
4. Environmental significance and conclusions
This study evaluated the partitioning of As during phase transforma-tion of ferrihydrite under highly alkaline conditions in the presence ofgypsum, as such conditions are encountered in many alkaline minewastes and tailing settings. The study demonstrates that ferrihydritepreferentially converts to hematite within 7 d of aging at 75 °C andhas an associated loss of surface area from 230 to 13 m2/g. Concurrentwith these changes, the aqueous As concentrations decrease from 1.44to 0.06 mg/L through 1 to 7 d of aging. Detailed XRD, Raman, and XASanalyses reveal that As is incorporated into the hematite structure dur-ing ferrihydrite transformation. This study was conducted under highlyalkaline pH conditions, thus limiting the adsorption of As onto the he-matite surface. However, the structural incorporation mechanism maybe a pH independent process and thus could also play a significantrole in As sequestration in neutral and acidic pH conditions. In addition,the structural incorporation of As is also independent of the surface areaof the incorporating solid. Additional studies examining other trace con-taminants may provide further support for this structural incorporationmodel as an important means of trace metal sequestration in naturalsoils and ground waters in addition to the classical adsorption and co-precipitation models. Although this mechanism might depend on thesize and concentration of cations/anions incorporated, the occurrenceof structurally bound trace metals in newly formed solids adds to cur-rent understanding of metal–mineral interactions in many natural andanthropogenic settings.
The stability of ferrihydrite and the partitioning of associated As areimportant to thoroughly understanding the long-term geochemicalcontrols of mine wastes (at temperatures N 1 °C and Fe/As N 60). Thisphase transformation is a slow process, taking ~52,000 years to com-plete in the presence of arsenate under alkaline conditions and at a tem-perature of ~1 °C (Das et al., 2011b). Even though the presence ofdissolved gypsum enhances the transformation process (~2.3 timesfaster than a ferrihydrite–arsenate system), it is estimated that thistransformation will also be long, taking ~23,000 years to complete. Inaddition, mine tailings with a lower pH and higher As concentrationswill reduce the rate of this transformation by orders of magnitude(Das et al., 2011a,b) irrespective of the strength of the electrolytes(data not presented).
Acknowledgments
The authors acknowledge the assistance of Tom Bonli with XRD andSEM analyses, Erin Schmeling with BET analyses, and Jianzhong Fanwith ICP-MS analyses conducted at the University of Saskatchewan.The authors also acknowledge the assistance of Dr. Kelly Sears fromMcGill University with TEM analyses. Fundingwas provided by theNat-ural Sciences and Engineering Research Council of Canada (NSERC)(184573-10) Industrial Research Chair program and Cameco

80 S. Das et al. / Chemical Geology 411 (2015) 69–80
Corporation (MJH). The Canadian Light Source is supported by theCanadian Foundation for Innovation, the University of Saskatchewan,Western Economic Diversification Canada, the National ResearchCouncil Canada, the Canadian Institutes of Health Research, and NSERC.
References
Airey, P.L., 1986. Radionuclide migration around uranium ore bodies in the Alligator Riv-ers Region of the Northern Territory of Australia—analogue of radioactive wasterepositories—a review. Chem. Geol. 55, 255–268.
Arai, Y., Sparks, D.L., Davis, J.A., 2004. Effects of dissolved carbonate on arsenate adsorp-tion and surface speciation at the hematite–water interface. Environ. Sci. Technol.38, 817–824.
Baltpurvins, K.A., Burns, R.C., Lawrance, G.A., 1997. Effect of Ca2+, Mg2+, and anion typeon the aging of iron(III) hydroxide precipitate. Environ. Sci. Technol. 31, 1024–1032.
Belzile, N., Tessier, A., 1990. Interactions between arsenic and iron oxyhydroxides in la-custrine sediments. Geochim. Cosmochim. Acta 54, 103–109.
Bersani, D., Lottici, P.P., Montenero, A., 1999. Micro-Raman investigation of iron oxidefilms and powders produced by sol–gel synthesis. J. Raman Spectrosc. 30, 355–360.
Bigham, J.M., Schwertmann, U., Carlson, L., Murad, E., 1990. A poorly crystallizedoxyhydroxysulfate of iron formed by bacterial oxidation of Fe(II) in acidmine waters.Geochim. Cosmochim. Acta 54, 2743–2758.
Bolanz, R.M., Wierzbicka-Wieczorek, M., Čaplovičová, M., Uhlík, P., Göttlicher, J.,Steininger, R., Majzlan, J., 2013. Structural incorporation of As5+ into hematite. Envi-ron. Sci. Technol. 47, 9140–9147.
Bowell, R.J., Bruce, I., 1995. Geochemistry of iron ochres and mine waters from LevantMine, Cornwall. Appl. Geochem. 10, 237–250.
Chen, N., Jiang, D.T., Cutler, J., Kotzer, T., Jia, Y.F., Demopoulos, G.P., Rowson, J.W., 2009.Structural characterization of poorly-crystalline scorodite, iron(III)–arsenate co-precipitates and uranium mill neutralized raffinate solids using X-ray absorptionfine structure spectroscopy. Geochim. Cosmochim. Acta 73, 3260–3276.
Chernyshova, I.V., Hochella, M.F., Madden, A.S., 2007. Size-dependent structural transfor-mations of hematite nanoparticles. 1. Phase transition. Phys. Chem. Chem. Phys. 9,1736–1750.
Coston, J.A., Fuller, C.C., Davis, J.A., 1995. Pb2+ and Zn2+ adsorption by a naturalaluminum- and iron-bearing surface coating on an aquifer sand. Geochim.Cosmochim. Acta 59, 3535–3547.
Cudennec, Y., Lecerf, A., 2006. The transformation of ferrihydrite into goethite or hema-tite, revisited. J. Solid State Chem. 179, 716–722.
Das, S., Hendry, M.J., 2011. Application of Raman spectroscopy to identify iron mineralscommonly found in mine wastes. Chem. Geol. 290, 101–108.
Das, S., Hendry, M.J., Essilfie-Dughan, J., 2010. The transformation of ferrihydrite under arange in pH (2–10) and temperature (25–100 °C). Proceedings of the 3rd Interna-tional Conference on Uranium, Saskatoon, Saskatchewan, Canada, pp. 337–349.
Das, S., Hendry, M.J., Essilfie-Dughan, J., 2011a. Transformation of two-line ferrihydrite togoethite and hematite as a function of pH and temperature. Environ. Sci. Technol. 45,268–275.
Das, S., Hendry, M.J., Essilfie-Dughan, J., 2011b. Effects of adsorbed arsenate on the rate oftransformation of 2-line ferrihydrite at pH 10. Environ. Sci. Technol. 45, 5557–5563.
Das, S., Essilfie-Dughan, J., Hendry, M.J., 2014. Arsenate partitioning from ferrihydrite tohematite: spectroscopic evidence. Am. Mineral. 99, 749–754.
de Faria, D.L.A., Silva, S.V., de Oliveira, M.T., 1997. Raman microspectroscopy of some ironoxides and oxyhydroxides. J. Raman Spectrosc. 28, 873–878.
Donahue, R., Hendry, M.J., 2003. Geochemistry of arsenic in uranium mine tailings, Sas-katchewan, Canada. Appl. Geochem. 18, 1733–1750.
Dzombak, D.A., Morel, F.M.M., 1990. Surface Complexation Modeling: Hydrous FerricOxide. John Wiley and Sons, New York.
Erel, Y., Morgan, J.J., 1992. The relationships between rock-derived lead and iron in natu-ral waters. Geochim. Cosmochim. Acta 56, 4157–4167.
Essilfie-Dughan, J., Hendry, M.J., Warner, J., Kotzer, T., 2013. Arsenic and iron speciation inuranium mine tailings using X-ray absorption spectroscopy. Appl. Geochem. 28,11–18.
Fendorf, S., Eick,M.J., Grossl, P., Sparks, D.L., 1997. Arsenate and chromate retentionmech-anisms on goethite. 1. Surface structure. Environ. Sci. Technol. 31, 315–320.
Foster, A.L., 2003. Spectroscopic investigations of arsenic species in solid phases. In:Welch, A.H., Stollenwerk, K.G. (Eds.), Arsenic in GroundWater Geochemistry and Oc-currence. Kluwer Academic Publishers, Dordrecht.
Foster, A.L., Brown, G.E., Tingle, T.N., Parks, G.A., 1998. Quantitative arsenic speciation inmine tailings using X-ray absorption spectroscopy. Am. Mineral. 83, 553–568.
Fuller, C.C., Davis, J.A., 1989. Influence of coupling of sorption and photosynthetic process-es on trace element cycles in natural waters. Nature 340, 52–54.
Gálvez, N., Barrón, V., Torrent, J., 1999. Preparation and properties of hematite with struc-tural phosphorous. Clay Clay Miner. 47, 375–385.
George, G.N., Pickering, I.J., 2007. X-ray absorption spectroscopy in biology and chemistry.NATO Sect. Sci. B Phys. 97–119.
Hudson-Edwards, K.A., Macklin, M.G., Curtis, C.D., Vaughan, D.J., 1996. Processes of forma-tion and distribution of Pb-, Zn-, Cd-, and Cu-bearing minerals in the Tyne Basin,northeast England: implications for metal-contaminated river systems. Environ. Sci.Technol. 30, 72–80.
Jambor, J.L., Dutrizac, J.E., 1998. Occurrence and constitution of natural and synthetic fer-rihydrite, a widespread iron oxyhydroxide. Chem. Rev. 98, 2549–2585.
Jia, Y., Demopoulos, G.P., 2005. Adsorption of arsenate onto ferrihydrite from aqueous so-lution: influence of media (sulfate vs. nitrate), added gypsum, and pH alteration. En-viron. Sci. Technol. 39, 9523–9527.
Johnson, C.A., 1986. The regulation of trace element concentrations in river and estuarinewaters contaminatedwith acidmine drainage: The adsorption of Cu and Zn on amor-phous Fe oxyhydroxides. Geochim. Cosmochim. Acta 50, 2433–2438.
Jubb, A.M., Allen, H.C., 2010. Vibrational spectroscopic characterization of hematite,maghemite, and magnetite thin films produced by vapor deposition. Appl. Mater. In-terfaces 2, 2804–2812.
Kelly, S.D., Hesterberg, D., Ravel, B., 2008. Analysis of soils and minerals using X-ray ab-sorption spectroscopy. In: Ulery, A.L., Drees, L.R., Soil Science Society of America(Eds.), Methods of Soil AnalysisPart 5, Mineralogical Methods. Soil Science Societyof America, Madison, WI.
Ladeira, A.C.Q., Ciminelli, V.S.T., Duarte, H.A., Alves, M.C.M., Ramos, A.Y., 2001. Mechanismof anion retention from EXAFS and density functional calculations: arsenic(V) adsorbed on gibbsite. Geochim. Cosmochim. Acta 65, 1211–1217.
Legodi, M.A., de Waal, D., 2007. The preparation of magnetite, goethite, hematite andmaghemite of pigment quality from mill scale iron waste. Dyes Pigments 74,161–168.
Lopez, M., Luis, B., Pasteris, J.D., Biswas, P., 2009. Sensitivity of micro-Raman spectrum tocrystallite size electrospray-deposited and post-annealed films of iron-oxide nano-particle suspensions. Appl. Spectrosc. 174, 627–635.
Mann, H., Fyfe, W.S., 1989. Metal uptake and Fe-, Ti-oxide biomineralization by acidophil-ic microorganisms in mine-waste environments, Elliot Lake, Canada. Can. J. Earth Sci.26, 2731–2735.
McNear, D.H., Tappero, R., Sparks, D.L., 2005. Shining light on metals in the environment.Elements 1, 211–216.
Michel, F.M., Ehm, L., Antao, S.M., Lee, P.L., Chupas, P.J., Liu, G., Strongin, D.R., Schoonen,M.A.A., Phillips, B.L., Parise, J.B., 2007. The structure of ferrihydrite, a nanocrystallinematerial. Science 316, 1726–1729.
Milnes, A.R., Fitzpatrick, R.W., Self, P.G., Fordham, A.W., McClure, S.G., 1992. In: Skinner,H.C.W., Fitzpatrick, R.W. (Eds.), Biomineralization Process of Iron andManganese:Mod-ern and Ancient EnvironmentsCatena Supplement 21. Catena Verlag, Cremlingen-Destedt, p. 233.
Moldovan, B.J., Jiang, D.T., Hendry, M.J., 2003. Mineralogical characterization of arsenic inuraniummine tailings precipitated from iron-rich hydrometallurgical solutions. Envi-ron. Sci. Technol. 37, 873–879.
Morin, G., Calas, G., 2006. Arsenic in soils, mine tailings, and former industrial sites. Ele-ments 2, 97–101.
Muramatsu, C., Sakata, M., Mitsunobu, S., 2012. Immobilization of arsenic(V) during thetransformation of ferrihydrite: a direct speciation study using synchrotron-basedXAFS spectroscopy. Chem. Lett. 41, 270–271.
Paige, C.R., Snodgrass, W.J., Nicholson, R.V., Scharer, J.M., 1996. The crystallization ofarsenate-contaminated iron hydroxide solids at high pH. Water Environ. Res. 68,981–987.
Paktunc, D., Foster, A., Laflamme, G., 2003. Speciation and characterization of arsenic inKetza River mine tailings using X-ray absorption spectroscopy. Environ. Sci. Technol.37, 2067–2074.
Paktunc, D., Foster, A., Heald, S., Laflamme, G., 2004. Speciation and characterization of ar-senic in gold ores and cyanidation tailings using X-ray absorption spectroscopy.Geochim. Cosmochim. Acta 68, 969–983.
Paktunc, D., Dutrizac, J., Gertsman, V., 2008. Synthesis and phase transformations involv-ing scorodite, ferric arsenate and arsenical ferrihydrite: implications for arsenic mo-bility. Geochim. Cosmochim. Acta 72, 2649–2672.
Payne, T.E., Davis, J.A., Waite, T.D., 1994. Uranium retention by weathered schists—therole of iron minerals. Radiochim. Acta 66-7, 297–303.
Ravel, B., Newville, M., 2005. ATHENA, ARTEMIS, HEPHAESTUS: data analysis for X-ray ab-sorption spectroscopy using IFEFFIT. J. Synchrotron Radiat. 12, 537–541.
Rehr, J.J., Albers, R.C., Zabinsky, S.I., 1992. High-order multiple-scattering calculations of X-ray-absorption fine-structure. Phys. Rev. Lett. 69, 3397–3400.
Schwertmann, U., Cornell, R.M., 1991. Iron Oxides in the Laboratory—Preparation andCharacterization. VCH, New York.
Shaw, S.A., Hendry, M.J., Essilfie-Dughan, J., Kotzer, T., Wallschläger, D., 2011. Distribution,characterization, and geochemical controls of elements of concern in uranium minetailings, Key Lake, Saskatchewan, Canada. Appl. Geochem. 26, 2044–2056.
Sherman, D.M., Randall, S.R., 2003. Surface complexation of arsenic(V) to iron(III) (hy-dr)oxides: structural mechanism from ab initio molecular geometries and EXAFSspectroscopy. Geochim. Cosmochim. Acta 67, 4223–4230.
Smedley, P.L., Kinniburgh, D.G., 2002. A review of the source, behaviour and distributionof arsenic in natural waters. Appl. Geochem. 17, 517–568.
U.S. EPA, 2001. Fact Sheet: Drinking Water Standard for Arsenic. EPA, Washington, D.C.Vaughan, D.J., 2006. Arsenic. Elements 2, 71–75.Wang, S., Mulligan, C.N., 2008. Speciation and surface structure of inorganic arsenic in
solid phases: a review. Environ. Int. 34, 867–879.Waychunas, G.A., Rea, B.A., Fuller, C.C., Davis, J.A., 1993. Surface-chemistry of ferrihydrite.
1. EXAFS studies of the geometry of coprecipitated and adsorbed arsenate. Geochim.Cosmochim. Acta 57, 2251–2269.
WHO, 1993. Guidelines for Drinking Water Quality, Vol. 1: Recommendations. 2nd ed.WHO, Geneva.
Xu, Y.Y., Zhao, D., Zhang, X.J., Jin, W.T., Kashkarov, P., Zhang, H., 2009. Synthesis and char-acterization of single-crystalline α-Fe2O3 nanoleaves. Phys. E. 41, 806–811.