fast selective detection of pyocyanin using cyclic voltammetry › files › 122794168 ›...
TRANSCRIPT

General rights Copyright and moral rights for the publications made accessible in the public portal are retained by the authors and/or other copyright owners and it is a condition of accessing publications that users recognise and abide by the legal requirements associated with these rights.
Users may download and print one copy of any publication from the public portal for the purpose of private study or research.
You may not further distribute the material or use it for any profit-making activity or commercial gain
You may freely distribute the URL identifying the publication in the public portal If you believe that this document breaches copyright please contact us providing details, and we will remove access to the work immediately and investigate your claim.
Downloaded from orbit.dtu.dk on: Jun 14, 2020
Fast Selective Detection of Pyocyanin Using Cyclic Voltammetry
Al Atraktchi, Fatima Al-Zahraa; Breum Andersen, Sandra; Johansen, Helle Krogh; Molin, Søren;Svendsen, Winnie Edith
Published in:Sensors
Link to article, DOI:10.3390/s16030408
Publication date:2016
Document VersionPublisher's PDF, also known as Version of record
Link back to DTU Orbit
Citation (APA):Al Atraktchi, F. A-Z., Breum Andersen, S., Johansen, H. K., Molin, S., & Svendsen, W. E. (2016). Fast SelectiveDetection of Pyocyanin Using Cyclic Voltammetry. Sensors, 16(3), [408]. https://doi.org/10.3390/s16030408
sensors
Article
Fast Selective Detection of Pyocyanin UsingCyclic Voltammetry
Fatima AlZahra’a Alatraktchi 1,2,3,*, Sandra Breum Andersen 2, Helle Krogh Johansen 2,4,Søren Molin 2,3 and Winnie E. Svendsen 1
1 Department of Micro- and Nanotechnology, Technical University of Denmark, Ørsteds Plads, 2800 Kgs.Lyngby, Denmark; [email protected]
2 Novo Nordisk Foundation Center for Biosustainability, Technical University of Denmark, Kogle Allé 6,2970 Hørsholm, Denmark; [email protected] (S.B.A.); [email protected] (H.K.J.);[email protected] (S.M.)
3 Department of Systems Biology, Technical University of Denmark, Kemitorvet, 2800 Kgs. Lyngby, Denmark4 Department of Clinical Microbiology, Afsnit 9301, Rigshospitalet, Juliane Maries Vej 22,
2100 København, Denmark* Correspondence: [email protected]; Tel.: +45-4525-6842; Fax: +45-4588-7762
Academic Editor: W. Rudolf SeitzReceived: 8 December 2015; Accepted: 15 March 2016; Published: 19 March 2016
Abstract: Pyocyanin is a virulence factor uniquely produced by the pathogen Pseudomonas aeruginosa.The fast and selective detection of pyocyanin in clinical samples can reveal important informationabout the presence of this microorganism in patients. Electrochemical sensing of the redox-activepyocyanin is a route to directly quantify pyocyanin in real time and in situ in hospitals and clinics. Theselective quantification of pyocyanin is, however, limited by other redox-active compounds existingin human fluids and by other metabolites produced by pathogenic bacteria. Here we present a directselective method to detect pyocyanin in a complex electroactive environment using commerciallyavailable electrodes. It is shown that cyclic voltammetry measurements between ´1.0 V to 1.0 V reveala potential detection window of pyocyanin of 0.58–0.82 V that is unaffected by other redox-activeinterferents. The linear quantification of pyocyanin has an R2 value of 0.991 across the clinicallyrelevant concentration range of 2–100 µM. The proposed method was tested on human saliva showinga standard deviation of 2.5% ˘ 1% (n = 5) from the known added pyocyanin concentration to thesamples. This inexpensive procedure is suggested for clinical use in monitoring the presence andstate of P. aeruginosa infection in patients.
Keywords: electrochemical detection; pyocyanin; quorum sensing; diagnosis; cyclic voltammetry
1. Introduction
Pseudomonas aeruginosa is reported to be among the most problematic bacteria in infectionssuch as bloodstream, surgical wound, burn wound, and cystic fibrosis lung infections [1–3].This opportunistic pathogen is seldom responsible for infections in healthy individuals, but is successfulin immune-compromised patients, where infection causes significant morbidity and mortality [4,5].While factors causing the infections to occur are well known, little is documented about the signals thatallow benign bacteria to become pathogenic [6]. Thus, information regarding the pathogenic behaviorof P. aeruginosa can be gained by monitoring the initial signals produced by this bacterium.
Special for P. aeruginosa is the production of the redox-active molecule pyocyanin. Pyocyaninproduction is controlled by quorum sensing [7]. P. aeruginosa uses quorum sensing to make collectivedecisions about virulence expression. Pyocyanin is assumed to be released prior to virulent activity andmay itself be a quorum sensing signal [8,9]. Thus, the ability to assess the pyocyanin level produced
Sensors 2016, 16, 408; doi:10.3390/s16030408 www.mdpi.com/journal/sensors

Sensors 2016, 16, 408 2 of 10
in patients can reveal valuable information about the state of progression of the infection before aclinical infection is apparent. The redox-active nature of pyocyanin which is uniquely produced by aproblematic bacterium such as P. aeruginosa makes it an excellent biomarker to determine whether apatient is in danger.
In the clinic, body fluids such as urine, blood and sputum are used to determine if a patient isinfected with bacteria. This is done via a microbiological culture of a sample from the body fluid toverify if an infection is present. Sputum cultures are specifically used to help identify the types ofinfections in the lungs and airways of cystic fibrosis patients. Sputum is normally not produced byhealthy individuals, but can be produced in small quantities if irritation of the airways occurs, suchas in the case of smokers and asthma patients. The presence of bacteria in sputum implies that it ispossible to detect pyocyanin directly in sputum samples from patients. However, this also means thatpyocyanin exists in a background of complex body fluids and this needs to be taken into account whenperforming measurements.
Currently, the detection of pyocyanin is accomplished by high-performance liquidchromatography (HPLC) or spectrophotometry. However, these are mostly time-consuming andcostly approaches due to the pre-purification of samples. They also require isolation and culturing ofbacterial samples. Electrochemical sensing is an increasingly popular method for the measurement ofbiochemical compounds due to the ability of specific and sensitive detection of desired molecules [10].One of the advantages of electrochemical sensors is that they can be incorporated into point-of-care(POC) devices, providing fast and real-time diagnosis of the infection state in patients without anypre-treatment [11].
It is possible to detect pyocyanin by electrochemical sensors due to its redox-active nature.There have only been a few reports on detecting pyocyanin using electrochemistry. Sharp et al.presented a carbon fiber sensor for the electrochemical sensing of pyocyanin capable of detectingpyocyanin concentrations between 1 µM and 100 µM [12]. Webster and Goluch were able to detectpyocyanin with palladium hydride reference electrodes integrated in a microfluidic up-concentrationdevice [13]. More recently, Sismaet et al. detected pyocyanin produced by P. aeruginosa by biochemicallyup-regulating the pyocyanin production [14]. These methods are starting to make their way into thegoal of clinical detection of pyocyanin in patients, some of them also by using commercially availableelectrodes [15]. It is common for the studies that detect pyocyanin electrochemically to find thatpyocyanin is exclusively detected at negative potentials around ´250 mV to ´300 mV, claiming thatno other chemicals can interfere with this signal [16,17]. Conversely, interferents from dead cells inhuman fluids can be released and detected at negative potentials, creating misleading results that couldfalsely be identified as pyocyanin. In reality, pyocyanin is produced in an environment of redox-activeprecursors and metabolites that, from an electrochemical perspective, are close to pyocyanin [18–20].Hence, the way to clinical diagnosis of infections using pyocyanin as an infection biomarker startswith the ability to selectively detect pyocyanin among interfering compounds.
The results from this study provide a specific method to selectively detect pyocyanin in a complexmixture of interacting compounds using relatively high positive potentials. In addition, this methodhas been applied on human saliva samples spiked with pyocyanin. The closest body fluid to sputumis saliva, which has been used in the model of this study. The Department of Clinical Microbiology atRigshospitalet in Copenhagen has shown that only 50% of all sputum samples are representative ofthe actual lower airway condition of the patients. The sputum samples were mixed with the salivaproduced by the patient, which makes saliva important to characterize before any attempt of directpyocyanin detection in sputum samples from patients [21]. With background in the results of thisstudy, we suggest using this method for early infection diagnostics in sputum from patients withlung infections.
Sensors 2016, 16, 408 3 of 10
2. Experimental Section
2.1. Reagents
Stock solutions of 100 µM pyocyanin (P0046-25MG, SIGMA, Copenhagen, Denmark), pyoverdine(P8374-1MG, SIGMA, Copenhagen, Denmark), NADP (N5755 SIGMA, Copenhagen, Denmark),NADPH (N5130 SIGMA, Copenhagen, Denmark), NAD (N1636, SIGMA-ALDRICH, Copenhagen,Denmark), NADH (N4505, SIGMA, Copenhagen, Denmark), phenazine-C12H8N2 (P13207 ALDRICH,Copenhagen, Denmark) and Lysogeny Broth (LB) medium were prepared in MilliQ water, respectively.
2.2. Preparation of Samples
Dilutions between 1 µM and 100 µM were prepared for all the compounds. A mixture of thementioned compounds was prepared containing 100 µM of each compound including pyocyanin.This mixture will be referred to as mix-1. A corresponding mixture without addition of pyocyaninwas also prepared, and referred to as mix-2. A dilution series in the range between 0 µM and 100 µMpyocyanin was prepared in MilliQ water and in background concentrations of 5, 25, 50 and 100 µMmix-2, respectively.
2.3. Cyclic Voltammetry Measurements—Experimental Protocol
Disposable screen-printed electrodes with a three-electrode configuration were used for theelectrochemical experiments (C223AT, Dropsens, Spain). The electrodes consisted of a 1.6 mm goldworking electrode, a gold counter electrode and a silver reference electrode. The electrodes wereconnected to a potentiostat (Metrohm Autolab, The Netherlands) from which cyclic voltammetrywas used to characterize the electrochemical profile of the different compounds and to quantify thepyocyanin content. The software Autolab NOVA 1.10 (Metrohm Autolab, The Netherlands) was usedfor data handling, peak finding and analysis.
All the compounds were individually characterized by five cyclic voltammetry sweeps between´1.0 V to 1.0 V and sweep rates of 0.05 V/s using concentrations of 100 µM of each compound.
Cyclic voltammograms between ´1.0 V to 1.0 V and a scan rate of 0.05 V/s were used tocharacterize the profiles of mix-1 and mix-2. The calibration curve was obtained by detecting thecurrent difference for the peaks of cyclic voltammograms performed on the dilution series of pyocyaninand mix-1, respectively; using a potential window of ´0.4 V to 1.0 V and a scan rate of 0.05 V/s. Allthe measurements were conducted versus the Ag reference electrode.
2.4. Cyclic Voltammetry of Human Saliva and Artificial Sputum
Human saliva (approximately 2 mL) was collected from healthy volunteers fasting 12 h priorto the experiment. The saliva was placed on the electrodes and all air bubbles were gently removed.A cyclic voltammetry scan from ´1.0 V to 1.3 V was performed using a scan rate of 0.10 V/s. Salivawas mixed with 100 µM mix-2 and 160 µM pyocyanin and placed on new electrodes before measuringthe current in a potential window of ´1.0 V to 1.0 V using a scan rate of 0.10 V/s. This was repeatedfive times.
Artificial sputum (ASM) was prepared according to Kirchner et al. [22]. A cyclic voltammetryscan from ´1.0 V to 1.0 V was performed using a scan rate of 0.10 V/s. All the measurements wereconducted versus the Ag reference electrode.
3. Results and Discussion
3.1. The Selectivity Window of Pyocyanin
The preliminary assessment of the electrochemical profile of pyocyanin using cyclic voltammetryshows several oxidation peaks at ´0.560 V, ´0.311 V and 0.699 V (Figure 1, blue curve). The MilliQ

Sensors 2016, 16, 408 4 of 10
water control gave no peaks, as expected (black curve). It is likely that the peak at ´0.311 V is equivalentto the pyocyanin peaks located around ´0.25 V to 0.30 V reported by earlier studies [6,12,13].
Sensors 2016, 16, 408 4 of 10
−0.311 V is equivalent to the pyocyanin peaks located around −0.25 V to 0.30 V reported by earlier
studies [6,12,13].
Figure 1. Cyclic voltammogram of 500 µM pyocyanin (blue) compared to the MilliQ water control
(black) using a scan rate of 0.05 V/s. No signals are generated from cyclic voltammetry of MilliQ
water, while pyocyanin reveals a characteristic profile with oxidation peaks at −0.560 V, −0.311 V and
0.699 V (arrows) measured versus the Ag reference electrode.
The characteristic peak potentials of NAD, NADH, NADP, NADP, pyoverdine, phenazine, LB,
human saliva and ASM were extracted from their respective cyclic voltammograms (Figure 2). The
individual cyclic voltammograms of the different compounds can be viewed in the supplementary
data. The detection window of each compound was determined by the characteristic potential peak
that increases proportionally with the increasing concentration. The bars represent the lower and
higher potential intervals which the max peak lies within. Several compounds are represented twice
as two or more peaks corresponded to the increasing concentration. Figure 2 shows that pyocyanin
has two detection windows that are located outside the characteristic detection windows of the
interfering compounds, namely at −0.560 V and at 0.699 V. In contrast, the window of detection with
a max peak at −0.311 V overlaps with human saliva and ASM. This implies that it will not be possible
to distinguish if a peak in this potential window belongs to pyocyanin or the tested body fluid in a
cyclic voltammogram. The implication of this interference is the main reason why the relatively
positive peak potential is more beneficial to use in the quantification experiments compared to the
negative peak potential. The unique and independent detection window of pyocyanin between 0.58 V
and 0.82 V allows selectivity in detection among the other redox-active chemicals.
Figure 2. Potential peak values of the different compounds and related detection width (bars)
extracted from cyclic voltammograms of the individual compounds. The detection window of
pyocyanin with peak at 0.699 V and corresponding start and end potentials lies outside the
interaction width of the other redox-active compounds.
Figure 1. Cyclic voltammogram of 500 µM pyocyanin (blue) compared to the MilliQ water control(black) using a scan rate of 0.05 V/s. No signals are generated from cyclic voltammetry of MilliQ water,while pyocyanin reveals a characteristic profile with oxidation peaks at ´0.560 V, ´0.311 V and 0.699 V(arrows) measured versus the Ag reference electrode.
The characteristic peak potentials of NAD, NADH, NADP, NADP, pyoverdine, phenazine,LB, human saliva and ASM were extracted from their respective cyclic voltammograms (Figure 2).The individual cyclic voltammograms of the different compounds can be viewed in the Supplementarydata. The detection window of each compound was determined by the characteristic potential peakthat increases proportionally with the increasing concentration. The bars represent the lower andhigher potential intervals which the max peak lies within. Several compounds are represented twice astwo or more peaks corresponded to the increasing concentration. Figure 2 shows that pyocyanin hastwo detection windows that are located outside the characteristic detection windows of the interferingcompounds, namely at ´0.560 V and at 0.699 V. In contrast, the window of detection with a maxpeak at ´0.311 V overlaps with human saliva and ASM. This implies that it will not be possible todistinguish if a peak in this potential window belongs to pyocyanin or the tested body fluid in a cyclicvoltammogram. The implication of this interference is the main reason why the relatively positivepeak potential is more beneficial to use in the quantification experiments compared to the negativepeak potential. The unique and independent detection window of pyocyanin between 0.58 V and0.82 V allows selectivity in detection among the other redox-active chemicals.
Sensors 2016, 16, 408 4 of 10
−0.311 V is equivalent to the pyocyanin peaks located around −0.25 V to 0.30 V reported by earlier
studies [6,12,13].
Figure 1. Cyclic voltammogram of 500 µM pyocyanin (blue) compared to the MilliQ water control
(black) using a scan rate of 0.05 V/s. No signals are generated from cyclic voltammetry of MilliQ
water, while pyocyanin reveals a characteristic profile with oxidation peaks at −0.560 V, −0.311 V and
0.699 V (arrows) measured versus the Ag reference electrode.
The characteristic peak potentials of NAD, NADH, NADP, NADP, pyoverdine, phenazine, LB,
human saliva and ASM were extracted from their respective cyclic voltammograms (Figure 2). The
individual cyclic voltammograms of the different compounds can be viewed in the supplementary
data. The detection window of each compound was determined by the characteristic potential peak
that increases proportionally with the increasing concentration. The bars represent the lower and
higher potential intervals which the max peak lies within. Several compounds are represented twice
as two or more peaks corresponded to the increasing concentration. Figure 2 shows that pyocyanin
has two detection windows that are located outside the characteristic detection windows of the
interfering compounds, namely at −0.560 V and at 0.699 V. In contrast, the window of detection with
a max peak at −0.311 V overlaps with human saliva and ASM. This implies that it will not be possible
to distinguish if a peak in this potential window belongs to pyocyanin or the tested body fluid in a
cyclic voltammogram. The implication of this interference is the main reason why the relatively
positive peak potential is more beneficial to use in the quantification experiments compared to the
negative peak potential. The unique and independent detection window of pyocyanin between 0.58 V
and 0.82 V allows selectivity in detection among the other redox-active chemicals.
Figure 2. Potential peak values of the different compounds and related detection width (bars)
extracted from cyclic voltammograms of the individual compounds. The detection window of
pyocyanin with peak at 0.699 V and corresponding start and end potentials lies outside the
interaction width of the other redox-active compounds.
Figure 2. Potential peak values of the different compounds and related detection width (bars) extractedfrom cyclic voltammograms of the individual compounds. The detection window of pyocyanin withpeak at 0.699 V and corresponding start and end potentials lies outside the interaction width of theother redox-active compounds.

Sensors 2016, 16, 408 5 of 10
As the max potential peak of 0.699 V was chosen for further quantification, a suitable scan rangefrom ´0.4 V to 1.0 V was established for the following quantitative investigations. This relativelyhigh potential has never been applied in pyocyanin quantification in previous research. Therefore, theelectrochemical behavior of pyocyanin at these relatively high potentials in a mixture of redox-activecompounds is not yet available for clinical use. The increase of electrode potential is a self-enhancingprocess. When the electrode potential is increased, the ohmic potential drops and the signal-to-noiseratio is enhanced. Thus, the use of relatively high characteristic potentials might enhance the limit ofdetection of pyocyanin, when considering use of, e.g., square wave voltammetry or amperometry.
3.2. Identifying Electrochemical “Fingerprint” of Pyocyanin among Interacting Compounds
A clear electrochemical fingerprint of pyocyanin was observed when detected among otherredox-active compounds that were equal in concentration to pyocyanin. The cyclic voltammogram ofmix-1 clearly reveals the presence of pyocyanin in the sample as a peak at 0.68 V (Figure 3, red curve).On the other hand, no pyocyanin peak is apparent in the cyclic voltammogram of mix-2 (black curve).Mix-2 gives a superposition of an oxidation peak at 0.48 V and a width that is slightly overlappingwith the pyocyanin detection window. In mix-1 it seems likely that the superposition of the peaksof the interfering compounds has shifted to peak around 0.10 V, which is close to the picture givenby Figure 2. Another remarkable observation is that the potential window with a peak at ´0.560 Vdetected in the cyclic voltammogram of pure pyocyanin (Figures 1 and 2) did not appear in Figure 3.This may be due to a non-reversible oxidation of pyocyanin.
Sensors 2016, 16, 408 5 of 10
As the max potential peak of 0.699 V was chosen for further quantification, a suitable scan range
from −0.4 V to 1.0 V was established for the following quantitative investigations. This relatively
high potential has never been applied in pyocyanin quantification in previous research. Therefore,
the electrochemical behavior of pyocyanin at these relatively high potentials in a mixture of
redox-active compounds is not yet available for clinical use. The increase of electrode potential is a
self-enhancing process. When the electrode potential is increased, the ohmic potential drops and the
signal-to-noise ratio is enhanced. Thus, the use of relatively high characteristic potentials might
enhance the limit of detection of pyocyanin, when considering use of, e.g., square wave voltammetry
or amperometry.
3.2. Identifying Electrochemical “Fingerprint” of Pyocyanin among Interacting Compounds
A clear electrochemical fingerprint of pyocyanin was observed when detected among other
redox-active compounds that were equal in concentration to pyocyanin. The cyclic voltammogram
of mix-1 clearly reveals the presence of pyocyanin in the sample as a peak at 0.68 V (Figure 3, red
curve). On the other hand, no pyocyanin peak is apparent in the cyclic voltammogram of mix-2
(black curve). Mix-2 gives a superposition of an oxidation peak at 0.48 V and a width that is slightly
overlapping with the pyocyanin detection window. In mix-1 it seems likely that the superposition of
the peaks of the interfering compounds has shifted to peak around 0.10 V, which is close to the
picture given by Figure 2. Another remarkable observation is that the potential window with a peak
at −0.560 V detected in the cyclic voltammogram of pure pyocyanin (Figures 1 and 2) did not appear
in Figure 3. This may be due to a non-reversible oxidation of pyocyanin.
Figure 3. Cyclic voltammograms of mixture of compounds containing pyocyanin (mix-1, red curve)
and mixture without pyocyanin (mix-2, black curve) measured versus the reference electrode. The red
curve has a peak at 0.68 V confirming the presence of pyocyanin (arrow), while it is absent in the
black curve of mix-2.
3.3. Detection Limit of Pyocyanin in a Complex Mixture of Interfering Compounds
After characterizing the signature of pyocyanin among the interferents, the limit of detection
(LOD) was investigated. A new sensor was used for each measurement to avoid cross-contamination
or fouling of electrodes. The peak currents in the detection window of pyocyanin were extracted
from cyclic voltammograms of pyocyanin in different mix concentrations as presented in Figure 4.
The peak currents were stable despite the increase of mix concentration. However, the LOD of
pyocyanin was affected by the presence of the increasing mix concentration. The LOD was 2 µM
obtained in the absence of any interfering compounds. At 5 µM mix concentration, a detection limit
of 3 µM was obtained. When the mix concentration was increased to 25 µM, the detection limit
increased to 6 µM and remained the same up to 100 µM mix background.
Figure 3. Cyclic voltammograms of mixture of compounds containing pyocyanin (mix-1, red curve)and mixture without pyocyanin (mix-2, black curve) measured versus the reference electrode. The redcurve has a peak at 0.68 V confirming the presence of pyocyanin (arrow), while it is absent in the blackcurve of mix-2.
3.3. Detection Limit of Pyocyanin in a Complex Mixture of Interfering Compounds
After characterizing the signature of pyocyanin among the interferents, the limit of detection(LOD) was investigated. A new sensor was used for each measurement to avoid cross-contaminationor fouling of electrodes. The peak currents in the detection window of pyocyanin were extracted fromcyclic voltammograms of pyocyanin in different mix concentrations as presented in Figure 4. Thepeak currents were stable despite the increase of mix concentration. However, the LOD of pyocyaninwas affected by the presence of the increasing mix concentration. The LOD was 2 µM obtained in theabsence of any interfering compounds. At 5 µM mix concentration, a detection limit of 3 µM wasobtained. When the mix concentration was increased to 25 µM, the detection limit increased to 6 µMand remained the same up to 100 µM mix background.
Sensors 2016, 16, 408 6 of 10
Sensors 2016, 16, 408 6 of 10
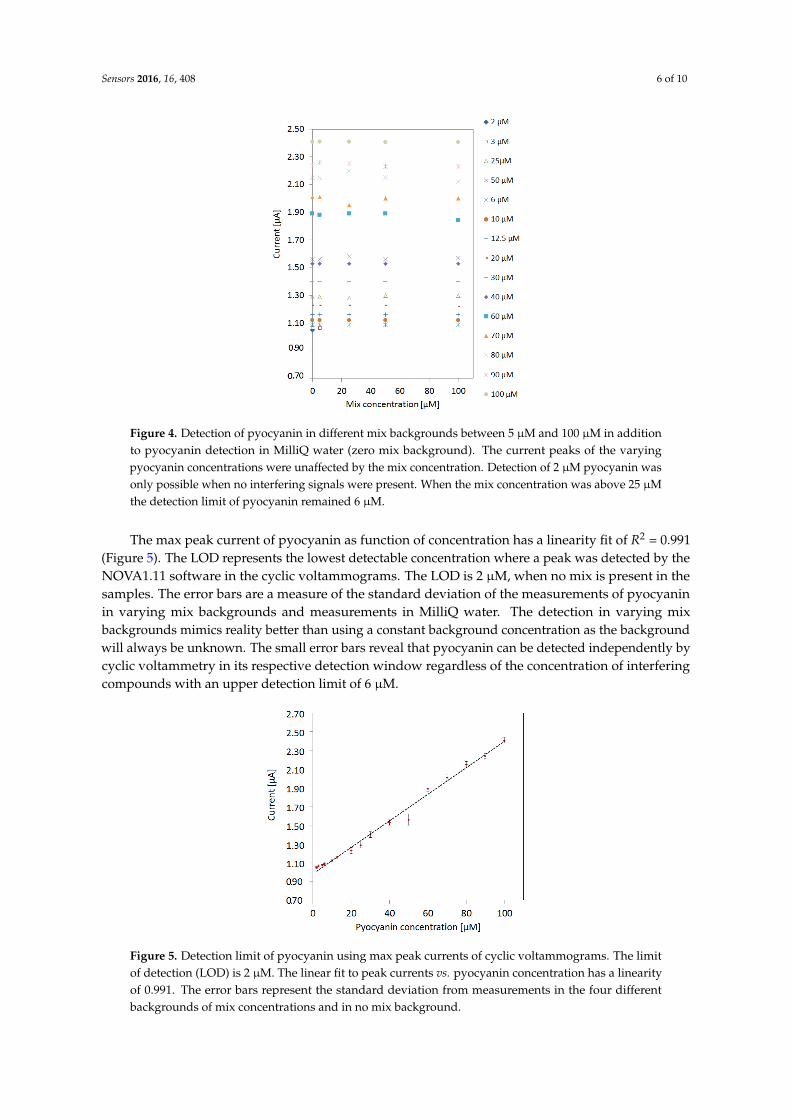
Figure 4. Detection of pyocyanin in different mix backgrounds between 5 µM and 100 µM in
addition to pyocyanin detection in MilliQ water (zero mix background). The current peaks of the
varying pyocyanin concentrations were unaffected by the mix concentration. Detection of 2 µM
pyocyanin was only possible when no interfering signals were present. When the mix concentration
was above 25 µM the detection limit of pyocyanin remained 6 µM.
The max peak current of pyocyanin as function of concentration has a linearity fit of R2 = 0.991
(Figure 5). The LOD represents the lowest detectable concentration where a peak was detected by
the NOVA1.11 software in the cyclic voltammograms. The LOD is 2 µM, when no mix is present in
the samples. The error bars are a measure of the standard deviation of the measurements of
pyocyanin in varying mix backgrounds and measurements in MilliQ water. The detection in varying
mix backgrounds mimics reality better than using a constant background concentration as the
background will always be unknown. The small error bars reveal that pyocyanin can be detected
independently by cyclic voltammetry in its respective detection window regardless of the
concentration of interfering compounds with an upper detection limit of 6 µM.
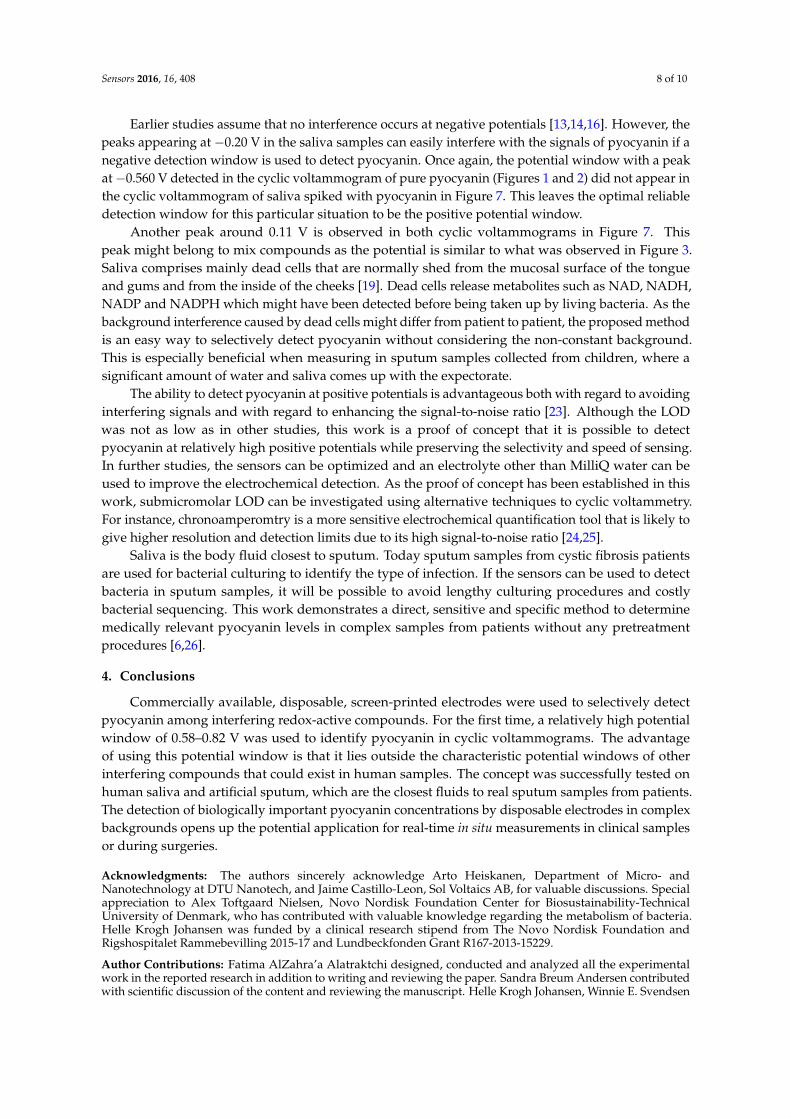
Figure 5. Detection limit of pyocyanin using max peak currents of cyclic voltammograms. The limit
of detection (LOD) is 2 µM. The linear fit to peak currents vs. pyocyanin concentration has a linearity
of 0.991. The error bars represent the standard deviation from measurements in the four different
backgrounds of mix concentrations and in no mix background.
Figure 4. Detection of pyocyanin in different mix backgrounds between 5 µM and 100 µM in additionto pyocyanin detection in MilliQ water (zero mix background). The current peaks of the varyingpyocyanin concentrations were unaffected by the mix concentration. Detection of 2 µM pyocyanin wasonly possible when no interfering signals were present. When the mix concentration was above 25 µMthe detection limit of pyocyanin remained 6 µM.
The max peak current of pyocyanin as function of concentration has a linearity fit of R2 = 0.991(Figure 5). The LOD represents the lowest detectable concentration where a peak was detected by theNOVA1.11 software in the cyclic voltammograms. The LOD is 2 µM, when no mix is present in thesamples. The error bars are a measure of the standard deviation of the measurements of pyocyaninin varying mix backgrounds and measurements in MilliQ water. The detection in varying mixbackgrounds mimics reality better than using a constant background concentration as the backgroundwill always be unknown. The small error bars reveal that pyocyanin can be detected independently bycyclic voltammetry in its respective detection window regardless of the concentration of interferingcompounds with an upper detection limit of 6 µM.
Sensors 2016, 16, 408 6 of 10
Figure 4. Detection of pyocyanin in different mix backgrounds between 5 µM and 100 µM in
addition to pyocyanin detection in MilliQ water (zero mix background). The current peaks of the
varying pyocyanin concentrations were unaffected by the mix concentration. Detection of 2 µM
pyocyanin was only possible when no interfering signals were present. When the mix concentration
was above 25 µM the detection limit of pyocyanin remained 6 µM.
The max peak current of pyocyanin as function of concentration has a linearity fit of R2 = 0.991
(Figure 5). The LOD represents the lowest detectable concentration where a peak was detected by
the NOVA1.11 software in the cyclic voltammograms. The LOD is 2 µM, when no mix is present in
the samples. The error bars are a measure of the standard deviation of the measurements of
pyocyanin in varying mix backgrounds and measurements in MilliQ water. The detection in varying
mix backgrounds mimics reality better than using a constant background concentration as the
background will always be unknown. The small error bars reveal that pyocyanin can be detected
independently by cyclic voltammetry in its respective detection window regardless of the
concentration of interfering compounds with an upper detection limit of 6 µM.
Figure 5. Detection limit of pyocyanin using max peak currents of cyclic voltammograms. The limit
of detection (LOD) is 2 µM. The linear fit to peak currents vs. pyocyanin concentration has a linearity
of 0.991. The error bars represent the standard deviation from measurements in the four different
backgrounds of mix concentrations and in no mix background.
Figure 5. Detection limit of pyocyanin using max peak currents of cyclic voltammograms. The limitof detection (LOD) is 2 µM. The linear fit to peak currents vs. pyocyanin concentration has a linearityof 0.991. The error bars represent the standard deviation from measurements in the four differentbackgrounds of mix concentrations and in no mix background.

Sensors 2016, 16, 408 7 of 10
The peak potential of pyocyanin shifts slightly to higher values as a function of pyocyaninconcentration (Figure 6). The fit indicates a slight increase of potential as a function of concentration.As the pyocyanin concentration decreases, the corresponding potential peak approximates the lowerlimit of the pyocyanin detection window. This may explain the detection limit around 2 µM.
Sensors 2016, 16, 408 7 of 10
The peak potential of pyocyanin shifts slightly to higher values as a function of pyocyanin
concentration (Figure 6). The fit indicates a slight increase of potential as a function of concentration.
As the pyocyanin concentration decreases, the corresponding potential peak approximates the lower
limit of the pyocyanin detection window. This may explain the detection limit around 2 µM.
Figure 6. Peak potential as function of pyocyanin concentration. The potential peaks go towards the
lower detection window of pyocyanin as the pyocyanin concentration decreases.
3.4. Detection of Pyocyanin in Saliva Samples
An example of a cyclic voltammogram of healthy human saliva is plotted along with a cyclic
voltammogram of human saliva containing 160 µM pyocyanin and 50 µM mix-2 in Figure 7. Mix-2
was added in order to complicate the background and observe if it is still possible to detect the
pyocyanin. Complicating the background is important since the interference caused by dead cells in
the human saliva is not necessarily equal from person to another. Peaks at −0.20 V are seen in both
measurements while a peak at 0.60 V only appears in the saliva sample containing pyocyanin.
The peak potential lies within the selectivity window of pyocyanin, thus confirming the sensing of
pyocyanin. The peak current is 3.31 × 10⁻⁶, corresponding to 164 ± 2 µM (n = 5) pyocyanin according
to the calibration curve in Figure 5. It is a deviation of 2.5 ± 1% SE from the known pyocyanin
concentration added to the samples.
Figure 7. Example of pyocyanin detection in human saliva sample. Black illustrates a cyclic
voltammogram of human saliva without pyocyanin. Dark red cyclic voltammogram is of human
saliva containing pyocyanin and mix. The peak around 0.60 V versus the reference electrode confirms
the presence of pyocyanin in the sample (arrow).
Figure 6. Peak potential as function of pyocyanin concentration. The potential peaks go towards thelower detection window of pyocyanin as the pyocyanin concentration decreases.
3.4. Detection of Pyocyanin in Saliva Samples
An example of a cyclic voltammogram of healthy human saliva is plotted along with a cyclicvoltammogram of human saliva containing 160 µM pyocyanin and 50 µM mix-2 in Figure 7. Mix-2 wasadded in order to complicate the background and observe if it is still possible to detect the pyocyanin.Complicating the background is important since the interference caused by dead cells in the humansaliva is not necessarily equal from person to another. Peaks at ´0.20 V are seen in both measurementswhile a peak at 0.60 V only appears in the saliva sample containing pyocyanin. The peak potentiallies within the selectivity window of pyocyanin, thus confirming the sensing of pyocyanin. The peakcurrent is 3.31 ˆ 10´6, corresponding to 164 ˘ 2 µM (n = 5) pyocyanin according to the calibrationcurve in Figure 5. It is a deviation of 2.5% ˘ 1% SE from the known pyocyanin concentration added tothe samples.
Sensors 2016, 16, 408 7 of 10
The peak potential of pyocyanin shifts slightly to higher values as a function of pyocyanin
concentration (Figure 6). The fit indicates a slight increase of potential as a function of concentration.
As the pyocyanin concentration decreases, the corresponding potential peak approximates the lower
limit of the pyocyanin detection window. This may explain the detection limit around 2 µM.
Figure 6. Peak potential as function of pyocyanin concentration. The potential peaks go towards the
lower detection window of pyocyanin as the pyocyanin concentration decreases.
3.4. Detection of Pyocyanin in Saliva Samples
An example of a cyclic voltammogram of healthy human saliva is plotted along with a cyclic
voltammogram of human saliva containing 160 µM pyocyanin and 50 µM mix-2 in Figure 7. Mix-2
was added in order to complicate the background and observe if it is still possible to detect the
pyocyanin. Complicating the background is important since the interference caused by dead cells in
the human saliva is not necessarily equal from person to another. Peaks at −0.20 V are seen in both
measurements while a peak at 0.60 V only appears in the saliva sample containing pyocyanin.
The peak potential lies within the selectivity window of pyocyanin, thus confirming the sensing of
pyocyanin. The peak current is 3.31 × 10⁻⁶, corresponding to 164 ± 2 µM (n = 5) pyocyanin according
to the calibration curve in Figure 5. It is a deviation of 2.5 ± 1% SE from the known pyocyanin
concentration added to the samples.
Figure 7. Example of pyocyanin detection in human saliva sample. Black illustrates a cyclic
voltammogram of human saliva without pyocyanin. Dark red cyclic voltammogram is of human
saliva containing pyocyanin and mix. The peak around 0.60 V versus the reference electrode confirms
the presence of pyocyanin in the sample (arrow).
Figure 7. Example of pyocyanin detection in human saliva sample. Black illustrates a cyclicvoltammogram of human saliva without pyocyanin. Dark red cyclic voltammogram is of humansaliva containing pyocyanin and mix. The peak around 0.60 V versus the reference electrode confirmsthe presence of pyocyanin in the sample (arrow).
Sensors 2016, 16, 408 8 of 10
Earlier studies assume that no interference occurs at negative potentials [13,14,16]. However, thepeaks appearing at ´0.20 V in the saliva samples can easily interfere with the signals of pyocyanin if anegative detection window is used to detect pyocyanin. Once again, the potential window with a peakat ´0.560 V detected in the cyclic voltammogram of pure pyocyanin (Figures 1 and 2) did not appear inthe cyclic voltammogram of saliva spiked with pyocyanin in Figure 7. This leaves the optimal reliabledetection window for this particular situation to be the positive potential window.
Another peak around 0.11 V is observed in both cyclic voltammograms in Figure 7. Thispeak might belong to mix compounds as the potential is similar to what was observed in Figure 3.Saliva comprises mainly dead cells that are normally shed from the mucosal surface of the tongueand gums and from the inside of the cheeks [19]. Dead cells release metabolites such as NAD, NADH,NADP and NADPH which might have been detected before being taken up by living bacteria. As thebackground interference caused by dead cells might differ from patient to patient, the proposed methodis an easy way to selectively detect pyocyanin without considering the non-constant background.This is especially beneficial when measuring in sputum samples collected from children, where asignificant amount of water and saliva comes up with the expectorate.
The ability to detect pyocyanin at positive potentials is advantageous both with regard to avoidinginterfering signals and with regard to enhancing the signal-to-noise ratio [23]. Although the LODwas not as low as in other studies, this work is a proof of concept that it is possible to detectpyocyanin at relatively high positive potentials while preserving the selectivity and speed of sensing.In further studies, the sensors can be optimized and an electrolyte other than MilliQ water can beused to improve the electrochemical detection. As the proof of concept has been established in thiswork, submicromolar LOD can be investigated using alternative techniques to cyclic voltammetry.For instance, chronoamperomtry is a more sensitive electrochemical quantification tool that is likely togive higher resolution and detection limits due to its high signal-to-noise ratio [24,25].
Saliva is the body fluid closest to sputum. Today sputum samples from cystic fibrosis patientsare used for bacterial culturing to identify the type of infection. If the sensors can be used to detectbacteria in sputum samples, it will be possible to avoid lengthy culturing procedures and costlybacterial sequencing. This work demonstrates a direct, sensitive and specific method to determinemedically relevant pyocyanin levels in complex samples from patients without any pretreatmentprocedures [6,26].
4. Conclusions
Commercially available, disposable, screen-printed electrodes were used to selectively detectpyocyanin among interfering redox-active compounds. For the first time, a relatively high potentialwindow of 0.58–0.82 V was used to identify pyocyanin in cyclic voltammograms. The advantageof using this potential window is that it lies outside the characteristic potential windows of otherinterfering compounds that could exist in human samples. The concept was successfully tested onhuman saliva and artificial sputum, which are the closest fluids to real sputum samples from patients.The detection of biologically important pyocyanin concentrations by disposable electrodes in complexbackgrounds opens up the potential application for real-time in situ measurements in clinical samplesor during surgeries.
Acknowledgments: The authors sincerely acknowledge Arto Heiskanen, Department of Micro- andNanotechnology at DTU Nanotech, and Jaime Castillo-Leon, Sol Voltaics AB, for valuable discussions. Specialappreciation to Alex Toftgaard Nielsen, Novo Nordisk Foundation Center for Biosustainability-TechnicalUniversity of Denmark, who has contributed with valuable knowledge regarding the metabolism of bacteria.Helle Krogh Johansen was funded by a clinical research stipend from The Novo Nordisk Foundation andRigshospitalet Rammebevilling 2015-17 and Lundbeckfonden Grant R167-2013-15229.
Author Contributions: Fatima AlZahra’a Alatraktchi designed, conducted and analyzed all the experimentalwork in the reported research in addition to writing and reviewing the paper. Sandra Breum Andersen contributedwith scientific discussion of the content and reviewing the manuscript. Helle Krogh Johansen, Winnie E. Svendsen
Sensors 2016, 16, 408 9 of 10
and Søren Molin contributed by supervising and reviewing the paper. All authors read and approved thefinal manuscript.
Conflicts of Interest: The authors declare no conflict of interest.
References
1. Miller, L.C.; O’Loughlin, C.T.; Zhang, Z.; Siryaporn, A.; Silpe, J.E.; Bassler, B.L.; Semmelhack, M.F.Development of potent inhibitors of pyocyanin production in Pseudomonas aeruginosa. J. Med. Chem. 2015, 58,1298–1306. [CrossRef] [PubMed]
2. Damkiær, S.; Yang, L.; Molin, S.; Jelsbak, L. Evolutionary remodeling of global regulatory networks duringlong-term bacterial adaptation to human hosts. Proc. Natl. Acad. Sci. USA 2013, 110, 7766–7771. [CrossRef][PubMed]
3. Abu, E.A.; Su, S.; Sallans, L.; Boissy, R.E.; Greatens, A.; Heineman, W.R.; Hassett, D.J. Cyclicvoltammetric, fluorescence and biological analysis of purified aeruginosin A, a secreted red pigment ofPseudomonas aeruginosa PAO1. Microbiology 2013, 159, 1736–1747. [CrossRef] [PubMed]
4. Rada, B.; Gardina, P.; Myers, T.G.; Leto, T.L. Reactive oxygen species mediate inflammatory cytokinerelease and EGFR-dependent mucin secretion in airway epithelial cells exposed to Pseudomonas pyocyanin.Muscosal. Immunol. 2011, 4, 158–171. [CrossRef] [PubMed]
5. Rada, B.; Leto, T.L. Pyocyanin effects on respiratory epithelium: Relevance in Pseudomonas aeruginosa airwayinfections. Trends Microbiol. 2013, 21, 73–81. [CrossRef] [PubMed]
6. Webster, T.A.; Goluch, E.D. Electrochemical detection of pyocyanin in nanochannels with integratedpalladium hydride reference electrodes. Lab. Chip 2012, 12, 5195–5201. [CrossRef] [PubMed]
7. Michel-Briand, Y.; Baysse, C. The pyocins of Pseudomonas aeruginosa. Biochimie 2002, 84, 499–510. [CrossRef]8. Jayaseelan, S.; Ramaswamy, D.; Dharmaraj, S. Pyocyanin: Production, applications, challenges and new
insights. World J. Microb. Biotechnol. 2014, 30, 1159–1168. [CrossRef] [PubMed]9. Dietrich, L.E.P.; Price-Whelan, A.; Petersen, A.; Whiteley, M.; Newman, D.K. The phenazine pyocyanin is a
terminal signalling factor in the quorum sensing network of Pseudomonas aeruginosa. Mol. Microbiol. 2006,61, 1308–1321. [CrossRef] [PubMed]
10. Alatraktchi, F.A.; Bakmand, T.; Dimaki, M.; Svendsen, W.E. Novel Membrane-Based Electrochemical Sensorfor Real-Time Bio-Applications. Sensors 2014, 14, 22128–22139. [CrossRef] [PubMed]
11. Svendsen, W.E.; Alatraktchi, F.A.; Bakmand, T.; Waagepetersen, H.; Dimaki, M. Novel culturing platform forbrain slices and neuronal cells. IEEE Eng. Med. Biol. Soc. 2015, 3299, 346–349.
12. Sharp, D.; Gladstone, P.; Smith, R.B.; Forsythe, S.; Davis, J. Approaching intelligent infection diagnostics:Carbon fibre sensor for delectrochemical pyocyanin detection. Bioelectrochemistry 2009, 77, 114–119.[CrossRef] [PubMed]
13. Sismaet, H.J.; Webster, T.A.; Goluch, E.D. Up-regulating pyocyanin production by amino acid addition forearly electrochemical identification of Pseudomonas aeruginosa. Analyst 2014, 139, 4241–4246. [CrossRef][PubMed]
14. Seviour, T.; Doyle, L.E.; Lauw, S.J.L.; Hinks, J.; Rice, S.A.; Netsatyy, V.J.; Webster, R.D.; Kjelleberg, S.;Marsili, E. Voltammetric profiling of redox-active metabolites expressed by Pseudomonas aeruginosa fordiagnostic purposes. Chem. Commun. 2015, 51, 3789–3792. [CrossRef] [PubMed]
15. Webster, T.A.; Sismaet, H.J.; Conte, J.L.; Chan, I.C.; Goluch, E.D. Electrochemical detection ofPseudomonas aeruginosa in human fluid samples via pyocyanin. Biosens. Bioelectron. 2014, 60, 265–270.[CrossRef] [PubMed]
16. Bellin, D.L.; Sakhtah, H.; Rosenstein, J.K.; Levine, P.M.; Thimot, J.; Emmett, K.; Dietrich, L.E.P.; Shepard, K.L.Integrated circuit-based electrochemical sensor for spatially resolved detection of redox-active metabolitesin biofilms. Nat. Commun. 2014, 5, 3256. [CrossRef] [PubMed]
17. Munteanu, G.; Dempsey, E.; McCormac, T.; Munteanu, C. Fast cyclic voltammetry of redox systemNAD+/NADH on the copper nanodoped mercury monolayer carbon fiber electrode. J. Electroanal. Chem.2012, 665, 12–19. [CrossRef]
18. Lin, K.-C.; Chen, S.-M. Reversible cyclic voltammetry of the NADH/NAD+ redox system on hybridpoly(luminol)/FAD film modified electrodes. J. Electroanal. Chem. 2006, 589, 52–59. [CrossRef]
Sensors 2016, 16, 408 10 of 10
19. Roka, A.; Inzelt, G. Cyclic voltammetric and nanogravimetric studies of NADP+ redox transformations on ayeast-modified platinum electrode. Electrochem. Commun. 2014, 45, 9–12.
20. Godderis, L.; Schouteden, C.; Tabish, A.; Poels, K.; Hoet, P.; Baccarelli, A.A.; van Landuyt, K. GlobalMethylation and Hydroxymethylation in DNA from Blood and Saliva in Healthy Volunteers. BioMed Res.Int. 2015, 2015, 845041. [CrossRef] [PubMed]
21. Johansen, H.K.; Department of Clinical Microbiology, Rigshospitalet, Copenhagen, Denmark. Repræsentativtmateriale til mikrobiologisk diagnostik af nedre luftvejsinfektioner. Personal communication, 2016.(In Danish)
22. Kirchner, S.; Fothergill, J.L.; Wright, E.A.; James, C.E.; Mowat, E.; Winstanley, C. Use of Artificial SputumMedium to Test Antibiotic Efficacy Against Pseudomonas aeruginosa in Conditions More Relevant to theCystic Fibrosis Lung. Jove-Journal of Visualized Experiments. J. Vis. Exp. 2012, 64, e3857. [PubMed]
23. Alatraktchi, F.A.-Z.; Molin, S.; Johansen, H.K.; Svendsen, W.E. Nano-molar selective detection of pyocyaninusing electrochemical amperometry for diagnostic purposes. Future Med. 2016, submitted.
24. Bard, A.J.; Faulkner, L.R. Electrochemical Methods—Fundamentals and Applications; Wiley: New York, NY, USA, 2001.25. Kissinger, P.; Heineman, W.R. Laboratory Techniques in Electroanalytical Chemistry, 2nd ed.; CRC Press:
New York, NY, USA, 1996.26. Caldwell, C.C.; Chen, Y.; Goetzmann, H.S.; Hao, Y.; Borchers, M.T.; Hassett, D.J.; Young, L.R.; Mavrodi, D.;
Thomashow, L.; Lau, G.W. Pseudomonas aeruginosa Exotoxin Pyocyanin Causes Cystic Fibrosis AirwayPathogenesis. Am. J. Pathol. 2009, 175, 2473–2488. [CrossRef] [PubMed]
© 2016 by the authors; licensee MDPI, Basel, Switzerland. This article is an open accessarticle distributed under the terms and conditions of the Creative Commons by Attribution(CC-BY) license (http://creativecommons.org/licenses/by/4.0/).