fast money? the contribution of state tax amnesties … · fast money? the contribution of state...
TRANSCRIPT
National Tax Journal, September 2012, 65 (3), 529–562
FAST MONEY? THE CONTRIBUTION OF STATE TAX AMNESTIES TO PUBLIC REVENUE SYSTEMS
John L. Mikesell and Justin M. Ross
State tax amnesties have become a commonplace component of state tax administra-tion over the last 30 years. This paper reviews the structural evolution of all state amnesty programs and makes the case that their fundamental purpose has shifted from improving tax administration to emphasizing revenue maximization. It then provides empirical evidence on which state amnesty program features aid in this effort. The regression results reveal that most of the malleable amnesty program features that tend to increase amnesty recoveries also confl ict with or undermine the goal of improving the tax administration system.
Keywords: tax amnesty, state tax administration
JEL Code: H71, H30
More that 20 years ago, Alm, McKee, and Beck (1990, p. 23) wrote,
Beleaguered by declining tax revenues and mounting expenditures, many state governments in recent years have sought alternative and novel revenue sources. One approach that has been used by twenty-eight states since 1981 is the tax amnesty.
At the time, those states had conducted a total of 37 amnesties, and the programs still carried a sense of being a new development for American government fi nance. Amnes-ties seemed to be a tool more appropriate for chronically non-compliant European or developing countries, which could use them to boost collections and possibly compli-ance. American observers were principally worried about the consequences of tax
John L. Mikesell: Chancellor’s Professor, School of Public & Environmental Aff airs, Indiana University, Bloomington, IN, USA ([email protected])
Justin M. Ross: Assistant Professor, School of Public & Environmental Aff airs, Indiana University, Bloom-ington, IN, USA ([email protected])

National Tax Journal530
amnesties for voluntary compliance, especially if taxpayers developed an expectation that the next amnesty might be just on the horizon.1
The reviews of these early efforts concluded that tax amnesties were fi rst and fore-most a tool for improving tax administration. In a study of the fi rst 26 state amnesty programs, Mikesell (1986) examined their structural features, noting throughout how these attributes contributed to the state system of tax administration. In a pair of inde-pendent surveys of state tax administrators, Ross (1986) and Parle and Hirlinger (1986) reviewed the goals and objectives of the early amnesty programs.2 They similarly found relatively little interest among the states in boosting short-term revenue, as emphasis was placed on bundling the amnesty with other enforcement strategies and improved compliance initiatives.
After 117 programs (and counting) over 30 years,3 we argue in this paper that amnesties have evolved into a standard component of American state tax collection systems with a purpose quite different from the administrative functions described in the contribu-tions of Mikesell, Parle and Hirlinger, and Ross cited above. Specifi cally, we argue that amnesties have become tools of revenue generation, and that this is being pursued even at the expense of existing systems of tax administration. To demonstrate this, the fi rst part of this article provides a narrative analysis of the path of state tax amnesty programs since 1981, paying particular attention to the amnesty features highlighted in Mikesell (1986). This overview demonstrates the differences in structure between the early surge of amnesties in the 1980s and more recent amnesties (the 66 conducted or scheduled since 2000). This paper then regresses amnesty recoveries against features of the amnesty programs. The empirical evidence indicates that most program features that are correlated with greater recoveries are those which confl ict with tax administra-tion concerns.
1 The fi rst tax amnesty on record was reported on the Rosetta stone, an amnesty declared by Ptolemy V Epiphanes in Egypt, circa 200 BC. The stone itself expressed the appreciation of the priesthood for the program. It is not clear whether any state amnesties were based on this experience.
2 Ross (1986) was able to survey more states, but was a bit less expansive on the issues relevant to state administration than Parle and Hirlinger (1986).
3 This count is through December 2011. The tally does not include special use tax amnesties variously granted to try to induce remote vendors or their in-state clients to come forward with otherwise uncollected tax, for instance, the Illinois amnesty for remote vendor purchases for January 1–October 15, 2011 or other special amnesties to bring fi rms into programs associated with the Streamlined Sales Tax Program. Likewise, it does not include narrow programs like the Kentucky “Expedited Protest Resolution” program of 2010 (the Kentucky Department of Revenue (2010) explicitly states that this program was not an amnesty), or the Minnesota 2010 amnesty for offshore accounts and foreign entities used to evade taxes. It does not include the Pennsylvania use tax self-audit/amnesty program from March 1, 1983–June 30, 1983 that waived penalty and interest for previously unknown liabilities from 1980–1982 and recovered $2,452,499. A similar use tax program conducted by Maine from July 1, 2006 through December 31, 2006 for liabilities from January 1, 2000 through December 31, 2005 is also not included. The count also excludes permanent “voluntary compliance initiatives” offered in many states that offer open-ended forgiveness of penalties for taxpayers who voluntarily come forward with liability previously unknown to the state. Also, it does not count local tax amnesties conducted separately from those run by the state.

Contributions of State Tax Amnesties to State Revenues 531
The layout of the paper is as follows. The next section provides background on tax amnesties drawing on the previous literature especially as it pertains to systems of tax administration. Section II discusses the pattern of amnesty offerings and revenue recoveries across the states over time. Section III proceeds with a narrative analysis of how the program features within the amnesties have evolved over time to refl ect a tool for revenue generation rather than improving administration. Section IV presents an empirical analysis of how these features actually affect revenue recovery, and Section V concludes.
I. THE AMNESTY IDEA
Baer and LeBorgne (2008, p. 5) defi ne a tax amnesty to be “a limited-time offer by the government to a specifi ed group of taxpayers to pay a defi ned amount, in exchange for forgiveness of a tax liability (including interest and penalties), relating to a previous tax period(s), as well as freedom from legal prosecution.”4 These temporary programs allow taxpayers who have previously evaded taxation to voluntarily remit unpaid taxes without incurring all the sanctions that failure of timely payment would ordinarily incur. If collected through enforcement action, taxpayers with these liabilities would owe the tax plus various penalties and interest on the unpaid amount and might also be subject to felony prosecution. By participating in the amnesty, taxpayers can avoid certain program-specifi ed consequences.
To consider the contribution and the complication that an amnesty might make to tax administration fi rst requires an understanding of tax administration itself. Penniman (1980, p.173) aptly characterized tax administration in this way: “… the tax offi cial’s service can be generalized only in terms of the value of the revenue he collects for the operation of all government and in the fairness with which he collects such revenue within the state’s tax framework.” The tax amnesty likewise must balance revenue and fairness in the service of tax administration. One contribution is the extra revenue that may fl ow from the amnesty, which the amnesty no doubt accomplishes in a manner particularly appealing to elected representatives. Amnesty collections emerge without the politically diffi cult tasks of increasing statutory rates or changing defi nitions in the tax base. Amnesty programs, however, raise equity concerns that likely impact the overall effi ciency of state tax administration. Because the money comes from those who previously had shirked payment, the amnesty understandably strikes the public as a special deal for evaders and therefore arguably violates principles of general fairness. Honest taxpayers may believe they have been cheated by the special deal provided to evaders, which could harm overall compliance by encouraging the attitude that waiting for the next amnesty is better than perpetual voluntary compliance. Since most major tax systems rely on voluntary compliance to generate collections, putting the honest taxpayer at regular economic disadvantage conceivably works against the efforts of
4 Forgiveness in the American states involves penalties, interest, and prosecution, not the basic liability.

National Tax Journal532
an effi cient system of tax administration. Furthermore, the only new revenue truly generated by the amnesty comes from those collections that would not otherwise be uncovered through normal enforcement efforts. Amnesty programs are revenue losers on accounts whose collection would occur without forgiveness, but surrender interest and penalties nevertheless. Hence there is a concern that the amnesty may harm the compliance climate and discriminate against the honest taxpayer for what may be little true new revenue. The diffi culty in accomplishing this balancing act between obtaining additional revenues and harming the compliance climate is the source of the reluctance that states historically had in regard to the amnesties.
The compliance effect of the amnesty seems crucial both in terms of revenue potential and as a signal of equity implications, but empirical evidence of such an impact is far from conclusive due to the complexity of the research question. A few studies have studied individual amnesty programs and the responses by taxpayers over time. From a random sample of tax amnesty participants, Fisher, Goodeeris, and Young (1989) found that the early Michigan experience did not signifi cantly bring previously unknown delinquent taxpayers permanently back to the tax rolls. Instead, they found that most amnesty participants were taxpayers known to the state who were paying only a portion of unpaid liabilities, and that a high estimate of the new taxpayers remaining on the rolls permanently was about 21 percent; Christian, Gupta, and Young (2002) came to similar conclusions on the same Michigan-1 (1986) amnesty after examining subsequent fi lings over a longer time horizon. Likewise, Joulfaian (1989) found that more than half of the Massachusetts-1 (1983) program participants were known delinquents, and 70 percent of their liabilities were less than four years old, which are the most likely to be collected under routine operations. Alm and Beck (1993) found no effect, positive or negative, in a careful time-series analysis of tax collection levels and trends that could be attributed to the 1985 Colorado amnesty program. Though informative, the main drawback of these single program ex-post analyses is that there is no variation at the program level; there are also concerns regarding their external validity.
Luitel and Sobel (2007) extended the literature by examining multiple states over time by drawing upon 37 state quarterly revenue collections with “regular” tax systems between 1981 and 2004.5 In a series of panel fi xed effect regressions, they found robust evidence that repeated offerings of amnesty reduced state revenue collections, which is consistent with a compliance problem in post-amnesty periods. A limitation of the Luitel and Sobel (2007) analysis, however, was the diffi culty in determining whether a downward trend in revenue collections following each amnesty iteration was a conse-quence of the amnesty itself, or if instead states repeatedly offer and reoffer amnesties because of persistent revenue problems.
Alm, McKee, and Beck (1990) found that participant taxpayer compliance decreased with amnesty offerings in an experimental setting, better allowing for the randomization not found in real world policy. In their experiment, subjects were divided into different sessions where they would voluntarily report their income for taxation over 25 rounds.
5 They defi ned “regular” tax systems as those that did not exclude a major tax base like sales or income.

Contributions of State Tax Amnesties to State Revenues 533
By itself, the introduction of an amnesty did appear to lower compliance, but introduc-ing new enforcement strategies and making promises of the amnesty being a “one-time event” appeared to be successful in offsetting this effect. This might be considered the strongest evidence that improving long-run compliance post-amnesty is possible, but it is not clear that the experimental settings transfer to the real world of politics and policy. For instance, lab administrators might be considered more credible by their subjects in such promises than state policy makers would be by their constituencies.
Though all the studies have their limitations, the preponderance of evidence is against the view that amnesties increase long-run revenues. The clearest conclusion from this research is that the fi scal contribution of an amnesty is in the direct recovery during the amnesty but not later.6 Therefore, it is important to measure and understand this direct recovery revenue because it may well be the only fi scal contribution of the amnesty.
II. AMNESTIES AND THEIR RECOVERIES
Since 1980, 45 states plus the District of Columbia have conducted at least one formal tax amnesty program; all but 11 of these have run more than one program, certainly casting doubt on the claims sometimes made by the states that the program offers a “one-time opportunity” for an honest, new start with the tax authorities.7 Figure 1 shows the annual frequency of state programs during the American amnesty era from 1981.8 The 1980s were a period of aggressive experimentation with 33 amnesty programs in 30 states, with Florida, Illinois, and Louisiana having repeated programs. Amnesties of this time did not stem from fi scal stress, but as Dubin, Graetz, and Wilde (1992) note, they were likely a state reaction to reduced federal enforcement efforts in that period that resulted in a lower compliance environment.9 State tax offi cials described the amnesties in terms of improving and updating their administrative systems (Parle and Hirlinger, 1986), and this was likewise refl ected in the amnesty features and accompa-nying programs (Mikesell, 1986).
6 Baer and LeBorgne (2008) review research on both American and international amnesties. They also con-clude that there is no evidence of a positive impact on revenue fl ows after the amnesty and some evidence of a negative impact.
7 The fi ve states abstaining from amnesties are Alaska, Montana, Tennessee, Utah, and Wyoming. It is note-worthy that four of these fi ve states omit a major broad based tax, but this observation is not particularly conclusive since other states without such taxes have offered amnesties multiple times. Likewise, Alaska, Tennessee, and Wyoming rely more on revenues from extractive resources, but Texas has a similar tax base and has offered three amnesties..
8 Note that 14 of the amnesties started in one year and ended in the next. This and later fi gures will follow the convention of counting the amnesty and its recovery in the start year. There is no reliable way of pars-ing the recoveries between years or of identifying any installment payments, in the few instances in which they have been permitted, to a later year. These magnitudes are modest, in any case.
9 In a later unpublished study, LeBorgne (2006) fi nds amnesties are more likely when a state is experiencing a budget defi cit. However, LeBorgne’s analysis stops in 1996 before the diffi cult recessionary environment of the 2000s and the concurrent fl urry of amnesties. Luitel and Tosun (2010) extend the analysis up to 2005 and likewise fi nd fi scal stress to be an important determinant of amnesty (re)enactment.

National Tax Journal534
The amnesty pace declined in the 1990s, when there were only 18 occurrences, eight of which came from states offering programs for the fi rst time. The 2000s brought a fl urry of 51 amnesties, however, and 15 more have been conducted in 2010, 2011, or are already scheduled for 2012. The fi gure shows dramatic increases in amnesties at both ends of the period from 2000 to the present. This pattern is almost certainly related to the declines in state tax collections during and shortly after the recessions of 2001 and 2007–2009, combined with general public opposition to statutory tax increases as a source of additional revenue.
Table 1 identifi es the state (and District of Columbia) tax amnesties conducted since 1981. Along with the dates of each amnesty, the table identifi es the gross state tax recovery in current and constant dollars from each program.10 Collections reported in the table are gross values for several reasons. First, tax revenue generated by other methods is traditionally reported on a gross, not net, basis. There are no deductions for the cost of collecting the revenue — those administrative costs are captured on the expenditure side of fi scal reporting — so this reporting allows for consistent comparison with other
14
12
10
8
6
4
2
0
19
81
19
83
19
85
19
87
19
89
19
91
19
93
19
95
19
97
19
99
20
01
20
03
20
05
20
07
20
09
20
11
Figure 1Frequency of Tax Amnesties, 1981–2012
10 Table 1 is produced from state amnesty evaluation reports, state press releases, news reports, state statutes, and various third party tabulations. One important third party source is the Federation of Tax Adminis-trators tabulation available at their website, Federation of Tax Administrators, Washington, DC, http://www.taxadmin.org/. While this list provides a good initial source, it does omit some state programs. Two important additional sources, both requiring additions and corrections, are Mikesell (1986) and the Joint Committee on Taxation (1998).

Contributions of State Tax Amnesties to State Revenues 535
Table 1Revenue Recovery by State Amnesty Program Since 1980
State Begin Date End Date Recovery ($)
Real Recovery (2005$)
Alabama-1 1/20/1984 4/1/1984 3,140,000 5,249,344Alabama-2 2/1/2009 5/15/2009 8,100,000 7,381,822Arizona-1 11/22/1982 1/20/1983 6,000,000 10,407,271Arizona-2 1/1/2002 2/28/2002 10,000,000 10,846,458Arizona-3 9/1/2003 10/31/2003 51,000,000 54,177,511Arizona-4 5/1/2009 6/1/2009 32,000,000 29,162,756Arizona-5 9/1/2011 10/1/2011 Not available Arkansas-1 9/1/1987 11/30/1987 1,700,000 2,622,688Arkansas-2 9/1/1997 11/30/1997 3,000,000 3,544,926Arkansas-3 7/1/2004 9/30/2004 3,556,683 3,674,791California-1 12/10/1984 3/15/1985 197,000,000 329,337,814California-2 2/1/2005 3/31/2005 675,000,000 675,000,000Colorado-1 9/16/1985 11/15/1985 6,323,744 10,261,154Colorado-2 6/1/2003 6/30/2003 18,000,000 19,121,474Colorado-3 10/1/2011 11/15/2011 > $11.000,000 Connecticut-1 9/1/1990 11/30/1990 54,000,000 74,728,073Connecticut-2 9/1/1995 11/30/1995 46,200,000 56,613,484Connecticut-3 9/1/2002 12/2/2002 109,000,000 118,226,387Connecticut-4 5/1/2009 6/25/2009 40,000,000 36,453,444Delaware-1 9/1/2009 10/30/2009 22,000,000 20,049,394District of Columbia-1 7/1/1987 9/30/1987 24,300,000 37,489,008District of Columbia-2 7/10/1995 8/31/1995 19,500,000 23,895,302District of Columbia-3 8/2/2010 9/30/2010 20,800,000 18,740,089Florida-1 1/1/1987 6/30/1987 13,000,000 20,055,848Florida-2 1/1/1988 6/30/1988 8,400,000 12,528,712Florida-3 10/1/1992 12/3/1992 14,000,000 18,277,240Florida-4 7/1/2003 10/31/2003 268,000,000 284,697,509Florida-5 7/1/2010 9/30/2010 82,900,000 74,690,068Georgia-1 10/1/1992 12/5/1992 51,300,000 66,973,028Hawaii-1 5/27/2009 6/26/2009 14,000,000 12,758,706Idaho-1 5/20/1983 8/30/1983 300,000 520,364Illinois-1 12/28/1981 1/8/1982 89,000 170,270Illinois-2 10/1/1984 11/30/1984 160,500,000 268,318,371Illinois-3 10/1/2003 11/17/2003 532,000,000 565,145,801Illinois-4 10/1/2010 11/8/2010 546,700,000 492,558,022Indiana-1 9/15/2005 11/15/2005 244,678,090 244,678,090Iowa-1 9/2/1986 10/31/1986 34,500,000 54,769,729Iowa-2 9/4/2007 10/31/2007 28,291,220 26,632,796Kansas-1 7/1/1984 9/30/1984 593,787 992,673Kansas-2 10/1/2003 11/30/2003 24,000,000 25,495,299Kansas-3 9/1/2010 10/15/2010 10,222,500 9,210,123

National Tax Journal536
Kentucky-1 9/15/1988 9/30/1988 61,100,000 91,131,462Kentucky-2 8/1/2002 9/30/2002 100,000,000 108,464,575Louisiana-1 10/1/1985 12/31/1985 1,209,538 1,962,643Louisiana-2 10/1/1987 12/15/1987 279,000 430,429Louisiana-3 10/1/1998 12/31/1998 1,300,000 1,518,976Louisiana-4 9/1/2001 10/30/2001 173,100,000 190,792,157Louisiana-5 9/1/2009 10/31/2009 303,700,000 276,772,777Maine-1 11/1/1990 12/31/1990 29,000,000 40,131,743Maine-2 9/1/2003 11/30/2003 37,600,000 39,942,636Maine-3 9/1/2009 11/30/2009 16,200,000 14,763,645Maine-4 9/1/2010 11/30/2010 8,100,000 7,297,823Maryland-1 9/1/1987 11/2/1987 34,600,000 53,379,410Maryland-2 9/1/2001 10/31/2001 39,200,000 43,206,543Maryland-3 9/1/2009 10/31/2009 26,000,000 23,694,739Massachusetts-1 10/17/1983 1/17/1984 84,600,000 146,742,524Massachusetts-2 10/1/2002 11/30/2002 96,100,000 104,234,457Massachusetts-3 1/1/2003 2/28/2003 46,900,000 49,822,064Massachusetts-4 4/1/2010 6/1/2010 32,570,027 29,344,482Michigan-1 5/12/1986 6/30/1986 109,800,000 174,310,616Michigan-2 5/15/2002 6/30/2002 81,990,000 88,930,105Michigan-3 5/15/2011 6/30/2011 76,000,000 66,978,056Minnesota-1 8/1/1984 10/31/1984 12,100,000 20,228,363Mississippi-1 9/1/1986 11/30/1986 1,000,000 1,587,528Mississippi-2 9/1/2004 12/31/2004 7,900,000 8,162,338Missouri-1 9/1/1983 10/31/1983 853,217 1,479,943Missouri-2 8/1/2002 10/31/2002 76,400,000 82,866,936Missouri-3 8/1/2003 10/31/2003 24,000,000 25,495,299Nebraska-1 8/1/2004 10/31/2004 7,500,000 7,749,055Nevada-1 2/1/2002 6/30/2002 7,300,000 7,917,914Nevada-2 7/1/2008 11/28/2008 27,000,000 24,866,000Nevada-3 7/1/2010 10/1/2010 28,500,000 25,677,526New Hampshire-1 12/1/1997 2/17/1998 13,500,000 15,773,976New Hampshire-2 12/1/2001 2/15/2002 13,500,000 14,879,804New Jersey-1 9/10/1987 12/8/1987 186,500,000 287,724,278New Jersey-2 3/15/1996 6/1/1996 359,000,000 431,703,123New Jersey-3 4/15/2002 6/10/2002 276,900,000 300,338,409New Jersey-4 5/4/2009 6/15/2009 725,000,000 660,718,680New Mexico-1 8/15/1985 11/13/1985 13,688,626 22,211,699New Mexico-2 8/16/1999 11/12/1999 45,000,000 51,818,245New Mexico-3 6/7/2010 9/30/2010 9,900,000 8,919,562
Table 1 (continued)Revenue Recovery by State Amnesty Program Since 1980
State Begin Date End Date Recovery ($)
Real Recovery (2005$)

Contributions of State Tax Amnesties to State Revenues 537
New York-1 11/1/1985 1/31/1986 401,300,000 651,165,055New York-2 11/1/1996 1/31/1997 253,400,000 299,428,085New York-3 11/18/2002 1/31/2003 582,700,000 632,023,081New York-4 10/1/2005 3/1/2006 349,000,000 349,000,000New York-5 1/15/2010 3/15/2010 50,000,000 45,048,292North Carolina-1 9/1/1989 12/1/1989 37,600,000 54,040,847North Dakota-1 9/1/1983 11/30/1983 150,000 260,182North Dakota-2 10/1/2003 1/31/2004 6,900,000 7,329,899Ohio-1 10/15/2001 1/15/2002 22,000,000 24,248,570Ohio-2 1/1/2006 2/15/2006 63,000,000 61,028,180Ohio-3 1/1/2012 2/15/2012 SCHEDULED Oklahoma-1 7/1/1984 12/31/1984 13,902,248 23,241,299Oklahoma-2 8/15/2002 11/15/2002 38,800,000 42,084,255Oklahoma-3 9/15/2008 11/14/2008 81,900,000 75,426,866Oregon-1 10/1/2009 11/19/2009 33,000,000 30,074,092Pennsylvania-1 10/13/1995 1/10/1996 93,000,000 111,833,957Pennsylvania-2 4/26/2010 6/18/2010 261,000,000 235,152,083Rhode Island-1 10/15/1986 1/12/1987 700,000 1,079,930Rhode Island-2 4/15/1996 6/28/1996 7,900,000 9,499,874Rhode Island-3 7/15/2006 9/30/2006 6,500,000 6,296,558South Carolina-1 9/1/1985 11/30/1985 7,500,000 12,169,793South Carolina-2 10/15/2002 12/2/2002 7,100,000 7,700,985South Dakota-1 4/1/1999 5/15/1999 500,000 575,758Texas-1 2/1/1984 2/29/1984 396,351 662,606Texas-2 3/11/2004 3/31/2004 379,000,000 391,585,560Texas-3 6/15/2007 8/15/2007 93,000,000 87,548,363Vermont-1 5/15/1990 6/25/1990 1,000,000 1,383,853Vermont-2 7/20/2009 8/31/2009 1,100,000 1,002,470Virginia-1 2/1/1990 3/31/1990 32,200,000 44,560,073Virginia-2 9/2/2003 11/3/2003 98,000,000 104,105,805Virginia-3 10/7/2009 12/5/2009 102,100,000 93,047,417Washington-1 2/1/2011 4/18/2011 263,000,000 233,989,929West Virginia-1 10/1/1986 12/31/1986 15,900,000 25,241,701West Virginia-2 9/1/2004 10/31/2004 11,169,609 11,540,521Wisconsin-1 9/15/1985 11/22/1985 26,800,000 43,486,727Wisconsin-2 6/15/1998 8/14/1998 30,900,000 36,104,879
Total 9,951,403,640 11,032,393,923 Mean 87,293,014 96,775,385 Median 28,395,610 29,253,619
Table 1 (continued)Revenue Recovery by State Amnesty Program Since 1980
State Begin Date End Date Recovery ($)
Real Recovery (2005$)

National Tax Journal538
tax revenue.11 Second, where data on the cost of running an amnesty are available, such cost is modest in comparison with collections, so reporting revenues on a net basis would have little impact on the amounts. In many instances, the amnesty program is administered with resources redirected from an existing department, and as a result the reported program cost is zero because there was no special budget appropriation. Third, there has been no standard approach to calculating program cost, meaning that there would be considerable inconsistency in reporting for net numbers. States which report “net revenues” may or may not have counted an estimate of forgone penalties and inter-est as program costs, for instance. For these reasons, gross collections are appropriate for comparing and evaluating the results of state amnesty programs. The vagaries of the data reporting process dictate considerable caution in use of the results. These are important data, however, because they remain the common basis on which states evaluate and promote the success of the amnesty. Because the existing evidence suggests there is no positive impact on revenue fl ow after the amnesty (Baer and LeBorgne, 2008), and that the impact may even be negative, the emphasis on the fi scal contribution of the direct amnesty recoveries is the appropriate focus of attention.12
In the aggregate, state amnesties report over $10.7 billion in recoveries (when adjusted to 2005 prices), a substantial but modest number in comparison to the $1.3 trillion total tax revenues collected during the equivalent periods. Revenue production has, how-ever, varied widely across state programs. In real terms, the greatest collections were from the California-2 (2005) program ($683.4 million) and the New Jersey-4 (2009) program ($661.7 million), and the smallest were from the Illinois-1 (1981) program ($165.9 thousand) and the North Dakota-1 (1983) program in ($259.2 thousand). The largest amnesty numbers are big enough to draw public attention to the results, even though the proceeds look much smaller when compared to the total tax revenues of the state. For instance, total tax collections in New Jersey in 2009 exceeded $24 billion — the amnesty proceeds were 2.7 percent of that amount, which is hardly enough to dramatically change the state’s fundamental fi scal situation and not a fl ow that would be a permanent component of annual revenue.
States do not report the type of tax for which the amnesty has made a recovery as regularly as they report total recoveries. Table 2 shows the distribution across taxes for
11 One exception to this use of gross rather than net collections is in regard to reporting for state lottery rev-enue in Bureau of Census Governments Division state revenue reports. This revenue is included in state revenue data on a net basis in miscellaneous revenues.
12 Even gross recovery can be a misleading indication of fi scal contribution. In one of the few careful analyses of the quality of amnesty revenue, the New York State Offi ce of Tax Policy Analysis (2004) estimated that, of the reported $582 million from the 2002 amnesty, net new revenue was only $83 million. The difference constituted waived penalty and interest ($294 million), revenue foregone from other compliance operations ($74.2 million), and revenue in the program that would have been collected without the amnesty ($131 million). Few other states have so thoroughly examined the quality of the amnesty recoveries. The Kansas Department of Revenue in its Amnesty 2010 Final Report did report a waiver of penalty and interest of $7.2 million on an amnesty recovery of $10.77 million (state plus local), but gave no estimate of what might have been recovered in absence of the amnesty.

Contributions of State Tax Amnesties to State Revenues 539
Table 2Amnesty Recoveries and Total State Tax Revenue by Type of Tax
Percent of Total
Amnesty RecoveriesPercent of Total
Tax Revenue
State AmnestySales and
UseIndividual
IncomeCorporate
IncomeSales and
UseIndividual
IncomeCorporate Income
Arkansas-3 (2004) 8.00 81.00 10.00 39.36 28.68 4.24
Colorado-1 (1985) 19.01 67.82 6.60 31.42 40.78 4.99
Connecticut-3 (2002) 54.95 19.02 15.75 32.24 38.27 3.62
Illinois-2 (1984) 19.95 5.97 72.97 34.47 28.19 7.65
Illinois-4 (2010) 24.30 6.45 46.04 22.96 38.07 11.31
Indiana-1 (2005) 27.36 15.13 35.84 39.15 32.16 7.66
Iowa-2 (2007) 31.66 23.26 40.98 26.71 41.33 5.04
Kansas-1 (1984) 23.02 68.37 7.98 28.56 31.51 8.34
Kansas-3 (2010) 15.72 42.15 37.88 33.10 41.10 5.40
Kentucky-2 (2002) 31.12 12.06 15.11 28.70 33.83 4.44
Louisiana-1 (1985) 70.09 11.28 4.47 31.27 12.61 7.27
Massachusetts-1 (1983) 26.00 48.58 9.34 21.37 47.78 12.49
Michigan-2 (2002) 28.71 22.51 34.58 35.60 28.02 9.45
Missouri-1 (1983) 6.56 4.53 87.91 43.51 29.60 5.43
New Jersey-3 (2002) 32.00 22.00 38.00 32.72 37.30 6.01
New Mexico-1 (1985) 57.23 8.76 4.24 42.81 7.02 4.93
New York-1 (1985) 39.13 44.13 14.59 20.93 50.92 8.36
New York-3 (2002) 28.64 53.35 2.16 20.93 53.60 4.94
North Dakota-2 (2003) 31.12 8.28 56.65 29.89 17.41 4.05
Ohio-1 (2002) 38.80 19.70 15.55 31.75 41.41 3.78
Oklahoma-2 (2002) 21.13 51.29 17.27 25.06 35.79 1.77
Pennsylvania-1 (1995) 22.47 15.01 37.45 31.16 28.50 8.22
Pennsylvania-2 (2010) 33.91 20.74 36.82 27.52 30.65 5.40
West Virginia-2 (2004) 53.86 19.04 14.52 25.47 27.25 10.77
Mean 31.03 28.77 27.61 30.69 33.41 6.48Median 28.68 20.22 16.51 31.22 32.99 5.41
Notes: Amnesty recoveries come from state reports. Tax revenue data are from U.S. Bureau of Census, Governments Division (http://www.census.gov/govs/).

National Tax Journal540
the 23 states for which these data are available.13 The table also presents the distribu-tion of total tax revenue across taxes so that a comparison with amnesty results can be made. The table focuses on sales and use, individual income, and corporate income taxes because these are the most signifi cant taxes in these states; furthermore, the total recoveries from the three exceed 80 percent of the total in all but four of the states. It is apparent the amnesties vary dramatically in regard to the relative yields for the three taxes. While the averages across all states are similar — around 30 percent for each — the variation from state to state is dramatic: sales and use tax shares range from 6.56 percent (Missouri-1 (1983)) to 70.09 percent (Louisiana-1 (1985)); individual income tax shares range from 4.53 percent (Missouri-1 (1983)) to 81 percent (Arkansas-1 (1987)); corporate income tax shares range from 2.16 percent (New York-3 (2002)) to 87.91 percent (Missouri-1 (1983)).14 For some states, recoveries are heavily drawn from the sales and use tax, and for others the income tax is the primary source.15 Seldom is there a close balance between recovery shares of sales and use and individual income taxes for an individual state. The table shows both a close balance in virtually all states between the revenues from sales and use and individual income taxes and only a mod-est contribution from the corporate income tax to total tax revenue. Amnesty recovery patterns diverge substantially from that, possibly revealing some differences in the level of evasion across taxes, but it is just as likely that this divergence simply reveals a difference in amnesty participation for unknown reasons.
Although these amnesty recoveries were no doubt welcome, in comparison with the size of fi scal defi cits being experienced by many American states in the aftermath of the Great Recession, they were modest. To the extent that state fi scal problems are structural and not cyclical, the onetime revenue from the amnesty will not provide the needed solution and will harm a state’s long term fi scal prospects to the extent it creates the feared compliance incentive problem.
III. THE EVOLUTION OF AMNESTY STRUCTURE: FROM ADMINISTRATIVE TO REVENUE CONCERN
There are several important program design differences across the state amnesties, and these features can be critical to determining how much revenue the amnesty immediately recovers relative to its impact on the state tax compliance climate. Table 3 shows how several of these signifi cant features of the programs have evolved across the decades.
13 State after action report sources include: Arkansas Department of Finance and Administration (2008); Indiana Department of Revenue (2006); Iowa Department of Revenue (2008); Kentucky Revenue Cabi-net (2003); Commonwealth of Massachusetts Department of Revenue (2010); Michigan Department of Treasury (2003); New Hampshire Department of Revenue (2002); New York State Offi ce of Tax Policy Analysis (2004); Kaufmann (2004); Pennsylvania Department of Revenue (1995); Pennsylvania Depart-ment of Revenue (2010); West Virginia State Tax Department (2005).
14 The table includes only states with all three taxes. Amnesties in Texas, with no income tax, are obviously almost entirely sales and use tax recovery, and the Washington state amnesty, another state with no income tax, would refl ect sales and use and business and occupation taxes.
15 For the few states that provide the information, most amnesty returns come from individual income tax fi lers.

Contributions of State Tax Amnesties to State Revenues 541
Table 3Comparison of Amnesty Program Structural Features Across the Decades
FeatureAmnesty,
1980–1989Amnesty,
1990–1999Amnesty,
2000–2009Amnesty,
2010–All
Amnesties
Number of amnesties 33 18 51 15 117 Average length of amnesty (days) Mean 84.15 72.4 71.3 63.13 74.06 Median 90 76 60 59 64
Calendar quarter of amnesty (% of all) First 12.1 11.1 13.7 20.0 13.6 Second 6.1 16.7 15.7 20.0 13.6 Third 51.5 27.8 49.0 40.0 45.3 Fourth 30.3 44.4 21.6 20.0 27.4 Period since last amnesty (% of all) First time 90.9 44.4 13.7 6.7 37.6 Five years or more 83.3 88.9 84.3 73.3 85.5 10 years or more 83.3 72.2 58.8 26.7 35.0 Eligibility of accounts receivables (number) Yes 15 15 36 12 78 No 18 3 15 3 39 Installment payments (number) Yes 16 8 15 1 40 No 17 9 36 14 76 Unknown 1 1 Waived Prosecution only 1 1 0 0 2 Reduced penalty 1 0 1 0 2 Penalty 18 3 8 3 32 Penalty and part of interest 4 1 23 4 32 Penalty and interest 2 1 16 5 24 Other 1 1 1 3 6 Unknown 6 11 2 0 19

National Tax Journal542
A. Eligible Liabilities and Applicants
The tax previously unpaid to states may include several logical categories: accounts receivable, taxes from delinquent fi lers who may be either accounts known to the tax department or previously unknown, taxes from incomplete prior returns, and taxes from fi rms or fi lers previously unknown to the state.16 While some early amnesties provided extremely limited eligibility (Texas-1 (1984) limited eligibility to unregistered merchants and Idaho-1 (1983) limited eligibility to periods in which no return had been fi led), such narrow eligibility has been the exception.17
The major distinction across the earlier amnesties was the inclusion of accounts receivable in the program. While the amnesties of the 1980s were closely divided in the eligibility of these liabilities (15 included them, while 18 did not), amnesties since then have overwhelmingly included accounts receivable (63 have, while only 21 have not). In 1986, Mikesell pointed out that inclusion of accounts receivable in amnesty eligibility was at that time a strong distinguishing feature between programs with high per capita recoveries and those with low per capita recoveries, and Alm and Beck (1991) would later fi nd the inclusion of accounts receivable to be a statistically signifi cant determinant of total amnesty recoveries. Since then, states have overwhelmingly included liabili-ties in accounts receivable, even though these represent the softest results in terms of producing new net revenue and in terms of rewarding non-compliance. Because the liability is both known and established, these revenues are most likely going to be col-lected through the enforcement mechanisms available to the state if the taxpayer has any recoverable fi nancial resources. Taxpayers truly without the means to get current from accounts receivable would be unlikely to have the means to become current through an amnesty program. It is diffi cult to view the inclusion of accounts receivable as having a purpose beyond speeding up the collection process by a few months.
B. Forgiveness of Penalties and Interest
Features that characterize all state amnesty programs include the following: they do not forgive the basic tax owed, they do not close tax years for potential audit, and they all waive criminal prosecution for violations included in the amnesty. Beyond those elements, the state programs mix varying degrees of forgiveness of fi nancial penalties and interest that would have otherwise been owed by the non-compliant taxpayer. Table 3 shows that amnesties have extended more toward forgiveness of interest across the decades. In the 1980s, amnesties generally provided for cancelled penalties, but con-tinued at least part of the interest liability. For the 2000s, virtually all amnesties granted
16 Accounts receivable includes “tax evaders who have already been detected by the tax administration and who have been sent notices of their new tax bills” (Baer and LeBorgne, 2008, p. 17).
17 One extreme exception was the Massachusetts-4 (2010) amnesty that limited eligibility to taxpayers who received a special “Tax Amnesty Notice” from the state. While sending notices of the amnesty to taxpayers is not exceptional, making the amnesty an “invitation only” event — and simultaneously promising extra penalties to those who do not participate — certainly is.

Contributions of State Tax Amnesties to State Revenues 543
at least partial interest forgiveness.18 The pattern of interest relief continues into the 2010s, when 12 of the 15 amnesties so far have provided at least partial interest relief in addition to penalty relief. Because many states in recent years have at least an informal program of providing penalty relief for any taxpayer who makes a voluntary disclosure of unknown liabilities, the forgiveness of penalty in formal amnesty program provides little marginal incentive, meaning that the best remaining award for enticing taxpay-ers into the amnesty program involves reductions in interest payments. This is likely the reason for the gradual shift in the extent to which this incentive is offered to bring taxpayers into the system. At their least generous, the Florida-3 (1992) and Illinois-1 (1981) programs offered only amnesty from prosecution.
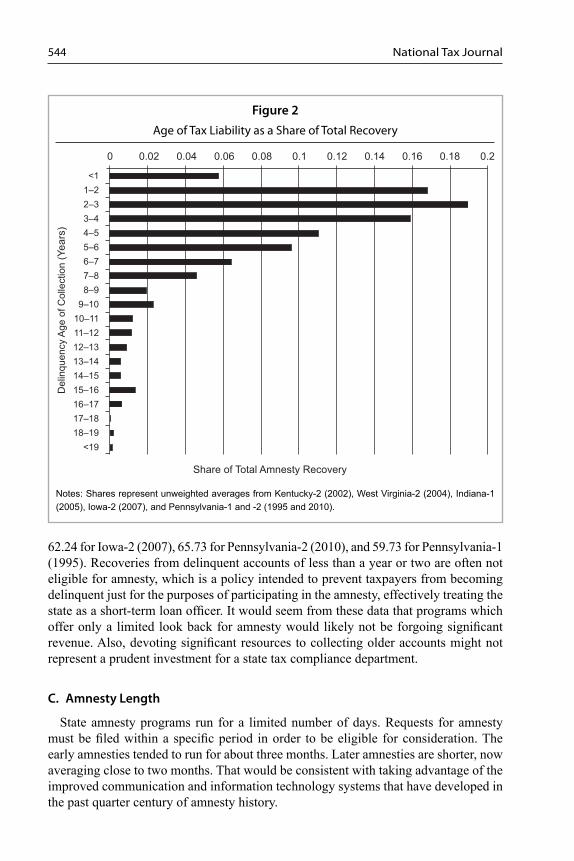
In many respects, forgiving interest is the most sensitive element of the amnesty in terms of maintaining equity and compliance incentives. The programs do not relieve the basic tax obligation, so that is not an issue, and the penalty has been demonstrated not to have its intended effect if the taxpayer is delinquent, so it involves no great revenue loss if waived. But to forgive interest is tantamount to giving the evaders an interest-free loan, and that gives the tax cheat an economic advantage over honest tax-payers.19 This advantage clearly has been on the minds of amnesty designers, as several programs have only a partial or no interest waiver. Interest obligations do accumulate on older liabilities, however, and some recent programs have created special higher waiver rates for such older obligations.20 The recent Florida program went as far as distinguishing between taxpayers who are being audited or under inquiry, examination, and civil investigation and those who initiate contact with the Department of Taxation. The former may receive a waiver of 25 percent of interest while the latter may receive a 50 percent waiver. For the few amnesties providing data on the age of the delinquent liability collected, however, a large amount of the total recovery comes from accounts that only recently became delinquent. Figure 2 demonstrates this point by summing the total recoveries by age of delinquency for the six amnesty programs that report these data, and then dividing it by total amnesty collections. Within these aggregates, the percentages of total recovery from tax years no more distant than fi ve years are 77.15 for Kentucky-2 (2002), 81.8 for West Virginia-2 (2004), 71.54 for Indiana-1 (2005),
18 While interest rates were historically low in the 2000s, it would be premature to conclude that this meant the waiver of accrued interest was unimportant. First, the interest rates states charge against delinquent payments are typically higher than “risk-free” Treasury bill rates, though the mark-up usually differs by the type of liability. Second, interest accrues throughout the period taxpayers are delinquent, so the history of interest rates over the lifetime of the liability is usually more important than the spot rate at the time the amnesty declares a waiver of accrued interest.
19 Since the 1980s, the prime interest rate has been on a path of secular decline. Using tax delinquency as a source of operating capital is thus relatively less attractive now than in the past — credit-worthy businesses can get the money at low interest rates from traditional sources. Furthermore, to the extent that the interest rate on delinquent payments generally tracks market rates, the state sacrifi ces less by forgiving interest. Both infl uences work toward making interest waivers more likely.
20 The Maine-4 (2010) amnesty waived 95 percent of the penalty for short term liabilities and 95 percent of the penalty plus interest for older liabilities. The New York-5 (2010) amnesty waived 50 percent of penalty and interest for newer liabilities and 80 percent for older ones.
National Tax Journal544
62.24 for Iowa-2 (2007), 65.73 for Pennsylvania-2 (2010), and 59.73 for Pennsylvania-1 (1995). Recoveries from delinquent accounts of less than a year or two are often not eligible for amnesty, which is a policy intended to prevent taxpayers from becoming delinquent just for the purposes of participating in the amnesty, effectively treating the state as a short-term loan offi cer. It would seem from these data that programs which offer only a limited look back for amnesty would likely not be forgoing signifi cant revenue. Also, devoting signifi cant resources to collecting older accounts might not represent a prudent investment for a state tax compliance department.
C. Amnesty Length
State amnesty programs run for a limited number of days. Requests for amnesty must be fi led within a specifi c period in order to be eligible for consideration. The early amnesties tended to run for about three months. Later amnesties are shorter, now averaging close to two months. That would be consistent with taking advantage of the improved communication and information technology systems that have developed in the past quarter century of amnesty history.
Figure 2Age of Tax Liability as a Share of Total Recovery
Notes: Shares represent unweighted averages from Kentucky-2 (2002), West Virginia-2 (2004), Indiana-1 (2005), Iowa-2 (2007), and Pennsylvania-1 and -2 (1995 and 2010).
<1
1–2
2–3
3–4
4–5
5–6
6–7
7–8
8–9
9–10
10–11
11–12
12–13
13–14
14–15
15–16
16–17
17–18
18–19
<19
De
linq
ue
ncy A
ge
of
Co
llectio
n (
Ye
ars
)
Share of Total Amnesty Recovery
0 0.02 0.04 0.06 0.08 0.1 0.12 0.14 0.16 0.18 0.2

Contributions of State Tax Amnesties to State Revenues 545
As one might surmise, the amnesty record shows that a longer amnesty period is associated with a lower recovery per day during the program, as participation is either fi xed or only increases at a diminishing rate with amnesty length. For amnesties of 60 or fewer days, the median daily recovery is $744,848, while for amnesties of 80 to 100 days, it is $278,852, and for amnesties of 110 days or longer, $95,076. The shortened amnesty period that has emerged suggests that amnesty design has responded to this pattern of diminished returns from long programs.
D. Quarter in Which Amnesty Conducted
Amnesties have tended to be conducted in the later quarters of the calendar year (i.e., the beginning of most state fi scal years). In the early amnesty era, there was a concern that amnesties earlier in the year would confl ict with the heaviest part of income tax fi ling season and that adding this work would complicate both administration and compliance. These administrative and compliance concerns appear to have become somewhat less important in the most recent decade with more programs offered earlier in the year. The third calendar quarter is the most popular quarter for an amnesty, with 45 percent of all programs conducted then.
E. Installment Plans
The amnesty programs differ in regard to whether they require the full liability be paid during the amnesty period (or shortly thereafter) to receive the amnesty incen-tive or whether they allow the taxpayer to establish an installment plan for payment of the liability over some period in the future. Since participants in amnesty programs have shown themselves to be less than reliable taxpayers, it may be surprising that amnesty programs established such installment programs at all.21 However, if the objective is to improve compliance and administration, these installment plans serve the purpose of enticing such taxpayers to at least come forward and make them-selves known, even if they ultimately cannot fulfi ll the obligations of their payment plans.
Here again the data presented in Table 3 show a considerable change in structure when later amnesties are compared to earlier ones. In the amnesties of the 1980s, 17 programs allowed installment payments while 16 did not. There was also a close split for the 1990s amnesties, with eight programs allowing amnesties while nine did not. But that changed in the 2000s, as only 15 of the 51 amnesties permitted installment plans and only one of 15 amnesties to date in the 2010s have allowed an installment payment option.
21 In fact, state amnesty reports often indicate that taxpayer failure to comply with installment plans is a common reason for amnesty denial. For instance, the New York-3 (2002) amnesty program reported that more than 100,000 of the 120,000 amnesty applications that were denied were due to taxpayers failing to complete an installment program, though they still collected more than $35 million in revenue from this group (New York State Offi ce of Tax Policy Analysis, 2004). The 120,000 denied applicants represented 11 percent of the total applications in the New York-3 (2002) amnesty program.

National Tax Journal546
F. Accompanying Programs
Amnesties have often been bundled with other programs, revealing a mixture of interest in both recovering tax revenue and in favorably infl uencing the compliance climate. In an early study, Mikesell (1986, pp. 522–523) found amnesty programs to be accompanied by additional programs designed to improve future compliance, and even argued that the amnesty may have been the cover necessary to make such enforcement enhancements and other changes to the rules “politically palatable.” These programs increased penalties and interest for the future, made tax evasion a felony, promised more rigorous enforcement, introduced new computer technologies, and allowed for improved audit detection techniques, among other changes (Mikesell, 1986; Alm and Beck, 1991).
In contrast, it does not seem to be the case that the more recent programs can be viewed as providing political cover for ramping up enforcement practices. Most of the recent amnesties are in states that had offered amnesty in the past and had made substantive administrative changes with the earlier amnesty, and thus had fewer opportunities to introduce new enforcement initiatives with their more recent amnesty programs. Table 4 identifi es the programs since 2000 that accompanied the amnesties, either directly in the legislation instituting the amnesty or in materials (guides, news releases, advertis-ing, etc.) produced by the revenue administration about the amnesty. Recent programs have accompanying compliance programs less frequently than was the case for the early amnesties.
In the 58 amnesty programs identifi ed in Table 4, only 26 bundled an accompanying program of any kind, suggesting the absence of a genuine interest in improving the long-run compliance effort. Furthermore, those programs that did take place do not have an orientation towards improving the overall compliance environment. Only 14 (including West Virginia-2 (2004), which has both compliance and recovery features) of the 26 programs made changes to the post-amnesty compliance environment by increas-ing penalties and interest, devoting amnesty proceeds to additional tax enforcement resources, or giving additional powers to tax enforcement. The remaining 12 amnesty programs listed in Table 4 were structured to increase recovery without providing changes to improve future compliance. These states structured their programs so that taxpayers who were eligible for the amnesty program but did not would be subject to extra penalties if discovered. In these cases, other future taxpayers would be subject to only ordinary penalties. Such a program creates an incentive to participate in the amnesty if a taxpayer is currently evading or delinquent, but has no effect on the long term revenue incentives and compliance of future possible evaders. Therefore, for most states, the amnesty was provided, but there were no changes in penalties, enforcement, or any other program that might make tax evasion less advantageous post-amnesty than pre-amnesty among the general population. The compliance rules and consequences would be expected to be no stricter after the amnesty.
The compliance initiatives attached to amnesties in recent years have been modest when compared to the changes that accompanied amnesties in the 1980s. This is also likely a consequence of the passage of time, as states were generally able to fi nd the

Contributions of State Tax Amnesties to State Revenues 547
Tabl
e 4
Enfo
rcem
ent a
nd A
dmin
istr
ativ
e Pr
ogra
ms
Acco
mpa
nyin
g A
mne
stie
s Si
nce
2000
Prog
ram
B
egin
Dat
eA
ccom
pany
ing
Prog
ram
s
Orie
ntat
ion
Mar
ylan
d-2
9/1/
2001
Incr
ease
d fi n
es a
nd p
enal
ties,
poss
ible
impr
ison
men
t.C
ompl
ianc
e
New
Jers
ey-3
4/15
/200
2Ex
tra 5
per
cent
pen
alty
if e
ligib
le li
abili
ties a
re n
ot in
am
nest
y.R
ecov
ery
Ken
tuck
y-2
8/1/
2002
Add
ition
al p
enal
ties,
publ
ish
list o
f del
inqu
ent t
axpa
yers
.C
ompl
ianc
e
Con
nect
icut
-39/
1/20
02Pr
omis
e ve
ry a
ggre
ssiv
e en
forc
emen
t afte
r am
nest
y.C
ompl
ianc
e
Sout
h C
arol
ina-
210
/15/
2002
20 p
erce
nt a
dditi
onal
col
lect
ion
fee
if ta
x de
bt n
ot p
aid
durin
g am
nest
y.R
ecov
ery
New
Yor
k-3
11/1
8/20
02In
tere
st ra
te in
crea
sed
from
prim
e to
prim
e pl
us 2
per
cent
.C
ompl
ianc
e
Flor
ida-
47/
1/20
03In
crea
ses i
nter
est r
ate
from
prim
e ra
te to
prim
e ra
te p
lus 4
per
cent
age
poin
ts.
Com
plia
nce
Virg
inia
-29/
2/20
0320
per
cent
ext
ra p
enal
ty fo
r lia
bilit
ies e
ligib
le fo
r am
nest
y.R
ecov
ery
Illin
ois-
310
/1/2
003
Non
parti
cipa
nts s
ubje
ct to
dou
ble
pre-
amne
sty
pena
lty a
nd in
tere
st.
Rec
over
y
Neb
rask
a-1
8/1/
2004
Part
of p
roce
eds d
irect
ed fo
r use
to h
ire m
ore
audi
tors
and
acq
uire
new
tech
nolo
gy fo
r rev
enue
de
partm
ent.
Com
plia
nce
Mis
siss
ippi
-29/
1/20
04A
nyon
e el
igib
le fo
r the
am
nest
y pr
ogra
m w
ho fa
ils to
pay
taxe
s due
dur
ing
the
amne
sty
prog
ram
w
ill fa
ce fi
nes o
f up
to $
100,
000
for i
ndiv
idua
ls a
nd $
500,
000
for c
orpo
ratio
ns a
nd/o
r may
face
jail
time
up to
fi ve
yea
rs.
Rec
over
y
Wes
t Virg
inia
-29/
1/20
04Ex
tra p
enal
ty if
taxp
ayer
doe
s not
par
ticip
ate
in a
mne
sty,
exp
ress
es in
tent
that
am
nest
y is
one
-tim
e oc
curr
ence
.R
ecov
ery/
Com
plia
nce
Cal
iforn
ia-2
2/1/
2005
Dou
ble
civi
l pen
altie
s, ad
ditio
nal i
nter
est-b
ased
pen
altie
s, cr
imin
al p
rose
cutio
n fo
r elig
ible
taxp
ayer
s w
ho d
o no
t par
ticip
ate
in th
e am
nest
y.R
ecov
ery
Indi
ana-
19/
15/2
005
Stric
ter e
nfor
cem
ent p
rom
ised
, mas
s bill
ing
cam
paig
n an
d us
e of
col
lect
ion
agen
cies
afte
r am
nest
y,
doub
ling
of p
enal
ties o
n lia
bilit
ies e
ligib
le fo
r am
nest
y bu
t fai
led
to p
artic
ipat
e.C
ompl
ianc
e
Ohi
o-2
1/1/
2006
Acc
ompa
nies
maj
or ta
x re
form
, cha
nge
in b
usin
ess t
axes
, no
chan
ged
adm
inis
tratio
n.C
ompl
ianc
e

National Tax Journal548
Okl
ahom
a-3
9/15
/200
8Th
ose
elig
ible
to p
artic
ipat
e w
ho d
o no
t are
subj
ect t
o pe
nalty
equ
al to
am
ount
of d
elin
quen
cy.
Rec
over
y
Ala
bam
a-2
2/1/
2009
New
syst
em to
iden
tify
com
plia
nce,
new
com
pute
r sys
tem
.C
ompl
ianc
e
New
Jers
ey-4
5/4/
2009
Hig
her p
enal
ty a
fter a
mne
sty.
Com
plia
nce
Haw
aii-1
5/27
/200
9En
hanc
ed p
ower
and
reso
urce
s to
audi
t and
ass
ess n
on-fi
lers
and
und
er-r
epor
ters
, res
ourc
es to
targ
et
cash
-bas
ed tr
ansa
ctio
ns, s
eizu
re a
nd a
sset
levy
pow
ers.
Com
plia
nce
Del
awar
e-1
9/1/
2009
Porti
on o
f am
nest
y pr
ocee
ds “
to p
rovi
de fo
r per
sonn
el c
osts
for t
he a
udit
of b
usin
esse
s or p
erso
ns
taxa
ble
unde
r the
supe
rvis
ion
of th
e D
ivis
ion.
”C
ompl
ianc
e
Ore
gon-
110
/1/2
009
Add
ition
al 2
5 pe
rcen
t pen
alty
for t
axpa
yers
who
wou
ld q
ualif
y bu
t do
not a
pply
for a
mne
sty
or w
ho
appl
y bu
t are
foun
d to
hav
e un
derr
epor
ted
or u
nder
paid
.R
ecov
ery
Virg
inia
-310
/7/2
009
20 p
erce
nt p
enal
ty a
fter a
mne
sty.
Com
plia
nce
Mas
sach
uset
ts-4
4/1/
2010
Taxp
ayer
s rec
eivi
ng “
Tax
Am
nest
y N
otic
e” w
ho d
o no
t par
ticip
ate
may
hav
e ex
tra p
enal
ty a
dded
an
d on
ly ta
xpay
ers r
ecei
ving
not
ice
are
elig
ible
for a
mne
sty.
Rec
over
y
Penn
sylv
ania
-24/
26/2
010
5 pe
rcen
t non
-par
ticip
atio
n pe
nalty
for e
ligib
le ta
xes n
ot p
aid
durin
g am
nest
y.R
ecov
ery
Dis
trict
of
Col
umbi
a-3
8/2/
2010
Empl
oyed
del
inqu
ents
who
did
not
par
ticip
ate
may
hav
e w
ages
gar
nish
ed.
Rec
over
y
Illin
ois-
410
/1/2
010
Dou
ble
prin
cipa
l and
inte
rest
for e
ligib
le li
abili
ties n
ot ta
king
am
nest
y.R
ecov
ery
Not
es: A
mne
stie
s w
ith n
o ac
com
pany
ing
prog
ram
incl
ude
Loui
sian
a-4
(200
1), O
hio-
1 (2
001)
, Nev
ada-
1 (2
002)
, Mic
higa
n-2
(200
2), M
isso
uri-2
(20
02),
Okl
ahom
a-2
(200
2), C
olor
ado-
2 (2
003)
, Mis
sour
i-3 (2
003)
, Ariz
ona-
3 (2
003)
, Mai
ne-2
(200
3), K
ansa
s-2
(200
3), N
orth
Dak
ota-
2 (2
003)
, Tex
as-2
(200
4),
Ark
ansa
s-3
(200
4), R
hode
Isla
nd-3
(200
6), T
exas
-3 (2
007)
, Iow
a-2
(200
7), N
evad
a-2
(200
8), A
rizon
a-4
(200
9), C
onne
ctic
ut-4
(200
9), V
erm
ont-2
(200
9),
Loui
sian
a-5
(200
9), M
aine
-3 (
2009
), M
aryl
and-
3 (2
009)
, New
Mex
ico-
3 (2
010)
, Flo
rida-
5 (2
010)
, Nev
ada-
3 (2
010)
, Kan
sas-
3 (2
010)
, Mai
ne-4
(20
10),
Was
hing
ton-
1 (2
011)
, Mic
higa
n-3
(201
1), A
rizon
a-5
(201
1). U
nkno
wn
or u
nver
ifi ed
pro
gram
s in
clud
e N
ew H
amps
hire
-2 (2
001)
, Ariz
ona-
2 (2
001)
, Mas
-sa
chus
etts
-2 (2
002)
, and
Mas
sach
uset
ts-3
(200
3), N
ew Y
ork-
4 (2
005)
, and
New
Yor
k-5
(201
0), C
olor
ado-
3 (2
011)
, and
Ohi
o-3
(201
2).
Tabl
e 4
(con
tinue
d)En
forc
emen
t and
Adm
inis
trat
ive
Prog
ram
s Ac
com
pany
ing
Am
nest
ies
Sinc
e 20
00
Prog
ram
B
egin
Dat
eA
ccom
pany
ing
Prog
ram
s
Orie
ntat
ion

Contributions of State Tax Amnesties to State Revenues 549
means to computerize and otherwise improve their tax administration systems by the start of the 21st century. Whether a part of the amnesty wave of the 1980s or not, by 2000, evasion had become a felony in state tax systems. Interest and penalties could only be reasonably added at the margin in repeat amnesties, and promises of a “one-time only event” presumably lose their credibility.22
G. Prior Amnesty Experience
As previously discussed, amnesties were often advertised as a last chance for tax compliance before stricter programs were implemented. Because of the considerable concern about the effects of an amnesty on the compliance environment, states felt it necessary to emphasize that, although the amnesty recoveries proved that many taxpay-ers had successfully evaded taxes in the past, conditions were changing and what had worked before would not work in the future. The amnesty provided the last opportunity to comply before the tax evasion was discovered and had even greater consequences. Obviously, virtually all amnesties conducted in the 1980s were the fi rst ones run by a state — but even then 10 percent were repeat programs. Overall, 62 percent of amnes-ties are repeat programs. Since the 1980s, the share of amnesties in a decade that were the fi rst run by the state has continually declined, from 44.4 percent in the 1990s to 13.7 percent in the 2000s, and then to 6.7 percent (one state) thus far in the 2010s. As noted earlier, only fi ve states have yet to conduct an amnesty, so the prospects for new programs this decade are not great.
Multiple amnesty states generally wait fi ve years or more before repeating an amnesty (more than eighty percent did so in the 1980s, 1990s, and 2000s), but only 73.3 percent have waited that long for the 2010s to date. The percentage of states waiting more than 10 years before running another amnesty has declined consistently, from 90 percent in the 1980s, to 72.2 percent in the 1990s, to 58.8 percent in the 2000s, and to 26.7 percent in the 2010s. Seldom would states now be able to make a convincing claim that an amnesty represents a unique opportunity to come clean with the state tax system. If one is run, there is likely to be another coming relatively soon. Of the 45 states plus the District of Columbia that have run or scheduled amnesties, only 11 have stopped with one (so far, at least), and 23 states have run three or more programs.
IV. ANALYZING THE AMNESTY EXPERIENCES: WHAT THE RECOVERY RECORD SHOWS
This section investigates empirically which amnesty features are associated with a productive amnesty program. A similar exercise was performed for the 28 earliest amnesty programs by Alm and Beck (1991), who used amnesty revenues as a proxy for income tax evasion among the states, which they regressed on the expected determinants
22 States, however, continue to make this claim; for example, as demonstrated in Table 4, the West Virginia-2 (2004) amnesty promised to be a one-time only event while being in its second iteration.

National Tax Journal550
of income tax compliance. Of course, as Alm and Beck (1991) noted, this created mea-surement error problems since amnesties involved more taxes than just the income tax. As previously demonstrated in Table 2, the amnesty recovery shares for various taxes often differ substantially from their shares in routine state tax collections. Therefore we model the output of an amnesty program as the result of a revenue production func-tion of two classes of inputs: unpaid tax liabilities and amnesty program design. The latter input classifi cation has been the subject of the narrative analysis to this point in the paper. The amount of unpaid tax liabilities should naturally lead to larger amnesty recoveries, but is a stock of unknown size that must be captured with proxy variables. These proxy variables for unpaid liabilities include the share of total personal income coming from reported nonfarm proprietor income, the existence of a national reces-sion, the intensity of federal audits, and the absence of a state sales tax. The amnesty program features will include indicators for repeat amnesties, the lag time between amnesties, the eligibility of accounts receivable, the implementation of an installment payment plan, the length of the amnesty, the quarter in which the amnesty was held, and whether or not there exists an alternative to the amnesty in the form of a voluntary disclosure program. These specifi c variables will be discussed in greater detail below.
The measure of amnesty output to be explained is the amnesty recovery as a share of the state’s total tax revenue (in millions) in the previous year. Dividing recovery by revenue scales the data and mitigates the need to incorporate variables that explain the potential size of the tax base. Since amnesty recoveries are correlated with bringing new taxpayers onto the tax rolls, the amnesty recovery could be associated with increases in total tax revenues through improved compliance. As a result, recovery is scaled by the previous year’s tax revenue to avoid this potential simultaneity bias in measurement, and this variable will be referred to as the recovery rate.23
Because states repeat infrequently, the model will be estimated as a pooled cross-section of the 108 state tax amnesty programs through 2010 for which complete data are available, though specifi cations to check the sensitivity of the model to outliers will also be presented.24 The appendix provides descriptive statistics for this range of observations. The production of the amnesty recovery rate (RecoveryRate) will be modeled in a log-linear specifi cation, expressed in vector form as:
(1)
α γ ε
= + +
+ + +
+ + + + +
+ + + + +
RecoveryRate b b NoSalesTax b HighAuditState b Recession b NFPIncomeShr b SecondAmnesty b ThirdAmnesty b Lag b VDP b AcctsReceivable b Install b Open60t99Days b Open100pDays Q Decade
ln( ) 0 1 2
3 4 5
6 7 8 9 10
11 12
23 The authors appreciate helpful discussion from the editor and an anonymous referee on this issue. Note that the recovery rates in Table 1 use tax revenue for the year of the amnesty in order to gauge fi scal sig-nifi cance in the period of the amnesty.
24 Among the regressors, the only observation with missing information prior to 2010 is on the existence of an installment plan in the South Dakota-2 (2001) program. Washington, DC is also excluded in all specifi cations because it has features of both state and local government.

Contributions of State Tax Amnesties to State Revenues 551
Defi nitions, sources, and summary statistics are provided in the appendix. As previ-ously described, the variables associated with coeffi cients b1 through b4 are intended to proxy for the amount of unpaid tax liabilities. Sales tax compliance is known to be particularly high, because the vendor acts only as a third party collection agent between customer and the government.25 States that generate revenue without the use of the sales tax are therefore likely to have a larger stock of unpaid revenue.26 Also, states over-whelmingly link their income tax compliance programs to federal efforts. States with greater federal compliance enforcement activity are likely to have lower state amnesty recovery potential, with the federal enforcement effort having spilled over to the state tax structure. Though data on federal audit intensity by state differ over time and are incomplete, the existing data do demonstrate that federal audit rates are systematically higher in some states than others (Birskyte, 2008).27 States that have an average rank-ing in the top-10 most audited states in the available data (1997–2001) are identifi ed as “high audit states” with a dummy variable (HighAuditState), with the expectation that these states will have lower recoveries in their amnesty programs than others (b2 < 0). If recessions cause taxpayers to become delinquent or to evade their taxes, then they may be correlated with amnesty participation (b3 > 0). Finally, states with high levels of self-employment likely have lower levels of routine tax compliance.28 The amount of self-employment activity in the state is measured by the share of the state’s total personal income derived from non-farm proprietor’s income, and is expected to be positively related to the recovery rate (b4 > 0).
The motivation behind the remaining amnesty program variables is largely derived from the major identifi able structures of these programs that have been discussed throughout this paper. Indicator variables identify whether the state previously enacted an amnesty program, by including controls to indicate if the amnesty is the state’s second program (SecondAmnesty) or if it is the third or more frequent program (Third-Amnesty). Presumably, amnesties would have smaller recoveries with each iteration due to a reduced pool of non-complaint taxpayers, so that b5 and b6 are negative. The more time that passes between amnesties (Lag) should increase the recovery rate since the stock of evaders and uncollected accounts accumulates over time. The Lag variable is measured for the regression as “1/(number of months since last amnesty).” Using this
25 High sales tax compliance of course does not extent to the use tax..26 It is conceivable that tax rates themselves may matter in determining how much information tax pay-
ing entities reveal to the state. Unfortunately, the various defi nitional changes to rates, levels, and bases across states both over time and cross-sections make introducing the rates themselves infeasible. Proxy variables, like sales and income tax revenues as a share of total personal income, were tested but found to be statistically insignifi cant, whereas a dummy variable for sales tax usage has explanatory power. This suggests the tax portfolio is perhaps more important than the rates. Similarly, state income tax variables seem to have no effect on recoveries, likely because the federal government monitors reporting and states primarily piggy-back on this effort.
27 High audit states include Alabama, Arizona, Arkansas, California, Louisiana, Minnesota, Mississippi, New Mexico, North Dakota, and Oklahoma.
28 Slemrod (2007) notes the relatively higher non-compliance rate among the self-employed found in Internal Revenue analyses, a pattern that is likely to carry over to state income tax systems as well.
National Tax Journal552
inverse relationship allows us to handle the conditionality of repeat amnesties with a consistent ordering. A state never before offering amnesty can be thought of as 1/∞ = 0, an amnesty offered 20 years ago as 1/240 = 0.004, and one ending in the previous month as 1/1 = 1.
If the amnesty program is conducted in a state that also operates a voluntary disclo-sure program (VDP), then the amnesty program has a smaller marginal benefi t over the state’s routine operations, and thus the program will have lower recoveries (b8 < 0).29 Also included are dummy variables representing the eligibility of accounts receiv-able (AcctsReceivable), whether or not taxpayers can pay through an installment plan (Install), and the quarter in which the amnesty program began (Q).30 The inclusion of accounts receivable should increase collections (b9 > 0), and if installment plans encourage participation then they will increase recoveries as well (b10 > 0). Several state amnesty reviews have found that a conventional view among program administrators is that increasing the duration of the amnesty period allows for more participation and amnesty collection. Evidence noted earlier, however, shows a declining recovery per day as the amnesty period becomes longer, suggesting diminishing returns from a longer amnesty. This motivates the pair of dummy variables for the duration of the amnesty, which if the state administrators are correct, will have a positive effect on amnesty recovery (b11, b12 > 0). As also discussed previously, early amnesty programs tended to administer the program late in the calendar year for fear of interfering with regular tax administration responsibilities for both the state authority and the individual taxpayer, but over time they have become more uniform across the year. The control for quarterly dummies will identify if this change in timing has a signifi cant impact on recoveries. Finally, a set of dummy variables for each decade is introduced (Decade). The control for decades is intended to capture institutional changes that might be diffi cult to observe as states transitioned from an emphasis on improved administration and compliance to increased revenue generation. As discussed in the earlier section, our observation that amnesties have increasingly become geared towards revenue generation is based on how states have changed their observed structural features, but regression analysis will demonstrate if this trend remains after controlling for other unobserved features.
Table 5 provides the estimates of the regression model under alternative sets of restric-tions.31 Robust standard errors, reported in parentheses, are employed even when the Breusch-Pagan test was unable to reject the null hypothesis of homoskedastic errors. Specifi cation (A) estimates a model with only the controls variables intended to proxy
29 In this dataset, the states that operate a voluntary disclosure program include Connecticut, Florida, Idaho, Indiana, Minnesota, Missouri, North Carolina, Pennsylvania, South Carolina, South Dakota, Vermont, and Wisconsin. When it was unclear if a state with a current voluntary disclosure program had the program during earlier amnesty programs, it was coded as having one at that time as well.
30 The variable Q is an n × 3 matrix of quarter identifi ers, with the fourth quarter excluded. The parameter α is a 3 × 1 vector of coeffi cients.
31 For dummy variables, the more precise estimation of the marginal effect in a semi-log specifi cation is exp(β) – 1, but this is not reported due to space limitations; see Halvorsen and Palmquist (1980) for an illustration.
Contributions of State Tax Amnesties to State Revenues 553
for unpaid tax liabilities, while specifi cation (B) controls only for amnesty program features. Specifi cation (C) combines the fi rst two specifi cations, and specifi cation (D) adds the decade indicators. Specifi cation (E) drops the seven amnesty programs that excluded a major broad-based tax. A residual analysis demonstrates that fi ve outliers result in a skewed distribution of errors, even with the removal of the observations in specifi cation (E). After removing these outliers in specifi cation (F), the residuals take a normal distribution as suggested by skewness and kurtosis tests. The mean variance-infl ation-factor (VIF), reported for each specifi cation, suggests multicollinearity is not a signifi cant problem.32
Comparing the adjusted-R2 across specifi cations (A) through (D) suggests most of the explanatory power is derived from the amnesty structure variables. The OLS model has just a few statistically signifi cant variables, likely due to the relatively small num-ber of degrees of freedom and sensitivity to the normal distribution assumptions. One should keep in mind, however, that the sample here is very close to the full population, so statistical signifi cance is more informative about a hypothesized larger sample than for the historical observations. Specifi cations (D) through (F) will serve as the main results when discussing the magnitude of the coeffi cients.
The coeffi cients of the variables in Table 5 generally have the expected signs and are relatively robust in size and sign, with the main difference between specifi cations being in statistical signifi cance. Examining fi rst the four variables measuring the size of unpaid liabilities, only the Recession indicator switches signs across specifi cations, though it is not statistically signifi cant in any specifi cation. Though statistically signifi cant in just two specifi cations, the effect of not having a sales tax takes the expected sign in all specifi cations and the magnitude is relatively constant throughout. For an amnesty program that would otherwise recover 0.5 percent of its annual tax revenue, the fully specifi ed models estimated in columns (D) through (F) suggest the effect of not having a sales tax increases the recovery rate by 0.73 to 0.78 percent.33 The evidence is simi-lar among states with high federal audit rates. The sign and size of the coeffi cient on HighAuditState are similar across specifi cations, with statistical signifi cance fl uctuating between specifi cations based on degrees of freedom. The effect of being a high audit state reduces an amnesty recovery rate of 0.5 to a recovery rate of 0.42 to 0.33 percent.34 Finally, non-farm proprietors income is positively correlated with greater recovery rates and is statistically signifi cant at the 5 percent level in specifi cations (E) and (F). Those point estimates suggest that a standard deviation increase in the NFPIncomeShr would increase a 0.5 percent recovery rate to 0.63 percent.35
Turning attention to the amnesty program features, two variables that stand out in Table 5 are the inclusion of accounts receivable and the accompaniment of a voluntary disclosure program. The accounts receivable indicator is statistically signifi cant at the 1
32 No individual variable carries a VIF score above four in any specifi cation.33 Calculations: ([exp(0.38) – 1 = 0.46] × 0.5) + 0.5 = 0.73; ([exp(0.44) – 1 = 0.55] × 0.5) + 0.5 = 0.78.34 Calculations: ([exp(–0.18) – 1 = –0.17] × 0.5) + 0.5 = 0.42; ([exp(–0.43) – 1= –0.35] × 0.5) + 0.5 = 0.33.35 Calculation: ([0.02 × 13.54 = 0.27] × 0.5 = 0.13) + 0.5 = 0.63.

National Tax Journal554Ta
ble
5O
LS R
egre
ssio
n Re
sults
Spec
ifi ca
tion
Dep
ende
nt V
aria
ble:
ln(R
ecov
ery/
Rev
enue
)(A
)(B
)(C
)(D
)(E
)(F
)
No
Sale
s Tax
0.66
**
0.54
0.38
0.39
0.44
*
(0.2
7)
(0.4
3)(0
.39)
(0.2
4)(0
.24)
Hig
h Au
dit
–0.6
1*
–0.2
2–0
.18
–0.4
3*–0
.42
(0
.34)
(0
.31)
(0.3
3)(0
.24)
(0.2
7)Re
cess
ion
0.07
–0
.23
–0.3
30.
350.
42
(0.7
9)
(0.6
5)(0
.68)
(0.2
9)(0
.30)
NFP
Inco
me
Shr
10.5
3**
7.
336.
1513
.65*
*13
.61*
*
(5.1
4)
(6.3
5)(7
.33)
(5.3
5)(5
.75)
Seco
nd A
mne
sty
–0
.05
–0.1
3–0
.30
–0.0
5–0
.04
(0.3
0)(0
.32)
(0.3
7)(0
.28)
(0.2
8)Th
ird+
Am
nest
y
0.03
–0.0
2–0
.21
0.20
0.18
(0.3
0)(0
.32)
(0.4
1)(0
.37)
(0.3
7)1/
(Mon
ths s
ince
last
am
nest
y)
–0.9
0–1
.06
–0.9
4–0
.96
–0.8
8
(0
.69)
(0.7
5)(0
.74)
(0.6
0)(0
.65)
Amne
sty
Incl
udes
Acc
ount
s Rec
eiva
ble
1.
67**
*1.
60**
*1.
54**
*1.
01**
*1.
04**
*
(0
.30)
(0.3
1)(0
.29)
(0.2
3)(0
.24)
Stat
e H
as V
olun
tary
Dis
clos
ure
Prog
ram
–0
.45*
–0.4
4*–0
.48*
–0.5
6**
–0.5
3*
(0
.23)
(0.2
6)(0
.28)
(0.2
7)(0
.27)
Amne
sty
Has
Inst
allm
ent P
aym
ent P
lan
0.
200.
250.
270.
00–0
.08
(0.2
4)(0
.25)
(0.2
7)(0
.21)
(0.2
1)Am
nest
y O
pen
60–9
9 D
ays
–0
.13
–0.1
4–0
.18
–0.2
7–0
.20
(0.2
9)(0
.27)
(0.2
8)(0
.23)
(0.2
4)

Contributions of State Tax Amnesties to State Revenues 555
Amne
sty
Ope
n 10
0+ D
ays
0.
120.
220.
26–0
.23
–0.2
4
(0
.37)
(0.3
7)(0
.38)
(0.3
1)(0
.34)
Qua
rter
1
–0.1
5–0
.13
–0.1
6–0
.29
–0.2
5
(0
.57)
(0.5
6)(0
.55)
(0.3
9)(0
.42)
Qua
rter
2
0.05
0.01
–0.0
1–0
.31
–0.0
6
(0
.38)
(0.3
7)(0
.37)
(0.3
1)(0
.32)
Qua
rter
3
0.12
0.19
0.23
0.09
0.11
(0.2
9)(0
.30)
(0.3
1)(0
.23)
(0.2
3)19
90s
0.
47–0
.16
–0.2
5
(0
.45)
(0.2
8)(0
.29)
2000
s
0.31
–0.7
1*–0
.78*
*
(0
.52)
(0.3
8)(0
.38)
Inte
rcep
t7.
48**
*7.
14**
*6.
66**
*6.
66**
*7.
44**
*7.
41**
*
(0.4
4)(0
.56)
(0.6
3)(0
.62)
(0.4
5)(0
.47)
Sam
ple
size
108
108
108
108
101
96A
dj-R
20.
030.
270.
270.
260.
250.
22M
ean
VIF
1.03
1.29
1.38
1.73
1.74
1.76
Bre
usch
-Pag
an χ
21.
1917
.39*
**14
.75*
**15
.38*
**11
.57*
**0.
54N
otes
: Ast
eris
ks in
dica
te st
atis
tical
sign
ifi ca
nce a
t the
1%
(***
), 5%
(**)
, and
10%
(*) l
evel
s. R
obus
t sta
ndar
d er
rors
are r
epor
ted
in p
aren
thes
es. S
pecifi c
atio
n (E
) exc
lude
s am
nest
ies t
hat d
id n
ot p
erm
it cl
aim
s fro
m a
maj
or b
road
-bas
ed ta
x, a
nd (F
) exc
lude
s out
liers
.

National Tax Journal556
percent level in all specifi cations, and the point estimates in specifi cations (D) through (F) suggest it would increase a 0.5 percent recovery rate to 1.37 or 2.34 percent.36 This is the largest effect observed among the dummy variables, and is consistent with Mikesell’s (1986) early observation that accounts receivable is the main distinguishing feature between amnesty program size, as well as Alm and Beck’s (1991) fi nding on the eligibility of delinquent taxpayers. Though accounts receivable is an attribute tax admin-istrators sometimes have control over during amnesty offerings, these also represent the “softest” returns as participation in the amnesty implies the state could probably have collected the entire amount through existing enforcement devices. Amnesties in states that operate a voluntary disclosure program, a competing device that allows delinquent taxpayers to avoid more signifi cant punishment, also experienced lower recovery rates by statistically signifi cant margins. The coeffi cients for voluntary disclosure program suggest they would lower a 0.50 percent recovery rate to about 0.30 percent.37
Despite lacking statistical signifi cance, the signs of the quarter indicators are consistent with the traditional concern that offering amnesties in the beginning of the calendar year would interfere with the collections process. Using the fourth quarter as the reference group, having the amnesty in the fi rst quarter is associated with lower collections while the highest collections occurred in third quarter amnesties. There does not appear to be evidence, however, to support the view that amnesty program length signifi cantly encourages participation. Dummy variables for amnesty program length actually carry a negative sign in many specifi cations, though it is possible that some reverse causality is occurring, and amnesties with low recoveries result in an extension of the size of the window of opportunity.
The evidence from the regressions in Table 5 is that repeated amnesties have smaller recoveries than the fi rst program, though this fi nding is not statistically signifi cant and is sensitive to outliers. Relative to a fi rst amnesty with a one percent recovery rate, the full sample specifi cation in column (D) indicates that the second amnesty has recovery rates that are 0.26 percent points lower, and third or higher amnesties recover 0.19 percentage points less than the initial amnesty.38 The time lag between amnesties is measured as the inverse number of months, with fi rst amnesties taking a value of zero; this treats amnesties that are far apart as more similar to fi rst amnesties in this measure than those that are closer together.39 The point estimates indicate that about a 12 month increase in the time since an initial amnesty with a 0.5 percent recovery rate would increase the revenue recovery rate by about 0.04 percentage points, though this is not statistically signifi cant.40 Likewise, installment plans apparently increase participation enough to increase the recovery rate in specifi cation (D), but the effect is not statisti-cally signifi cant and is sensitive to outliers. Specifi cations (E) and (F) demonstrate that
36 Calculations: ([exp(1.54) – 1 = 3.68] × 0.5) + .5 = 2.34; ([exp(1.01) – 1 = 1.74] × 0.5) + 0.5 = 1.37.37 Calculations: ([exp(–0.48) – 1 = –0.38] × 0.5) + .5 = 0.31; ([exp(–0.56) – 1 = –0.43] × 0.5) + 0.5 = 0.29.38 Calculations: exp(–0.30) – 1 = –0.26; exp(–0.21) – 1 = –0.19.39 Alternative approaches to inverse number of months, such as using dummy variables to indicate different
lengths of intervals between amnesties, yielded qualitatively same results.40 Calculations: ([(–1/12) × –0.96] × 0.5 = 0.04) + 0.5 = 0.54; ([(–1/12) × –0.88] × 0.5 = 0.036) + 0.5 = 0.536.

Contributions of State Tax Amnesties to State Revenues 557
recovery rates have fallen by statistically signifi cant margins during the millennium decade, but this is also sensitive to the choice of sample.
These results are suggestive of the trade-offs confronted by amnesty program admin-istrators. As described earlier, permitting an installment payment plan probably entices some taxpayers to come forward even though it seems many will be unlikely to live up to the terms of the agreement. States have been dropping this feature in the revenue maximizing era in hopes of quickly collecting the full liability, but the evidence pre-sented in Table 5 suggests that the revenue recovered is not substantively infl uenced. This suggests that policy makers can retain this feature of good administration without signifi cantly compromising revenue. Similarly, offering amnesty in the third quarter was done historically to prevent substantial interference with routine collections, while more recently amnesties have become more evenly distributed throughout the year. The evidence suggests that a third quarter beginning is most highly correlated with revenue recovery, although the effect is not statistically signifi cant. Shutting down the program within 60 days also seems to cost no revenue, and shortens the demands on administrative resources. However, if a state wants a large recovery, permitting known delinquencies through accounts receivable and shutting down voluntary disclosure programs seem to have the most to offer in terms of gross recovery, though these changes would confl ict with good existing tax administration policies.
V. SUMMARY AND CONCLUDING OBSERVATIONS
An exploration of the structures of state tax amnesties and amnesty policies reveals that the purpose of state tax amnesty programs has evolved. Early amnesty programs were coupled with important administrative reforms and efforts at improving compli-ance and enforcement, while the structure of recent programs and their timing relative to adverse fi scal shocks demonstrates an emphasis on revenue generation. In fact, many of these recent structural changes are inconsistent with an administrative system that values compliance and enforcement. Indeed, a regression analysis of the effects of amnesty features on amnesty recoveries suggests that if states are aggressively pursuing revenue maximization, the factors they can modify that are most infl uential on revenues also compromise existing tax administration. This raises some concerns because the historical record has demonstrated amnesty recoveries are seldom large enough to make any dramatic impact on state fi nances, even compared to non-traditional slack revenue sources such as rainy day funds or lotteries. Even among the early amnesties, which were more interested in long-term compliance and tax administration, the preponder-ance of evidence suggests that amnesties represent only a temporary revenue shock, not a continuing fi scal base.
Somewhat paradoxically, if state legislatures continue to enact amnesty programs, the belief that there is zero long-term revenue effect at best or a negative effect at worst suggests that administrators should seek to maximize revenue to the greatest possible extent, as it will likely be the only fi scal contribution. Should an amnesty be offered, the empirical evidence from prior programs suggests that gross revenue collections may

National Tax Journal558
be increased by making accounts receivable eligible for amnesty relief, by keeping the program open less than 60 days, and by holding the program in the third quarter of the calendar year. States that do not regularly tax sales, have low federal audit rates, and do not operate a voluntary disclosure program are likely to fi nd their recoveries to be higher. Finally, states should recognize that the evidence indicates that historically collections decline with each successive offering and increase with the amount of time since the last amnesty, holding constant the other structural features of the amnesty program.
Several open questions remain regarding even the immediate revenue fl ow — would ordinary state enforcement systems have eventually brought in the revenue, rendering the net effect negative due to waived penalty and interest? Do amnesties have any effect on the perceived fairness of the tax administration system? Does substantial amnesty recovery measure the futility of tax administration, and therefore advertise that success-ful evasion is quite feasible? The avalanche of tax amnesties since 2000 and generally improving state revenue yields with the end of the Great Recession probably mean a pause in the pace of such programs for a few years. Nevertheless, it appears that such programs have become an accepted tool in state tax administration, as states generally regard their experiences with amnesties to have been successful.41 As amnesty programs continue, future lawmakers and tax administrators may learn from the experiences of the 117 amnesties in the fi rst 30 years of amnesty history.
ACKNOWLEDGMENTS
The authors appreciate helpful comments and feedback from Ranjana Madhusud-han, Bill Gentry, George Zodrow, and two anonymous referees. The authors are solely responsible for any errors.
REFERENCES
Alm, James, and William Beck, 1991. “Wiping the Slate Clean: Individual Response to State Tax Amnesties.” Southern Economic Journal 57 (4), 1043–1053.
Alm, James, and William Beck, 1993. “Tax Amnesties and Compliance in the Long Run: A Time Series Analysis.” National Tax Journal 46 (1), 53–60.
Alm, James, Michael McKee, and William Beck, 1990. “Amazing Grace: Tax Amnesties and Compliance.” National Tax Journal 43 (1), 23–37.
Arkansas Department of Finance and Administration, 2008. “Tax Amnesty Program.” Arkansas State Revenue Tax Quarterly 11 (2), 2.
Baer, Katherine, and Eric LeBorgne, 2008. Tax Amnesties: Theory, Trends, and Some Alterna-tives. International Monetary Fund, Washington, DC.
41 One amnesty that appears to have been generally regarded as not so successful was the Maine-4 (2010) am-nesty, a program that began just nine months after the previous one. That is, however, the extreme exception.

Contributions of State Tax Amnesties to State Revenues 559
Birskyte, Liucija, 2008. The Effects of IRS Audit Rates on State Individual Income Tax Compli-ance. Ph.D. dissertation. Indiana University, Bloomington, IN.
Christian, Charles W., Sanjay Gupta, and James C. Young, 2002. “Evidence on Subsequent Fil-ings from the State of Michigan’s Income Tax Amnesty.” National Tax Journal 55 (4), 703–721.
Commonwealth of Massachusetts Department of Revenue, 2010. 2010 Report on Tax Amnesty Program. Commonwealth of Massachusetts Department of Revenue, Boston, MA.
Dubin, Jeffrey A., Michael J. Graetz, and Louis L. Wilde, 1992. “State Income Tax Amnesties: Causes.” Quarterly Journal of Economics 107 (3), 1057–1070.
Fisher, Ronald C., John H. Goodeeris, and James C. Young, 1989. “Participation in Tax Amnes-ties: The Individual Income Tax.” National Tax Journal 42 (1), 15–27.
Halvorsen, Robert, and Raymond Palmquist, 1980. “The Interpretation of Dummy Variables in Semilogrithmic Regressions.” American Economic Review 70 (3), 474–475.
Indiana Department of Revenue, 2006. Indiana Tax Amnesty: Final Report. Indiana Department of Revenue, Indianapolis, IN.
Iowa Department of Revenue, 2008. Executive Summary 2007 Iowa Tax Amnesty. Iowa Depart-ment of Revenue, Des Moines, IA.
Joint Committee on Taxation, 1998. Tax Amnesty. JCS-2-98. Joint Committee on Taxation, Washington, DC.
Joulfaian, David, 1989. “Participation in Tax Amnesties: Evidence from a State.” In Proceed-ings of the Eighty-First Annual Conference on Taxation, 128–133. National Tax Association, Washington, DC.
Kaufmann, Michael C., 2004. Oklahoma Tax Amnesty Program. Paper presented at the “Revenue Estimating Conference,” September 19–22, sponsored by the Federation of Tax Administrators. Burlington, VT.
Kentucky Department of Revenue, 2010. Annual Report 2009-2010. Kentucky Department of Revenue, Frankfort, KY.
Kentucky Revenue Cabinet, 2003. 2002 Tax Amnesty Final Report. Kentucky Department of Revenue, Frankfort, KY.
LeBorgne, Eric, 2006. “Economic and Political Determinants of Tax Amnesties in the U. S. States.” In Proceedings of the Ninety-Eighth Annual Conference on Taxation, 443–450. National Tax Association, Washington, DC.
Luitel, Hari S., and Russell S. Sobel, 2007. “The Revenue Impact of Repeated Tax Amnesties.” Public Budgeting and Finance 27 (3), 19–38.
Luitel, Hari S., and Mehmet S. Tosun, 2010. “An Examination of the Relation between State Fiscal Health and Amnesty Enactment.” Working Paper No. 10-009. University of Nevada, Reno, NV.

National Tax Journal560
Michigan Department of Treasury, 2003. State of Michigan Tax Amnesty Program 2002. Michigan Department of Treasury, Lansing, MI.
Mikesell, John L., 1986.“Amnesties for State Tax Evaders: The Nature of and Response to Recent Programs.” National Tax Journal 39 (4), 507–525.
New Hampshire Department of Revenue, 2002. New Hampshire Department of Revenue Admin-istration 2002 Annual Report. New Hampshire Department of Revenue, Concord, NH.
New York State Offi ce of Tax Policy Analysis, 2004. Tax Amnesty: Review of New York State’s 2002–2003 Amnesty Program. New York State Department of Taxation and Finance, Albany, New York.
Parle, William M., and Mike W. Hirlinger, 1986. “Evaluating the Use of Tax Amnesty by State Governments.” Public Administration Review 46 (3), 246–255.
Penniman, Clara, 1980. State Income Taxation. John Hopkins University Press, Baltimore, MD.
Pennsylvania Department of Revenue, 1995. Final Report on the Tax Amnesty Program. Penn-sylvania Department of Revenue, Harrisburg, PA.
Pennsylvania Department of Revenue, 2010. Final Report on the 2010 PA Tax Amnesty Program. Pennsylvania Department of Revenue, Harrisburg, PA.
Ross, Bonnie G., 1986. “Federal Tax Amnesty: Refl ecting on the States’ Experiences.” Tax Law 40, 145–184.
Setze, Karen, 2009. “States Offering Amnesties in Wake of Fiscal Crisis, But at What Price?” State Tax Notes 51, (March 18), 908–910.
Slemrod, Joel, 2007. “Cheating Ourselves: The Economics of Tax Evasion.” The Journal of Economic Perspective 21 (1), 25–48.
West Virginia State Tax Department, 2005. West Virginia Tax Amnesty Program of 2004. West Virginia State Tax Department, Charleston, WV.

Contributions of State Tax Amnesties to State Revenues 561
APPENDIX A
A1. Defi nitions and Sources
Recovery/Revenue is amnesty recovery as a share of total tax revenue collected in the year prior to the amnesty start date, multiplied by one million; revenue data are from U.S. Bureau of the Census, Governments Division. No Sales Tax is a dummy variable, where 1 indicates the absence of a state sales tax in the year of the amnesty. High Audit State is a dummy variable, where a value of 1 indicates that the state’s mean rank in federal audits from 1997–2001 was in the top-10 most audited; the source is the Transactional Records Access Clearing House of Syracuse University (http://trac.syr.edu). Recession is an indicator variable that takes a value of 1 if there was a national recession as defi ned by the NBER. NFP Income Shr is the proportion of state personal income from non-farm proprietor’s income in the year prior to the amnesty start date; the source is U.S. Bureau of Economic Analysis (http://www.bea.gov). Second Amnesty is a dummy variable, where 1 indicates a state’s second amnesty program. Third+ Amnesty is a
Table A1Descriptive Statistics for Observations in Regression Analysis (Table 5)
Variable MeanStandard Deviation Minimum Maximum
Recovery/Revenue 6,841 69,14 12.75 27,599No Sales Tax 0.04 0.19 0 1High Audit 0.25 0.44 0 1Recession 0.08 0.28 0 1NFP Income Shr 0.08 0.02 0.05 0.15Second Amnesty 0.31 0.47 0 1Third+ Amnesty 0.29 0.45 0 1Amnesty Includes Accounts Receivable 0.66 0.48 0 1State Has Voluntary Disclosure Program 0.22 0.42 0 1Amnesty Has Installment Payment Plan 0.35 0.48 0 1Amnesty Open 60–99 Days 0.46 0.50 0 1Amnesty Open 100+ Days 0.11 0.32 0 1Quarter 1 0.13 0.34 0 1Quarter 2 0.14 0.35 0 1Quarter 3 0.45 0.50 0 11990s 0.15 0.36 0 12000s 0.56 0.50 0 1
Note: The sample size is 108.

National Tax Journal562
dummy variable, where 1 indicates a state’s third (or higher) amnesty program. The variable 1/(Months since last amnesty) is the inverse of the number of months between the ending month of the last amnesty and the starting month of the current amnesty, with zero being employed if the state has never offered previously offered an amnesty. Amnesty Includes Accounts Receivable is an indicator variable, where 1 indicates an amnesty program that includes accounts receivable among the eligible liabilities. State Has Voluntary Disclosure Program is a dummy variable indicating that the state offers some program where taxpayers can voluntarily reveal themselves to the state tax authorities without fear of criminal prosecution; the primary source was Setze (2009). Amnesty Has Installment Payment Plan is an indicator variable where 1 indicates the amnesty program permitted self-reporters to participate in a repayment plan. Amnesty Open X Days is an indicator for the range of days the amnesty was open. Quarter X is an indicator variable, where 1 indicates an amnesty occurred during quarter X. Finally, 1990s and 2000s are dummy variables that indicate if the amnesty start date began after 1989 or after 1999, respectively.
A2. Amnesty Program and Recovery Data
Data are from the authors’ compilation from state amnesty evaluation reports, state press releases, news reports, state statutes, and various third party tabulations. Important third party sources include the Federation of Tax Administrators tabulation available at their website, http://www.taxadmin.org/, Mikesell (1986), and Joint Committee on Taxation (1998).