fast method development of salicylic acid process … · · 2017-10-10it requires planning...
TRANSCRIPT

Fast Method Development of SalicylicAcid Process Impurities using AgilentZORBAX Rapid Resolution HighThroughput Columns with the Agilent1200 Series Method DevelopmentSolution Controlled by AutoChrom Version 12.01
Abstract
A sample consisting of salicylic acid and its published process impurities are sepa-
rated using an analytical method developed on an Agilent 1200 Series Method
Development Solution controlled by ACD/AutoChrom software, version 12.01. The
chromatograph while under control of AutoChrom can screen up to seven columns,
13 buffers and two organic solvents with columns held in four temperature-controlled
zones. The software helps plan the next best experiment to perform, allowing the ana-
lyst to focus on quickly developing methods using conditions with the best likelihood
of success. In this work three columns (Agilent ZORBAX StableBond SB-C18,
ZORBAX Eclipse Plus C18 and StableBond SB-Aq) are screened using five mobile
phase modifiers. Temperature is maintained at 25 °C throughout the experiment.
Fifteen solvent column experiments are initially screened. Several experiments follow
to construct a retention model. A solution is achieved with a final in under 3 min
isocratic separation.
Authors
William J. Long
Agilent Technologies, Inc.
2850 Centerville Road
Wilmington, DE 19808
USA
Margaret Antler, Andrey Vazhentsev
Advanced Chemistry Development, Inc.
110 Yonge Street, 14th Floor
Toronto, Ontario M5C 1T4
Canada
Application NotePharmaceutical

2
Introduction
Rapid Resolution High Throughput (RRHT) columns aredesigned to yield separations of 150 mm, 5 µm columns with50 mm, 1.8 µm columns. Equivalent resolution can beachieved at higher flow rates, 3 to 5 times faster. [1,2,3,4]
Analytical method development is a challenging and timeconsuming activity. It requires planning experiments, prepar-ing multiple mobile phases, transcribing numerous methodsinto the chromatographic software and data analysis. Smallchanges in mobile phase composition can affect the elutionorder, so peak tracking throughout the method developmentprocess is also an important task. [5,6,7]
Selectivity is an important parameter in analytical methoddevelopment. Using short 1.8 µm columns rapid screening ofdifferent selectivity modifiers is attractive due to the time andsolvent savings that are possible. Separations that are devel-oped on these RRHT columns can be easily transferred to avariety of other instruments with capabilities across the 400to 1200 bar range. In general using 4.6 × 50 mm RRHTcolumns, many analyses may be completed in one third toone tenth of the time required with a 4.6 × 150 mm, 5 µmcolumn. More method development options can be exploredin less time.
Salicylic acid, also known as 2-hydroxybenzoic acid is one ofseveral beta hydroxy acids. It is the key additive in many skin-care products. It is also found in many plants that areused in traditional medicine. (8,9 ) Sodium salicylate is com-mercially prepared from sodium phenoxide and carbon dioxideat high pressure and temperature in the Kolbe-Schmitt reac-tion. It is acidified to give the desired salicylic acid. [10] Inthis work RRHT columns, Autochrom and the Agilent 1200 SLMethod Development Solution will be used to quickly evaluate method development choices.
Experimental
An Agilent 1200 Series Method Development Solution basedon the Agilent 1200 Series Rapid Resolution LC componentswas used for this work. This system consisted of a G1312BBinary Pump SL, capable of delivering up to 600 bar; twoG1316C Thermostatted Column Compartments (TCC), aG1376D High Performance Autosampler SL+, a G1315C SLDiode Array Detector equipped with a semi-micro flow cellwith a 6-mm path length. Both TCC's are equipped with an 8-position/9-port selection valve. The valves are newQuickChange Valves that are mounted on a slide-out rail tomake plumbing and maintance more convenient. Valve 1 actsas an entrance to the columns whereas valve 2 acts as an
TCC-cluster
2 Solvent Choices on binary 3 on quaternary
Detector
Solventselection
Pump
Autosampler
Inlet valve
Outlet valve
Figure 1. Instrument diagram.
3
exit. The center port on valve 1 was connected to the autosampler and the center port on valve 2 was connected to theflow cell in the detector. Port 1 on both valves were connected to the StableBond C18 column, and port 2 on bothvalves were connected to Eclipse Plus C18. Port 7 was con-nected to StableBond Aq and Port 8 was connected to abypass connecting capillary. The solvent passing into eachcolumn was heated using one of seven individual low disper-sion heat exchangers. A G1160 12-solvent selection valvewas connected to valve position A1 on the G1312B. Togetherwith the internal solvent selection valve of the Binary SLPump, up to 15 solvents can be screened using this system,although in this work it was limited to six. The followingmobile phase modifiers and buffers were used: 0.1% trifluo-roacetic acid (TFA), 0.1% formic acid (FA), 0.1% acetic acid,10 mM ammonium acetate titrated to pH 4.8 with acetic acid,and 10 mM ammonium acetate titrated to pH 6.5 with aceticacid. Water was used as a final weak solvent, to rinse themodifiers from the columns, and allow proper column storage.All modifiers were purchased from Sigma Aldrich exceptacetic acid which was purchased from EM Science.Acetonitrile was used throughout as a strong solvent.Temperature was controlled at 25 °C, flow rate was set at1.49 mL/min. Agilent Chemstation B0 4.01 SP1 was used tocontrol the liquid chromatograph together with AutoChromVersion 12.01 from Advanced Chemistry Development, Inc.(Toronto, Canada).
Three Agilent columns were used in this work:
• ZORBAX RRHT StableBond SB-C18, 4.6 mm × 50 mm, 1.8 µm, p/n 822975-902
• ZORBAX RRHT Eclipse Plus C18, 4.6 mm × 50 mm, 1.8 µm,p/n 959941-902
• ZORBAX RRHT StableBond SB-Aq, 4.6 mm × 50 mm, 1.8 µm, p/n 827900-914
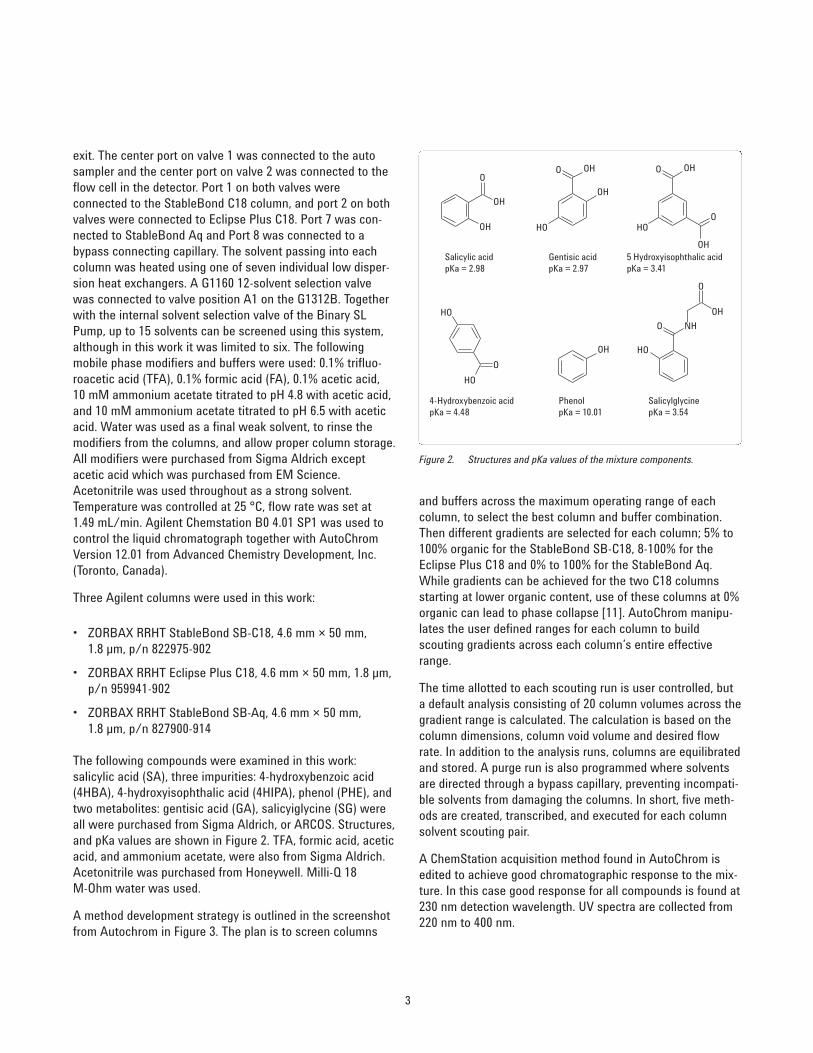
The following compounds were examined in this work: salicylic acid (SA), three impurities: 4-hydroxybenzoic acid(4HBA), 4-hydroxyisophthalic acid (4HIPA), phenol (PHE), andtwo metabolites: gentisic acid (GA), salicyiglycine (SG) wereall were purchased from Sigma Aldrich, or ARCOS. Structures,and pKa values are shown in Figure 2. TFA, formic acid, aceticacid, and ammonium acetate, were also from Sigma Aldrich.Acetonitrile was purchased from Honeywell. Milli-Q 18 M-Ohm water was used.
A method development strategy is outlined in the screenshotfrom Autochrom in Figure 3. The plan is to screen columns
and buffers across the maximum operating range of eachcolumn, to select the best column and buffer combination.Then different gradients are selected for each column; 5% to100% organic for the StableBond SB-C18, 8-100% for theEclipse Plus C18 and 0% to 100% for the StableBond Aq.While gradients can be achieved for the two C18 columnsstarting at lower organic content, use of these columns at 0%organic can lead to phase collapse [11]. AutoChrom manipu-lates the user defined ranges for each column to build scouting gradients across each column’s entire effectiverange.
The time allotted to each scouting run is user controlled, buta default analysis consisting of 20 column volumes across thegradient range is calculated. The calculation is based on thecolumn dimensions, column void volume and desired flowrate. In addition to the analysis runs, columns are equilibratedand stored. A purge run is also programmed where solventsare directed through a bypass capillary, preventing incompati-ble solvents from damaging the columns. In short, five meth-ods are created, transcribed, and executed for each columnsolvent scouting pair.
A ChemStation acquisition method found in AutoChrom isedited to achieve good chromatographic response to the mix-ture. In this case good response for all compounds is found at230 nm detection wavelength. UV spectra are collected from220 nm to 400 nm.
Salicylic acidpKa = 2.98
Gentisic acidpKa = 2.97
5 Hydroxyisophthalic acidpKa = 3.41
O
OH
OH
O
O
O
O
O NH
O
4-Hydroxybenzoic acidpKa = 4.48
PhenolpKa = 10.01
SalicylglycinepKa = 3.54
OH
OH
HO HO
OH
OH
HO
HO
HO
OH
OH
Figure 2. Structures and pKa values of the mixture components.

4
Discussion
Chromatographic peak tracking can be a time consuming stepin analytical method development. With simple mixtures it isfrequently accomplished by injecting individual standards ofeach component using each chromatographic condition. Asmore compounds or conditions are added this is no longer apractical methodology. The UV spectra can also be used totrack components manually. Many analysts heavily involvedin method development create elaborate spreadsheets con-taining retention times and uv peak information.
ACD/AutoChrom combines instrument control for Agilent1100 and 1200 Series LC, and LC/MS systems with softwarefor logical method development. After the analyst defines themethod development goal, AutoChrom generates the methodfiles for Agilent Chemstation software, executes the experi-ments, guides the analyst through the data processing, andassists the analyst in selecting the next experiment.
AutoChrom will run column, buffer, temperature and solventscreening experiments, find and track all peaks in the sam-ples, and select the best result. Peak tracking is based on UVor MS spectral similarity. (This work demonstrates UV match-ing only.) The UV peak-tracking utility, UV-MAP, extracts purespectra for each component detected. The spectra are thencompared across each injection. Peaks that are "best" matchesare assigned first. Weaker matches are assigned later.
AutoChrom guides the analyst through method optimization.When AutoChrom's suggestion for the next experiment isaccepted by the user, the software will execute the nextexperiment automatically. The software provides an overviewof the experiments, and allows access to the original datawhen necessary. Experiments are summarized in a peak table.
While the Agilent 1200 Series Method Development Solutionis capable of screening up to seven columns when used withAutoChrom, only three are used in this work. Since the USPmethod for the analysis of these compounds specifies the use
Select Best
Optimize Gradient
Result
Origin
Column and BufferScreening
Figure 3. Autochrom strategy screenshot.

5
of a C18 column, StableBond SB-C18 and Eclipse Plus C18were evaluated.[11] In previous work SB-Aq was evaluated,so it was added to the screening.[10] Further, the column isplaced in position 7 on the column selection valves. Thisdemonstrates the ability of the system to pick and choose conditions to be evaluated.
AutoChrom divides the experiments into "waves." Each waveis a planned group of experiments. In this work, two waves ofexperiments were executed; initial column and buffer screen-ing, followed by gradient optimization. At the end of eachwave, the software suggests the next experiment to perform,but the operator must accept the suggestion about how (or if)to continue method development. If the chromatographerdoes not accept the experiment suggested by the software,
they may enter their own experiment to execute next. Thisallows the operator to control the method developmentprocess.
In the first wave all three columns were screened with eachof the five solvents on the G1160 valve and then washed withwater and stored in a 50:50 mixture of acetonitrile and water.The results of this initial screening are summarized in Table 1.This table lists the experiments, columns and resulting "grad-ing" of the separation. In addition, the components aretracked by UV spectral similarity. Figure 4 shows the 15 corre-sponding chromatograms from these initial screenings. Ascan be seen in Table 1 and Figure 4, the StableBond SB-C18and Eclipse Plus C18 using 0.1% TFA produce the best separations. AutoChrom suggests that the Eclipse Plus C18
StableBond SB-C18 Eclipse Plus C18 StableBond SB-Ag
0.1 % TFA
0.1 % Formic acid
0.1% Acetic acid
pH 4.8 10 mMCH3COONH4
pH 6.5 10 mMCH3COONH4
2.001.751.501.25Retention time (min)
C_
01
C_
02
C_
03
C_
04
C_
05
C_
06
2.001.751.501.251.00Retention time (min)
C_
01
C_
02
C_
03
C_
04
C_
05 C_
06
2.252.001.751.50Retention time (min)
C_
01
C_
04
C_
06
2.12.01.91.81.71.61.5Retention time (min)
C_
01 C_
02
C_
04
C_
06
1.51.0Retention time (min)
C_
03
C_
02C
_06
C_
05
1.25 1.501.000.75Retention time (min)
C_
01
C_
03
C_
02
1.25 1.501.000.75Retention time (min)
C_
01
C_
03
C_
02
1.51.00.5Retention time (min)
C_
03 C_
04
C_
05
C_
01
C_
02C
_03
C_
04
C_
05 C_
06
2.001.751.501.25Retention time (min)
C_
01 C_
03
C_
02
C_
04
C_
05
C_
06
2.001.751.501.25Retention time (min)
C_
01
C_
02C
_03
C_
04
C_
05 C_
06
2.001.751.501.251.00Retention time (min)
C_
01 C_
03
C_
02
C_
04
C_
06
1.751.501.251.00Retention time (min)
C_
03
C_
02C
_04
C_
05
1.51.00.5Retention time (min)
C_
03 C_
06
C_
05
1.51.00.5Retention time (min)
C_
01
C_
02C
_03
C_
04
C_
05
C_
06
2.252.001.751.50Retention time (min)
Figure 4. Fifteen Chromatograms from wave 1.

with 0.1% TFA column and buffer combination is slightlybetter than the SB-C18 column, and should be used for fur-ther method development. The selection of the best experi-ment is based on the number of components detected, andthe resolution score, which is the average value of normalizedresolutions between all peaks on the chromatogram.However, there may be additional considerations whenselecting the best method from the screening set.
Figure 2 lists the pKa of each analyte. As can be seen thepKa's are mostly between 2.97 and 5. Phenol can also beclassified as a weak acid. Acidic compounds are best retainedin mobile phases where the compounds are fully protonated.The 0.1% TFA (pH 2) and the 0.1% formic acid (pH 2.7) mobilephases fully meet this criterion. The acetic acid mobile phase(0.1% pH 3.8), show peak order changes and peak broadening,evident on the two StableBond columns (SB-C18 and SB-Aq).This is probably due to the exposed silanol groups on thenon-end-capped StableBond column. Two analytes that havepKa's at or below 3 could be interacting with these groups. Itis possible to use these silanol groups to the analysts' advan-tage by judiciously choosing mobile phase conditions to con-trol the charge of these silanol groups. However in this casethe work is performed at a pH where the silanol groups on thesilica are uncharged. StableBond has been shown to possessvery good long term stability in mobile phases containing TFA.[12]
6
Resolution Minimum Peaks found/ Retention timeColumn and Buffer score resolution total peaks Peak_01 Peak_02 Peak_03 Peak_04 Peak_05 Peak_06
SB-C18 and 0.1% TFA 1 3.629 6/6 1.19 1.29 1.404 1.595 1.774 2.044
Eclipse Plus C18 and 0.1% TFA 1 3.982 6/6 1.064 1.171 1.302 1.506 1.701 1.969
SB-Aq and 0.1% TFA 1 2.067 6/6 1.577 1.679 1.742 1.864 2.011 2.264
SB-C18 and 0.1% formic acid 1 1.947 6/6 1.184 1.292 1.35 1.59 1.775 2.005
Eclipse Plus C18 and 0.1% formic acid 1 2.297 6/6 1.056 1.171 1.241 1.494 1.698 1.908
SB-Aq and 0.1% formic acid 0.4 – 3/6 1.564 1.855 2.214
SB-C18 and 0.1% acetic acid 1 1.961 6/6 1.144 1.287 1.202 1.567 1.776 1.869
Eclipse Plus C18 and 0.1% acetic acid 0.8 – 5/6 1.011 1.168 1.069 1.459 1.723
SB-Aq and 0.1% acetic acid 0.6 – 4/6 1.517 1.667 1.81 2.029
SB-C18 and pH 4.8 0.6 – 4/6 1.029 0.693 1.776 1.126
Eclipse Plus C18 and pH 4.8 0.6 – 4/6 0.894 0.554 1.004 1.702
SB-Aq and pH 4.8 0.4 – 4/6 0.796 1.418 1.131
SB-C18 and pH 6.5 0.4 – 4/6 0.533 1.778 0.961
Eclipse Plus C18 and pH 6.5 0.4 – 4/6 0.522 0.912 1.704
SB-Aq and pH 6.5 0.4 – 4/6 1.034 1.31 2.015
Table 1. Wave 1 Solvent and Column Screening Results
The software suggests the best experiment, but the analystmust accept the decision, or choose another. After the ana-lyst chooses the best separation based upon the chromato-graphic grading or other reasoning, the software will move onto the second wave of experiments for method optimization.In this case, although the Eclipse Plus C18 column is sug-gested by the software, StableBond SB-C18 is chosen for fur-ther experimentation. By including the analyst in the decisionprocess, other factors such as column stability can be considered in the method development process.
The next step is gradient optimization. The resulting chro-matogram from the screening run is processed byAutoChrom, which proposes two new sets of gradient condi-tions. These conditions are chosen to yield gradients withvaried slopes in order to build a chromatographic retentionmodel. Initial starting conditions, and earliest and latest elution compositions are used to construct these gradients.
7
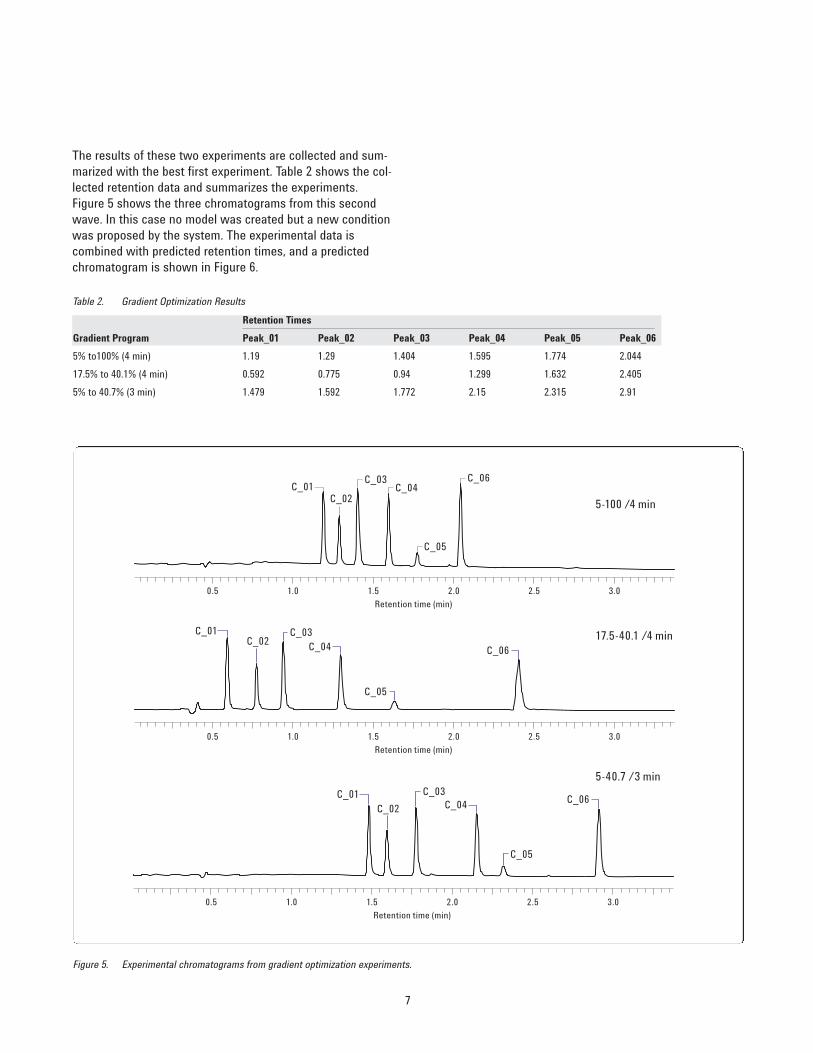
The results of these two experiments are collected and sum-marized with the best first experiment. Table 2 shows the col-lected retention data and summarizes the experiments. Figure 5 shows the three chromatograms from this secondwave. In this case no model was created but a new conditionwas proposed by the system. The experimental data is combined with predicted retention times, and a predicted chromatogram is shown in Figure 6.
Retention Times
Gradient Program Peak_01 Peak_02 Peak_03 Peak_04 Peak_05 Peak_06
5% to100% (4 min) 1.19 1.29 1.404 1.595 1.774 2.044
17.5% to 40.1% (4 min) 0.592 0.775 0.94 1.299 1.632 2.405
5% to 40.7% (3 min) 1.479 1.592 1.772 2.15 2.315 2.91
Table 2. Gradient Optimization Results
5-100 /4 min
3.02.52.01.51.00.5
Retention time (min)
C_01C_02
C_03C_04
C_05
C_06
17.5-40.1 /4 minC_01C_02
C_03C_04
C_05
C_06
3.02.52.01.51.00.5
Retention time (min)
5-40.7 /3 min
C_01C_02
C_03C_04
C_05
C_06
3.02.52.01.51.00.5
Retention time (min)
Figure 5. Experimental chromatograms from gradient optimization experiments.

Suggested Method
15% MeCN 85% 0.1% TFA
43210
Time, min
0.0001
0.0002
0.0003
0.0004
0.0005
0.0006
1
2
3
4
5
6
Retention TimesGradient Program Peak_01 Peak_02 Peak_03 Peak_04 Peak_05 Peak_06
5% to 100% (4 min) 1.19 1.29 1.404 1.595 1.774 2.044Experimental 17.5% to 40.1% (4 min) 0.592 0.775 0.94 1.299 1.632 2.405
5% to 40.7% (3 min) 1.479 1.592 1.772 2.15 2.315 2.91
Predicted 15% 0.716 0.943 1.198 2.011 2.295 5.37
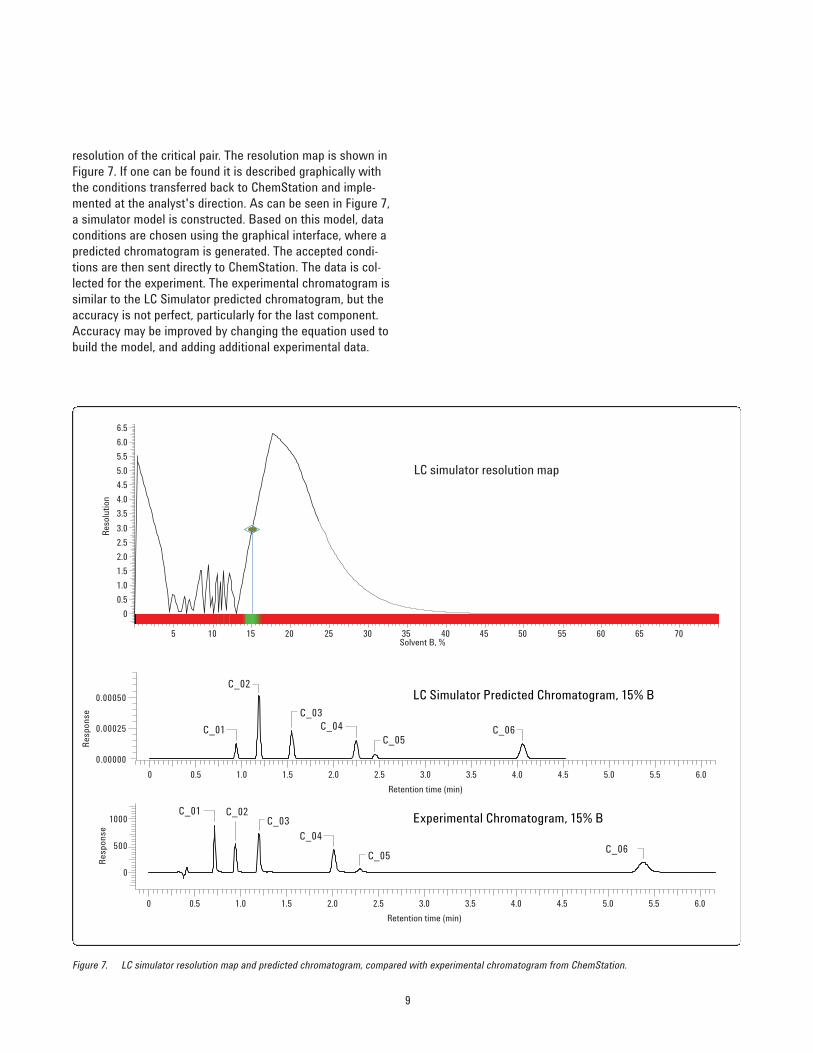
The three chromatograms from the gradient optimizationexperiments are then transferred into LC Simulator, a programincluded in AutoChrom. This program calculates an optimalseparation based upon a chromatographic model, and user-defined criteria for a suitable method, which can include k',run time, resolution, robustness, and column stability criteria.LC Simulator calculates a model for the separation based onthe experimental data, and then uses the model to determineoptimal chromatographic conditions (targeting an isocraticsolution). A resolution map is created, which allows the analyst to see how changing the gradient affects the
8
Figure 6. First three chromatograms and system suggested analysis (no model built, more data needed).
9
resolution of the critical pair. The resolution map is shown inFigure 7. If one can be found it is described graphically withthe conditions transferred back to ChemStation and imple-mented at the analyst's direction. As can be seen in Figure 7,a simulator model is constructed. Based on this model, dataconditions are chosen using the graphical interface, where apredicted chromatogram is generated. The accepted condi-tions are then sent directly to ChemStation. The data is col-lected for the experiment. The experimental chromatogram issimilar to the LC Simulator predicted chromatogram, but theaccuracy is not perfect, particularly for the last component.Accuracy may be improved by changing the equation used tobuild the model, and adding additional experimental data.
706560555045403530252015105Solvent B, %
LC simulator resolution map
0
0.5
1.0
1.5
2.0
2.5
3.0
3.5
4.0
4.5
5.0
5.5
6.0
6.5
Res
olut
ion
LC Simulator Predicted Chromatogram, 15% B
Experimental Chromatogram, 15% B
6.05.55.04.54.03.53.02.52.01.51.00.50
Retention time (min)
0.00025
0.00000
0.00050
Res
pons
e
C_01
C_02
C_03C_04
C_05C_06
0
500
1000
Res
pons
e
C_01 C_02C_03
C_04
C_05C_06
6.05.55.04.54.03.53.02.52.01.51.00.50
Retention time (min)
Figure 7. LC simulator resolution map and predicted chromatogram, compared with experimental chromatogram from ChemStation.
10
After the suggested experiment is executed, the analystdecides whether or not to continue method optimization.If the method is not acceptable, we can add the fourthexperiment to our model, improving the accuracy, andallow the software to suggest the next experiment. In thiscase, we are satisfied with the method, so we simply stopmethod development at this point.
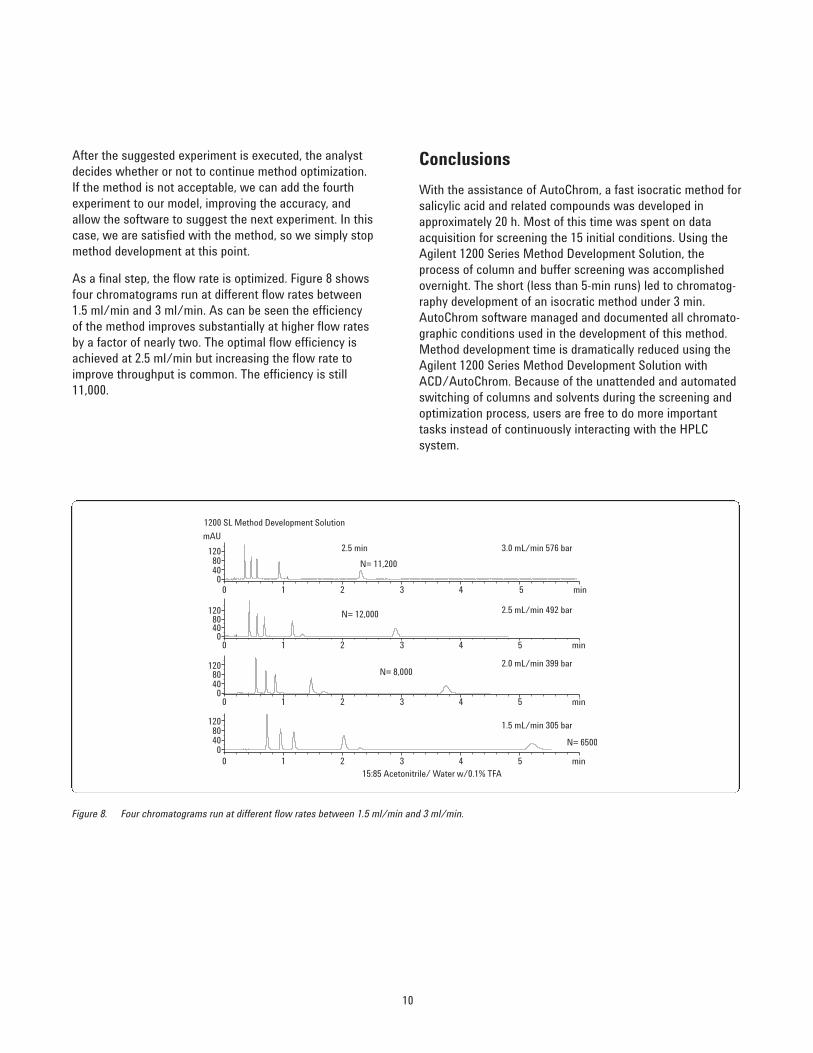
As a final step, the flow rate is optimized. Figure 8 showsfour chromatograms run at different flow rates between1.5 ml/min and 3 ml/min. As can be seen the efficiencyof the method improves substantially at higher flow ratesby a factor of nearly two. The optimal flow efficiency isachieved at 2.5 ml/min but increasing the flow rate toimprove throughput is common. The efficiency is still11,000.
min0 1 2 3 4 5
mAU
04080
120
min0 1 2 3 4 50
4080
120
min0 1 2 3 4 50
4080
120
min0 1 2 3 4 50
4080
120
3.0 mL/min 576 bar
2.5 mL/min 492 bar
2.0 mL/min 399 bar
1.5 mL/min 305 bar
2.5 min
15:85 Acetonitrile/ Water w/0.1% TFA
1200 SL Method Development Solution
N= 11,200
N= 6500
N= 8,000
N= 12,000
Figure 8. Four chromatograms run at different flow rates between 1.5 ml/min and 3 ml/min.
Conclusions
With the assistance of AutoChrom, a fast isocratic method forsalicylic acid and related compounds was developed inapproximately 20 h. Most of this time was spent on dataacquisition for screening the 15 initial conditions. Using theAgilent 1200 Series Method Development Solution, theprocess of column and buffer screening was accomplishedovernight. The short (less than 5-min runs) led to chromatog-raphy development of an isocratic method under 3 min.AutoChrom software managed and documented all chromato-graphic conditions used in the development of this method.Method development time is dramatically reduced using theAgilent 1200 Series Method Development Solution withACD/AutoChrom. Because of the unattended and automatedswitching of columns and solvents during the screening andoptimization process, users are free to do more importanttasks instead of continuously interacting with the HPLC system.

11
References
1. Tatsunari Yoshida, Ronald E. Majors, and Hiroki Kumagai“High-Speed Analyses using Rapid Resolution LiquidChromatography on ZORBAX Column Packed 1.8 µmParticles,” Chromatography, Vol.28 No.2 (2007) 81–87.
2. A. D. Broske, R. D. Ricker, B. J. Permar, W. Chen, and M. Joseph, “The Influence of Sub-Two Micron Particleson HPLC Performance,” Agilent Technologies publication5989-9251EN, May 2003.
3. William J. Long and John W. Henderson Jr.. “High-Resolution Analysis of Taxanes Using Rapid ResolutionHT (1.8 µm) Agilent Eclipse Plus Phenyl-Hexyl Columns,”Agilent Technologies publication 5989-9340EN, August28, 2008,.
4. John W. Henderson Jr. and William J. Long,” ExploitingRRHT Columns with Different C18 Selectivities to QuicklyDevelop Methods for Endocannabinoids, January 19,2007, Agilent Technologies publication 5989-6128EN.
5. L. R.Snyder, J. J. Kirkland, J. L. Glajch, “Practical HPLCMethod Development, 2nd ED.” Wiley-Interscience, NewYork, 1997.
6. Angelika Gratzfeld-Huesgen, “An Open-Access LC/MSSystem Capable of Running Different Applications Withup to Eight 1.8 µm, 3.5 µm, 5 µm Particle Columns ofDifferent Selectivity and Length,” Poster HPLC 2009Dresden DE.
7. Rob Edam, Mattias Purtsh, Angelika Gratzfeld-Huesgen,Michael Frank, Helmut Schulenburg-Schell, Freddy vanDamme, “Automated Method Development With Sub-2 µm Particle Columns for LC Separation of Chemical andAgricultural Samples,” Poster HPLC 2009 Dresden DE.
8. A. Toiu, L Vlase, I. Oniga, and M. Tamas, “HPLC Analysisof Salicylic Acid Derivatives from Viola Species,”Chemistry of Natural Compounds, Vol. 44, No. 3, 2008(357-358).
9. J. D. Goss, “Improved Chromatographic Separation ofSalicylic Acid and Some Related Compounds on a PhenylColumn,” Journal of Chromatography A, 828 (1998)267–271.
10. William J. Long and John W. Henderson Jr., “Separationof Salicylic Acid Impurities with Different Acid Mobile-Phase Modifiers,” Agilent Technologies publication 5989-7731EN, July 24, 2009
11. Salicylic Acid USP 23 (1995) 1395.
12. B. A. Bidlingmeyer, A. D. Broske, “The Role of Pore Sizeand Stationary Phase Composition in PreventingAqueous-Induced Retention Time Loss in Reversed-Phase HPLC. J Chromatogr Sci. 2004 Feb;42(2):100-6.
13. L. R. Snyder, J. J. Kirkland, “Modern LiquidChromatography, Wiley and Sons, 1980.
For More Information
For more information on our products and services, visit ourWeb site at www.agilent.com/chem.

www.agilent.com/chem
For Research Use Only. Not for use in diagnostic procedures.
Agilent shall not be liable for errors contained herein orfor incidental or consequential damages in connectionwith the furnishing, performance, or use of this material.
Information, descriptions, and specifications in this publication are subject to change without notice.
© Agilent Technologies, Inc., 2009, 2017Printed in the USAMarch 1, 20175990-4809EN