fast, effective xps point analysis of metal components · 2017-09-06 · fast, effective xps point...
TRANSCRIPT

Fast, Effective XPS Point Analysis of Metal ComponentsChris Baily and Tim Nunney, Thermo Fisher Scientific, East Grinstead, West Sussex, UK
The Thermo Scientific K-Alpha system was used to investigate a tarnished aluminum component. By using X-ray photoelectron spectroscopy (XPS), identification and quantification of chemical differences between optically distinct areas on the sample was possible.
Introduction
XPS sample analysis can be a very involved process, with operators requiring a high skill level to load samples, collect data and interpret the results. The K-Alpha surface analysis system enables researchers to utilize this powerful analytical technique via a unique combination of hardware design and intuitive software, without compromising information content or performance. The K-Alpha system is controlled by Thermo Scientific Avantage software, which controls all aspects of the sample analysis. Safe sample transfer protocols, and a point-and-shoot user interface via live camera views, are designed to make sample loading, navigation and analysis alignment quick and easy.
When this user-friendly operation is coupled with powerful, integrated analytical tools such as “Multi-spectrum insert”, “Survey ID”, and full peak deconvolution, performing an XPS point analysis is quite easy to perform.
In this application note we describe how the K-Alpha can be used to analyze a tarnished aluminum part to obtain chemical state information from different regions of the surface and understand the source of discoloration observed on the surface.
Method
The sample was mounted onto the 60 mm × 60 mm sample platter by the use of two supplied spring clips (see Figure 1). Latex gloves were worn to prevent the sample or platter from being contaminated. The sample was then loaded into the fast entry load-lock, and the button pushed in the software to pump down and transfer the sample carrier into the analysis chamber. Sample transfer occurs automatically when the pressure in the load-lock reaches an acceptable level.
Key Words
• K-Alpha
• Auto-Analysis
• Multi-Spectrum
• Point Analysis
• Surface Analysis
• Survey ID
• XPS
Application Note: 52297
Figure 1: Picture of the aluminum sample mounted on the K-Alpha sample block

When the sample is pumped down an image of the sample platter is automatically acquired and stored in the upper part of the optical view window to use for coarse navigation from sample to sample (see Figure 2).
Once the samples are loaded into the analysis chamber, double-clicking on the platter image moves to a position of interest. A point analysis object can be inserted by first choos-ing “Point” from the drop-down menu; then, whilst holding down the “control” key on the keyboard, left clicking on the live optical view where you wish the centre of the analysis position to be (see Figure 3).
This simultaneously inserts an X-ray object and a point object in the experiment tree (on the left of the screen) and on the optical view draws an ellipse, representing the size of the X-ray spot, at the analysis position (see Figure 4). The size of the X-ray spot defines the analysis area because the XPS signal is only obtained from the location on the sample that the X-ray is irradiated. The X-ray spot size is easily adjusted using the mouse-wheel to allow it to be tailored to the size of the feature being analyzed.
Next, the “multispectrum” tool can be used to insert a survey spectrum (see Figure 5) and the experiment can be run. A survey spectrum is a full-range scan that can be used to identify the elements present at the surface, and to produce an elemental quantification. These spectra are usually lower resolution but have high count-rates to facilitate detec-tion of weaker signals. It also enables detection of unexpected elements, and so are used to find all the elements that are present before collecting high-resolution, region spectra.
Figure 4: Screenshot after inserting a “Point”
Figure 2: Screenshot of the platter image acquisition, with inlay of the platter view camera configuration
Figure 3: Screenshot of inserting a “Point”
Figure 5: Screenshot of inserting a survey scan using the “Multi-spectrum insert” tool
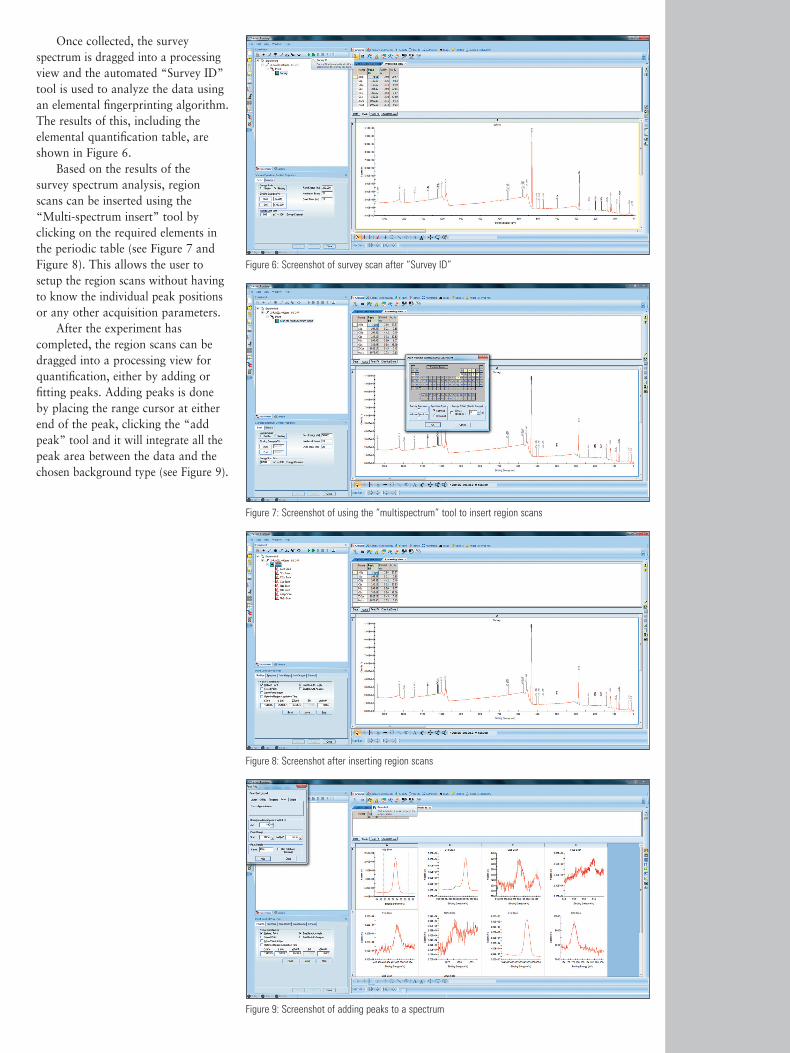
Once collected, the survey spectrum is dragged into a processing view and the automated “Survey ID” tool is used to analyze the data using an elemental fingerprinting algorithm. The results of this, including the elemental quantification table, are shown in Figure 6.
Based on the results of the survey spectrum analysis, region scans can be inserted using the “Multi-spectrum insert” tool by clicking on the required elements in the periodic table (see Figure 7 and Figure 8). This allows the user to setup the region scans without having to know the individual peak positions or any other acquisition parameters.
After the experiment has completed, the region scans can be dragged into a processing view for quantification, either by adding or fitting peaks. Adding peaks is done by placing the range cursor at either end of the peak, clicking the “add peak” tool and it will integrate all the peak area between the data and the chosen background type (see Figure 9).
Figure 6: Screenshot of survey scan after “Survey ID”
Figure 7: Screenshot of using the “multispectrum” tool to insert region scans
Figure 8: Screenshot after inserting region scans
Figure 9: Screenshot of adding peaks to a spectrum

If a peak fit is required to deconvolve overlapping peaks from different chemical states then, once the range is selected, the “peak fit” tool can be used to add and fit peaks to the spectrum (see Figure 10).
Once all the regions scans have been processed, the full chemical state quantification is shown in the peak table above the spectra (see Figure 11).
This whole process can be repeated to give multiple point analyses in one experiment. Figure 12 shows the experiment setup to run three consecutive point analyses in the brown, grey and shiny parts of the sample. The software can also be configured to run this process automatically (Auto-Analysis mode), where the experiment is created on-the-fly by the instrument based on analysis of the survey spectrum, and data is exported to a Microsoft® Word® report.
Figure 12: Screenshot of the experiment tree setup to run multiple point analyses
Figure 10: Screenshot of fitting peaks to a spectrum
Figure 11: Screenshot of full chemical state quantification after all spectra have been analyzed

Part of Thermo Fisher Scientific
AN52297_E 02/12M
www.thermoscientific.com©2012 Thermo Fisher Scientific Inc. All rights reserved. Microsoft and Microsoft Word are registered trademarks of Microsoft Corporation. All other trademarks are the property of Thermo Fisher Scientific Inc. and its subsidiaries. Specifications, terms and pricing are subject to change. Not all products are available in all countries. Please consult your local sales representative for details.
In addition to these
offices, Thermo Fisher
Scientific maintains
a network of represen
tative organizations
throughout the world.
Africa +27 11 822 4120Australia +61 3 9757 4300Austria +43 1 333 50 34 0Belgium +32 53 73 42 41Canada +1 800 530 8447China +86 10 8419 3588Denmark +45 70 23 62 60 Europe-Other +43 1 333 50 34 0Finland / Norway / Sweden +46 8 556 468 00France +33 1 60 92 48 00Germany +49 6103 408 1014India +91 22 6742 9434Italy +39 02 950 591Japan +81 45 453 9100Latin America +1 561 688 8700Middle East +43 1 333 50 34 0Netherlands +31 76 579 55 55New Zealand +64 9 980 6700Russia/CIS +43 1 333 50 34 0Spain +34 914 845 965Switzerland +41 61 716 77 00UK +44 1442 233555USA +1 800 532 4752
VG Systems Ltd. Trading as Thermo Fisher Scientific, East Grinstead, UK is ISO Certified.
Results
Table 1 shows the comparison table of the chemical state quantification for all three analysis points.
The quantification shows that the shiny and grey areas have very similar chemistries, with the only clear differences being the levels of carbon and oxygen. The brown area has over 10% of Fe2O3 and a significant increase in the amount of ZnO as compared to the two other analysis points. As the iron oxide is on the surface, the signals from the elements beneath (most notably aluminum) are reduced. This attenuation of the substrate signal allows the thickness of the iron oxide layer to be calculated using another tool in the Avantage™ data system, based on a simple two-layer model. Using this tool, the iron oxide thickness is 1.5 nm. The identification of increased levels of zinc oxide and iron oxide enabled the analyst to determine the cause of the discoloration on the sample and hence the failure of the component.
Summary
The K-Alpha XPS system can be used to analyze points of interest on the surface of a sample quickly, easily and reliably by making use of the user-friendly experiment setup interface and the integrated data-processing tools.
Name Shiny Area At. % Grey Area At. % Brown Area At. %
Al2p Al2O3 20.11 21.38 8.64
Si2p SiO2 0.36 0.23 0.60
S2p sulfate 0.60 0.40 0.23
Cl2p organic 0.25 0.32 0.46
C1s C-C/C-H 17.78 9.51 11.88
C1s C-O 11.43 13.36 10.31
C1s C=O 3.01 2.70 2.63
N1s organic 0.75 0.55 0.59
O1s 45.10 51.08 53.57
Fe2p Fe2O3 0.27 0.18 10.14
Zn2p3/2 ZnO 0.16 0.18 0.82
Na1s 0.18 0.12 0.14
Table 1: Full chemical state quantification for all three analysis points