committeesp2m.upj.ac.id/userfiles/files/ferdinand fassa - iconbuild.pdf · emeritus prof. roger...
TRANSCRIPT

1

4
COMMITTEES INTERNATIONAL SCIENTIFIC COMMITTEE
1. Prof. Datuk Ir. Dr. Wahid Omar, Universiti Teknologi Malaysia, Malaysia 2. Prof. Dr. Muhd Zaimi Bin Abd Majid, Universiti Teknologi Malaysia, Malaysia 3. Prof. Dr. Mohammad Bin Ismail, Universiti Teknologi Malaysia, Malaysia 4. Prof. Ir. Dr. Mahmood Bin Md. Tahir, Universiti Teknologi Malaysia, Malaysia 5. Prof. Ir. Dr. Mohd Hanim Bin Osman, Universiti Teknologi Malaysia, Malaysia
6. Prof. Dr. Safian Sharif, Universiti Teknologi Malaysia, Malaysia 7. Prof. Ir. Dr. Rosli Bin Mohd Zin, Universiti Teknologi Malaysia, Malaysia 8. Assoc. Prof. Sr. Dr. Faridah Ismail, Universiti Teknologi Mara, Malaysia 9. Assoc. Prof. Dr. Norhazilan Bin Md Noor, Universiti Teknologi Malaysia, Malaysia 10. Assoc. Prof. Dr. Abdul Rahman Bin Mohd. Sam, Universiti Teknologi Malaysia, Malaysia 11. Dr. Shek Poi Ngian, Universiti Teknologi Malaysia, Malaysia 12. Dr. Mohammadamin Azimi, Universiti Teknologi Malaysia, Malaysia 13. Professor Osamu Takahashi, Nagaoka University of Technology, Japan 14. Professor Seom Jeong Sang, Yonsei University, Korea
15. Professor Dr. Kim Jang-Ho Jay, Yonsei University, Korea 16. Professor Lee Juhnwan, Yonsei University, Korea 17. Mohan Maweswaran Kumaraswamy, University of Hong Kong, Hong Kong 18. Professor Geoffrey Q. P. Shen, Hong Kong Polytechnic University, Hong Kong 19. Tony Thorpe, Loughborough University, United Kingdom 20. Emeritus Prof. Roger James Plank, University of Sheffield, United Kingdom 21. Professor Dr. Jean-Paul Lebet, École Polytechnique Fédérale De Lausanne, France 22. Halim Boussabaine, University of Liverpool, United Kingdom 23. Dr-Ing. Hans Peter Leimer, University of Applied Sciences And Arts Hawk Hildesheim, Germany
24. Dr-Ing. Wolfgang Rettberg, University of Applied Sciences And Arts Hawk Hildesheim, Germany 25. Professor Dr. Md. Zakariahossain, Mie University, Japan 26. Professor Chimay J. Anumba, Florida University, USA
27. Professor Miroslaw J. Skibniewski, University of Maryland, USA 28. Associate Professor Yixin Shao, Mcgill University, Quebec, Canada

5
TECHNICAL COMMITTEE
SRIWIJAYA UNIVERSITY (INDONESIA)
1. Prof. Dr. Ir. Anis Saggaff, MSCE 2. Prof. Dr. Ir. Erika Buchari, M.Sc. 3. Dr. Eng. Ir. Joni Arliansyah, M.T. 4. Dr. Saloma, S.T., M.T.
5. Dr. Eng. Ir. Gunawan Tanzil, M.Eng. 6. Dr. Ir. Hanafiah, M.S. 7. Dr. Ir. Dinar Dwi Anugrah Putra, MSPJ 8. Dr. Ir. Maulid M. Iqbal, M.S. 9. Ir. Yakni Idris, M.Sc., MSCE 10. Ir. Sarino, MSCE
UNIVERSITI TEKNOLOGI MALAYSIA (MALAYSIA)
1. Prof. Ir. Dr. Mahmood Bin Md. Tahir 2. Prof. Dr. Muhd Zaimi Bin Abd. Majid 3. Prof. Dr. Mohammad Bin Ismail 4. Prof. Ir. Dr. Mohd Hanim Bin Osman 5. Prof. Ir. Dr. Ramli Bin Nazir 6. Prof. Ir. Dr. Rosli Bin Mohd Zin 7. Prof. Dr. Safian Sharif 8. Prof. Dr. Edy Tonnizam Bin Mohamad 9. Assoc. Prof. Dr. Abdul Rahman Bin Mohd. Sam
10. Assoc. Prof. Dr. Rozana Binti Zakaria 11. Assoc. Prof. Dr. Norhazilan Bin Md Noor
12. Assoc. Prof. Dr. Zaiton Binti Haron 13. Assoc. Prof. Dr. Raja Nafidah Binti Raja Shahminan 14. Dr. Khairulzan Bin Yahya 15. Dr. Ahmad Kueh Beng Hong 16. Dr. Tan Cher Siang 17. Dr. Ma Chau Khun 18. Dr. Rohaya Binti Abd. Jalil 19. Dr. Low Sheau Ting 20. Dr. Khairil Anwar Bin Mohamed Khaidzir
21. Dr. Shek Poi Ngian 22. Dr. Mohammadamin Azimi
Shuttle bus services quality assessment Tangerang Selatan toward smart cityFerdinand Fassa, Fredy Jhon Philip Sitorus, and Tri Nugraha Adikesuma
Citation: AIP Conference Proceedings 1903, 060008 (2017);View online: https://doi.org/10.1063/1.5011562View Table of Contents: http://aip.scitation.org/toc/apc/1903/1Published by the American Institute of Physics
Shuttle Bus Services Quality Assessment Tangerang Selatan toward Smart City
Ferdinand Fassaa), Fredy Jhon Philip Sitorusb), Tri Nugraha Adikesuma
Pembangunan Jaya University
a)Corresponding author: [email protected] b)[email protected]
Abstract. Around the world, shuttle bus operation played the significant role to accommodate transportation for commuting bus passengers. Shuttle Bus services in cities are provided by various bus agencies with kinds of own specific purposes. For instance, at Tangerang Selatan, Indonesia, it was said that shuttle bus In Trans Bintaro is run and operated by private bus companies hire by Bintaro developer. The aim of this research is to identify factors of satisfaction of shuttle bus service in Kota Tangerang Selatan, Indonesia. Several factors are used to analyze sums of 20 parameters performance indicators of Shuttle Bus. A face to face interview using a questionnaire (N=200) was used to collect data on October and March 2017. Likert and diagram Cartesian were used to model the all the parameters. This research succeeded in finding some categories of Shuttle bus service attributes such as accessibility, comfort, and safety. Users agreed that eight indicators in shuttle bus have the excellent achievement, while three indicators on performance remain low and should receive more attention especially punctuality of the bus.
INTRODUCTION
Could you define what a smart city? for some cities, that might be the improved of facilities such as public safety, education or better transportation system and in another word smart city is one that focused on continual improvement. Services quality are important in measuring for public transportation services in Indonesia. The service quality reflects the decision of potential passengers whether they used the shuttle bus services or not. It is important to evaluate the passenger’s perception of the shuttle bus service in order to find passengers satisfaction in terms of comfort, availability, and safety. Low quality of service results in inconvenience for users, thus reduces the service competitiveness against private vehicle use. In the year 2008, Tangerang Selatan was established as one of the cities in Banten province, by that time Tangerang Selatan has risen as one of the cities with high development. In this city grew many residential areas with kind of its facilities such as the mall, park, school, and shuttle bus to accommodate people in traveling. Tangerang Selatan has more than 3 shuttle bus system spread in difference residences/zone namely Serpong Alam Sutera, Gading Serpong Summarecon, Serpong BSD and Bintaro area.
This research is focusing on continual improvement in one are which is Bintaro area. Shuttle bus in Bintaro established on 2014, and the population of the ridership in 2016 is 200-280 people per day. The needs for evaluation of shuttle bus services in increasing the activity are important to attract an urban population. It is said that the increased activity of the population will increase the demanding in using public transport and the impact on the level of public transport services (Garling et al. 2002). Sezhian (2011) said the public transport service is a measurement. The analysis and evaluation of the performance are the strategies in improving the service quality of transportation systems, strategies in improving the performance of bus services and provide optimal results in operation are requiring a revamping transportation system based on the characteristics of bus transport services (Adris.A.Putra et al. 2014). This paper reviews the shuttle bus services in Kota Tangerang Selatan focusing on Bintaro area by gathering information about the service operations, and the passenger’s perception using questionnaire survey method.
Proceedings of the 3rd International Conference on Construction and Building Engineering (ICONBUILD) 2017AIP Conf. Proc. 1903, 060008-1–060008-7; https://doi.org/10.1063/1.5011562
Published by AIP Publishing. 978-0-7354-1591-1/$30.00
060008-1

LITERATURE
Study on various topics of service performance has been carrying out globally. The purpose of these studies is for quality improvements in public transport, so passenger’s satisfaction can be achieved. Some models were introduced and suggested to analyze shuttle buses reliability performance, such as quality of service and passenger’s perception (Yaqub N & Madzlan Napiah, 2011) and effects of shuttle service (Steve Lawson et.al, 2011).
The public transportation service, in this case, shuttle bus is important in improving the quality of service and reduce various problems in public transportation systems. It is stated that to improve the public transportation service performance in urban areas is needs public transport passenger preferences in order to accommodate the requirement. Assessment on public transportation services performance is essential in providing satisfaction to the users of public transportation (Beirao and Cabral 2007).
Scheuning (2004) said that quality of service on public transportation is the requirement or the fulfillment of the expectations that compares the results with the need, the expectations to compare whether to accept a level of quality service. And It is said that public transportation user satisfaction was related to the perceived quality of service, public transportation users feel the quality of service, because every person tends to have a different assessment of public transportation quality, and they will continue in using public transportation if they feel satisfy (Olsen 2007).
Meyer (2002) stated that services performance of the transportation system, the passenger’s satisfaction indicators affected by the reliability of the public transportation system, speed, travel time, delays, security, and travel expenses. And also they state that satisfaction on services is the indicators that affect convenience, travel time and reliability, these indicators give impact on customer satisfaction (Cavana and Corbett, 2007).
Furthermore, there are three main things to note on passengers dissatisfaction in public transportation system which is: accessibility, cost and station stops (Andreassen and Lindestad, 1998).
The indicators to give you the satisfaction of users of public transport are the provision of public transportation and a range of public transportation services. In addition, the indicator such as waiting time and comfort is the most significant indicator that affects the transport user satisfaction in general (Trynopoulos and Antoniou,2008).
Based on the description of public transportation performance satisfaction evaluation,it is said that public transport is expected to provide a strategy for improving the performance of transit-oriented towards satisfaction of urban public transport users and at the end public transportation should be able to deliver high performance, in order to give satisfaction to the passengers of public transportation.
The indicator used to evaluate and assess the performance of public transport services is in this case Shuttle bus is based on Bus Passenger Survey indicators conducted by Passenger Focus in 2014 and indicators issued by the Minister of Transportation Regulation No. 46 2014.
The main indicators used are as follows: Waiting Time & Travel time Bus Stop consists of The information provided at the stop, freedom from litter, the location of the stop is quite
representative Bus conditions such as bus cleanliness, seat availability, hand railing availability for standing, The cleanliness
outside of the bus, exterior condition of the bus, The cleanliness and condition inside the bus, Information that provided inside the bus, The availability of seating or space to stand, The temperature inside the bus.
METHODS
The research method is the descriptive quantitative method, it is used to describe the perception of an individual, or the symptoms of the particular group, or influence in public relations. The rating scales on this questionnaire is using the likert scale and to evaluate the shuttle bus performance and customer satisfaction level translated into the Cartesian diagram.
Cartesian diagram used to divide all indicators into four quadrants, which is the top priority in quadrant I, quadrant II keep achievement in quadrant II, redundant in quadrant III, and quadrant IV in low priority. This quadrant shows in Fig. 1.
060008-2

Impo
rtan
ce (Y
)
II I
IV III
Performance (X) FIGURE 1. Diagram Cartesian
Data about shuttle bus services in Bintaro Area is gathered during a survey in the visiting shuttle bus transit area.
The schedules and announcement are observed and taken note. The interviewer is taken from the drivers, by using all information, the service performance can be identified. A survey using questionnaire is conducted to determine the shuttle bus passenger’s demography. It is important to use questionnaire survey to understand their passenger in order to increase quality service that raises the passenger’s satisfaction and decision to keep using the service. Totally 250 questionnaires are given out, but only 200 respondents are collected over period of two (2) months of October and March 2016/2017.
DATA ANALYSIS
Description of Survey Respondents
In total, 200 ridership responded to the survey in four days. This figure represents around 80% of shuttle total ridership everyday day. The sample of the passenger from whom survey responses were collected represents a well-balanced sample that includes representatives from various categories in which shuttle bus ridership could be categorized.
These categories include gender, ridership aged and ridership occupation. Pertaining to gender, 45% of respondents were female while 55% were male. In the ridership aged category, the highest percentage of respondents was aged 21 to 30 at 37%. They were followed by aged under 20 at 35%, aged 31-41 at 15% and aged over 60 at 3% Fig. 2 shows the ridership aged distribution of the survey respondents.
The ridership classification groups of the civil servant, the private employee, police/army, entrepreneur, professional and others represented significantly fewer proportions of the survey respondent population at 4%, 39%, 1%, 4%, 3% and 49% respectively as shown in Fig. 3.
060008-3

FIGURE 2. Ridership aged
FIGURE 3. Ridership occupations
Shuttle Performance Assessment
Where data was available, shuttle service performance was assessed in 3 areas spread with 20 indicators: punctuality & time waiting for the bus, the bus stop, and on the bus condition performance. The results from the calculation shown in Table 1.
Table 1 describe all indicators in spread into four quadrants with divide is the average rate of performance and interest, the average interest rate of shuttle bus is 3.05/4 and the average performance is 3.24/4. Assessment the level of performance and interest will bring different perspectives according to what is perceived, Cartesian diagram used to portray the intersection of quadrant and the average value of the performance rate and interest of shuttle bus services
35%
37%
15%
7%
3% 1% 2%
Ridership Aged
<20
21-30
31-40
41-50
51-60
61-70
>70
4%
39%
1%4%
3%
49%
Occupations
Civil Servant
Privete Employee
Police/Army
Enterpreneur
Profesional
Others
060008-4

with the purpose to find out the specifics of each indicator is located on the quadrant in the Cartesian diagram. Cartesian quadrant position indicators can be shown in Fig. 4.
TABLE 1. Position indicators Indicator Average Performance (X) Average Performance (Y)
The information provided the stop 3.01 3.21 Route/destination information on the inside of the bus 2.97 3.09 The cleanliness and conduction of the inside of the bus 3.30 3.40 The cleanliness and conduction of the outside of the bus 3.19 3.27 The ease of getting onto and off the bus 3.15 3.28 Punctually of the bus 2.76 3.29 Time journey on the bus took 2.84 3.22 The availability of seating 3.08 3.21 The availability of space to stand 3.09 3.17 The comfort of the seats 3.13 3.18 Provision of grab rails to stand/move within the bus 3.00 3.11 The amount of personal space you had around you 3.15 3.28 The temperature inside the bus 3.17 3.31 Your personal security whilst on the bus 3.18 3.28 The helpfulness and attitude of the driver 3.07 3.29 Safety of the driving (i.e. Speed, driver concentrating) 3.17 3.34 How near to the kreb the driver stopped 2.93 3.17 It's condition/standard of maintenance 2.91 3.23 Bus location position 2.99 3.24 Overall satisfaction with the bus stop 3.01 3.31
FIGURE. 4. Shuttle bus indicators performance
Fig. 4 presents the location of each indicator, the indicators are described as follows:
Quadrant I, Indicators that located in this quadrant describe high interest and high performance it is mean this
indicators has given satisfaction and must be maintain the achievement. The indicators must be maintained because it has attracted the attention of users to utilize shuttle bus. There are eight indicators that can be maintained, which are: o The cleanliness and condition interior of the bus as shown in Fig. 5 (a). o The cleanliness and condition exterior of the bus as shown in Fig. 5 (b). o The ease of getting onto and off the bus o The amount of personal space you had around you
060008-5
o The temperature inside the bus o The security whilst on the bus o The helpfulness and the attitude of the driver o Safety of the driving (i.e. speed, driver concentrating)
(a) (b)
FIGURE 5. (a) Interior of the bus condition (b) exterior of the bus condition
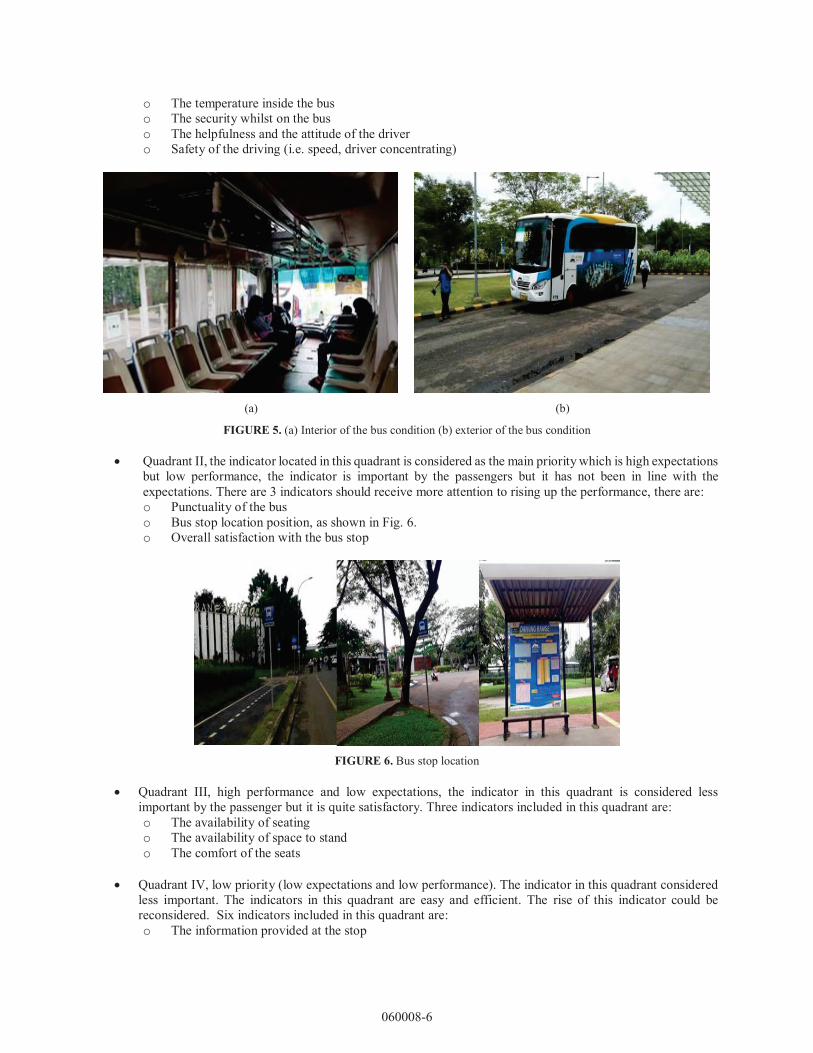
Quadrant II, the indicator located in this quadrant is considered as the main priority which is high expectations but low performance, the indicator is important by the passengers but it has not been in line with the expectations. There are 3 indicators should receive more attention to rising up the performance, there are: o Punctuality of the bus o Bus stop location position, as shown in Fig. 6. o Overall satisfaction with the bus stop
FIGURE 6. Bus stop location
Quadrant III, high performance and low expectations, the indicator in this quadrant is considered less
important by the passenger but it is quite satisfactory. Three indicators included in this quadrant are: o The availability of seating o The availability of space to stand o The comfort of the seats
Quadrant IV, low priority (low expectations and low performance). The indicator in this quadrant considered
less important. The indicators in this quadrant are easy and efficient. The rise of this indicator could be reconsidered. Six indicators included in this quadrant are: o The information provided at the stop
060008-6

o Route/destination information on the outside of the bus o Time journey on the bus took o Provision of grab rails to stand/move within the bus, as shown in Fig. 7 o How near to the kerb the driver stopped o Its condition/standard of maintenance
FIGURE 7. Provision of grab rails to stand/move within the bus
CONCLUSION
Eight indicators in shuttle bus have the excellent achievement, while three indicators on performance remain low and should receive more attention especially punctuality of the bus. And there still three indicators high performance but low expectations. And finally, six indicators should need attention because of them. Have low expectations and low performance. To summarize this paper there still need some improvement in several indicators, only less than 60% are in good performance.
REFERENCES
1. Adris. A. Putra et al., IRJES 3, 38-44 (2014). 2. Beirao dan Cabral, Transport Policy 14, 478-489 (2007). 3. T. Garling, D. Eek, P. Loukopoulos, S. Fujii, O. Johansson, R. Kitamura, Transport Policy 9(1), 59-70 (2002). 4. Olsen, S.O., Psychol Market 24, 315–341, (2007). 5. E. Scheuning, The Service Quality Handbook (New York, 2004). 6. M. V. Sezhian, C. Muralidharan, T. Nambirajan, S. G. Deshmukh, IJEST 3(2), 1046-1059 (2001). 7. Steve Lawson, Transportation Research Record: Journal of the Transportation Research Board (Transportation
Research Board of the National Academies, Washington D.C, 2011), pp. 97–106. 8. N. Yaqub and Madzlan Napiah, IJCEE-IJENS 11(5), 1 (2011).
060008-7