farnoorough england) f/6 01 05033 aeroynamic royal
TRANSCRIPT
05033 ROYAL AIRCRAFT ESTABLISHMENT FARNOOROUGH ENGLAND) F/6 01AEROYNAMIC CHARACTERISTICS OF MOVING TRAILING-EDGE CONTROLS AT--ETC(U)JN 79 D B MABEY, 0 M MCOWAT. B L WELSH
UNC-SF]ED RAE-TMSTRUCTURES" t7 DRIC-BR-69932 NL
NO
780T c
TECH. MEMO TECH. MEMOSTRUCTURES 947 STRUCTURES 947 /
~ LEVELV ,R93 /ROYAL AIRCRAFT ESTABLISHMENT
AERODYNAMIC CHARACTERISTICS OF MOVING TRAILING-ZDGE CONTROLSSAT
SUBSONIC AND TRANSONIC SPEEDS,
A- *- -
!.' D. G.1/Mbey
D. M.i McOwat
I-.I
B. L., Welsh
Juna-1979/ 1
nqq
~140
U * j
ROYAL AIRCRAFT ESTABLISHMENT
Technical Memorandum Structures 947
Received for printing 25 June 1979
AERODYNAMIC CHARACTERISTICS OF MOVING TRAILING-EDGE CONTROLS
AT SUBSONIC AND TRANSONIC SPEEDS
by
D. G. Mabey
D. M. McOwat
B. L. Welsh
SUMMiARY
This paper compares oscillatory pressures calculated and measured at highsubsonic speeds for a swept back wing of aspect ratio 6 with a part-span trailing-"edge flap. The flap was driven at frequencies of 1 Hz (quasi-steady) and 90 Hzat Mach numbers from 0.40 to 0.*95 with both fixed and free transition over a rangeof Reynolds numbers from +6to 4 x 1o6. "~, . #.-
The measured oscillatory pressures depend strongly on the boundary-layerdisplacement thickness at the hinge line. Hence extrapolation from model to fullscale requires great care. In subsonic flow, tests with free transition give thethinnest turbulent boundary layer at the hinge line and come nearest to full scale.However, at transonic speeds transition should be fixed at a safe distance up-stream of the most forward excursion of the shock wave to obtain results appropri-ate to higher Reynolds number.
Tests with flap driven simultaneously at two frequencies (90 Hz and 131 Hz)at subsonic and transonic speeds produce the same oscillatory pressures at 131 Hzas when driven independently. Hence the principle of superposition applies, atleast for small amplitude motions with attached flows.
Prepared for AGARD Fluid Dy~namnics Panel Meeting on the Aerodynamic Characteristicsof Controls, May 1979
Copyright@©
Controller WMO London1979
IW
2
LIST OF CONTENTS
Page
1 INTRODUCTION 3
2 EXPERIMENTAL DETAILS 3
2.1 Pressure measurements 3
2.2 Model construction 3
2.3 Boundary layer measurements 3
2.4 Test conditions 4
3 RESULTS 4
3.1 Comparisons with theory 4
3.2 Principle of superposition 5
3.3 Transition measurements 5
3.4 Skin friction measurements 6
3.5 Influence of boundary layer 6
4 FUTURE RESEARCH 7
5 CONCLUDING REMARKS 8
Notation 9
References 10
Illustrations Figures 1-16
Report documentation page inside back cover
ACCESSION forNTIS ,. ;tp Section go IDDC C.' Section ElUNANNCI
JUSTIFIC ,
.. .....Y . .... ... .... ..
OISRA T; .""!15ILIIY CODESDist ' /or SPECIAL
~ 1
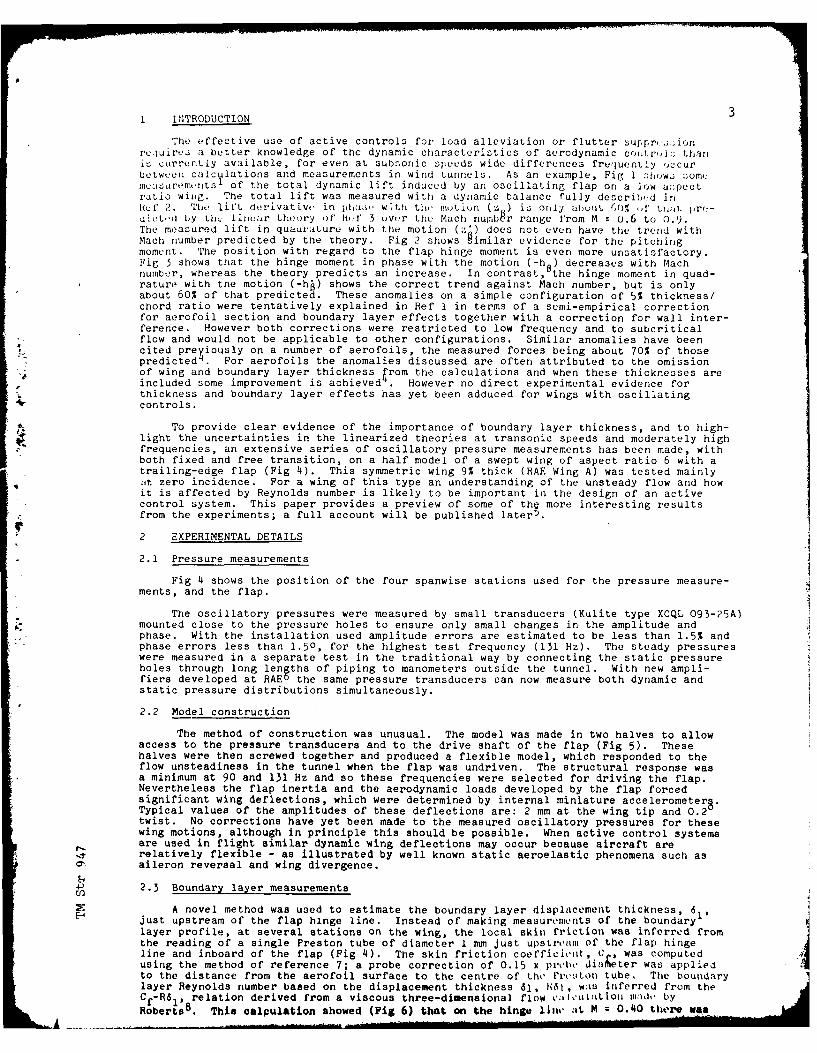
1 INTRODUCTION 3
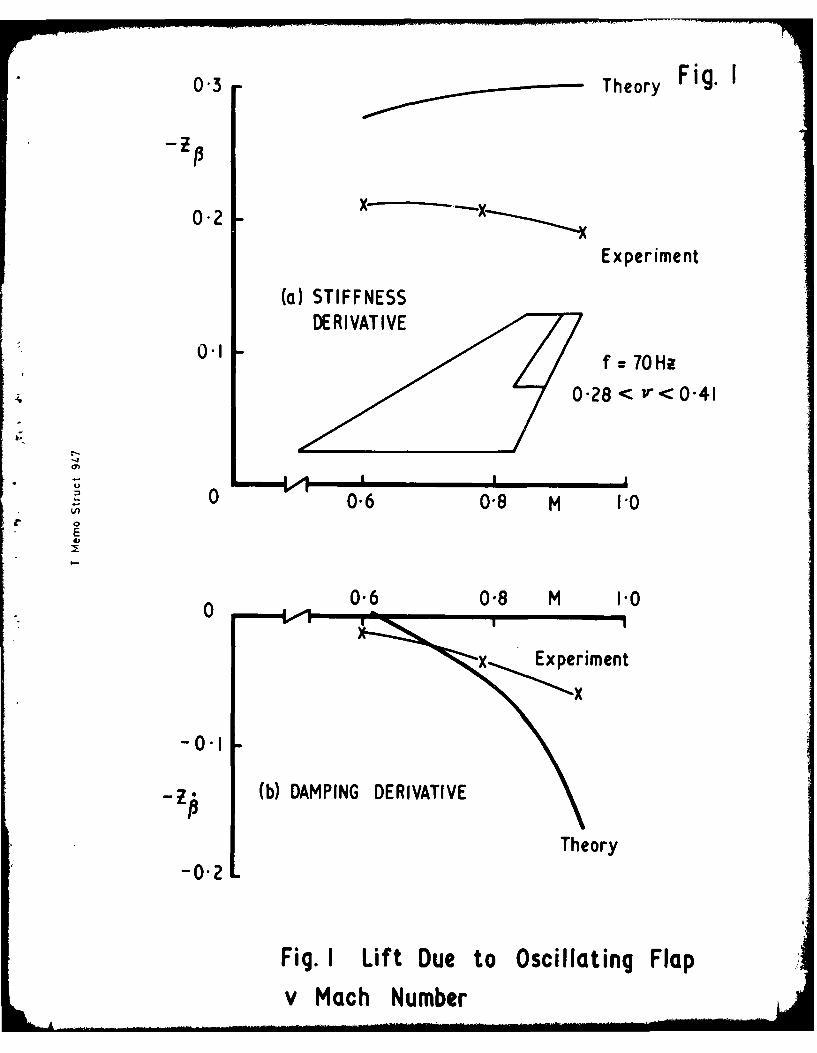
The effective use of active controls for load alleviation or flutter suppr,.;ionrequirea a better knowledge of the dynamic characteristics of aerodynamic cortrol:; thanis currently available, for even at subsonic speeds wide differences frequently occurbetween calcylations and measurements in wind tunnels. As an example, Fig 1 Zfhow:; :;omemoauremnts' of the total dynamic lift induced by an oscillating flap on a low a:spectratio wing. The total lift was measured with a dynamic balance fully described inRQt" 2. The lift derivativw in phatos with theo motiun ( ) is only about (,()% ,f tii;o. pro-U ctd by tht linear theory of' H2f 3 over the Mach numbgr range from M = 0.6 to 0.9.The measured lift in quadrature with the motion (z*) does not even have the trend withMach number predicted by the theory. Fig 2 shows gimilar evidence for the pitchingmoment. The position with regard to the flap hinge moment is even more unsatisfactory.Fig 3 shows that the hinge moment in phase with the motion (-h8 ) decreases with Machnumber, whereas the theory predicts an increase. In contrast,Bthe hinge moment in quad-rature with the motion (-h ) shows the correct trend against Mach number, but is onlyabout 60% of that predicted. These anomalies on a simple configuration of 5% thickness/chord ratio were tentatively explained in Ref 1 in terms of a semi-empirical correctionfor aerofoil section and boundary layer effects together with a correction for wall inter-ference. However both corrections were restricted to low frequency and to subcriticalflow and would not be applicable to other configurations. Similar anomalies have beencited preyiously on a number of aerofoils, the measured forces being about 70% of thosepredicted
. For aerofoils the anomalies discussed are often attributed to the omission
of wing and boundary layer thickness rom the calculations and when these thicknesses areincluded some improvement is achieved . However no direct experimental evidence for
% thickness and boundary layer effects has yet been adduced for wings with oscillatingcontrols.
To provide clear evidence of the importance of boundary layer thickness, and to high-light the uncertainties in the linearized theories at transonic speeds and moderately highfrequencies, an extensive series of oscillatory pressure measurements has been made, withboth fixed and free transition, on a half model of a swept wing of aspect ratio 6 with atrailing-edge flap (Fig 4). This symmetric wing 9% thick (RAE Wing A) was tested mainly;it zero incidence. For a wing of this type an understanding of the unsteady flow and howit is affected by Reynolds number is likely to be important in the design of an activecontrol system. This paper provides a preview of some of thg more interesting resultsfrom the experiments; a full account will be published later.
2 EXPERIMENTAL DETAILS
2.1 Pressure measurements
Fig 4 shows the position of the four spanwise stations used for the pressure measure-ments, and the flap.
The oscillatory pressures were measured by small transducers (Kulite type XCQL 093-25A)mounted close to the pressure holes to ensure only small changes in the amplitude andphase. With the installation used amplitude errors are estimated to be less than 1.5% andphase errors less than 1.50, for the highest test frequency (131 Hz). The steady pressureswere measured in a separate test in the traditional way by connecting the static pressureholes through long lengths of piping to manometers outside the tunnel. With new ampli-fiers developed at RAE
0 the same pressure transducers can now measure both dynamic and
static pressure distributions simultaneously.
2.2 Model construction
The method of construction was unusual. The model was made in two halves to allowaccess to the pressure transducers and to the drive shaft of the flap (Fig 5). Thesehalves were then screwed together and produced a flexible model, which responded to theflow unsteadiness in the tunnel when the flap was undriven. The structural response wasa minimum at 90 and 131 Hz and so these frequencies were selected for driving the flap.Nevertheless the flap inertia and the aerodynamic loads developed by the flap forcedsignificant wing deflections, which were determined by internal miniature accelerometer.Typical values of the amplitudes of these deflections are: 2 mm at the wing tip and 0.2twist. No corrections have yet been made to the measured oscillatory pressures for thesewing motions, although in principle this should be possible. When active control systemsare used in flight similar dynamic wing deflections may occur because aircraft arerelatively flexible - as illustrated by well known static aeroelastic phenomena such as
0. aileron reversal and wing divergence.
4 2.3 Boundary layer measurements
XA novel method was used to estimate the boundary layer displacement thickness, 61,Ejust upstream of the flap hinge line. Instead of making measurements of the boundary
layer profile, at several stations on the wing, the local skin friction was inferred fromthe reading of a single Preston tube of diameter I mm just upstr,,m Of the flap hinge
line and inboard of the flap (Fig 4). The skin friction coefficiit, "A. was computedusing the method of reference 7; a probe correction of 0.15 x probe 'in eter was appliedto the distance from the aerofoil surface to the centre of the .E'Veoton tube. The boundarylayer Reynolds number based on the displacement thickness 61, 101, was inferred from theCf-R6 1 , relation derived from a viscous three-dimensional flow vt viuatLti mtidv byRoberts
8. This calpulation showed (Fig 6) that on the hinge hut.' at M z 0.40 thero waa
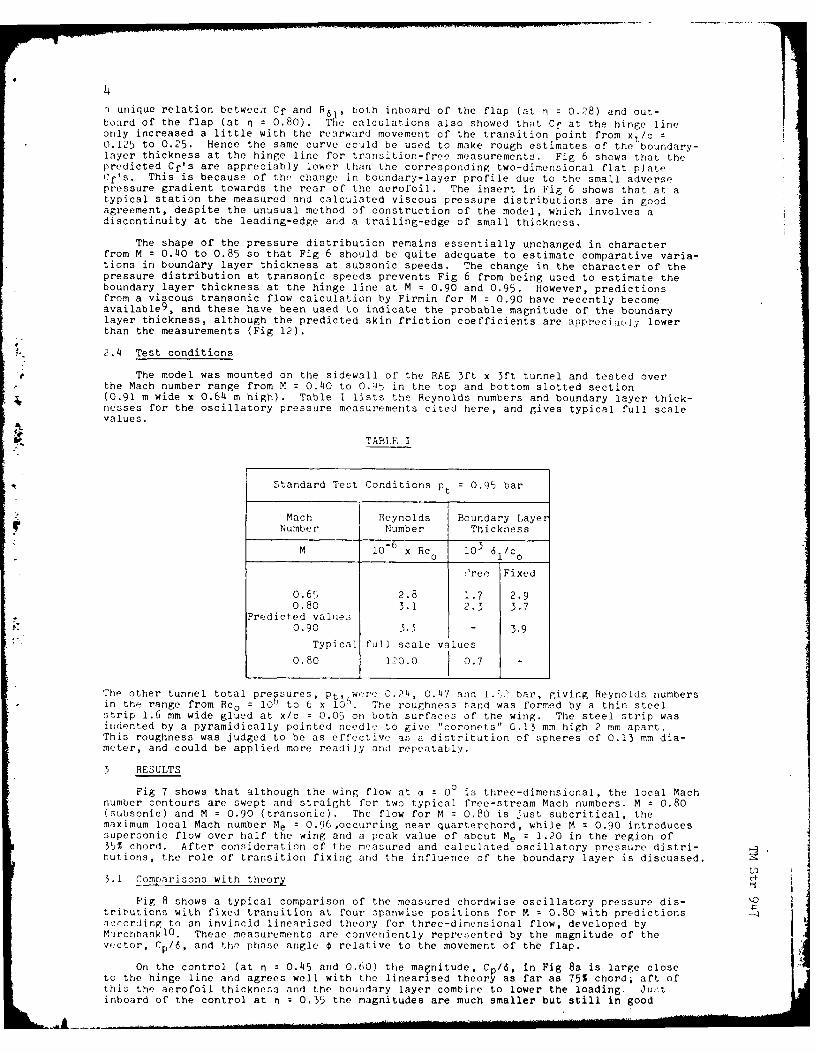
7 unique relation betwee,1 Cf and R6R, both inboard of the flap (at n = 0.28) and out-board of the flap (at n = 0.80). T e calculations also showed that Cf at the hinge lineonly increased a little with the rearward movement of the transition point from xt/c0.125 to 0.25. Hence the same curve could be used to make rough estimates of the boundary-layer thickness at the hinge line for transition-free measurements. Fig 6 shows that thepredicted Cf's are appreciably lower than the corresponding two-dimensional flat plateCf's. This is because of the change in boundary-layer profile due to the small adversepressure gradient towards the rear of the aerofoil. The insert in Fig 6 shows that at atypical station the measured and calculated viscous pressure distributions are in goodagreement, despite the unusual method of construction of the model, which involves adiscontinuity at the leading-edge and a trailing-edge of small thickness.
The shape of the pressure distribution remains essentially unchanged in characterfrom M = 0.40 to 0.85 so that Fig 6 should be quite adequate to estimate comparative varia-tions in boundary layer thickness at subsonic speeds. The change in the character of thepressure distribution at transonic speeds prevents Fig 6 from being used to estimate theboundary layer thickness at the hinge line at M = 0.90 and 0.95. However, predictionsfrom a viscous transonic flow calculation by Firmin for M = 0.90 have recently becomeavailable
9, and these have been used to indicate the probable magnitude of the boundary
layer thickness, although the predicted skin friction coefficients are appreciaul:; lowerthan the measurements (Fig 12).
2.4 Test conditions
The model was mounted on the sidewall of the RAE 3ft x 3ft tunnel and tested overthe Mach number range from M = 0.40 to 0.95 in the top and bottom slotted section(0.91 m wide x 0.64 m high). Table I lists the Reynolds numbers and boundary layer thick-nesses for the oscillatory pressure measurements cited here, and gives typical full scalevalues.
TABLE I
Standard Test Conditions pt = 0.95 bar
Mach Reynolds Boundary LayerNumber Number Thickness
M 10 x Rc 10 6 1/co
2ree Fixed
0.65 2.8 1.7 2.90.80 3.1 2.3 3.7
Predicted value:s0.90 3.3 - 3.9
Typical full scale values
0.80 120.0 0.7
The other tunnel total pre sures, Pt, wcre 0.24, 0.47 and 1.52 bar, giving Reynolds numbersin the range from Rco =iO1 to6 x 10 . The roughness [and was formed by a thin steelstrip 1.6 mm wide glued at x/c = 0.05 on both surfaces of the wing. The steel strip wasindented by a pyramidically pointed needle to give "coronets" 0.13 mm high 2 mm apart.This roughness was judged to be as effective as a distribution of spheres of 0.13 mm dia-meter, and could be applied more readily and repeatably.
3 RESULTS
Fig 7 shows that although the wing flow at a = 00 is three-dimensional, the local Machnumber contours are swept and straight for two typical free-stream Mach numbers. M = 0.80(subsonic) and M = 0.90 (transonic). The flow for M = 0.80 is just subcritical, themaximum local Mach number Me = 0.96,occurring near quarterchord, while M = 0.90 introducessupersonic flow over half the wing and a peak value of about Me = 1.20 in the region of35% chord. After consideration of the measured and calculated oscillatory pressure distri-butions, the role of transition fixing and the influence of the boundary layer is discussed.
to5.1 Comoarisons with theory
Fig 8 shows a typical comparison of the measured chordwise oscillatory pressure dis-tributions with fixed transition at four spanwise positions for M O.80 with predictionsnccording to an inviscid linearised theory for three-dimensional flow, developed byMlirchbanklO. These measurements are conveniently represented by the magnitude of thevector, Cp/6, and the phase angle 0 relative to the movement of the flap.
On the control (at n = 0.45 and 0.60) the maInitude, CD/6, in Fig 8a is large closeto the hinge line and agrees well with the linearised theory as far as 75% chord; aft ofthis the aerofoil thickness and the boundary layer combine to lower the loading. Justinboard of the control at n = 0.35 the magnitudes are much smaller but still in good
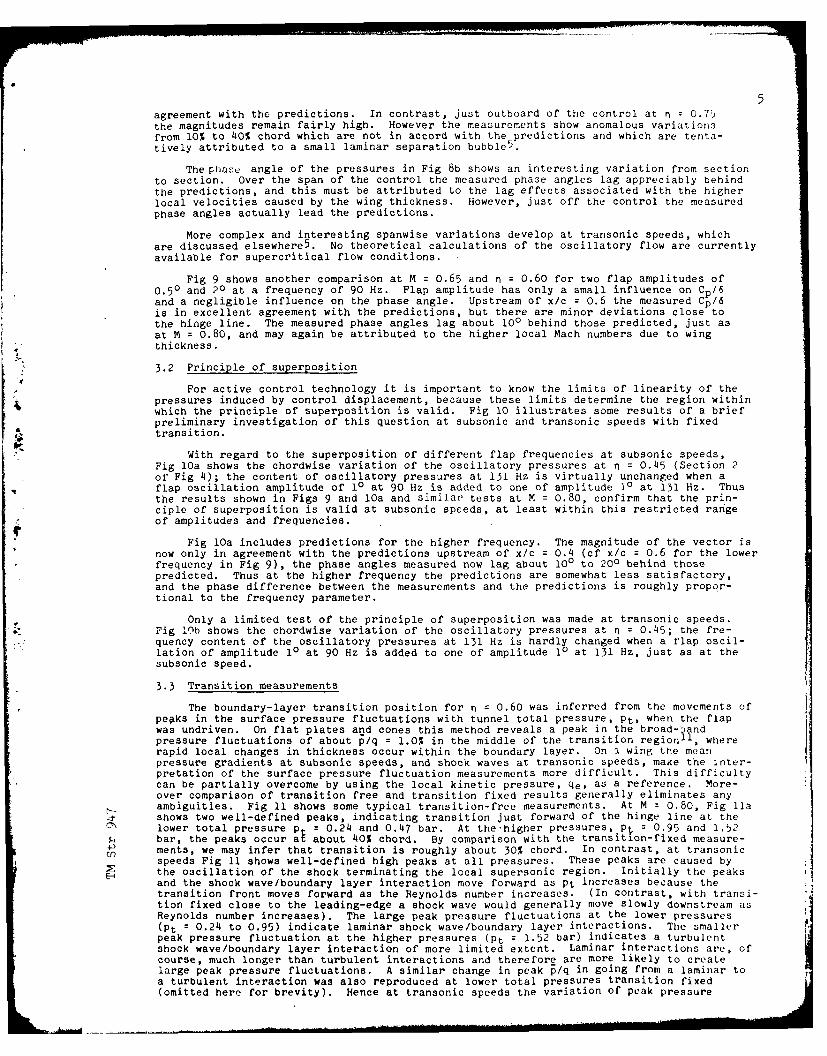
agreement with the predictions. In contrast, just outboard of the control at n r 7the magnitudes remain fairly high. However the measurements show anomalous variationsfrom 10% to 40% chord which are not in accord with the predictions arid which are terita-tively attributed to a small laminar separation bubble 5 .
The phase angle of the pressures in Fig 8b shows an interesting variation from sectionto section. Over the span of the control the measured phase angles lag appreciably behindthe predictions, and this must be attributed to the lag effects associated with the higherlocal velocities caused by the wing thickness. However, just off the control the measuredphase angles actually lead the predictions.
More complex and interesting spanwise variations develop at transonic speeds, whichare discussed elsewhere 5 . No theoretical calculations of the oscillatory flow are currentlyavailable for supercritical flow conditions.
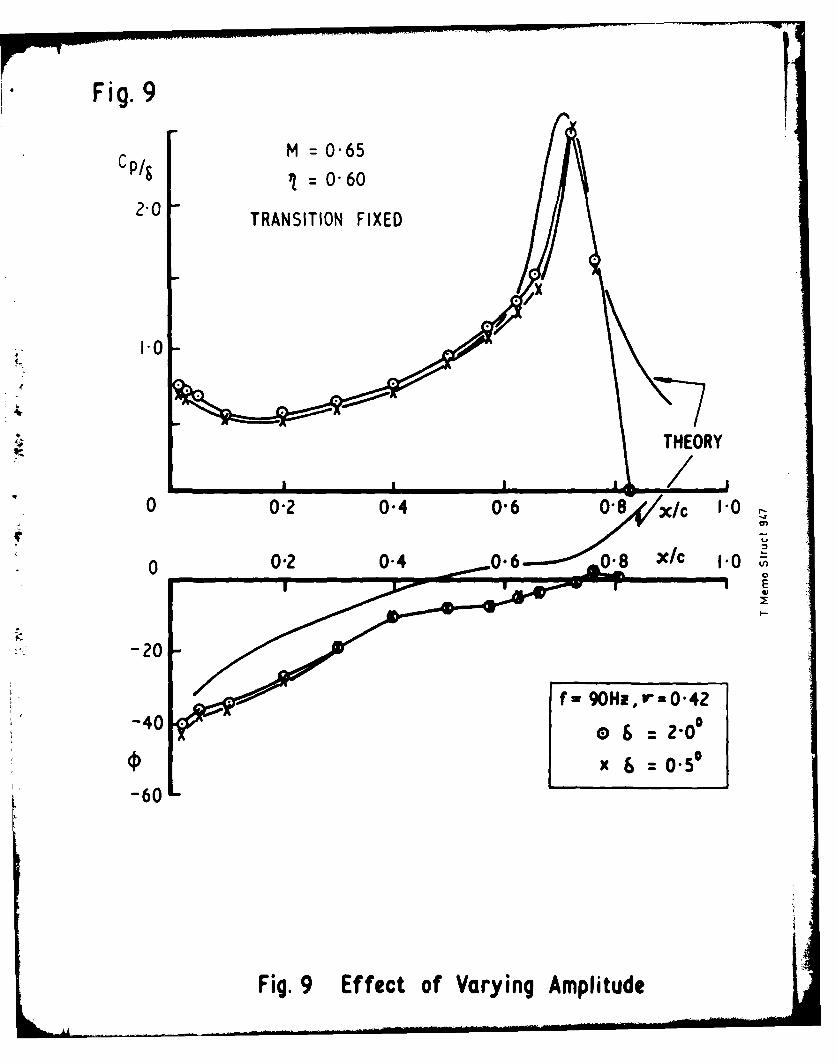
Fig 9 shows another comparison at M = 0.65 and n0.60 for two flap amplitudes of0.50 and 20 at a frequency of 90 Hz. Flap amplitude has only a small influence on C P 6and a negligible influence on the phase angle. Upstream of x/c =0.6 the measuredC /is in excellent agreement with the predictions, but there are minor deviations close tothe hinge line. The measured phase angles lag about 100 behind those predicted, just asat M =0.80, and may again be attributed to the higher local Mach numbers due to wingthickness.
3.2 Principle of superposition
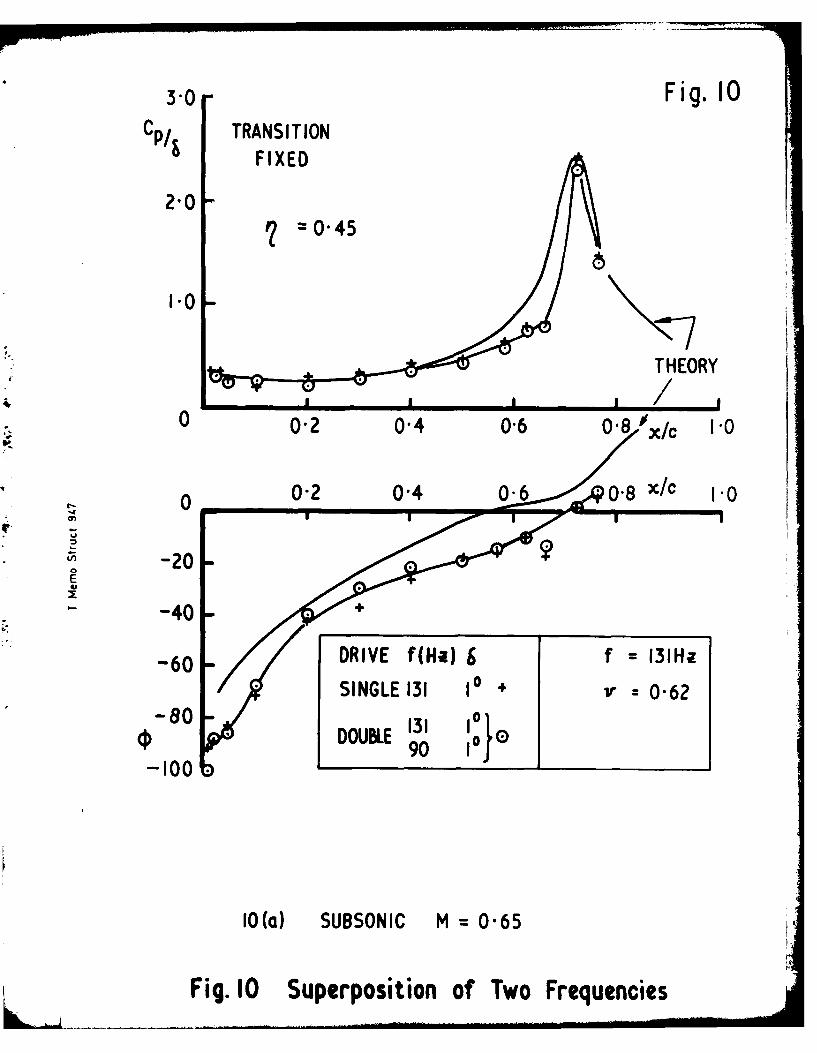
For active control technology it is important to know the limits of linearity of thepressures induced by control displacement, because these limits determine the region withinwhich the principle of superposition is valid. Fig 10 illustrates some results of a briefpreliminary investigation of this question at subsonic and transonic speeds with fixedtransition.
With regard to the superposition of different flap frequencies at subsonic speeds,Fig 10a shows the chordwise variation of the oscillatory pressures at n =0.45 (Section 2of Fig 4); the content of oscillatory pressures at 131 Hz is virtually unchanged when aflap oscillation amplitude of 10 at 90 Hz is added to one of amplitude 10 at 131 Hz. Thusthe results shown in Figs 9 and 10a and similar tests at M =0.80, confirm that the prin-ciple of superposition is valid at subsonic speeds, at least within this restricted rangeof amplitudes and frequencies.
Fig 10a includes predictions for the higher frequency. The magnitude of the vector isVnow only in agreement with the predictions upstream of x/c =0.4 (cf x/c =0.6 for the lower
frequency in Fig 9), the phase angles measured now lag about 100 to 200 behind thosepredicted. Thus at the higher frequency the predictions are somewhat less satisfactory,and the phase difference between the measurements and the predictions is roughly propor-tional to the frequency parameter.
Only a limited test of the principle of superposition was made at transonic speeds.Fig 10fb shows the chordwise variation of the oscillatory pressures at n =0.45; the fre-quency content of the oscillatory pressures at 131 Hz is hardly changed when a flap oscil-lation of amplitude 10 at 90 Hz is added to one of amplitude 10 at 131 Hz, just as at thesubsonic speed.
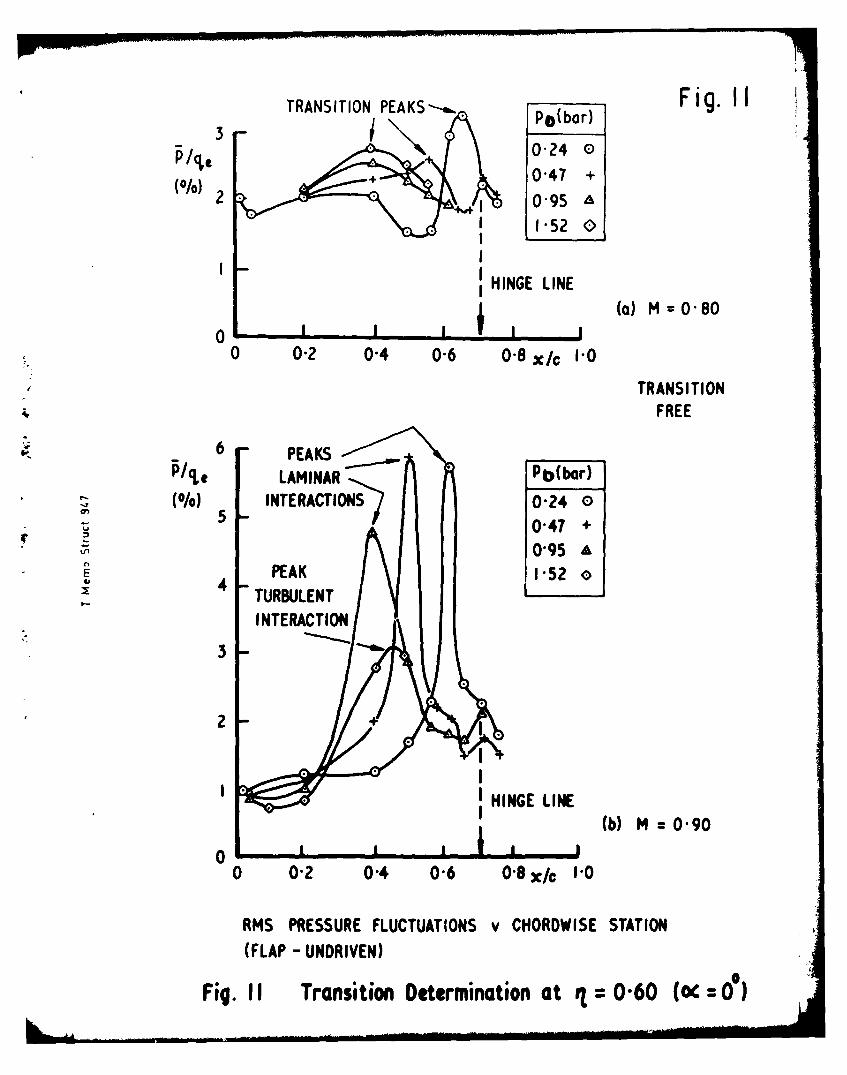
3.3 Transition measurements
The boundary-layer transition position for n = 0.60 was inferred from the movements ofpeAks in the surface pressure fluctuations with tunnel total pressure, pt, when the flapwas undriven. On flat plates and cones this method reveals a peak in the broad-Dandpressure fluctuations of about p/q =1.0% in the middle of the transition region11l, whererapid local changes in thickness occur within the boundary layer. On 'I wing the meanpressure gradients at subsonic speeds, and shock waves at transonic speeds, maxe the inter-pretation of the surface pressure fluctuation measurements more diffic~ult. This difficultycan be partially overcome by using the local kinetic pressure, qes as a reference. More-over comparison of transition free and transition fixed results generally eliminates anyambiguities. Fig 11 shows some typical transition-free measurements. At M =0.80, Fig Ilashows two well-defined peaks, indicating transition just forward of the hinge line at thelower total pressure p1 = 0.24 and 0.47 bar. At the-higher pressures, p 0.95 and 1.52bar, the peaks occur at about 40% chord. By comparison with the transition-fixed measure-
4 ments, we may infer that transition is roughly about 30% chord. In contrast, at transonicC) speeds Fig 11 shows well-defined high peaks at all pressures. These peaks are caused byH the oscillation of the shock terminating the local supersonic region. Initially the peaks
and the shock wave/boundary layer interaction move forward as pt increases because thetransition front moves forward as the Reynolds number increases. (In contrast, with transi-tion fixed close to the leading-edge a shock wave would generally move slowly downstream asReynolds number increases). The large peak pressure fluctuations at the lower pressures(Pt =0.24 to 0.95) indicate laminar shock wave/boundary layer interactions. The smallerpeak pressure fluctuation at the higher pressures (pt =1.52 bar) indicates a turbulentshock wave/boundary layer interaction of more limited extent. Laminar interactions are, ofcourse, much longer than turbulent interactions and therefore are more likely to createlarge peak pressure fluctuations. A similar change in peak p/q in going frnm a laminar toa turbulent interaction was also reproduced at lower total pressures transition fixed(omitted here for brevity). Hence at transonic speeds the variation of peak pressure
fluctuations with Reynolds number can be a valuable guide to the state cf the I urn aryj'yur at the shock even though it cannot give the precise transition position.
With the roughness band at the standard test pressure (Pt = 0.95 bar), transitiI. wa:3always close to the leading-edge so that the boundary layer at the hinge line was exce'-sively thick relative to full-scale values. Hence from the point of view of the trailing-edge flap, the boundary layer at the standard pressure must be described as "overfixed",with all the difficulties that this condition is known to introduce for steady neasurements.(See for example the discussion in Refs 12 and 13).
3.4 Skin friction measurements
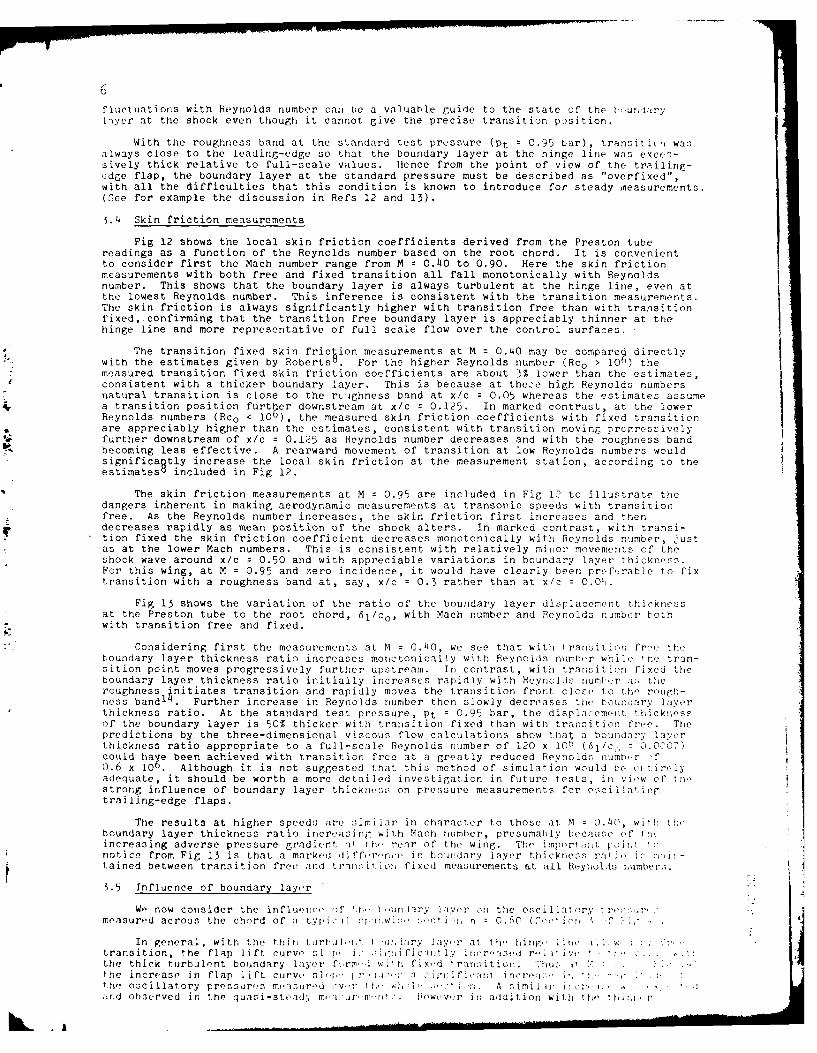
Fig 12 shows the local skin friction coefficients derived from the Preston tubereadings as a function of the Reynolds number based on the root chord. It is convenientto consider first the Mach number range from M = 0.40 to 0.90. Here the skin frictionmeasurements with both free and fixed transition all fall monotonically with Reynoldsnumber. This shows that the boundary layer is always turbulent at the hinge line, even atthe lowest Reynolds number. This inference is consistent with the transition measurements.The skin friction is always significantly higher with transition free than with transitionfixed, confirming that the transition free boundary layer is appreciably thinner at thehinge line and more representative of full scale flow over the control surfaces.
The transition fixed skin friczion measurements at M = 0.40 may be compare9 directlywith the estimates given by Roberts0 . For the higher Reynolds number (Reo > 10 ) themeasured transition fixed skin friction coefficients are about 3% lower than the estimates,consistent with a thicker boundary layer. This is because at theze high Reynolds numbersnatural transition is close to the roughness band at x/c = 0.05 whereas the estimates assumea transition position furt er downstream at x/c = 0.125. In marked contrast, at the lowerReynolds numbers (Rco < 100), the measured skin friction coefficients with fixed transitionare appreciably higher than the estimates, consistent with transition moving progressiveiyfurther downstream of x/c = 0.125 as Reynolds number decreases and with the roughness bandbecoming less effective. A rearward movement of transition at low Reynolds numbers wouldsignificantly increase the local skin friction at the measurement station, according to theestimates included in Fig 12.
The skin friction measurements at M = 0.95 are included in Fig 12 to illustrate thedangers inherent in making aerodynamic measurements at transonic speeds with transitionfree. As the Reynolds number increases, the skin friction first increases and thendecreases rapidly as mean position of the shock alters, In marked contrast, with transi-tion fixed the skin friction coefficient decreases monotonically with Reynolds number, justas at the lower Mach numbers. This is consistent with relatively minor movements of theshock wave around x/c = 0.50 and with appreciable variations in boundary layer thickness.For this wing, at M = 0.95 and zero incidence, it would have clearly been pref,:rable to fixtransition with a roughness band at, say, x/c = 0.3 rather than at x/c = 0.05.
Fig 13 shows the variation of the ratio of the boundary layer displacement thicknessat the Preston tube to the root chord, 6l/Co, with Mach number and Reynolds number bothwith transition free and fixed.
Considering first the measurements at M = 0.40, we see that with transition free theboundary layer thickness ratio increases monctonically with Reynolds number whil', 'the tran-sition point moves progressively further upstream. In contrast, with transition fixed theboundary layer thickness ratio initially increases rapidly with Reynolds rumber a_,; theroughness initiates transition and rapidly moves the transition front close to thp rough-ness band1 4 . Further increase in Reynolds number then slowly decreases the boundary layerthickness ratio. At the standard test pressure, Pt = 0.95 bar, the displacement thicknessof the boundary layer is 50% thicker with transition fixed than with transition free. Thepredictions by the three-dimensional viscous flow calculations show that a boundary layerthickness ratio appropriate to a full-scale Reynolds number of 120 x 100 (61/c. 7 0.o07)could have been achieved with transition free at a greatly reduced Reynolds numb,'r >f0.6 x 106. Although it is not suggested that this method of simulation would be r t' irelyadequate, it should be worth a more detailed investigation in future tests, in view of tnstrong influence of boundary layer thickne3s on pressure measurements fcr oscillalc.'n,trailing-edge flaps.
The results at higher speeds are similar in character to those at M = 0.40, with thboundary layer thickness ratio increasing with Mach number, presumably because of" Ih.increasing adverse pressure gradient at h- rear of the wing. The import Jit joitA 1,notice from Fig 13 is that a marked diff,'r.nce in boundary layer thickness rat ic m 1 -tained between transition free and tran: it.ion fixed measurements at all Reynolds roumber.;.
5.5 Influence of boundary layer
We now consider the influence of ti. tunil ry 1'iyer on the oscillatory ,. "measured across the chord of a typic-i c-r.W :,' c-tI m, 0. n 0 ( 0 c. ionr f ',-
In general, with the thin turhil,uI t I, n.liary lay,.r at the hinr,, line il w. i ttransition, the flap lift curve sl I igri ficot ly inore-se;d r,,it , ie " .the thick turbulent boundary layer f'.rm' I w:t h fixed t rant ition. hu v " . .the increase in flap lift curve- sl-i I Y, n , :: -I : ni fi'ar t incre::, it. t!, "the oscillatory pressures mesnured ov.r th. wII . ': A similar i ,t c r, i.ard observed in the quasi-steady m, ': ur. m nit: . Now,,v,,r in addition with the I I1., r
It
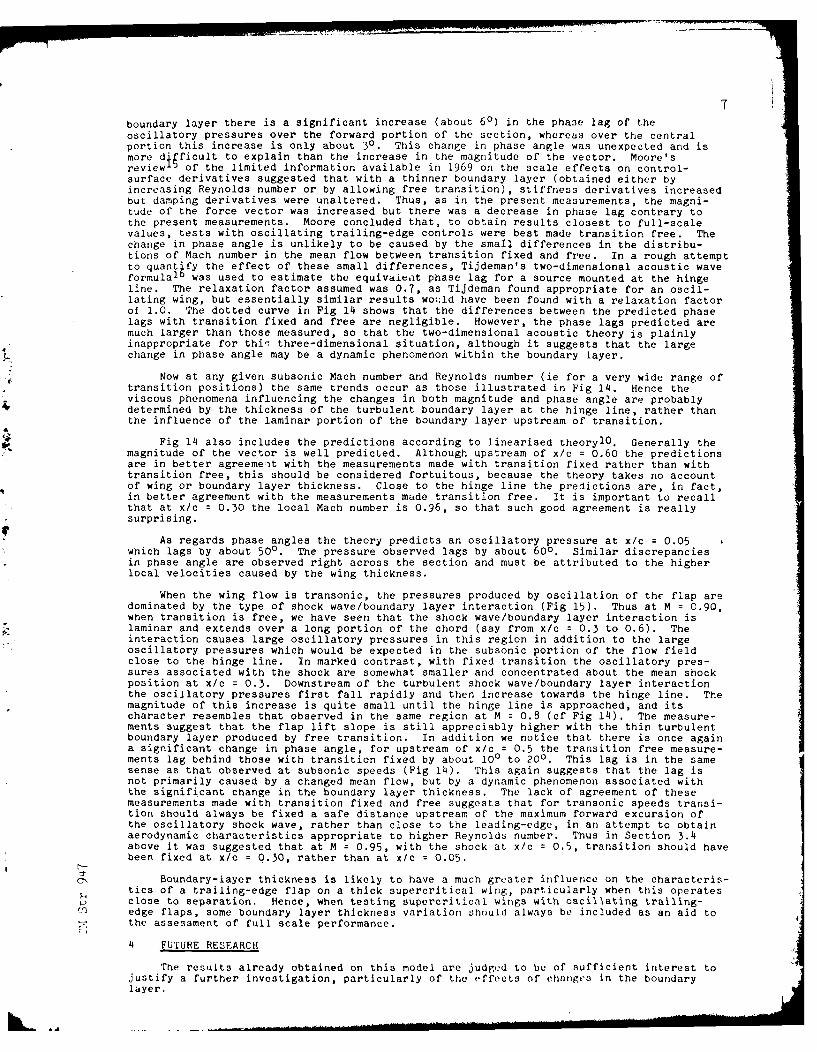
7boundary layer there is a significant increase (about 60) in the phase lag of theoscillatory pressures over the forward portion of the section, whereas over the centralportion this increase is only about 30. This change in phase angle was unexpected and ismore dificult to explain than the increase in the magnitude of the vector. Moore'sreview '~of the limited information available in 1969 on the scale effects on control-surface derivatives suggested that with a thinner boundary layer (obtained either byincreasing Reynolds number or by allowing free transition) , stiffness derivatives increasedbut damping derivatives were unaltered. Thus, as in the present measurements, the magni-tude of the force vector was increased but there was a decrease in phase lag contrary tothe present measurements. Moore concluded that, to obtain results closest to full-scalevalues, tests with oscillating trailing-edge controls were best made transition free. Thechange in phase angle is unlikely to be caused by the small differences in the distribu-tions of Mach number in the mean flow between transition fixed and free. In a rough attemptto quant fy the effect of these small differences, Tijdeman's two-dimensional acoustic wave
frua was used to estimate the equivalenit phase lag for a source mounted at the hingeline. The relaxation factor assumed was 0.7, as Tijdeman found appropriate for an oscil-lating wing, but essentially similar results wot:ld have been found with a relaxation factorof 1.0. The dotted curve in Fig 14 shows that the differences between the predicted phaselags with transition fixed and free are negligible. However, the phase lags predicted aremuch larger than those measured, so that the two-dimensional acoustic theory is plainlyinappropriate for thii three-dimensional situation, although it suggests that the largechange in phase angle may be a dynamic phenomenon within the boundary layer.
Now at any given subsonic Mach number and Reynolds number Cie for a very wide range oftransition positions) the same trends occur as those illustrated in Fig 14. Hence theviscous phenomena influencing the changes in both magnitude and phase angle are probablydetermined by the thickness of the turbulent boundary layer at the hinge line, rather thanthe influence of the laminar portion of the boundary layer upstream of transition.
Fig 14 also includes the predictions according to linearised theorylO. Generally themagnitude of the vector is well predicted. Although upstream of x/c =0.60 the predictionsare in better agreemeit with the measurements made with transition fixed rather than withtransition free, this should be considered fortuitous, because the theory takes no accountof wing or boundary layer thickness. Close to the hinge line the predictions are, in fact,in better agreement with the measurements made transition free. It is important to recallthat at x/c =0.30 the local Mach number is 0.96, s0 that such good agreement is reallysurprising.
As regards phase angles the theory predicts an oscillatory pressure at x/c =0.05which lags by about 500. The pressure observed lags by about 600. Similar discrepanciesin phase angle are observed right across the section and must be attributed to the higherlocal velocities caused by the wing thickness.
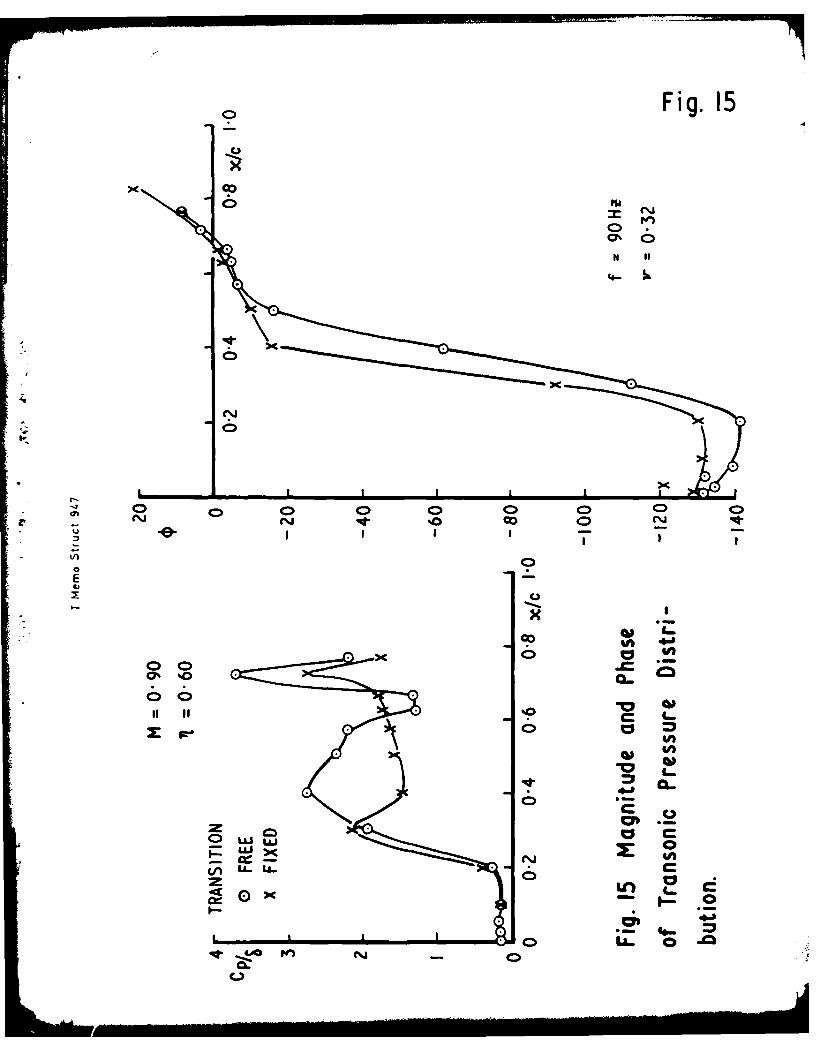
When the wing flow is transonic, the pressures produced by oscillation of the flap aredominated by the type of shock wave/boundary layer interaction (Fig 15). Thus at M 0 .90,when transition is free, we have seen that the shock wave/boundary layer interaction islaminar and extends over a long portion of the chord (say from x/c =0.3 to 0.6). Theinteraction causes large oscillatory pressures in this region in addition to the largeoscillatory pressures which would be expected in the subsonic portion of the flow fieldclose to the hinge line. In marked contrast, with fixed transition the oscillatory pres-,sures associated with the shock are somewhat smaller and concentrated about the mean shockposition at x/c =0.3. Downstream of the turbulent shock wave/boundary layer interactionthe oscillatory pressures first fall rapidly and then increase towards the hinge line. The
magnitude of this increase is quite small until the hinge line is approached, and itsIcharacter resembles that observed in the same region at M 0.8 Ccf Fig 14). The measure-ments suggest that the flap lift slope is still appreciably higher with the thin turbulentboundary layer produced by free transition. In addition we notice that there is once againa significant change in phase angle, for upstream of x/c =0.5 the transition free measure-ments lag behind those with transition fixed by about 100 to 200. This lag is in the samesense as that observed at subsonic speeds (Fig 14). This again suggests that the lag isnot primarily caused by a changed mean flow, but by a dynamic phenomenon associated withthe significant change in the boundary layer thickness. The lack of agreement of thesemeasurements made with transition fixed and free suggests that for transonic speeds transi-tion should always be fixed a safe distance upstream of the maximum forward excursion ofthe oscillatory shock wave, rather than close to the leading-edge, in an attempt to obtainaerodynamic characteristics appropriate to higher Reynolds number. Thus in Section 3.4above it was suggested that at MN 0.95, with the shock at x/c =0.5, transition should havebeen fixed at x/c =0.30, rather than at x/c = 0.05.
Boundary-layer thickness is likely to have a much greater influence en the characteris-tics of a trailing-edge flap on a thick supercritical wing, particularly when this operatesclose to separation. Hence, when testing supercritical wings with oscillating trailing-
rnedge flaps, some boundary layer thickness variation should always be included ss an aid tothe assessment of full scale performance.
4 FUTURE RESEARCH
The results already obtained on this model are judged to be of sufficient interest tojustify a further investigation, particularly of the effects of' changes in the boundarylayer.
8
One ahortcoming of the present tests is that the pressures were not measured closeenough to the trailing edge (eg Figs 9 and 14). Hence the aluminium alloy flap has nowbeen rplno'-'d with i stiffer flap (Fig 16) made in carbon fibre with 12 instead of 6pressure orifices. This flap will be driven electromagnetically at higher frequenciesand at larger amplitudes. (From about 200 at 25 Hz to 10 at 200 Hz). The flap amplitudewill be more precisely determined with a new type of fibre-optic instrument mounted onthe drive shaftl
7; this instrument has no significant errors up to frequencies az high as
500 Hz.
Although the results for the tests of superposition are, of course, only establishedfor attached flows, they suggest a useful interim practical application of active controltechnology to reduce the model response to unsteadiness in the tunnel flow. The model isflexible and responds strongly at the fundamental wing bending frequency (about 60 Hz).During the next series of tests the pressures induced by small amplitude flap oscillationsat this frequency will be measured, the corresponding phases and amplitudes of all the wingaccelerometers will be noted. These "open loop" measurements will then be used to formu-late a suitable "closed loop" control law relating one of the accelerometer responses toan appropriate flap movement to reduce the wing responses and thus extend the fatigue lifeof the model. Ultimately we intend to extend our measurements of flap effectiveness toconditions of fully separated flow when there is significant buffeting.
5 CONCLUDING REMARKS
On this 9% thick symmetric wing the boundary layer has a large effect on the pressuresgenerated by the oscillating trailing-edge flap, even at zero lift. With the thin turbu-
4 lent boundary layer at the hinge line allowed by natural transition the flap producesappreciably higher forces at subsonic speeds, as was confirmed by the quasi-steady measure-ments. However, the increase in phase lag with the thinner boundary layer was not expectedand has not yet been explained.
It is essential at transonic speeds to ensure a turbulent shock wave/boundary layerinteraction, even in the absence of separation. Ideally the turbulent boundary layer shouldbe as thin as possible. This may be achieved either by fixing transition just upstream ofthe shock, or by increasing the Reynolds number just until a turbulent shock wave/boundarylayer interaction is obtained with free transition.
Although the effects of the boundary layer and wing thickness are not included, thei* predictions from lifting surface theory provide fair overall agreement with the measurements
at subsonic speeds particularly at frequency parameters up to about 0.4. The authors hopethat the present measurements at transonic speeds, and those yet to be made, will serve asa challenge to theoreticians to develop adequate theories for this difficult speed range.
L-i
NOTATION
C /6 magnitude of vector of oscillatory pressure per radian flap
P deflection
Cf local skin friction coefficient
C, C, c0 local, average, and root chords
f freqeuncy (Hz)
h, h ; m8 , m ; z; , respectively hinge moment, pitching moment and lift derivativesin phase and in quadrature with flap displacement (Ref 1)
M Mach number
PO tunnel total pressure
p rms pressure fluctuations
q kinetic pressure
R unit Reynolds number
U stream velocity
x streamwise distance from local leading-edge
a angle of incidence
6 flap deflection in streamwise plane (radians, Ref 1)
6 flap deflection normal to hinge line (radians, unlessotherwise stated)
61 boundary layer displacement thickness
ni spanwise distance as a fraction of semi-span
* phase of pressure oscillation relative to flap motion (degpositive for pressure leading displacement)
frequency parameter = 2lTfc/U
Subscripts
e local external flow conditions
t transition position
.o
kL- LA ------ -
10hLEF ENCE,!'
I N C Laibourne, K C Wight, B L Welsh. Meazur,_-nirt 'A' U(t r, :;rC,,ont: or:;ciliatoryderivatives on a swept back, tapered model wing in two tr;jrt:;Qrjic tunrJelZ.R&M 3806 1976.
2 K C Wight, N C Lambourne. A control surface oscillatory de!rivativ,: rig for usewith half models in high speed wind tunnels. ARC C? 1553 1975.
5 D E Davies. Calculation of unsteady generalised airforces on a thin wingoscillating harmonically in subsonic flow. R&M 3409 1963.
4 H Tijdeman. High subsonic and transonic effects in unsteady aerodynamics.NLR TR 750790 May 1975.
5 D McOwat, B L Welsh, B Cripps. Time-dependent pressure measurements on a sweptwing with an oscillating flap at subsonic and transonic speeds.RAE TR in preparation.
6 B L Welsh, C R Pyne. A method to improve the temperature stability of semi-conductor strain gauge pressure transducers. RAE TR 77155, October 1977.
7 J M Allen. Use of the Baronti-Libby transformation and Preston1 tube calibrationsto determine skin friction from turbulent velocity profiles. NASA TNP 4853November 1968.
8 A Roberts. The spline-Neumann system: comparison of experimental results for W4with a preliminary boundary layer treatment. BAC Aero Report 34 1977.
9 M Firmin. Private Communication, December 1978.
10 W R Marchbank. Evaluation of pressure distribution on thin wings with distortedcontrol surfaces oscillating harmonically in linearised compressible subsonicflow. R&M 3783 1978.
11 D G Mabey. Boundary layer transition measurements on the AEDC 100 cone in threeRAE wind tunnels and their implications. R&M 3821 1978.
12 J F Cahill. Simulation of full scale flight aerodynamic tests in existing transonictunnels. Paper C20, AGARD CP 83-1 April 1971.
13 A B Haines. Further evidence and thoughts on scale effects at high subsonic speeds.Paper 43, AGARD CP 174 October 1975.
14 E L Van Driest. Boundary layer transition at supersonic speeds. Three-dimensionalroughness effects (spheres). Jn Aero Space Sci Vol 29, p 909, August 1962.
15 A W Moore. Scale effects on oscillatory control - surface derivatives.ARC CP 1151 1971.
16 H Tijdeman. Investigations of the transonic flow around oscillating aerofoils.NLR TR 7709OU October 1977.
17 B L Welsh. A new angular displacement transducer. RAE TR 79-026.
C
'i.
II
*0-3 Theory Fig. I
0-2x
Experiment
(a) STIFFNESS
DEIATV0.1 f = 70Hz
0-28 < r <041
0 0-6 0'8 M 1.0
00
X Experiment
x
-0-1
(b) DAMPING DERIVATIVE
Theory-0-2
Fig. I Lift Due to Oscillating Flapv Mach Number
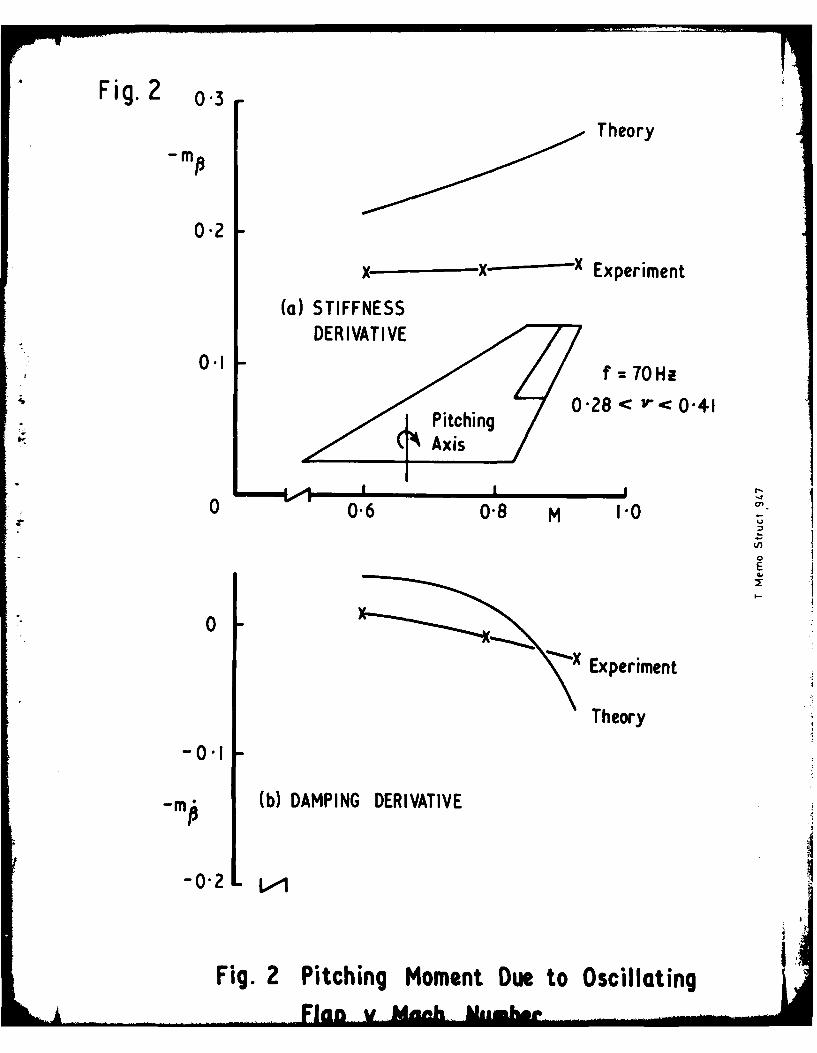
Fig. 2Theory
-rn
0-2
x x xExperiment
(a) STIFFNESSDERIVATIVE
0-1 f 7OHz
Axis
0 0-6 0-8 M 1.0 .
E
0~XExperiment
Theory
-0.I
-m (b) DAMPING DERIVATIVE
-0-2 L Le1
Fig. 2 Pitching Moment Due to Oscillating
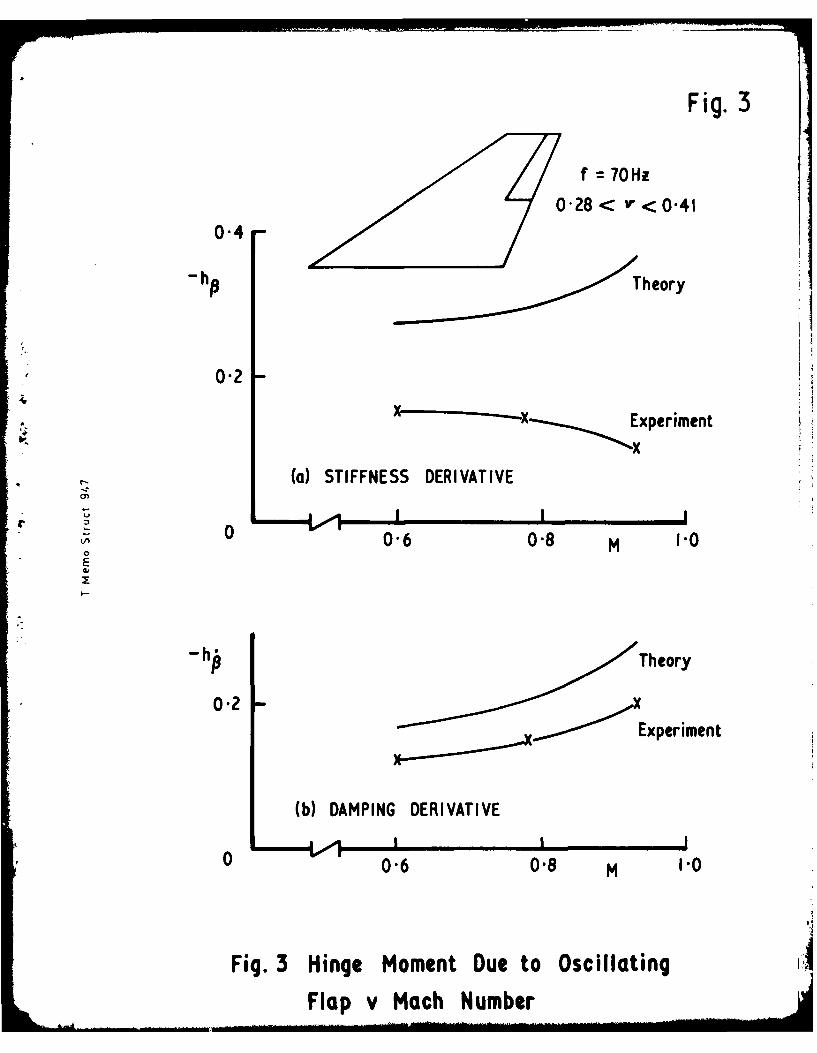
Fig. 3
f =7OHz
0-4
hP Theory
0-2
001.
0-6 0.0M
0 -2 ... Experiment
(b) DAMPING DERIVATIVE
o 0-6 0.8 M 1.0
Fig. 3 Hinge Moment Due to OscillatingFlap v Mach Number
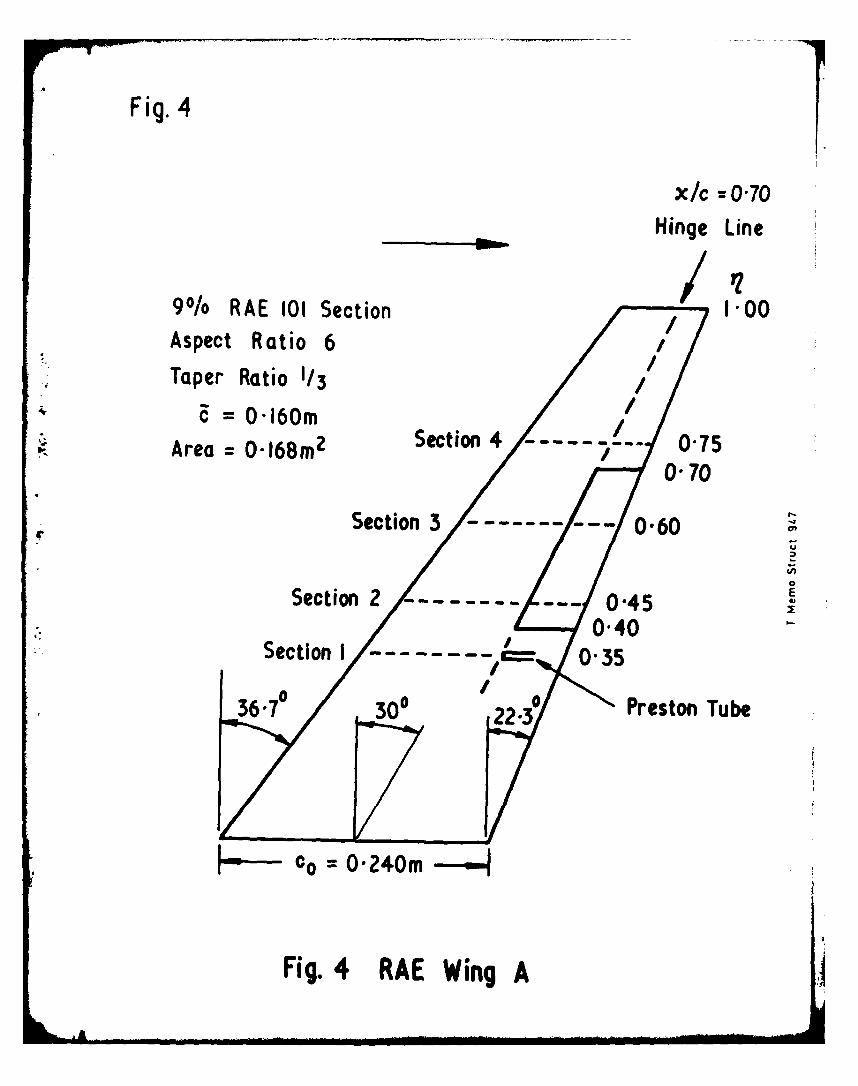
Fig. 4
x/c -070._ Hinge Line
9% RAE 101 Section I00
Aspect Ratio 6Taper Ratio 1/3
= O160m
Area = O-168m 2 Section 4 0-75
•Section 3 0.60
Section 2 -0"450 ,300-40
Section 1I-3
36.70 300 22-. Preston Tube
Co = 0240m - I
Fig. 4 RAE Wing A
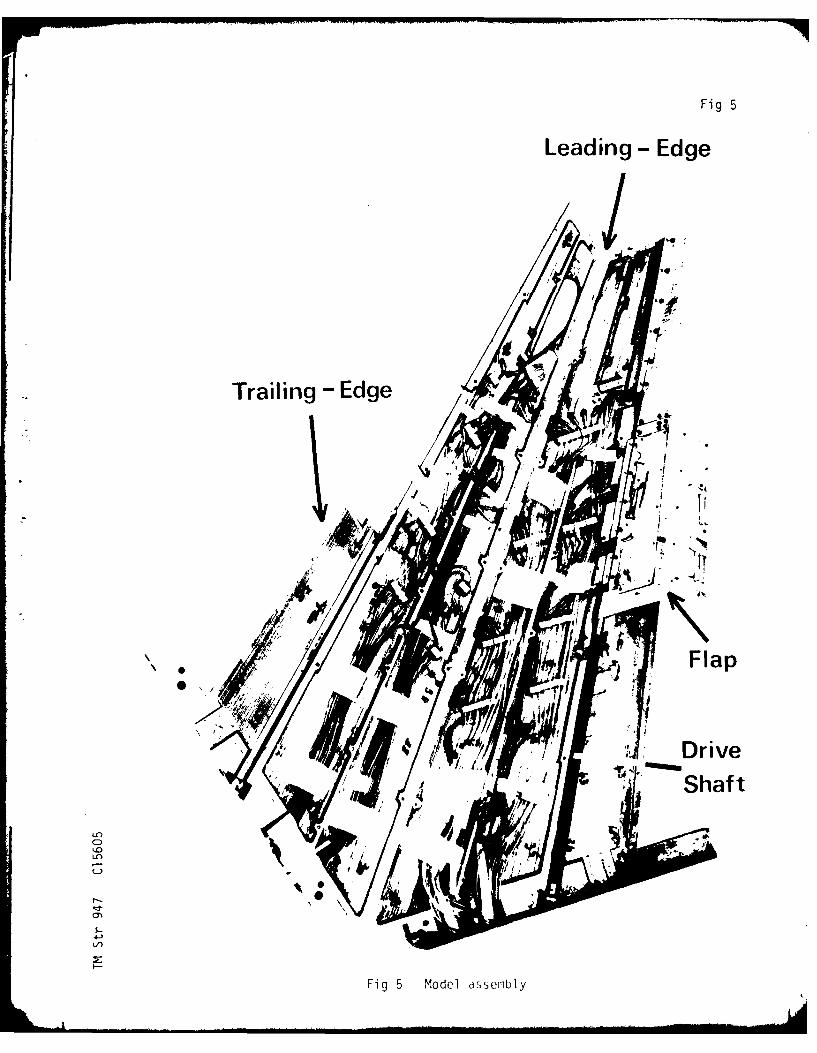
Fig 5
Leading - Edge
Trailing -Edge-
I, /,
Flap.
00
Fig 5 odel aDrivel
-- -- -- -
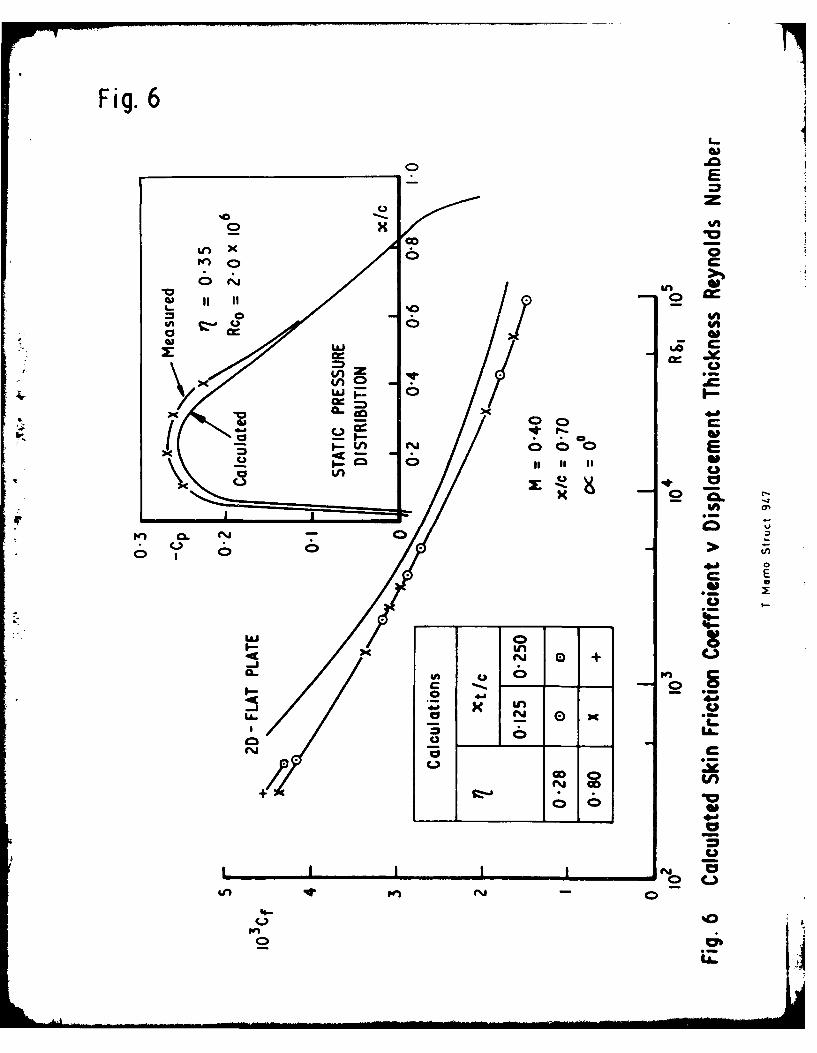
Fig. 6
0, X
,aX 6 inw 01 C
II II0
0 c
II
cr.n
I Ur
CAO
I.~'t I -t
CL C
o 0,
4.
LAJ 0CL.A
a 0 C.
LA - m
C-CC
00j
C.)Ln N -
4.n"
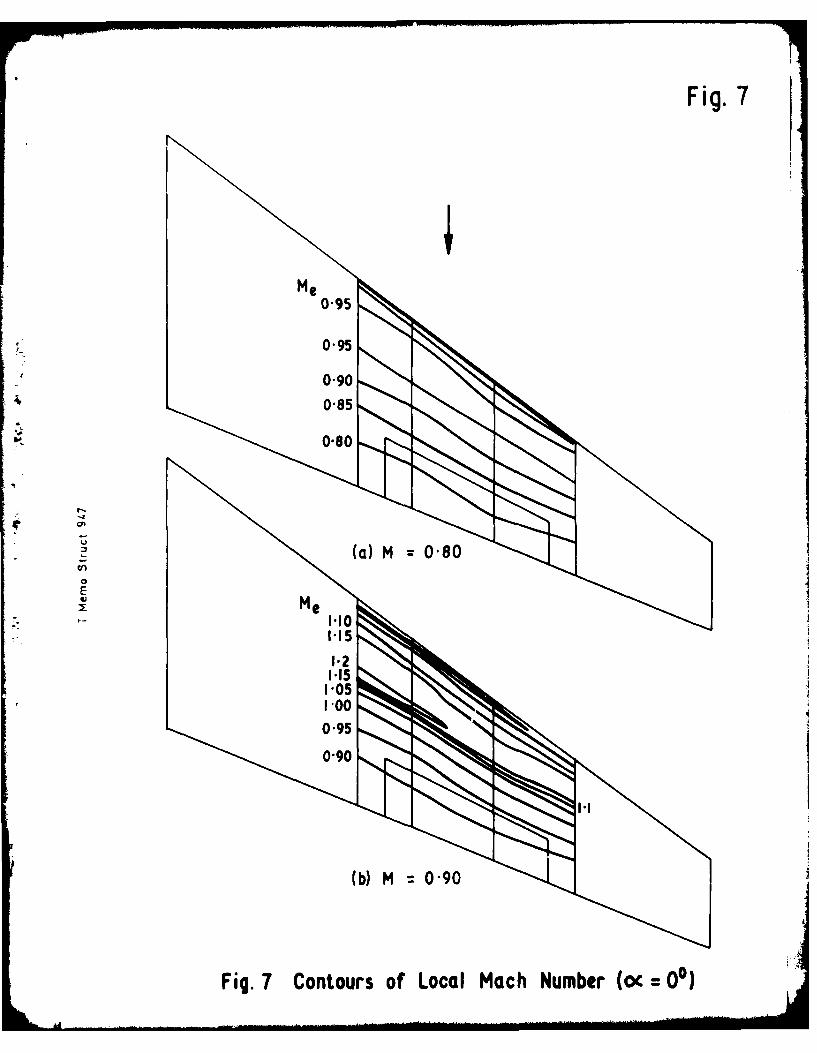
Fig. 7
Me
0.95
emeo.1
1.1
G1J
1.1
Fig. 7 Contours of Local Mach Number (mC 0'0)
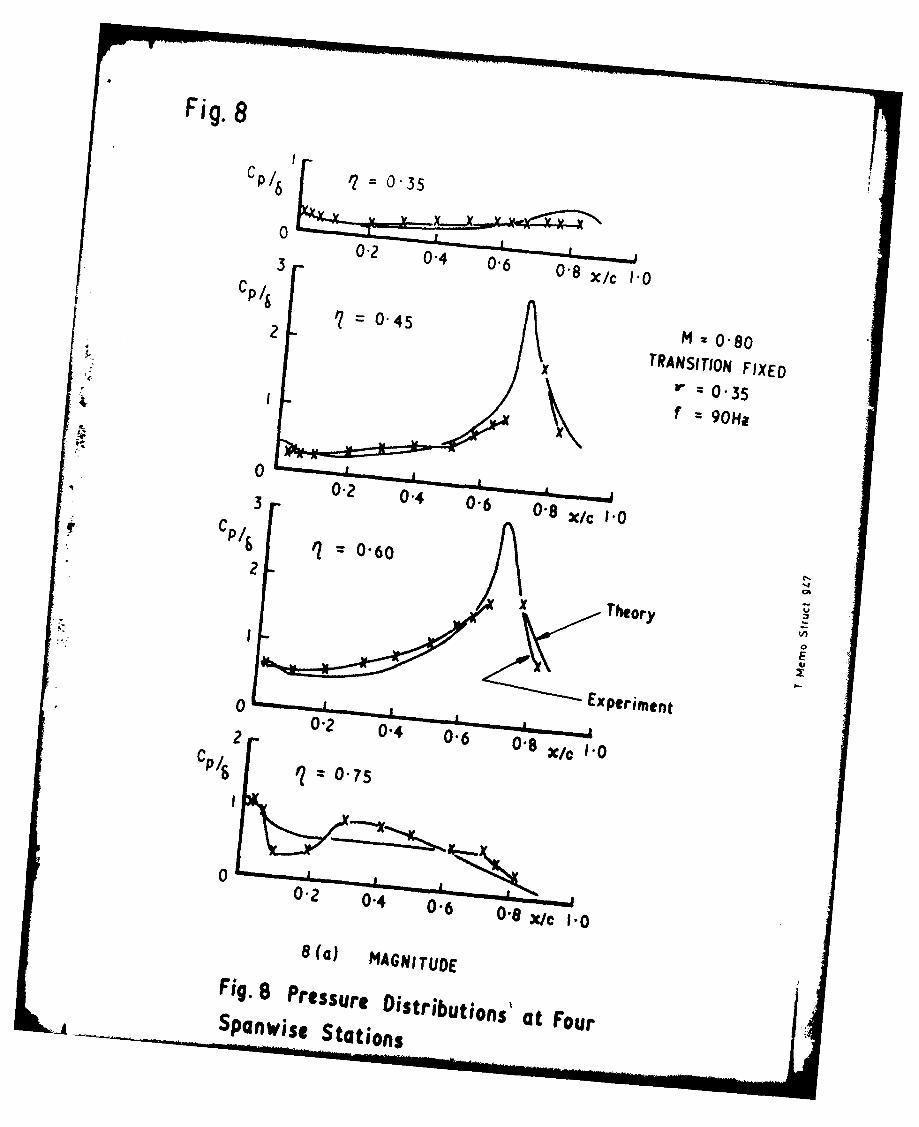
Fig. 8
cP/6 035
0
02 /6 0-6 08 X/c 1.0c/2 0- 45
M 080
TRANSITION FIXED
0
c P / 6 ' 6 0X c [
& q =000.8
0I
00
00-2 0-4 0-6 0-8 x/c 1.0
8(4) MAGNITUDE
Fig. 8 rt Distributions' at FourSpanvise stations5
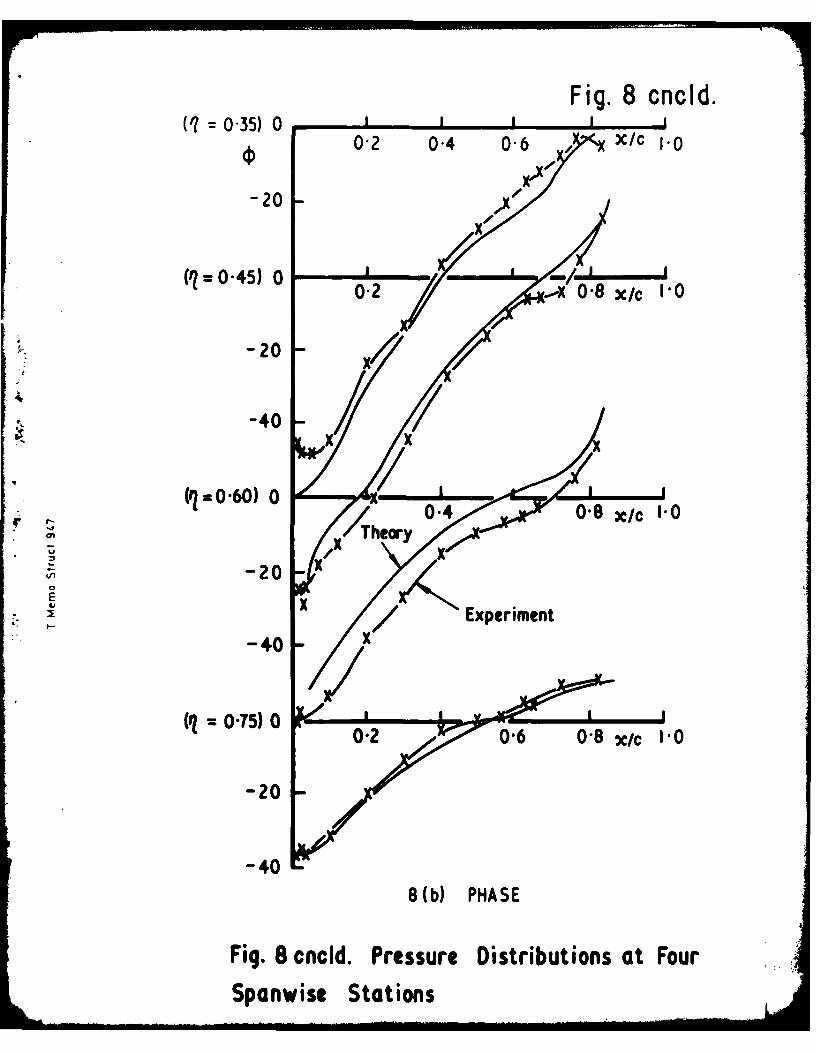
Fig. 8 cncld.(1=0-35)O0
0-2 0-4 0-6 / X/C 1.0
-20 I
(I?=0-45) 0
-20
-4
(1 0 60) 0
02
440,
(1 0-75) 0 W
-20
-408 (b) PHA SE
Fig. 8 cncld. Pressure Distributions at FourSpanwise Stations
M = 0-65C p/s = 060
2.0 TRANSITION FIXED
1 -0
THEORY
0 0.2 0-4 0-6 0.8 x/C 1.0
00.2 0-4 0-6 0.8 xlc 1-0
-20
f= 90Hz r 0-42-40* 6 2
x 6 0.50
-60
Fig. 9 Effect of Varying Amplitude
3-0 Fig. 10Cp/ TRANSITION
& - FIXED
2-0=O045
1.0
THEORY
0 0"2 04 0.6 0. 8OX/C 1.0
0. 04 _, 02 04 0O"0 x/c I0
-20
-40
-60 DRIVE f(Ha) 6 f -131Ha
SINGLE 131 10 v - 0"62-80 131 1 0¢DOUBLE 90 1 0°
-100 .
10(a) SUBSONIC M = 065
Fig. 10 Superposition of Two Frequencies
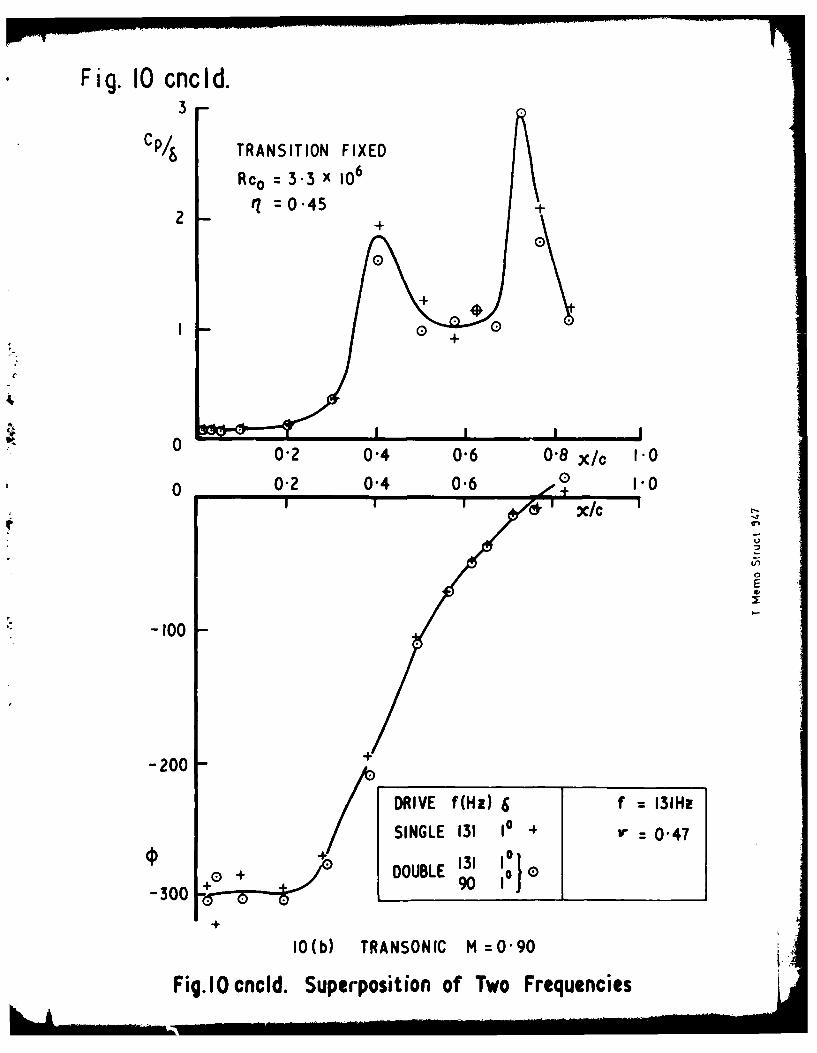
Fig. 10 cncld.3 -
Cp/& TRANSITION FIXED
Rco = 3.3 x 10⁶
2q =045 +
00
+
0+
400'2 0"4 0"6 0'8 x/c 1.0
o 02 0"4 0.6 ,00
E
-100
-200 2
DRIVE f(Hz) 6 f - 131Hz
SINGLE 131 1* r4 0"47.D131 1 }
+ DOUBLE 90 1 0-300
10(b) TRANSONIC M =0'90
Fig.lOcncld. Superposition of Two Frequencies
TRANSITION PEAKS-*. Fig. I3
024 00-47 +
HINGE LINE(a) M O"80
0 0.2 0-4 0-6 08 X/c 10
TRANSITIONFREE
6-PEAKS Pt(bor)
Pla, LAMINAR -;4 0S(%/) -INTERACTIONS 024 05l 047 +50'95 A
PEAK 0152 04E TURBULENT
INTERACTION
3
2 I
IIIHINGE LINE
(b) M 090
00 02 04 06 0.8 xlc 10
RMS PRESSURE FLUCTUATIONS v CHOROWISE STATION(FLAP - UNDRIVEN)
Fig. II Transition Determination at q 060 (c 0
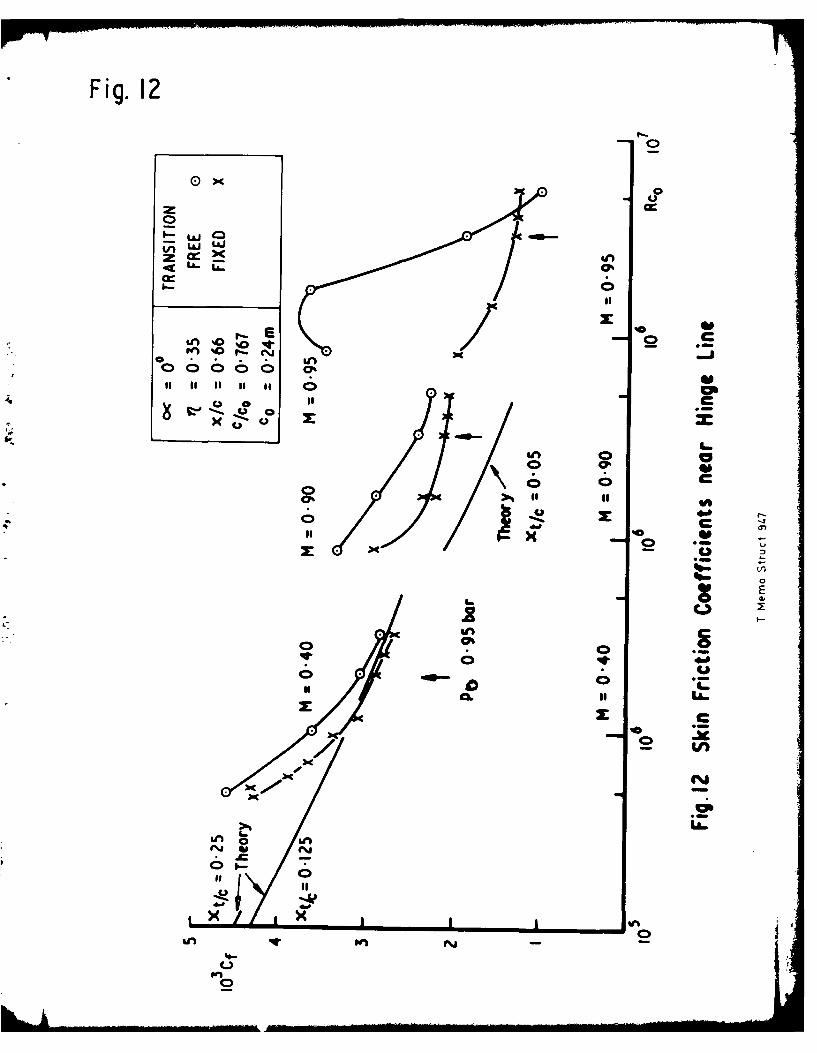
Fig. 12
00
z U
o =
~ CP
CL If
0'
Au.m
xI " I ICI
in fSn
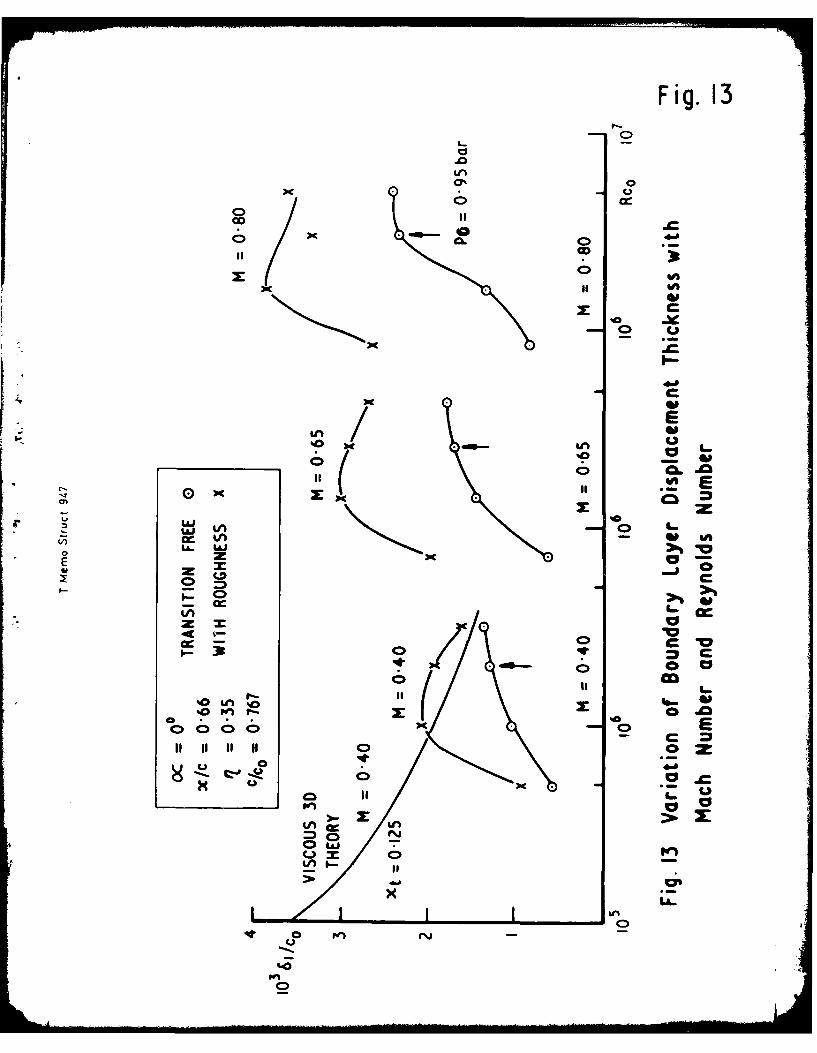
Fig. 13
Ln
0%0C>C.
coo
%00
u 40
2 U2
16- Cr
'0 ~ LAo
000066 0 E
kn X:.i
0 0
10PC'aC~7on w C
0~ II
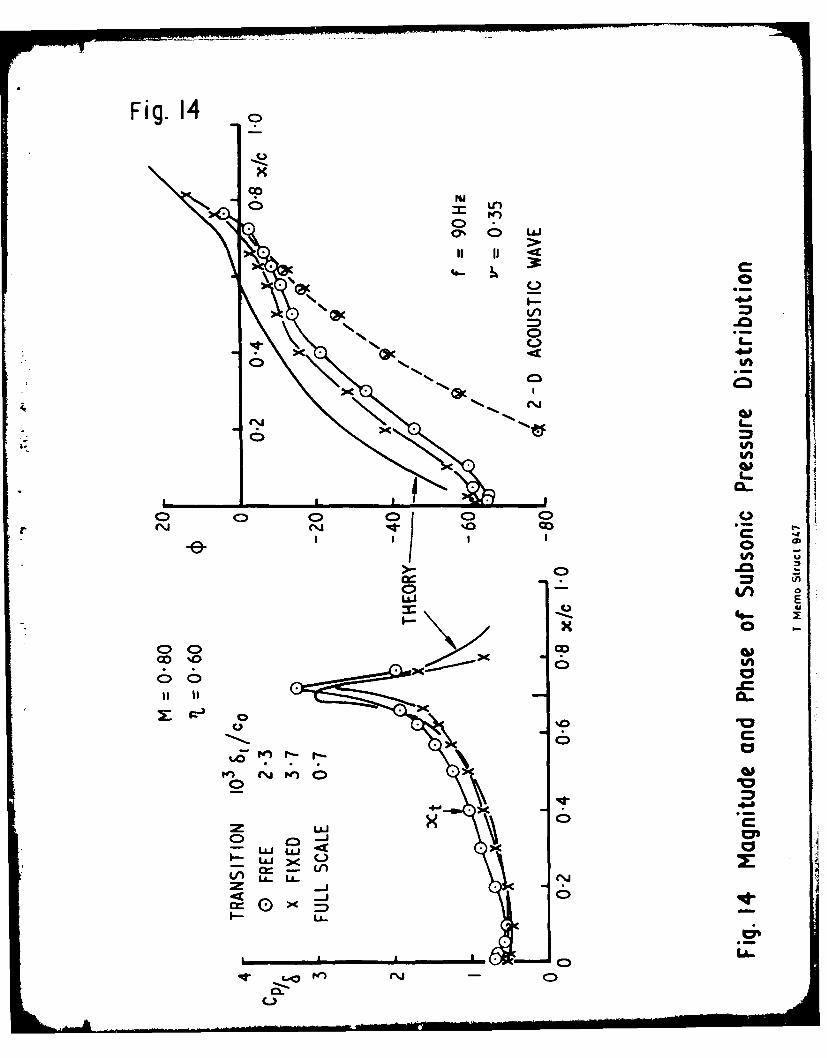
Fig. 14
oPS
08-
C)0
06-
ICI
I- C-
rJJ E~
6 6
00
C>. -.J
UI-
J--
0F Fig 15
co d
I*. II
7-0
I-.-
6 6
0IJ 0jU
U- U-
0 VIL
004-
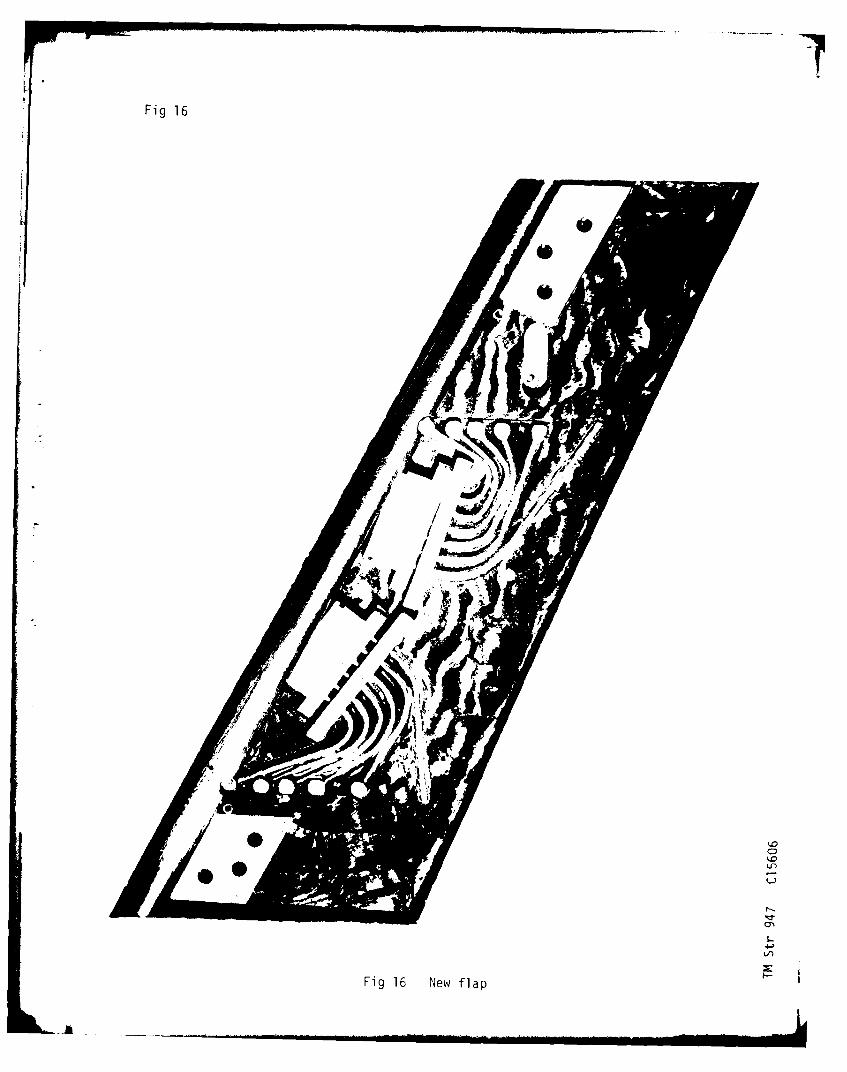
Fig 16
Fig 16 New flap
A _
UNCLASSIFIED
P t,6 AUeS033 (U FIE.LL/GhOuP 6ktw6
UNCLAS51FIEu TITLEArRODYi4AMIC CHARACTERISTICS OF MOVING TRAILING-EDGE CotNTROLS AT SUBSO
AFRSTRALT111) THIS PAPER COMPARES OSCILLATORY Pk'FSSURFS CALCULATED AND MFACUREI
ASPr.CT RATIO 6 WITH A PART-SCAN TRAILIJG-EDGF FLAP. THE FLAP WAS DRI'L AT MACH NUMtbERS FROM U9'40 TO 0.95 WITh BOTH FIXED AND FREE TRANC1TIl
10 9 mILLION, THE' MEASURED OSCILLATORY PRESSUqES DFPE'ND STRONGI Y ON'I'KGE LINE* HNCE EXTRAPOLATION FROM MODFL TO FULL SCALE RFQUIRES rREAUN GIVE THE TriINNrST TURBULENT BOUNUARY LAYER AT THF HINGE LINF. AND ClPriF5 IRANSITION SHOULD BE FIXf'D AT A SAFE DISTANCE UP.STEAM OF THE IPFSULTS APPROPRIATE TO HIGHEk REYNOLDS NUMbFR, TrSTS wITHi FLAP ORIVEIH Z) AT SURSONIC pND TRANSONIC SPEEDS PiFODUCF THE SA0ir OSCILLATOR.Y PRI
INCE THV PRINCIPLE OF SUPERPOSITION APPLIES, AT LEAST FOR SFALL AMPLIT
INUFX TFHMS AqSIGNEI
.kCDYNAMIC CHARACTERISTICS TRANSITIOI
HIGH VELOCITY SUBSONIC I"FYNOLUS NIJMBER MACH NUMBIOSC ILL AT ION PRESSURERFYNOLOS NUMbER AMPL I TUDuEACT ION SUBSONIC ISURSUNIC CHARACTERISTICS VELOCITYTRANSONIC CHARACTERISTICS VELOCITY
H1'!8ULi:NT BOUNDARY LAYER
TFRmS NOT F(lUNJD ON NLIASPECT RATIO 6 ATTACHED IbOUN[JARY-LAYER DISPLACEMENT THICKNESS FIXED TRAIFORWARt EXCURSION FULL SCALIPEAT CARE HINGE LINI
1OVING TRAILING-EuGE CONTROLS PART-cCANWtIASI-STEAOY HZ SAFF oISTiSWEPT RACK WING TRAN;SONICI HZ 131 HZ91) HZ
UNCL A SSI F IED
UNCLASSIFIED 86
|L|NG-EDGE COPITROLS AT SUBSONIC AND TRANSONIC SPFESo
SURFS CALCULATED AND MFARURE) AT HIGH SUBSONIC SPEEDS FOR A SWEPT BACK WING OF
'EDGE FLAP* THE FLAP WAS DRIVEN AT FREWUENCIES OF 1 HZ (QUASI-STEADY) AND 90 H
BOTH FIXED AND FREE TRANSITION OVER A RANGE OF REYNOLDS NUMBERS FROM L MILLIONRESSURES DFPEND STRONGl Y ON THE BOUNDARY-LAYER UISPLACEMENT THICKNESS AT ThE HTO FULL SCALE RFQUIRES GREAT CARE. IN SUBSONIC FLOW, TESTS WITH FREE TKANSITI
AYER AT THF HINGF LINE AND COME NEAREST TO FULL SCALE, HOWEVER, AT TRANSONIC S
a DISTANCE UP.STREAM OF THE MOST FORWARD EXCURSION OF THE SHOCK WA¥j TO OBTAINVNBFR. TFSTS WITH FLAP DRIVEN SIMULTANEOUSLY AT TwO FREWUENCIES (9u HZ AN' 131PUCF THE SAir OSCILLATORY PRESSURES AT 131 HZ AS WHEN DRIVEN INiEPLNUENTLYo HE
, AT LEAST FOR SMALL AMPLITUDE MOTIONS WITH ATTACHED FLOWS* (AUTHOR)
INDFX TFRMS AqSIGNED
THANSITIUNS
SUBSONIC FLIGHT
MACH NUMBER
PRESSURE
AMPLITUUESUB5ONIC FLOW
VELOCITY
VELOCITY
TFRMS NOT FOUND ON NLDB
ATTACHED FLOWSFIXFD TRANSITION
FULL SCALE
HINGE LINEPART-%CAN TRAILING-EDGE FLAP
SAFF DISTANCE UP-STREAM
TRANSONIC SPEEDS TRANSITION
131 HZ
UNCLASSIFTED
REPORT DOCUMENTATION PAGEOverall security classification of this page
L71LIMTTED
As far as possible this page should contain only unclassified information. If it is necessary to enter classified information, the boxabove must be marked to indicate the classification, e.g. Restricted, Confidential or Secret.
S. Sponsoefrigency' 2od OrigiSosofrne 3 Agency Cntac AuhRity) t Naecund lai ain/akn
N/A NMSrcurs NA ANIIE
94
5. (Fo oranltos Triein oreg LaOrnage CroaeAtor aeadLcto
7b. (Foorin ofeencyPps) Ttle. Place apnsaof CoeenceCnrcuhrtyaeadLcto
* paper prepared for AGARD Symposium on Aerodynamic Characteristics of Controls,
Naples,_____________________________ May________________________________ 1979______________________________ ________________________________
8. Author 1. Surname, Initials 9a. Author 2 9b. Authors 3, 4 .... 10. Date Pages Refs.
Mabey, D.G. Mc~wat, D.M. Welsh, B.L. June 1 28 117
11. Contract Number 12. Period 13. Project 14. Other Reference Nos.
N/A N/A__________
15. Distribution statement(a) Controlled by -
(b) Special limitations (if any) -
16. Descriptors (Keywords) (Descriptors marked *are selected from TEST)
Unsteady aerodynamics.
17. Abstract
This paper compares oscillatory pressures calculated and measured at high
subsonic speeds for a swept back wing of aspect ratio 6 with a part-span trailing-edge flap. The flap was driven at frequencies of 1 Hz (quasi-steady) and 90 Hz at
Mach numbers from 0.40 to 0.95 with both fixed and free transition over a range ofReynolds numbers from 1o6 to 4 x 10⁶.
The measured oscillatory pressures depend strongly on the boundary layer dis-placement thickness at the hinge line. Hence extrapolation from model to full scale
requires great care. In subsonic flow, tests with free transition give the thinnest
turbulent boundary layer at the hinge line and come nearest to full scale. However,
at transonic speeds transition should be fixed at a safe distance upstream of themost forward excursion of the shock wave to obtain results appropriate to higher
Reynolds number.
Tests with flap driven simultaneously at two frequencies (90 Hz and 131 Hz) at
-subsonic and transonic speeds produce the same oscillatory pressures at 131 Hz as
2when driven independently. Hence the principle of superposition applies, at leastSfor small amplitude motions with attached flows.