farmland rental rate briefing ag lender day lamberton august 12 th, 2014 david bau extension...
TRANSCRIPT

Farmland Rental Rate Briefing
Ag Lender DayLamberton
August 12th, 2014
David BauExtension Educator
Agricultural Business ManagementUniversity of Minnesota Extension
Copyright © 2013. University of Minnesota. All Rights Reserved.

TODAY’S AGENDA:• Corn and Soybeans 2014 Outlook• FINBIN DATA• Increasing Input costs• Minnesota Agricultural Statistic Information• Farm Land Rental Rate Trends • Land Values• Current Local Markets
Copyright © 2013. University of Minnesota. All Rights Reserved.

2014 Corn Budget
Copyright © 2013. University of Minnesota. All Rights Reserved.

Copyright @ 2012-13 University of Minnesota All Rights Reserved.
CORN BudgetSouthern MN FINBIN Data
Maximum Value
Minimum Value
Actual 2012
Average 03-2012
Project2013
Actual 2013
Project 2014
Forecast 2014
Yield per acre (bu.) 190.5 63.62 178.05 175.43 184 180 190 178Operators share of yield % 100 100 100 100 100 100 100 100Value per bu. 6.5 1.73 6.5 3.73 6.72 4.45 6.95 5Total product return per acre 1157.23 143.38 1157.23 653.98 1,210.59 749.22 1,263.95 890Miscellaneous income per acre 69.66 -1.81 25.44 16.45 23.22 110.38 20.90 10Gross return per acre 1182.77 213.04 1182.80 670.43 1233.80 859.60 1284.85 900

Copyright @ 2012-13 University of Minnesota All Rights Reserved.
Direct ExpensesMaximum
ValueMinimum
Value
Actual 2012
Average 03-2012
Project2013
Actual 2013
Project 2014
Forecast 2014
Seed 112 25.96 112 72.71 116.53 123 121.06 121
Fertilizer 184.87 32.15 184.87 104.78 192.91 188.83 200.95 160Crop chemicals 30.63 22.19 30.63 26.07 30.97 33.00 31.31 31Crop insurance 27.13 2.93 24.84 17.17 25.99 25.95 27.15 28
Drying fuel 36.57 4.28 5.5 14.21 5.36 21.79 5.21 15Fuel & oil 36.41 8.74 36.41 23.44 37.83 36.03 39.24 39Repairs 46.84 18.27 46.84 32.28 48.24 47.98 49.64 50
Custom hire 10.99 3.09 10.99 6.70 11.32 9.05 11.66 12Hired labor 3.47 0.15 1.94 1.93 2.04 4.15 2.14 2Land rent 199.88 78.76 199.88 140.32 206.25 246.47 212.63 230
Machinery & bldg leases 3.25 0.32 2.25 1.96 2.33 3.37 2.41 2Utilities 1.2 0.22 0 0.97 0.00 1.24 0.00 1Marketing 4.09 0.3 4.09 1.90 4.28 3.69 4.48 5
Operating interest 15.14 6.99 10.19 10.52 10.33 9.83 10.47 11Miscellaneous 5.88 0.96 4.21 3.25 4.38 2.53 4.55 4Total direct expenses per acre
674.66 216.2 674.66 457.22 698.79 755.44 722.92 711
Return over direct exp per acre
508.11 -33.01 508.11 213.22 535.02 104.16 561.93 189

Copyright @ 2012-13 University of Minnesota All Rights Reserved.
Overhead ExpensesMaximum
ValueMinimum
Value
Actual 2012
Average 03-2012
Project2013
Actual 2013
Project 2014
Forecast 2014
Custom Hire 3.04 1.74 0 2.32 0.04 0.07 2
Hired labor 12.94 4.74 12.94 8.16 13.26 12.71 13.57 13
Machinery & bldg leases 6.45 1.37 6.19 5.29 6.44 8.26 6.70 7
Farm insurance 8.36 2.13 8.36 5.66 8.69 9.57 9.02 9
Utilities 5.18 2.12 5.04 3.72 5.18 5.28 5.33 6
Dues & professional fees 3.4 0.42 3.37 1.93 3.55 3.75 3.72 4
Interest 8.28 4.1 7.47 7.02 7.64 7.23 7.80 8
Mach & bldg depreciation 51.66 18.05 51.66 34.40 52.62 61.03 53.57 54Miscellaneous 9.09 3.91 8.95 6.38 9.13 9.61 9.31 10
Total overhead expenses per acre 103.98 43.6 103.98 73.55 106.50 117.46 109.02 113
Total dir & ovhd expenses per acre
778.63 263.91 778.63 530.77 805.28 872.90 831.92 824
Net return per acre 404.13 -81.89 404.13 139.65 428.52 -13.30 452.91 76
Lbr & mgt charge per acre 58.67 24.18 58.67 40.49 60.49 59.78 62.30 60
Net return over lbr & mgt 345.46 -107.64 345.46 108.47 367.92 -73.08 390.38 16
Government payments 51.95 -7.85 18.23 22.91 17.97 18.05 17.71 0
Net return with gov’t payments 363.69 -71.72 363.69 125.49 386.13 -55.03 408.57 16

Copyright @ 2012-13 University of Minnesota All Rights Reserved.
Cost of ProductionMaximum
ValueMinimum
Value
Actual 2012
Average 03-2012
Project2013
Actual 2013
Project 2014
Forecast 2014
Total direct expense per bu. $3.79 $1.53 $3.79 2.61 3.81 4.49 3.83 3.99
Total dir & ovhd exp per bu. $4.37 $1.83 $4.37 3.03 4.38 5.19 4.38 4.63
With labor & management $4.70 $1.83 $4.70 3.12 4.70 5.55 4.71 4.97
Total exp less govt & oth income
$4.13 $1.64 $4.13 2.92 4.18 4.78 4.22 4.91
Est. labor hours per acre 3.37 2.42 2.71 2.58 2.69 2.89 2.68 2.6

Copyright @ 2012-13 University of Minnesota All Rights Reserved.
Rents at $230 in forecast example Farmer Keeps: $60 labor charge and $16 net income $76 Total With 178 bushels of corn at $5.00 per bushel

Copyright @ 2012-13 University of Minnesota All Rights Reserved.
What if corn price is $3.25 per bushel?
Lower income by $321.50 per acre Now farmer keeps: No Labor Charge: $0 A Loss of $245.50
2014 Soybean Budget
Copyright © 2013. University of Minnesota. All Rights Reserved.

Copyright @ 2012-13 University of Minnesota All Rights Reserved.
SOYBEAN BudgetSouthern MN FINBIN Data
Maximum Values
Minimum Values
Actual2012
Average2003-2012
Project 2013
Actual2013
Project2014
Forecast 2014
Yield per acre (bu.) 53.11 20.7 49.26 46.77 50.76 47.03 52.27 48Value per bu. 13.77 5.05 13.77 8.89 14.17 12.63 14.58 11.5Total product return per acre 678.19 125.76 678.19 416.61 707.27 594.18 736.34 552Miscellaneous income per acre 58.67 2.14 14.92 16.32 13.23 19.29 11.54 15Gross return per acre 693.11 172.76 693.11 432.82 720.50 613.47 747.88 567

Copyright @ 2012-13 University of Minnesota All Rights Reserved.
Direct ExpensesMaximum
ValuesMinimum
ValuesActual2012
Average2003-2012
Project 2013
Actual2013
Project2014
Forecast 2014
Seed 56.2 13.1 56.2 37.20 58.47 59.99 60.74 57
Fertilizer 25.29 1.34 25.29 9.17 26.55 23.46 27.81 25Crop chemicals 32.91 17.36 30.65 24.73 31.16 34.71 31.66 31Crop insurance 28.96 4.84 22.37 17.40 23.29 23.29 24.22 22
Fuel & oil 23.75 6.76 23.18 16.94 24.00 22.60 24.82 24Repairs 30.99 14.21 30.99 23.60 31.80 31.11 32.62 32Custom hire 7.61 2.33 7.61 4.80 7.86 6.67 8.10 8
Hired labor 2.36 0.21 1.59 0.89 1.67 2.84 1.76 2Land rent 191.52 77.86 191.52 137.72 197.50 231.57 203.48 230Machinery & bldg leases 2.39 0.35 1.54 1.52 1.57 2.94 1.61 2
Marketing 1.9 0.27 1.46 1.25 1.52 2.56 1.59 2Operating interest 10.8 5.49 6.04 7.55 6.04 5.73 6.05 7Miscellaneous 4.72 0.8 2.52 2.46 2.60 2.35 2.68 3
Total direct expenses per acre
401.97 152.44 401.97 285.38 415.10 451.38 428.24 445
Return over direct exp per acre
291.14 20.32 291.14 147.44 305.39 162.09 319.65 122
Copyright @ 2012-13 University of Minnesota All Rights Reserved.
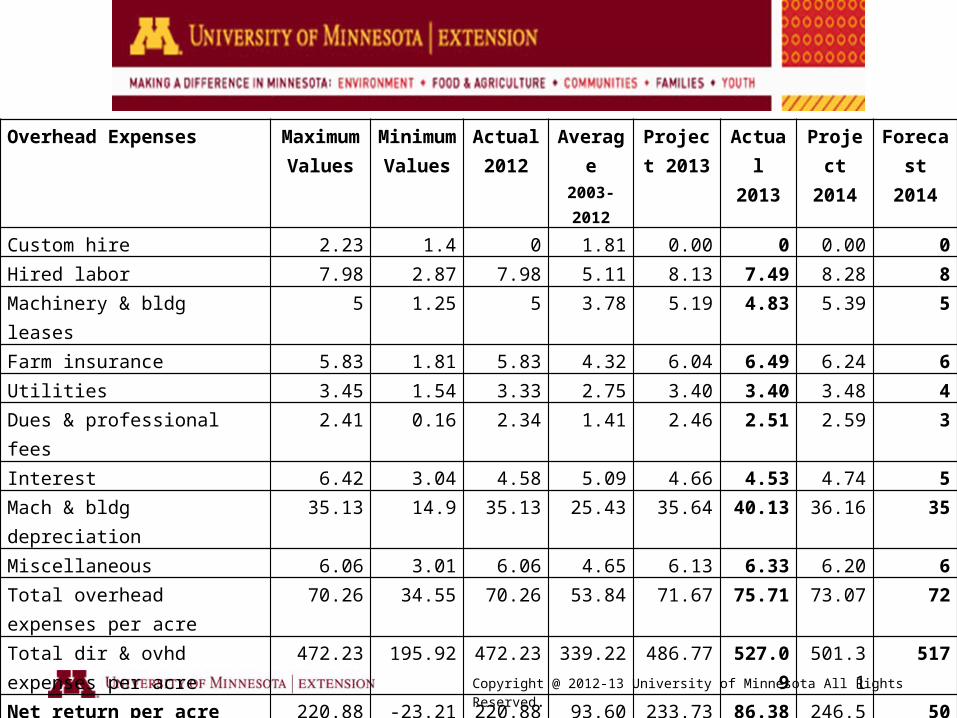
Overhead Expenses Maximum Values
Minimum Values
Actual2012
Average2003-2012
Project 2013
Actual2013
Project2014
Forecast 2014
Custom hire 2.23 1.4 0 1.81 0.00 0 0.00 0
Hired labor 7.98 2.87 7.98 5.11 8.13 7.49 8.28 8
Machinery & bldg leases 5 1.25 5 3.78 5.19 4.83 5.39 5
Farm insurance 5.83 1.81 5.83 4.32 6.04 6.49 6.24 6
Utilities 3.45 1.54 3.33 2.75 3.40 3.40 3.48 4
Dues & professional fees 2.41 0.16 2.34 1.41 2.46 2.51 2.59 3
Interest 6.42 3.04 4.58 5.09 4.66 4.53 4.74 5
Mach & bldg depreciation 35.13 14.9 35.13 25.43 35.64 40.13 36.16 35Miscellaneous 6.06 3.01 6.06 4.65 6.13 6.33 6.20 6
Total overhead expenses per acre 70.26 34.55 70.26 53.84 71.67 75.71 73.07 72
Total dir & ovhd expenses per acre
472.23 195.92 472.23 339.22 486.77 527.09 501.31 517
Net return per acre 220.88 -23.21 220.88 93.60 233.73 86.38 246.57 50
Lbr & mgt charge per acre 41.14 19.79 41.14 30.75 42.05 39.44 42.96 45
Net return over lbr & mgt 179.74 -47.04 179.74 69.32 191.68 46.94 203.61 5
Government payments 42.16 0 17.18 21.40 18.08 16.94 18.99 0
Net return with gov’t payments 196.92 -47.04 196.92 85.80 209.76 63.88 222.60 5

Copyright @ 2012-13 University of Minnesota All Rights Reserved.
Cost of ProductionMaximum
ValueMinimum
Value Actual
2012Average 03-2012
Project2013
Actual 2013
Project 2014
Forecast 2014
Total direct expense per bu. 8.64 3.5 8.16 6.15 8.20 9.60 8.24 9.27
Total dir & ovhd exp per bu. 10.28 4.25 9.59 7.31 9.59 11.21 9.60 10.77
With labor & management 11.14 4.68 10.42 7.97 10.41 12.04 10.40 11.71
Total exp less govt & oth income
9.97 4.45 9.77 7.13 9.84 11.69 9.92 11.40
Est. labor hours per acre 2.68 1.8 1.80 1.93 1.76 1.84 1.71 2

Copyright @ 2012-13 University of Minnesota All Rights Reserved.
Rents at $230 in forecast example Farmer Keeps: $45 labor charge and $5 net income $50 Total With 48 bushels soybeans at $11.50 per bushel
Copyright @ 2012-13 University of Minnesota All Rights Reserved.
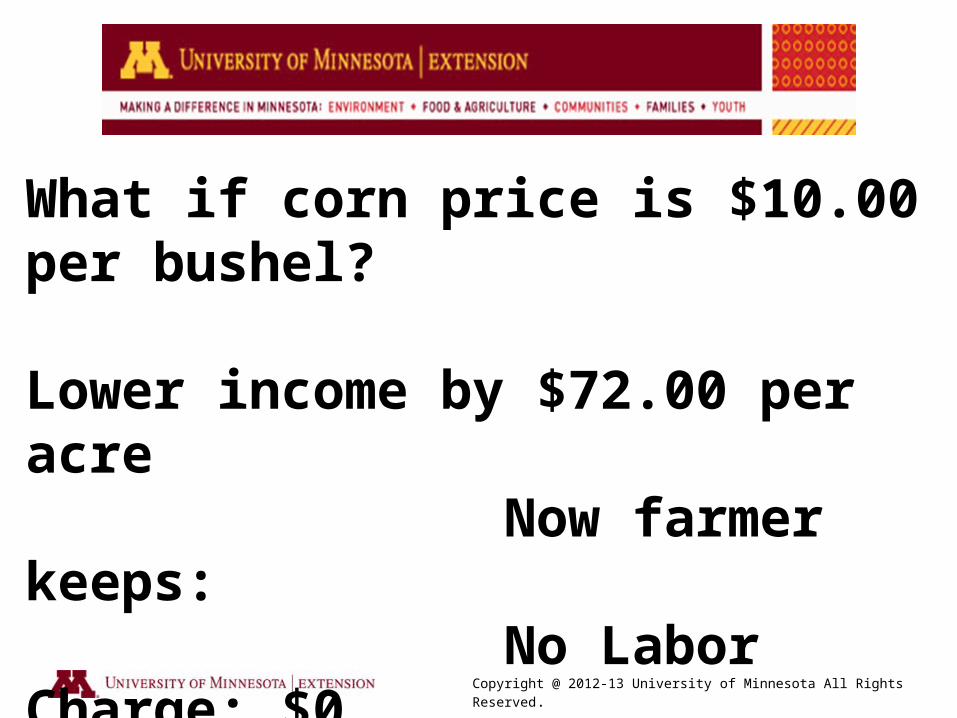
What if corn price is $10.00 per bushel?
Lower income by $72.00 per acre Now farmer keeps: No Labor Charge: $0 A Loss of $22.00

Copyright @ 2012-13 University of Minnesota All Rights Reserved.
FINBIN DATA

www.fin
bin.umn.edu

Copyright © 2013. University of Minnesota. All Rights Reserved.

Copyright © 2013. University of Minnesota. All Rights Reserved.

Increasing Input costs
Copyright © 2013. University of Minnesota. All Rights Reserved.

Copyright @ 2012-13 University of Minnesota All Rights Reserved.
Input costs for corn have been increasing at rate of 14.7% for corn since 2003.
Input costs for soybeans have increased at a rate of 10.4% per year since 2003.
Input Cost Trends

Copyright @ 2012-13 University of Minnesota All Rights Reserved.
If you would apply the 14.7% increase per year to 2012 numbers that would make 2013 total corn input cost direct and overhead expense at $893.09 per acre or $5.02 per bushel at 178 bushels per acre.
For 2014 total costs would be $1024.37 per acre or $5.75 per bushel at 178 bushels per acre.
Input Cost Trends

Copyright @ 2012-13 University of Minnesota All Rights Reserved.
If you would apply the 10.4% increase per year to 2012 numbers that would make 2013 total soybean input cost direct and overhead expense at $570.77 per acre or $11.89 per bushel at 48 bushels per acre.
For 2014 total costs would be $630.13 per acre or $13.13 per bushel at 48 bushels per acre.
Input Cost Trends

Copyright @ 2012-13 University of Minnesota All Rights Reserved.
2014 corn yields of 178 bushels per acre @ $4.50 per bushel is total income of $801 with expense at $1,024.37 per acre would be Net Farm Income of Negative $223.37 per acre.
2014 soybean yields of 48 bushels per acre @ $11.50 per bushel is $552 with expense at $630.13 per acre would be Net Farm Income of Negative $78.13.
Input Cost Trends

Copyright @ 2012-13 University of Minnesota All Rights Reserved.
SEP 2014 351'6 -7'6 359'4 358'6 359'4 351'2
DEC 2014 364'0 -7'2 371'2 370'4 371'0 363'0JUL 2015 392'2 -7'0 399'2 398'6 398'6 391'2DEC 2015 406'6 -5'6 412'4 411'2 411'6 405'4DEC 2016 420'4 0 420'4 416'0 422'0 415'2DEC 2017 421'6 -5'4 427'2 424'2 424'2 421'6
Month Last ChangePriorSettle
Open High Low
August 8, 2014

Copyright @ 2012-13 University of Minnesota All Rights Reserved.
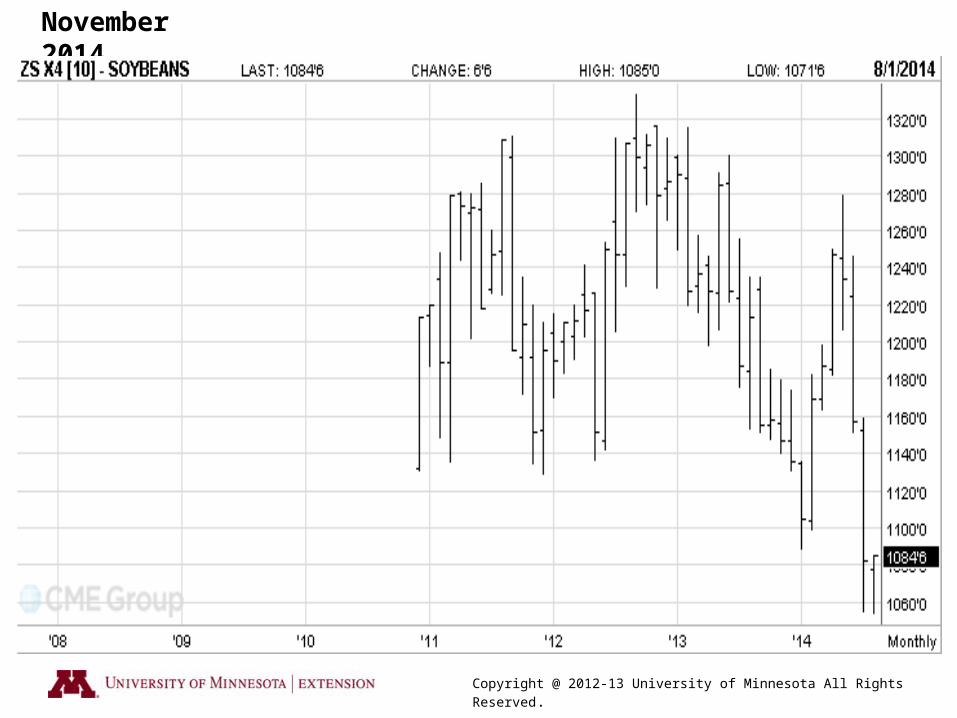
Month Last ChangePriorSettle
Open High Low
SEP 2014 1113'4 +14'2 1099'2 1097'4 1114'4 1097'4NOV 2014 1084'6 +6'6 1078'0 1076'6 1085'0 1071'6JUL 2015 1112'0 a +5'2 1106'6 1105'0 1113'4 1101'0 aNOV 2015 1084'0
a +0'4 1083'4 1083'0 1086'6 1075'2NOV 2016 1062'0 -3'4 1065'4 1067'4 1068'4 1060'0NOV 2017 - - 1056'0 - - -
August 8, 2014

Corn Cash Rental PaymentAfter $664 per acre expenses including $70 labor charge
($824-$230 +$70= $664)
Copyright © 2011-12. University of Minnesota. All Rights Reserved.
Cash Price 130 145 160 175 190 205$ 3.50 $-209 $-157 $-104 $-52 $1 $54$ 4.00 $-144 $-84 $-24 $36 $96 $156$ 4.50 $-79 $-12 $56 $124 $191 $259$ 5.00 $-14 $61 $136 $211 $286 $361$ 5.50 $51 $134 $216 $299 $381 $464$ 6.00 $116 $206 $296 $386 $476 $566$ 6.50 $181 $279 $376 $474 $571 $669$ 7.00 $246 $351 $456 $561 $666 $771
Yield Per Acre

Copyright @ 2012-13 University of Minnesota All Rights Reserved.
Minnesota Agricultural Statistic Rental Information

Copyright @ 2012-13 University of Minnesota All Rights Reserved.
County 2013 2012 2011 2010 2009 2013 2012 2011 2010Cottonwood 224 204 160 146 137 NA NA NA 35Jackson 222 178 155 155 146 NA 37 NA NALincoln 168 149 141 132 116 48 50 NA 43Lyon 210 174 146 146 132 52.5 NA 30.5 47.5Murray 213 205 159 158 137 53 58 34.5 49.5Nobles 212 185 170 148 141 NA NA NA 50.5Pipestone 191 156 140 136 137 46 48 42 41.5Redwood 222 184 178 156 144 NA NA 42 NARock 226 213 182 172 161 61 51 NA NA
SOUTHWEST 212 183 159 149 139 51.5 49 47 47
Cropland Rental Rates Pasture Rental Rates
Minnesota Cropland and Pasture Rental RatesData provided by the Minnesota Agricultural Statistic Service September 2012, 2011 and 2010 and May 2009
NASS.USDA.GOV

Copyright @ 2012-13 University of Minnesota All Rights Reserved.
Cropland Rental Rates Pasture Rental Rates IrrigatedRegion 2013 2012 2011 2010 2009 2013 2012 2011 2010 2012
NORTHWEST 98 81.5 75.5 62 61 16.5 18.5 13.5 12 121NORTH CENTRAL NA NA NA 23.5 21.5 14 14 12 13 133NORTHEAST NA NA NA 10.5 4.5 10 8 5 8.1 NAWEST CENTRAL 160 128 118 108 100 31.5 28.5 22.5 27.5 177CENTRAL 189 164 151 132 119 23 15 15.5 19 214
EAST CENTRAL 72.5 60 62.5 46 44.5 15.5 12 12 13.5 NA
SOUTHWEST 212 183 159 149 139 51.5 49 47 47 NA
SOUTH CENTRAL 246 216 181 162 154 NA NA 36.5 49 NASOUTHEAST 239 192 174 160 151 36.5 30.5 34 31.5 NAMINNESOTA 177 150 135 121 113 28 34 21.5 24 200
Minnesota Cropland and Pasture Rental RatesData provided by the Minnesota Agricultural Statistic Service September 2011 and 2010 and May 2009
**Minnesota average cropland rent in 2014 $185 increased 4.5%Down from 18% previous year and 11.1% increase in 2012 Pasture average in 2014 $26 declined 7%

Copyright @ 2012-13 University of Minnesota All Rights Reserved.
Farm Land Rental Rate Trends

Copyright @ 2011-12 University of Minnesota All Rights Reserved.
Average Rents Paid Per Acre
County '02 '03 '04 '05 '06 '07 '08
' 09 ‘10 ‘11 '12 '13Est.'14
Average Cropland Rental Rates paid in Adult Farm Management FINBIN database. Calculated 2014 based on FINBIN rents increased 4.5 percent from 2013 to 2013 multiplied by 2013 rates to
estimate to determine 2014 rental rates
Southwest
Cottonwood 93 97 96 101 107 108 143 139 148 164 174 196 205
Jackson 101 103 105 109 111 119 146 145 157 167 209 219 229
Lincoln 69 74 85 86 83 107 120 152 163 167 168 165 172
Lyon 80 82 85 89 92 94 119 137 140 168 185 218 228
Murray 82 86 87 89 94 100 120 143 154 168 237 265 277
Nobles 91 93 97 102 103 117 132 140 146 168 182 207 216
Pipestone 78 74 81 91 96 105 110 121 136 150 223 219 229
Redwood 89 93 92 99 98 104 122 140 158 173 187 211 220

Copyright @ 2011-12 University of Minnesota All Rights Reserved.
-------------Average------------- ------------------------2013---------------------------- 2015
2009 2010 2011 2012 Avg Median10th
Pctile 90th
PctileNASSEst. Est.
South Central
Cottonwood 139 148 164 174 196 196 88 275 224 ____Jackson 145 157 167 209 219 220 125 289 222 ____Lincoln 152 n/a n/a 168 165 164 73 275 168 ____Lyon 137 140 168 185 218 206 125 286 210 ____Murray 143 154 168 237 265 198 97 300 213 ____Nobles 140 146 168 182 207 200 129 290 212 ____Pipestone n/a n/a n/a 223 219 209 100 301 191 ____Redwood 140 158 173 187 211 200 134 270 222 ____Rock n/a n/a n/a n/a n/a n/a n/a n/a 226 ____Martin 177 181 210 254 274 258 175 338 274 ____Watonwan 146 165 177 218 265 207 164 317 219 ____

Copyright @ 2012-13 University of Minnesota All Rights Reserved.
Average Annual Change in Land Rental Rates
2009-2013 2012-2013
Northwest 9.6% 11.2%West Central n/a n/aCentral 11.6% 12.2%East Central 4.5% 15.0%Southwest 11.8% 10.2%South Central 12.1% 10.7%Southeast 10.9% 4.4%State 11.6% 11.3%
Copyright @ 2012-13 University of Minnesota All Rights Reserved.
Land Values

Copyright @ 2011-12 University of Minnesota All Rights Reserved.
County 2012 2011 2010 2009 20085 yr ave 2012 2011 2010 2009 2008
5 yr ave
Cottonwood 156.7 165.7 180.4 183.0 170.0 171.2 43.9 43.6 46.5 47.0 43.0 44.8
Jackson 177.2 164.6 185.7 184.0 172.0 176.7 47.5 45.0 48.7 49.0 42.5 46.5
Lincoln 143.8 148.0 161.9 163.0 148.0 152.9 39.8 34.4 44.8 40.0 35.0 38.8
Lyon 152.6 150.6 168.5 174.0 159.0 160.9 42.0 34.6 48.2 41.0 37.0 40.6
Murray 150.7 168.5 186.3 183.0 170.0 171.7 45.2 45.5 50.3 47.0 42.5 46.1
Nobles 155.5 176.0 179.8 180.0 173.0 172.9 46.6 45.1 50.8 47.5 41.5 46.3
Pipestone 143.6 154.2 172.4 168.0 162.0 160.0 40.5 38.3 48.8 44.0 38.0 41.9
Redwood 164.1 151.0 184.0 187.0 173.0 171.8 45.0 37.3 51.3 45.5 42.5 44.3
Rock 156.8 180.6 189.2 179.0 182.0 177.5 45.5 48.8 54.3 49.5 47.0 49.0
Southwest 157.3 162.5 179.7 179.0 169.0 169.5 44.4 41.5 49.4 46.0 41.5 44.6
Minnesota 165.0 156.0 177.0 174.0 164.0 167.2 43.0 38.5 45.0 40.0 38.0 40.9
Corn and Soybeans County Yields Yields from Minnesota Agricultural Statistic Service Annual Bulletins: 2012, 2011, 2010, 2009. Corn Soybeans

Copyright @ 2012-13 University of Minnesota All Rights Reserved.
COUNTY 2003 2004 2005 2006 2007 2008 2009 2010 2011 2012 2013
CHIPPEWA NA NA $2481 $2582 $2615 $3776 $3,932 $3,605 $3,892 $6,024 $7,288
COTTONWOOD $1625 $1854 $2439 $2853 $3005 $4423 $2,798 $3,699 $5,424 $7,807 $9,300
JACKSON $1790 $2111 $2671 $2969 $3332 $4425 $3,999 $4,100 $6,453 $5,981 $7,665
LAC QUI PARLE $1220 $1461 $1742 $1933 $2217 $2474 $3,138 $3,326 $4,052 $4,174 $5,797
LINCOLN $1223 $1172 $1509 $1624 $2401 $2343 $2,917 $2,830 $3,464 $4,253 $7,501
LYON $1676 $1878 $2012 $2303 $2207 $3912 $2,908 $3,373 $5,057 $6,284 $8,687
MARTIN $2091 $2476 $2871 $3092 $3478 $3783 $4,446 $4,634 $4,509 $8,359 $9,401
MURRAY $1672 $2039 $2183 $2286 $2500 $3523 $3,700 $3,919 $3,859 $5,678 $8,452
NOBLES $1928 $2238 $2411 $2882 $3393 $4126 $3,939 $5,037 $4,850 $6,109 $8,602
PIPESTONE $1334 $1851 $1880 $2127 $2409 $3386 $3,680 $3,511 $4,433 $5,615 $9,400
REDWOOD NA NA $2705 $2743 $2880 $3759 $4,158 $4,259 $5,445 $7,479 $8,263
ROCK $1926 $2139 $2369 $2992 $3912 $5052 $5,221 $4,783 No Sales $7,839 $11,074
WATONWAN $1842 $2193 $2337 $3112 $3103 $3642 $4,000 $4,107 $4,983 $6,349 $8,964
YELLOW MED. NA NA $2055 $2537 $2429 $3203 $3,425 $3,595 $4,515 $5,481 $8,125
AVERAGE $1666 $1947 $2262 $2574 $2849 $3702 $3,733 $3,913 $4,687 $6,245 $8,466
SW MINNESOTA COUNTY FARM LAND PRICES 2001-2012
Prepared by David Bau, Jim Nesseth 2002-2003 The amounts listed below are the prices paid per acre for total farmland (not tillable acres) in each listed county. The data is from farm sales recorded from January 1st through June 30th of the respective years. The data includes only bare land sales. No land and building combination sales are included. The information is from actual arms length sales reported to county authorities and collected by personnel of the University of Minnesota Extension. Sales data was not weighted for acres, each sale on a per acre basis was averaged to get the average price paid per acre. In 2005 added counties Chippewa, Lac qui Parle, Redwood and Yellow
Medicine to study.

Copyright @ 2012-13 University of Minnesota All Rights Reserved.
December 2014
Copyright @ 2012-13 University of Minnesota All Rights Reserved.
November 2014

Copyright @ 2012-13 University of Minnesota All Rights Reserved.
Forty Year Range in Cash Prices Worthington, Minnesota
SOYBEANS CORN
Year High Low Difference Year High Low Difference
2013 17.74 12.20 5.54 2013 7.45 4.05 3.402012 17.65 11.32 6.33 2012 8.22 5.80 2.422011 13.87 10.77 3.10 2011 7.49 5.55 1.942010 13.16 8.79 4.37 2010 5.77 2.94 2.832009 11.97 8.23 3.74 2009 4.11 2.78 1.332008 15.50 7.72 7.78 2008 7.00 2.91 4.092007 11.09 5.97 5.12 2007 4.15 2.81 1.342006 6.29 4.68 1.61 2006 3.40 1.66 1.742005 7.05 4.98 2.07 2005 1.94 1.43 0.512004 10.41 4.73 5.68 2004 3.03 1.61 1.42
Average 8.32 5.63 2.69 Average 3.31 2.13 1.19Prepared by: David Bau – Regional Extension Educator, Agricultural Business Management

WORTHINGTON, MN CORN PRICE PROBABILITY
A= 1988-2012 crop years 25 years
B= 1998-2012 crop years 15 years
C= 2003-2012 crop years 10 years
D= 2008-2012 crop years 5 years
Corn Percent of Time
A B C D $ 7.00 4 7 11 21 $ 6.50 7 11 16 32 $ 6.00 10 16 25 47 $ 5.50 12 20 30 54 $ 5.00 14 23 34 58 $ 4.50 16 25 37 60 $ 4.00 17 26 39 62 $ 3.50 22 33 50 76 $ 3.00 30 44 67 96
Data collected by Erlin Weness and David Bau and prepared by David Bau.

WORTHINGTON, MN SOYBEAN PRICE PROBABILITY
A B C D$15.00 2 3 4 8$14.00 5 8 12 23$13.00 9 15 23 40$12.00 12 20 30 50$11.00 15 26 38 62$10.00 18 29 44 69$9.00 23 38 57 89$8.00 27 43 65 99$7.00 35 48 72 100
A= 1988-2012 crop year 25 years
B= 1998-2012 crop years 15 years
C= 2003-2012 crop years 10 years
D= 2008-2012 crop years 5 years
Soybeans Percent of Time
Data collected by Erlin Weness and David Bau and prepared by David
Copyright @ 2012-13 University of Minnesota All Rights Reserved.
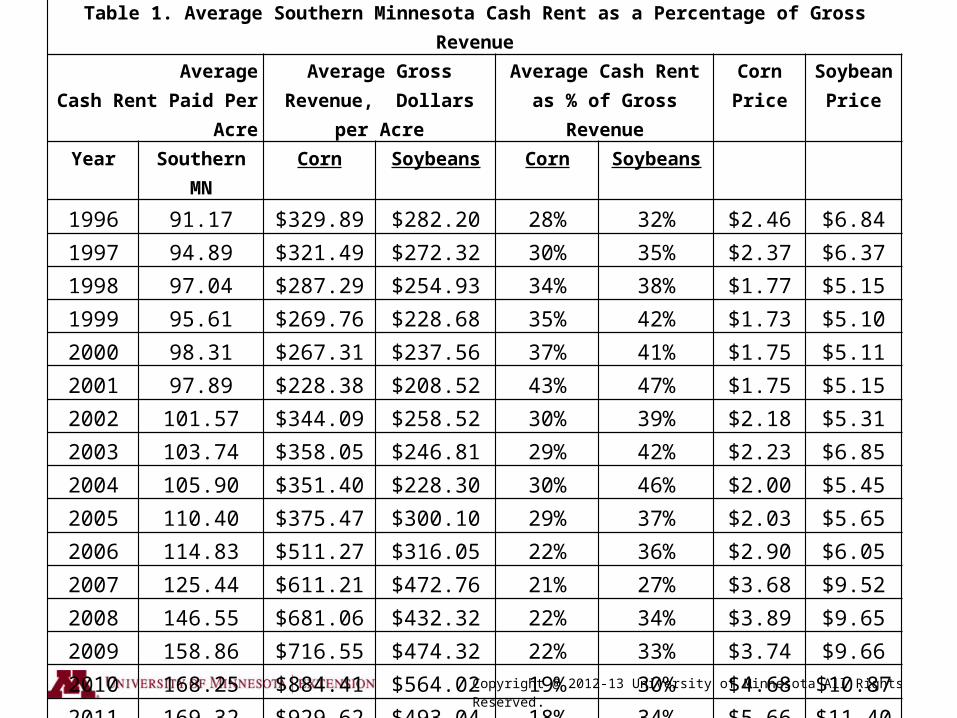
Table 1. Average Southern Minnesota Cash Rent as a Percentage of Gross Revenue Average Cash Rent
Paid Per AcreAverage Gross Revenue,
Dollars per AcreAverage Cash Rent as %
of Gross RevenueCorn Price
Soybean Price
Year Southern MN Corn Soybeans Corn Soybeans
1996 91.17 $329.89 $282.20 28% 32% $2.46 $6.841997 94.89 $321.49 $272.32 30% 35% $2.37 $6.371998 97.04 $287.29 $254.93 34% 38% $1.77 $5.151999 95.61 $269.76 $228.68 35% 42% $1.73 $5.102000 98.31 $267.31 $237.56 37% 41% $1.75 $5.112001 97.89 $228.38 $208.52 43% 47% $1.75 $5.152002 101.57 $344.09 $258.52 30% 39% $2.18 $5.312003 103.74 $358.05 $246.81 29% 42% $2.23 $6.852004 105.90 $351.40 $228.30 30% 46% $2.00 $5.452005 110.40 $375.47 $300.10 29% 37% $2.03 $5.652006 114.83 $511.27 $316.05 22% 36% $2.90 $6.052007 125.44 $611.21 $472.76 21% 27% $3.68 $9.522008 146.55 $681.06 $432.32 22% 34% $3.89 $9.652009 158.86 $716.55 $474.32 22% 33% $3.74 $9.662010 168.25 $884.41 $564.02 19% 30% $4.68 $10.872011 169.32 $929.62 $493.04 18% 34% $5.66 $11.402012 199.88 $1,182.80 $693.11 17% 29% $6.50 $13.772013 243.47 $802.56 $593.99 30% 41% $4.45 12.63
Average 27.56% 36.83%

Copyright @ 2012-13 University of Minnesota All Rights Reserved.
Calendar Year Corn Soybeans2013 $6.04 $13.992012 $6.83 $12.642011 $6.62 $12.832010 $3.84 $10.012009 $3.40 $9.892008 $4.92 $11.592007 $3.38 $7.782006 $2.15 $5.392005 $1.68 $5.802004 $2.32 $7.53
10 YR Average $4.12 $9.75
Worthington Yearly Average Cash Prices

Copyright @ 2012-13 University of Minnesota All Rights Reserved.
Questions??
http://www.extension.umn.edu/agriculture/business/
2014 Farm Resource Guide
David BauRegional Extension Educator
Agricultural Business ManagementUniversity of Minnesota Extension