farmer brothers investor presentation
TRANSCRIPT
1
FARMER BROTHERSINVESTOR PRESENTATION
MARCH 18, 2019

2
UNDERSTANDING, LEADING, BUILDING & WINNING
IN THE BUSINESS OF COFFEE
FARMER BROTHERS

3
WE ARE A COFFEE COMPANY
DESIGNED TO DELIVER THE
COFFEE PEOPLE WANT,
THE WAY THEY WANT IT.

4
We have transformed from a
100-year-old coffee company to
a growing and successful
forward-thinking industry leader,
championing coffee culture.

5
(Unaudited) FY 2015 FY 201813 Year
CAGR2
COFFEE VOLUME(In Pounds)
87,685,000 107,429,000 7.0%
NET SALES(In Millions)
$545.9 $606.5 3.6%
ADJUSTED EBITDA3,4
(In Millions)$30.9 $47.6 15.5%
NOTE
1. Includes Boyd Coffee business, acquired in October 2017.
2. Represents the compound annual growth rate over the period from June 30, 2015 to June 30, 2018.
3. Adjusted EBITDA is a non-GAAP financial measure and is unaudited; a reconciliation of this non-GAAP measure to its corresponding GAAP measure is included in the appendix.
4. Prior year financial information has been retrospectively adjusted to reflect the impact of certain changes in accounting principles and corrections to previously issued financial statements.

6
INVESTMENT HIGHLIGHTS
MARKET
OPPORTUNITY
A significant opportunity
to expand market share in
the $76B coffee industry
growing at 3-5% annually
INDUSTRY
LEADERSHIP
Purposeful leadership in
sustainability, ethical sourcing
and waste elimination creates
superior customer offerings
COMPREHENSIVE
CAPABILITIES
A business model
designed to effectively and
efficiently deliver across all
stages of the coffee
business
CAPACITY
TO GROW
Continued focus on
leveraging investment in
state-of-the-art Northlake
facility,creating significant
opportunities for customer
acquisitionand sustainable
long-termgrowth
CASH
FLOW
Balancing top-line
growth with increased
operating leverage
generates potential for
strong free cash flow
ENHANCED DSD
NETWORK
Sales channel investments
and route & branch optimization
efforts designed to drive
increased efficiencies and
ability to capture national
accounts
BOYD’S
INTEGRATION
Successfully
completed Boyd’s
integration work and
remain on track to
deliver forecasted
synergies
M&A
GROWTH
Well-positioned to pursue
growth through additional
opportunistic M&A
NOTE
Please see appendix for sources.
7
UNDERSTANDINGTHE BUSINESS OF COFFEE

8
The days of a
single-origin
pour-over
anytime,
everywhere
are here.
The days of a
cup of joe in
the morning
are over.
UNDERSTANDING
9
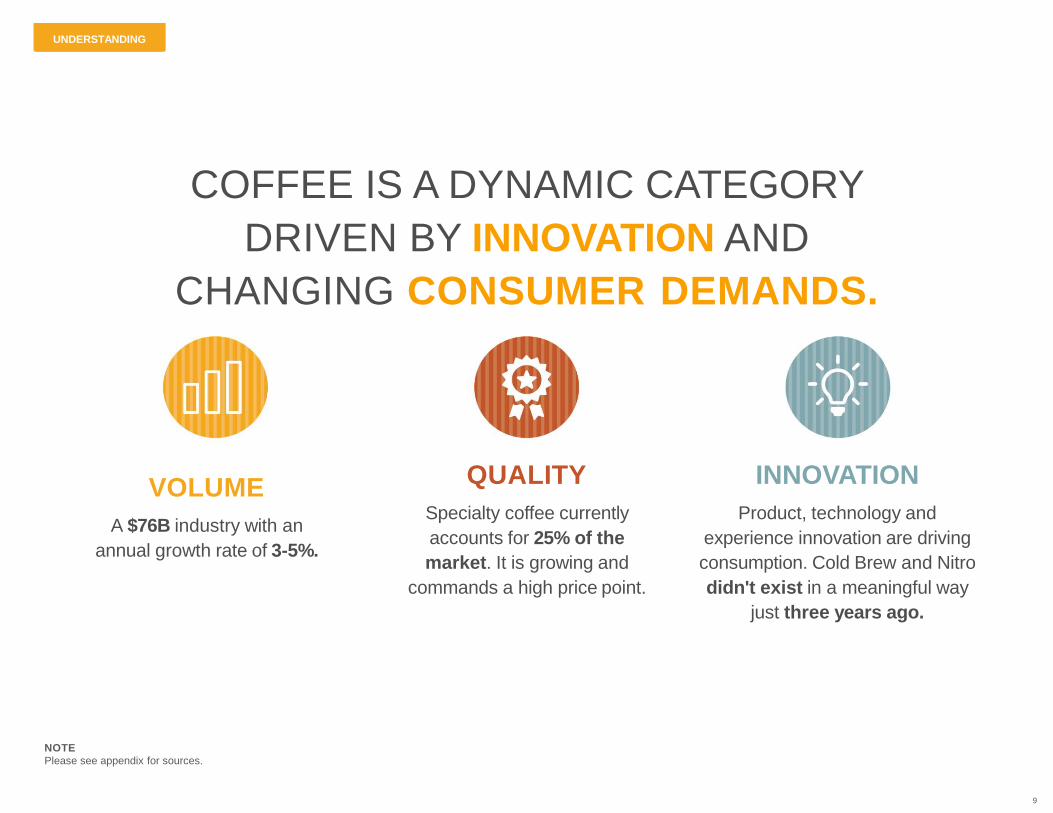
VOLUME
A $76B industry with an
annual growth rate of 3-5%.
QUALITY
Specialty coffee currently
accounts for 25% of the
market. It is growing and
commands a high price point.
INNOVATION
Product, technology and
experience innovation are driving
consumption. Cold Brew and Nitro
didn't exist in a meaningful way
just three years ago.
COFFEE IS A DYNAMIC CATEGORY
DRIVEN BY INNOVATION AND
CHANGING CONSUMER DEMANDS.
UNDERSTANDING
NOTE
Please see appendix for sources.

10
UNDERSTANDING
SourcingSustainability and origin stories are
influencing purchasing decisions.
DrinkingCoffee is now consumed across wider dayparts.
Product Innovation
Millennials and Gen Xers now prefer gourmet, specialty and espresso-based coffee and in different formats.
Sourcing100% sustainably sourced coffee will be expected.
DrinkingUnderstanding of the health benefits of coffee
continue to expand.
Product Innovation
Cold and frozen-format coffee is forecasted to grow 12.5% between 2016-2021.
TRENDS IMPORTANT
TO OUR FUTURETO US RIGHT NOW
TRENDS IMPORTANT
NOTE
Please see appendix for sources.

11
By revenue, Farmer Brothers accounts for less than 1% of the U.S. coffee market
"Significant consolidation lies ahead in the coffee industry."
- James Watson, Rabobank
MARKET SHARE
OVERVIEW
MARKET CONSOLIDATION
IS UNDERWAY
UNDERSTANDING
NOTE
Please see appendix for sources.

12
UNDERSTANDING
COFFEE ROASTERS WE COMPETE AGAINST
NOTE
Company logos not owned by Farmer Brothers.
13
LEADINGIN THE BUSINESS OF COFFEE

14
We are
experts in
coffee...
…in all facets
of coffee
LEADING

15
INDUSTRY-LEADING EXPERTISE
LEADING
Sourcing Hedging Roasting Direct Ship Turnkey Service
Sourcing in 28countries,
including sixwith direct trade
relationships, efficiently delivering
coffee across all quality levels
Industry-leading hedging
program, and advisor to large sophisticated
customers
Experienced team of more than 10 highly-skilled,
qualified roasters with operations in
three SQF-certified roasting
facilities
Trusted partnerships with recognized global
and national brands
Deep expertise as total-solution
provider, including set-up, equipment,
supplies and service

16
PURPOSEFUL LEADERSHIP
Industry
Founding member of World Coffee Research
Ethical Sourcing
Longstanding direct trade relationships and innovative
partnerships
Sustainability
Award-winning sustainability program with science-based
carbon reduction goals
Driving towards zero-waste status in roasting and distribution facilities
Eliminating Waste
LEADING

17
BUILDINGIN THE BUSINESS OF COFFEE

18
We are built
for growth...
…and prepared
for change.
BUILDING

19
Farmer Brothers' transformation
and modernization journey
Capacity
& Roasting Portfolio Customers Commerce Logistics Organization
BUILDING

20
BUILDING
CAPACITY & ROASTING
NOW
Following successful integration, produce 100% of Boyd’s SKUs in our three Farmer Brothers facilities, which have a total potential capacity of 200+ million lbs. of coffee per year1
THEN
Three facilities with limited ability to meet the changing needs of coffeeconsumers
NEXT
Continuing to ramp up production at flagship plant throughout FY 2019
NOTE
1. Additional capital could be required to grow capacity to 200+ million lbs. of coffee per year

21
PORTFOLIO
NOW
Full and focused portfolio with growth in premium and specialty categories along with a presence in select adjacent beverage categories
THEN
Primarily traditional coffee products with limited premium products
NEXT
Greater traction for premium and specialty brands and high-growth innovative segments
BUILDING

22
CUSTOMERS
NOW
Profitable legacy customers demanding premium coffee
Partnerships with sophisticated global and national brands
THEN
Customer profile heavily weighted towards offices, truck stops and restaurants demanding traditional quality coffee
NEXT
Deliver increased ROI and profitability through winning medium to large customer accounts and opportunistic M&A
BUILDING

23
COMMERCE
NOW
Optimizing DSD sales capabilities by realigning sales network to utilize channel expertise to drive sales growth nationally and increasing presence with new street sales team resources, in addition to branch and route optimization
THEN
Legacy local sales network with geographical focus and limited expertise in designing sales solutions by type of customer
NEXT
Drive sales growth through roastery direct ship1 and third-party distributors
To date, successfully consolidated 60 routes
BUILDING
NOTE
1. Direct ship to customers by third-party carrier

24
LOGISTICS
NOW
Outsourced long-haul to 3PL and implemented fleet management for a more efficient distribution network
THEN
Owned fleet of long-haul and delivery trucks moving product along the network one step at a time
NEXT
Deliver efficiency through technology
BUILDING

25
ORGANIZATION
THEN
Legacy management steeped in traditional coffee business
NEXT
Optimize M&A integration capabilities across all functional teams
Elevate roastery direct capabilities
NOW
Experienced senior leadership team
In-house sustainability and M&A expertise
Infused culture with vibrant talent resulting from move of headquarters
BUILDING

26
WINNINGIN THE BUSINESS OF COFFEE
27
We are positioned to
WIN AND GROW
WINNING

28
WINNING
1 2 3
MORE COFFEE BETTER COFFEE NEW COFFEE
Win more large, national
accounts
Expand roastery direct
and third-party
distribution delivery
channels
Maximize DSD Growth
Pursue opportunistic
M&A to deliver aligned
brands, customers and
innovation
Leverage market shift to
premium and specialty coffee
Produce highest quality coffee
at new flagship facility
Expand trend-relevant
portfolio to meet
consumer needs
(e.g., Cold Brew, Shelf-stable,
Frozen)
Consistent investment in
state-of-the art equipment
for customers to deliver
on trends

29
INVESTMENT HIGHLIGHTS
MARKET
OPPORTUNITY
A significant opportunity
to expand market share in
the $76B coffee industry
growing at 3-5% annually
INDUSTRY
LEADERSHIP
Purposeful leadership in
sustainability, ethical sourcing
and waste elimination creates
superior customer offerings
COMPREHENSIVE
CAPABILITIES
A business model
designed to effectively and
efficiently deliver across all
stages of the coffee
business
CAPACITY
TO GROW
Continued focus on
leveraging investment in
state-of-the-art Northlake
facility,creating significant
opportunities for customer
acquisitionand sustainable
long-termgrowth
CASH
FLOW
Balancing top-line
growth with increased
operating leverage
generates potential for
strong free cash flow
BOYD’S
INTEGRATION
Successfully
completed Boyd’s
integration work and
remain on track to
deliver forecasted
synergies
M&A
GROWTH
Well-positioned to pursue
growth through additional
opportunistic M&A
WINNING
ENHANCED DSD
NETWORK
Sales channel investments
and route & branch optimization
efforts designed to drive
increased efficiencies and
ability to capture national
accounts
NOTE
Please see appendix for sources.

30
RETROSPECTIVELY
ADJUSTED HISTORICAL
FINANCIAL RESULTS

31
CHANGES IN ACCOUNTING PRINCIPLES AND CORRECTIONS
TO PREVIOUSLY ISSUED FINANCIAL STATEMENTS:
ADJUSTED EBITDA1
(Unaudited)
Prior year periods have been retrospectively adjusted in our FY 2018 Form 10-K to reflect the impact of the following changes in accounting
principles and corrections to previously issued financial statements:
• Change in Method of Accounting from LIFO to FIFO - We changed our method of accounting for our coffee, tea and culinary products from
the LIFO basis to the FIFO basis.
• Change in Accounting Principle for Freight and Warehousing Costs - We implemented a change in accounting principle for freight costs
incurred to transfer goods from a distribution center to a branch warehouse and warehousing overhead costs incurred to store and ready
goods prior to their sale, from expensing such costs as incurred within selling expenses to capitalizing such costs as inventory and expensing
through cost of goods sold.
• Reclassification and Capitalization of Allied Freight, Overhead Variances and Purchase Price Variances - We made certain corrections
to our consolidated financial statements to reclassify and capitalize to inventory allied freight previously expensed as incurred in selling
expenses, and to capitalize to inventory overhead variances and purchase price variances associated with allied product lines previously
expensed as incurred in cost of goods sold.
Prior year periods in our FY 2018 Form 10-K do not reflect the retrospective application of certain new accounting principles adopted by the
Company in FY 2019.
1. Adjusted EBITDA is a non-GAAP financial measure and is unaudited; a reconciliation of this non-GAAP measure to its corresponding GAAP measure is included in the appendix.
2. Includes Boyd Coffee business acquired in October 2017.
(In thousands) FY 2015 FY 2016 FY 2017 FY 20182
Retrospectively
Adjusted$30,908 $31,017 $42,985
As
Reported$47,562
As Previously
Reported$41,268 $41,386 $45,973 NA
Difference ($10,360) ($10,369) ($2,988) NA

32
CHANGES IN ACCOUNTING PRINCIPLES AND CORRECTIONS
TO PREVIOUSLY ISSUED FINANCIAL STATEMENTS:
GROSS MARGIN(Unaudited)
• The changes in accounting principles and corrections to previously issued financial statements in our FY 2018 Form 10-K reduced
gross margin on average by 630 bps over FY 2015 to FY 2017.
• The reclassification impact for freight costs incurred to transfer goods from a distribution center to a branch warehouse and
warehousing overhead costs incurred to store and ready goods prior to their sale and the reclassification of allied freight averaged
480bps over FY 2015 to FY 2017.
• The capitalization impact for all changes and corrections in our FY 2018 Form 10-K averaged 150bps over FY 2015 to FY 2017.
GROSS MARGIN FY 2015 FY 2016 FY 2017 FY 2018
Retrospectively
Adjusted29.2% 31.4% 34.5%
As
Reported34.1%
As Previously
Reported36.1% 38.3% 39.5% NA
Difference -6.9% -6.9% -5.0% NA
Capitalization
Impact-1.9% -1.9% -0.6% NA
Reclassification
Impact-5.0% -4.9% -4.4% NA
Difference -6.9% -6.9% -5.0% NA

33
CHANGES IN ACCOUNTING PRINCIPLES AND CORRECTIONS
TO PREVIOUSLY ISSUED FINANCIAL STATEMENTS:
OPERATING EXPENSES(Unaudited)
• The change in accounting principle for freight and warehousing costs and the reclassification of allied freight costs reduced operating expenses
between $23.9M to $27.0M over FY 2015 to FY 2017, and 440bps to 500bps, and accordingly reduced gross margin for the reclassification of
these expenses as a component of inventory and cost of sales.
OPERATING
EXPENSES
(In thousands)
FY 2015 FY 2016 FY 2017 FY 2018
Retrospectively
Adjusted$166,705 $173,358 $147,700 As Reported $205,919
As Previously
Reported$193,752 $200,296 $171,569 NA
Difference ($27,047) ($26,938) ($23,869) NA
OPERATING
EXPENSE % OF
SALES
2015 2016 2017 2018
Retrospectively
Adjusted30.5% 31.8% 27.3% As Reported 33.9%
As Previously
Reported35.5% 36.8% 31.7% NA
Difference -5.0% -4.9% -4.4% NA

34
APPENDIX

35
(Unaudited)1
FY 20151
FY 20161
FY 20171
FY 2018
NET SALES(In Thousands)
$545,882 $544,382 $541,500 $606,544
GROSS MARGIN2
29.2% 31.4% 34.5% 34.1%
ADJUSTED EBITDA2,3
(In Thousands)$30,908 $31,017 $42,985 $47,562
COFFEE VOLUME (GREEN)(Pounds In Thousands)
87,685 90,669 95,499 107,429
COFFEE VOLUME GROWTH 0.8% 3.4% 5.3% 12.5%
1. Fiscal year ending June 30.
2. Prior year financial information has been retrospectively adjusted to reflect the impact of certain changes in accounting principles and corrections to previously issued financial statements.
3. Adjusted EBITDA is a non-GAAP financial measure and is unaudited; a reconciliation of this non-GAAP measure to its corresponding GAAP measure is included in the appendix.
APPENDIX
36
NOTE
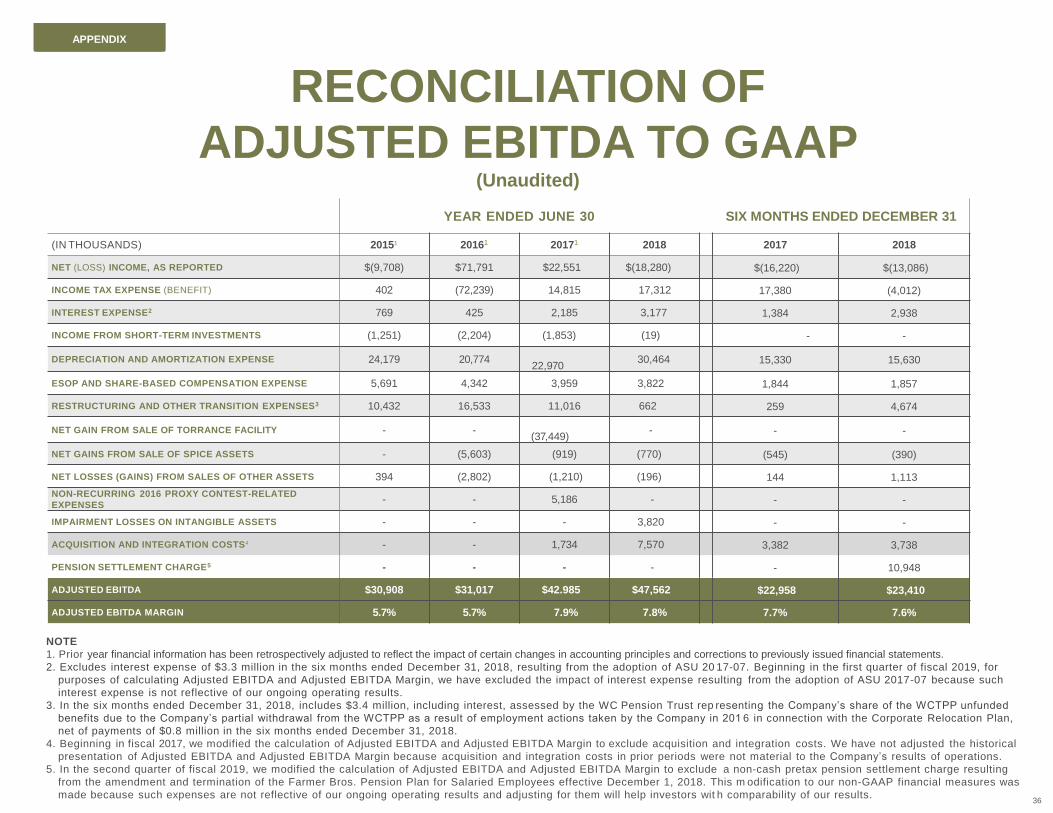
1. Prior year financial information has been retrospectively adjusted to reflect the impact of certain changes in accounting principles and corrections to previously issued financial statements.
2. Excludes interest expense of $3.3 million in the six months ended December 31, 2018, resulting from the adoption of ASU 20 17-07. Beginning in the first quarter of fiscal 2019, for
purposes of calculating Adjusted EBITDA and Adjusted EBITDA Margin, we have excluded the impact of interest expense resulting from the adoption of ASU 2017-07 because such
interest expense is not reflective of our ongoing operating results.
3. In the six months ended December 31, 2018, includes $3.4 million, including interest, assessed by the WC Pension Trust rep resenting the Company’s share of the WCTPP unfunded
benefits due to the Company’s partial withdrawal from the WCTPP as a result of employment actions taken by the Company in 201 6 in connection with the Corporate Relocation Plan,
net of payments of $0.8 million in the six months ended December 31, 2018.
4. Beginning in fiscal 2017, we modified the calculation of Adjusted EBITDA and Adjusted EBITDA Margin to exclude acquisition and integration costs. We have not adjusted the historical
presentation of Adjusted EBITDA and Adjusted EBITDA Margin because acquisition and integration costs in prior periods were not material to the Company’s results of operations.
5. In the second quarter of fiscal 2019, we modified the calculation of Adjusted EBITDA and Adjusted EBITDA Margin to exclude a non-cash pretax pension settlement charge resulting
from the amendment and termination of the Farmer Bros. Pension Plan for Salaried Employees effective December 1, 2018. This m odification to our non-GAAP financial measures was
made because such expenses are not reflective of our ongoing operating results and adjusting for them will help investors wit h comparability of our results.
APENDIX
RECONCILIATION OF
ADJUSTED EBITDA TO GAAP (Unaudited)
APPENDIX
YEAR ENDED JUNE 30 SIX MONTHS ENDED DECEMBER 31
(IN THOUSANDS) 20151 20161 20171 2018 2017 2018
NET (LOSS) INCOME, AS REPORTED $(9,708) $71,791 $22,551 $(18,280) $(16,220) $(13,086)
INCOME TAX EXPENSE (BENEFIT) 402 (72,239) 14,815 17,312 17,380 (4,012)
INTEREST EXPENSE2 769 425 2,185 3,177 1,384 2,938
INCOME FROM SHORT-TERM INVESTMENTS (1,251) (2,204) (1,853) (19) - -
DEPRECIATION AND AMORTIZATION EXPENSE 24,179 20,77422,970
30,464 15,330 15,630
ESOP AND SHARE-BASED COMPENSATION EXPENSE 5,691 4,342 3,959 3,822 1,844 1,857
RESTRUCTURING AND OTHER TRANSITION EXPENSES3 10,432 16,533 11,016 662 259 4,674
NET GAIN FROM SALE OF TORRANCE FACILITY - -(37,449)
- - -
NET GAINS FROM SALE OF SPICE ASSETS - (5,603) (919) (770) (545) (390)
NET LOSSES (GAINS) FROM SALES OF OTHER ASSETS 394 (2,802) (1,210) (196) 144 1,113
NON-RECURRING 2016 PROXY CONTEST-RELATED
EXPENSES- - 5,186 - - -
IMPAIRMENT LOSSES ON INTANGIBLE ASSETS - - - 3,820 - -
ACQUISITION AND INTEGRATION COSTS4 - - 1,734 7,570 3,382 3,738
PENSION SETTLEMENT CHARGE5 - - - - - 10,948
ADJUSTED EBITDA $30,908 $31,017 $42.985 $47,562 $22,958 $23,410
ADJUSTED EBITDA MARGIN 5.7% 5.7% 7.9% 7.8% 7.7% 7.6%
37
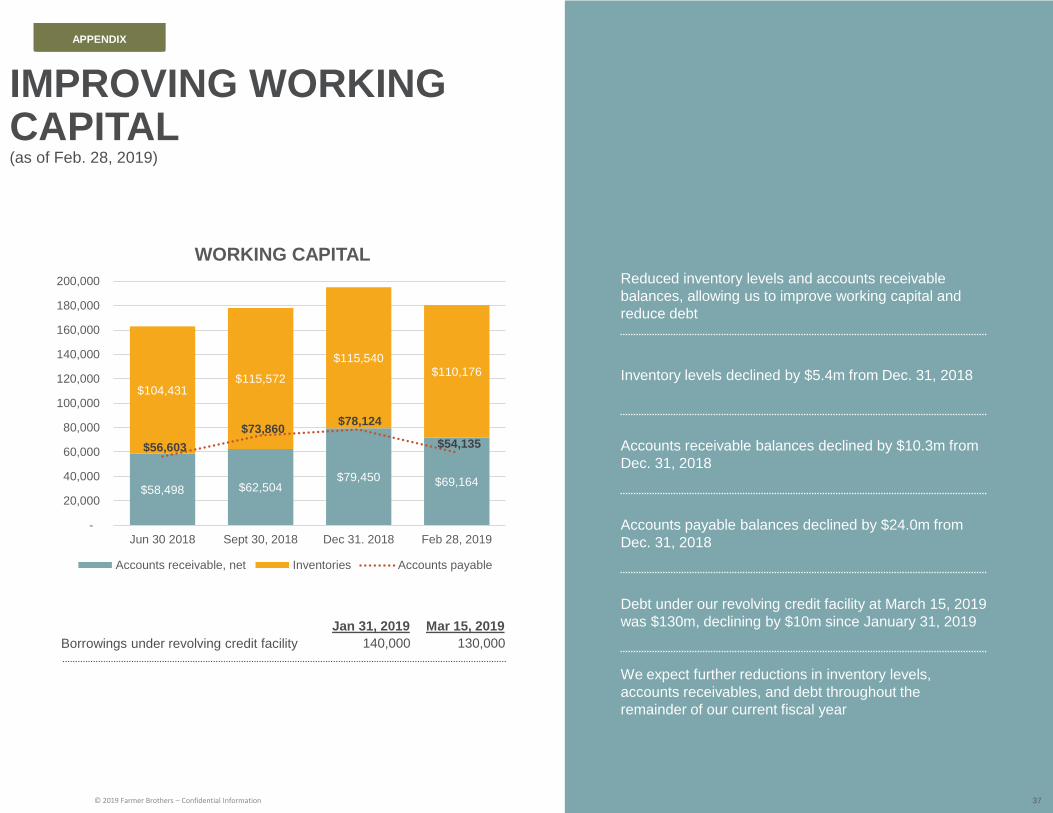
IMPROVING WORKING CAPITAL(as of Feb. 28, 2019)
© 2019 Farmer Brothers – Confidential Information
$58,498 $62,504$79,450 $69,164
$104,431$115,572
$115,540$110,176
$56,603
$73,860$78,124
$54,135
-
20,000
40,000
60,000
80,000
100,000
120,000
140,000
160,000
180,000
200,000
Jun 30 2018 Sept 30, 2018 Dec 31. 2018 Feb 28, 2019
WORKING CAPITAL
Accounts receivable, net Inventories Accounts payable
Borrowings under revolving credit facility
Jan 31, 2019
140,000
Mar 15, 2019
130,000
37
APPENDIX
Reduced inventory levels and accounts receivable
balances, allowing us to improve working capital and
reduce debt
Inventory levels declined by $5.4m from Dec. 31, 2018
Accounts receivable balances declined by $10.3m from
Dec. 31, 2018
Accounts payable balances declined by $24.0m from
Dec. 31, 2018
Debt under our revolving credit facility at March 15, 2019
was $130m, declining by $10m since January 31, 2019
We expect further reductions in inventory levels,
accounts receivables, and debt throughout the
remainder of our current fiscal year

38
FARMER BROS. CO.
CONDENSED CONSOLIDATED BALANCE SHEETS(In thousands)
(Unaudited)
As of
June 30, 2018 June 30, 20171 December 31, 2018
Assets
Current assets:
Cash and cash equivalents $ 2,438 $ 6,241 $ 13,333
Short-term investments — 368 -
Accounts and notes receivable 58,498 46,446 79,450
Inventories 104,431 79,790 115,540
Prepaid expenses 7,842 7,540 7,335
Other assets 305 318 324
Total current assets 173,514 140,703 215,982
Property, plant and equipment, net 186,589 176,066 193,626
Goodwill 36,224 10,996 36,224
Intangible assets, net 31,515 18,618 30,179
Other assets 8,381 6,837 8,703
Deferred income taxes 39,308 53,933 43,343
Total assets $ 475,531 $ 407,153 $ 528,057
LIABILITIES AND STOCKHOLDERS’ EQUITY
Current liabilities:
Accounts payable $ 56,603 $ 39,784 $ 78,124
Accrued payroll expenses 17,918 17,345 17,176
Short-term borrowings under revolving credit facility 89,787 27,621 -
Short-term obligations under capital leases 190 958 103
Short-term derivative liabilities 3,300 1,857 4,201
Other current liabilities 10,659 9,702 8,448
Total current liabilities 178,457 97,267 108,052
Accrued pension liabilities 40,380 51,281 47,593
Long-term borrowings under revolving credit facility 130,000
Accrued postretirement benefits 20,473 19,788 18,336
Accrued workers’ compensation liabilities 5,354 7,548 4,938
Other long-term liabilities 1,812 1,717 813
Total liabilities $ 246,476 $ 177,601 $ 309,732
Total stockholders’ equity $ 229,055 $ 229,552 $ 218,325
Total liabilities and stockholders’ equity $ 475,531 $ 407,153 $ 528,057
APPENDIX
1. Prior year financial information has been retrospectively adjusted to reflect the impact of certain changes in accounting principles and corrections to previously issued financial statements.

39
FARMER BROS. CO.
CONDENSED CONSOLIDATED STATEMENTS OF OPERATIONS(In thousands, except share and per share data)
(Unaudited)
Year Ended June 30,
2018 20171 20161
Net sales $ 606,544 $ 541,500 $ 544,382
Cost of goods sold 399,502 354,622 373,214
Gross profit 207,042 186,878 171,168
Selling expenses 154,539 133,329 123,260
General and administrative expenses 47,863 42,933 41,970
Restructuring and other transition expenses 662 11,016 16,533
Net gain from sale of Torrance Facility — (37,449) —
Other operating expenses 2,854 (2,129) (8,405)
Operating expenses 205,918 147,700 173,358
Income (loss) from operations 1,124 39,178 (2,190)
Total other (expense) income (2,092) (1,812) 1,742
(loss) income before taxes (968) 37,366 (448)
Income tax expense (benefit) 17,312 14,815 (72,239)
Net income (loss) $ (18,280) $ 22,551 $ 71,791
Less: Cumulative preferred dividends, undeclared and unpaid 389 - -
Net (loss) income available to common stockholders $ (18,669) $ 22,551 $ 71,791
Net (loss) income available to common stockholders per common share - Basic $ (1.11) $ 1.35 $ 4.35
Net (loss) income available to common stockholders per common share - diluted $ (1.11) $ 1.35 $ 4.32
Weighted average common shares outstanding—basic 16,815,020 16,668,745 16,502,523
Weighted average common shares outstanding—diluted 16,815,020 16,785,752 16,627,402
APPENDIX
1. Prior year financial information has been retrospectively adjusted to reflect the impact of certain changes in accounting principles and corrections to previously issued financial statements.

40
FARMER BROS. CO.
CONDENSED CONSOLIDATED STATEMENTS OF OPERATIONS (In thousands, except share and per share data)
(Unaudited)
Three Months Ended December 31, Six Months Ended December 31,
2018 20171 2018 20171
Net sales $ 159,773 $ 167,366 $ 307,213 $ 299,079
Cost of goods sold 106,529 111,089 205,734 196,719
Gross profit 53,244 56,277 101,479 102,360
Selling expenses 39,591 42,127 76,901 74,984
General and administrative expenses 12,140 14,305 20,757 25,664
Restructuring and other transition expenses 207 139 4,674 259
Other operating expenses 804 (304) 723 (401)
Operating expenses 52,742 56,267 103,055 100,506
Income (loss) from operations 502 10 (1,576) 1,854
Total other expense (13,327) (282) (15,522) (694)
(loss) income before taxes (12,825) (272) (17,098) 1,160
Income tax (benefit) expense (2,725) 16,788 (4,012) 17,380
Net loss $ (10,100) $ (17,060) $ (13,086) $ (16,220)
Less: Cumulative preferred dividends, undeclared and unpaid 134 129 266 129
Net loss available to common stockholders $ (10,234) $ (17,189) $ (13,352) $ (16,349)
Net loss available to common stockholders per common share -
Basic$ (0.60) $ (1.03) $ (0.79) $ (0.98)
Net loss available to common stockholders per common share -
diluted$ (0.60) $ (1.03) $ (0.79) $ (0.98)
Weighted average common shares outstanding—basic 16,985,157 16,723,498 16,971,995 16,711,660
Weighted average common shares outstanding—diluted 16,985,157 16,723,498 16,971,995 16,711,660
APPENDIX
1. Prior year financial information has been retrospectively adjusted to reflect the impact of certain changes in accounting principles and corrections to previously issued financial statements.

41
FARMER BROS. CO.
CONDENSED CONSOLIDATED STATEMENTS OF CASH FLOWS(In thousands)
(Unaudited)Year Ended June 30,
2018 20171 20161
Cash flows from operating activities:
Net (loss) income $ (18,280) $ 22,551 $ 71,791
Adjustments to reconcile net (loss) income to net cash provided by operating activities:
Depreciation and amortization 30,464 22,970 20,774
Other Non-Cash 24,325 (16,875) (62,709)
Change in operating assets and liabilities:
Change in operating assets (19,753) 17,383 6,523
Change in operating liabilities (7,811) (3,917) (8,751)
Net cash provided by operating activities $ 8,855 $ 42,112 $ 27,628
Cash flows from investing activities:
Acquisitions of businesses, net of cash acquired $ (39,608) $ (25,853) $ —
Purchases of property, plant and equipment (35,443) (45,195) (31,050)
Purchases of assets for construction of New Facility (1,577) (39,754) (19,426)
Proceeds from sales of property, plant and equipment 1,988 4,078 10,946
Net cash used in investing activities $ (74,640) $ (106,724) $ (39,530)
Cash flows from financing activities:
Proceeds from revolving credit facility $ 85,315 $ 77,985 $ 405
Repayments on revolving credit facility (23,149) (50,473) (374)
Proceeds from sale-leaseback financing obligation — 42,455 —
Proceeds from New Facility lease financing obligation — 16,346 19,426
Repayments of New Facility lease financing — (35,772) —
Payments of capital lease obligations (947) (1,433) (3,147)
Other financing activities 763 650 1,527
Net cash provided by financing activities $ 61,982 $ 49,758 $ 17,837
Net (decrease) increase in cash and cash equivalents $ (3,803) $ (14,854) $ 5,935
Cash and cash equivalents at beginning of year 6,241 21,095 15,160
Cash and cash equivalents at end of year $ 2,438 $ 6,241 $ 21,095
APPENDIX
1. Prior year financial information has been retrospectively adjusted to reflect the impact of certain changes in accounting principles and corrections to previously issued financial statements.

42
FARMER BROS. CO.
CONDENSED CONSOLIDATED STATEMENTS OF CASH FLOWS (In thousands)
(Unaudited)Six Months Ended December 31,
2018 20171
Cash flows from operating activities:
Net loss $ (13,086) $ (16,220)
Adjustments to reconcile net loss to net cash used in operating activities:
Depreciation and amortization 15,630 15,330
Other Non-Cash 20,562 16,443
Change in operating assets and liabilities:
Change in operating assets (32,644) (14,244)
Change in operating liabilities 3,892 (2,842)
Net cash used in operating activities $ (5,646) $ (1,533)
Cash flows from investing activities:
Acquisition of businesses, net of cash acquired $ — $ (39,608)
Purchases of property, plant and equipment (23,120) (14,672)
Purchases of assets for construction of New Facility — (1,577)
Proceeds from sales of property, plant and equipment 105 85
Net cash used in investing activities $ (23,015) $ (55,772)
Cash flows from financing activities:
Proceeds from revolving credit facility $ 40,642 $ 69,758
Repayments on revolving credit facility (429) (12,949)
Payments of capital lease obligations (137) (591)
Payment of financing costs (1,027) (365)
Proceeds from stock option exercises 507 625
Net cash provided by financing activities $ 39,556 $ 56,478
Net increase (decrease) in cash and cash equivalents $ 10,895 $ (827)
Cash and cash equivalents at beginning of period 2,438 6,241
Cash and cash equivalents at end of period $ 13,333 $ 5,414
APPENDIX
1. Prior year financial information has been retrospectively adjusted to reflect the impact of certain changes in accounting principles and corrections to previously issued financial statements.

43
SOURCES
Page 6, 9 & 29
Industry Volume & Growth
Technomic AFH Beverage Study 2016 RSE, 2014-2016 CAGR
Specialty Coffee Growth Nielsen XAOC latest 52 weeks
WE 1/27/18
Page 10
Cold & Frozen Format Growth
NCA: National Coffee Drinking Trends 2017; Technomic AFH
Beverage Study 2016 RSE, 2014-2016; Doing well by doing good
Nielsen 2014
Page 11
APPENDIX
Market Consolidation
James Watson, Coffee Consolidation Accelerates (2017), Rabobank,
available at http://research.rabobank.com/far/en/sectors/beverages/Coffee_Consolidation
_Accelerates.html

44
FORWARD-LOOKING STATEMENTS
Certain statements contained in this presentation are not based on historical fact and are forward-looking statements within the
meaning of federal securities laws and regulations. These statements are based on management’s current expectations, assumptions,
estimates and observations of future events and include any statements that do not directly relate to any historical or current fact;
actual results may differ materially due in part to the risk factors set forth in our most recent 10-K and 10-Q filings. These forward-
looking statements can be identified by the use of words like “anticipates,” “estimates,” “projects,” “expects,” “plans,” “believes,”
“intends,” “will,” “assumes” and other words of similar meaning. Owing to the uncertainties inherent in forward-looking statements,
actual results could differ materially from those set forth in forward-looking statements. We intend these forward-looking statements to
speak only at the time of this presentation and do not undertake to update or revise these statements as more information becomes
available except as required under federal securities laws and the rules and regulations of the SEC. Factors that could cause actual
results to differ materially from those in forward looking statements include, but are not limited to, the success of our corporate
relocation plan, the timing and success of our DSD restructuring plan, the Company’s success in consummating acquisitions and
integrating acquired businesses, the impact of capital improvement projects, the adequacy and availability of capital resources to fund
the Company’s existing and planned business operations and the Company’s capital expenditure requirements, the relative
effectiveness of compensation-based employee incentives in causing improvements in Company performance, the capacity to meet
the demands of our large national account customers, the extent of execution of plans for the growth of Company business and
achievement of financial metrics related to those plans, the ability of the Company to retain and/or attract qualified employees, the
success of the Company’s adaptation to technology and new commerce channels, the effect of the capital markets as well as other
external factors on stockholder value, fluctuations in availability and cost of green coffee, competition, organizational changes, the
effectiveness of our hedging strategies in reducing price risk, changes in consumer preferences, our ability to provide sustainability in
ways that do not materially impair profitability, changes in the strength of the economy, business conditions in the coffee industry and
food industry in general, our continued success in attracting new customers, variances from budgeted sales mix and growth rates,
weather and special or unusual events, as well as other risks described in this presentation and other factors described from time to
time in our filings with the SEC. The results of operations for the three and six months ended December 31, 2018 are not necessarily
indicative of the results that may be expected for any future period.
APPENDIX

45