farm performance and productivity - gov.uk
TRANSCRIPT
Farm performance and productivityAnalysis of Farm Business Survey

Farm Business Survey
The Farm Business Survey (FBS) provides information on the financial, physical and environmental performance of farm businesses in England to inform and evaluate policy decisions. The FBS is intended to serve the needs of farmers, farming and land management interest groups, government, government partners and researchers. Survey results typically give comparisons between groups of businesses, for example between regions or between types of farm.
Unless otherwise specified, the figures reported in this slide pack are based on a 3 year matched dataset 2016/17 to 2018/19.

Farm Performance
Farm Performance Farm Accounts Productivity

1.1England, how is the economicoutput distributed across thenumber of farms?
In England in 2017, a small numberof economically large farms (8%)produced over half (57%) theagricultural output using just 33% ofthe total farmed land area.
1.2How does the economic size of afarm affect its performance inEngland?
Over the three year period 2016/17to 2018/19 in England, the highestperforming 25% farms have asimilar level of performanceregardless of farm size. However,the gap between the top and bottom25% is greater for smaller farms.
1.3Why does agricultural performancevary so widely and how can lowerperforming farms improveperformance?Differences achieved in input and outputsvalues is one reason for differences in farmperformance. As a result of differences ininput and output values achieved, for every£100 spent by Lowland Grazing Livestockfarms, those in the top 20% made on average£161 compared to £87 for farms in the bottom20%.
1.4How can farms maximise theiroutputs?
Farms can maximise their outputsby responding to the market, suchas by ensuring their outputs conformto processor safety requirementsand quality specifications, thereforereducing wastage and increaseprices achieved.
1.5What are the routes to improvingfarm performance?
Routes to improving farmperformance include reducinginputs, such as by feed efficiency ornutrient management, maximisingthe value of outputs by improvinganimal and plant health or themarketability of outputs, oralternative routes like diversification.
1.6How can diversification help toincrease farm profitability?Over the three year period 2016/17 to2018/19, two thirds of farms (62%) in thebottom 10% by profitability undertook adiversified activity, compared with threequarters (75%) in the top 10%. Of thosefarms that had a diversified activity, thebottom 10% made, on average, £43/ha,compared with £223/ha for farms in thetop 10%.
Summary – Farm Performance
Farm Performance and Productivity Pack
Farm Performance Farm Accounts Productivity

In England how is the economic output distributed across the number of farms?
In England in 2017, a small number of economically large farms (8%) produced over half (57%) the agricultural output using just 33% of the total farmed land area.
Economic Size ClassificationStandard Output
Very Small
Under €25K
Small
€25K to €125K
Medium
€125K to €250K
Large
€250K to €500K
Very Large
At least €500K
% total Farm Businesses
Number of farm businesses
41%38,700
30%28,200
12%10,800
9%8,600
8%7,100
Total:93,400
Farm Businesses
% of total Output 2% 11% 12% 18% 57%
Total:€16,400
million estimated
output
% total Farmed Area(thousand Hectares) 7% 21% 18% 21% 33%
Total:9.1
Millionhectares
Standard Output measures the total value of output of any one enterprise - per head for livestock and per hectare for crops. For crops this willbe the main product (e.g. wheat, barley, peas) plus any by-product that is sold, for example straw. For livestock it will be the value of the main product (milk, eggs, lamb, pork) plus the value of any secondary product (calf, wool) minus the cost of replacement.
Note - the figures exclude businesses classified as ‘specialist horse’Farm Performance and Productivity Pack 1.1
Farm Performance Farm Accounts Productivity

How does the economic size of a farm affect its performance in England?
Over the three year period 2016/17 to 2018/19 in England, the highest performing 25% farms have a similar level of performance regardless of farm size. However, the gap between the top and bottom 25% is greater for smaller farms.
Ratio of the average output costs and average input costs for whole farm business for the top 25% of farms, middle 50% (25%-75%) and bottom 25% of farms by economic size
0.00
0.50
1.00
1.50
Very small Small Medium Large Very Large
Bottom 25%Middle 50%Top 25%
Economic farm size bands
Very small farm businesses show the largest difference in performance between top 25% and bottom 25%, but the average performance of the top 25% is similar to larger farms.
Farm sizes are based on the estimated Standard Labour Requirements (SLR) for the business, not its land area.
SLR is defined as the theoretical number of workers required each year to run a business, based on its cropping and livestock activities. For more information on how SLR is defined (see slide 3.4).
Ratio of economic performance, top 25% vs bottom 25%:
A ratio of 1 means the outputs = inputs
2.1 1.9 1.7 1.5 1.4
Farm Business Income (FBI) is calculated as the difference between Farm Business Outputs and Farm Business Inputs. It does not deduct the cost of unpaid labour. When calculating farm economic performance, unpaid labour is included as a cost. This allows a fairer comparison between farms with employees and those that use unpaid (often family) labour.
Farm Performance and Productivity Pack 1.2
Farm Performance Farm Accounts Productivity

Why does agricultural performance vary so widely and how can lower performing farms improve performance?
Differences achieved in input and outputs values is one reason for differences in farm performance. As a result of differences in input and output values achieved, for every £100 spent by Lowland Grazing Livestock farms, those in the top 20% made on average £161 compared to £87 for farms in the bottom 20%.
Total output: £1353/hectare
£377 £185Livestock output£622
Livestock output£355 £186
Cro
psC
rops
Oth
er
Total Cost: £827/hectare
Input costs
Bottom 20%
Top 20%
Total Cost: £840/hectare
Variable Costs£312
Fixed Costs£515
Variable Costs£335
Fixed Costs£504
Total output: £723/hectare
Bottom 20%
Top 20%
Output value
Diversification
Direct Payments
Agri-environment
Differences in inputs costs can be due to inefficient use of inputs, differences in farming system and management, and the resource efficiency of crops and livestock on the farm. Our research shows that where beef animals of the same breed were reared in different sized groups the feed intake required to obtain the same growth rate varied considerably, by up to 23%.
Differences in outputs achieved may be due to system design, impacts of pests and diseases, and the yield potential of crops and livestock grown on the farm. For example, diseases such as Bovine Viral Diarrhoea can reduce milk outputs by 10% to 20%.
Fixed and variable costs are broadly similar between the bottom and top 20%.
The top 20% achieved a greater revenue per hectare for their crops and livestock, and made more from diversification and agri-environment schemes.
Farm Performance and Productivity Pack 1.3
Farm Performance Farm Accounts Productivity

How can farms maximise their outputs? Farms can maximise their outputs by responding to the market, such as by ensuring their outputs conform to processor safety requirements and quality specifications, therefore reducing wastage and increase prices achieved.
Safety requirementsFarm businesses can maximise their returns by minimising the loss of saleable products. Livestock sold for slaughter must be fit for human consumption. Anything that doesn’t meet safety requirements will be rejected, resulting in reduced returns and possible non-payments to farmers. Many losses are avoidable through disease management and welfare practices. For example, liver fluke (parasitic worms) can be avoided through vaccination programmes and bruising avoided through taking greater care of animals during transit. Main causes for rejection and number of rejections in English red meat slaughterhouses in 2017
247,500
88,500 87,000
22,500
Losses can also be avoided in other sectors. For example, knowing the hygiene requirements of a dairy contract can avoid hygiene deductions, and following protocols to ensure mycotoxin levels are low enough in cereals can ensure standards are met.
0%
5%
10%
15%
20%
% o
f cat
tle
carc
ases
Understanding the marketMeeting quality specifications can maximise the price of the product. Abattoirs require animals that satisfy certain fat and weight specifications to meet consumer demands. However, 49% of prime beef fails to meet target market specifications. Knowing the market means that cattle of the appropriate breed, weight and specification can be reared to maximise returns.Securing more favourable contracts may help maximise prices paid or highlight problematic clauses, to ensure the farmer gets the best deal. Dairy contracts, for example, can have different standards for fat and protein levels, affecting the price by up to 0.75p/litre. Crop loss at harvest, out-graded material and spoilage in storage accounts for 2-25% of yield. Losses can be avoided by investing in machinery to minimise potato damage, or ventilation systems to improve grain drying. Greater transparency in the food chain increases information flow, enabling farms to better respond to market signals and increase efficiency. This could be through vertical integration, where a farm business becomes involved in the processing, retailing or catering of their produce. Alternatively, seeking feedback from processors can help farms monitor and improve.
Liver fluke Abscesses
Pneumonia/Pleurisy Bruising
Farm Performance and Productivity Pack 1.4
Farm Performance Farm Accounts Productivity

What are the routes to improving farm performance?
Routes to improving farm performance include reducing inputs, such as by feed efficiency or nutrient management, maximising the value of outputs by improving animal and plant health or the marketability of outputs, or alternative routes such as diversification.
Reducing Inputs
Monitoring Input UseCrop and livestock inputs represent 84% of variable costs to farms, which may be reduced by improving feed efficiency, selective breeding of animals and/or following a detailed crop nutrient management plan.
Controlling Livestock and plant disease can help farmers to reduce input costs, such as veterinary medicines or plant protection products.
Increasing Outputs
Improving Animal & Plant HealthPoor animal and plant health can decrease productivity and increase emissions, such as greenhouse gases, associated with production.
Improving Marketability of OutputsFarms can maximise their outputs by responding to the market, such as by ensuring their outputs conform to processor safety requirements and quality specifications, therefore reducing wastage and increase prices achieved.
Alternative Options
DiversificationOver the three year period 2016/17 to 2018/19, for the 70% of farms that had diversified, the average additional income from diversification was £19,800.
Environmental Land Management System (ELM) Farms may be able to use some of their agricultural land, in particular the less productive land, to deliver environmental benefits through a new ELM system.
Efficiency Improvements/Reducing Input CostsThere are often large variations in input costs for farms. Some aspects of this may be outside of a farmers control, such as transport costs (delivery and collection) being higher for farms in more remote areas .In some circumstances, farm businesses can work together to create a purchasing cooperative for greater buying power. Cash flow will impact on the ability to do this as some farm businesses may not have the capital to buy in advance.
Business Management PracticesWhilst reducing inputs and maximising outputs could help offset the reduction of subsidies, business management practices could also be used to make improvements.
The ability to diversify will depend on the characteristics and location of the farm. If more farms diversify, this would increase the supply and thus in turn may lower the return to the farmer.
Farm Performance and Productivity Pack 1.5
Farm Performance Farm Accounts Productivity
How can diversification help to increase farm profitability?
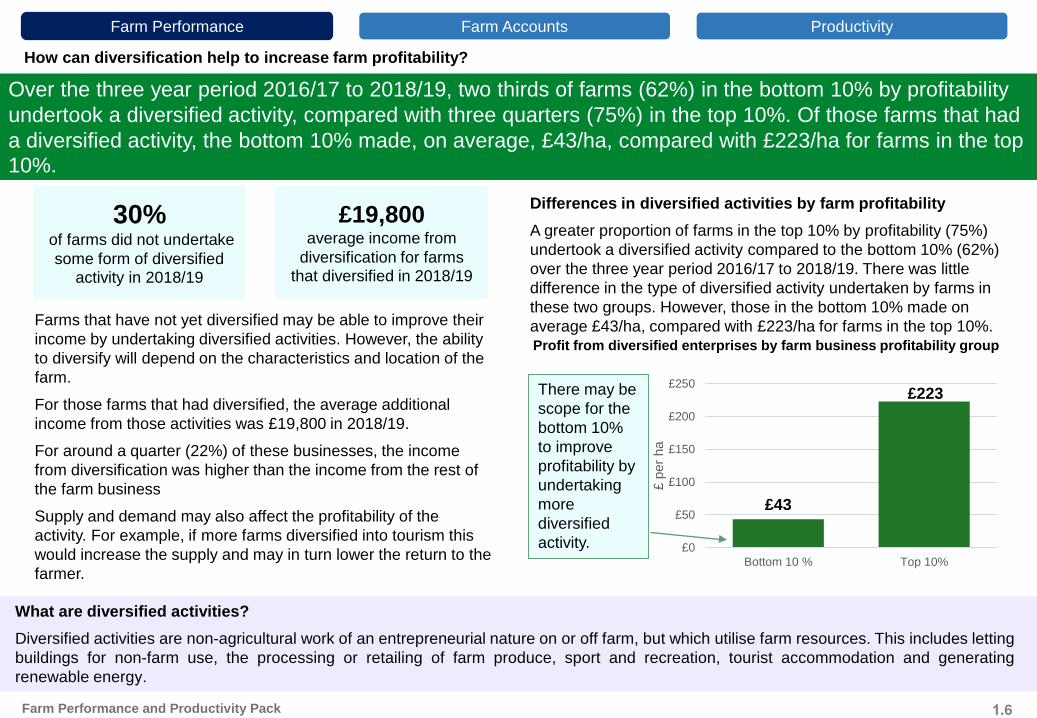
Over the three year period 2016/17 to 2018/19, two thirds of farms (62%) in the bottom 10% by profitability undertook a diversified activity, compared with three quarters (75%) in the top 10%. Of those farms that had a diversified activity, the bottom 10% made, on average, £43/ha, compared with £223/ha for farms in the top 10%.
30%of farms did not undertake some form of diversified
activity in 2018/19
£19,800average income from
diversification for farms that diversified in 2018/19
Farms that have not yet diversified may be able to improve their income by undertaking diversified activities. However, the ability to diversify will depend on the characteristics and location of the farm. For those farms that had diversified, the average additional income from those activities was £19,800 in 2018/19.For around a quarter (22%) of these businesses, the income from diversification was higher than the income from the rest of the farm businessSupply and demand may also affect the profitability of the activity. For example, if more farms diversified into tourism this would increase the supply and may in turn lower the return to the farmer.
Differences in diversified activities by farm profitabilityA greater proportion of farms in the top 10% by profitability (75%) undertook a diversified activity compared to the bottom 10% (62%) over the three year period 2016/17 to 2018/19. There was little difference in the type of diversified activity undertaken by farms in these two groups. However, those in the bottom 10% made on average £43/ha, compared with £223/ha for farms in the top 10%.Profit from diversified enterprises by farm business profitability group
£43
£223
£0
£50
£100
£150
£200
£250
Bottom 10 % Top 10%
£ pe
r ha
There may be scope for the bottom 10% to improve profitability by undertaking more diversified activity.
Farm Performance and Productivity Pack
What are diversified activities?Diversified activities are non-agricultural work of an entrepreneurial nature on or off farm, but which utilise farm resources. This includes letting buildings for non-farm use, the processing or retailing of farm produce, sport and recreation, tourist accommodation and generating renewable energy.
1.6
Farm Performance Farm Accounts Productivity

Farm Accounts
Farm Performance Farm Accounts Productivity

Summary – Farm Accounts
2.1What factors are contributing to some farmers in England continuing to farm while making a loss?Income from agriculture can be volatile, as farm businesses are price-takers and the determinants of the prices they receive can be out of their control. Income from Direct Payments, agri-environment schemes and diversification tends to be more stable.
2.3How does Farm Business Income vary by region?
Farm Business Income (FBI) varies across the different regions of England, and on average over the three year period 2016/17 to 2018/19 the East of England had the highest FBI (£61,800) and the South West the least (£38,800).
2.4How does profit vary according to different farm size in England?
Farm Business Income varies by farm size, and over the three year period 2016/17 to 2018/19 part time and small farms were more reliant on Direct Payments and very large farms the least.
Farm Performance and Productivity Pack
Farm Performance Farm Accounts
2.2What factors are contributing to some farmers in England continuing to farm while making a loss?
Many farmers put the farming lifestyle as being more important to them than maximising profits. Many farms are also asset rich, with owner occupied farms averaging a net worth of £1.84m.
Productivity

Summary – Farm Accounts
2.5How does Farm Business Income vary by tenure type?
Over the three year period 2016/17 to 2018/19 mixed – mainly tenanted farms had the highest farm business income (£68,300) and owner occupied farms the lowest (£33,700).
2.6How does agriculture contribute to the incomes (or profit) of farmers in England?
Over the three year period 2016/17 to 2018/19, only the top 50% of farms made a profit from agriculture. The bottom 25% of farms made a loss of £27,000 from agriculture, and overall made a loss of £7,300.
2.7How does profit vary between the Uplands and Lowlands?
On average, over the three year period 2016/17 to 2018/19, grazing livestock farms in Severely Disadvantaged Areas made a greater loss from farming activities, but Farm Business Income for these was higher than grazing livestock farms generally due to greater income from Direct Payments and agri-environment schemes.
2.8How important is agriculture in the rural economy?
Agriculture is important for rural areas, especially in the rural uplands, accounting for around 15% of registered businesses and 8% of employment across all rural areas, which rises to 30% and 14% respectively in rural uplands areas.
2.9How much income do farmers generate from providing non-agricultural products using their farm resources?
Over the three year time period 2016/17 to 2018/19, 2/3rds of farms used farm resources to deliver non-agricultural activities, generating around £623 million additional profit (£15,600 average per farm).
Farm Performance and Productivity Pack
Farm Performance Farm Accounts Productivity

What factors are contributing to some farmers in England continuing to farm while making a loss?
Income from agriculture can be volatile, as farm businesses are price-takers and the determinants of the prices they receive can be out of their control. Income from Direct Payments, agri-environment schemes and diversification tends to be more stable.
Average income (£) from agriculture, diversification, Agri-environment and Direct Payments for all farms from 2005/06 to 2017/18
-£10,000
£0
£10,000
£20,000
£30,000
2005/06 2007/08 2009/10 2011/12 2013/14 2015/16 2017/18
Agriculture Agri-environment Diversification Direct payments
£ pe
r far
m
Farm Performance and Productivity Pack 2.1
Farm Performance Farm Accounts Productivity
Note there are slight discontinuities in the data in 2009/10, 2012/13 and 2017/18
Compared to income from Direct Payments, Agri-environment schemes and Diversification, income from agriculture is volatile from year to year. This volatility in agricultural income is found across all farm types.
Fluctuations in Direct Payments are due to changes in the exchange rate. The sterling rates are set based on the exchange rate in September each year.
Farmers are price-takersMany of the determinants of the prices farmers receive are out of their control. Farmers plant crops and raise animals, but by the time their produce is available for market the actual price they receive may have fallen. Many agricultural products are perishable and cannot be stored on farm, so have to be moved into the supply chain quickly, meaning farmers cannot wait for better prices. Weather patterns can also impact both domestic and global supply. These factors mean that in some years farmers make profits and in others losses.
What factors are contributing to some farmers in England continuing to farm while making a loss?
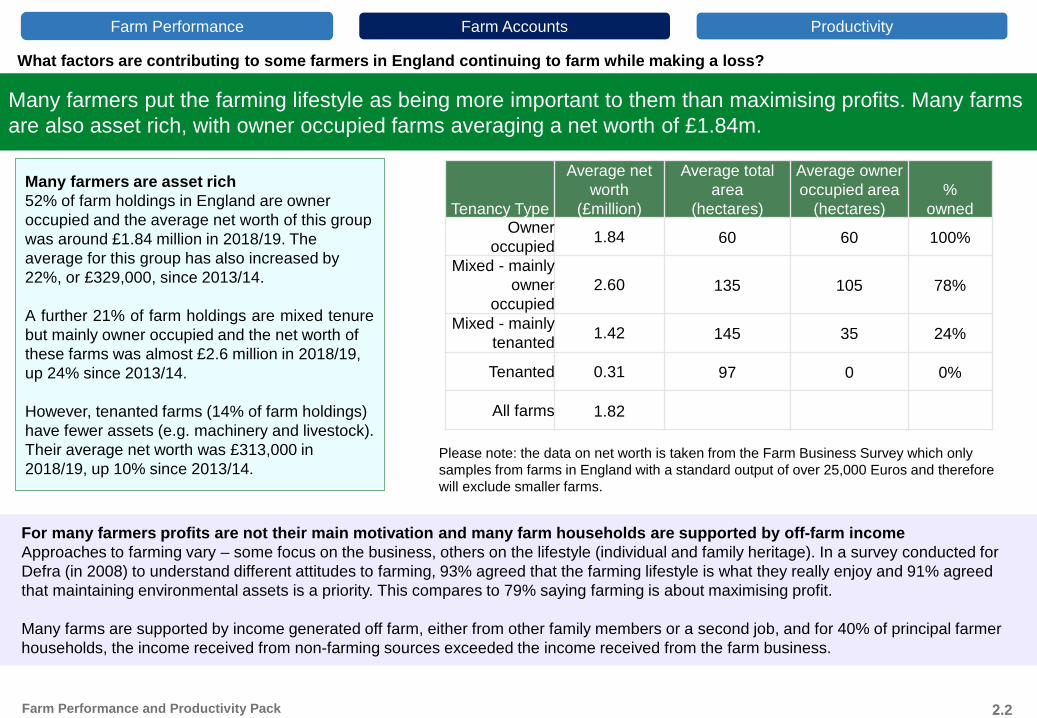
Many farmers put the farming lifestyle as being more important to them than maximising profits. Many farms are also asset rich, with owner occupied farms averaging a net worth of £1.84m.
Farm Performance and Productivity Pack 2.2
Many farmers are asset rich52% of farm holdings in England are owner occupied and the average net worth of this group was around £1.84 million in 2018/19. The average for this group has also increased by 22%, or £329,000, since 2013/14.
A further 21% of farm holdings are mixed tenure but mainly owner occupied and the net worth of these farms was almost £2.6 million in 2018/19, up 24% since 2013/14.
However, tenanted farms (14% of farm holdings) have fewer assets (e.g. machinery and livestock). Their average net worth was £313,000 in 2018/19, up 10% since 2013/14.
Tenancy Type
Average net worth
(£million)
Average total area
(hectares)
Average owner occupied area
(hectares)%
ownedOwner
occupied 1.84 60 60 100%
Mixed - mainly owner
occupied2.60 135 105 78%
Mixed - mainly tenanted 1.42 145 35 24%
Tenanted 0.31 97 0 0%
All farms 1.82
Please note: the data on net worth is taken from the Farm Business Survey which only samples from farms in England with a standard output of over 25,000 Euros and therefore will exclude smaller farms.
For many farmers profits are not their main motivation and many farm households are supported by off-farm incomeApproaches to farming vary – some focus on the business, others on the lifestyle (individual and family heritage). In a survey conducted for Defra (in 2008) to understand different attitudes to farming, 93% agreed that the farming lifestyle is what they really enjoy and 91% agreed that maintaining environmental assets is a priority. This compares to 79% saying farming is about maximising profit.
Many farms are supported by income generated off farm, either from other family members or a second job, and for 40% of principal farmer households, the income received from non-farming sources exceeded the income received from the farm business.
Farm Performance Farm Accounts Productivity

How does Farm Business Income vary by region?
Farm Business Income (FBI) varies across the different regions of England, and on average over the three year period 2016/17 to 2018/19 the East of England had the highest FBI (£61,800) and the South West the least (£38,800).
Farm Business Income (FBI) and the proportion that comes from:
-20000
-10000
0
10000
20000
30000
40000
50000
60000
England NorthEast
NorthWest
Yorkshire&
Humber
EastMidlands
WestMidlands
East ofEngland
SouthEast
SouthWest
Farm BusinessIncome
Agriculture Agri-environment Diversification Direct Payments
% Direct Payments53% 71% 61% 46% 57% 48% 61% 47% 50%
The North East had the highest proportion of income from Direct Payments due to a prevalence of Grazing livestock farms in this area.
The East of England had the highest average FBI of £61,800.
Farm businesses in the South East and North East made losses on the agriculture part of their FBI.
The North West had the lowest average FBI and the West Midlands received the least Direct Payments.
Farm Performance and Productivity Pack 2.3
Farm Performance Farm Accounts Productivity

How does profit vary according to different farm size in England?
Farm Business Income varies by farm size, and over the 3-year three year period 2016/17 to 2018/19 part time and small farms were more reliant on Direct Payments and very large farms the least.
Farm size Definition
Spare & Part time Less than 1 SLR
Small 1 to less than 2 SLR
Medium 2 to less than 3 SLR
Large 3 to less than 5 SLR
Very Large 5 or more SLR
The standard labour requirement (SLR) of a farm represents the normal labour requirement, in Full Time Equivalents, for all enterprises on a farm under typical conditions. The SLR for a farm is calculated from standard coefficients applied to each enterprise of the farm. The standard coefficients represent the input of labour required per head of livestock or per hectare of crops for enterprises of average size and performance.
Average Farm Business Income (£)
All farms
£47,600
53%
Very Large
£143,100
42%
Large
£68,300
48%
Direct PaymentDiversificationAgri-environmentAgriculture
Medium
£45,000
58%
Small
£28,100
70%
Spare/Part time
£18,500
72% % Direct Payments
For spare and part time farms and small farms, more than three quarters (72% and 70%) of their Farm Business Income came from Direct Payments.
For Medium and Large farms, the amount of their income (58% and 48%) that came from Direct Payments was just above the average for all farms (58%).
For very large farms just under half (42%) of their income came from Direct Payments.
2.4Farm Performance and Productivity Pack
Farm Performance Farm Accounts Productivity
-20,000
0
20,000
40,000
60,000
80,000
100,000
120,000
140,000
160,000

How does Farm Business Income vary by tenure type?
Over the three year period 2016/17 to 2018/19 Mixed – mainly tenanted farms had the highest farm business income (£68,300) and owner occupied farms the lowest (£33,700).
In England in 2017…
39%of farmed area in England was
rented.
14% of farm holdings were
wholly tenanted (15,000 farms), accounting for 16% of farmed area (1.4million
ha).
34%of farms were mixed tenure
(36,000 farms). These accounted for 50% of
farmed area (4.6million ha).
52% Over the three year period
2016/17 to 2018/19 Mixed –mainly tenanted farms had the highest farm business income (£68,300) and owner occupied
farms the lowest (£33,700).
Of the land that was rented, the majority
(85%) was rented for at least a year, while the remaining 15% was rented seasonally.
Average Farm Business Income (FBI) by tenancy type, based on 3 year matched dataset 2016/17 to 2018/19
Direct PaymentDiversificationAgri-environmentAgriculture
Owner occupied
£33,700
% Direct Payments
54%
Mixed(mainly owner
occupied)
£59,300
50%
Mixed(mainly
tenanted)
£68,300
49%
Tenanted
2.5Farm Performance and Productivity Pack
Farm Performance Farm Accounts Productivity
£34,100
71%
All farm types
£47,600
53%
80,000
70,000
60,000
50,000
40,000
30,000
20,000
10,000
0
-10,000

How does agriculture contribute to the incomes (or profit) of farmers in England?
Over the three year period 2016/17 to 2018/19, only the top 50% of farms made a profit from agriculture. The bottom 25% of farms made a loss of £27,000 from agriculture, and overall made a loss of £7,300.
Farm Performance and Productivity Pack 2.6
Contributions to Farm Business Income (or profit)
Income from agriculture
Farm Business Income
All farms
£7,300
£47,600
Bottom 25% of farms
-£7,300
-£27,000
25%-50%
-£7,000
£16,300
50%-75%
£2,200
£38,300
Top 25% of farms
£142,600
£60,500
AgricultureOnly the top 25% on average made a profit from the agricultural part of the business (£60,500). The bottom 25% made an average loss of £32,000 from agriculture.
Ranking farms from lowest to highest by their Farm Business Income and splitting into 4 equal groups:
DiversificationOn average, diversification provided profit to farms in each group, but contributed most (£26,300) to the top 25% of farms. The bottom 25% made only £3,500 from diversification.
Direct PaymentsOn average, Direct Payments contributed £25,300 to farm business income. For the top 25% of farms, the average income from Direct Payments was £48,100, these farms receive more because this is an area based payment and they tend to be larger.
Diversification
Direct Payments
Agri-environment
Key
Farms are ranked from the lowest to highest Farm Business Income
£ per farm
Agriculture
Farm Performance Farm Accounts Productivity
Agri-environmentThese schemes contributed an average £4,100 to farm incomes.
-50,000
-
50,000
100,000
150,000
200,000

How does profit vary between the Uplands and Lowlands? On average, over the 3-year three year period 2016/17 to 2018/19, grazing livestock farms in Severely Disadvantaged Areas made a greater loss from farming activities, but Farm Business Income for these was higher than grazing livestock farms due to greater income from Direct Payments and agri-environment schemes.Less Favoured Areas (LFA) in England are subdivided into two areas.The more environmentally challenging areas within the LFA, which tend to be more upland in character, are classed as ‘Severely Disadvantaged Areas’ (SDA). The remainder is classified as ‘Disadvantaged Areas’ (DA). This distinction is important as it determines eligibility for support payments and environmental schemes, with SDAs being the focus of Government support in the LFA.
Three quarters of farm holdings in the SDA are grazing livestock, accounting for 87% of the farmed area.
In 2016 there were 9,500 holdings forming 9,200 farm businesses classed as having the majority of their land in the SDA in England, covering 1.1million hectares (excluding common land).
Average Farm Business Income (FBI) for all farms in the SDA is lower than the average of all farms outside the SDA due to the prevalence of Grazing Livestock (GL) farms, which tend to have lower incomes than other farm types.SDA GL farms made greater loss from agriculture, but overall FBI was higher due to greater income from Direct Payments and agri-environment schemes.On average, SDA GL farms are larger than non-SDA GL farms (132ha compared with 45ha), and hence the per farm income from Direct Payments and agri-environment schemes is larger.
Composition of Farm Business Income: SDA and Non SDA Grazing livestock (GL) farmsCOm
Non SDA GL£16.4kFarm Business Income
Mainly SDA GL
£29k
16.5k
£3.1k
£18.4k
£15.9k
- k
£6.9k£2.9k£9.3
£
-
Farm Business Income£30.3k
Agriculture
Agri-environment
Diversification
Direct Payments
Farm Performance and Productivity Pack 2.7
Farm Performance Farm Accounts Productivity
Without Direct Payments, grazing livestock farms in SDA have an average FBI of £1,300 compared to non-SDA GL FBI of £500 due to larger agri-environment payments.

How important is agriculture in the rural economy?
Agriculture is important for rural areas, especially in the rural uplands, accounting for around 15% of registered businesses and 8% of employment across all rural areas, which rises to 30% and 14% respectively in rural uplands areas.
Agriculture contributes around 2% to the rural economy (in England). It is 0.6% of England’s economy overall.
Rural uplands are home to almost 240,000 people, of which 31% (72,000) live within areas that are sparsely populated.
The proportion of rural employment in agriculture is greater in smaller settlements and in sparsely populated areas, especially in upland areas.
Agriculture accounts for 15% of registered businesses across all rural areas, however this proportion is twice as much in rural uplands areas (30%), making it one of the most important sectors in rural uplands.
Proportion of businesses in agriculture, forestry and fishing
Note: * agriculture includes agriculture, forestry and fishing sectors
Rural
15%
Rural Uplands
30%
Agriculture accounts for 8% of employment in registered businesses across all rural areas, however in rural uplands the proportion of people employed in agriculture is almost twice as high at 14%. Accommodation and food service activities are also important employment sectors in rural uplands.
Proportion of employment in agriculture, forestry and fishing
30%
Rural
8%
14%
Rural uplands
Farm Performance and Productivity Pack 2.8
Farm Performance Farm Accounts Productivity
0%
5%
10%
15%
20%
25%
0%
5%
10%
15%
20%
25%
30%
35%

Over the three year time period 2016/17 to 2018/19, 2/3rds of farms used farm resources to deliver non-agricultural activities, generating around £623 million additional profit (£15,600 average per farm).
Diversified enterprises = non-agricultural work of an entrepreneurial nature on or off farm, but which utilises farm resources.
How much income do farmers generate from providing non-agricultural products using their farm resources?
Farm Performance and Productivity Pack 2.9
% of farms carrying out Average amount for those carrying out
Diversified enterprises (all kinds)
70% £15,600
Letting buildings for non-farming use
48% £14,400
Processing/retailing of farm produce
12% £9,400
Sport and recreation 15% £4,100
Tourist accommodation and catering
7% £6,600
Solar energy 21% £2,200
Other sources of renewable energy 10% £6,400
Other diversified activities 15%
0 5,000 10,000 15,000 20,000Average enterprise income (£/farm)
£4,800
Over the three year time period 2016/17 to 2018/19, 70% of farms participated in some form of diversified activity, up from 51% in 2009/10.
For those farms with a diversified activity, their income from that activity accounted for 28% of their profit in 2016/17 to 2018/19.
Just under a quarter (23%) of these businesses had a greater income from diversification than from the rest of the farm business.
Letting out buildings for non-agricultural use was the most common diversified activity, on average generating around £14,400 for those carrying out this activity in 2016/17 to 2018/19.
Processing and retailing of farm produce had the second highest average income stream among the diversified activities but only 12% of farms carried this out in 2016/17 to 2018/19.
Farm Performance Farm Accounts Productivity

Productivity
Farm Performance Farm Accounts Productivity

Summary – Productivity
Farm Performance and Productivity Pack
Farm Performance Farm Accounts Productivity
3.1How does UK agricultural competitiveness on cost compare internationally by sector?
Although aggregate comparisons suggest lagging UK agricultural productivity growth, other data shows that certain UK sectors have costs of production that are competitive on a global scale, such as for wheat and milk production.
3.2What drives productivity growth in the agriculture sector?
People, innovation, competitive pressures and capital are the four key drivers of productivity growth in UK agriculture, underpinned by the wider business environment including the trade regime, infrastructure and regulatory frameworks. Productivity growth must also be balanced with environmental outcomes.
3.3What is innovation, how is the UK performing?
Innovation is central to productivity growth and evidence suggests there should be high returns from public support for Research and Development (R&D) for agriculture
3.4How many farmers innovate and what are their motivations?
The strong agricultural research base needs to be mirrored by uptake of innovative practices by farmers. In autumn 2018, 54% of farms had introduced a significant change to their business in the previous year. Increased productivity, lowering costs and making things easier for self and staff were the most commonly cited motivations.

Summary – Productivity
3.6How does investment drive productivity and what barriers can stop farmers from investing?
Capital investment drives productivity improvements by enabling workers to be better able to do their jobs and produce output more efficiently. Uncertainty about the future is a key barrier to investment decisions.
3.7How does competition drive productivity and what competition is there in the agriculture sector?
Competition, as measured by entry and exit rates, is much lower for agriculture than for the wider economy. Removing Direct Payments could drive productivity improvement through greater entry and exit and reallocation of resources.
Farm Performance and Productivity Pack
Farm Performance Farm Accounts
3.5How could improving farm business and technical skills improve productivity?Improving farm business and technical skills can enable more efficient working and greater resilience. In England, farms with higher economic performance are more likely to undertake farm business management practices such as business planning and benchmarking.
Productivity

How does UK agricultural competitiveness on cost compare internationally by sector?
Although aggregate comparisons suggest lagging UK agricultural productivity growth, other data shows that certain UK sectors have costs of production that are competitive on a global scale, such as for wheat and milk production.
Costs of production are influenced by productivity, as well as other factors such as production standards and exchange rates. Comparisons are shown for selected, comparable countries.
Wheat average* cost of production and revenue, 2017
0
50
100
150
200
250
UK Australia Canada Germany France
Cash cost Depreciation Opportunity cost Gross revenue
UK Production Cost($212/tonne)
For wheat, the average revenue for representative farms in the UK was similar to other EU and non-EU countries. Average production costs are competitive with some countries, with costs of $212/tonne lower than Germany ($229), although higher than others such as Canada ($183).
Milk average* cost of production and revenue, 2017
0
20
40
60
UK Ireland France Germany Netherlands NewZealand
Cash cost Depreciation Opportunity cost Gross revenue
UK Gross Revenue ($47/100kg)
For milk, average revenues are competitive with other countries at around $47/100kg. Costs are largely competitive with most countries, with the exception of New Zealand.
*These charts show data from a small number of representative or typical farms in a given country rather than the national average. Opportunity costis calculated as a combination of unpaid family labour and imputed rent; these are based on local/regional values.
US$
/100
kg
US$
/tonn
e
Farm Performance and Productivity Pack 3.1
Farm Performance Farm Accounts Productivity
What drives productivity growth in the agriculture sector?
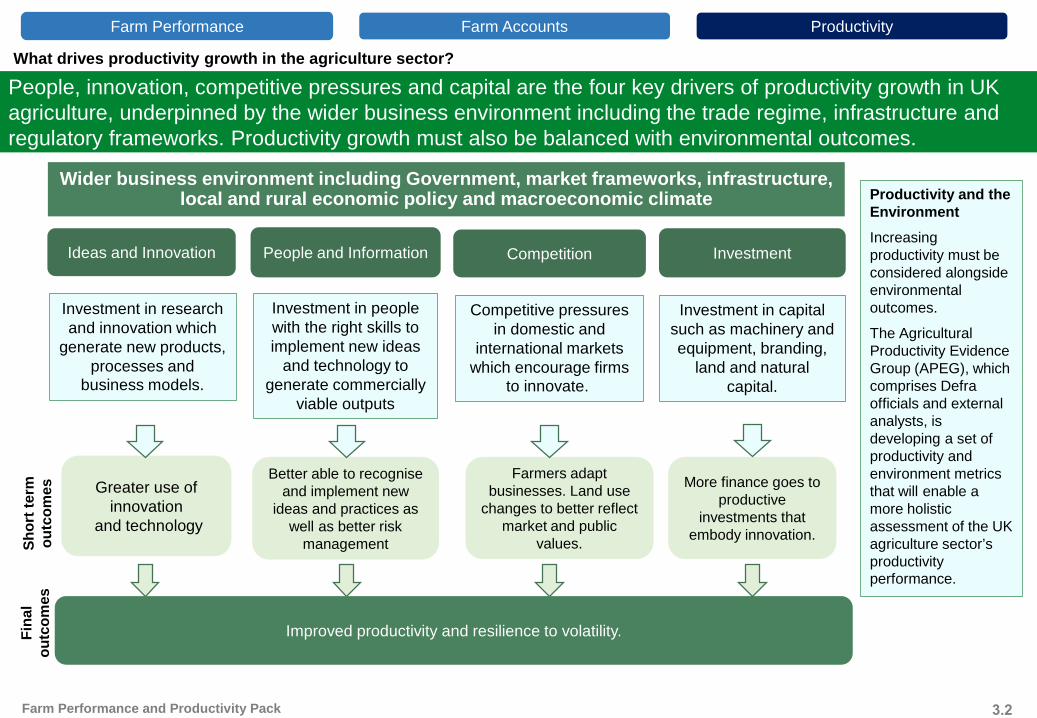
People, innovation, competitive pressures and capital are the four key drivers of productivity growth in UK agriculture, underpinned by the wider business environment including the trade regime, infrastructure and regulatory frameworks. Productivity growth must also be balanced with environmental outcomes.
Wider business environment including Government, market frameworks, infrastructure, local and rural economic policy and macroeconomic climate
Ideas and Innovation
Investment in research and innovation which
generate new products, processes and
business models.
Shor
t ter
m
outc
omes Greater use of
innovationand technology
People and Information
Investment in people with the right skills to implement new ideas
and technology to generate commercially
viable outputs
Better able to recognise and implement new
ideas and practices as well as better risk
management
Competition
Competitive pressures in domestic and
international markets which encourage firms
to innovate.
Farmers adapt businesses. Land use
changes to better reflect market and public
values.
Investment
Investment in capital such as machinery and equipment, branding,
land and natural capital.
More finance goes to productive
investments that embody innovation.
esna
lFi co
mou
t Improved productivity and resilience to volatility.
Productivity and the Environment Increasing productivity must be considered alongside environmental outcomes.
The Agricultural Productivity Evidence Group (APEG), which comprises Defra officials and external analysts, is developing a set of productivity and environment metrics that will enable a more holistic assessment of the UK agriculture sector’s productivity performance.
Farm Performance and Productivity Pack 3.2
Farm Performance Farm Accounts Productivity

What is innovation, how is the UK performing?
Innovation is central to productivity growth and evidence suggests there should be high returns from public support for Research and Development (R&D) for agriculture.
Innovation is the successful exploitation of new ideas. New ideas can take the form of new technologies, often embodied in capital equipment, new products or new ways of working.
Public sector spending is strong and higher or comparable with other European Countries, supporting a strong research base….
…however, this appears not to have translated into higher productivity growth in the UK.
Public Agricultural R&D as a percentage of agricultural GVA (average 2008-2017)
0% 1% 2% 3% 4% 5% 6%
Italy
France
Netherlands
Denmark
Germany
UK
Ireland
UK public spending on agricultural R&D has fallen by around a third in real terms since the 1980s, from around £600mn to £400mn.
Public sector R&D should be complemented by private sector investment, although this has remained stagnant at approximately 1.1% of GDP since 1995, compared to an OECD average of 1.6%.
UK agricultural productivity has not grown as fast as some of our competitors including those with lower public investment in innovation. Evidence suggests this may be due to fragmentation and coordination failures in the current UK innovation system, which have resulted in poor translation of public spending on innovation into productivity improvements on the farm level. The Standing Committee on Agricultural Research found that there are a number of gaps between practitioners and the research community that need to be bridged:• Success is judged in different ways.• Researchers and farmers have different styles of
communication• Researchers must be aware of the realities for
farmers regarding which innovations they use
Survey responses to Health and Harmony and discussions with farmers undertaken by Defra highlighted the following as key factors to increase innovation and to promote wider adoption of new approaches of technology: enabling farmers to be involved in research – both individually and in collaborative efforts - tailoring research to farmers’ needs, and effective knowledge exchange.
Farm Performance and Productivity Pack 3.3
Farm Performance Farm Accounts Productivity

The strong agricultural research base needs to be mirrored by uptake of innovative practices by farmers. In autumn 2018, 54% of farms had introduced a significant change to their business in the previous year. Increased productivity, lowering costs and making things easier for self and staff were the most commonly cited motivations.
How many farmers innovate and what are their motivations?
When asked in autumn 2018:
54%Had introduced a
significant change to their business in last
year
33%Planned to introduce a
significant change to their business in the
next year
Large farms were more likely to have introduced a significant change than small farms. Cereal farms were more likely to have introduced a significant change than other farm types.The most commonly selected motivations for innovating were to “increase productivity” (67% of farms), “lower costs” (65%) and “make things easier for me and my staff” (64%).Farm advisors (51% of farms), other farmers (44%), the farming press (36%) and family (36%) were the most commonly selected as sources of encouragement to innovate
Whilst there were a number of businesses very focused on technology (i.e. for horticulture), most of the farmers participating in farmer-led Future Farming discussions regarded innovation as being easily adopted measures, rather than just technology, that boost productivity.
Types of innovation introduced or intended to be introduced, autumn 2018
23%
20%
17%
17%
16%
10%
1%
1%
10%
9%
7%
10%
10%
8%
0% 10% 20% 30%
New or specialist machinery
Crop management (e.g. rotations)
Precision approaches(e.g. GPS, variable rate application)
Livestock management(e.g. breeding techniques or grazing
systems)
Technology(e.g. IT-enabled applications)
Business management(e.g. management tools)
Other
Last 12 months
Next 12 months
Farm Performance and Productivity Pack 3.4
Farm Performance Farm Accounts Productivity

How could improving farm business and technical skills improve productivity?
Improving farm business and technical skills can enable more efficient working and greater resilience. In England, farms with higher economic performance are more likely to undertake farm business management practices such as business planning and benchmarking.
Business management skills are important for ensuring that managers employ best practices to optimise performance and to underpin an efficient knowledge exchange system. Good managers are better able to recognise new ideas and undertake complementary investments to turn these ideas into new products and processes.
Only a third of farm managers in the UK had some form of formal training in 2013, compared to our main competitors, of which at least 60% of farm managers had a form of formal training. The UK compares better when considering younger farmers, with approximately 48% of farm managers aged under 35 in the UK having a form of formal training.
Percentage of farm managers with formal agricultural training (2013)
0%
20%
40%
60%
80%
100%
United Kingdom Netherlands France Germany
Proportion of farm businesses in top 25% and bottom 25% engaging in business management practices (2016/17).
13%
8%
17% 16%
44%
29% 29%26%
0%
10%
20%
30%
40%
50%Bottom 25% of farmsTop 25% of farms
While farms with higher economic performance are more likely to engage in farm business management practices, even the majority of these higher performers do not engage in these practices.
Grazing Livestock farms were the least likely to produce budgets and in depth profit and loss accounts. These farms also tended to have the lowest Farm Business Income.
Enterprise level/balance
sheet/international benchmarking
Regularly attends
discussion groups
Formal Plan Produces budget, gross margins, cash
flows or in-depth profit and loss
accounts
All managers Managers aged under 35
32%
72%62%
68%
48%
77%83%
62%
Farm Performance and Productivity Pack 3.5
Farm Performance Farm Accounts Productivity

How does investment drive productivity and what barriers can stop farmers from investing?
Capital investment drives productivity improvements by enabling workers to be better able to do their jobs and produce output more efficiently. Uncertainty about the future is a key barrier to investment decisions.
Lending to the agricultural sector is strong…. …however, there are some barriers to investment.
Non-Financial Corporations
0
50
100
150
200
250
300
Q4 2000 Q4 2003 Q4 2006 Q4 2009 Q4 2012 Q4 2015 Q4 2018
Outstanding lending from monetary financial institutions(£m)
Agriculture has seen a consistent upward trend in lending since 2000, compared to non-financial corporations. Although not all lending will be for investment purposes, access to finance for farm businesses appears to be strong.
Agricultural Industries
Proportion of online respondents that selected each option as a barrier to new capital investment that could boost profitability and improve animal and plant health on-farm
Other 13%
Difficulties with securing finance fromprivate lenders 17%
Insufficient access to support andadvice 21%
Social issues 25%
Investments in buildings, innovation ornew equipment are prohibitively… 64%
Inde
x, Q
4 20
00 =
100
Underlying profitability of the business 72%
Uncertainty about the future and whereto target new investment 77%
Whilst only 17% of on-line respondents to Defra’s Health and Harmony consultation cited difficulties with securing finance as a barrier to capital investment, for 77% the barrier was considered to be uncertainty about the future and where to target new investment.
Farm Performance and Productivity Pack 3.6
Farm Performance Farm Accounts Productivity
Listening to farmers as part of our discussion groups, we heard that profitability is a key factor in driving investment decisions. Some farmers highlighted future uncertainty over markets and standards (including trade and tariffs) as a barrier to investment, as well as labour and financial support becoming increasingly important, including for securing loans based on less certain business plans.

How does competition drive productivity and what competition is there in the agriculture sector?
Competition, as measured by entry and exit rates, is much lower for agriculture than for the wider economy. Removing Direct Payments could drive productivity improvement through greater entry and exit and reallocation of resources.
Competitive markets encourage new entrants and act as a spur to incumbents to innovate or exit. The Direct Payments system has acted to maintain high prices of agricultural land, impacting entry and exit rates as higher land prices have: made it difficult for new entrants wanting to start a new farm businesses to obtain land; increased the cost of expansion for productive businesses; and constrained incentives to exit for less productive farm businesses. If there is limited exit from the sector, this directly limits entry due to the need for land on which to farm.The median age of farm holders is 60 years and just 2% are aged under 35 years highlighting the limited structural change in the sector.
60 yearsMedian age of farm holders in
England
2%farm holders
aged under 35 in England
A common view from farmers participating in Future Farming discussion meetings was that encouraging new entrants was important for the long-term success of the industry. There was also a view that some structural change could be encouraged by older or less productive farmers leaving the industry.
Agriculture
Manufacturing
UK Economy
16%
12%
8%
4%
0%2010 2011 2012 2013 2014 2015 2016 2017
UK business birth rates UK business death rates
Agriculture
Manufacturing
UK Economy
0%
4%
8%
12%
16%
2010 2011 2012 2013 2014 2015 2016 2017
Business birth and death rates for agriculture remain consistently below those for the UK economy as a whole and the manufacturing sector. As a result, the “churn” of businesses in the agriculture sector is limited.
Farm Performance and Productivity Pack 3.7
Farm Performance Farm Accounts Productivity