faridkot district, punjab - central ground water...
TRANSCRIPT

क दरय भम जल बोडर
जल ससाधन नद वकास और गगा सरण मतरालय
भारत सरकार Central Ground Water Board
Ministry of Water Resources River Development and Ganga Rejuvenation
Government of India
Report on
AQUIFER MAPPING AND MANAGEMENT PLAN
Faridkot District Punjab
उर पिशचम तर चडीगढ़ North Western Region Chandigarh
AQUIFER MAPPING ampMANAGEMENT PLAN OF
FARIDKOT DISTRICT PUNJAB
Central Ground Water BoardNorth Western Region Chandigarh
Ministry of Water Resources River Development and Ganga RejuvenationGovernment of India
2017
AQUIFER MAPPING ampMANAGEMENT PLAN OF
FARIDKOT DISTRICT PUNJAB
Central Ground Water BoardNorth Western Region Chandigarh
Ministry of Water Resources River Development and Ganga RejuvenationGovernment of India
2017
AQUIFER MAPPING ampMANAGEMENT PLAN OF
FARIDKOT DISTRICT PUNJAB
Central Ground Water BoardNorth Western Region Chandigarh
Ministry of Water Resources River Development and Ganga RejuvenationGovernment of India
2017
AQUIFER MAPPING AND MANAGEMENT PLANFARIDKOT DISTRICT
(141860 Sq Km)
DISTRICT TECHNICAL REPORT (PART ndash I)
SL NO TITLE OF CONTENTS PAGE NO
10 INTRODUCTION 1 - 8
20 DATA COLLECTION AND GENERATION 9 - 17
30 DATA INTERPRETATION INTEGRATION AND AQUIFER MAPPING 18 - 25
40 GROUND WATER RESOURCES 26 - 30
50 GROUND WATER RELATED ISSUES 31 - 33
60 MANAGEMENT STRATEGIES AND AQUIFER MANAGEMENT PLAN 34 ndash 36
70 CONCLUSIONS 37
BLOCKWISE AQUIFER MAPS AND MANAGEMENT PLAN (PART ndash II)
I FARIDKOT BLOCK 39 - 46
II KOT KAPURA BLOCK 47 - 54
LIST OF FIGURES
Fig1 Base map of Faridkot District
Fig2 Fluvial Geomorphological Studies Carried out by Different Researchers to Understand the
Subsurface Aquifer System in North Western Regions
Fig3 Drainage and Water Bodies of Faridkot District
Fig4 Canal and Distributaries of Faridkot District
Fig5 Major Aquifers
Fig6 Depth to Pre Monsoon Water level (May 2015)
Fig7 Depth to Post Monsoon Water level (November 2015)
Fig8 Groundwater Quality 2015
Fig9 VES Locations in Faridkot District
Fig10 Locations of Exploration Data Availability
Fig11 Locations of Validated Exploration Data
Fig12 Elevation Contour Map
Fig13 Locations of Validated Exploratory Wells with Lithology
Fig14 3-Dimension Lithological Model
Fig15ab 2-Dimension Lithological Sections
Fig16 3-Dimension Lithological Fence
Fig17 3D Aquifer Disposition Model
Fig18 3D Aquifer Disposition Fence Diagram
Fig19 Conceptual figure to Understand the Fresh and Saline Water Resources in the Aquifer up
to 300 m for Resource Estimation in Unconfined and Confined Aquifer System
Fig20 Long term Ground Water Table Variation
Fig-21 Irrigation Tube Wells as per Depth wise Distributions in Faridkot District
LIST OF TABLES
Table1 Land use pattern of Faridkot district Punjab
Table -2 Summary of Optimized Exploration Wells
Table-3 Aquifer Grouping in Faridkot District
Table-4 Dynamic Ground Water Resource amp Development Potential (31032013) in mcm
Table-5 Block Wise In-Storage Ground Water Resources of Fresh Water Aquifers Upto Average
Depth
Table-6 Block Wise In-Storage Ground Water Resources of Saline Aquifers Upto 300 m Depth
Table-7 Block Wise Total Availability of Fresh and Saline Groundwater Resources upto 300 m
Depth and Volume of Unsaturated Granular Zone after 3m upto water level
Table-8 Distribution of Tube wells According to Well Ownerrsquos land holding Size
Table-9 Distribution of Tube wells According to Depth
Table-10 System of Ground water Distribution Device
Table-11a Scope of Quantitative Impact on Stage of Development after applying various
Management Strategies in mcm
Table-11b Scope of Quantitative Impact on Stage of Development after applying various
Management Strategies in percentage
ANNEXURES
Annexure-I Results of Chemical Analysis of Water Samples from NHS in Faridkot 2015
Annexure-II Results of Chemical Analysis of Water Samples from NAQUIM studies in Faridkot
(2014)
Annexure-III Lithological Data of Wells in Faridkot District
Annexure-IV Aquifer Grouping of Well Locations in Faridkot District
PHOTOGRAPHS
PROJECT TEAM
Regional Director Dr SKJainNodal Officer
Executive Engineer
Dr Sunil Kumar Scientist DHK ManochaReport Compilation Roopesh GKrishnan Scientist BHydrogeology Geophysics Chemical QualityRakesh RanaScientist DGP SinghScientist D (Retd)
SK KapilScientist DSK PaliScientist D (Retd)Rishi RajAssistant Chemist
Gyanendra RaiSTA (HG)
Aquifer Mapping and Management Plan of Faridkot District Punjab State
Page | 1
10 INTRODUCTIONThe primary objective of the Aquifer Mapping can be summed up as ldquoKnow your
Aquifer Manage your Aquiferrdquo Demystification of Science and thereby involvement of stakeholders is the essence of the entire project The involvement and participation of thecommunity will infuse a sense of ownership amongst the stakeholders This is an activity wherethe Government and the Community work in tandem Greater the harmony between the twogreater will be the chances of successful implementation and achievement of the goals of theProject As per the Report of the Working Group on Sustainable Ground Water ManagementldquoIt is imperative to design an aquifer mapping programme with a clear-cut groundwatermanagement purpose This will ensure that aquifer mapping does not remain an academicexercise and that it will seamlessly flow into a participatory groundwater managementprogramme The aquifer mapping approach can help integrate ground water availability withground water accessibility and quality aspects
12 Scope of the studySystematic mapping of an aquifer encompasses a host of activities such as collection and
compilation of available information on aquifer systems demarcation of their extents and theircharacterization analysis of data gaps generation of additional data for filling the identifieddata gaps and finally preparation of aquifer maps at the desired scale This manual attempts toevolve uniform protocols for these activities to facilitate their easy integration for the district aswhole
13 Approach and MethodologyNational Aquifer Mapping Programme basically aims at characterizing the geometry
parameters behaviour of ground water levels and status of ground water development invarious aquifer systems to facilitate planning of their sustainable management The majoractivities involved in this process include compilation of existing data identification of datagaps and generation of data for filling data gaps and preparation of aquifer maps The overallactivities of aquifer mapping are presented in the flow chart below
Aquifer Mapping and Management Plan of Faridkot District Punjab State
Page | 2
14 Location and Geographical UnitsFaridkot is located in South- Western part of Punjab State The area lies between
30deg21rsquo59rdquo to 30deg49rsquo52rdquo North latitude and 74deg28rsquo12rdquo to 75deg03rsquo22rdquo East longitude and falls in theSurvey of India Toposheet Nos 44J6 9 10 11 13 14 15 and 44N3 covering an area of141860 sq km (Fig1) It shares common boundaries with Moga district in east Ferozepurdistrict in North amp West and Muktsar and Bathinda districts in South The highest elevation2133 m above msl is near Jiwanwala in the eastern part whereas the minimum of 190m atPind Balochan in the western part with a gentle gradient of 045mkm to the SSW
Faridkot district is the smallest district of Punjab State and has two Sub divisions Tehsilsnamely Faridkot and Jaito and two Sub Tehsils namely Kotkapura and Sadiq comprising 190Gram Panchayats and 171 villages Faridkot District has two administrative development blocksie Faridkot and Kot Kapura
Total Population of the district as per the 2011 Census is 618008 out of which327121 are males and 290887 are females The total rural population in the district is217514 and the urban population is 400494 The population density is 424 persons sq kmagainst the state average of 550 personssq km
15 Climatic Conditions Rainfall and ClimateThe climate of the district is classified as sub-topical steppe semi-arid and hot which is
mainly dry except in rainy months and characterized by intensely hot summer and cold winterThe Normal Annual Rainfall is 449 mm in 24 days which is unevenly distributed over the
district Normal Monsoon Rainfall is 349 mm The southwest monsoon sets in last week of Juneand withdraws towards end of September and contributes about 78 of annual rainfall Julyand August are the wettest months The remaining 22 of the annual rainfall occurs duringnon-monsoon months of the year in the form of thunder storm and western disturbancesRainfall in the district increases from southwest to northeast
16 Geomorphology amp Soil TypeThe study area forms a part of the Sutlej Basin and exhibits gradational landforms
mainly fluvial formed by sediments On the whole it exhibits a low-lying flat topographygenerally sloping towards southwest except few linear depression occupied by palaeo-bluffand palaeo channel near Pakka and southeast of Kamiyana Villages and by sand dunes whichare concentrated in northwestern and southern part of the study area Because of theexceptionally flat topography there is not much development drainage system
The Study area forms a part of Punjab Plain and is sub-divided into the following threeregions on the basis of soil topography climate and natural vegetation
a Faridkot Hathar- Sadiq- Sandy Plain This part extends over Sadiq town part of thedistrict commonly known as Hathar area This part of the district has a large numbers ofsand dunes and wind blown sand has its own effect on the fertility of soil
Aquifer Mapping and Management Plan of Faridkot District Punjab State
Page | 3
Fig1 Base map of Faridkot District
Aquifer Mapping and Management Plan of Faridkot District Punjab State
Page | 4
b Faridkot Uttar- Dhudhi- sandy-loamy This part of Faridkot district extends over DhudhiKot Sukhia Tehna and is known as Uttar area The soil is sandy loam Due to extensionof agriculture and irrigation there is apparent disappearance of sand dunes to a greatextent which have been leveled up generally
c Jaitu Area- Sandy Loam to Loam This region extends over and around Jaitu tehsil Thetexture of the soil is sandy loam to loam This area is known for the best staple ofcotton Most of the area is covered under sandy soil followed by clayey soil except somepatches where there is appreciable thickness of top clay layer varying from 67 to 167m
The study area is developed by Indo Gangetic Alluvium main landforms are Alluvial Plain Sandsheets Sand dunes and Palaeo Channels Alluvial plain forms the major part of the areafollowed by Sand Sheets and Sand dunes as patches Palaeo channel is occurred in central partof the study area
The soils classes are mainly loams loamy sand sandy to fine sandy loams and siltyloams Loamy sand is covered in major part of the study area
The combined studies on fluvial geomorphology and Remote sensing studies in northwestern region are carried out by IITs and Delhi University It has been observed that the hugeflood depositions by River Ghaggar Saraswati and other minor rivers at different time intervaland channel migrations in different ages and also Aeolian depositions caused sand dunes indifferent time interval leads to difficulty in aquifer grouping The studies are also conformedthrough sedimentological core sampling analysis during the project The observations areunderstood by regional geomorphology and channels migrations which shown in the belowFig2
Fig2 Fluvial Geomorphological Studies carried out to understand the SubsurfaceAquifer System in North Western Regions
Aquifer Mapping and Management Plan of Faridkot District Punjab State
Page | 5
17 Land Use Land CoverBased on the visual interpretation of satellite data and topographical data land
useland classes have been identified The main classes are Built Up land Agricultural landforestland Land under non agriculture use current fallows and water bodies The Land usepatterns are given in below tableLand use pattern of Faridkot district Punjab (wwwagripbgovin)
Type of Land use Area (ha)
1 Total Geographical area 1419002 Forest 20043 Land put to non-agricultural use 16719 (11)4 Current Fallows 22395 Net area sown 126678 (89)6 Gross cropped area 2529897 Cropping intensity 200
18 River System and Water Resources
No river is flowing through the area but there are some drains which flow during heavyrains and serve as natural drainage The main drains are Tarobri Drain Mari Drain Samadh BhaiDrain and Chand Bhan Drain (Fig3) There is a good network of canals and these passes throughthe area The main canals are Bikaner Canal Sirhind Feeder Rajasthan Feeder Abohar andBathinda branches of Sirhind Canal Bikaner Canal and Bathinda Branch of Sirhind Canal passesthrough northwestern and southeastern margins of the district and Sirhind Feeder RajasthanFeeder Abohar Branch of Sirhind Canal run through the entire length of district in north-southand northeast-southwest directions respectively (Fig4) Sirhind canal system has been servingthe district for irrigation since long time There are large water bodies near Khara PanjgrainJaito Mandi Wara daraka and in Faridkot Town These water bodies generally dry in summer
19 Agriculture amp IrrigationFaridkot is mainly an agricultural district and 70 of the population resided in the rural
areas depends up on agriculture The two main crop seasons in a year are Kharif and Rabi whichis locally known as lsquoSaunirsquo(Summer Harvest Season) and lsquoHarrhirsquo (Winter Harvest Season) Theprinciple Kharif crops are Paddy Maize Bajra Cotton Moong Mash Moth Arhar Sugarcaneetc while important Rabi crops are Wheat Barley Gram Sarson Taramera and Toria etc
Irrigation is carried out by surface water and ground water As major parts of the areaare underlain by saline water so canal water is major source of irrigation In some parts whereground water is available as fresh water lenses than irrigation is covered by skimming wellsknown as multiple well point system Kharif and Rabi is cultivated in study area under two typesof soil ie loamy sand and sandy loam and the sources of irrigation are canal as well astubewells Conjunctive use of canal water and ground water for irrigation is being carried outefficiently in this area
Aquifer Mapping and Management Plan of Faridkot District Punjab State
Page | 6
a Canal Water IrrigationMajor source of irrigation is canal where water from Sirhind canal is utilized for
irrigation The other important distributaries are Abohar Branch Dhulkot distributary systemMari distributary system Faridkot distributary Kotkapura distributary Jaitu distributaryRupana and Doda distributary system The total length of above distributaries which serve inFaridkot district is 22844 km out of which 20649 km is lined and 2185 km is unlined Grossirrigated areas of all the channels are 9025339 ha and cultural command area is 8026656 hawith 294 no of outlets Intensity of irrigation is 140
b Ground Water IrrigationWith the advent of multiple well point systems ground water irrigation is also playing
an important role in development of agriculture economy of the study area This is not onlyrelease the pressure mounted on the canal water supply but also creates the maximum storagein the unconfined aquifer for fresh ground water through return flow and canal seepage
110 IndustriesThere are no major industries in the area except rice mills in Deviwala village and few
poultry farms in the district
111 Mineral ResourcesSince the entire area is occupied by Quaternary sediments no minerals of significant
industrial use are foundAlkaline soils contain saltpetre called Kalmi Shora in local languagewhich has application in chemical oxide glass soap industry and leather tanning are found inthis area It is being extracted at Sirsari and Kot Sukhia villages It occurs as thin slightlyyellowish to dark brown encrustation on the ground surface and is found mostly over the oldhabitation sites lsquoThehsrsquo or over barren kallar lands and cattle sheds
Saltpetre is an important source of Niter (KNO3) which is used in cracker industrymatchbox manufacture and as a fertilizer
112 Water Conservation and Artificial rechargeThe north and eastern part of the area where water level is declining artificial recharge
structures may help in arresting the decline Recharge Trench with injection well structure isthe suitable for artificial recharge Water conservation methods like change in cropping patternchange in Irrigation policy lining of unlined channels timely plantation of paddy promotion ofsprinkler and drip irrigation etc may be adopted to overcome the ground water decline in thearea
Aquifer Mapping and Management Plan of Faridkot District Punjab State
Page | 7
Fig3 Drainage and Water Bodies of Faridkot District
Aquifer Mapping and Management Plan of Faridkot District Punjab State
Page | 8
Fig4 Canal and Distributaries of Faridkot District
Aquifer Mapping and Management Plan of Faridkot District Punjab State
Page | 9
20 DATA COLLECTION AND GENERATION
21 Geology and Hydrogeological dataThe area lies in the central part of Satluj basin of Indo-Gangetic Alluvial plain
Geologically the area is occupied by a thick sequence of Quaternary deposits of Mid-Pleistoceneto Recent age These comprise alternate sequence of fluvial and arid phases The exposedQuaternary Sediments can be broadly classifies as- (i) Older Alluvium of Middle to UpperPleistocene age overlain by (ii) Aeolian deposits of Holocene age The provenance of OlderAlluvium deposited by rivers originated from Himalayas and Aeolian deposits have been laiddown by wind action from Thar Desert of Rajasthan in the southwest part of the area Thegeneralized stratigraphic sequence of the area are given belowGeneralized Stratigraphy Faridkot District (After Garg amp Singh 1993)Age Lithological Unit Lithological Characteristics
Holocene Aeolian Flat Unconsolidated thin veneer of Aeolian sand
Newer Dunes Unconsolidated orange brown sand and silt
Semi consolidated dunes Semi consolidated light to dark brown sand
Older dune Dark brown Aeolian sand and silt withsome vegetal matter
Mid to UpperPleistocene
Older Alluvium Multi-cyclic light grey to brown fine tomedium grained mixture of clay silt andsand with Kankar Light grey to pink stickyclay grayish mica sand with kankar
-----Basement not exposed----
The Principle Aquifer in the study area is Alluvium and the Major Aquifers are OlderAlluvium and Aeolian Alluvium (Fig5) The Ground water occurs in unconfined (water table) andconfined conditions
211 Water Level BehaviorTwenty three monitoring stations of Central Ground Water Board (CGWB) (7
Piezometers and 16 Dugwells) and Eighteen monitoring stations (18 Piezometers) of StateGovernment represent the first aquifer Second and third aquifer is represented by onemonitoring station of CGWB Depth to water level in the area ranges from 145 to 1819 m bglduring pre-monsoon period (Fig6) and 120 to 2015 m bgl during post monsoon period (Fig7)In eastern part water levels are in the range of 10 to 20 m in central part the water levels are inthe range of 5 to 10 m bgl and in western part the water levels are shallower in the range of 2to 5 m Seasonal water level fluctuation shows a rise and fall in the range of 110 to (-) 200 m inwestern and eastern part of the districts respectively during year 2015
Aquifer Mapping and Management Plan of Faridkot District Punjab State
Page | 10
Hydrograph of Different Observation Wells
Fig5 Major Aquifers
Aquifer Mapping and Management Plan of Faridkot District Punjab State
Page | 11
Fig6 Depth to Water level Pre Monsoon 2015
Aquifer Mapping and Management Plan of Faridkot District Punjab State
Page | 12
Fig7 Depth to Water level Post Monsoon 2015
Aquifer Mapping and Management Plan of Faridkot District Punjab State
Page | 13
22 Water Quality DataGround water quality of shallow aquifer (Aquifer-I) is assessed on the basis of chemical
data of National Hydrograph Network stations ie NHNS monitored during Pre monsoonperiod Twenty four groundwater samples are collected during NHNS 2015 and chemicalanalysis is given in Annexure-I The chemical quality of deeper aquifers has to be assessedduring ongoing groundwater exploration programme under NAQUIM
Chemical data of shallow aquifer indicates that ground water is alkaline in nature TheElectrical Conductivity (EC) values ranges from 444 to 8653 microScm at 25oC indicating fresh tomoderately saline The EC values less than 1000 microScm at 25oC have observed at four locationsie Jand Sahib (444) Devi wala (476) Mehmuana (550) and Arianwala (700) respectively TheEC values more than 3000 microScm at 25oC have observed at six locations ie Tehna (8653) BajaKhana (3988) Nangal (3487) Kot Kapura (3299) Mumara (3212) and Sukhanwala (3126) Theground water occurring in the central and south-eastern parts are marginally to highly salineand not suitable for drinking purposes
The chloride concentration in ground water varies broadly between 28 mgl atAriyanwala and also 1544 mgl at Tehna Ground water with fluoride above 15 mgL are foundmainly in Nathuwala (603) Killi (429 ) Kot Kapura (333) Dhilwan kalan (285) Moharewala(195) and Bir Sikhanwala (184) and Nitrate concentration in groundwater above permissiblelimit 15 mgl are found in Kot kapura (144) Killi (140) Dal Singhwala (136)Tehna (118)Nangal (104) Bir Sikhan wala (89) Nathuwala (79) Chand baja (79 ) Wara Daraka (66) Shersinghwala (65) and Sukhanwala(46) The USSL diagrams used for classification of irrigationwater based on EC and SAR shown below observed that ground water occurring in Faridkotdistrict falls under C4S3 C2S1 C4S4 C3S1 C3S3 and C3S2 classes of irrigation classification
Aquifer Mapping and Management Plan of Faridkot District Punjab State
Page | 14
Such waters when used continuously for irrigation they are likely to cause salinityhazards and lead to reduction in crop yields Plot of USSL diagram indicates that ground watersfall under C2S1 and C3S1 classes of irrigation rating
Analysing mechanism and equipments used for chemical analysis are given in table-1Table-1 Analytical methods and equipments used for chemical analysis
S No Parameters Analytical Methods
A Physico-chemical analysis
pHConductivity (EC)Carbonate amp bicarbonate (CO3HCO3)Chloride (Cl)Sulphate (SO4)Nitrate (NO3)Fluoride (F)Total hardness (TH)Calcium (Ca)Magnesium (Mg)Sodium (Na)Potassium (K)Total Dissolved Solids (TDS)
Electrometric methodElectrical conductivity methodTitrimetric methodArgenotometric methodNephloturbidity method
Spectro-photometric methodIon metric methodEDTA-Titri metric methodEDTA-Titri metric methodBy differenceFlame photometric methodFlame photometric methodGravimetric
B Trace elementsHeavy metals
Copper (Cu)Cadmium (Cd)Chromium (Cr)Lead (Pb)Manganese (Mn)Nickel (Ni)Cyanide (Cn)
Iron (Fe)
Digestion followed by AtomicAbsorption Spectrophotometer
(AAS)
Spectrophotometer method
Aquifer Mapping and Management Plan of Faridkot District Punjab State
Page | 15
Fig8 Hill-Piper diagram for Groundwater Quality of Shallow Aquifer of Faridkot District
Aquifer Mapping and Management Plan of Faridkot District Punjab State
Page | 16
Fig8 Groundwater Quality 2015
Aquifer Mapping and Management Plan of Faridkot District Punjab State
Page | 17
23 Geophysical data
To delineate fresh water - saline water interface laterally as well as vertically surfacegeophysical investigations have been carried out in alluvial tracts over parts of the study areaUnder surface geophysical investigations total 44 VES (Fig9) in an area of 1800 sq km wereconducted with current electrical separation of 600 to 1000 m
Fig9 VES Locations in Faridkot District
Aquifer Mapping and Management Plan of Faridkot District Punjab State
Page | 18
Subsurface geophysical investigations include borehole logging The ground waterquality data pertaining to the CGWB exploratory boreholes indicate vertical and lateralvariation in EC values Shallow ground water quality data shows clearly the existence of salinityat shallow depth in the many parts of study area such as Pakka Mahmuana ShirinwalaShersinghwala Dohak Kamiyana Kingra and many other places Electrical conductivity (EC) ofground water is more than 2000 microS cm in major part of the area except at few places Slightimprovement in quality of ground water at deeper depth as compared to shallow depth hasbeen observed at few places These places are Chuggewala Golewalla Nangal Deepsinghwalawhere EC of ground water was found to be within 2000 microS cm within the depth range of 80 to120 m
24 Exploratory drilling State - Data AvailabilityThe Lithologs of Exploratory Well Observation well Piezometer productive wells of
CGWB Punjab State Tubewell Corporation (PSTC) now as Punjab Water ResourcesDevelopment and Management (PWRDM) WRED ( Water Resources and EnvironmentDirectorate) Water Supply and Sanitation (WSS) and Private Wells have been collected andthose supported electrical logs have been validated for aquifer map preparation The details areshown in Table-1
Table-1 Data Availability of Exploration Wells of Faridkot district
SlNo Source of data Depth Range (m) Totallt 100 100-200 200-300 gt300
1 CGWB 2 1 1 8 122 WREDPSTCWSS 15 1 0 3 193 PRIVATE WELLS 1 0 1 0 2Total 18 2 2 11 33
25 Spatial Data DistributionThe actual data of all the wells in the area are plotted on the map of 150000 scale with
5rsquoX5rsquogrid (9 x 9) km (Fig 10) Perusal of table shows that majority of tube wells falls in theshallow aquifer having depth less than 100m and deeper aquifer having depth more than 300mThe grids formations devoid of groundwater exploration are identified as data gaps and theseare to be filled by data generation The Physical record of the availability of exploration data aregiven in Annexure-II
Aquifer Mapping and Management Plan of Faridkot District Punjab State
Page | 19
Fig10 Locations of Exploration Data Availability
Aquifer Mapping and Management Plan of Faridkot District Punjab State
Page | 20
30 DATA INTERPRETATION INTEGRATION AND AQUIFER MAPPINGAll the available data have been validated to generate aquifer map The deepest well in
each quadrant is selected and plotted on the map of 150000 scale with 5rsquoX5rsquogrid (9 x 9) km(Fig11)
Fig11 Locations of validated exploration data
The optimized wells of CGWB PWRDM WRED WSS and Private Wells have been usedto prepare the elevation or collar elevation map to identify the topographic variations onground surface so that it can give the synoptic picture of gradient variations in the water levels
Aquifer Mapping and Management Plan of Faridkot District Punjab State
Page | 21
The topographic elevation values have been plotted to prepare the elevation contour map(Fig12) The locations of validated wells in quadrant and toposheet wise distributions inrespective blocks are given in Table-2 Locations of validated exploratory wells with litholog areshown in Fig13
Fig12 Elevation contour map
Fig13 Locations of validated exploratory wells with Litholog
Aquifer Mapping and Management Plan of Faridkot District Punjab State
Page | 22
Table -2 Summary of optimized exploration wells
Block ToposheetQuadrant Depth Range (m) Elevation(m amsl)
Source ofdata
Location lt 100 100-200 200-300 gt300Faridkot 1A 44J06 Dip Singh Wala - - - 350 201 CGWBFaridkot 3C 44J09 Golewala - - - 34378 1995 CGWBFaridkot 1A 44J14 Tehna - - - 300 205 CGWBFaridkot 3A 44J14 Bhagthala - - - 37195 198 PSTCFaridkot 1A 44J10 Sadhuwala - - - 35970 196 PSTCKot Kapura 1C 44J15 Dal Singhwala - - - 300 211 CGWBKot Kapura 1B 44J15 Jaito Mandi - - - 41920 203 CGWBKot Kapura 2A 44J14 Kot Kapura - - - 42190 206 CGWBKot Kapura 3B 44J14 Nanak Nagri - - 2134 - 210 PRIVATEKot Kapura 1B 44J14 Nangal - - - 300 206 CGWBKot Kapura 3A 44J14 Wara Daraka - - - 300 205 CGWBKot Kapura 2C 44J14 Aulakh - - - 38414 211 PSTCKot Kapura 2B 44J14 Deviwala - - 269 - 207 CGWBMuktsar 2B 44J10 Dohak - 163 - - 197 CGWBGhal khurd 3B 44J09 Toot - - 217 - 196 CGWB
Two exploratory wells from adjacent districts ie Dohak from Muktsar district and Toot from Ferozpur district have beenincorporated for the preparation of lithological fence and cross sections
Aquifer Mapping and Management Plan of Faridkot District Punjab State
Page | 23
31 Sub Surface Disposition311 Previous Work
To delineate and determine the potential aquifer zones evaluation of aquifercharacteristics etc Exploratory drilling was conducted by CGWB at 6 locations in the districtincludes 05 exploratory wells and 1 slim hole between 1975 to 2008 through in-house activitiesand 02 exploratory wells and 2 piezometers through outsourced by Ms WAPCOS Ltd between2011 to 2015 (Fig10) The drilling has been carried out to a maximum depth of about 408 m(Kot Kapura) and revealed the presence of 6 to 12 prominent permeable granular zones withaggregate thickness varying from 28 to 283 m The granular zone consists of fine to mediumsand The slim hole at Golewala and exploratory well at Kot Kapura have abandoned due topoor quality of formation water upto depth of 350m bgl
Further the study of exploratory boreholes drilled in the district revealed the presence ofmultiple aquifer groups up to the maximum drilled depth of 408 m The first aquifer group formsvery shallow water table aquifer (IA) and occurs down to 57 m Below that clay layer starts gettingthickened to about 8-10m separating Aquifer IB down to 120 m The below multi aquifers behavesas semi-confined to confined and consisting of thin sand layers alternating with thicker clay layersOverall flow of ground water is towards south-west direction Further the study of exploratoryboreholes drilled in the area revealed that the area is considered as a single aquifer system up tothe maximum depth of 300 m
312 Present NAQUIM StudyTo understand the sub surface disposition in the study area geological sections and
fence diagram have been prepared by synthesizing the various sub-surface sections on the basisof study of the lithological logs and electrical logs of boreholes drilled by CGWB WRED PSTCand Private Agencies using the RockWorks15 software and a 3D lithological model has beenprepared (Fig14) The 2D lithology sections and 3D lithological fence diagram has beenprepared using lithology model and are shown in Fig15a b amp 16 respectively The aquifers arecomposed of fine to medium sand with clay intercalations The granular zones are extensiveThe aquifer occurring below 252m depth are composed of very fine to medium sand with silt
Based on geophysical borehole logging and use of resistivity profiling followed by thedepth soundings at few selected places fresh-saline water zones are demarcated This analysisis extremely important for the present study and will be referred from time to time as it isobviously the higher resistivity beds represents freshwater zone in contrast in low resistive bedsindicating saline groundwater zoneFig14 3-Dimension Lithological Model
Aquifer Mapping and Management Plan of Faridkot District Punjab State
Page | 24
The major aquifer system of the area is Quaternary alluvial deposits having Older and Aeolianalluvium which mainly comprises of sand silt and clay The top surface layer is mainly silty clayThe lithology along W-E direction shows the variation in lithological thickness ie thin clay layersinter bedded with sand except at Nangal where thick clay layers were identified at 55 m bglThere is inter-layering of sand and clay with thick clay at Golewala and Bhagthala towardswestern side at a depth between 150m to 210m bgl There is thick a inter-layering of sand andclay towards all lithologs except Nanak Nagri shows thin sequence of sand and clay towards SWLithological data of wells are given in Annexure-III
Fig15ab 2-Dimension Lithological Sections
SWE
Aquifer Mapping and Management Plan of Faridkot District Punjab State
Page | 25
Fig16 3-Dimension Lithological Fence
Aquifer Mapping and Management Plan of Faridkot District Punjab State
Page | 26
32 Aquifer Geometry
The aquifer group embodies a number of granular layers alternating with clay lenses Afew clay layers intervening these aquifer groups pinch out against the sand zones at few placesThe marker horizons are traced all over the area by connecting their tops and bottoms Sandyclay layer occurs at the surface covering the unconfined aquifer which is in turn underlain byprominent clay zone It is composed of mainly of medium sand with thin beds of fine sand
Aquifer IA (Very Shallow Aquifer) extends maximum upto 70 m of depth and below thatclay layer starts getting thickened about 10-12m separating Aquifer IB to a maximum depth of123 m Multi layer aquifers are existing in the area each aquifer is separated by thick clay zonesof 25 to 40 m upto 300m depth (Annexure IV) Based on the same criteria to know the broadpicture of the aquifer disposition inter-relationship of granular zones nature geometry andextension of aquifers in the study area the aquifer grouping has been carried out using the sub-surface lithology and a 3-Dimensional aquifer model (Fig17) and aquifer disposition 3D fencediagram has also been prepared using the aquifer model (Fig18) Various groups identified inthe area are given in Table-3 It is very difficult to differentiate the aquifer groups after AquiferGroup I so the whole lithology is considered to be a single aquifer group system The firstaquifer is water table aquifer and extends all over the area The aquifer is mainly composed offine to coarse grained sand
Table-3 Aquifer Grouping in Faridkot DistrictAquifer Group Range Thickness
From To Min Max
Aquifer IA 4 70 29 50
Aquifer IB 64 123 21 52
Multiple Aquifers 133 300 21 85
Fig17 3D Aquifer Disposition Model
Aquifer Mapping and Management Plan of Faridkot District Punjab State
Page | 27
Fig18 3D Aquifer Disposition Fence
Aquifer Mapping and Management Plan of Faridkot District Punjab State
Page | 28
40 GROUND WATER RESOURCESGround water resource estimation of the area have been carried out by taking Dynamic
and In-storage resources of unconfined aquifer and confined aquifer present upto 300m depthThe assessment of dynamic ground water Resources of the study area have been carried outjointly by CGWB and Water Resources and Environment Directorate (WRED) Department ofIrrigation Punjab on the basis of Ground Water Estimation Committee (1997) methodology
The occurrence of potential aquifers (productive granular zones) upto 300 m depth hasbeen demarcated on basis of aquifer wise subsurface mapping The total saturated thickness ofgranular zones was derived from the exploratory borehole data of a particular block Thegranular zones occurring below the zone of water level fluctuation up to the first confining layerhas been considered as static unconfined zone The specific yield value for the unconfinedaquifer has been taken as 60 of 012 which comes as 0072 whereas for the confined aquiferthe storativity value has been considered Since the specific yield is likely to reduce withincrease in depth due to compaction of overlying sediments
Hence the major data elements considered in this estimation are thickness of granularzones specific yieldstorativity and area of both fresh water and salinebrackish water It hasbeen observed that in some of the blocks sufficient data on probable occurrence of granularzones was not available In those cases the existing exploratory data of adjoining blockdistricthas been either extrapolated or interpolated to derive such parameters required for estimationThis assessment of total groundwater resources has been computed based on the availabledata with CGWB amp WRED Department of Irrigation and Punjab
41 Groundwater Resources up to depth of 300ma Dynamic Resources
Block-wise ground water resource potential of the district has been assessed as perGEC-97 as on 31st March 2013 The primary source of recharge in the area is the rainfall Theground water development in all the blocks has exceeded the available recharge thus all theblocks have been categorized as over exploited The overall stage of ground water developmentin the Faridkot district has been assessed to be 160 The block wise details are given in belowTable-4
Table 4 Dynamic Ground Water Resource amp Development Potential (31032013) in mcmAssessmentUnit Block
NetAnnualGroundWater
Availability
ExistingGross
GroundWater Draft
forirrigation
ExistingGross GroundWater Draftfor domestic
andindustrial
water supply
ExistingGross
GroundWater
Draft forAll uses(11+12)
Provision fordomestic
andindustrial
requirementsupply to
2025
Net GroundWater
Availabilityfor futureirrigation
development(10-11-14)
Stage ofGroundWater
Development(1310)
100()
Category
Faridkot 34632 52861 1911 54771 2219 -20448 158Over
Exploited
Kot Kapura 26821 42020 1402 43421 1511 -16709 162Over
Exploited
TOTAL 61453 94880 3313 98193 3730 -37157 160Over
Exploited
Aquifer Mapping and Management Plan of Faridkot District Punjab State
Page | 29
b In-storage Ground Water ResourcesAs per revised guidelines recommended by the Central Level Expert Group on
groundwater resources assessment the resources are separately considered as dynamic and in-storage unconfined In case of alluvial area in-storage resources of unconfined aquifer havebeen computed on the basis of specific yield of aquifer as detailed below
In-storageGround Water
resources(Unconfined
Aquifer)
=
Thickness of the aquifer(granularproductive zone)
below the zone of water levelfluctuation down to the bottom
layer of unconfined aquifer
x Sp Yield ofthe aquifer
x Areal extentof the
aquifer
The dynamic and in-storage ground water resource estimations have been calculated forsingle aquifer group upto 300m of each block of Faridkot district In-storage ground waterresources are estimated for fresh water and saline water resources based on the geophysicalinterpretations of depth to fresh and saline water interface for each block The fresh and salinecalculations are made on the basis of the assumptions on aquifer that is considered asunconfined aquifer so that the specific yield concept is used for resources estimations (Fig19)The detailed resources estimations are calculated in detailed table for fresh and saline waterresources in the below Table-5 6amp 7
Total Availability of Ground Water Resources = Dynamic Resources + In-storage Resources
Fig19 Conceptual figure to understand the fresh and saline water resources in the aquifer up to300 m for Resource Estimation in Unconfined and Confined Aquifer System
(The clay lenses are more dominant in the aquifer and sometimes huge thickness of clay depositsare also observed in the lithologs)
Aquifer Mapping and Management Plan of Faridkot District Punjab State
Page | 30
Table-5 Block wise In-Storage Ground Water Resources of Fresh Water Aquifer
GENERAL DESCRIPTION OF THE GROUND WATER ASSESSMENT UNIT OF DISTRICT FARIDKOT PUNJAB STATE (2013)
Type of Ground Water Assessment Unit (Block) Faridkot Blocks
SrNo
Name ofAssessment
Unit
Type offormation
Areal extent (sq km) AveragePre-
monsoonWaterLevel
(m bgl)
Depth tobottom of
Aquiferbased on
Geophysical Interface
amp Boreholelogging(m bgl)
TotalThickness
offormation
belowPre-
monsoonWaterLevel(m)
(7-6)
Totalthickness
of theGranularZones up
to thedepth of
FreshWaterZones
(m)
Thicknessof the
unsaturated
granularZones up
to Pre-monsoon
WL(m)
Thicknessof the
saturatedgranularZones up
to thedepth of
Freshwater
aquiferbelow (m)
(9-10)
AverageSpecific
Yield
In-StorageGroundWater
Resourcesup to thedepth of
FreshWater
Aquifer(ham)
51112
TotalGeographical Area
AssessmentArea
FreshWater
1 2 3 4 5 6 7 8 9 10 11 12 13
1 Faridkot Alluvium 75210 36710 450 152 1475 72 2 69 0072 182375
2
KotKapura Alluvium 66650 61650 1069 106 9531 51 3 48 0072 213062Dist Total (ham) 141860 228406 395438Dist Total (mcm) 3954
ham hectare metremcm million cubic metre
Aquifer Mapping and Management Plan of Faridkot District Punjab State
Page | 31
Table-6 Block Wise In-Storage Ground Water Resources of Saline Aquifers upto 300 m Depth
GENERAL DESCRIPTION OF THE GROUND WATER ASSESSMENT UNIT OF DISTRICT FARIDKOT PUNJAB STATE (2013)Type of Ground Water Assessment Unit (Block) Faridkot BlocksSrNo
Name ofAssessment
Unit
Type offormation
Areal extent (ha) Depth tobottom of
Aquifer basedon Geophysical
Interface ampBoreholelogging(m bgl)
Depth tobottom of
Saline WaterAquifer
based onGeophysicalInterface ampBorelogging
(m bgl)
Totalthickness
of theSaline
Water upto the max
depth(m)
Totalthickness of
theGranular
Zones up tothe depth of
SalineWaterZones
(m)
AverageSpecific
Yield
In-StorageGroundWater
Resourcesup to thedepth of
SalineWater
Aquifer(ham)
51011
TotalGeographical
Area
AssessmentArea
Saline Water
1 2 3 4 5 6 7 8 9 10 111 Faridkot Alluvium 75210 38500 152 300 148 103 0072 2855162 Kot Kapura Alluvium 66650 5000 106 300 194 76 0072 27360
Dist Total (ham) 141860 228406 312876Dist Total (mcm) 3129
ham hectare metremcm million cubic metre
Aquifer Mapping and Management Plan of Faridkot District Punjab State
Page | 32
Table-7 Block Wise Total Availability of Fresh and Saline Groundwater Resources upto 300 m Depth and Volume of unsaturatedgranular zone after 3m upto water level
BLOCK WISE AVAILABILITY OF TOTAL GROUNDWATER RESOURCES IN FARIDKOT DISTRICTSlNo BLOCK Volume of
UnsaturatedGranular Zone
up to Pre-monsoon WL
DynamicGroundwater
Resources(2013)
AQUIFER-I
In-storageGroundwater
Resources UPTOFRESHWATER
Total FreshGroundwater
Resources[(4)+(5)] (HAM)
Total SalineGroundwater
Resources[(3)+(4)](HAM)
Total Availability ofGroundwater
Resources [(6)+(7)]
ham mcm
1 2 3 4 5 6 7 8 91 Faridkot 10830 34632 182375 217007 285516 502523 50252 Kot Kapura 14396 26821 213062 239883 27360 267243 2672
DistTotal (ham) 25227 61453 395438 456891 312876 769767 7698DistTotal (mcm) 252 615 3954 4569 3129
ham hectare metremcm million cubic metre
Aquifer Mapping and Management Plan of Faridkot District Punjab State
Page | 33
50 GROUND WATER ISSUES
51 Ground Water DepletionThe Study area is famous for its paddy and non paddy cultivation The quality of ground
water in the area is suitable for irrigation and drinking purposes therefore the ground water isconstantly being pumped for the irrigation due to its easy access through tube wells at shallowdepths and they are the main source of irrigation This will lead to its deepening of groundwater levels in blocks of Faridkot and Kot Kapura of Faridkot district as the recharge of thegroundwater through rainfall and other sources are less than the overall extraction Thehydrographs also shows the declining water level trend over the years in the district (Fig20) andis categorized as over-exploited This declining water table trend if not checked would assumean alarming situation in the near future affecting agricultural production and thus economyGround Water Recharge and Conservation may be carried out in these areas to overcome thedepletion Other than the groundwater depletion quality and rising water table are the otherissues
Fig20 Long term ground water table variation
52 Rising Water tableIn western parts of the area water table is rising due to less withdrawal of ground water
because of brackish saline quality coupled with easy availability of canal water for domesticand irrigation purposes As such these areas are likely to get water logged in near future Thereis an urgent need to arrest the rising water trend in western part and implement anti-waterlogging schemes
Aquifer Mapping and Management Plan of Faridkot District Punjab State
Page | 34
53 Ground Water QualityThe ground water of the study area is alkaline in nature Ground water in the area is
generally fresh to marginally saline with fluoride concentration above permissible limit (15mgL) are found mainly in Nathuwala (603) Killi (429) Kot Kapura (333) Dhilwan Kalan(285)and Bir Sikhanwala (184) Nitrate concentration above permissible limit (45mgl) are found inSukhanwala (46) Sher singhwala (65) Wara Daraka (66) Dhilwan Kalan (72)Nathuwala (79)Chand Bhaja (79) Bir Sikhanwala (89) Nangal (104) Tehna (118) Dal Singhwala(136) Killi (140)and KotKapura (144) and iron concentration above permissible limit (15 mgL)are observed inDeviwala (177) There is growing concern on deterioration of ground water quality due togeogenic and anthropogenic activities
54 Ground Water Irrigation ScenarioAs per the data available from minor irrigation census 2005-06 the detailed number of
shallow deep tube wells lined unlined water distribution system land holdings of wells aregiven in Table-89 amp10
Table-8 Distribution of Tube wells According to Well Ownerrsquos land holding SizeType of
Tube well(TW)
Marginal(0-1 ha)
Small(1-2 ha)
Semi-Medium(2-4 ha)
Medium(4-10ha)
Big(gt10ha)
Total
Shallow TW 1100 4029 10069 14576 5314 35088
Deep TW 29 197 596 1188 468 2478
Total 1129 4226 10665 15764 5782 37566
Table-9 Distribution of Tube wells According to DepthDepth of Tubewells in metres Total depth
Range0-150m
Depth range 0-20 m 20-40 m 40-60 m 60-70 m 70-90m 90-150m gt150 m
Tubewells 3507 9947 9998 11636 543 1744 191 37566
Tubewells () 9 26 27 31 1 5 1
Table-10 System of Ground water distribution deviceOpen Water Channels
Linedpucca Unlinedkutcha Others Total2093 35455 18 37566
Aquifer Mapping and Management Plan of Faridkot District Punjab State
Page | 35
60 MANAGEMENT STRATEGIES AND AQUIFER MANAGEMENT PLAN
Aquifer mapping is leads to groundwater management plans to be implemented byincluding demand side-management and Ground Water Use Efficiency
An outline of the Aquifer Management Plan for each block is given in Part-II Thisincludes details regarding population rainfall average annual rainfall agriculture and irrigationwater bodies ground water resource availability ground water extraction and water levelbehavior Aquifer disposition and various cross sections have also been given Ground waterresources extraction and other issues including ground water resource enhancement anddemand side innervations have been given
Artificial recharge plan is less feasible in the Faridkot District due to very low availabilityof volume of surplus water (959 mcm) Another focus has been given to minimize the grossdraft by enhancing ground water use efficiency in irrigation system after replacing the waterdistribution system from unlinedkutcha channel to Under Ground Pipeline System (UGPS) inover exploited blocks of the district
61 Scope of ImplementationThis plan is focusing on the technical aspects of the ground water recharge through
various means so that various implementing agencies may get the appropriate technicalguidelines The existingongoing schemes of the central or state govt like MANERGA IWSPPMKSY (Prime Minister Krishi Sinchai Yojna) NABARD funded schemes Urban Developmentschemes departmentally funded projects etc may be benefitted from the recharge plan byincorporating the input in the operational guidelines design and for locating the specific sites
Agriculture University engineering Collages Academic and Research Institution NGOmay also take up the pilot or demonstrative projects in the blocks suitable to them to plan atlocal level as per local conditions
62 Potential of Enhancing the Ground Water Use EfficiencyThe micro level transformation in the ground water management have vast impact
potential to counter extensive ground water depletion faced in the state of Punjab particularlyin overexploited blocks
There are around 35455 (out of 37566) tube wells (9438 ) operated by farmers forirrigation through unlinedKutcha open channel system in study area (Table-10) where waterfrom the tube well is discharge to the agricultural field In this process huge (around 25 )(RKVY 2015) quantity of ground water is wasted in soil moisture and evaporation losses
Around 95 of the tube wells are of shallow depth (20 to 70m) and remaining wells aredeeper depth (70 to gt150 m) existed in the area (Table-9) Thus majority of wells are tappingshallow aquifer which is under stress
Dynamic ground water resources (2013) indicate that Gross ground water draft forirrigation in the district is estimated at 94880 mcm It is expected that around 25 of overdraft can be brought down by switching over to undergroundsurface pipeline based
Aquifer Mapping and Management Plan of Faridkot District Punjab State
Page | 36
distribution from the prevailing unlined open channels Thereby gross draft will be reduced to224 mcm (Table-11a) assuming that there is no crop diversification by the farmers
The benefit will lead to saving of precious ground water resources in overexploitedblocks The measure if implemented will bring down the ground water overdraft from 160 to123 The category of the blocks will also improve resulting in boosting of agriculture andindustrial development otherwise not sustainable in over-exploited blocks (Table-11b)
The tube wells also consume enormous electricity which is subsidized and governmentincur significant revenue on this account The measures therefore will result in saving of energyand money Pollution impact will be reduced whenever diesel engines are used by the farmersThe environmental and ecological condition in the irrigated land will improve Unwanted weedgrowth will also be controlled inside the farm land It is expected to save 1 of the agriculturalland occupied by open channels which can be utilized for cultivation purpose Heavy groundwater overdraft can be reduced by these efforts This will ensure more crops per drop
63 Water saving Potential from Crop Diversification-Change Paddy to MaizeSoya-beanAs the requirement of water for paddy is much high therefore by changing paddy to
maizesoya-bean will help in saving of water For estimating the water saving by cropdiversification it is assumed that one mcm of water will be saved in case of maize or soyabeanplanted in one sq km of land In case of pulses even higher amount of ground water can besaved
The block wise saving of water in mcm by applying various management strategies suchas crop diversification Under Ground Pipe lines (UGPL) in individual land and artificial rechargemethods are given in tables 11a b
Table-11a Scope of Quantitative Impact on Stage of Development after applying variousmanagement strategies in mcm
Block Net GroundWater
Availability(mcm)
TotalIrrigation
Draft(mcm)
PresentStage of
draft(SOD)
() (Asper
2013)
Reduction in draft by different watersaving method
SODafterwards
()
Change ofpaddy
cultivationarea ( ofexisting)
Replacewater
coursesby UGPipes
(mcm)
AdoptArtificialrecharge
(mcm)
ChangePaddy
toMaize(mcm)
Total(mcm)
(2+3+4)
1 2 3 4 5Faridkot 34632 52861 158 12472 484 7245 20201 9969 -
Kot Kapura 26821 42020 162 9915 475 6264 16654 9986 -Total 61453 94880 160 22387 959 13567 36913 9948
Aquifer Mapping and Management Plan of Faridkot District Punjab State
Page | 37
Table-11b Impact on Stage of Development (SOD) after applying various managementstrategies in Faridkot District
Block PresentSOD ()
as on2013
Reductionin SOD ()
afterunlinedchannel
()
ResultantSOD ()
Col(2 - 3)
Reduction inStage of
developmentafter crop
diversificationby
MaizeSoyabean()
ResultantSOD ()
Col(2 - 5)
Reduction inStage of
developmentafter Artificialrecharge ()
ResultantSOD ()
Col(2 - 7)
1 2 3 4 5 6 7 8Faridkot 158 3601 12199 2090 13710 140 15660
KotKapura 162 3697 12503 2340 13860 177 16023
Total 160 3664 12336 2210 13790 178 15822
By adopting all the management strategies resulting in total reduction in stage of groundwaterdevelopment is 6052 Hence overall stage of development afterwards is 9948 and is givenin Table12
Table-12 Overall Stage of Development (SOD) after reduction in Faridkot
Block PresentStage of
development() as on
2013
Reduction instage of
developmentafter unlinedchannel ()
Reduction inStage of
developmentafter crop
diversificationby
MaizeSoyabean()
Reduction inStage of
developmentafter Artificialrecharge ()
TotalReduction in
Stage ofdevelopment
()
(3 +4+5)
Stage ofdevelopmentafterwards
()
(2-6)
1 2 3 4 5 6 7Faridkot 158 3601 2090 140 5831 9969
Kot Kapura 162 3697 2340 177 6214 9986Total 160 3664 2210 178 6052 9948
Aquifer Mapping and Management Plan of Faridkot District Punjab State
Page | 38
70 CONCLUSIONS1 The area lies in the central part of Satluj basin of Indo-Gangetic Alluvial plain
Geologically the area is occupied by a thick sequence of Quaternary deposits of Mid-Pleistocene to Recent age
2 The Principle Aquifer system in the study area is Alluvium and the Major Aquifers areOlder Alluvium and Aeolian Alluvium
3 Lithological characteristics of the area are Multi-cyclic light grey to brown fine tomedium grained mixture of clay silt and sand with Kankar
4 Thick layering of clay with sand at many places can be observed towards south of thedistrict at deeper depths The Ground water occurs in unconfined (water table) andconfined conditions
5 Chemical data of ground water from shallow aquifer indicates that ground water isalkaline and fresh to moderately saline
6 To delineate fresh water - saline water interface laterally as well as vertically surfacegeophysical investigations have been carried out in alluvial tracts
7 To understand the sub surface disposition geological sections and fence diagram havebeen prepared by synthesizing the various sub-surface sections on the basis of study ofthe lithological logs and electrical logs of boreholes drilled by CGWB WRED PSTC andPrivate Agencies using the RockWorks15 software
8 Aquifer IA (Very Shallow Aquifer) extends maximum upto 70 m of depth and below thatclay layer starts getting thickened about 10-12m separating Aquifer IB to a maximumdepth of 123 m Multi layer aquifers are existing in the area each aquifer is separated bythick clay zones of 25 to 40 m upto 300m depth It is very difficult to differentiate theaquifer groups after Aquifer Group I so the whole lithology is considered to be a singleaquifer group system
9 Stage of Ground Water Development of the district is 160 on the basis of Dynamicground water resources 2013 In- storage ground water resources has also beencalculated up to a depth of 300 meters
10 The fresh water resources are inadequate in aquifer upto maximum depth of 106mwhereas saline water is dominant resources below 106 m depth upto 300 m In thenorth of the district towards Faridkot block fresh water is available upto 152m depth
11 Dynamic ground water resources of the study area are 61453 mcm whereas In-storageground water resources up to fresh water zones are 3954 mcm Thus total fresh groundwater resources up to maximum depth of 152 m are 4569 mcm Total saline waterresources up to depth of 300 m are 3129 mcm
12 Main groundwater issues in the area are groundwater depletion quality and risingwater table
13 Considering the high ground water abstraction for irrigation (94880 mcm) andoverdraft (37157 mcm) it is suggested that proposed artificial recharge measures (959mcm) crop diversification measures (13567 mcm) and conserving ground waterthrough laying of underground pipe line (22387 mcm) will be useful
14 Other techniques of water saving and modern irrigation technology to be enforced tomaximize per drop of water use in the district and also to think about the hidden salinewater resources and for its utilizations
Aquifer Mapping and Management Plan of Faridkot District Punjab State
Page | 39
BLOCK WISE
AQUIFER MAPS
AND
MANAGEMENT PLAN
(PART-II)
Aquifer Mapping and Management Plan of Faridkot District Punjab State
Page | 40
I Salient Information of Faridkot Block
Block Area(in Km2)
75210 sq km
District State Faridkot PunjabPopulation Urban Population 2260
Rural Population 179432Total population 181692
Rainfall NormalMonsoon 335 mm
Non-monsoon Rainfall 35 mmAnnual Average Rainfall 349 mm
Agriculture and Irrigation Principal crops Wheat Cotton and PaddyGross cropped area 119562 sq kmNet sown area 59180 sq kmIrrigation practices Canal and Tube well IrrigationCropping intensity 202Area underGround water Irrigation 6159 sq kmSurface water irrigation 51143 sq kmNumber and types of abstraction structures 20927 Tubewells
Ground Water ResourceAvailability and Extraction
Ground water Resources AvailabilityTotal Ground Water Resources available is 5025 mcm (fresh andsaline water) up to the depth of 300m The fresh water resourcesare estimated up to the depth of 152 m on the basis of geophysicalinterpretations The potential granular zones available for freshwater are calculated as 72 m Saline water resources are estimatedon the basis of available well depth (up to 300 m) and the granularzones are counted after depth of 152 m and available zones are 103m Block is categorized as Over-Exploited as per DynamicGroundwater Resources 2013 assessment
Ground water Resources ExtractionDeeper aquifers are marginal to highly saline and not suitable forirrigation purpose as such all users are tapping shallow aquifersDrinking water supply wells of State Government tapping shallowaquifers Therefore the ground water draft could not be assessed fordeeper aquifer
Aquifer Mapping and Management Plan of Faridkot District Punjab State
Page | 41
Existing and future waterdemands
Existing Gross Ground water Draft as on 2013Irrigation 52861 mcmDomestic and industrial water supply 1911 mcmFuture water demandsIrrigation development potential (-)2045 mcmDomestic and industrial water supply up to 2025 years 2219 mcm
Water level behavior Aquifer wise water levelAquifer-IPre Monsoon 145 ndash 1522 m bglPost Monsoon 120 ndash 1310 m bglMean (10 yrs) 100 ndash (-)101 myrTrendsPre Monsoon 018 ndash (-)022 myrPost Monsoon 024 ndash (-)030 myrAquifer-IINo Monitoring stations
Aquifer-IIINo Monitoring stations
HYDROGRAPH SHOWING DECLINING WATER TABLE
Aquifer Mapping and Management Plan of Faridkot District Punjab State
Page | 42
HYDROGRAPH SHOWING DECLINING WATER TABLE
HYDROGRAPH SHOWING DECLINING WATER TABLE
Monitoring well Golewala dried after 2004
Aquifer Mapping and Management Plan of Faridkot District Punjab State
Page | 43
Aquifer Disposition
Number of aquifers 1
Principal aquifer AlluviumMajor Aquifer Older Alluvium Aeolian Alluvium
Exploratory Data AvailabilitySource of Data No of exploration wells as per depth range (m) Total
lt100 100-200 200-300 gt300
CGWB 1 0 0 4 5WREDPSTCWSS 6 1 0 2 9PRIVATE 0 0 0 0 0TOTAL 7 1 0 6 14
Aquifer wise Characteristics (CGWB 2012)AquiferGroup
Geology Type ofAquifer
ThicknessofGranularzones (m)
Transmissivity(m2day)
YieldDischarge
(m3day)
SpecificYield
Storativity
SingleAquiferSystem
Quarter-naryAlluvialdeposits
Unconfined toconfined
175 474 - 2660 939 -55944
12 (0072)
175 x 10-3
-18 x 10-3
Well field proposed in adjacent blockThe Aquifer comprises of fresh and saline water and the major aquifer material is sand Theaquiclude and aquitard comprises of clay clay with siltExploratory Data Validated
Source of Data No of exploration wells as per depth range (m) Totallt100 100-200 200-300 gt300
CGWB 0 0 0 4 4WREDPSTCWSS 0 0 0 2 2PRIVATE 0 0 0 0 0TOTAL 0 0 0 6 6
The data is validated by selecting the deepest well in each quadrant and used for preparation of3-D Litho models 2-D Geological Cross Sections Fence Diagrams and Aquifer Maps
Aquifer Mapping and Management Plan of Faridkot District Punjab State
Page | 44
3-D Lithological Model of Faridkot Block
Lithological Cross Section from Dip Singh Wala to Nangal
Lithological Cross Section from Toot to Nangal
Aquifer Mapping and Management Plan of Faridkot District Punjab State
Page | 45
3-D Lithological Fence Diagram
3-D Aquifer Disposition Fence Diagram
Aquifer Mapping and Management Plan of Faridkot District Punjab State
Page | 45
3-D Lithological Fence Diagram
3-D Aquifer Disposition Fence Diagram
Aquifer Mapping and Management Plan of Faridkot District Punjab State
Page | 45
3-D Lithological Fence Diagram
3-D Aquifer Disposition Fence Diagram
Aquifer Mapping and Management Plan of Faridkot District Punjab State
Page | 46
Ground water Resource Extraction Contamination and other issues in Faridkot Block
Ground WaterResources upto thedepth of 300m
Dynamic Fresh waterresources
34632 mcm
In-storage Fresh waterresources
182375 mcm
In-storage Saline waterresources
285516 mcm
Total 502523 mcmGround WaterExtraction (as per 2013)
Irrigation 52861 mcm
Domestic amp Industrial 1911 mcm
Future Demand for domestic amp Industrial sector(2025) (as per 2013)
2219 mcm
Stage of Groundwater Development 158
Chemical Quality of ground water Ground water in the area is alkaline and pHranges between 794 to 917 Groundwater in the area is fresh to marginal salineEC value of ground water show widevariations and ranges from 444 Scm to8653Scm at 250CRSC values vary from (ndash) 73 to 113 meqLarea is fit for irrigation
Ground water Contamination Issues Fluoride (mgl)Nathuwala (603) Killi(429)Nitrate (mgl)Sukhanwala (46) Sher Singhwala (65)Nathuwala (79) Chand Baja (79) Nangal(104) Tehna (118) Killi (140)Iron (mg)Devi wala (177)
Other issues Water level decline has been observed inmajor parts of the block due to indiscriminate development of ground waterresourcesIn shallow water level area lessdevelopment of ground water resourcecouple with recharge from canal irrigationis causing water logging and inland salinityproblems
Aquifer Mapping and Management Plan of Faridkot District Punjab State
Page | 47
Ground water Resource Enhancement Potential
Aquifer wise space available for recharge and proposed interventions (Supply Side Measures)
Aquifer-I
Volumes of unsaturated zone after 3m upto a desirable depth 10830 mcmSource water requirementavailability for recharge Rain Canal Irrigation return flowTypes and number of structures NAOther interventions proposed Artificial Recharge Roof top Rainwater harvesting will conserve484 mcm volume of water
Demand side interventions
Advanced Irrigation PracticesArea proposed to be covered Entire Block Faridkot (75210 sq km)Volume of Water expected to be conserved under advanced irrigation practices such as lining ofunderground pipelines (Kutcha channel) 12472 mcm
Required Change in cropping pattern
Proposed change in cropping pattern Paddy to Maize Soyabean The overexploitation can bemanaged at sustainable level (100) by changing the Paddy cropArea coverage 15 of the total paddy area needs to change ie7245 sq kmAnticipated volume of water to be saved 7245 mcm
Net AnnualGroundWater
Availability2013
(mcm)
TotalIrrigation Draft
(present)(mcm)
GrossDraft alluses(present)(mcm)
Paddyarea
(Sq km)
RequiredArea to
beChange
fromPaddy toMaize
soyabean
(Sq km)
Amountof
WaterSaved(mcm)
Grossdraftafter
savingof water(mcm)
PresentStage of
development ()
Reductionin Stage ofdevelopme
nt afterMaize
soya bean()
CropDiversifiedarea ()
34632 52861 54771 48300 7245 7245 45616 158 209 15
Alternate Water sourcesSurface water sources Tanks PondsLocation details and availability from such sources outside the area Not AvailableRegulation and Control
Punjab Subsoil Act for delay in paddy plantation should continue in the area
Aquifer Mapping and Management Plan of Faridkot District Punjab State
Page | 48
Other interventions proposed if anyModern Irrigation Practices be adopted for Rabi crops Some of the techniques are given in
the table below (PAU Ludhiana)
SlNo Techniques Water Saving()
Crops
1 Mulching 17 Wheat2 Bed Planting 18-25 Wheat3 Use of Sprinkler and drip
Irrigation70-90 Sugarcane Cotton Sunflower Maize
Other than that by 15 days ponding followed by 2 days of drying can lead to 25 saving of water inpaddy crop
Aquifer Mapping and Management Plan of Faridkot District Punjab State
Page | 49
II Salient Information of Kot Kapura Block
Block Area(in Km2)
66650 sq km
District State Faridkot PunjabPopulation Urban Population 373
Rural Population 221025Total population 221398
Rainfall Normal Monsoon 328 mmNon-monsoon Rainfall 61 mmAnnual Average Rainfall 370 mm
Agriculture and Irrigation Principal crops Wheat Cotton and PaddyGross cropped area 133427 sq kmNet sown area 67498 sq kmIrrigation practices Canal and Tube well IrrigationCropping intensity 198Area underGround water Irrigation 4278 sq kmSurface water irrigation 62899 sq kmNumber and types of abstraction structures 16639 Tubewells
Ground Water ResourceAvailability and Extraction
Ground water Resources AvailabilityTotal Ground Water Resources available is 2672 mcm (fresh andsaline water) up to the depth of 300 m The fresh water resourcesare estimated up to the depth of 106 m on the basis of geophysicalinterpretations The potential granular zones available for freshwater are 51 m Saline water resources are estimated on the basis ofwell (up to 300 m) and the granular zones are counted after depth of106 m and available zones are 76 m Block is categorized as Over-Exploited as per Dynamic Groundwater Resources 2013 assessment
Ground water Resources ExtractionDeeper aquifers are marginal to highly saline and not suitable forirrigation purpose as such all users are tapping shallow aquifersDrinking water supply wells of State Government tapping shallowaquifers Therefore the ground water draft could not be assessed fordeeper aquifer
Aquifer Mapping and Management Plan of Faridkot District Punjab State
Page | 50
Existing and future waterdemands
Existing Gross Ground water Draft as on 2013Irrigation 42020 mcmDomestic and industrial water supply 1402 mcmFuture water demandsIrrigation development potential (-)16709 mcmDomestic and industrial water supply up to 2025 years 1511 mcm
Water level behavior Aquifer wise water levelAquifer-IPre Monsoon 235 ndash 1600 m bglPost Monsoon 155 ndash 1820 m bglMean (10 yrs) 158 ndash (-)086 myrTrendsPre Monsoon 016 ndash (-)026 myrPost Monsoon 015 ndash (-)029 myrAquifer-II (156m)Pre Monsoon 772 m bglPost Monsoon 805 m bglAquifer-III (269m)Pre Monsoon NAPost Monsoon 820 m bgl
HYDROGRAPH SHOWING DECLINING WATER TABLE
Aquifer Mapping and Management Plan of Faridkot District Punjab State
Page | 51
HYDROGRAPH SHOWING DECLINING WATER TABLE
HYDROGRAPH SHOWING DECLINING WATER TABLE
Aquifer Mapping and Management Plan of Faridkot District Punjab State
Page | 52
Aquifer Disposition
Number of aquifers 1
Principal aquifer AlluviumMajor Aquifer Older Alluvium Aeolian Alluvium
Exploratory Data AvailabilitySource of Data No of exploration wells as per depth range (m) Total
lt100 100-200 200-300 gt300
CGWB 2 1 1 4 8WREDPSTCWSS 8 0 0 1 9PRIVATE 1 0 1 0 2TOTAL 11 1 2 5 19
Aquifer wise Characteristics (CGWB2015)AquiferGroup
Geology Type ofAquifer
ThicknessofGranularzones (m)
Transmi-ssivity(m2day)
Yield(m3day)
SpecificYield
Storativity
SingleAquiferSystem
QuaternaryAlluvialdeposits
Unconfinedto confined
127 547 -2990
3668 12 (0072) 72x10-4
Well field proposed in this block (Site Location Deviwala)The Aquifer comprises of fresh and saline water and the major aquifer material is sand Theaquiclude and aquitard comprises of clay clay with siltExploratory Data Validated
Source of Data No of exploration wells as per depth range (m) Totallt100 100-200 200-300 gt300
CGWB 0 0 1 4 5WREDPSTCWSS 0 0 0 1 1PRIVATE 0 0 1 0 1TOTAL 0 0 2 5 7
The data is validated by selecting the deepest well in each quadrant and used for preparation of3-D Litho models 2-D Geological Cross Sections Fence Diagrams and Aquifer Maps
Aquifer Mapping and Management Plan of Faridkot District Punjab State
Page | 53
3-D Lithological model of Kot Kapura Block
Lithological Cross section from Wara Daraka to Aulakh
Lithological Cross section from Nangal to Dal Singhwala
Aquifer Mapping and Management Plan of Faridkot District Punjab State
Page | 54
3-D Lithological Fence Diagram
3-D Aquifer Disposition Fence Diagram
Aquifer Mapping and Management Plan of Faridkot District Punjab State
Page | 54
3-D Lithological Fence Diagram
3-D Aquifer Disposition Fence Diagram
Aquifer Mapping and Management Plan of Faridkot District Punjab State
Page | 54
3-D Lithological Fence Diagram
3-D Aquifer Disposition Fence Diagram
Aquifer Mapping and Management Plan of Faridkot District Punjab State
Page | 55
Ground water Resource Extraction Contamination and other issues in Kot Kapura Block
Ground WaterResources upto thedepth of 300m
Dynamic Fresh waterresources
26821 mcm
In-storage Fresh waterresources
213062 mcm
In-storage Saline waterresources
27360 mcm
Total 267243 mcmGround WaterExtraction (as per 2013)
Irrigation 42020 mcm
Domestic amp Industrial 1402 mcm
Future Demand for domestic amp Industrial sector(2025) (as per 2013)
1511 mcm
Stage of Groundwater Development 162
Chemical Quality of ground water Ground water in the area is alkaline and pHranges between 820 to 893 Ground waterin the area is slightly fresh to marginalsaline EC value of the ground water showwide variations and ranges from 1154Scm to 3988 Scm at 250CRSC values are varies from -003 to 1100meqL and the area is fit for irrigation
Ground water Contamination Issues Fluoride (mgl)Kot Kapura (333) Dhilwan kalan (285)Moharewala ( 195) Bir Sikhanwala ( 184)Nitrate (mgl)Wara Daraka (66) Dhilwan Kalan (72)Moharewala (78) Bir sikhan wala (89)KotKapura (144)
Other issues Water level decline has been observed inmajor parts of the block due to indiscriminate development of ground waterresourcesIn shallow water level area lessdevelopment of ground water resourcecouple with recharge from canal irrigation iscausing water logging and inland salinityproblems
Aquifer Mapping and Management Plan of Faridkot District Punjab State
Page | 56
Ground water Resource Enhancement Potential
Aquifer wise space available for recharge and proposed interventions (Supply Side Measures)
Aquifer-I
Volume of unsaturated zone after 3m upto a desirable depth 14396 mcmSource water requirementavailability for recharge Rain Canal Irrigation return flowTypes and number of structures NAOther interventions proposed Artificial Recharge Roof top Rainwater harvesting will conserve475 mcm volume of water
Demand side interventions
Advanced Irrigation PracticesArea proposed to be covered Entire Kot Kapura Block (66650 sq km)Volume of Water expected to be conserved under advanced irrigation practices such as lining ofunderground pipelines (Kutcha channel) etc 9915 mcm
Required Change in cropping pattern
Proposed change in cropping pattern Rice to Maize Soyabean The overexploitation can bemanaged at sustainable level (100) by changing the Paddy cropArea coverage 12 of the total rice area needs to change ie 6264 sq kmAnticipated volume of water to be saved 6264 mcm
Net AnnualGroundWater
Availability2013
(mcm)
TotalIrrigation Draft
(present)(mcm)
GrossDraft alluses(present)(mcm)
Paddyarea
(Sq km)
RequiredArea to be
Changefrom
Paddy toMaize
soya bean(Sq km)
Amountof
WaterSaved(mcm)
Grossdraftafter
savingof water(mcm)
PresentStage of
development ()
Reductionin Stage ofdevelopme
nt afterMaize
soya bean()
CropDiversifiedarea ()
26821 42020 43421 52200 6264 6264 35756 162 234 12
Alternate Water sourcesSurface water sources Tanks PondsLocation details and availability from such sources outside the area Not AvailableRegulation and Control
Punjab Subsoil Act for delay in paddy plantation should continue in the area
Other interventions proposed if anyModern Irrigation Practices be adopted for Rabi crops Some of the techniques are given in
the table below (PAU Ludhiana)
Aquifer Mapping and Management Plan of Faridkot District Punjab State
Page | 57
SlNo Techniques Water Saving()
Crops
1 Mulching 17 Wheat2 Bed Planting 18-25 Wheat3 Use of Sprinkler and drip
Irrigation70-90 Sugarcane Cotton Sunflower Maize
Other than that by 15 days ponding followed by 2 days of drying can lead to 25 saving of water inpaddy crop
Aquifer Mapping and Management Plan of Faridkot District Punjab State
Page | 58
Annexure-I
Nd Not Determined BDL Below Detection Limit
Aquifer Mapping and Management Plan of Faridkot District Punjab State
Page | 59
Annexure-IIData Availability of Exploration Wells of Faridkot district
SlNo LOCATION LONGITUDE LATITUDE DEPTH ELEVATION BLOCK DEPARTMENT1 Dal Singhwala 74950 30469 300 211 Kot Kapura CGWB2 Dip Singh Wala 74483 30742 300 201 Faridkot CGWB3 Golewala 74692 30792 300 1995 Faridkot CGWB4 Jaito Mandi 74891 30446 300 203 Kot Kapura CGWB5 Kot Kapura 74814 30576 300 206 Kot Kapura CGWB6 Nanak Nagri 74893 30581 200 210 Kot Kapura PRIVATE7 Nangal 74869 30669 300 206 Faridkot CGWB8 Tehna 74790 30690 300 205 Faridkot CGWB9 Wara Daraka 74797 30548 300 205 Kot Kapura CGWB
10 Aulakh 74920 30643 300 211 Kot Kapura PSTC11 Bhagthala 74786 30777 300 198 Faridkot PSTC12 Sadhuwala 74559 30717 300 196 Faridkot PSTC13 Deviwala 74870 30612 269 207 Kot Kapura CGWB14 Deviwala-I 74870 30612 156 207 Kot Kapura CGWB15 Kouni 74675 30760 60 194 Faridkot WSS16 Ghugiana 74639 30746 60 198 Faridkot WSS17 Pahluwala 74763 30799 60 203 Faridkot WSS18 Faridkot 74763 30681 60 203 Faridkot WSS19 Doda Bhundar 75016 30470 121 212 Kot Kapura WRED20 Dhudi 74849 30700 60 207 Faridkot WSS21 Ratti Rori 74811 30647 60 208 Faridkot WSS22 Chak Kalyan 74705 30572 60 203 Kot Kapura WSS23 Kot Kapura 74812 30596 60 208 Kot Kapura WSS24 Behbal Kalan 74913 30531 60 210 Kot Kapura WSS25 Rorian Kapura 74815 30439 60 207 Kot Kapura WSS26 Panjgrain 74914 30608 70 211 Kot Kapura PRIVATE27 Fatehgarh 74943 30405 60 208 Kot Kapura WSS
28Bhurj JawarSingh 74987 30535 60 211 Kot Kapura WRED
29 Dewarana 74766 30593 30 206 Kot Kapura WRED30 Sher Singhwala 74628 30665 65 195 Faridkot CGWB31 Bir Sikhan wala 74849 30627 65 207 Kot Kapura CGWB32 Dohak 74603 30632 163 197 Muktsar CGWB33 Toot 74645 30829 217 196 Ghal khurd CGWB
Two exploratory wells from adjacent districts ie Dohak from Muktsar district and Toot fromFerozpur district have been incorporated for the preparation of lithological fence and crosssections
Aquifer Mapping and Management Plan of Faridkot District Punjab State
Page | 60
Annexure-IIILITHOLOGICAL DATA OF WELLS IN FARIDKOT DISTRICT
Well Location Depth from Depth to Lithology Thickness
Dal Singhwala
0 13 Clay 1313 20 Fresh Sand 720 28 Clay 828 57 Fresh Sand 2957 64 Clay 764 75 Saline Sand 1175 78 Clay 378 97 Saline Sand 1997 108 Clay 11
108 117 Saline Sand 9117 122 Clay 5122 134 Saline Sand 12134 157 Clay 23157 173 Saline Sand 16173 179 Clay 6179 184 Saline Sand 5184 211 Clay 27211 219 Saline Sand 8219 253 Clay 34253 259 Saline Sand 6259 278 Clay 19278 293 Saline Sand 15293 298 Clay 5298 300 Saline Sand 2
Dip Singh Wala
0 8 Fresh Sand 88 36 Clay 28
36 68 Fresh Sand 3268 755 Clay 75
755 805 Fresh Sand 5805 83 Clay 2583 92 Fresh Sand 992 93 Clay 193 109 Saline Sand 16
109 113 Clay 4113 116 Saline Sand 3116 120 Clay 4120 132 Saline Sand 12
Aquifer Mapping and Management Plan of Faridkot District Punjab State
Page | 61
Dip Singh Wala 132 146 Clay 14146 162 Saline Sand 16162 168 Clay 6168 192 Saline Sand 24192 195 Clay 3195 197 Saline Sand 2197 2015 Clay 45
2015 209 Saline Sand 75209 2135 Clay 45
2135 2175 Saline Sand 42175 221 Clay 35221 237 Saline Sand 16237 2865 Clay 495
2865 2895 Saline Sand 32895 293 Clay 35293 296 Saline Sand 3296 300 Clay 4
Golewala
0 75 Clay 7575 2885 Fresh Sand 2135
2885 40 Clay 111540 525 Fresh Sand 125
525 60 Clay 7560 88 Saline Sand 2888 93 Clay 593 103 Saline Sand 10
103 1325 Clay 2951325 1375 Saline Sand 51375 155 Clay 175155 1575 Saline Sand 25
1575 182 Clay 245182 2035 Saline Sand 215
2035 2285 Clay 252285 234 Saline Sand 55234 253 Clay 19253 2725 Saline Sand 195
2725 280 Clay 75280 2975 Saline Sand 175
2975 300 Clay 25Jaito Mandi 0 15 Clay 15
15 25 Fresh Sand 1025 28 Clay 3
Aquifer Mapping and Management Plan of Faridkot District Punjab State
Page | 62
Jaito Mandi 28 42 Fresh Sand 1442 46 Clay 446 59 Fresh Sand 1359 80 Clay 2180 915 Fresh Sand 115
915 103 Clay 115103 107 Fresh Sand 4107 1555 Clay 485
1555 1715 Fresh Sand 161715 191 Clay 195191 213 Saline Sand 22213 220 Clay 7220 223 Saline Sand 3223 238 Clay 15238 255 Saline Sand 17255 273 Clay 18273 2785 Saline Sand 55
2785 2805 Clay 22805 283 Saline Sand 25283 2985 Clay 155
2985 300 Saline Sand 15
Kot Kapura
0 14 Clay 1414 21 Fresh Sand 721 25 Clay 425 355 Fresh Sand 105
355 37 Clay 1537 50 Fresh Sand 1350 57 Clay 757 64 Fresh Sand 764 69 Clay 569 77 Fresh Sand 877 88 Clay 1188 99 Fresh Sand 1199 103 Clay 4
103 106 Saline Sand 3106 123 Clay 17123 1286 Saline Sand 56
1286 130 Clay 14130 1326 Saline Sand 26
1326 134 Clay 14134 1355 Saline Sand 15
Aquifer Mapping and Management Plan of Faridkot District Punjab State
Page | 63
Kot Kapura
1355 1492 Clay 1371492 1518 Saline Sand 261518 155 Clay 32155 1584 Saline Sand 34
1584 161 Clay 26161 1796 Saline Sand 186
1796 1812 Clay 161812 1838 Saline Sand 261838 1865 Clay 271865 2045 Saline Sand 182045 207 Clay 25207 2125 Saline Sand 55
2125 249 Clay 365249 2545 Saline Sand 55
2545 280 Clay 255280 2944 Saline Sand 144
2944 300 Clay 56
Nanak Nagri
0 136 Clay 136136 208 Fresh Sand 72208 265 Clay 57265 305 Fresh Sand 4305 34 Clay 3534 368 Fresh Sand 28
368 388 Clay 2388 40 Fresh Sand 1240 428 Clay 28
428 46 Fresh Sand 3246 695 Clay 235
695 712 Fresh Sand 17712 785 Clay 73785 815 Fresh Sand 3815 84 Clay 2584 87 Fresh Sand 387 92 Clay 592 936 Saline Sand 16
936 988 Clay 52988 100 Saline Sand 12100 1085 Clay 85
1085 1115 Saline Sand 31115 118 Clay 65118 120 Saline Sand 2
Aquifer Mapping and Management Plan of Faridkot District Punjab State
Page | 64
Nanak Nagri 120 128 Clay 8128 1296 Saline Sand 16
1296 130 Clay 04130 1316 Saline Sand 16
1316 135 Clay 34135 1368 Saline Sand 18
1368 165 Clay 282165 1676 Saline Sand 26
1676 184 Clay 164184 1868 Saline Sand 28
1868 1905 Clay 371905 1948 Saline Sand 431948 2134 Clay 186
Nangal
0 8 Clay 88 20 Fresh Sand 12
20 23 Clay 323 28 Fresh Sand 528 29 Clay 129 41 Fresh Sand 1241 72 Clay 3172 80 Fresh Sand 880 91 Clay 1191 124 Fresh Sand 33
124 151 Clay 27151 158 Fresh Sand 7158 163 Clay 5163 171 Fresh Sand 8171 181 Clay 10181 187 Fresh Sand 6187 193 Clay 6193 199 Fresh Sand 6199 203 Clay 4203 219 Fresh Sand 16219 224 Clay 5224 233 Saline Sand 9233 243 Clay 10243 249 Saline Sand 6249 251 Clay 2251 257 Saline Sand 6257 300 Clay 43
Tehna 0 8 Clay 8
Aquifer Mapping and Management Plan of Faridkot District Punjab State
Page | 65
Tehna
8 23 Fresh Sand 1523 28 Clay 528 32 Fresh Sand 432 37 Clay 537 41 Fresh Sand 441 59 Clay 1859 63 Fresh Sand 463 69 Clay 669 72 Fresh Sand 372 102 Clay 30
102 106 Fresh Sand 4106 120 Clay 14120 123 Fresh Sand 3123 133 Clay 10133 136 Fresh Sand 3136 145 Clay 9145 150 Fresh Sand 5150 158 Clay 8158 163 Fresh Sand 5163 168 Clay 5168 172 Fresh Sand 4172 176 Clay 4176 184 Fresh Sand 8184 210 Clay 26210 215 Fresh Sand 5215 221 Clay 6221 225 Fresh Sand 4225 254 Clay 29254 264 Fresh Sand 10264 267 Clay 3267 275 Fresh Sand 8275 294 Clay 19294 300 Fresh Sand 6
Wara Daraka
0 15 Clay 1515 22 Fresh Sand 722 28 Clay 628 48 Fresh Sand 2048 52 Clay 452 61 Fresh Sand 961 65 Clay 465 75 Fresh Sand 10
Aquifer Mapping and Management Plan of Faridkot District Punjab State
Page | 66
Wara Daraka
75 84 Clay 984 86 Saline Sand 286 91 Clay 591 97 Saline Sand 697 101 Clay 4
101 119 Saline Sand 18119 124 Clay 5124 129 Saline Sand 5129 150 Clay 21150 172 Saline Sand 22172 184 Clay 12184 188 Saline Sand 4188 196 Clay 8196 205 Saline Sand 9205 234 Clay 29234 239 Saline Sand 5239 274 Clay 35274 281 Saline Sand 7281 300 Clay 19
Aulakh
0 1829 Clay 18291829 4573 Fresh Sand 27444573 7621 Clay 30487621 9146 Fresh Sand 15259146 10975 Clay 1829
10975 1128 Saline Sand 3051128 13414 Clay 2134
13414 16768 Saline Sand 335416768 20112 Clay 334420112 21036 Saline Sand 92421036 21341 Clay 30521341 21951 Saline Sand 6121951 2256 Clay 6092256 245 Saline Sand 194245 300 Clay 55
Bhagthala
0 35 Clay 3535 1829 Fresh Sand 1479
1829 41 Clay 227141 53 Fresh Sand 1253 63 Clay 1063 8537 Saline Sand 2237
8537 92 Clay 663
Aquifer Mapping and Management Plan of Faridkot District Punjab State
Page | 67
92 102 Saline Sand 10102 1311 Clay 291
1311 13415 Saline Sand 30513415 16768 Clay 335316768 17073 Saline Sand 30517073 185 Clay 1427
185 203 Saline Sand 18203 22866 Clay 2566
22866 23476 Saline Sand 6123476 253 Clay 1824
253 273 Saline Sand 20273 280 Clay 7280 294 Saline Sand 14294 300 Clay 6
Sadhuwala
0 61 Fresh Sand 6161 3049 Clay 2439
3049 52 Saline Sand 215152 625 Clay 105
625 725 Saline Sand 10725 77 Clay 4577 84 Saline Sand 784 91 Clay 791 107 Saline Sand 16
107 110 Clay 3110 114 Saline Sand 4114 118 Clay 4118 130 Saline Sand 12130 14339 Clay 1339
14339 16463 Saline Sand 212416463 17683 Clay 12217683 207 Saline Sand 3017
207 2115 Clay 452115 2155 Saline Sand 42155 219 Clay 35219 235 Saline Sand 16235 237 Clay 2237 25624 Saline Sand 1924
25624 27134 Clay 15127134 300 Saline Sand 2866
Deviwala0 15 Clay 15
15 23 Fresh Sand 8
Aquifer Mapping and Management Plan of Faridkot District Punjab State
Page | 68
Deviwala
23 38 Clay 1538 46 Fresh Sand 846 48 Clay 248 53 Fresh Sand 553 61 Clay 861 65 Fresh Sand 465 72 Clay 772 78 Fresh Sand 678 94 Clay 1694 106 Fresh Sand 12
106 109 Clay 3109 112 Saline Sand 3112 128 Clay 16128 140 Saline Sand 12140 158 Clay 18158 163 Saline Sand 5163 179 Clay 16179 183 Saline Sand 4183 187 Clay 4187 196 Saline Sand 9196 202 Clay 6202 213 Saline Sand 11213 218 Clay 5218 223 Saline Sand 5223 252 Clay 29252 258 Saline Sand 6258 263 Clay 5263 269 Saline Sand 6
Dohak
0 8 Clay 88 10 Fresh Sand 2
10 21 Clay 1121 33 Saline Sand 1233 41 Clay 841 79 Saline Sand 3879 89 Clay 1089 95 Saline Sand 695 99 Clay 499 112 Saline Sand 13
112 116 Clay 4116 139 Saline Sand 23139 154 Clay 15
Aquifer Mapping and Management Plan of Faridkot District Punjab State
Page | 69
154 163 Saline Sand 9
Toot
0 15 Clay 1515 198 Fresh Sand 48
198 21 Clay 1221 474 Fresh Sand 264
474 51 Clay 3651 552 Fresh Sand 42
552 626 Clay 74626 766 Fresh Sand 14766 101 Clay 244101 104 Fresh Sand 3104 113 Clay 9113 116 Fresh Sand 3116 143 Clay 27143 146 Saline Sand 3146 167 Clay 21167 170 Saline Sand 3170 182 Clay 12182 204 Saline Sand 22204 214 Clay 10214 217 Saline Sand 3
Aquifer Mapping and Management Plan of Faridkot District Punjab State
Page | 70
Annexure-IVAQUIFER GROUPING OF WELL LOCATIONS IN FARIDKOT DISTRICT
Well location Depth from Depth to Aquifer Thickness FreshGranular
Zones
SalineGranular
Zones
Dal Singhwala
0 15 Unsaturated Zone 15 215 57 Aquifer Group-IA 42 3457 64 Aquiclude-IA 764 134 Aquifer Group-IB 70 51
134 157 Aquiclude-IB 23157 300 Multiple Aquifers 143 52
Dip Singh Wala
0 5 Unsaturated Zone 5 55 68 Aquifer Group-IA 63 35
68 755 Aquiclude-IA 75755 132 Aquifer Group-IB 565 14 31132 146 Aquiclude-IB 14146 300 Multiple Aquifers 154 755
Golewala
0 4 Unsaturated Zone 4 14 525 Aquifer Group-IA 485 33
525 60 Aquiclude-IA 7560 103 Aquifer Group-IB 43 38
103 155 Aquiclude-IB 52155 300 Multiple Aquifers 145 665
Jaito Mandi
0 14 Unsaturated Zone 14 114 59 Aquifer Group-IA 45 3759 80 Aquiclude-IA 2180 107 Aquifer Group-IB 27 155
107 1555 Aquiclude-IB 4851555 300 Multiple Aquifers 1445 16 515
Kot Kapura
0 9 Unsaturated Zone 9 29 77 Aquifer Group-IA 68 455
77 88 Aquiclude-IA 1188 106 Aquifer Group-IB 18 11 3
106 155 Aquiclude-IB 49155 300 Multiple Aquifers 145 68
Nanak Nagri
0 12 Unsaturated Zone 12 112 46 Aquifer Group-IA 34 18446 69 Aquiclude-IA 2369 131 Aquifer Group-IB 62 77 11
131 165 Aquiclude-IB 34165 2134 Multiple Aquifers 484 97
Nangal 0 9 Unsaturated Zone 9 1
Aquifer Mapping and Management Plan of Faridkot District Punjab State
Page | 71
Nangal
9 41 Aquifer Group-IA 32 2941 72 Aquiclude-IA 3172 124 Aquifer Group-IB 52 41
124 151 Aquiclude-IB 27151 300 Multiple Aquifers 149 43 21
Tehna
0 10 Unsaturated Zone 10 210 41 Aquifer Group-IA 31 18741 59 Aquiclude-IA 1859 106 Aquifer Group-IB 47 33
106 158 Aquiclude-IB 52158 300 Multiple Aquifers 142 50
Wara Daraka
0 4 Unsaturated Zone 4 04 75 Aquifer Group-IA 71 46
75 84 Aquiclude-IA 984 129 Aquifer Group-IB 45 31
129 150 Aquiclude-IB 21150 300 Multiple Aquifers 150 47
Aulakh
0 17 Unsaturated Zone 17 217 46 Aquifer Group-IA 29 2646 76 Aquiclude-IA 3076 113 Aquifer Group-IB 37 1525 305
113 134 Aquiclude-IB 21134 300 Multiple Aquifers 166 6828
Bhagthala
0 4 Unsaturated Zone 4 14 53 Aquifer Group-IA 49 24
53 63 Aquiclude-IA 1063 102 Aquifer Group-IB 39 3237
102 168 Aquiclude-IB 66168 300 Multiple Aquifers 132 6115
Sadhuwala
0 5 Unsaturated Zone 5 55 52 Aquifer Group-IA 47 2151
52 63 Aquiclude-IA 1163 130 Aquifer Group-IB 67 49
130 144 Aquiclude-IB 14144 300 Multiple Aquifers 156 11931
Deviwala
0 8 Unsaturated Zone 8 28 78 Aquifer Group-IA 70 31
78 94 Aquiclude-IA 1694 112 Aquifer Group-IB 18 12 3
112 128 Aquiclude-IB 16128 269 Multiple Aquifers 141 58
Aquifer Mapping and Management Plan of Faridkot District Punjab State
Page | 72
Dohak
0 3 Unsaturated Zone 3 03 79 Aquifer Group-IA 76 2 50
79 89 Aquiclude-IA 1089 139 Aquifer Group-IB 50 42
139 154 Aquiclude-IB 15154 163 Multiple Aquifers 9 9
Toot
0 9 Unsaturated Zone 9 19 55 Aquifer Group-IA 46 354
55 63 Aquiclude-IA 863 116 Aquifer Group-IB 53 25
116 143 Aquiclude-IB 27143 217 Multiple Aquifers 74 31
- कदरीय भमि जल बोरड
-
- जल ससाधन नदी विकास और गगा सरकषण मतरालय
- भारत सरकार
-
- contents naquim faridkotpdf (p1-5)
- Final Faridkot edited 170317pdf (p6-77)
-

AQUIFER MAPPING ampMANAGEMENT PLAN OF
FARIDKOT DISTRICT PUNJAB
Central Ground Water BoardNorth Western Region Chandigarh
Ministry of Water Resources River Development and Ganga RejuvenationGovernment of India
2017
AQUIFER MAPPING ampMANAGEMENT PLAN OF
FARIDKOT DISTRICT PUNJAB
Central Ground Water BoardNorth Western Region Chandigarh
Ministry of Water Resources River Development and Ganga RejuvenationGovernment of India
2017
AQUIFER MAPPING ampMANAGEMENT PLAN OF
FARIDKOT DISTRICT PUNJAB
Central Ground Water BoardNorth Western Region Chandigarh
Ministry of Water Resources River Development and Ganga RejuvenationGovernment of India
2017
AQUIFER MAPPING AND MANAGEMENT PLANFARIDKOT DISTRICT
(141860 Sq Km)
DISTRICT TECHNICAL REPORT (PART ndash I)
SL NO TITLE OF CONTENTS PAGE NO
10 INTRODUCTION 1 - 8
20 DATA COLLECTION AND GENERATION 9 - 17
30 DATA INTERPRETATION INTEGRATION AND AQUIFER MAPPING 18 - 25
40 GROUND WATER RESOURCES 26 - 30
50 GROUND WATER RELATED ISSUES 31 - 33
60 MANAGEMENT STRATEGIES AND AQUIFER MANAGEMENT PLAN 34 ndash 36
70 CONCLUSIONS 37
BLOCKWISE AQUIFER MAPS AND MANAGEMENT PLAN (PART ndash II)
I FARIDKOT BLOCK 39 - 46
II KOT KAPURA BLOCK 47 - 54
LIST OF FIGURES
Fig1 Base map of Faridkot District
Fig2 Fluvial Geomorphological Studies Carried out by Different Researchers to Understand the
Subsurface Aquifer System in North Western Regions
Fig3 Drainage and Water Bodies of Faridkot District
Fig4 Canal and Distributaries of Faridkot District
Fig5 Major Aquifers
Fig6 Depth to Pre Monsoon Water level (May 2015)
Fig7 Depth to Post Monsoon Water level (November 2015)
Fig8 Groundwater Quality 2015
Fig9 VES Locations in Faridkot District
Fig10 Locations of Exploration Data Availability
Fig11 Locations of Validated Exploration Data
Fig12 Elevation Contour Map
Fig13 Locations of Validated Exploratory Wells with Lithology
Fig14 3-Dimension Lithological Model
Fig15ab 2-Dimension Lithological Sections
Fig16 3-Dimension Lithological Fence
Fig17 3D Aquifer Disposition Model
Fig18 3D Aquifer Disposition Fence Diagram
Fig19 Conceptual figure to Understand the Fresh and Saline Water Resources in the Aquifer up
to 300 m for Resource Estimation in Unconfined and Confined Aquifer System
Fig20 Long term Ground Water Table Variation
Fig-21 Irrigation Tube Wells as per Depth wise Distributions in Faridkot District
LIST OF TABLES
Table1 Land use pattern of Faridkot district Punjab
Table -2 Summary of Optimized Exploration Wells
Table-3 Aquifer Grouping in Faridkot District
Table-4 Dynamic Ground Water Resource amp Development Potential (31032013) in mcm
Table-5 Block Wise In-Storage Ground Water Resources of Fresh Water Aquifers Upto Average
Depth
Table-6 Block Wise In-Storage Ground Water Resources of Saline Aquifers Upto 300 m Depth
Table-7 Block Wise Total Availability of Fresh and Saline Groundwater Resources upto 300 m
Depth and Volume of Unsaturated Granular Zone after 3m upto water level
Table-8 Distribution of Tube wells According to Well Ownerrsquos land holding Size
Table-9 Distribution of Tube wells According to Depth
Table-10 System of Ground water Distribution Device
Table-11a Scope of Quantitative Impact on Stage of Development after applying various
Management Strategies in mcm
Table-11b Scope of Quantitative Impact on Stage of Development after applying various
Management Strategies in percentage
ANNEXURES
Annexure-I Results of Chemical Analysis of Water Samples from NHS in Faridkot 2015
Annexure-II Results of Chemical Analysis of Water Samples from NAQUIM studies in Faridkot
(2014)
Annexure-III Lithological Data of Wells in Faridkot District
Annexure-IV Aquifer Grouping of Well Locations in Faridkot District
PHOTOGRAPHS
PROJECT TEAM
Regional Director Dr SKJainNodal Officer
Executive Engineer
Dr Sunil Kumar Scientist DHK ManochaReport Compilation Roopesh GKrishnan Scientist BHydrogeology Geophysics Chemical QualityRakesh RanaScientist DGP SinghScientist D (Retd)
SK KapilScientist DSK PaliScientist D (Retd)Rishi RajAssistant Chemist
Gyanendra RaiSTA (HG)
Aquifer Mapping and Management Plan of Faridkot District Punjab State
Page | 1
10 INTRODUCTIONThe primary objective of the Aquifer Mapping can be summed up as ldquoKnow your
Aquifer Manage your Aquiferrdquo Demystification of Science and thereby involvement of stakeholders is the essence of the entire project The involvement and participation of thecommunity will infuse a sense of ownership amongst the stakeholders This is an activity wherethe Government and the Community work in tandem Greater the harmony between the twogreater will be the chances of successful implementation and achievement of the goals of theProject As per the Report of the Working Group on Sustainable Ground Water ManagementldquoIt is imperative to design an aquifer mapping programme with a clear-cut groundwatermanagement purpose This will ensure that aquifer mapping does not remain an academicexercise and that it will seamlessly flow into a participatory groundwater managementprogramme The aquifer mapping approach can help integrate ground water availability withground water accessibility and quality aspects
12 Scope of the studySystematic mapping of an aquifer encompasses a host of activities such as collection and
compilation of available information on aquifer systems demarcation of their extents and theircharacterization analysis of data gaps generation of additional data for filling the identifieddata gaps and finally preparation of aquifer maps at the desired scale This manual attempts toevolve uniform protocols for these activities to facilitate their easy integration for the district aswhole
13 Approach and MethodologyNational Aquifer Mapping Programme basically aims at characterizing the geometry
parameters behaviour of ground water levels and status of ground water development invarious aquifer systems to facilitate planning of their sustainable management The majoractivities involved in this process include compilation of existing data identification of datagaps and generation of data for filling data gaps and preparation of aquifer maps The overallactivities of aquifer mapping are presented in the flow chart below
Aquifer Mapping and Management Plan of Faridkot District Punjab State
Page | 1
10 INTRODUCTIONThe primary objective of the Aquifer Mapping can be summed up as ldquoKnow your
Aquifer Manage your Aquiferrdquo Demystification of Science and thereby involvement of stakeholders is the essence of the entire project The involvement and participation of thecommunity will infuse a sense of ownership amongst the stakeholders This is an activity wherethe Government and the Community work in tandem Greater the harmony between the twogreater will be the chances of successful implementation and achievement of the goals of theProject As per the Report of the Working Group on Sustainable Ground Water ManagementldquoIt is imperative to design an aquifer mapping programme with a clear-cut groundwatermanagement purpose This will ensure that aquifer mapping does not remain an academicexercise and that it will seamlessly flow into a participatory groundwater managementprogramme The aquifer mapping approach can help integrate ground water availability withground water accessibility and quality aspects
12 Scope of the studySystematic mapping of an aquifer encompasses a host of activities such as collection and
compilation of available information on aquifer systems demarcation of their extents and theircharacterization analysis of data gaps generation of additional data for filling the identifieddata gaps and finally preparation of aquifer maps at the desired scale This manual attempts toevolve uniform protocols for these activities to facilitate their easy integration for the district aswhole
13 Approach and MethodologyNational Aquifer Mapping Programme basically aims at characterizing the geometry
parameters behaviour of ground water levels and status of ground water development invarious aquifer systems to facilitate planning of their sustainable management The majoractivities involved in this process include compilation of existing data identification of datagaps and generation of data for filling data gaps and preparation of aquifer maps The overallactivities of aquifer mapping are presented in the flow chart below
Aquifer Mapping and Management Plan of Faridkot District Punjab State
Page | 1
10 INTRODUCTIONThe primary objective of the Aquifer Mapping can be summed up as ldquoKnow your
Aquifer Manage your Aquiferrdquo Demystification of Science and thereby involvement of stakeholders is the essence of the entire project The involvement and participation of thecommunity will infuse a sense of ownership amongst the stakeholders This is an activity wherethe Government and the Community work in tandem Greater the harmony between the twogreater will be the chances of successful implementation and achievement of the goals of theProject As per the Report of the Working Group on Sustainable Ground Water ManagementldquoIt is imperative to design an aquifer mapping programme with a clear-cut groundwatermanagement purpose This will ensure that aquifer mapping does not remain an academicexercise and that it will seamlessly flow into a participatory groundwater managementprogramme The aquifer mapping approach can help integrate ground water availability withground water accessibility and quality aspects
12 Scope of the studySystematic mapping of an aquifer encompasses a host of activities such as collection and
compilation of available information on aquifer systems demarcation of their extents and theircharacterization analysis of data gaps generation of additional data for filling the identifieddata gaps and finally preparation of aquifer maps at the desired scale This manual attempts toevolve uniform protocols for these activities to facilitate their easy integration for the district aswhole
13 Approach and MethodologyNational Aquifer Mapping Programme basically aims at characterizing the geometry
parameters behaviour of ground water levels and status of ground water development invarious aquifer systems to facilitate planning of their sustainable management The majoractivities involved in this process include compilation of existing data identification of datagaps and generation of data for filling data gaps and preparation of aquifer maps The overallactivities of aquifer mapping are presented in the flow chart below
Aquifer Mapping and Management Plan of Faridkot District Punjab State
Page | 2
14 Location and Geographical UnitsFaridkot is located in South- Western part of Punjab State The area lies between
30deg21rsquo59rdquo to 30deg49rsquo52rdquo North latitude and 74deg28rsquo12rdquo to 75deg03rsquo22rdquo East longitude and falls in theSurvey of India Toposheet Nos 44J6 9 10 11 13 14 15 and 44N3 covering an area of141860 sq km (Fig1) It shares common boundaries with Moga district in east Ferozepurdistrict in North amp West and Muktsar and Bathinda districts in South The highest elevation2133 m above msl is near Jiwanwala in the eastern part whereas the minimum of 190m atPind Balochan in the western part with a gentle gradient of 045mkm to the SSW
Faridkot district is the smallest district of Punjab State and has two Sub divisions Tehsilsnamely Faridkot and Jaito and two Sub Tehsils namely Kotkapura and Sadiq comprising 190Gram Panchayats and 171 villages Faridkot District has two administrative development blocksie Faridkot and Kot Kapura
Total Population of the district as per the 2011 Census is 618008 out of which327121 are males and 290887 are females The total rural population in the district is217514 and the urban population is 400494 The population density is 424 persons sq kmagainst the state average of 550 personssq km
15 Climatic Conditions Rainfall and ClimateThe climate of the district is classified as sub-topical steppe semi-arid and hot which is
mainly dry except in rainy months and characterized by intensely hot summer and cold winterThe Normal Annual Rainfall is 449 mm in 24 days which is unevenly distributed over the
district Normal Monsoon Rainfall is 349 mm The southwest monsoon sets in last week of Juneand withdraws towards end of September and contributes about 78 of annual rainfall Julyand August are the wettest months The remaining 22 of the annual rainfall occurs duringnon-monsoon months of the year in the form of thunder storm and western disturbancesRainfall in the district increases from southwest to northeast
16 Geomorphology amp Soil TypeThe study area forms a part of the Sutlej Basin and exhibits gradational landforms
mainly fluvial formed by sediments On the whole it exhibits a low-lying flat topographygenerally sloping towards southwest except few linear depression occupied by palaeo-bluffand palaeo channel near Pakka and southeast of Kamiyana Villages and by sand dunes whichare concentrated in northwestern and southern part of the study area Because of theexceptionally flat topography there is not much development drainage system
The Study area forms a part of Punjab Plain and is sub-divided into the following threeregions on the basis of soil topography climate and natural vegetation
a Faridkot Hathar- Sadiq- Sandy Plain This part extends over Sadiq town part of thedistrict commonly known as Hathar area This part of the district has a large numbers ofsand dunes and wind blown sand has its own effect on the fertility of soil
Aquifer Mapping and Management Plan of Faridkot District Punjab State
Page | 3
Fig1 Base map of Faridkot District
Aquifer Mapping and Management Plan of Faridkot District Punjab State
Page | 4
b Faridkot Uttar- Dhudhi- sandy-loamy This part of Faridkot district extends over DhudhiKot Sukhia Tehna and is known as Uttar area The soil is sandy loam Due to extensionof agriculture and irrigation there is apparent disappearance of sand dunes to a greatextent which have been leveled up generally
c Jaitu Area- Sandy Loam to Loam This region extends over and around Jaitu tehsil Thetexture of the soil is sandy loam to loam This area is known for the best staple ofcotton Most of the area is covered under sandy soil followed by clayey soil except somepatches where there is appreciable thickness of top clay layer varying from 67 to 167m
The study area is developed by Indo Gangetic Alluvium main landforms are Alluvial Plain Sandsheets Sand dunes and Palaeo Channels Alluvial plain forms the major part of the areafollowed by Sand Sheets and Sand dunes as patches Palaeo channel is occurred in central partof the study area
The soils classes are mainly loams loamy sand sandy to fine sandy loams and siltyloams Loamy sand is covered in major part of the study area
The combined studies on fluvial geomorphology and Remote sensing studies in northwestern region are carried out by IITs and Delhi University It has been observed that the hugeflood depositions by River Ghaggar Saraswati and other minor rivers at different time intervaland channel migrations in different ages and also Aeolian depositions caused sand dunes indifferent time interval leads to difficulty in aquifer grouping The studies are also conformedthrough sedimentological core sampling analysis during the project The observations areunderstood by regional geomorphology and channels migrations which shown in the belowFig2
Fig2 Fluvial Geomorphological Studies carried out to understand the SubsurfaceAquifer System in North Western Regions
Aquifer Mapping and Management Plan of Faridkot District Punjab State
Page | 4
b Faridkot Uttar- Dhudhi- sandy-loamy This part of Faridkot district extends over DhudhiKot Sukhia Tehna and is known as Uttar area The soil is sandy loam Due to extensionof agriculture and irrigation there is apparent disappearance of sand dunes to a greatextent which have been leveled up generally
c Jaitu Area- Sandy Loam to Loam This region extends over and around Jaitu tehsil Thetexture of the soil is sandy loam to loam This area is known for the best staple ofcotton Most of the area is covered under sandy soil followed by clayey soil except somepatches where there is appreciable thickness of top clay layer varying from 67 to 167m
The study area is developed by Indo Gangetic Alluvium main landforms are Alluvial Plain Sandsheets Sand dunes and Palaeo Channels Alluvial plain forms the major part of the areafollowed by Sand Sheets and Sand dunes as patches Palaeo channel is occurred in central partof the study area
The soils classes are mainly loams loamy sand sandy to fine sandy loams and siltyloams Loamy sand is covered in major part of the study area
The combined studies on fluvial geomorphology and Remote sensing studies in northwestern region are carried out by IITs and Delhi University It has been observed that the hugeflood depositions by River Ghaggar Saraswati and other minor rivers at different time intervaland channel migrations in different ages and also Aeolian depositions caused sand dunes indifferent time interval leads to difficulty in aquifer grouping The studies are also conformedthrough sedimentological core sampling analysis during the project The observations areunderstood by regional geomorphology and channels migrations which shown in the belowFig2
Fig2 Fluvial Geomorphological Studies carried out to understand the SubsurfaceAquifer System in North Western Regions
Aquifer Mapping and Management Plan of Faridkot District Punjab State
Page | 4
b Faridkot Uttar- Dhudhi- sandy-loamy This part of Faridkot district extends over DhudhiKot Sukhia Tehna and is known as Uttar area The soil is sandy loam Due to extensionof agriculture and irrigation there is apparent disappearance of sand dunes to a greatextent which have been leveled up generally
c Jaitu Area- Sandy Loam to Loam This region extends over and around Jaitu tehsil Thetexture of the soil is sandy loam to loam This area is known for the best staple ofcotton Most of the area is covered under sandy soil followed by clayey soil except somepatches where there is appreciable thickness of top clay layer varying from 67 to 167m
The study area is developed by Indo Gangetic Alluvium main landforms are Alluvial Plain Sandsheets Sand dunes and Palaeo Channels Alluvial plain forms the major part of the areafollowed by Sand Sheets and Sand dunes as patches Palaeo channel is occurred in central partof the study area
The soils classes are mainly loams loamy sand sandy to fine sandy loams and siltyloams Loamy sand is covered in major part of the study area
The combined studies on fluvial geomorphology and Remote sensing studies in northwestern region are carried out by IITs and Delhi University It has been observed that the hugeflood depositions by River Ghaggar Saraswati and other minor rivers at different time intervaland channel migrations in different ages and also Aeolian depositions caused sand dunes indifferent time interval leads to difficulty in aquifer grouping The studies are also conformedthrough sedimentological core sampling analysis during the project The observations areunderstood by regional geomorphology and channels migrations which shown in the belowFig2
Fig2 Fluvial Geomorphological Studies carried out to understand the SubsurfaceAquifer System in North Western Regions
Aquifer Mapping and Management Plan of Faridkot District Punjab State
Page | 5
17 Land Use Land CoverBased on the visual interpretation of satellite data and topographical data land
useland classes have been identified The main classes are Built Up land Agricultural landforestland Land under non agriculture use current fallows and water bodies The Land usepatterns are given in below tableLand use pattern of Faridkot district Punjab (wwwagripbgovin)
Type of Land use Area (ha)
1 Total Geographical area 1419002 Forest 20043 Land put to non-agricultural use 16719 (11)4 Current Fallows 22395 Net area sown 126678 (89)6 Gross cropped area 2529897 Cropping intensity 200
18 River System and Water Resources
No river is flowing through the area but there are some drains which flow during heavyrains and serve as natural drainage The main drains are Tarobri Drain Mari Drain Samadh BhaiDrain and Chand Bhan Drain (Fig3) There is a good network of canals and these passes throughthe area The main canals are Bikaner Canal Sirhind Feeder Rajasthan Feeder Abohar andBathinda branches of Sirhind Canal Bikaner Canal and Bathinda Branch of Sirhind Canal passesthrough northwestern and southeastern margins of the district and Sirhind Feeder RajasthanFeeder Abohar Branch of Sirhind Canal run through the entire length of district in north-southand northeast-southwest directions respectively (Fig4) Sirhind canal system has been servingthe district for irrigation since long time There are large water bodies near Khara PanjgrainJaito Mandi Wara daraka and in Faridkot Town These water bodies generally dry in summer
19 Agriculture amp IrrigationFaridkot is mainly an agricultural district and 70 of the population resided in the rural
areas depends up on agriculture The two main crop seasons in a year are Kharif and Rabi whichis locally known as lsquoSaunirsquo(Summer Harvest Season) and lsquoHarrhirsquo (Winter Harvest Season) Theprinciple Kharif crops are Paddy Maize Bajra Cotton Moong Mash Moth Arhar Sugarcaneetc while important Rabi crops are Wheat Barley Gram Sarson Taramera and Toria etc
Irrigation is carried out by surface water and ground water As major parts of the areaare underlain by saline water so canal water is major source of irrigation In some parts whereground water is available as fresh water lenses than irrigation is covered by skimming wellsknown as multiple well point system Kharif and Rabi is cultivated in study area under two typesof soil ie loamy sand and sandy loam and the sources of irrigation are canal as well astubewells Conjunctive use of canal water and ground water for irrigation is being carried outefficiently in this area
Aquifer Mapping and Management Plan of Faridkot District Punjab State
Page | 6
a Canal Water IrrigationMajor source of irrigation is canal where water from Sirhind canal is utilized for
irrigation The other important distributaries are Abohar Branch Dhulkot distributary systemMari distributary system Faridkot distributary Kotkapura distributary Jaitu distributaryRupana and Doda distributary system The total length of above distributaries which serve inFaridkot district is 22844 km out of which 20649 km is lined and 2185 km is unlined Grossirrigated areas of all the channels are 9025339 ha and cultural command area is 8026656 hawith 294 no of outlets Intensity of irrigation is 140
b Ground Water IrrigationWith the advent of multiple well point systems ground water irrigation is also playing
an important role in development of agriculture economy of the study area This is not onlyrelease the pressure mounted on the canal water supply but also creates the maximum storagein the unconfined aquifer for fresh ground water through return flow and canal seepage
110 IndustriesThere are no major industries in the area except rice mills in Deviwala village and few
poultry farms in the district
111 Mineral ResourcesSince the entire area is occupied by Quaternary sediments no minerals of significant
industrial use are foundAlkaline soils contain saltpetre called Kalmi Shora in local languagewhich has application in chemical oxide glass soap industry and leather tanning are found inthis area It is being extracted at Sirsari and Kot Sukhia villages It occurs as thin slightlyyellowish to dark brown encrustation on the ground surface and is found mostly over the oldhabitation sites lsquoThehsrsquo or over barren kallar lands and cattle sheds
Saltpetre is an important source of Niter (KNO3) which is used in cracker industrymatchbox manufacture and as a fertilizer
112 Water Conservation and Artificial rechargeThe north and eastern part of the area where water level is declining artificial recharge
structures may help in arresting the decline Recharge Trench with injection well structure isthe suitable for artificial recharge Water conservation methods like change in cropping patternchange in Irrigation policy lining of unlined channels timely plantation of paddy promotion ofsprinkler and drip irrigation etc may be adopted to overcome the ground water decline in thearea
Aquifer Mapping and Management Plan of Faridkot District Punjab State
Page | 7
Fig3 Drainage and Water Bodies of Faridkot District
Aquifer Mapping and Management Plan of Faridkot District Punjab State
Page | 8
Fig4 Canal and Distributaries of Faridkot District
Aquifer Mapping and Management Plan of Faridkot District Punjab State
Page | 9
20 DATA COLLECTION AND GENERATION
21 Geology and Hydrogeological dataThe area lies in the central part of Satluj basin of Indo-Gangetic Alluvial plain
Geologically the area is occupied by a thick sequence of Quaternary deposits of Mid-Pleistoceneto Recent age These comprise alternate sequence of fluvial and arid phases The exposedQuaternary Sediments can be broadly classifies as- (i) Older Alluvium of Middle to UpperPleistocene age overlain by (ii) Aeolian deposits of Holocene age The provenance of OlderAlluvium deposited by rivers originated from Himalayas and Aeolian deposits have been laiddown by wind action from Thar Desert of Rajasthan in the southwest part of the area Thegeneralized stratigraphic sequence of the area are given belowGeneralized Stratigraphy Faridkot District (After Garg amp Singh 1993)Age Lithological Unit Lithological Characteristics
Holocene Aeolian Flat Unconsolidated thin veneer of Aeolian sand
Newer Dunes Unconsolidated orange brown sand and silt
Semi consolidated dunes Semi consolidated light to dark brown sand
Older dune Dark brown Aeolian sand and silt withsome vegetal matter
Mid to UpperPleistocene
Older Alluvium Multi-cyclic light grey to brown fine tomedium grained mixture of clay silt andsand with Kankar Light grey to pink stickyclay grayish mica sand with kankar
-----Basement not exposed----
The Principle Aquifer in the study area is Alluvium and the Major Aquifers are OlderAlluvium and Aeolian Alluvium (Fig5) The Ground water occurs in unconfined (water table) andconfined conditions
211 Water Level BehaviorTwenty three monitoring stations of Central Ground Water Board (CGWB) (7
Piezometers and 16 Dugwells) and Eighteen monitoring stations (18 Piezometers) of StateGovernment represent the first aquifer Second and third aquifer is represented by onemonitoring station of CGWB Depth to water level in the area ranges from 145 to 1819 m bglduring pre-monsoon period (Fig6) and 120 to 2015 m bgl during post monsoon period (Fig7)In eastern part water levels are in the range of 10 to 20 m in central part the water levels are inthe range of 5 to 10 m bgl and in western part the water levels are shallower in the range of 2to 5 m Seasonal water level fluctuation shows a rise and fall in the range of 110 to (-) 200 m inwestern and eastern part of the districts respectively during year 2015
Aquifer Mapping and Management Plan of Faridkot District Punjab State
Page | 10
Hydrograph of Different Observation Wells
Fig5 Major Aquifers
Aquifer Mapping and Management Plan of Faridkot District Punjab State
Page | 11
Fig6 Depth to Water level Pre Monsoon 2015
Aquifer Mapping and Management Plan of Faridkot District Punjab State
Page | 12
Fig7 Depth to Water level Post Monsoon 2015
Aquifer Mapping and Management Plan of Faridkot District Punjab State
Page | 13
22 Water Quality DataGround water quality of shallow aquifer (Aquifer-I) is assessed on the basis of chemical
data of National Hydrograph Network stations ie NHNS monitored during Pre monsoonperiod Twenty four groundwater samples are collected during NHNS 2015 and chemicalanalysis is given in Annexure-I The chemical quality of deeper aquifers has to be assessedduring ongoing groundwater exploration programme under NAQUIM
Chemical data of shallow aquifer indicates that ground water is alkaline in nature TheElectrical Conductivity (EC) values ranges from 444 to 8653 microScm at 25oC indicating fresh tomoderately saline The EC values less than 1000 microScm at 25oC have observed at four locationsie Jand Sahib (444) Devi wala (476) Mehmuana (550) and Arianwala (700) respectively TheEC values more than 3000 microScm at 25oC have observed at six locations ie Tehna (8653) BajaKhana (3988) Nangal (3487) Kot Kapura (3299) Mumara (3212) and Sukhanwala (3126) Theground water occurring in the central and south-eastern parts are marginally to highly salineand not suitable for drinking purposes
The chloride concentration in ground water varies broadly between 28 mgl atAriyanwala and also 1544 mgl at Tehna Ground water with fluoride above 15 mgL are foundmainly in Nathuwala (603) Killi (429 ) Kot Kapura (333) Dhilwan kalan (285) Moharewala(195) and Bir Sikhanwala (184) and Nitrate concentration in groundwater above permissiblelimit 15 mgl are found in Kot kapura (144) Killi (140) Dal Singhwala (136)Tehna (118)Nangal (104) Bir Sikhan wala (89) Nathuwala (79) Chand baja (79 ) Wara Daraka (66) Shersinghwala (65) and Sukhanwala(46) The USSL diagrams used for classification of irrigationwater based on EC and SAR shown below observed that ground water occurring in Faridkotdistrict falls under C4S3 C2S1 C4S4 C3S1 C3S3 and C3S2 classes of irrigation classification
Aquifer Mapping and Management Plan of Faridkot District Punjab State
Page | 14
Such waters when used continuously for irrigation they are likely to cause salinityhazards and lead to reduction in crop yields Plot of USSL diagram indicates that ground watersfall under C2S1 and C3S1 classes of irrigation rating
Analysing mechanism and equipments used for chemical analysis are given in table-1Table-1 Analytical methods and equipments used for chemical analysis
S No Parameters Analytical Methods
A Physico-chemical analysis
pHConductivity (EC)Carbonate amp bicarbonate (CO3HCO3)Chloride (Cl)Sulphate (SO4)Nitrate (NO3)Fluoride (F)Total hardness (TH)Calcium (Ca)Magnesium (Mg)Sodium (Na)Potassium (K)Total Dissolved Solids (TDS)
Electrometric methodElectrical conductivity methodTitrimetric methodArgenotometric methodNephloturbidity method
Spectro-photometric methodIon metric methodEDTA-Titri metric methodEDTA-Titri metric methodBy differenceFlame photometric methodFlame photometric methodGravimetric
B Trace elementsHeavy metals
Copper (Cu)Cadmium (Cd)Chromium (Cr)Lead (Pb)Manganese (Mn)Nickel (Ni)Cyanide (Cn)
Iron (Fe)
Digestion followed by AtomicAbsorption Spectrophotometer
(AAS)
Spectrophotometer method
Aquifer Mapping and Management Plan of Faridkot District Punjab State
Page | 15
Fig8 Hill-Piper diagram for Groundwater Quality of Shallow Aquifer of Faridkot District
Aquifer Mapping and Management Plan of Faridkot District Punjab State
Page | 16
Fig8 Groundwater Quality 2015
Aquifer Mapping and Management Plan of Faridkot District Punjab State
Page | 17
23 Geophysical data
To delineate fresh water - saline water interface laterally as well as vertically surfacegeophysical investigations have been carried out in alluvial tracts over parts of the study areaUnder surface geophysical investigations total 44 VES (Fig9) in an area of 1800 sq km wereconducted with current electrical separation of 600 to 1000 m
Fig9 VES Locations in Faridkot District
Aquifer Mapping and Management Plan of Faridkot District Punjab State
Page | 17
23 Geophysical data
To delineate fresh water - saline water interface laterally as well as vertically surfacegeophysical investigations have been carried out in alluvial tracts over parts of the study areaUnder surface geophysical investigations total 44 VES (Fig9) in an area of 1800 sq km wereconducted with current electrical separation of 600 to 1000 m
Fig9 VES Locations in Faridkot District
Aquifer Mapping and Management Plan of Faridkot District Punjab State
Page | 17
23 Geophysical data
To delineate fresh water - saline water interface laterally as well as vertically surfacegeophysical investigations have been carried out in alluvial tracts over parts of the study areaUnder surface geophysical investigations total 44 VES (Fig9) in an area of 1800 sq km wereconducted with current electrical separation of 600 to 1000 m
Fig9 VES Locations in Faridkot District
Aquifer Mapping and Management Plan of Faridkot District Punjab State
Page | 18
Subsurface geophysical investigations include borehole logging The ground waterquality data pertaining to the CGWB exploratory boreholes indicate vertical and lateralvariation in EC values Shallow ground water quality data shows clearly the existence of salinityat shallow depth in the many parts of study area such as Pakka Mahmuana ShirinwalaShersinghwala Dohak Kamiyana Kingra and many other places Electrical conductivity (EC) ofground water is more than 2000 microS cm in major part of the area except at few places Slightimprovement in quality of ground water at deeper depth as compared to shallow depth hasbeen observed at few places These places are Chuggewala Golewalla Nangal Deepsinghwalawhere EC of ground water was found to be within 2000 microS cm within the depth range of 80 to120 m
24 Exploratory drilling State - Data AvailabilityThe Lithologs of Exploratory Well Observation well Piezometer productive wells of
CGWB Punjab State Tubewell Corporation (PSTC) now as Punjab Water ResourcesDevelopment and Management (PWRDM) WRED ( Water Resources and EnvironmentDirectorate) Water Supply and Sanitation (WSS) and Private Wells have been collected andthose supported electrical logs have been validated for aquifer map preparation The details areshown in Table-1
Table-1 Data Availability of Exploration Wells of Faridkot district
SlNo Source of data Depth Range (m) Totallt 100 100-200 200-300 gt300
1 CGWB 2 1 1 8 122 WREDPSTCWSS 15 1 0 3 193 PRIVATE WELLS 1 0 1 0 2Total 18 2 2 11 33
25 Spatial Data DistributionThe actual data of all the wells in the area are plotted on the map of 150000 scale with
5rsquoX5rsquogrid (9 x 9) km (Fig 10) Perusal of table shows that majority of tube wells falls in theshallow aquifer having depth less than 100m and deeper aquifer having depth more than 300mThe grids formations devoid of groundwater exploration are identified as data gaps and theseare to be filled by data generation The Physical record of the availability of exploration data aregiven in Annexure-II
Aquifer Mapping and Management Plan of Faridkot District Punjab State
Page | 19
Fig10 Locations of Exploration Data Availability
Aquifer Mapping and Management Plan of Faridkot District Punjab State
Page | 20
30 DATA INTERPRETATION INTEGRATION AND AQUIFER MAPPINGAll the available data have been validated to generate aquifer map The deepest well in
each quadrant is selected and plotted on the map of 150000 scale with 5rsquoX5rsquogrid (9 x 9) km(Fig11)
Fig11 Locations of validated exploration data
The optimized wells of CGWB PWRDM WRED WSS and Private Wells have been usedto prepare the elevation or collar elevation map to identify the topographic variations onground surface so that it can give the synoptic picture of gradient variations in the water levels
Aquifer Mapping and Management Plan of Faridkot District Punjab State
Page | 21
The topographic elevation values have been plotted to prepare the elevation contour map(Fig12) The locations of validated wells in quadrant and toposheet wise distributions inrespective blocks are given in Table-2 Locations of validated exploratory wells with litholog areshown in Fig13
Fig12 Elevation contour map
Fig13 Locations of validated exploratory wells with Litholog
Aquifer Mapping and Management Plan of Faridkot District Punjab State
Page | 22
Table -2 Summary of optimized exploration wells
Block ToposheetQuadrant Depth Range (m) Elevation(m amsl)
Source ofdata
Location lt 100 100-200 200-300 gt300Faridkot 1A 44J06 Dip Singh Wala - - - 350 201 CGWBFaridkot 3C 44J09 Golewala - - - 34378 1995 CGWBFaridkot 1A 44J14 Tehna - - - 300 205 CGWBFaridkot 3A 44J14 Bhagthala - - - 37195 198 PSTCFaridkot 1A 44J10 Sadhuwala - - - 35970 196 PSTCKot Kapura 1C 44J15 Dal Singhwala - - - 300 211 CGWBKot Kapura 1B 44J15 Jaito Mandi - - - 41920 203 CGWBKot Kapura 2A 44J14 Kot Kapura - - - 42190 206 CGWBKot Kapura 3B 44J14 Nanak Nagri - - 2134 - 210 PRIVATEKot Kapura 1B 44J14 Nangal - - - 300 206 CGWBKot Kapura 3A 44J14 Wara Daraka - - - 300 205 CGWBKot Kapura 2C 44J14 Aulakh - - - 38414 211 PSTCKot Kapura 2B 44J14 Deviwala - - 269 - 207 CGWBMuktsar 2B 44J10 Dohak - 163 - - 197 CGWBGhal khurd 3B 44J09 Toot - - 217 - 196 CGWB
Two exploratory wells from adjacent districts ie Dohak from Muktsar district and Toot from Ferozpur district have beenincorporated for the preparation of lithological fence and cross sections
Aquifer Mapping and Management Plan of Faridkot District Punjab State
Page | 23
31 Sub Surface Disposition311 Previous Work
To delineate and determine the potential aquifer zones evaluation of aquifercharacteristics etc Exploratory drilling was conducted by CGWB at 6 locations in the districtincludes 05 exploratory wells and 1 slim hole between 1975 to 2008 through in-house activitiesand 02 exploratory wells and 2 piezometers through outsourced by Ms WAPCOS Ltd between2011 to 2015 (Fig10) The drilling has been carried out to a maximum depth of about 408 m(Kot Kapura) and revealed the presence of 6 to 12 prominent permeable granular zones withaggregate thickness varying from 28 to 283 m The granular zone consists of fine to mediumsand The slim hole at Golewala and exploratory well at Kot Kapura have abandoned due topoor quality of formation water upto depth of 350m bgl
Further the study of exploratory boreholes drilled in the district revealed the presence ofmultiple aquifer groups up to the maximum drilled depth of 408 m The first aquifer group formsvery shallow water table aquifer (IA) and occurs down to 57 m Below that clay layer starts gettingthickened to about 8-10m separating Aquifer IB down to 120 m The below multi aquifers behavesas semi-confined to confined and consisting of thin sand layers alternating with thicker clay layersOverall flow of ground water is towards south-west direction Further the study of exploratoryboreholes drilled in the area revealed that the area is considered as a single aquifer system up tothe maximum depth of 300 m
312 Present NAQUIM StudyTo understand the sub surface disposition in the study area geological sections and
fence diagram have been prepared by synthesizing the various sub-surface sections on the basisof study of the lithological logs and electrical logs of boreholes drilled by CGWB WRED PSTCand Private Agencies using the RockWorks15 software and a 3D lithological model has beenprepared (Fig14) The 2D lithology sections and 3D lithological fence diagram has beenprepared using lithology model and are shown in Fig15a b amp 16 respectively The aquifers arecomposed of fine to medium sand with clay intercalations The granular zones are extensiveThe aquifer occurring below 252m depth are composed of very fine to medium sand with silt
Based on geophysical borehole logging and use of resistivity profiling followed by thedepth soundings at few selected places fresh-saline water zones are demarcated This analysisis extremely important for the present study and will be referred from time to time as it isobviously the higher resistivity beds represents freshwater zone in contrast in low resistive bedsindicating saline groundwater zoneFig14 3-Dimension Lithological Model
Aquifer Mapping and Management Plan of Faridkot District Punjab State
Page | 24
The major aquifer system of the area is Quaternary alluvial deposits having Older and Aeolianalluvium which mainly comprises of sand silt and clay The top surface layer is mainly silty clayThe lithology along W-E direction shows the variation in lithological thickness ie thin clay layersinter bedded with sand except at Nangal where thick clay layers were identified at 55 m bglThere is inter-layering of sand and clay with thick clay at Golewala and Bhagthala towardswestern side at a depth between 150m to 210m bgl There is thick a inter-layering of sand andclay towards all lithologs except Nanak Nagri shows thin sequence of sand and clay towards SWLithological data of wells are given in Annexure-III
Fig15ab 2-Dimension Lithological Sections
SWE
Aquifer Mapping and Management Plan of Faridkot District Punjab State
Page | 25
Fig16 3-Dimension Lithological Fence
Aquifer Mapping and Management Plan of Faridkot District Punjab State
Page | 26
32 Aquifer Geometry
The aquifer group embodies a number of granular layers alternating with clay lenses Afew clay layers intervening these aquifer groups pinch out against the sand zones at few placesThe marker horizons are traced all over the area by connecting their tops and bottoms Sandyclay layer occurs at the surface covering the unconfined aquifer which is in turn underlain byprominent clay zone It is composed of mainly of medium sand with thin beds of fine sand
Aquifer IA (Very Shallow Aquifer) extends maximum upto 70 m of depth and below thatclay layer starts getting thickened about 10-12m separating Aquifer IB to a maximum depth of123 m Multi layer aquifers are existing in the area each aquifer is separated by thick clay zonesof 25 to 40 m upto 300m depth (Annexure IV) Based on the same criteria to know the broadpicture of the aquifer disposition inter-relationship of granular zones nature geometry andextension of aquifers in the study area the aquifer grouping has been carried out using the sub-surface lithology and a 3-Dimensional aquifer model (Fig17) and aquifer disposition 3D fencediagram has also been prepared using the aquifer model (Fig18) Various groups identified inthe area are given in Table-3 It is very difficult to differentiate the aquifer groups after AquiferGroup I so the whole lithology is considered to be a single aquifer group system The firstaquifer is water table aquifer and extends all over the area The aquifer is mainly composed offine to coarse grained sand
Table-3 Aquifer Grouping in Faridkot DistrictAquifer Group Range Thickness
From To Min Max
Aquifer IA 4 70 29 50
Aquifer IB 64 123 21 52
Multiple Aquifers 133 300 21 85
Fig17 3D Aquifer Disposition Model
Aquifer Mapping and Management Plan of Faridkot District Punjab State
Page | 27
Fig18 3D Aquifer Disposition Fence
Aquifer Mapping and Management Plan of Faridkot District Punjab State
Page | 28
40 GROUND WATER RESOURCESGround water resource estimation of the area have been carried out by taking Dynamic
and In-storage resources of unconfined aquifer and confined aquifer present upto 300m depthThe assessment of dynamic ground water Resources of the study area have been carried outjointly by CGWB and Water Resources and Environment Directorate (WRED) Department ofIrrigation Punjab on the basis of Ground Water Estimation Committee (1997) methodology
The occurrence of potential aquifers (productive granular zones) upto 300 m depth hasbeen demarcated on basis of aquifer wise subsurface mapping The total saturated thickness ofgranular zones was derived from the exploratory borehole data of a particular block Thegranular zones occurring below the zone of water level fluctuation up to the first confining layerhas been considered as static unconfined zone The specific yield value for the unconfinedaquifer has been taken as 60 of 012 which comes as 0072 whereas for the confined aquiferthe storativity value has been considered Since the specific yield is likely to reduce withincrease in depth due to compaction of overlying sediments
Hence the major data elements considered in this estimation are thickness of granularzones specific yieldstorativity and area of both fresh water and salinebrackish water It hasbeen observed that in some of the blocks sufficient data on probable occurrence of granularzones was not available In those cases the existing exploratory data of adjoining blockdistricthas been either extrapolated or interpolated to derive such parameters required for estimationThis assessment of total groundwater resources has been computed based on the availabledata with CGWB amp WRED Department of Irrigation and Punjab
41 Groundwater Resources up to depth of 300ma Dynamic Resources
Block-wise ground water resource potential of the district has been assessed as perGEC-97 as on 31st March 2013 The primary source of recharge in the area is the rainfall Theground water development in all the blocks has exceeded the available recharge thus all theblocks have been categorized as over exploited The overall stage of ground water developmentin the Faridkot district has been assessed to be 160 The block wise details are given in belowTable-4
Table 4 Dynamic Ground Water Resource amp Development Potential (31032013) in mcmAssessmentUnit Block
NetAnnualGroundWater
Availability
ExistingGross
GroundWater Draft
forirrigation
ExistingGross GroundWater Draftfor domestic
andindustrial
water supply
ExistingGross
GroundWater
Draft forAll uses(11+12)
Provision fordomestic
andindustrial
requirementsupply to
2025
Net GroundWater
Availabilityfor futureirrigation
development(10-11-14)
Stage ofGroundWater
Development(1310)
100()
Category
Faridkot 34632 52861 1911 54771 2219 -20448 158Over
Exploited
Kot Kapura 26821 42020 1402 43421 1511 -16709 162Over
Exploited
TOTAL 61453 94880 3313 98193 3730 -37157 160Over
Exploited
Aquifer Mapping and Management Plan of Faridkot District Punjab State
Page | 29
b In-storage Ground Water ResourcesAs per revised guidelines recommended by the Central Level Expert Group on
groundwater resources assessment the resources are separately considered as dynamic and in-storage unconfined In case of alluvial area in-storage resources of unconfined aquifer havebeen computed on the basis of specific yield of aquifer as detailed below
In-storageGround Water
resources(Unconfined
Aquifer)
=
Thickness of the aquifer(granularproductive zone)
below the zone of water levelfluctuation down to the bottom
layer of unconfined aquifer
x Sp Yield ofthe aquifer
x Areal extentof the
aquifer
The dynamic and in-storage ground water resource estimations have been calculated forsingle aquifer group upto 300m of each block of Faridkot district In-storage ground waterresources are estimated for fresh water and saline water resources based on the geophysicalinterpretations of depth to fresh and saline water interface for each block The fresh and salinecalculations are made on the basis of the assumptions on aquifer that is considered asunconfined aquifer so that the specific yield concept is used for resources estimations (Fig19)The detailed resources estimations are calculated in detailed table for fresh and saline waterresources in the below Table-5 6amp 7
Total Availability of Ground Water Resources = Dynamic Resources + In-storage Resources
Fig19 Conceptual figure to understand the fresh and saline water resources in the aquifer up to300 m for Resource Estimation in Unconfined and Confined Aquifer System
(The clay lenses are more dominant in the aquifer and sometimes huge thickness of clay depositsare also observed in the lithologs)
Aquifer Mapping and Management Plan of Faridkot District Punjab State
Page | 29
b In-storage Ground Water ResourcesAs per revised guidelines recommended by the Central Level Expert Group on
groundwater resources assessment the resources are separately considered as dynamic and in-storage unconfined In case of alluvial area in-storage resources of unconfined aquifer havebeen computed on the basis of specific yield of aquifer as detailed below
In-storageGround Water
resources(Unconfined
Aquifer)
=
Thickness of the aquifer(granularproductive zone)
below the zone of water levelfluctuation down to the bottom
layer of unconfined aquifer
x Sp Yield ofthe aquifer
x Areal extentof the
aquifer
The dynamic and in-storage ground water resource estimations have been calculated forsingle aquifer group upto 300m of each block of Faridkot district In-storage ground waterresources are estimated for fresh water and saline water resources based on the geophysicalinterpretations of depth to fresh and saline water interface for each block The fresh and salinecalculations are made on the basis of the assumptions on aquifer that is considered asunconfined aquifer so that the specific yield concept is used for resources estimations (Fig19)The detailed resources estimations are calculated in detailed table for fresh and saline waterresources in the below Table-5 6amp 7
Total Availability of Ground Water Resources = Dynamic Resources + In-storage Resources
Fig19 Conceptual figure to understand the fresh and saline water resources in the aquifer up to300 m for Resource Estimation in Unconfined and Confined Aquifer System
(The clay lenses are more dominant in the aquifer and sometimes huge thickness of clay depositsare also observed in the lithologs)
Aquifer Mapping and Management Plan of Faridkot District Punjab State
Page | 29
b In-storage Ground Water ResourcesAs per revised guidelines recommended by the Central Level Expert Group on
groundwater resources assessment the resources are separately considered as dynamic and in-storage unconfined In case of alluvial area in-storage resources of unconfined aquifer havebeen computed on the basis of specific yield of aquifer as detailed below
In-storageGround Water
resources(Unconfined
Aquifer)
=
Thickness of the aquifer(granularproductive zone)
below the zone of water levelfluctuation down to the bottom
layer of unconfined aquifer
x Sp Yield ofthe aquifer
x Areal extentof the
aquifer
The dynamic and in-storage ground water resource estimations have been calculated forsingle aquifer group upto 300m of each block of Faridkot district In-storage ground waterresources are estimated for fresh water and saline water resources based on the geophysicalinterpretations of depth to fresh and saline water interface for each block The fresh and salinecalculations are made on the basis of the assumptions on aquifer that is considered asunconfined aquifer so that the specific yield concept is used for resources estimations (Fig19)The detailed resources estimations are calculated in detailed table for fresh and saline waterresources in the below Table-5 6amp 7
Total Availability of Ground Water Resources = Dynamic Resources + In-storage Resources
Fig19 Conceptual figure to understand the fresh and saline water resources in the aquifer up to300 m for Resource Estimation in Unconfined and Confined Aquifer System
(The clay lenses are more dominant in the aquifer and sometimes huge thickness of clay depositsare also observed in the lithologs)
Aquifer Mapping and Management Plan of Faridkot District Punjab State
Page | 30
Table-5 Block wise In-Storage Ground Water Resources of Fresh Water Aquifer
GENERAL DESCRIPTION OF THE GROUND WATER ASSESSMENT UNIT OF DISTRICT FARIDKOT PUNJAB STATE (2013)
Type of Ground Water Assessment Unit (Block) Faridkot Blocks
SrNo
Name ofAssessment
Unit
Type offormation
Areal extent (sq km) AveragePre-
monsoonWaterLevel
(m bgl)
Depth tobottom of
Aquiferbased on
Geophysical Interface
amp Boreholelogging(m bgl)
TotalThickness
offormation
belowPre-
monsoonWaterLevel(m)
(7-6)
Totalthickness
of theGranularZones up
to thedepth of
FreshWaterZones
(m)
Thicknessof the
unsaturated
granularZones up
to Pre-monsoon
WL(m)
Thicknessof the
saturatedgranularZones up
to thedepth of
Freshwater
aquiferbelow (m)
(9-10)
AverageSpecific
Yield
In-StorageGroundWater
Resourcesup to thedepth of
FreshWater
Aquifer(ham)
51112
TotalGeographical Area
AssessmentArea
FreshWater
1 2 3 4 5 6 7 8 9 10 11 12 13
1 Faridkot Alluvium 75210 36710 450 152 1475 72 2 69 0072 182375
2
KotKapura Alluvium 66650 61650 1069 106 9531 51 3 48 0072 213062Dist Total (ham) 141860 228406 395438Dist Total (mcm) 3954
ham hectare metremcm million cubic metre
Aquifer Mapping and Management Plan of Faridkot District Punjab State
Page | 31
Table-6 Block Wise In-Storage Ground Water Resources of Saline Aquifers upto 300 m Depth
GENERAL DESCRIPTION OF THE GROUND WATER ASSESSMENT UNIT OF DISTRICT FARIDKOT PUNJAB STATE (2013)Type of Ground Water Assessment Unit (Block) Faridkot BlocksSrNo
Name ofAssessment
Unit
Type offormation
Areal extent (ha) Depth tobottom of
Aquifer basedon Geophysical
Interface ampBoreholelogging(m bgl)
Depth tobottom of
Saline WaterAquifer
based onGeophysicalInterface ampBorelogging
(m bgl)
Totalthickness
of theSaline
Water upto the max
depth(m)
Totalthickness of
theGranular
Zones up tothe depth of
SalineWaterZones
(m)
AverageSpecific
Yield
In-StorageGroundWater
Resourcesup to thedepth of
SalineWater
Aquifer(ham)
51011
TotalGeographical
Area
AssessmentArea
Saline Water
1 2 3 4 5 6 7 8 9 10 111 Faridkot Alluvium 75210 38500 152 300 148 103 0072 2855162 Kot Kapura Alluvium 66650 5000 106 300 194 76 0072 27360
Dist Total (ham) 141860 228406 312876Dist Total (mcm) 3129
ham hectare metremcm million cubic metre
Aquifer Mapping and Management Plan of Faridkot District Punjab State
Page | 32
Table-7 Block Wise Total Availability of Fresh and Saline Groundwater Resources upto 300 m Depth and Volume of unsaturatedgranular zone after 3m upto water level
BLOCK WISE AVAILABILITY OF TOTAL GROUNDWATER RESOURCES IN FARIDKOT DISTRICTSlNo BLOCK Volume of
UnsaturatedGranular Zone
up to Pre-monsoon WL
DynamicGroundwater
Resources(2013)
AQUIFER-I
In-storageGroundwater
Resources UPTOFRESHWATER
Total FreshGroundwater
Resources[(4)+(5)] (HAM)
Total SalineGroundwater
Resources[(3)+(4)](HAM)
Total Availability ofGroundwater
Resources [(6)+(7)]
ham mcm
1 2 3 4 5 6 7 8 91 Faridkot 10830 34632 182375 217007 285516 502523 50252 Kot Kapura 14396 26821 213062 239883 27360 267243 2672
DistTotal (ham) 25227 61453 395438 456891 312876 769767 7698DistTotal (mcm) 252 615 3954 4569 3129
ham hectare metremcm million cubic metre
Aquifer Mapping and Management Plan of Faridkot District Punjab State
Page | 33
50 GROUND WATER ISSUES
51 Ground Water DepletionThe Study area is famous for its paddy and non paddy cultivation The quality of ground
water in the area is suitable for irrigation and drinking purposes therefore the ground water isconstantly being pumped for the irrigation due to its easy access through tube wells at shallowdepths and they are the main source of irrigation This will lead to its deepening of groundwater levels in blocks of Faridkot and Kot Kapura of Faridkot district as the recharge of thegroundwater through rainfall and other sources are less than the overall extraction Thehydrographs also shows the declining water level trend over the years in the district (Fig20) andis categorized as over-exploited This declining water table trend if not checked would assumean alarming situation in the near future affecting agricultural production and thus economyGround Water Recharge and Conservation may be carried out in these areas to overcome thedepletion Other than the groundwater depletion quality and rising water table are the otherissues
Fig20 Long term ground water table variation
52 Rising Water tableIn western parts of the area water table is rising due to less withdrawal of ground water
because of brackish saline quality coupled with easy availability of canal water for domesticand irrigation purposes As such these areas are likely to get water logged in near future Thereis an urgent need to arrest the rising water trend in western part and implement anti-waterlogging schemes
Aquifer Mapping and Management Plan of Faridkot District Punjab State
Page | 34
53 Ground Water QualityThe ground water of the study area is alkaline in nature Ground water in the area is
generally fresh to marginally saline with fluoride concentration above permissible limit (15mgL) are found mainly in Nathuwala (603) Killi (429) Kot Kapura (333) Dhilwan Kalan(285)and Bir Sikhanwala (184) Nitrate concentration above permissible limit (45mgl) are found inSukhanwala (46) Sher singhwala (65) Wara Daraka (66) Dhilwan Kalan (72)Nathuwala (79)Chand Bhaja (79) Bir Sikhanwala (89) Nangal (104) Tehna (118) Dal Singhwala(136) Killi (140)and KotKapura (144) and iron concentration above permissible limit (15 mgL)are observed inDeviwala (177) There is growing concern on deterioration of ground water quality due togeogenic and anthropogenic activities
54 Ground Water Irrigation ScenarioAs per the data available from minor irrigation census 2005-06 the detailed number of
shallow deep tube wells lined unlined water distribution system land holdings of wells aregiven in Table-89 amp10
Table-8 Distribution of Tube wells According to Well Ownerrsquos land holding SizeType of
Tube well(TW)
Marginal(0-1 ha)
Small(1-2 ha)
Semi-Medium(2-4 ha)
Medium(4-10ha)
Big(gt10ha)
Total
Shallow TW 1100 4029 10069 14576 5314 35088
Deep TW 29 197 596 1188 468 2478
Total 1129 4226 10665 15764 5782 37566
Table-9 Distribution of Tube wells According to DepthDepth of Tubewells in metres Total depth
Range0-150m
Depth range 0-20 m 20-40 m 40-60 m 60-70 m 70-90m 90-150m gt150 m
Tubewells 3507 9947 9998 11636 543 1744 191 37566
Tubewells () 9 26 27 31 1 5 1
Table-10 System of Ground water distribution deviceOpen Water Channels
Linedpucca Unlinedkutcha Others Total2093 35455 18 37566
Aquifer Mapping and Management Plan of Faridkot District Punjab State
Page | 35
60 MANAGEMENT STRATEGIES AND AQUIFER MANAGEMENT PLAN
Aquifer mapping is leads to groundwater management plans to be implemented byincluding demand side-management and Ground Water Use Efficiency
An outline of the Aquifer Management Plan for each block is given in Part-II Thisincludes details regarding population rainfall average annual rainfall agriculture and irrigationwater bodies ground water resource availability ground water extraction and water levelbehavior Aquifer disposition and various cross sections have also been given Ground waterresources extraction and other issues including ground water resource enhancement anddemand side innervations have been given
Artificial recharge plan is less feasible in the Faridkot District due to very low availabilityof volume of surplus water (959 mcm) Another focus has been given to minimize the grossdraft by enhancing ground water use efficiency in irrigation system after replacing the waterdistribution system from unlinedkutcha channel to Under Ground Pipeline System (UGPS) inover exploited blocks of the district
61 Scope of ImplementationThis plan is focusing on the technical aspects of the ground water recharge through
various means so that various implementing agencies may get the appropriate technicalguidelines The existingongoing schemes of the central or state govt like MANERGA IWSPPMKSY (Prime Minister Krishi Sinchai Yojna) NABARD funded schemes Urban Developmentschemes departmentally funded projects etc may be benefitted from the recharge plan byincorporating the input in the operational guidelines design and for locating the specific sites
Agriculture University engineering Collages Academic and Research Institution NGOmay also take up the pilot or demonstrative projects in the blocks suitable to them to plan atlocal level as per local conditions
62 Potential of Enhancing the Ground Water Use EfficiencyThe micro level transformation in the ground water management have vast impact
potential to counter extensive ground water depletion faced in the state of Punjab particularlyin overexploited blocks
There are around 35455 (out of 37566) tube wells (9438 ) operated by farmers forirrigation through unlinedKutcha open channel system in study area (Table-10) where waterfrom the tube well is discharge to the agricultural field In this process huge (around 25 )(RKVY 2015) quantity of ground water is wasted in soil moisture and evaporation losses
Around 95 of the tube wells are of shallow depth (20 to 70m) and remaining wells aredeeper depth (70 to gt150 m) existed in the area (Table-9) Thus majority of wells are tappingshallow aquifer which is under stress
Dynamic ground water resources (2013) indicate that Gross ground water draft forirrigation in the district is estimated at 94880 mcm It is expected that around 25 of overdraft can be brought down by switching over to undergroundsurface pipeline based
Aquifer Mapping and Management Plan of Faridkot District Punjab State
Page | 36
distribution from the prevailing unlined open channels Thereby gross draft will be reduced to224 mcm (Table-11a) assuming that there is no crop diversification by the farmers
The benefit will lead to saving of precious ground water resources in overexploitedblocks The measure if implemented will bring down the ground water overdraft from 160 to123 The category of the blocks will also improve resulting in boosting of agriculture andindustrial development otherwise not sustainable in over-exploited blocks (Table-11b)
The tube wells also consume enormous electricity which is subsidized and governmentincur significant revenue on this account The measures therefore will result in saving of energyand money Pollution impact will be reduced whenever diesel engines are used by the farmersThe environmental and ecological condition in the irrigated land will improve Unwanted weedgrowth will also be controlled inside the farm land It is expected to save 1 of the agriculturalland occupied by open channels which can be utilized for cultivation purpose Heavy groundwater overdraft can be reduced by these efforts This will ensure more crops per drop
63 Water saving Potential from Crop Diversification-Change Paddy to MaizeSoya-beanAs the requirement of water for paddy is much high therefore by changing paddy to
maizesoya-bean will help in saving of water For estimating the water saving by cropdiversification it is assumed that one mcm of water will be saved in case of maize or soyabeanplanted in one sq km of land In case of pulses even higher amount of ground water can besaved
The block wise saving of water in mcm by applying various management strategies suchas crop diversification Under Ground Pipe lines (UGPL) in individual land and artificial rechargemethods are given in tables 11a b
Table-11a Scope of Quantitative Impact on Stage of Development after applying variousmanagement strategies in mcm
Block Net GroundWater
Availability(mcm)
TotalIrrigation
Draft(mcm)
PresentStage of
draft(SOD)
() (Asper
2013)
Reduction in draft by different watersaving method
SODafterwards
()
Change ofpaddy
cultivationarea ( ofexisting)
Replacewater
coursesby UGPipes
(mcm)
AdoptArtificialrecharge
(mcm)
ChangePaddy
toMaize(mcm)
Total(mcm)
(2+3+4)
1 2 3 4 5Faridkot 34632 52861 158 12472 484 7245 20201 9969 -
Kot Kapura 26821 42020 162 9915 475 6264 16654 9986 -Total 61453 94880 160 22387 959 13567 36913 9948
Aquifer Mapping and Management Plan of Faridkot District Punjab State
Page | 37
Table-11b Impact on Stage of Development (SOD) after applying various managementstrategies in Faridkot District
Block PresentSOD ()
as on2013
Reductionin SOD ()
afterunlinedchannel
()
ResultantSOD ()
Col(2 - 3)
Reduction inStage of
developmentafter crop
diversificationby
MaizeSoyabean()
ResultantSOD ()
Col(2 - 5)
Reduction inStage of
developmentafter Artificialrecharge ()
ResultantSOD ()
Col(2 - 7)
1 2 3 4 5 6 7 8Faridkot 158 3601 12199 2090 13710 140 15660
KotKapura 162 3697 12503 2340 13860 177 16023
Total 160 3664 12336 2210 13790 178 15822
By adopting all the management strategies resulting in total reduction in stage of groundwaterdevelopment is 6052 Hence overall stage of development afterwards is 9948 and is givenin Table12
Table-12 Overall Stage of Development (SOD) after reduction in Faridkot
Block PresentStage of
development() as on
2013
Reduction instage of
developmentafter unlinedchannel ()
Reduction inStage of
developmentafter crop
diversificationby
MaizeSoyabean()
Reduction inStage of
developmentafter Artificialrecharge ()
TotalReduction in
Stage ofdevelopment
()
(3 +4+5)
Stage ofdevelopmentafterwards
()
(2-6)
1 2 3 4 5 6 7Faridkot 158 3601 2090 140 5831 9969
Kot Kapura 162 3697 2340 177 6214 9986Total 160 3664 2210 178 6052 9948
Aquifer Mapping and Management Plan of Faridkot District Punjab State
Page | 38
70 CONCLUSIONS1 The area lies in the central part of Satluj basin of Indo-Gangetic Alluvial plain
Geologically the area is occupied by a thick sequence of Quaternary deposits of Mid-Pleistocene to Recent age
2 The Principle Aquifer system in the study area is Alluvium and the Major Aquifers areOlder Alluvium and Aeolian Alluvium
3 Lithological characteristics of the area are Multi-cyclic light grey to brown fine tomedium grained mixture of clay silt and sand with Kankar
4 Thick layering of clay with sand at many places can be observed towards south of thedistrict at deeper depths The Ground water occurs in unconfined (water table) andconfined conditions
5 Chemical data of ground water from shallow aquifer indicates that ground water isalkaline and fresh to moderately saline
6 To delineate fresh water - saline water interface laterally as well as vertically surfacegeophysical investigations have been carried out in alluvial tracts
7 To understand the sub surface disposition geological sections and fence diagram havebeen prepared by synthesizing the various sub-surface sections on the basis of study ofthe lithological logs and electrical logs of boreholes drilled by CGWB WRED PSTC andPrivate Agencies using the RockWorks15 software
8 Aquifer IA (Very Shallow Aquifer) extends maximum upto 70 m of depth and below thatclay layer starts getting thickened about 10-12m separating Aquifer IB to a maximumdepth of 123 m Multi layer aquifers are existing in the area each aquifer is separated bythick clay zones of 25 to 40 m upto 300m depth It is very difficult to differentiate theaquifer groups after Aquifer Group I so the whole lithology is considered to be a singleaquifer group system
9 Stage of Ground Water Development of the district is 160 on the basis of Dynamicground water resources 2013 In- storage ground water resources has also beencalculated up to a depth of 300 meters
10 The fresh water resources are inadequate in aquifer upto maximum depth of 106mwhereas saline water is dominant resources below 106 m depth upto 300 m In thenorth of the district towards Faridkot block fresh water is available upto 152m depth
11 Dynamic ground water resources of the study area are 61453 mcm whereas In-storageground water resources up to fresh water zones are 3954 mcm Thus total fresh groundwater resources up to maximum depth of 152 m are 4569 mcm Total saline waterresources up to depth of 300 m are 3129 mcm
12 Main groundwater issues in the area are groundwater depletion quality and risingwater table
13 Considering the high ground water abstraction for irrigation (94880 mcm) andoverdraft (37157 mcm) it is suggested that proposed artificial recharge measures (959mcm) crop diversification measures (13567 mcm) and conserving ground waterthrough laying of underground pipe line (22387 mcm) will be useful
14 Other techniques of water saving and modern irrigation technology to be enforced tomaximize per drop of water use in the district and also to think about the hidden salinewater resources and for its utilizations
Aquifer Mapping and Management Plan of Faridkot District Punjab State
Page | 39
BLOCK WISE
AQUIFER MAPS
AND
MANAGEMENT PLAN
(PART-II)
Aquifer Mapping and Management Plan of Faridkot District Punjab State
Page | 40
I Salient Information of Faridkot Block
Block Area(in Km2)
75210 sq km
District State Faridkot PunjabPopulation Urban Population 2260
Rural Population 179432Total population 181692
Rainfall NormalMonsoon 335 mm
Non-monsoon Rainfall 35 mmAnnual Average Rainfall 349 mm
Agriculture and Irrigation Principal crops Wheat Cotton and PaddyGross cropped area 119562 sq kmNet sown area 59180 sq kmIrrigation practices Canal and Tube well IrrigationCropping intensity 202Area underGround water Irrigation 6159 sq kmSurface water irrigation 51143 sq kmNumber and types of abstraction structures 20927 Tubewells
Ground Water ResourceAvailability and Extraction
Ground water Resources AvailabilityTotal Ground Water Resources available is 5025 mcm (fresh andsaline water) up to the depth of 300m The fresh water resourcesare estimated up to the depth of 152 m on the basis of geophysicalinterpretations The potential granular zones available for freshwater are calculated as 72 m Saline water resources are estimatedon the basis of available well depth (up to 300 m) and the granularzones are counted after depth of 152 m and available zones are 103m Block is categorized as Over-Exploited as per DynamicGroundwater Resources 2013 assessment
Ground water Resources ExtractionDeeper aquifers are marginal to highly saline and not suitable forirrigation purpose as such all users are tapping shallow aquifersDrinking water supply wells of State Government tapping shallowaquifers Therefore the ground water draft could not be assessed fordeeper aquifer
Aquifer Mapping and Management Plan of Faridkot District Punjab State
Page | 41
Existing and future waterdemands
Existing Gross Ground water Draft as on 2013Irrigation 52861 mcmDomestic and industrial water supply 1911 mcmFuture water demandsIrrigation development potential (-)2045 mcmDomestic and industrial water supply up to 2025 years 2219 mcm
Water level behavior Aquifer wise water levelAquifer-IPre Monsoon 145 ndash 1522 m bglPost Monsoon 120 ndash 1310 m bglMean (10 yrs) 100 ndash (-)101 myrTrendsPre Monsoon 018 ndash (-)022 myrPost Monsoon 024 ndash (-)030 myrAquifer-IINo Monitoring stations
Aquifer-IIINo Monitoring stations
HYDROGRAPH SHOWING DECLINING WATER TABLE
Aquifer Mapping and Management Plan of Faridkot District Punjab State
Page | 42
HYDROGRAPH SHOWING DECLINING WATER TABLE
HYDROGRAPH SHOWING DECLINING WATER TABLE
Monitoring well Golewala dried after 2004
Aquifer Mapping and Management Plan of Faridkot District Punjab State
Page | 43
Aquifer Disposition
Number of aquifers 1
Principal aquifer AlluviumMajor Aquifer Older Alluvium Aeolian Alluvium
Exploratory Data AvailabilitySource of Data No of exploration wells as per depth range (m) Total
lt100 100-200 200-300 gt300
CGWB 1 0 0 4 5WREDPSTCWSS 6 1 0 2 9PRIVATE 0 0 0 0 0TOTAL 7 1 0 6 14
Aquifer wise Characteristics (CGWB 2012)AquiferGroup
Geology Type ofAquifer
ThicknessofGranularzones (m)
Transmissivity(m2day)
YieldDischarge
(m3day)
SpecificYield
Storativity
SingleAquiferSystem
Quarter-naryAlluvialdeposits
Unconfined toconfined
175 474 - 2660 939 -55944
12 (0072)
175 x 10-3
-18 x 10-3
Well field proposed in adjacent blockThe Aquifer comprises of fresh and saline water and the major aquifer material is sand Theaquiclude and aquitard comprises of clay clay with siltExploratory Data Validated
Source of Data No of exploration wells as per depth range (m) Totallt100 100-200 200-300 gt300
CGWB 0 0 0 4 4WREDPSTCWSS 0 0 0 2 2PRIVATE 0 0 0 0 0TOTAL 0 0 0 6 6
The data is validated by selecting the deepest well in each quadrant and used for preparation of3-D Litho models 2-D Geological Cross Sections Fence Diagrams and Aquifer Maps
Aquifer Mapping and Management Plan of Faridkot District Punjab State
Page | 44
3-D Lithological Model of Faridkot Block
Lithological Cross Section from Dip Singh Wala to Nangal
Lithological Cross Section from Toot to Nangal
Aquifer Mapping and Management Plan of Faridkot District Punjab State
Page | 45
3-D Lithological Fence Diagram
3-D Aquifer Disposition Fence Diagram
Aquifer Mapping and Management Plan of Faridkot District Punjab State
Page | 45
3-D Lithological Fence Diagram
3-D Aquifer Disposition Fence Diagram
Aquifer Mapping and Management Plan of Faridkot District Punjab State
Page | 45
3-D Lithological Fence Diagram
3-D Aquifer Disposition Fence Diagram
Aquifer Mapping and Management Plan of Faridkot District Punjab State
Page | 46
Ground water Resource Extraction Contamination and other issues in Faridkot Block
Ground WaterResources upto thedepth of 300m
Dynamic Fresh waterresources
34632 mcm
In-storage Fresh waterresources
182375 mcm
In-storage Saline waterresources
285516 mcm
Total 502523 mcmGround WaterExtraction (as per 2013)
Irrigation 52861 mcm
Domestic amp Industrial 1911 mcm
Future Demand for domestic amp Industrial sector(2025) (as per 2013)
2219 mcm
Stage of Groundwater Development 158
Chemical Quality of ground water Ground water in the area is alkaline and pHranges between 794 to 917 Groundwater in the area is fresh to marginal salineEC value of ground water show widevariations and ranges from 444 Scm to8653Scm at 250CRSC values vary from (ndash) 73 to 113 meqLarea is fit for irrigation
Ground water Contamination Issues Fluoride (mgl)Nathuwala (603) Killi(429)Nitrate (mgl)Sukhanwala (46) Sher Singhwala (65)Nathuwala (79) Chand Baja (79) Nangal(104) Tehna (118) Killi (140)Iron (mg)Devi wala (177)
Other issues Water level decline has been observed inmajor parts of the block due to indiscriminate development of ground waterresourcesIn shallow water level area lessdevelopment of ground water resourcecouple with recharge from canal irrigationis causing water logging and inland salinityproblems
Aquifer Mapping and Management Plan of Faridkot District Punjab State
Page | 47
Ground water Resource Enhancement Potential
Aquifer wise space available for recharge and proposed interventions (Supply Side Measures)
Aquifer-I
Volumes of unsaturated zone after 3m upto a desirable depth 10830 mcmSource water requirementavailability for recharge Rain Canal Irrigation return flowTypes and number of structures NAOther interventions proposed Artificial Recharge Roof top Rainwater harvesting will conserve484 mcm volume of water
Demand side interventions
Advanced Irrigation PracticesArea proposed to be covered Entire Block Faridkot (75210 sq km)Volume of Water expected to be conserved under advanced irrigation practices such as lining ofunderground pipelines (Kutcha channel) 12472 mcm
Required Change in cropping pattern
Proposed change in cropping pattern Paddy to Maize Soyabean The overexploitation can bemanaged at sustainable level (100) by changing the Paddy cropArea coverage 15 of the total paddy area needs to change ie7245 sq kmAnticipated volume of water to be saved 7245 mcm
Net AnnualGroundWater
Availability2013
(mcm)
TotalIrrigation Draft
(present)(mcm)
GrossDraft alluses(present)(mcm)
Paddyarea
(Sq km)
RequiredArea to
beChange
fromPaddy toMaize
soyabean
(Sq km)
Amountof
WaterSaved(mcm)
Grossdraftafter
savingof water(mcm)
PresentStage of
development ()
Reductionin Stage ofdevelopme
nt afterMaize
soya bean()
CropDiversifiedarea ()
34632 52861 54771 48300 7245 7245 45616 158 209 15
Alternate Water sourcesSurface water sources Tanks PondsLocation details and availability from such sources outside the area Not AvailableRegulation and Control
Punjab Subsoil Act for delay in paddy plantation should continue in the area
Aquifer Mapping and Management Plan of Faridkot District Punjab State
Page | 48
Other interventions proposed if anyModern Irrigation Practices be adopted for Rabi crops Some of the techniques are given in
the table below (PAU Ludhiana)
SlNo Techniques Water Saving()
Crops
1 Mulching 17 Wheat2 Bed Planting 18-25 Wheat3 Use of Sprinkler and drip
Irrigation70-90 Sugarcane Cotton Sunflower Maize
Other than that by 15 days ponding followed by 2 days of drying can lead to 25 saving of water inpaddy crop
Aquifer Mapping and Management Plan of Faridkot District Punjab State
Page | 49
II Salient Information of Kot Kapura Block
Block Area(in Km2)
66650 sq km
District State Faridkot PunjabPopulation Urban Population 373
Rural Population 221025Total population 221398
Rainfall Normal Monsoon 328 mmNon-monsoon Rainfall 61 mmAnnual Average Rainfall 370 mm
Agriculture and Irrigation Principal crops Wheat Cotton and PaddyGross cropped area 133427 sq kmNet sown area 67498 sq kmIrrigation practices Canal and Tube well IrrigationCropping intensity 198Area underGround water Irrigation 4278 sq kmSurface water irrigation 62899 sq kmNumber and types of abstraction structures 16639 Tubewells
Ground Water ResourceAvailability and Extraction
Ground water Resources AvailabilityTotal Ground Water Resources available is 2672 mcm (fresh andsaline water) up to the depth of 300 m The fresh water resourcesare estimated up to the depth of 106 m on the basis of geophysicalinterpretations The potential granular zones available for freshwater are 51 m Saline water resources are estimated on the basis ofwell (up to 300 m) and the granular zones are counted after depth of106 m and available zones are 76 m Block is categorized as Over-Exploited as per Dynamic Groundwater Resources 2013 assessment
Ground water Resources ExtractionDeeper aquifers are marginal to highly saline and not suitable forirrigation purpose as such all users are tapping shallow aquifersDrinking water supply wells of State Government tapping shallowaquifers Therefore the ground water draft could not be assessed fordeeper aquifer
Aquifer Mapping and Management Plan of Faridkot District Punjab State
Page | 50
Existing and future waterdemands
Existing Gross Ground water Draft as on 2013Irrigation 42020 mcmDomestic and industrial water supply 1402 mcmFuture water demandsIrrigation development potential (-)16709 mcmDomestic and industrial water supply up to 2025 years 1511 mcm
Water level behavior Aquifer wise water levelAquifer-IPre Monsoon 235 ndash 1600 m bglPost Monsoon 155 ndash 1820 m bglMean (10 yrs) 158 ndash (-)086 myrTrendsPre Monsoon 016 ndash (-)026 myrPost Monsoon 015 ndash (-)029 myrAquifer-II (156m)Pre Monsoon 772 m bglPost Monsoon 805 m bglAquifer-III (269m)Pre Monsoon NAPost Monsoon 820 m bgl
HYDROGRAPH SHOWING DECLINING WATER TABLE
Aquifer Mapping and Management Plan of Faridkot District Punjab State
Page | 51
HYDROGRAPH SHOWING DECLINING WATER TABLE
HYDROGRAPH SHOWING DECLINING WATER TABLE
Aquifer Mapping and Management Plan of Faridkot District Punjab State
Page | 52
Aquifer Disposition
Number of aquifers 1
Principal aquifer AlluviumMajor Aquifer Older Alluvium Aeolian Alluvium
Exploratory Data AvailabilitySource of Data No of exploration wells as per depth range (m) Total
lt100 100-200 200-300 gt300
CGWB 2 1 1 4 8WREDPSTCWSS 8 0 0 1 9PRIVATE 1 0 1 0 2TOTAL 11 1 2 5 19
Aquifer wise Characteristics (CGWB2015)AquiferGroup
Geology Type ofAquifer
ThicknessofGranularzones (m)
Transmi-ssivity(m2day)
Yield(m3day)
SpecificYield
Storativity
SingleAquiferSystem
QuaternaryAlluvialdeposits
Unconfinedto confined
127 547 -2990
3668 12 (0072) 72x10-4
Well field proposed in this block (Site Location Deviwala)The Aquifer comprises of fresh and saline water and the major aquifer material is sand Theaquiclude and aquitard comprises of clay clay with siltExploratory Data Validated
Source of Data No of exploration wells as per depth range (m) Totallt100 100-200 200-300 gt300
CGWB 0 0 1 4 5WREDPSTCWSS 0 0 0 1 1PRIVATE 0 0 1 0 1TOTAL 0 0 2 5 7
The data is validated by selecting the deepest well in each quadrant and used for preparation of3-D Litho models 2-D Geological Cross Sections Fence Diagrams and Aquifer Maps
Aquifer Mapping and Management Plan of Faridkot District Punjab State
Page | 53
3-D Lithological model of Kot Kapura Block
Lithological Cross section from Wara Daraka to Aulakh
Lithological Cross section from Nangal to Dal Singhwala
Aquifer Mapping and Management Plan of Faridkot District Punjab State
Page | 54
3-D Lithological Fence Diagram
3-D Aquifer Disposition Fence Diagram
Aquifer Mapping and Management Plan of Faridkot District Punjab State
Page | 54
3-D Lithological Fence Diagram
3-D Aquifer Disposition Fence Diagram
Aquifer Mapping and Management Plan of Faridkot District Punjab State
Page | 54
3-D Lithological Fence Diagram
3-D Aquifer Disposition Fence Diagram
Aquifer Mapping and Management Plan of Faridkot District Punjab State
Page | 55
Ground water Resource Extraction Contamination and other issues in Kot Kapura Block
Ground WaterResources upto thedepth of 300m
Dynamic Fresh waterresources
26821 mcm
In-storage Fresh waterresources
213062 mcm
In-storage Saline waterresources
27360 mcm
Total 267243 mcmGround WaterExtraction (as per 2013)
Irrigation 42020 mcm
Domestic amp Industrial 1402 mcm
Future Demand for domestic amp Industrial sector(2025) (as per 2013)
1511 mcm
Stage of Groundwater Development 162
Chemical Quality of ground water Ground water in the area is alkaline and pHranges between 820 to 893 Ground waterin the area is slightly fresh to marginalsaline EC value of the ground water showwide variations and ranges from 1154Scm to 3988 Scm at 250CRSC values are varies from -003 to 1100meqL and the area is fit for irrigation
Ground water Contamination Issues Fluoride (mgl)Kot Kapura (333) Dhilwan kalan (285)Moharewala ( 195) Bir Sikhanwala ( 184)Nitrate (mgl)Wara Daraka (66) Dhilwan Kalan (72)Moharewala (78) Bir sikhan wala (89)KotKapura (144)
Other issues Water level decline has been observed inmajor parts of the block due to indiscriminate development of ground waterresourcesIn shallow water level area lessdevelopment of ground water resourcecouple with recharge from canal irrigation iscausing water logging and inland salinityproblems
Aquifer Mapping and Management Plan of Faridkot District Punjab State
Page | 56
Ground water Resource Enhancement Potential
Aquifer wise space available for recharge and proposed interventions (Supply Side Measures)
Aquifer-I
Volume of unsaturated zone after 3m upto a desirable depth 14396 mcmSource water requirementavailability for recharge Rain Canal Irrigation return flowTypes and number of structures NAOther interventions proposed Artificial Recharge Roof top Rainwater harvesting will conserve475 mcm volume of water
Demand side interventions
Advanced Irrigation PracticesArea proposed to be covered Entire Kot Kapura Block (66650 sq km)Volume of Water expected to be conserved under advanced irrigation practices such as lining ofunderground pipelines (Kutcha channel) etc 9915 mcm
Required Change in cropping pattern
Proposed change in cropping pattern Rice to Maize Soyabean The overexploitation can bemanaged at sustainable level (100) by changing the Paddy cropArea coverage 12 of the total rice area needs to change ie 6264 sq kmAnticipated volume of water to be saved 6264 mcm
Net AnnualGroundWater
Availability2013
(mcm)
TotalIrrigation Draft
(present)(mcm)
GrossDraft alluses(present)(mcm)
Paddyarea
(Sq km)
RequiredArea to be
Changefrom
Paddy toMaize
soya bean(Sq km)
Amountof
WaterSaved(mcm)
Grossdraftafter
savingof water(mcm)
PresentStage of
development ()
Reductionin Stage ofdevelopme
nt afterMaize
soya bean()
CropDiversifiedarea ()
26821 42020 43421 52200 6264 6264 35756 162 234 12
Alternate Water sourcesSurface water sources Tanks PondsLocation details and availability from such sources outside the area Not AvailableRegulation and Control
Punjab Subsoil Act for delay in paddy plantation should continue in the area
Other interventions proposed if anyModern Irrigation Practices be adopted for Rabi crops Some of the techniques are given in
the table below (PAU Ludhiana)
Aquifer Mapping and Management Plan of Faridkot District Punjab State
Page | 57
SlNo Techniques Water Saving()
Crops
1 Mulching 17 Wheat2 Bed Planting 18-25 Wheat3 Use of Sprinkler and drip
Irrigation70-90 Sugarcane Cotton Sunflower Maize
Other than that by 15 days ponding followed by 2 days of drying can lead to 25 saving of water inpaddy crop
Aquifer Mapping and Management Plan of Faridkot District Punjab State
Page | 58
Annexure-I
Nd Not Determined BDL Below Detection Limit
Aquifer Mapping and Management Plan of Faridkot District Punjab State
Page | 59
Annexure-IIData Availability of Exploration Wells of Faridkot district
SlNo LOCATION LONGITUDE LATITUDE DEPTH ELEVATION BLOCK DEPARTMENT1 Dal Singhwala 74950 30469 300 211 Kot Kapura CGWB2 Dip Singh Wala 74483 30742 300 201 Faridkot CGWB3 Golewala 74692 30792 300 1995 Faridkot CGWB4 Jaito Mandi 74891 30446 300 203 Kot Kapura CGWB5 Kot Kapura 74814 30576 300 206 Kot Kapura CGWB6 Nanak Nagri 74893 30581 200 210 Kot Kapura PRIVATE7 Nangal 74869 30669 300 206 Faridkot CGWB8 Tehna 74790 30690 300 205 Faridkot CGWB9 Wara Daraka 74797 30548 300 205 Kot Kapura CGWB
10 Aulakh 74920 30643 300 211 Kot Kapura PSTC11 Bhagthala 74786 30777 300 198 Faridkot PSTC12 Sadhuwala 74559 30717 300 196 Faridkot PSTC13 Deviwala 74870 30612 269 207 Kot Kapura CGWB14 Deviwala-I 74870 30612 156 207 Kot Kapura CGWB15 Kouni 74675 30760 60 194 Faridkot WSS16 Ghugiana 74639 30746 60 198 Faridkot WSS17 Pahluwala 74763 30799 60 203 Faridkot WSS18 Faridkot 74763 30681 60 203 Faridkot WSS19 Doda Bhundar 75016 30470 121 212 Kot Kapura WRED20 Dhudi 74849 30700 60 207 Faridkot WSS21 Ratti Rori 74811 30647 60 208 Faridkot WSS22 Chak Kalyan 74705 30572 60 203 Kot Kapura WSS23 Kot Kapura 74812 30596 60 208 Kot Kapura WSS24 Behbal Kalan 74913 30531 60 210 Kot Kapura WSS25 Rorian Kapura 74815 30439 60 207 Kot Kapura WSS26 Panjgrain 74914 30608 70 211 Kot Kapura PRIVATE27 Fatehgarh 74943 30405 60 208 Kot Kapura WSS
28Bhurj JawarSingh 74987 30535 60 211 Kot Kapura WRED
29 Dewarana 74766 30593 30 206 Kot Kapura WRED30 Sher Singhwala 74628 30665 65 195 Faridkot CGWB31 Bir Sikhan wala 74849 30627 65 207 Kot Kapura CGWB32 Dohak 74603 30632 163 197 Muktsar CGWB33 Toot 74645 30829 217 196 Ghal khurd CGWB
Two exploratory wells from adjacent districts ie Dohak from Muktsar district and Toot fromFerozpur district have been incorporated for the preparation of lithological fence and crosssections
Aquifer Mapping and Management Plan of Faridkot District Punjab State
Page | 60
Annexure-IIILITHOLOGICAL DATA OF WELLS IN FARIDKOT DISTRICT
Well Location Depth from Depth to Lithology Thickness
Dal Singhwala
0 13 Clay 1313 20 Fresh Sand 720 28 Clay 828 57 Fresh Sand 2957 64 Clay 764 75 Saline Sand 1175 78 Clay 378 97 Saline Sand 1997 108 Clay 11
108 117 Saline Sand 9117 122 Clay 5122 134 Saline Sand 12134 157 Clay 23157 173 Saline Sand 16173 179 Clay 6179 184 Saline Sand 5184 211 Clay 27211 219 Saline Sand 8219 253 Clay 34253 259 Saline Sand 6259 278 Clay 19278 293 Saline Sand 15293 298 Clay 5298 300 Saline Sand 2
Dip Singh Wala
0 8 Fresh Sand 88 36 Clay 28
36 68 Fresh Sand 3268 755 Clay 75
755 805 Fresh Sand 5805 83 Clay 2583 92 Fresh Sand 992 93 Clay 193 109 Saline Sand 16
109 113 Clay 4113 116 Saline Sand 3116 120 Clay 4120 132 Saline Sand 12
Aquifer Mapping and Management Plan of Faridkot District Punjab State
Page | 61
Dip Singh Wala 132 146 Clay 14146 162 Saline Sand 16162 168 Clay 6168 192 Saline Sand 24192 195 Clay 3195 197 Saline Sand 2197 2015 Clay 45
2015 209 Saline Sand 75209 2135 Clay 45
2135 2175 Saline Sand 42175 221 Clay 35221 237 Saline Sand 16237 2865 Clay 495
2865 2895 Saline Sand 32895 293 Clay 35293 296 Saline Sand 3296 300 Clay 4
Golewala
0 75 Clay 7575 2885 Fresh Sand 2135
2885 40 Clay 111540 525 Fresh Sand 125
525 60 Clay 7560 88 Saline Sand 2888 93 Clay 593 103 Saline Sand 10
103 1325 Clay 2951325 1375 Saline Sand 51375 155 Clay 175155 1575 Saline Sand 25
1575 182 Clay 245182 2035 Saline Sand 215
2035 2285 Clay 252285 234 Saline Sand 55234 253 Clay 19253 2725 Saline Sand 195
2725 280 Clay 75280 2975 Saline Sand 175
2975 300 Clay 25Jaito Mandi 0 15 Clay 15
15 25 Fresh Sand 1025 28 Clay 3
Aquifer Mapping and Management Plan of Faridkot District Punjab State
Page | 62
Jaito Mandi 28 42 Fresh Sand 1442 46 Clay 446 59 Fresh Sand 1359 80 Clay 2180 915 Fresh Sand 115
915 103 Clay 115103 107 Fresh Sand 4107 1555 Clay 485
1555 1715 Fresh Sand 161715 191 Clay 195191 213 Saline Sand 22213 220 Clay 7220 223 Saline Sand 3223 238 Clay 15238 255 Saline Sand 17255 273 Clay 18273 2785 Saline Sand 55
2785 2805 Clay 22805 283 Saline Sand 25283 2985 Clay 155
2985 300 Saline Sand 15
Kot Kapura
0 14 Clay 1414 21 Fresh Sand 721 25 Clay 425 355 Fresh Sand 105
355 37 Clay 1537 50 Fresh Sand 1350 57 Clay 757 64 Fresh Sand 764 69 Clay 569 77 Fresh Sand 877 88 Clay 1188 99 Fresh Sand 1199 103 Clay 4
103 106 Saline Sand 3106 123 Clay 17123 1286 Saline Sand 56
1286 130 Clay 14130 1326 Saline Sand 26
1326 134 Clay 14134 1355 Saline Sand 15
Aquifer Mapping and Management Plan of Faridkot District Punjab State
Page | 63
Kot Kapura
1355 1492 Clay 1371492 1518 Saline Sand 261518 155 Clay 32155 1584 Saline Sand 34
1584 161 Clay 26161 1796 Saline Sand 186
1796 1812 Clay 161812 1838 Saline Sand 261838 1865 Clay 271865 2045 Saline Sand 182045 207 Clay 25207 2125 Saline Sand 55
2125 249 Clay 365249 2545 Saline Sand 55
2545 280 Clay 255280 2944 Saline Sand 144
2944 300 Clay 56
Nanak Nagri
0 136 Clay 136136 208 Fresh Sand 72208 265 Clay 57265 305 Fresh Sand 4305 34 Clay 3534 368 Fresh Sand 28
368 388 Clay 2388 40 Fresh Sand 1240 428 Clay 28
428 46 Fresh Sand 3246 695 Clay 235
695 712 Fresh Sand 17712 785 Clay 73785 815 Fresh Sand 3815 84 Clay 2584 87 Fresh Sand 387 92 Clay 592 936 Saline Sand 16
936 988 Clay 52988 100 Saline Sand 12100 1085 Clay 85
1085 1115 Saline Sand 31115 118 Clay 65118 120 Saline Sand 2
Aquifer Mapping and Management Plan of Faridkot District Punjab State
Page | 64
Nanak Nagri 120 128 Clay 8128 1296 Saline Sand 16
1296 130 Clay 04130 1316 Saline Sand 16
1316 135 Clay 34135 1368 Saline Sand 18
1368 165 Clay 282165 1676 Saline Sand 26
1676 184 Clay 164184 1868 Saline Sand 28
1868 1905 Clay 371905 1948 Saline Sand 431948 2134 Clay 186
Nangal
0 8 Clay 88 20 Fresh Sand 12
20 23 Clay 323 28 Fresh Sand 528 29 Clay 129 41 Fresh Sand 1241 72 Clay 3172 80 Fresh Sand 880 91 Clay 1191 124 Fresh Sand 33
124 151 Clay 27151 158 Fresh Sand 7158 163 Clay 5163 171 Fresh Sand 8171 181 Clay 10181 187 Fresh Sand 6187 193 Clay 6193 199 Fresh Sand 6199 203 Clay 4203 219 Fresh Sand 16219 224 Clay 5224 233 Saline Sand 9233 243 Clay 10243 249 Saline Sand 6249 251 Clay 2251 257 Saline Sand 6257 300 Clay 43
Tehna 0 8 Clay 8
Aquifer Mapping and Management Plan of Faridkot District Punjab State
Page | 65
Tehna
8 23 Fresh Sand 1523 28 Clay 528 32 Fresh Sand 432 37 Clay 537 41 Fresh Sand 441 59 Clay 1859 63 Fresh Sand 463 69 Clay 669 72 Fresh Sand 372 102 Clay 30
102 106 Fresh Sand 4106 120 Clay 14120 123 Fresh Sand 3123 133 Clay 10133 136 Fresh Sand 3136 145 Clay 9145 150 Fresh Sand 5150 158 Clay 8158 163 Fresh Sand 5163 168 Clay 5168 172 Fresh Sand 4172 176 Clay 4176 184 Fresh Sand 8184 210 Clay 26210 215 Fresh Sand 5215 221 Clay 6221 225 Fresh Sand 4225 254 Clay 29254 264 Fresh Sand 10264 267 Clay 3267 275 Fresh Sand 8275 294 Clay 19294 300 Fresh Sand 6
Wara Daraka
0 15 Clay 1515 22 Fresh Sand 722 28 Clay 628 48 Fresh Sand 2048 52 Clay 452 61 Fresh Sand 961 65 Clay 465 75 Fresh Sand 10
Aquifer Mapping and Management Plan of Faridkot District Punjab State
Page | 66
Wara Daraka
75 84 Clay 984 86 Saline Sand 286 91 Clay 591 97 Saline Sand 697 101 Clay 4
101 119 Saline Sand 18119 124 Clay 5124 129 Saline Sand 5129 150 Clay 21150 172 Saline Sand 22172 184 Clay 12184 188 Saline Sand 4188 196 Clay 8196 205 Saline Sand 9205 234 Clay 29234 239 Saline Sand 5239 274 Clay 35274 281 Saline Sand 7281 300 Clay 19
Aulakh
0 1829 Clay 18291829 4573 Fresh Sand 27444573 7621 Clay 30487621 9146 Fresh Sand 15259146 10975 Clay 1829
10975 1128 Saline Sand 3051128 13414 Clay 2134
13414 16768 Saline Sand 335416768 20112 Clay 334420112 21036 Saline Sand 92421036 21341 Clay 30521341 21951 Saline Sand 6121951 2256 Clay 6092256 245 Saline Sand 194245 300 Clay 55
Bhagthala
0 35 Clay 3535 1829 Fresh Sand 1479
1829 41 Clay 227141 53 Fresh Sand 1253 63 Clay 1063 8537 Saline Sand 2237
8537 92 Clay 663
Aquifer Mapping and Management Plan of Faridkot District Punjab State
Page | 67
92 102 Saline Sand 10102 1311 Clay 291
1311 13415 Saline Sand 30513415 16768 Clay 335316768 17073 Saline Sand 30517073 185 Clay 1427
185 203 Saline Sand 18203 22866 Clay 2566
22866 23476 Saline Sand 6123476 253 Clay 1824
253 273 Saline Sand 20273 280 Clay 7280 294 Saline Sand 14294 300 Clay 6
Sadhuwala
0 61 Fresh Sand 6161 3049 Clay 2439
3049 52 Saline Sand 215152 625 Clay 105
625 725 Saline Sand 10725 77 Clay 4577 84 Saline Sand 784 91 Clay 791 107 Saline Sand 16
107 110 Clay 3110 114 Saline Sand 4114 118 Clay 4118 130 Saline Sand 12130 14339 Clay 1339
14339 16463 Saline Sand 212416463 17683 Clay 12217683 207 Saline Sand 3017
207 2115 Clay 452115 2155 Saline Sand 42155 219 Clay 35219 235 Saline Sand 16235 237 Clay 2237 25624 Saline Sand 1924
25624 27134 Clay 15127134 300 Saline Sand 2866
Deviwala0 15 Clay 15
15 23 Fresh Sand 8
Aquifer Mapping and Management Plan of Faridkot District Punjab State
Page | 68
Deviwala
23 38 Clay 1538 46 Fresh Sand 846 48 Clay 248 53 Fresh Sand 553 61 Clay 861 65 Fresh Sand 465 72 Clay 772 78 Fresh Sand 678 94 Clay 1694 106 Fresh Sand 12
106 109 Clay 3109 112 Saline Sand 3112 128 Clay 16128 140 Saline Sand 12140 158 Clay 18158 163 Saline Sand 5163 179 Clay 16179 183 Saline Sand 4183 187 Clay 4187 196 Saline Sand 9196 202 Clay 6202 213 Saline Sand 11213 218 Clay 5218 223 Saline Sand 5223 252 Clay 29252 258 Saline Sand 6258 263 Clay 5263 269 Saline Sand 6
Dohak
0 8 Clay 88 10 Fresh Sand 2
10 21 Clay 1121 33 Saline Sand 1233 41 Clay 841 79 Saline Sand 3879 89 Clay 1089 95 Saline Sand 695 99 Clay 499 112 Saline Sand 13
112 116 Clay 4116 139 Saline Sand 23139 154 Clay 15
Aquifer Mapping and Management Plan of Faridkot District Punjab State
Page | 69
154 163 Saline Sand 9
Toot
0 15 Clay 1515 198 Fresh Sand 48
198 21 Clay 1221 474 Fresh Sand 264
474 51 Clay 3651 552 Fresh Sand 42
552 626 Clay 74626 766 Fresh Sand 14766 101 Clay 244101 104 Fresh Sand 3104 113 Clay 9113 116 Fresh Sand 3116 143 Clay 27143 146 Saline Sand 3146 167 Clay 21167 170 Saline Sand 3170 182 Clay 12182 204 Saline Sand 22204 214 Clay 10214 217 Saline Sand 3
Aquifer Mapping and Management Plan of Faridkot District Punjab State
Page | 70
Annexure-IVAQUIFER GROUPING OF WELL LOCATIONS IN FARIDKOT DISTRICT
Well location Depth from Depth to Aquifer Thickness FreshGranular
Zones
SalineGranular
Zones
Dal Singhwala
0 15 Unsaturated Zone 15 215 57 Aquifer Group-IA 42 3457 64 Aquiclude-IA 764 134 Aquifer Group-IB 70 51
134 157 Aquiclude-IB 23157 300 Multiple Aquifers 143 52
Dip Singh Wala
0 5 Unsaturated Zone 5 55 68 Aquifer Group-IA 63 35
68 755 Aquiclude-IA 75755 132 Aquifer Group-IB 565 14 31132 146 Aquiclude-IB 14146 300 Multiple Aquifers 154 755
Golewala
0 4 Unsaturated Zone 4 14 525 Aquifer Group-IA 485 33
525 60 Aquiclude-IA 7560 103 Aquifer Group-IB 43 38
103 155 Aquiclude-IB 52155 300 Multiple Aquifers 145 665
Jaito Mandi
0 14 Unsaturated Zone 14 114 59 Aquifer Group-IA 45 3759 80 Aquiclude-IA 2180 107 Aquifer Group-IB 27 155
107 1555 Aquiclude-IB 4851555 300 Multiple Aquifers 1445 16 515
Kot Kapura
0 9 Unsaturated Zone 9 29 77 Aquifer Group-IA 68 455
77 88 Aquiclude-IA 1188 106 Aquifer Group-IB 18 11 3
106 155 Aquiclude-IB 49155 300 Multiple Aquifers 145 68
Nanak Nagri
0 12 Unsaturated Zone 12 112 46 Aquifer Group-IA 34 18446 69 Aquiclude-IA 2369 131 Aquifer Group-IB 62 77 11
131 165 Aquiclude-IB 34165 2134 Multiple Aquifers 484 97
Nangal 0 9 Unsaturated Zone 9 1
Aquifer Mapping and Management Plan of Faridkot District Punjab State
Page | 71
Nangal
9 41 Aquifer Group-IA 32 2941 72 Aquiclude-IA 3172 124 Aquifer Group-IB 52 41
124 151 Aquiclude-IB 27151 300 Multiple Aquifers 149 43 21
Tehna
0 10 Unsaturated Zone 10 210 41 Aquifer Group-IA 31 18741 59 Aquiclude-IA 1859 106 Aquifer Group-IB 47 33
106 158 Aquiclude-IB 52158 300 Multiple Aquifers 142 50
Wara Daraka
0 4 Unsaturated Zone 4 04 75 Aquifer Group-IA 71 46
75 84 Aquiclude-IA 984 129 Aquifer Group-IB 45 31
129 150 Aquiclude-IB 21150 300 Multiple Aquifers 150 47
Aulakh
0 17 Unsaturated Zone 17 217 46 Aquifer Group-IA 29 2646 76 Aquiclude-IA 3076 113 Aquifer Group-IB 37 1525 305
113 134 Aquiclude-IB 21134 300 Multiple Aquifers 166 6828
Bhagthala
0 4 Unsaturated Zone 4 14 53 Aquifer Group-IA 49 24
53 63 Aquiclude-IA 1063 102 Aquifer Group-IB 39 3237
102 168 Aquiclude-IB 66168 300 Multiple Aquifers 132 6115
Sadhuwala
0 5 Unsaturated Zone 5 55 52 Aquifer Group-IA 47 2151
52 63 Aquiclude-IA 1163 130 Aquifer Group-IB 67 49
130 144 Aquiclude-IB 14144 300 Multiple Aquifers 156 11931
Deviwala
0 8 Unsaturated Zone 8 28 78 Aquifer Group-IA 70 31
78 94 Aquiclude-IA 1694 112 Aquifer Group-IB 18 12 3
112 128 Aquiclude-IB 16128 269 Multiple Aquifers 141 58
Aquifer Mapping and Management Plan of Faridkot District Punjab State
Page | 72
Dohak
0 3 Unsaturated Zone 3 03 79 Aquifer Group-IA 76 2 50
79 89 Aquiclude-IA 1089 139 Aquifer Group-IB 50 42
139 154 Aquiclude-IB 15154 163 Multiple Aquifers 9 9
Toot
0 9 Unsaturated Zone 9 19 55 Aquifer Group-IA 46 354
55 63 Aquiclude-IA 863 116 Aquifer Group-IB 53 25
116 143 Aquiclude-IB 27143 217 Multiple Aquifers 74 31
- कदरीय भमि जल बोरड
-
- जल ससाधन नदी विकास और गगा सरकषण मतरालय
- भारत सरकार
-
- contents naquim faridkotpdf (p1-5)
- Final Faridkot edited 170317pdf (p6-77)
-

Aquifer Mapping and Management Plan of Faridkot District Punjab State
Page | 1
10 INTRODUCTIONThe primary objective of the Aquifer Mapping can be summed up as ldquoKnow your
Aquifer Manage your Aquiferrdquo Demystification of Science and thereby involvement of stakeholders is the essence of the entire project The involvement and participation of thecommunity will infuse a sense of ownership amongst the stakeholders This is an activity wherethe Government and the Community work in tandem Greater the harmony between the twogreater will be the chances of successful implementation and achievement of the goals of theProject As per the Report of the Working Group on Sustainable Ground Water ManagementldquoIt is imperative to design an aquifer mapping programme with a clear-cut groundwatermanagement purpose This will ensure that aquifer mapping does not remain an academicexercise and that it will seamlessly flow into a participatory groundwater managementprogramme The aquifer mapping approach can help integrate ground water availability withground water accessibility and quality aspects
12 Scope of the studySystematic mapping of an aquifer encompasses a host of activities such as collection and
compilation of available information on aquifer systems demarcation of their extents and theircharacterization analysis of data gaps generation of additional data for filling the identifieddata gaps and finally preparation of aquifer maps at the desired scale This manual attempts toevolve uniform protocols for these activities to facilitate their easy integration for the district aswhole
13 Approach and MethodologyNational Aquifer Mapping Programme basically aims at characterizing the geometry
parameters behaviour of ground water levels and status of ground water development invarious aquifer systems to facilitate planning of their sustainable management The majoractivities involved in this process include compilation of existing data identification of datagaps and generation of data for filling data gaps and preparation of aquifer maps The overallactivities of aquifer mapping are presented in the flow chart below
Aquifer Mapping and Management Plan of Faridkot District Punjab State
Page | 2
14 Location and Geographical UnitsFaridkot is located in South- Western part of Punjab State The area lies between
30deg21rsquo59rdquo to 30deg49rsquo52rdquo North latitude and 74deg28rsquo12rdquo to 75deg03rsquo22rdquo East longitude and falls in theSurvey of India Toposheet Nos 44J6 9 10 11 13 14 15 and 44N3 covering an area of141860 sq km (Fig1) It shares common boundaries with Moga district in east Ferozepurdistrict in North amp West and Muktsar and Bathinda districts in South The highest elevation2133 m above msl is near Jiwanwala in the eastern part whereas the minimum of 190m atPind Balochan in the western part with a gentle gradient of 045mkm to the SSW
Faridkot district is the smallest district of Punjab State and has two Sub divisions Tehsilsnamely Faridkot and Jaito and two Sub Tehsils namely Kotkapura and Sadiq comprising 190Gram Panchayats and 171 villages Faridkot District has two administrative development blocksie Faridkot and Kot Kapura
Total Population of the district as per the 2011 Census is 618008 out of which327121 are males and 290887 are females The total rural population in the district is217514 and the urban population is 400494 The population density is 424 persons sq kmagainst the state average of 550 personssq km
15 Climatic Conditions Rainfall and ClimateThe climate of the district is classified as sub-topical steppe semi-arid and hot which is
mainly dry except in rainy months and characterized by intensely hot summer and cold winterThe Normal Annual Rainfall is 449 mm in 24 days which is unevenly distributed over the
district Normal Monsoon Rainfall is 349 mm The southwest monsoon sets in last week of Juneand withdraws towards end of September and contributes about 78 of annual rainfall Julyand August are the wettest months The remaining 22 of the annual rainfall occurs duringnon-monsoon months of the year in the form of thunder storm and western disturbancesRainfall in the district increases from southwest to northeast
16 Geomorphology amp Soil TypeThe study area forms a part of the Sutlej Basin and exhibits gradational landforms
mainly fluvial formed by sediments On the whole it exhibits a low-lying flat topographygenerally sloping towards southwest except few linear depression occupied by palaeo-bluffand palaeo channel near Pakka and southeast of Kamiyana Villages and by sand dunes whichare concentrated in northwestern and southern part of the study area Because of theexceptionally flat topography there is not much development drainage system
The Study area forms a part of Punjab Plain and is sub-divided into the following threeregions on the basis of soil topography climate and natural vegetation
a Faridkot Hathar- Sadiq- Sandy Plain This part extends over Sadiq town part of thedistrict commonly known as Hathar area This part of the district has a large numbers ofsand dunes and wind blown sand has its own effect on the fertility of soil
Aquifer Mapping and Management Plan of Faridkot District Punjab State
Page | 3
Fig1 Base map of Faridkot District
Aquifer Mapping and Management Plan of Faridkot District Punjab State
Page | 4
b Faridkot Uttar- Dhudhi- sandy-loamy This part of Faridkot district extends over DhudhiKot Sukhia Tehna and is known as Uttar area The soil is sandy loam Due to extensionof agriculture and irrigation there is apparent disappearance of sand dunes to a greatextent which have been leveled up generally
c Jaitu Area- Sandy Loam to Loam This region extends over and around Jaitu tehsil Thetexture of the soil is sandy loam to loam This area is known for the best staple ofcotton Most of the area is covered under sandy soil followed by clayey soil except somepatches where there is appreciable thickness of top clay layer varying from 67 to 167m
The study area is developed by Indo Gangetic Alluvium main landforms are Alluvial Plain Sandsheets Sand dunes and Palaeo Channels Alluvial plain forms the major part of the areafollowed by Sand Sheets and Sand dunes as patches Palaeo channel is occurred in central partof the study area
The soils classes are mainly loams loamy sand sandy to fine sandy loams and siltyloams Loamy sand is covered in major part of the study area
The combined studies on fluvial geomorphology and Remote sensing studies in northwestern region are carried out by IITs and Delhi University It has been observed that the hugeflood depositions by River Ghaggar Saraswati and other minor rivers at different time intervaland channel migrations in different ages and also Aeolian depositions caused sand dunes indifferent time interval leads to difficulty in aquifer grouping The studies are also conformedthrough sedimentological core sampling analysis during the project The observations areunderstood by regional geomorphology and channels migrations which shown in the belowFig2
Fig2 Fluvial Geomorphological Studies carried out to understand the SubsurfaceAquifer System in North Western Regions
Aquifer Mapping and Management Plan of Faridkot District Punjab State
Page | 4
b Faridkot Uttar- Dhudhi- sandy-loamy This part of Faridkot district extends over DhudhiKot Sukhia Tehna and is known as Uttar area The soil is sandy loam Due to extensionof agriculture and irrigation there is apparent disappearance of sand dunes to a greatextent which have been leveled up generally
c Jaitu Area- Sandy Loam to Loam This region extends over and around Jaitu tehsil Thetexture of the soil is sandy loam to loam This area is known for the best staple ofcotton Most of the area is covered under sandy soil followed by clayey soil except somepatches where there is appreciable thickness of top clay layer varying from 67 to 167m
The study area is developed by Indo Gangetic Alluvium main landforms are Alluvial Plain Sandsheets Sand dunes and Palaeo Channels Alluvial plain forms the major part of the areafollowed by Sand Sheets and Sand dunes as patches Palaeo channel is occurred in central partof the study area
The soils classes are mainly loams loamy sand sandy to fine sandy loams and siltyloams Loamy sand is covered in major part of the study area
The combined studies on fluvial geomorphology and Remote sensing studies in northwestern region are carried out by IITs and Delhi University It has been observed that the hugeflood depositions by River Ghaggar Saraswati and other minor rivers at different time intervaland channel migrations in different ages and also Aeolian depositions caused sand dunes indifferent time interval leads to difficulty in aquifer grouping The studies are also conformedthrough sedimentological core sampling analysis during the project The observations areunderstood by regional geomorphology and channels migrations which shown in the belowFig2
Fig2 Fluvial Geomorphological Studies carried out to understand the SubsurfaceAquifer System in North Western Regions
Aquifer Mapping and Management Plan of Faridkot District Punjab State
Page | 4
b Faridkot Uttar- Dhudhi- sandy-loamy This part of Faridkot district extends over DhudhiKot Sukhia Tehna and is known as Uttar area The soil is sandy loam Due to extensionof agriculture and irrigation there is apparent disappearance of sand dunes to a greatextent which have been leveled up generally
c Jaitu Area- Sandy Loam to Loam This region extends over and around Jaitu tehsil Thetexture of the soil is sandy loam to loam This area is known for the best staple ofcotton Most of the area is covered under sandy soil followed by clayey soil except somepatches where there is appreciable thickness of top clay layer varying from 67 to 167m
The study area is developed by Indo Gangetic Alluvium main landforms are Alluvial Plain Sandsheets Sand dunes and Palaeo Channels Alluvial plain forms the major part of the areafollowed by Sand Sheets and Sand dunes as patches Palaeo channel is occurred in central partof the study area
The soils classes are mainly loams loamy sand sandy to fine sandy loams and siltyloams Loamy sand is covered in major part of the study area
The combined studies on fluvial geomorphology and Remote sensing studies in northwestern region are carried out by IITs and Delhi University It has been observed that the hugeflood depositions by River Ghaggar Saraswati and other minor rivers at different time intervaland channel migrations in different ages and also Aeolian depositions caused sand dunes indifferent time interval leads to difficulty in aquifer grouping The studies are also conformedthrough sedimentological core sampling analysis during the project The observations areunderstood by regional geomorphology and channels migrations which shown in the belowFig2
Fig2 Fluvial Geomorphological Studies carried out to understand the SubsurfaceAquifer System in North Western Regions
Aquifer Mapping and Management Plan of Faridkot District Punjab State
Page | 5
17 Land Use Land CoverBased on the visual interpretation of satellite data and topographical data land
useland classes have been identified The main classes are Built Up land Agricultural landforestland Land under non agriculture use current fallows and water bodies The Land usepatterns are given in below tableLand use pattern of Faridkot district Punjab (wwwagripbgovin)
Type of Land use Area (ha)
1 Total Geographical area 1419002 Forest 20043 Land put to non-agricultural use 16719 (11)4 Current Fallows 22395 Net area sown 126678 (89)6 Gross cropped area 2529897 Cropping intensity 200
18 River System and Water Resources
No river is flowing through the area but there are some drains which flow during heavyrains and serve as natural drainage The main drains are Tarobri Drain Mari Drain Samadh BhaiDrain and Chand Bhan Drain (Fig3) There is a good network of canals and these passes throughthe area The main canals are Bikaner Canal Sirhind Feeder Rajasthan Feeder Abohar andBathinda branches of Sirhind Canal Bikaner Canal and Bathinda Branch of Sirhind Canal passesthrough northwestern and southeastern margins of the district and Sirhind Feeder RajasthanFeeder Abohar Branch of Sirhind Canal run through the entire length of district in north-southand northeast-southwest directions respectively (Fig4) Sirhind canal system has been servingthe district for irrigation since long time There are large water bodies near Khara PanjgrainJaito Mandi Wara daraka and in Faridkot Town These water bodies generally dry in summer
19 Agriculture amp IrrigationFaridkot is mainly an agricultural district and 70 of the population resided in the rural
areas depends up on agriculture The two main crop seasons in a year are Kharif and Rabi whichis locally known as lsquoSaunirsquo(Summer Harvest Season) and lsquoHarrhirsquo (Winter Harvest Season) Theprinciple Kharif crops are Paddy Maize Bajra Cotton Moong Mash Moth Arhar Sugarcaneetc while important Rabi crops are Wheat Barley Gram Sarson Taramera and Toria etc
Irrigation is carried out by surface water and ground water As major parts of the areaare underlain by saline water so canal water is major source of irrigation In some parts whereground water is available as fresh water lenses than irrigation is covered by skimming wellsknown as multiple well point system Kharif and Rabi is cultivated in study area under two typesof soil ie loamy sand and sandy loam and the sources of irrigation are canal as well astubewells Conjunctive use of canal water and ground water for irrigation is being carried outefficiently in this area
Aquifer Mapping and Management Plan of Faridkot District Punjab State
Page | 6
a Canal Water IrrigationMajor source of irrigation is canal where water from Sirhind canal is utilized for
irrigation The other important distributaries are Abohar Branch Dhulkot distributary systemMari distributary system Faridkot distributary Kotkapura distributary Jaitu distributaryRupana and Doda distributary system The total length of above distributaries which serve inFaridkot district is 22844 km out of which 20649 km is lined and 2185 km is unlined Grossirrigated areas of all the channels are 9025339 ha and cultural command area is 8026656 hawith 294 no of outlets Intensity of irrigation is 140
b Ground Water IrrigationWith the advent of multiple well point systems ground water irrigation is also playing
an important role in development of agriculture economy of the study area This is not onlyrelease the pressure mounted on the canal water supply but also creates the maximum storagein the unconfined aquifer for fresh ground water through return flow and canal seepage
110 IndustriesThere are no major industries in the area except rice mills in Deviwala village and few
poultry farms in the district
111 Mineral ResourcesSince the entire area is occupied by Quaternary sediments no minerals of significant
industrial use are foundAlkaline soils contain saltpetre called Kalmi Shora in local languagewhich has application in chemical oxide glass soap industry and leather tanning are found inthis area It is being extracted at Sirsari and Kot Sukhia villages It occurs as thin slightlyyellowish to dark brown encrustation on the ground surface and is found mostly over the oldhabitation sites lsquoThehsrsquo or over barren kallar lands and cattle sheds
Saltpetre is an important source of Niter (KNO3) which is used in cracker industrymatchbox manufacture and as a fertilizer
112 Water Conservation and Artificial rechargeThe north and eastern part of the area where water level is declining artificial recharge
structures may help in arresting the decline Recharge Trench with injection well structure isthe suitable for artificial recharge Water conservation methods like change in cropping patternchange in Irrigation policy lining of unlined channels timely plantation of paddy promotion ofsprinkler and drip irrigation etc may be adopted to overcome the ground water decline in thearea
Aquifer Mapping and Management Plan of Faridkot District Punjab State
Page | 7
Fig3 Drainage and Water Bodies of Faridkot District
Aquifer Mapping and Management Plan of Faridkot District Punjab State
Page | 8
Fig4 Canal and Distributaries of Faridkot District
Aquifer Mapping and Management Plan of Faridkot District Punjab State
Page | 9
20 DATA COLLECTION AND GENERATION
21 Geology and Hydrogeological dataThe area lies in the central part of Satluj basin of Indo-Gangetic Alluvial plain
Geologically the area is occupied by a thick sequence of Quaternary deposits of Mid-Pleistoceneto Recent age These comprise alternate sequence of fluvial and arid phases The exposedQuaternary Sediments can be broadly classifies as- (i) Older Alluvium of Middle to UpperPleistocene age overlain by (ii) Aeolian deposits of Holocene age The provenance of OlderAlluvium deposited by rivers originated from Himalayas and Aeolian deposits have been laiddown by wind action from Thar Desert of Rajasthan in the southwest part of the area Thegeneralized stratigraphic sequence of the area are given belowGeneralized Stratigraphy Faridkot District (After Garg amp Singh 1993)Age Lithological Unit Lithological Characteristics
Holocene Aeolian Flat Unconsolidated thin veneer of Aeolian sand
Newer Dunes Unconsolidated orange brown sand and silt
Semi consolidated dunes Semi consolidated light to dark brown sand
Older dune Dark brown Aeolian sand and silt withsome vegetal matter
Mid to UpperPleistocene
Older Alluvium Multi-cyclic light grey to brown fine tomedium grained mixture of clay silt andsand with Kankar Light grey to pink stickyclay grayish mica sand with kankar
-----Basement not exposed----
The Principle Aquifer in the study area is Alluvium and the Major Aquifers are OlderAlluvium and Aeolian Alluvium (Fig5) The Ground water occurs in unconfined (water table) andconfined conditions
211 Water Level BehaviorTwenty three monitoring stations of Central Ground Water Board (CGWB) (7
Piezometers and 16 Dugwells) and Eighteen monitoring stations (18 Piezometers) of StateGovernment represent the first aquifer Second and third aquifer is represented by onemonitoring station of CGWB Depth to water level in the area ranges from 145 to 1819 m bglduring pre-monsoon period (Fig6) and 120 to 2015 m bgl during post monsoon period (Fig7)In eastern part water levels are in the range of 10 to 20 m in central part the water levels are inthe range of 5 to 10 m bgl and in western part the water levels are shallower in the range of 2to 5 m Seasonal water level fluctuation shows a rise and fall in the range of 110 to (-) 200 m inwestern and eastern part of the districts respectively during year 2015
Aquifer Mapping and Management Plan of Faridkot District Punjab State
Page | 10
Hydrograph of Different Observation Wells
Fig5 Major Aquifers
Aquifer Mapping and Management Plan of Faridkot District Punjab State
Page | 11
Fig6 Depth to Water level Pre Monsoon 2015
Aquifer Mapping and Management Plan of Faridkot District Punjab State
Page | 12
Fig7 Depth to Water level Post Monsoon 2015
Aquifer Mapping and Management Plan of Faridkot District Punjab State
Page | 13
22 Water Quality DataGround water quality of shallow aquifer (Aquifer-I) is assessed on the basis of chemical
data of National Hydrograph Network stations ie NHNS monitored during Pre monsoonperiod Twenty four groundwater samples are collected during NHNS 2015 and chemicalanalysis is given in Annexure-I The chemical quality of deeper aquifers has to be assessedduring ongoing groundwater exploration programme under NAQUIM
Chemical data of shallow aquifer indicates that ground water is alkaline in nature TheElectrical Conductivity (EC) values ranges from 444 to 8653 microScm at 25oC indicating fresh tomoderately saline The EC values less than 1000 microScm at 25oC have observed at four locationsie Jand Sahib (444) Devi wala (476) Mehmuana (550) and Arianwala (700) respectively TheEC values more than 3000 microScm at 25oC have observed at six locations ie Tehna (8653) BajaKhana (3988) Nangal (3487) Kot Kapura (3299) Mumara (3212) and Sukhanwala (3126) Theground water occurring in the central and south-eastern parts are marginally to highly salineand not suitable for drinking purposes
The chloride concentration in ground water varies broadly between 28 mgl atAriyanwala and also 1544 mgl at Tehna Ground water with fluoride above 15 mgL are foundmainly in Nathuwala (603) Killi (429 ) Kot Kapura (333) Dhilwan kalan (285) Moharewala(195) and Bir Sikhanwala (184) and Nitrate concentration in groundwater above permissiblelimit 15 mgl are found in Kot kapura (144) Killi (140) Dal Singhwala (136)Tehna (118)Nangal (104) Bir Sikhan wala (89) Nathuwala (79) Chand baja (79 ) Wara Daraka (66) Shersinghwala (65) and Sukhanwala(46) The USSL diagrams used for classification of irrigationwater based on EC and SAR shown below observed that ground water occurring in Faridkotdistrict falls under C4S3 C2S1 C4S4 C3S1 C3S3 and C3S2 classes of irrigation classification
Aquifer Mapping and Management Plan of Faridkot District Punjab State
Page | 14
Such waters when used continuously for irrigation they are likely to cause salinityhazards and lead to reduction in crop yields Plot of USSL diagram indicates that ground watersfall under C2S1 and C3S1 classes of irrigation rating
Analysing mechanism and equipments used for chemical analysis are given in table-1Table-1 Analytical methods and equipments used for chemical analysis
S No Parameters Analytical Methods
A Physico-chemical analysis
pHConductivity (EC)Carbonate amp bicarbonate (CO3HCO3)Chloride (Cl)Sulphate (SO4)Nitrate (NO3)Fluoride (F)Total hardness (TH)Calcium (Ca)Magnesium (Mg)Sodium (Na)Potassium (K)Total Dissolved Solids (TDS)
Electrometric methodElectrical conductivity methodTitrimetric methodArgenotometric methodNephloturbidity method
Spectro-photometric methodIon metric methodEDTA-Titri metric methodEDTA-Titri metric methodBy differenceFlame photometric methodFlame photometric methodGravimetric
B Trace elementsHeavy metals
Copper (Cu)Cadmium (Cd)Chromium (Cr)Lead (Pb)Manganese (Mn)Nickel (Ni)Cyanide (Cn)
Iron (Fe)
Digestion followed by AtomicAbsorption Spectrophotometer
(AAS)
Spectrophotometer method
Aquifer Mapping and Management Plan of Faridkot District Punjab State
Page | 15
Fig8 Hill-Piper diagram for Groundwater Quality of Shallow Aquifer of Faridkot District
Aquifer Mapping and Management Plan of Faridkot District Punjab State
Page | 16
Fig8 Groundwater Quality 2015
Aquifer Mapping and Management Plan of Faridkot District Punjab State
Page | 17
23 Geophysical data
To delineate fresh water - saline water interface laterally as well as vertically surfacegeophysical investigations have been carried out in alluvial tracts over parts of the study areaUnder surface geophysical investigations total 44 VES (Fig9) in an area of 1800 sq km wereconducted with current electrical separation of 600 to 1000 m
Fig9 VES Locations in Faridkot District
Aquifer Mapping and Management Plan of Faridkot District Punjab State
Page | 17
23 Geophysical data
To delineate fresh water - saline water interface laterally as well as vertically surfacegeophysical investigations have been carried out in alluvial tracts over parts of the study areaUnder surface geophysical investigations total 44 VES (Fig9) in an area of 1800 sq km wereconducted with current electrical separation of 600 to 1000 m
Fig9 VES Locations in Faridkot District
Aquifer Mapping and Management Plan of Faridkot District Punjab State
Page | 17
23 Geophysical data
To delineate fresh water - saline water interface laterally as well as vertically surfacegeophysical investigations have been carried out in alluvial tracts over parts of the study areaUnder surface geophysical investigations total 44 VES (Fig9) in an area of 1800 sq km wereconducted with current electrical separation of 600 to 1000 m
Fig9 VES Locations in Faridkot District
Aquifer Mapping and Management Plan of Faridkot District Punjab State
Page | 18
Subsurface geophysical investigations include borehole logging The ground waterquality data pertaining to the CGWB exploratory boreholes indicate vertical and lateralvariation in EC values Shallow ground water quality data shows clearly the existence of salinityat shallow depth in the many parts of study area such as Pakka Mahmuana ShirinwalaShersinghwala Dohak Kamiyana Kingra and many other places Electrical conductivity (EC) ofground water is more than 2000 microS cm in major part of the area except at few places Slightimprovement in quality of ground water at deeper depth as compared to shallow depth hasbeen observed at few places These places are Chuggewala Golewalla Nangal Deepsinghwalawhere EC of ground water was found to be within 2000 microS cm within the depth range of 80 to120 m
24 Exploratory drilling State - Data AvailabilityThe Lithologs of Exploratory Well Observation well Piezometer productive wells of
CGWB Punjab State Tubewell Corporation (PSTC) now as Punjab Water ResourcesDevelopment and Management (PWRDM) WRED ( Water Resources and EnvironmentDirectorate) Water Supply and Sanitation (WSS) and Private Wells have been collected andthose supported electrical logs have been validated for aquifer map preparation The details areshown in Table-1
Table-1 Data Availability of Exploration Wells of Faridkot district
SlNo Source of data Depth Range (m) Totallt 100 100-200 200-300 gt300
1 CGWB 2 1 1 8 122 WREDPSTCWSS 15 1 0 3 193 PRIVATE WELLS 1 0 1 0 2Total 18 2 2 11 33
25 Spatial Data DistributionThe actual data of all the wells in the area are plotted on the map of 150000 scale with
5rsquoX5rsquogrid (9 x 9) km (Fig 10) Perusal of table shows that majority of tube wells falls in theshallow aquifer having depth less than 100m and deeper aquifer having depth more than 300mThe grids formations devoid of groundwater exploration are identified as data gaps and theseare to be filled by data generation The Physical record of the availability of exploration data aregiven in Annexure-II
Aquifer Mapping and Management Plan of Faridkot District Punjab State
Page | 19
Fig10 Locations of Exploration Data Availability
Aquifer Mapping and Management Plan of Faridkot District Punjab State
Page | 20
30 DATA INTERPRETATION INTEGRATION AND AQUIFER MAPPINGAll the available data have been validated to generate aquifer map The deepest well in
each quadrant is selected and plotted on the map of 150000 scale with 5rsquoX5rsquogrid (9 x 9) km(Fig11)
Fig11 Locations of validated exploration data
The optimized wells of CGWB PWRDM WRED WSS and Private Wells have been usedto prepare the elevation or collar elevation map to identify the topographic variations onground surface so that it can give the synoptic picture of gradient variations in the water levels
Aquifer Mapping and Management Plan of Faridkot District Punjab State
Page | 21
The topographic elevation values have been plotted to prepare the elevation contour map(Fig12) The locations of validated wells in quadrant and toposheet wise distributions inrespective blocks are given in Table-2 Locations of validated exploratory wells with litholog areshown in Fig13
Fig12 Elevation contour map
Fig13 Locations of validated exploratory wells with Litholog
Aquifer Mapping and Management Plan of Faridkot District Punjab State
Page | 22
Table -2 Summary of optimized exploration wells
Block ToposheetQuadrant Depth Range (m) Elevation(m amsl)
Source ofdata
Location lt 100 100-200 200-300 gt300Faridkot 1A 44J06 Dip Singh Wala - - - 350 201 CGWBFaridkot 3C 44J09 Golewala - - - 34378 1995 CGWBFaridkot 1A 44J14 Tehna - - - 300 205 CGWBFaridkot 3A 44J14 Bhagthala - - - 37195 198 PSTCFaridkot 1A 44J10 Sadhuwala - - - 35970 196 PSTCKot Kapura 1C 44J15 Dal Singhwala - - - 300 211 CGWBKot Kapura 1B 44J15 Jaito Mandi - - - 41920 203 CGWBKot Kapura 2A 44J14 Kot Kapura - - - 42190 206 CGWBKot Kapura 3B 44J14 Nanak Nagri - - 2134 - 210 PRIVATEKot Kapura 1B 44J14 Nangal - - - 300 206 CGWBKot Kapura 3A 44J14 Wara Daraka - - - 300 205 CGWBKot Kapura 2C 44J14 Aulakh - - - 38414 211 PSTCKot Kapura 2B 44J14 Deviwala - - 269 - 207 CGWBMuktsar 2B 44J10 Dohak - 163 - - 197 CGWBGhal khurd 3B 44J09 Toot - - 217 - 196 CGWB
Two exploratory wells from adjacent districts ie Dohak from Muktsar district and Toot from Ferozpur district have beenincorporated for the preparation of lithological fence and cross sections
Aquifer Mapping and Management Plan of Faridkot District Punjab State
Page | 23
31 Sub Surface Disposition311 Previous Work
To delineate and determine the potential aquifer zones evaluation of aquifercharacteristics etc Exploratory drilling was conducted by CGWB at 6 locations in the districtincludes 05 exploratory wells and 1 slim hole between 1975 to 2008 through in-house activitiesand 02 exploratory wells and 2 piezometers through outsourced by Ms WAPCOS Ltd between2011 to 2015 (Fig10) The drilling has been carried out to a maximum depth of about 408 m(Kot Kapura) and revealed the presence of 6 to 12 prominent permeable granular zones withaggregate thickness varying from 28 to 283 m The granular zone consists of fine to mediumsand The slim hole at Golewala and exploratory well at Kot Kapura have abandoned due topoor quality of formation water upto depth of 350m bgl
Further the study of exploratory boreholes drilled in the district revealed the presence ofmultiple aquifer groups up to the maximum drilled depth of 408 m The first aquifer group formsvery shallow water table aquifer (IA) and occurs down to 57 m Below that clay layer starts gettingthickened to about 8-10m separating Aquifer IB down to 120 m The below multi aquifers behavesas semi-confined to confined and consisting of thin sand layers alternating with thicker clay layersOverall flow of ground water is towards south-west direction Further the study of exploratoryboreholes drilled in the area revealed that the area is considered as a single aquifer system up tothe maximum depth of 300 m
312 Present NAQUIM StudyTo understand the sub surface disposition in the study area geological sections and
fence diagram have been prepared by synthesizing the various sub-surface sections on the basisof study of the lithological logs and electrical logs of boreholes drilled by CGWB WRED PSTCand Private Agencies using the RockWorks15 software and a 3D lithological model has beenprepared (Fig14) The 2D lithology sections and 3D lithological fence diagram has beenprepared using lithology model and are shown in Fig15a b amp 16 respectively The aquifers arecomposed of fine to medium sand with clay intercalations The granular zones are extensiveThe aquifer occurring below 252m depth are composed of very fine to medium sand with silt
Based on geophysical borehole logging and use of resistivity profiling followed by thedepth soundings at few selected places fresh-saline water zones are demarcated This analysisis extremely important for the present study and will be referred from time to time as it isobviously the higher resistivity beds represents freshwater zone in contrast in low resistive bedsindicating saline groundwater zoneFig14 3-Dimension Lithological Model
Aquifer Mapping and Management Plan of Faridkot District Punjab State
Page | 24
The major aquifer system of the area is Quaternary alluvial deposits having Older and Aeolianalluvium which mainly comprises of sand silt and clay The top surface layer is mainly silty clayThe lithology along W-E direction shows the variation in lithological thickness ie thin clay layersinter bedded with sand except at Nangal where thick clay layers were identified at 55 m bglThere is inter-layering of sand and clay with thick clay at Golewala and Bhagthala towardswestern side at a depth between 150m to 210m bgl There is thick a inter-layering of sand andclay towards all lithologs except Nanak Nagri shows thin sequence of sand and clay towards SWLithological data of wells are given in Annexure-III
Fig15ab 2-Dimension Lithological Sections
SWE
Aquifer Mapping and Management Plan of Faridkot District Punjab State
Page | 25
Fig16 3-Dimension Lithological Fence
Aquifer Mapping and Management Plan of Faridkot District Punjab State
Page | 26
32 Aquifer Geometry
The aquifer group embodies a number of granular layers alternating with clay lenses Afew clay layers intervening these aquifer groups pinch out against the sand zones at few placesThe marker horizons are traced all over the area by connecting their tops and bottoms Sandyclay layer occurs at the surface covering the unconfined aquifer which is in turn underlain byprominent clay zone It is composed of mainly of medium sand with thin beds of fine sand
Aquifer IA (Very Shallow Aquifer) extends maximum upto 70 m of depth and below thatclay layer starts getting thickened about 10-12m separating Aquifer IB to a maximum depth of123 m Multi layer aquifers are existing in the area each aquifer is separated by thick clay zonesof 25 to 40 m upto 300m depth (Annexure IV) Based on the same criteria to know the broadpicture of the aquifer disposition inter-relationship of granular zones nature geometry andextension of aquifers in the study area the aquifer grouping has been carried out using the sub-surface lithology and a 3-Dimensional aquifer model (Fig17) and aquifer disposition 3D fencediagram has also been prepared using the aquifer model (Fig18) Various groups identified inthe area are given in Table-3 It is very difficult to differentiate the aquifer groups after AquiferGroup I so the whole lithology is considered to be a single aquifer group system The firstaquifer is water table aquifer and extends all over the area The aquifer is mainly composed offine to coarse grained sand
Table-3 Aquifer Grouping in Faridkot DistrictAquifer Group Range Thickness
From To Min Max
Aquifer IA 4 70 29 50
Aquifer IB 64 123 21 52
Multiple Aquifers 133 300 21 85
Fig17 3D Aquifer Disposition Model
Aquifer Mapping and Management Plan of Faridkot District Punjab State
Page | 27
Fig18 3D Aquifer Disposition Fence
Aquifer Mapping and Management Plan of Faridkot District Punjab State
Page | 28
40 GROUND WATER RESOURCESGround water resource estimation of the area have been carried out by taking Dynamic
and In-storage resources of unconfined aquifer and confined aquifer present upto 300m depthThe assessment of dynamic ground water Resources of the study area have been carried outjointly by CGWB and Water Resources and Environment Directorate (WRED) Department ofIrrigation Punjab on the basis of Ground Water Estimation Committee (1997) methodology
The occurrence of potential aquifers (productive granular zones) upto 300 m depth hasbeen demarcated on basis of aquifer wise subsurface mapping The total saturated thickness ofgranular zones was derived from the exploratory borehole data of a particular block Thegranular zones occurring below the zone of water level fluctuation up to the first confining layerhas been considered as static unconfined zone The specific yield value for the unconfinedaquifer has been taken as 60 of 012 which comes as 0072 whereas for the confined aquiferthe storativity value has been considered Since the specific yield is likely to reduce withincrease in depth due to compaction of overlying sediments
Hence the major data elements considered in this estimation are thickness of granularzones specific yieldstorativity and area of both fresh water and salinebrackish water It hasbeen observed that in some of the blocks sufficient data on probable occurrence of granularzones was not available In those cases the existing exploratory data of adjoining blockdistricthas been either extrapolated or interpolated to derive such parameters required for estimationThis assessment of total groundwater resources has been computed based on the availabledata with CGWB amp WRED Department of Irrigation and Punjab
41 Groundwater Resources up to depth of 300ma Dynamic Resources
Block-wise ground water resource potential of the district has been assessed as perGEC-97 as on 31st March 2013 The primary source of recharge in the area is the rainfall Theground water development in all the blocks has exceeded the available recharge thus all theblocks have been categorized as over exploited The overall stage of ground water developmentin the Faridkot district has been assessed to be 160 The block wise details are given in belowTable-4
Table 4 Dynamic Ground Water Resource amp Development Potential (31032013) in mcmAssessmentUnit Block
NetAnnualGroundWater
Availability
ExistingGross
GroundWater Draft
forirrigation
ExistingGross GroundWater Draftfor domestic
andindustrial
water supply
ExistingGross
GroundWater
Draft forAll uses(11+12)
Provision fordomestic
andindustrial
requirementsupply to
2025
Net GroundWater
Availabilityfor futureirrigation
development(10-11-14)
Stage ofGroundWater
Development(1310)
100()
Category
Faridkot 34632 52861 1911 54771 2219 -20448 158Over
Exploited
Kot Kapura 26821 42020 1402 43421 1511 -16709 162Over
Exploited
TOTAL 61453 94880 3313 98193 3730 -37157 160Over
Exploited
Aquifer Mapping and Management Plan of Faridkot District Punjab State
Page | 29
b In-storage Ground Water ResourcesAs per revised guidelines recommended by the Central Level Expert Group on
groundwater resources assessment the resources are separately considered as dynamic and in-storage unconfined In case of alluvial area in-storage resources of unconfined aquifer havebeen computed on the basis of specific yield of aquifer as detailed below
In-storageGround Water
resources(Unconfined
Aquifer)
=
Thickness of the aquifer(granularproductive zone)
below the zone of water levelfluctuation down to the bottom
layer of unconfined aquifer
x Sp Yield ofthe aquifer
x Areal extentof the
aquifer
The dynamic and in-storage ground water resource estimations have been calculated forsingle aquifer group upto 300m of each block of Faridkot district In-storage ground waterresources are estimated for fresh water and saline water resources based on the geophysicalinterpretations of depth to fresh and saline water interface for each block The fresh and salinecalculations are made on the basis of the assumptions on aquifer that is considered asunconfined aquifer so that the specific yield concept is used for resources estimations (Fig19)The detailed resources estimations are calculated in detailed table for fresh and saline waterresources in the below Table-5 6amp 7
Total Availability of Ground Water Resources = Dynamic Resources + In-storage Resources
Fig19 Conceptual figure to understand the fresh and saline water resources in the aquifer up to300 m for Resource Estimation in Unconfined and Confined Aquifer System
(The clay lenses are more dominant in the aquifer and sometimes huge thickness of clay depositsare also observed in the lithologs)
Aquifer Mapping and Management Plan of Faridkot District Punjab State
Page | 29
b In-storage Ground Water ResourcesAs per revised guidelines recommended by the Central Level Expert Group on
groundwater resources assessment the resources are separately considered as dynamic and in-storage unconfined In case of alluvial area in-storage resources of unconfined aquifer havebeen computed on the basis of specific yield of aquifer as detailed below
In-storageGround Water
resources(Unconfined
Aquifer)
=
Thickness of the aquifer(granularproductive zone)
below the zone of water levelfluctuation down to the bottom
layer of unconfined aquifer
x Sp Yield ofthe aquifer
x Areal extentof the
aquifer
The dynamic and in-storage ground water resource estimations have been calculated forsingle aquifer group upto 300m of each block of Faridkot district In-storage ground waterresources are estimated for fresh water and saline water resources based on the geophysicalinterpretations of depth to fresh and saline water interface for each block The fresh and salinecalculations are made on the basis of the assumptions on aquifer that is considered asunconfined aquifer so that the specific yield concept is used for resources estimations (Fig19)The detailed resources estimations are calculated in detailed table for fresh and saline waterresources in the below Table-5 6amp 7
Total Availability of Ground Water Resources = Dynamic Resources + In-storage Resources
Fig19 Conceptual figure to understand the fresh and saline water resources in the aquifer up to300 m for Resource Estimation in Unconfined and Confined Aquifer System
(The clay lenses are more dominant in the aquifer and sometimes huge thickness of clay depositsare also observed in the lithologs)
Aquifer Mapping and Management Plan of Faridkot District Punjab State
Page | 29
b In-storage Ground Water ResourcesAs per revised guidelines recommended by the Central Level Expert Group on
groundwater resources assessment the resources are separately considered as dynamic and in-storage unconfined In case of alluvial area in-storage resources of unconfined aquifer havebeen computed on the basis of specific yield of aquifer as detailed below
In-storageGround Water
resources(Unconfined
Aquifer)
=
Thickness of the aquifer(granularproductive zone)
below the zone of water levelfluctuation down to the bottom
layer of unconfined aquifer
x Sp Yield ofthe aquifer
x Areal extentof the
aquifer
The dynamic and in-storage ground water resource estimations have been calculated forsingle aquifer group upto 300m of each block of Faridkot district In-storage ground waterresources are estimated for fresh water and saline water resources based on the geophysicalinterpretations of depth to fresh and saline water interface for each block The fresh and salinecalculations are made on the basis of the assumptions on aquifer that is considered asunconfined aquifer so that the specific yield concept is used for resources estimations (Fig19)The detailed resources estimations are calculated in detailed table for fresh and saline waterresources in the below Table-5 6amp 7
Total Availability of Ground Water Resources = Dynamic Resources + In-storage Resources
Fig19 Conceptual figure to understand the fresh and saline water resources in the aquifer up to300 m for Resource Estimation in Unconfined and Confined Aquifer System
(The clay lenses are more dominant in the aquifer and sometimes huge thickness of clay depositsare also observed in the lithologs)
Aquifer Mapping and Management Plan of Faridkot District Punjab State
Page | 30
Table-5 Block wise In-Storage Ground Water Resources of Fresh Water Aquifer
GENERAL DESCRIPTION OF THE GROUND WATER ASSESSMENT UNIT OF DISTRICT FARIDKOT PUNJAB STATE (2013)
Type of Ground Water Assessment Unit (Block) Faridkot Blocks
SrNo
Name ofAssessment
Unit
Type offormation
Areal extent (sq km) AveragePre-
monsoonWaterLevel
(m bgl)
Depth tobottom of
Aquiferbased on
Geophysical Interface
amp Boreholelogging(m bgl)
TotalThickness
offormation
belowPre-
monsoonWaterLevel(m)
(7-6)
Totalthickness
of theGranularZones up
to thedepth of
FreshWaterZones
(m)
Thicknessof the
unsaturated
granularZones up
to Pre-monsoon
WL(m)
Thicknessof the
saturatedgranularZones up
to thedepth of
Freshwater
aquiferbelow (m)
(9-10)
AverageSpecific
Yield
In-StorageGroundWater
Resourcesup to thedepth of
FreshWater
Aquifer(ham)
51112
TotalGeographical Area
AssessmentArea
FreshWater
1 2 3 4 5 6 7 8 9 10 11 12 13
1 Faridkot Alluvium 75210 36710 450 152 1475 72 2 69 0072 182375
2
KotKapura Alluvium 66650 61650 1069 106 9531 51 3 48 0072 213062Dist Total (ham) 141860 228406 395438Dist Total (mcm) 3954
ham hectare metremcm million cubic metre
Aquifer Mapping and Management Plan of Faridkot District Punjab State
Page | 31
Table-6 Block Wise In-Storage Ground Water Resources of Saline Aquifers upto 300 m Depth
GENERAL DESCRIPTION OF THE GROUND WATER ASSESSMENT UNIT OF DISTRICT FARIDKOT PUNJAB STATE (2013)Type of Ground Water Assessment Unit (Block) Faridkot BlocksSrNo
Name ofAssessment
Unit
Type offormation
Areal extent (ha) Depth tobottom of
Aquifer basedon Geophysical
Interface ampBoreholelogging(m bgl)
Depth tobottom of
Saline WaterAquifer
based onGeophysicalInterface ampBorelogging
(m bgl)
Totalthickness
of theSaline
Water upto the max
depth(m)
Totalthickness of
theGranular
Zones up tothe depth of
SalineWaterZones
(m)
AverageSpecific
Yield
In-StorageGroundWater
Resourcesup to thedepth of
SalineWater
Aquifer(ham)
51011
TotalGeographical
Area
AssessmentArea
Saline Water
1 2 3 4 5 6 7 8 9 10 111 Faridkot Alluvium 75210 38500 152 300 148 103 0072 2855162 Kot Kapura Alluvium 66650 5000 106 300 194 76 0072 27360
Dist Total (ham) 141860 228406 312876Dist Total (mcm) 3129
ham hectare metremcm million cubic metre
Aquifer Mapping and Management Plan of Faridkot District Punjab State
Page | 32
Table-7 Block Wise Total Availability of Fresh and Saline Groundwater Resources upto 300 m Depth and Volume of unsaturatedgranular zone after 3m upto water level
BLOCK WISE AVAILABILITY OF TOTAL GROUNDWATER RESOURCES IN FARIDKOT DISTRICTSlNo BLOCK Volume of
UnsaturatedGranular Zone
up to Pre-monsoon WL
DynamicGroundwater
Resources(2013)
AQUIFER-I
In-storageGroundwater
Resources UPTOFRESHWATER
Total FreshGroundwater
Resources[(4)+(5)] (HAM)
Total SalineGroundwater
Resources[(3)+(4)](HAM)
Total Availability ofGroundwater
Resources [(6)+(7)]
ham mcm
1 2 3 4 5 6 7 8 91 Faridkot 10830 34632 182375 217007 285516 502523 50252 Kot Kapura 14396 26821 213062 239883 27360 267243 2672
DistTotal (ham) 25227 61453 395438 456891 312876 769767 7698DistTotal (mcm) 252 615 3954 4569 3129
ham hectare metremcm million cubic metre
Aquifer Mapping and Management Plan of Faridkot District Punjab State
Page | 33
50 GROUND WATER ISSUES
51 Ground Water DepletionThe Study area is famous for its paddy and non paddy cultivation The quality of ground
water in the area is suitable for irrigation and drinking purposes therefore the ground water isconstantly being pumped for the irrigation due to its easy access through tube wells at shallowdepths and they are the main source of irrigation This will lead to its deepening of groundwater levels in blocks of Faridkot and Kot Kapura of Faridkot district as the recharge of thegroundwater through rainfall and other sources are less than the overall extraction Thehydrographs also shows the declining water level trend over the years in the district (Fig20) andis categorized as over-exploited This declining water table trend if not checked would assumean alarming situation in the near future affecting agricultural production and thus economyGround Water Recharge and Conservation may be carried out in these areas to overcome thedepletion Other than the groundwater depletion quality and rising water table are the otherissues
Fig20 Long term ground water table variation
52 Rising Water tableIn western parts of the area water table is rising due to less withdrawal of ground water
because of brackish saline quality coupled with easy availability of canal water for domesticand irrigation purposes As such these areas are likely to get water logged in near future Thereis an urgent need to arrest the rising water trend in western part and implement anti-waterlogging schemes
Aquifer Mapping and Management Plan of Faridkot District Punjab State
Page | 34
53 Ground Water QualityThe ground water of the study area is alkaline in nature Ground water in the area is
generally fresh to marginally saline with fluoride concentration above permissible limit (15mgL) are found mainly in Nathuwala (603) Killi (429) Kot Kapura (333) Dhilwan Kalan(285)and Bir Sikhanwala (184) Nitrate concentration above permissible limit (45mgl) are found inSukhanwala (46) Sher singhwala (65) Wara Daraka (66) Dhilwan Kalan (72)Nathuwala (79)Chand Bhaja (79) Bir Sikhanwala (89) Nangal (104) Tehna (118) Dal Singhwala(136) Killi (140)and KotKapura (144) and iron concentration above permissible limit (15 mgL)are observed inDeviwala (177) There is growing concern on deterioration of ground water quality due togeogenic and anthropogenic activities
54 Ground Water Irrigation ScenarioAs per the data available from minor irrigation census 2005-06 the detailed number of
shallow deep tube wells lined unlined water distribution system land holdings of wells aregiven in Table-89 amp10
Table-8 Distribution of Tube wells According to Well Ownerrsquos land holding SizeType of
Tube well(TW)
Marginal(0-1 ha)
Small(1-2 ha)
Semi-Medium(2-4 ha)
Medium(4-10ha)
Big(gt10ha)
Total
Shallow TW 1100 4029 10069 14576 5314 35088
Deep TW 29 197 596 1188 468 2478
Total 1129 4226 10665 15764 5782 37566
Table-9 Distribution of Tube wells According to DepthDepth of Tubewells in metres Total depth
Range0-150m
Depth range 0-20 m 20-40 m 40-60 m 60-70 m 70-90m 90-150m gt150 m
Tubewells 3507 9947 9998 11636 543 1744 191 37566
Tubewells () 9 26 27 31 1 5 1
Table-10 System of Ground water distribution deviceOpen Water Channels
Linedpucca Unlinedkutcha Others Total2093 35455 18 37566
Aquifer Mapping and Management Plan of Faridkot District Punjab State
Page | 35
60 MANAGEMENT STRATEGIES AND AQUIFER MANAGEMENT PLAN
Aquifer mapping is leads to groundwater management plans to be implemented byincluding demand side-management and Ground Water Use Efficiency
An outline of the Aquifer Management Plan for each block is given in Part-II Thisincludes details regarding population rainfall average annual rainfall agriculture and irrigationwater bodies ground water resource availability ground water extraction and water levelbehavior Aquifer disposition and various cross sections have also been given Ground waterresources extraction and other issues including ground water resource enhancement anddemand side innervations have been given
Artificial recharge plan is less feasible in the Faridkot District due to very low availabilityof volume of surplus water (959 mcm) Another focus has been given to minimize the grossdraft by enhancing ground water use efficiency in irrigation system after replacing the waterdistribution system from unlinedkutcha channel to Under Ground Pipeline System (UGPS) inover exploited blocks of the district
61 Scope of ImplementationThis plan is focusing on the technical aspects of the ground water recharge through
various means so that various implementing agencies may get the appropriate technicalguidelines The existingongoing schemes of the central or state govt like MANERGA IWSPPMKSY (Prime Minister Krishi Sinchai Yojna) NABARD funded schemes Urban Developmentschemes departmentally funded projects etc may be benefitted from the recharge plan byincorporating the input in the operational guidelines design and for locating the specific sites
Agriculture University engineering Collages Academic and Research Institution NGOmay also take up the pilot or demonstrative projects in the blocks suitable to them to plan atlocal level as per local conditions
62 Potential of Enhancing the Ground Water Use EfficiencyThe micro level transformation in the ground water management have vast impact
potential to counter extensive ground water depletion faced in the state of Punjab particularlyin overexploited blocks
There are around 35455 (out of 37566) tube wells (9438 ) operated by farmers forirrigation through unlinedKutcha open channel system in study area (Table-10) where waterfrom the tube well is discharge to the agricultural field In this process huge (around 25 )(RKVY 2015) quantity of ground water is wasted in soil moisture and evaporation losses
Around 95 of the tube wells are of shallow depth (20 to 70m) and remaining wells aredeeper depth (70 to gt150 m) existed in the area (Table-9) Thus majority of wells are tappingshallow aquifer which is under stress
Dynamic ground water resources (2013) indicate that Gross ground water draft forirrigation in the district is estimated at 94880 mcm It is expected that around 25 of overdraft can be brought down by switching over to undergroundsurface pipeline based
Aquifer Mapping and Management Plan of Faridkot District Punjab State
Page | 36
distribution from the prevailing unlined open channels Thereby gross draft will be reduced to224 mcm (Table-11a) assuming that there is no crop diversification by the farmers
The benefit will lead to saving of precious ground water resources in overexploitedblocks The measure if implemented will bring down the ground water overdraft from 160 to123 The category of the blocks will also improve resulting in boosting of agriculture andindustrial development otherwise not sustainable in over-exploited blocks (Table-11b)
The tube wells also consume enormous electricity which is subsidized and governmentincur significant revenue on this account The measures therefore will result in saving of energyand money Pollution impact will be reduced whenever diesel engines are used by the farmersThe environmental and ecological condition in the irrigated land will improve Unwanted weedgrowth will also be controlled inside the farm land It is expected to save 1 of the agriculturalland occupied by open channels which can be utilized for cultivation purpose Heavy groundwater overdraft can be reduced by these efforts This will ensure more crops per drop
63 Water saving Potential from Crop Diversification-Change Paddy to MaizeSoya-beanAs the requirement of water for paddy is much high therefore by changing paddy to
maizesoya-bean will help in saving of water For estimating the water saving by cropdiversification it is assumed that one mcm of water will be saved in case of maize or soyabeanplanted in one sq km of land In case of pulses even higher amount of ground water can besaved
The block wise saving of water in mcm by applying various management strategies suchas crop diversification Under Ground Pipe lines (UGPL) in individual land and artificial rechargemethods are given in tables 11a b
Table-11a Scope of Quantitative Impact on Stage of Development after applying variousmanagement strategies in mcm
Block Net GroundWater
Availability(mcm)
TotalIrrigation
Draft(mcm)
PresentStage of
draft(SOD)
() (Asper
2013)
Reduction in draft by different watersaving method
SODafterwards
()
Change ofpaddy
cultivationarea ( ofexisting)
Replacewater
coursesby UGPipes
(mcm)
AdoptArtificialrecharge
(mcm)
ChangePaddy
toMaize(mcm)
Total(mcm)
(2+3+4)
1 2 3 4 5Faridkot 34632 52861 158 12472 484 7245 20201 9969 -
Kot Kapura 26821 42020 162 9915 475 6264 16654 9986 -Total 61453 94880 160 22387 959 13567 36913 9948
Aquifer Mapping and Management Plan of Faridkot District Punjab State
Page | 37
Table-11b Impact on Stage of Development (SOD) after applying various managementstrategies in Faridkot District
Block PresentSOD ()
as on2013
Reductionin SOD ()
afterunlinedchannel
()
ResultantSOD ()
Col(2 - 3)
Reduction inStage of
developmentafter crop
diversificationby
MaizeSoyabean()
ResultantSOD ()
Col(2 - 5)
Reduction inStage of
developmentafter Artificialrecharge ()
ResultantSOD ()
Col(2 - 7)
1 2 3 4 5 6 7 8Faridkot 158 3601 12199 2090 13710 140 15660
KotKapura 162 3697 12503 2340 13860 177 16023
Total 160 3664 12336 2210 13790 178 15822
By adopting all the management strategies resulting in total reduction in stage of groundwaterdevelopment is 6052 Hence overall stage of development afterwards is 9948 and is givenin Table12
Table-12 Overall Stage of Development (SOD) after reduction in Faridkot
Block PresentStage of
development() as on
2013
Reduction instage of
developmentafter unlinedchannel ()
Reduction inStage of
developmentafter crop
diversificationby
MaizeSoyabean()
Reduction inStage of
developmentafter Artificialrecharge ()
TotalReduction in
Stage ofdevelopment
()
(3 +4+5)
Stage ofdevelopmentafterwards
()
(2-6)
1 2 3 4 5 6 7Faridkot 158 3601 2090 140 5831 9969
Kot Kapura 162 3697 2340 177 6214 9986Total 160 3664 2210 178 6052 9948
Aquifer Mapping and Management Plan of Faridkot District Punjab State
Page | 38
70 CONCLUSIONS1 The area lies in the central part of Satluj basin of Indo-Gangetic Alluvial plain
Geologically the area is occupied by a thick sequence of Quaternary deposits of Mid-Pleistocene to Recent age
2 The Principle Aquifer system in the study area is Alluvium and the Major Aquifers areOlder Alluvium and Aeolian Alluvium
3 Lithological characteristics of the area are Multi-cyclic light grey to brown fine tomedium grained mixture of clay silt and sand with Kankar
4 Thick layering of clay with sand at many places can be observed towards south of thedistrict at deeper depths The Ground water occurs in unconfined (water table) andconfined conditions
5 Chemical data of ground water from shallow aquifer indicates that ground water isalkaline and fresh to moderately saline
6 To delineate fresh water - saline water interface laterally as well as vertically surfacegeophysical investigations have been carried out in alluvial tracts
7 To understand the sub surface disposition geological sections and fence diagram havebeen prepared by synthesizing the various sub-surface sections on the basis of study ofthe lithological logs and electrical logs of boreholes drilled by CGWB WRED PSTC andPrivate Agencies using the RockWorks15 software
8 Aquifer IA (Very Shallow Aquifer) extends maximum upto 70 m of depth and below thatclay layer starts getting thickened about 10-12m separating Aquifer IB to a maximumdepth of 123 m Multi layer aquifers are existing in the area each aquifer is separated bythick clay zones of 25 to 40 m upto 300m depth It is very difficult to differentiate theaquifer groups after Aquifer Group I so the whole lithology is considered to be a singleaquifer group system
9 Stage of Ground Water Development of the district is 160 on the basis of Dynamicground water resources 2013 In- storage ground water resources has also beencalculated up to a depth of 300 meters
10 The fresh water resources are inadequate in aquifer upto maximum depth of 106mwhereas saline water is dominant resources below 106 m depth upto 300 m In thenorth of the district towards Faridkot block fresh water is available upto 152m depth
11 Dynamic ground water resources of the study area are 61453 mcm whereas In-storageground water resources up to fresh water zones are 3954 mcm Thus total fresh groundwater resources up to maximum depth of 152 m are 4569 mcm Total saline waterresources up to depth of 300 m are 3129 mcm
12 Main groundwater issues in the area are groundwater depletion quality and risingwater table
13 Considering the high ground water abstraction for irrigation (94880 mcm) andoverdraft (37157 mcm) it is suggested that proposed artificial recharge measures (959mcm) crop diversification measures (13567 mcm) and conserving ground waterthrough laying of underground pipe line (22387 mcm) will be useful
14 Other techniques of water saving and modern irrigation technology to be enforced tomaximize per drop of water use in the district and also to think about the hidden salinewater resources and for its utilizations
Aquifer Mapping and Management Plan of Faridkot District Punjab State
Page | 39
BLOCK WISE
AQUIFER MAPS
AND
MANAGEMENT PLAN
(PART-II)
Aquifer Mapping and Management Plan of Faridkot District Punjab State
Page | 40
I Salient Information of Faridkot Block
Block Area(in Km2)
75210 sq km
District State Faridkot PunjabPopulation Urban Population 2260
Rural Population 179432Total population 181692
Rainfall NormalMonsoon 335 mm
Non-monsoon Rainfall 35 mmAnnual Average Rainfall 349 mm
Agriculture and Irrigation Principal crops Wheat Cotton and PaddyGross cropped area 119562 sq kmNet sown area 59180 sq kmIrrigation practices Canal and Tube well IrrigationCropping intensity 202Area underGround water Irrigation 6159 sq kmSurface water irrigation 51143 sq kmNumber and types of abstraction structures 20927 Tubewells
Ground Water ResourceAvailability and Extraction
Ground water Resources AvailabilityTotal Ground Water Resources available is 5025 mcm (fresh andsaline water) up to the depth of 300m The fresh water resourcesare estimated up to the depth of 152 m on the basis of geophysicalinterpretations The potential granular zones available for freshwater are calculated as 72 m Saline water resources are estimatedon the basis of available well depth (up to 300 m) and the granularzones are counted after depth of 152 m and available zones are 103m Block is categorized as Over-Exploited as per DynamicGroundwater Resources 2013 assessment
Ground water Resources ExtractionDeeper aquifers are marginal to highly saline and not suitable forirrigation purpose as such all users are tapping shallow aquifersDrinking water supply wells of State Government tapping shallowaquifers Therefore the ground water draft could not be assessed fordeeper aquifer
Aquifer Mapping and Management Plan of Faridkot District Punjab State
Page | 41
Existing and future waterdemands
Existing Gross Ground water Draft as on 2013Irrigation 52861 mcmDomestic and industrial water supply 1911 mcmFuture water demandsIrrigation development potential (-)2045 mcmDomestic and industrial water supply up to 2025 years 2219 mcm
Water level behavior Aquifer wise water levelAquifer-IPre Monsoon 145 ndash 1522 m bglPost Monsoon 120 ndash 1310 m bglMean (10 yrs) 100 ndash (-)101 myrTrendsPre Monsoon 018 ndash (-)022 myrPost Monsoon 024 ndash (-)030 myrAquifer-IINo Monitoring stations
Aquifer-IIINo Monitoring stations
HYDROGRAPH SHOWING DECLINING WATER TABLE
Aquifer Mapping and Management Plan of Faridkot District Punjab State
Page | 42
HYDROGRAPH SHOWING DECLINING WATER TABLE
HYDROGRAPH SHOWING DECLINING WATER TABLE
Monitoring well Golewala dried after 2004
Aquifer Mapping and Management Plan of Faridkot District Punjab State
Page | 43
Aquifer Disposition
Number of aquifers 1
Principal aquifer AlluviumMajor Aquifer Older Alluvium Aeolian Alluvium
Exploratory Data AvailabilitySource of Data No of exploration wells as per depth range (m) Total
lt100 100-200 200-300 gt300
CGWB 1 0 0 4 5WREDPSTCWSS 6 1 0 2 9PRIVATE 0 0 0 0 0TOTAL 7 1 0 6 14
Aquifer wise Characteristics (CGWB 2012)AquiferGroup
Geology Type ofAquifer
ThicknessofGranularzones (m)
Transmissivity(m2day)
YieldDischarge
(m3day)
SpecificYield
Storativity
SingleAquiferSystem
Quarter-naryAlluvialdeposits
Unconfined toconfined
175 474 - 2660 939 -55944
12 (0072)
175 x 10-3
-18 x 10-3
Well field proposed in adjacent blockThe Aquifer comprises of fresh and saline water and the major aquifer material is sand Theaquiclude and aquitard comprises of clay clay with siltExploratory Data Validated
Source of Data No of exploration wells as per depth range (m) Totallt100 100-200 200-300 gt300
CGWB 0 0 0 4 4WREDPSTCWSS 0 0 0 2 2PRIVATE 0 0 0 0 0TOTAL 0 0 0 6 6
The data is validated by selecting the deepest well in each quadrant and used for preparation of3-D Litho models 2-D Geological Cross Sections Fence Diagrams and Aquifer Maps
Aquifer Mapping and Management Plan of Faridkot District Punjab State
Page | 44
3-D Lithological Model of Faridkot Block
Lithological Cross Section from Dip Singh Wala to Nangal
Lithological Cross Section from Toot to Nangal
Aquifer Mapping and Management Plan of Faridkot District Punjab State
Page | 45
3-D Lithological Fence Diagram
3-D Aquifer Disposition Fence Diagram
Aquifer Mapping and Management Plan of Faridkot District Punjab State
Page | 45
3-D Lithological Fence Diagram
3-D Aquifer Disposition Fence Diagram
Aquifer Mapping and Management Plan of Faridkot District Punjab State
Page | 45
3-D Lithological Fence Diagram
3-D Aquifer Disposition Fence Diagram
Aquifer Mapping and Management Plan of Faridkot District Punjab State
Page | 46
Ground water Resource Extraction Contamination and other issues in Faridkot Block
Ground WaterResources upto thedepth of 300m
Dynamic Fresh waterresources
34632 mcm
In-storage Fresh waterresources
182375 mcm
In-storage Saline waterresources
285516 mcm
Total 502523 mcmGround WaterExtraction (as per 2013)
Irrigation 52861 mcm
Domestic amp Industrial 1911 mcm
Future Demand for domestic amp Industrial sector(2025) (as per 2013)
2219 mcm
Stage of Groundwater Development 158
Chemical Quality of ground water Ground water in the area is alkaline and pHranges between 794 to 917 Groundwater in the area is fresh to marginal salineEC value of ground water show widevariations and ranges from 444 Scm to8653Scm at 250CRSC values vary from (ndash) 73 to 113 meqLarea is fit for irrigation
Ground water Contamination Issues Fluoride (mgl)Nathuwala (603) Killi(429)Nitrate (mgl)Sukhanwala (46) Sher Singhwala (65)Nathuwala (79) Chand Baja (79) Nangal(104) Tehna (118) Killi (140)Iron (mg)Devi wala (177)
Other issues Water level decline has been observed inmajor parts of the block due to indiscriminate development of ground waterresourcesIn shallow water level area lessdevelopment of ground water resourcecouple with recharge from canal irrigationis causing water logging and inland salinityproblems
Aquifer Mapping and Management Plan of Faridkot District Punjab State
Page | 47
Ground water Resource Enhancement Potential
Aquifer wise space available for recharge and proposed interventions (Supply Side Measures)
Aquifer-I
Volumes of unsaturated zone after 3m upto a desirable depth 10830 mcmSource water requirementavailability for recharge Rain Canal Irrigation return flowTypes and number of structures NAOther interventions proposed Artificial Recharge Roof top Rainwater harvesting will conserve484 mcm volume of water
Demand side interventions
Advanced Irrigation PracticesArea proposed to be covered Entire Block Faridkot (75210 sq km)Volume of Water expected to be conserved under advanced irrigation practices such as lining ofunderground pipelines (Kutcha channel) 12472 mcm
Required Change in cropping pattern
Proposed change in cropping pattern Paddy to Maize Soyabean The overexploitation can bemanaged at sustainable level (100) by changing the Paddy cropArea coverage 15 of the total paddy area needs to change ie7245 sq kmAnticipated volume of water to be saved 7245 mcm
Net AnnualGroundWater
Availability2013
(mcm)
TotalIrrigation Draft
(present)(mcm)
GrossDraft alluses(present)(mcm)
Paddyarea
(Sq km)
RequiredArea to
beChange
fromPaddy toMaize
soyabean
(Sq km)
Amountof
WaterSaved(mcm)
Grossdraftafter
savingof water(mcm)
PresentStage of
development ()
Reductionin Stage ofdevelopme
nt afterMaize
soya bean()
CropDiversifiedarea ()
34632 52861 54771 48300 7245 7245 45616 158 209 15
Alternate Water sourcesSurface water sources Tanks PondsLocation details and availability from such sources outside the area Not AvailableRegulation and Control
Punjab Subsoil Act for delay in paddy plantation should continue in the area
Aquifer Mapping and Management Plan of Faridkot District Punjab State
Page | 48
Other interventions proposed if anyModern Irrigation Practices be adopted for Rabi crops Some of the techniques are given in
the table below (PAU Ludhiana)
SlNo Techniques Water Saving()
Crops
1 Mulching 17 Wheat2 Bed Planting 18-25 Wheat3 Use of Sprinkler and drip
Irrigation70-90 Sugarcane Cotton Sunflower Maize
Other than that by 15 days ponding followed by 2 days of drying can lead to 25 saving of water inpaddy crop
Aquifer Mapping and Management Plan of Faridkot District Punjab State
Page | 49
II Salient Information of Kot Kapura Block
Block Area(in Km2)
66650 sq km
District State Faridkot PunjabPopulation Urban Population 373
Rural Population 221025Total population 221398
Rainfall Normal Monsoon 328 mmNon-monsoon Rainfall 61 mmAnnual Average Rainfall 370 mm
Agriculture and Irrigation Principal crops Wheat Cotton and PaddyGross cropped area 133427 sq kmNet sown area 67498 sq kmIrrigation practices Canal and Tube well IrrigationCropping intensity 198Area underGround water Irrigation 4278 sq kmSurface water irrigation 62899 sq kmNumber and types of abstraction structures 16639 Tubewells
Ground Water ResourceAvailability and Extraction
Ground water Resources AvailabilityTotal Ground Water Resources available is 2672 mcm (fresh andsaline water) up to the depth of 300 m The fresh water resourcesare estimated up to the depth of 106 m on the basis of geophysicalinterpretations The potential granular zones available for freshwater are 51 m Saline water resources are estimated on the basis ofwell (up to 300 m) and the granular zones are counted after depth of106 m and available zones are 76 m Block is categorized as Over-Exploited as per Dynamic Groundwater Resources 2013 assessment
Ground water Resources ExtractionDeeper aquifers are marginal to highly saline and not suitable forirrigation purpose as such all users are tapping shallow aquifersDrinking water supply wells of State Government tapping shallowaquifers Therefore the ground water draft could not be assessed fordeeper aquifer
Aquifer Mapping and Management Plan of Faridkot District Punjab State
Page | 50
Existing and future waterdemands
Existing Gross Ground water Draft as on 2013Irrigation 42020 mcmDomestic and industrial water supply 1402 mcmFuture water demandsIrrigation development potential (-)16709 mcmDomestic and industrial water supply up to 2025 years 1511 mcm
Water level behavior Aquifer wise water levelAquifer-IPre Monsoon 235 ndash 1600 m bglPost Monsoon 155 ndash 1820 m bglMean (10 yrs) 158 ndash (-)086 myrTrendsPre Monsoon 016 ndash (-)026 myrPost Monsoon 015 ndash (-)029 myrAquifer-II (156m)Pre Monsoon 772 m bglPost Monsoon 805 m bglAquifer-III (269m)Pre Monsoon NAPost Monsoon 820 m bgl
HYDROGRAPH SHOWING DECLINING WATER TABLE
Aquifer Mapping and Management Plan of Faridkot District Punjab State
Page | 51
HYDROGRAPH SHOWING DECLINING WATER TABLE
HYDROGRAPH SHOWING DECLINING WATER TABLE
Aquifer Mapping and Management Plan of Faridkot District Punjab State
Page | 52
Aquifer Disposition
Number of aquifers 1
Principal aquifer AlluviumMajor Aquifer Older Alluvium Aeolian Alluvium
Exploratory Data AvailabilitySource of Data No of exploration wells as per depth range (m) Total
lt100 100-200 200-300 gt300
CGWB 2 1 1 4 8WREDPSTCWSS 8 0 0 1 9PRIVATE 1 0 1 0 2TOTAL 11 1 2 5 19
Aquifer wise Characteristics (CGWB2015)AquiferGroup
Geology Type ofAquifer
ThicknessofGranularzones (m)
Transmi-ssivity(m2day)
Yield(m3day)
SpecificYield
Storativity
SingleAquiferSystem
QuaternaryAlluvialdeposits
Unconfinedto confined
127 547 -2990
3668 12 (0072) 72x10-4
Well field proposed in this block (Site Location Deviwala)The Aquifer comprises of fresh and saline water and the major aquifer material is sand Theaquiclude and aquitard comprises of clay clay with siltExploratory Data Validated
Source of Data No of exploration wells as per depth range (m) Totallt100 100-200 200-300 gt300
CGWB 0 0 1 4 5WREDPSTCWSS 0 0 0 1 1PRIVATE 0 0 1 0 1TOTAL 0 0 2 5 7
The data is validated by selecting the deepest well in each quadrant and used for preparation of3-D Litho models 2-D Geological Cross Sections Fence Diagrams and Aquifer Maps
Aquifer Mapping and Management Plan of Faridkot District Punjab State
Page | 53
3-D Lithological model of Kot Kapura Block
Lithological Cross section from Wara Daraka to Aulakh
Lithological Cross section from Nangal to Dal Singhwala
Aquifer Mapping and Management Plan of Faridkot District Punjab State
Page | 54
3-D Lithological Fence Diagram
3-D Aquifer Disposition Fence Diagram
Aquifer Mapping and Management Plan of Faridkot District Punjab State
Page | 54
3-D Lithological Fence Diagram
3-D Aquifer Disposition Fence Diagram
Aquifer Mapping and Management Plan of Faridkot District Punjab State
Page | 54
3-D Lithological Fence Diagram
3-D Aquifer Disposition Fence Diagram
Aquifer Mapping and Management Plan of Faridkot District Punjab State
Page | 55
Ground water Resource Extraction Contamination and other issues in Kot Kapura Block
Ground WaterResources upto thedepth of 300m
Dynamic Fresh waterresources
26821 mcm
In-storage Fresh waterresources
213062 mcm
In-storage Saline waterresources
27360 mcm
Total 267243 mcmGround WaterExtraction (as per 2013)
Irrigation 42020 mcm
Domestic amp Industrial 1402 mcm
Future Demand for domestic amp Industrial sector(2025) (as per 2013)
1511 mcm
Stage of Groundwater Development 162
Chemical Quality of ground water Ground water in the area is alkaline and pHranges between 820 to 893 Ground waterin the area is slightly fresh to marginalsaline EC value of the ground water showwide variations and ranges from 1154Scm to 3988 Scm at 250CRSC values are varies from -003 to 1100meqL and the area is fit for irrigation
Ground water Contamination Issues Fluoride (mgl)Kot Kapura (333) Dhilwan kalan (285)Moharewala ( 195) Bir Sikhanwala ( 184)Nitrate (mgl)Wara Daraka (66) Dhilwan Kalan (72)Moharewala (78) Bir sikhan wala (89)KotKapura (144)
Other issues Water level decline has been observed inmajor parts of the block due to indiscriminate development of ground waterresourcesIn shallow water level area lessdevelopment of ground water resourcecouple with recharge from canal irrigation iscausing water logging and inland salinityproblems
Aquifer Mapping and Management Plan of Faridkot District Punjab State
Page | 56
Ground water Resource Enhancement Potential
Aquifer wise space available for recharge and proposed interventions (Supply Side Measures)
Aquifer-I
Volume of unsaturated zone after 3m upto a desirable depth 14396 mcmSource water requirementavailability for recharge Rain Canal Irrigation return flowTypes and number of structures NAOther interventions proposed Artificial Recharge Roof top Rainwater harvesting will conserve475 mcm volume of water
Demand side interventions
Advanced Irrigation PracticesArea proposed to be covered Entire Kot Kapura Block (66650 sq km)Volume of Water expected to be conserved under advanced irrigation practices such as lining ofunderground pipelines (Kutcha channel) etc 9915 mcm
Required Change in cropping pattern
Proposed change in cropping pattern Rice to Maize Soyabean The overexploitation can bemanaged at sustainable level (100) by changing the Paddy cropArea coverage 12 of the total rice area needs to change ie 6264 sq kmAnticipated volume of water to be saved 6264 mcm
Net AnnualGroundWater
Availability2013
(mcm)
TotalIrrigation Draft
(present)(mcm)
GrossDraft alluses(present)(mcm)
Paddyarea
(Sq km)
RequiredArea to be
Changefrom
Paddy toMaize
soya bean(Sq km)
Amountof
WaterSaved(mcm)
Grossdraftafter
savingof water(mcm)
PresentStage of
development ()
Reductionin Stage ofdevelopme
nt afterMaize
soya bean()
CropDiversifiedarea ()
26821 42020 43421 52200 6264 6264 35756 162 234 12
Alternate Water sourcesSurface water sources Tanks PondsLocation details and availability from such sources outside the area Not AvailableRegulation and Control
Punjab Subsoil Act for delay in paddy plantation should continue in the area
Other interventions proposed if anyModern Irrigation Practices be adopted for Rabi crops Some of the techniques are given in
the table below (PAU Ludhiana)
Aquifer Mapping and Management Plan of Faridkot District Punjab State
Page | 57
SlNo Techniques Water Saving()
Crops
1 Mulching 17 Wheat2 Bed Planting 18-25 Wheat3 Use of Sprinkler and drip
Irrigation70-90 Sugarcane Cotton Sunflower Maize
Other than that by 15 days ponding followed by 2 days of drying can lead to 25 saving of water inpaddy crop
Aquifer Mapping and Management Plan of Faridkot District Punjab State
Page | 58
Annexure-I
Nd Not Determined BDL Below Detection Limit
Aquifer Mapping and Management Plan of Faridkot District Punjab State
Page | 59
Annexure-IIData Availability of Exploration Wells of Faridkot district
SlNo LOCATION LONGITUDE LATITUDE DEPTH ELEVATION BLOCK DEPARTMENT1 Dal Singhwala 74950 30469 300 211 Kot Kapura CGWB2 Dip Singh Wala 74483 30742 300 201 Faridkot CGWB3 Golewala 74692 30792 300 1995 Faridkot CGWB4 Jaito Mandi 74891 30446 300 203 Kot Kapura CGWB5 Kot Kapura 74814 30576 300 206 Kot Kapura CGWB6 Nanak Nagri 74893 30581 200 210 Kot Kapura PRIVATE7 Nangal 74869 30669 300 206 Faridkot CGWB8 Tehna 74790 30690 300 205 Faridkot CGWB9 Wara Daraka 74797 30548 300 205 Kot Kapura CGWB
10 Aulakh 74920 30643 300 211 Kot Kapura PSTC11 Bhagthala 74786 30777 300 198 Faridkot PSTC12 Sadhuwala 74559 30717 300 196 Faridkot PSTC13 Deviwala 74870 30612 269 207 Kot Kapura CGWB14 Deviwala-I 74870 30612 156 207 Kot Kapura CGWB15 Kouni 74675 30760 60 194 Faridkot WSS16 Ghugiana 74639 30746 60 198 Faridkot WSS17 Pahluwala 74763 30799 60 203 Faridkot WSS18 Faridkot 74763 30681 60 203 Faridkot WSS19 Doda Bhundar 75016 30470 121 212 Kot Kapura WRED20 Dhudi 74849 30700 60 207 Faridkot WSS21 Ratti Rori 74811 30647 60 208 Faridkot WSS22 Chak Kalyan 74705 30572 60 203 Kot Kapura WSS23 Kot Kapura 74812 30596 60 208 Kot Kapura WSS24 Behbal Kalan 74913 30531 60 210 Kot Kapura WSS25 Rorian Kapura 74815 30439 60 207 Kot Kapura WSS26 Panjgrain 74914 30608 70 211 Kot Kapura PRIVATE27 Fatehgarh 74943 30405 60 208 Kot Kapura WSS
28Bhurj JawarSingh 74987 30535 60 211 Kot Kapura WRED
29 Dewarana 74766 30593 30 206 Kot Kapura WRED30 Sher Singhwala 74628 30665 65 195 Faridkot CGWB31 Bir Sikhan wala 74849 30627 65 207 Kot Kapura CGWB32 Dohak 74603 30632 163 197 Muktsar CGWB33 Toot 74645 30829 217 196 Ghal khurd CGWB
Two exploratory wells from adjacent districts ie Dohak from Muktsar district and Toot fromFerozpur district have been incorporated for the preparation of lithological fence and crosssections
Aquifer Mapping and Management Plan of Faridkot District Punjab State
Page | 60
Annexure-IIILITHOLOGICAL DATA OF WELLS IN FARIDKOT DISTRICT
Well Location Depth from Depth to Lithology Thickness
Dal Singhwala
0 13 Clay 1313 20 Fresh Sand 720 28 Clay 828 57 Fresh Sand 2957 64 Clay 764 75 Saline Sand 1175 78 Clay 378 97 Saline Sand 1997 108 Clay 11
108 117 Saline Sand 9117 122 Clay 5122 134 Saline Sand 12134 157 Clay 23157 173 Saline Sand 16173 179 Clay 6179 184 Saline Sand 5184 211 Clay 27211 219 Saline Sand 8219 253 Clay 34253 259 Saline Sand 6259 278 Clay 19278 293 Saline Sand 15293 298 Clay 5298 300 Saline Sand 2
Dip Singh Wala
0 8 Fresh Sand 88 36 Clay 28
36 68 Fresh Sand 3268 755 Clay 75
755 805 Fresh Sand 5805 83 Clay 2583 92 Fresh Sand 992 93 Clay 193 109 Saline Sand 16
109 113 Clay 4113 116 Saline Sand 3116 120 Clay 4120 132 Saline Sand 12
Aquifer Mapping and Management Plan of Faridkot District Punjab State
Page | 61
Dip Singh Wala 132 146 Clay 14146 162 Saline Sand 16162 168 Clay 6168 192 Saline Sand 24192 195 Clay 3195 197 Saline Sand 2197 2015 Clay 45
2015 209 Saline Sand 75209 2135 Clay 45
2135 2175 Saline Sand 42175 221 Clay 35221 237 Saline Sand 16237 2865 Clay 495
2865 2895 Saline Sand 32895 293 Clay 35293 296 Saline Sand 3296 300 Clay 4
Golewala
0 75 Clay 7575 2885 Fresh Sand 2135
2885 40 Clay 111540 525 Fresh Sand 125
525 60 Clay 7560 88 Saline Sand 2888 93 Clay 593 103 Saline Sand 10
103 1325 Clay 2951325 1375 Saline Sand 51375 155 Clay 175155 1575 Saline Sand 25
1575 182 Clay 245182 2035 Saline Sand 215
2035 2285 Clay 252285 234 Saline Sand 55234 253 Clay 19253 2725 Saline Sand 195
2725 280 Clay 75280 2975 Saline Sand 175
2975 300 Clay 25Jaito Mandi 0 15 Clay 15
15 25 Fresh Sand 1025 28 Clay 3
Aquifer Mapping and Management Plan of Faridkot District Punjab State
Page | 62
Jaito Mandi 28 42 Fresh Sand 1442 46 Clay 446 59 Fresh Sand 1359 80 Clay 2180 915 Fresh Sand 115
915 103 Clay 115103 107 Fresh Sand 4107 1555 Clay 485
1555 1715 Fresh Sand 161715 191 Clay 195191 213 Saline Sand 22213 220 Clay 7220 223 Saline Sand 3223 238 Clay 15238 255 Saline Sand 17255 273 Clay 18273 2785 Saline Sand 55
2785 2805 Clay 22805 283 Saline Sand 25283 2985 Clay 155
2985 300 Saline Sand 15
Kot Kapura
0 14 Clay 1414 21 Fresh Sand 721 25 Clay 425 355 Fresh Sand 105
355 37 Clay 1537 50 Fresh Sand 1350 57 Clay 757 64 Fresh Sand 764 69 Clay 569 77 Fresh Sand 877 88 Clay 1188 99 Fresh Sand 1199 103 Clay 4
103 106 Saline Sand 3106 123 Clay 17123 1286 Saline Sand 56
1286 130 Clay 14130 1326 Saline Sand 26
1326 134 Clay 14134 1355 Saline Sand 15
Aquifer Mapping and Management Plan of Faridkot District Punjab State
Page | 63
Kot Kapura
1355 1492 Clay 1371492 1518 Saline Sand 261518 155 Clay 32155 1584 Saline Sand 34
1584 161 Clay 26161 1796 Saline Sand 186
1796 1812 Clay 161812 1838 Saline Sand 261838 1865 Clay 271865 2045 Saline Sand 182045 207 Clay 25207 2125 Saline Sand 55
2125 249 Clay 365249 2545 Saline Sand 55
2545 280 Clay 255280 2944 Saline Sand 144
2944 300 Clay 56
Nanak Nagri
0 136 Clay 136136 208 Fresh Sand 72208 265 Clay 57265 305 Fresh Sand 4305 34 Clay 3534 368 Fresh Sand 28
368 388 Clay 2388 40 Fresh Sand 1240 428 Clay 28
428 46 Fresh Sand 3246 695 Clay 235
695 712 Fresh Sand 17712 785 Clay 73785 815 Fresh Sand 3815 84 Clay 2584 87 Fresh Sand 387 92 Clay 592 936 Saline Sand 16
936 988 Clay 52988 100 Saline Sand 12100 1085 Clay 85
1085 1115 Saline Sand 31115 118 Clay 65118 120 Saline Sand 2
Aquifer Mapping and Management Plan of Faridkot District Punjab State
Page | 64
Nanak Nagri 120 128 Clay 8128 1296 Saline Sand 16
1296 130 Clay 04130 1316 Saline Sand 16
1316 135 Clay 34135 1368 Saline Sand 18
1368 165 Clay 282165 1676 Saline Sand 26
1676 184 Clay 164184 1868 Saline Sand 28
1868 1905 Clay 371905 1948 Saline Sand 431948 2134 Clay 186
Nangal
0 8 Clay 88 20 Fresh Sand 12
20 23 Clay 323 28 Fresh Sand 528 29 Clay 129 41 Fresh Sand 1241 72 Clay 3172 80 Fresh Sand 880 91 Clay 1191 124 Fresh Sand 33
124 151 Clay 27151 158 Fresh Sand 7158 163 Clay 5163 171 Fresh Sand 8171 181 Clay 10181 187 Fresh Sand 6187 193 Clay 6193 199 Fresh Sand 6199 203 Clay 4203 219 Fresh Sand 16219 224 Clay 5224 233 Saline Sand 9233 243 Clay 10243 249 Saline Sand 6249 251 Clay 2251 257 Saline Sand 6257 300 Clay 43
Tehna 0 8 Clay 8
Aquifer Mapping and Management Plan of Faridkot District Punjab State
Page | 65
Tehna
8 23 Fresh Sand 1523 28 Clay 528 32 Fresh Sand 432 37 Clay 537 41 Fresh Sand 441 59 Clay 1859 63 Fresh Sand 463 69 Clay 669 72 Fresh Sand 372 102 Clay 30
102 106 Fresh Sand 4106 120 Clay 14120 123 Fresh Sand 3123 133 Clay 10133 136 Fresh Sand 3136 145 Clay 9145 150 Fresh Sand 5150 158 Clay 8158 163 Fresh Sand 5163 168 Clay 5168 172 Fresh Sand 4172 176 Clay 4176 184 Fresh Sand 8184 210 Clay 26210 215 Fresh Sand 5215 221 Clay 6221 225 Fresh Sand 4225 254 Clay 29254 264 Fresh Sand 10264 267 Clay 3267 275 Fresh Sand 8275 294 Clay 19294 300 Fresh Sand 6
Wara Daraka
0 15 Clay 1515 22 Fresh Sand 722 28 Clay 628 48 Fresh Sand 2048 52 Clay 452 61 Fresh Sand 961 65 Clay 465 75 Fresh Sand 10
Aquifer Mapping and Management Plan of Faridkot District Punjab State
Page | 66
Wara Daraka
75 84 Clay 984 86 Saline Sand 286 91 Clay 591 97 Saline Sand 697 101 Clay 4
101 119 Saline Sand 18119 124 Clay 5124 129 Saline Sand 5129 150 Clay 21150 172 Saline Sand 22172 184 Clay 12184 188 Saline Sand 4188 196 Clay 8196 205 Saline Sand 9205 234 Clay 29234 239 Saline Sand 5239 274 Clay 35274 281 Saline Sand 7281 300 Clay 19
Aulakh
0 1829 Clay 18291829 4573 Fresh Sand 27444573 7621 Clay 30487621 9146 Fresh Sand 15259146 10975 Clay 1829
10975 1128 Saline Sand 3051128 13414 Clay 2134
13414 16768 Saline Sand 335416768 20112 Clay 334420112 21036 Saline Sand 92421036 21341 Clay 30521341 21951 Saline Sand 6121951 2256 Clay 6092256 245 Saline Sand 194245 300 Clay 55
Bhagthala
0 35 Clay 3535 1829 Fresh Sand 1479
1829 41 Clay 227141 53 Fresh Sand 1253 63 Clay 1063 8537 Saline Sand 2237
8537 92 Clay 663
Aquifer Mapping and Management Plan of Faridkot District Punjab State
Page | 67
92 102 Saline Sand 10102 1311 Clay 291
1311 13415 Saline Sand 30513415 16768 Clay 335316768 17073 Saline Sand 30517073 185 Clay 1427
185 203 Saline Sand 18203 22866 Clay 2566
22866 23476 Saline Sand 6123476 253 Clay 1824
253 273 Saline Sand 20273 280 Clay 7280 294 Saline Sand 14294 300 Clay 6
Sadhuwala
0 61 Fresh Sand 6161 3049 Clay 2439
3049 52 Saline Sand 215152 625 Clay 105
625 725 Saline Sand 10725 77 Clay 4577 84 Saline Sand 784 91 Clay 791 107 Saline Sand 16
107 110 Clay 3110 114 Saline Sand 4114 118 Clay 4118 130 Saline Sand 12130 14339 Clay 1339
14339 16463 Saline Sand 212416463 17683 Clay 12217683 207 Saline Sand 3017
207 2115 Clay 452115 2155 Saline Sand 42155 219 Clay 35219 235 Saline Sand 16235 237 Clay 2237 25624 Saline Sand 1924
25624 27134 Clay 15127134 300 Saline Sand 2866
Deviwala0 15 Clay 15
15 23 Fresh Sand 8
Aquifer Mapping and Management Plan of Faridkot District Punjab State
Page | 68
Deviwala
23 38 Clay 1538 46 Fresh Sand 846 48 Clay 248 53 Fresh Sand 553 61 Clay 861 65 Fresh Sand 465 72 Clay 772 78 Fresh Sand 678 94 Clay 1694 106 Fresh Sand 12
106 109 Clay 3109 112 Saline Sand 3112 128 Clay 16128 140 Saline Sand 12140 158 Clay 18158 163 Saline Sand 5163 179 Clay 16179 183 Saline Sand 4183 187 Clay 4187 196 Saline Sand 9196 202 Clay 6202 213 Saline Sand 11213 218 Clay 5218 223 Saline Sand 5223 252 Clay 29252 258 Saline Sand 6258 263 Clay 5263 269 Saline Sand 6
Dohak
0 8 Clay 88 10 Fresh Sand 2
10 21 Clay 1121 33 Saline Sand 1233 41 Clay 841 79 Saline Sand 3879 89 Clay 1089 95 Saline Sand 695 99 Clay 499 112 Saline Sand 13
112 116 Clay 4116 139 Saline Sand 23139 154 Clay 15
Aquifer Mapping and Management Plan of Faridkot District Punjab State
Page | 69
154 163 Saline Sand 9
Toot
0 15 Clay 1515 198 Fresh Sand 48
198 21 Clay 1221 474 Fresh Sand 264
474 51 Clay 3651 552 Fresh Sand 42
552 626 Clay 74626 766 Fresh Sand 14766 101 Clay 244101 104 Fresh Sand 3104 113 Clay 9113 116 Fresh Sand 3116 143 Clay 27143 146 Saline Sand 3146 167 Clay 21167 170 Saline Sand 3170 182 Clay 12182 204 Saline Sand 22204 214 Clay 10214 217 Saline Sand 3
Aquifer Mapping and Management Plan of Faridkot District Punjab State
Page | 70
Annexure-IVAQUIFER GROUPING OF WELL LOCATIONS IN FARIDKOT DISTRICT
Well location Depth from Depth to Aquifer Thickness FreshGranular
Zones
SalineGranular
Zones
Dal Singhwala
0 15 Unsaturated Zone 15 215 57 Aquifer Group-IA 42 3457 64 Aquiclude-IA 764 134 Aquifer Group-IB 70 51
134 157 Aquiclude-IB 23157 300 Multiple Aquifers 143 52
Dip Singh Wala
0 5 Unsaturated Zone 5 55 68 Aquifer Group-IA 63 35
68 755 Aquiclude-IA 75755 132 Aquifer Group-IB 565 14 31132 146 Aquiclude-IB 14146 300 Multiple Aquifers 154 755
Golewala
0 4 Unsaturated Zone 4 14 525 Aquifer Group-IA 485 33
525 60 Aquiclude-IA 7560 103 Aquifer Group-IB 43 38
103 155 Aquiclude-IB 52155 300 Multiple Aquifers 145 665
Jaito Mandi
0 14 Unsaturated Zone 14 114 59 Aquifer Group-IA 45 3759 80 Aquiclude-IA 2180 107 Aquifer Group-IB 27 155
107 1555 Aquiclude-IB 4851555 300 Multiple Aquifers 1445 16 515
Kot Kapura
0 9 Unsaturated Zone 9 29 77 Aquifer Group-IA 68 455
77 88 Aquiclude-IA 1188 106 Aquifer Group-IB 18 11 3
106 155 Aquiclude-IB 49155 300 Multiple Aquifers 145 68
Nanak Nagri
0 12 Unsaturated Zone 12 112 46 Aquifer Group-IA 34 18446 69 Aquiclude-IA 2369 131 Aquifer Group-IB 62 77 11
131 165 Aquiclude-IB 34165 2134 Multiple Aquifers 484 97
Nangal 0 9 Unsaturated Zone 9 1
Aquifer Mapping and Management Plan of Faridkot District Punjab State
Page | 71
Nangal
9 41 Aquifer Group-IA 32 2941 72 Aquiclude-IA 3172 124 Aquifer Group-IB 52 41
124 151 Aquiclude-IB 27151 300 Multiple Aquifers 149 43 21
Tehna
0 10 Unsaturated Zone 10 210 41 Aquifer Group-IA 31 18741 59 Aquiclude-IA 1859 106 Aquifer Group-IB 47 33
106 158 Aquiclude-IB 52158 300 Multiple Aquifers 142 50
Wara Daraka
0 4 Unsaturated Zone 4 04 75 Aquifer Group-IA 71 46
75 84 Aquiclude-IA 984 129 Aquifer Group-IB 45 31
129 150 Aquiclude-IB 21150 300 Multiple Aquifers 150 47
Aulakh
0 17 Unsaturated Zone 17 217 46 Aquifer Group-IA 29 2646 76 Aquiclude-IA 3076 113 Aquifer Group-IB 37 1525 305
113 134 Aquiclude-IB 21134 300 Multiple Aquifers 166 6828
Bhagthala
0 4 Unsaturated Zone 4 14 53 Aquifer Group-IA 49 24
53 63 Aquiclude-IA 1063 102 Aquifer Group-IB 39 3237
102 168 Aquiclude-IB 66168 300 Multiple Aquifers 132 6115
Sadhuwala
0 5 Unsaturated Zone 5 55 52 Aquifer Group-IA 47 2151
52 63 Aquiclude-IA 1163 130 Aquifer Group-IB 67 49
130 144 Aquiclude-IB 14144 300 Multiple Aquifers 156 11931
Deviwala
0 8 Unsaturated Zone 8 28 78 Aquifer Group-IA 70 31
78 94 Aquiclude-IA 1694 112 Aquifer Group-IB 18 12 3
112 128 Aquiclude-IB 16128 269 Multiple Aquifers 141 58
Aquifer Mapping and Management Plan of Faridkot District Punjab State
Page | 72
Dohak
0 3 Unsaturated Zone 3 03 79 Aquifer Group-IA 76 2 50
79 89 Aquiclude-IA 1089 139 Aquifer Group-IB 50 42
139 154 Aquiclude-IB 15154 163 Multiple Aquifers 9 9
Toot
0 9 Unsaturated Zone 9 19 55 Aquifer Group-IA 46 354
55 63 Aquiclude-IA 863 116 Aquifer Group-IB 53 25
116 143 Aquiclude-IB 27143 217 Multiple Aquifers 74 31
- कदरीय भमि जल बोरड
-
- जल ससाधन नदी विकास और गगा सरकषण मतरालय
- भारत सरकार
-
- contents naquim faridkotpdf (p1-5)
- Final Faridkot edited 170317pdf (p6-77)
-

Aquifer Mapping and Management Plan of Faridkot District Punjab State
Page | 4
b Faridkot Uttar- Dhudhi- sandy-loamy This part of Faridkot district extends over DhudhiKot Sukhia Tehna and is known as Uttar area The soil is sandy loam Due to extensionof agriculture and irrigation there is apparent disappearance of sand dunes to a greatextent which have been leveled up generally
c Jaitu Area- Sandy Loam to Loam This region extends over and around Jaitu tehsil Thetexture of the soil is sandy loam to loam This area is known for the best staple ofcotton Most of the area is covered under sandy soil followed by clayey soil except somepatches where there is appreciable thickness of top clay layer varying from 67 to 167m
The study area is developed by Indo Gangetic Alluvium main landforms are Alluvial Plain Sandsheets Sand dunes and Palaeo Channels Alluvial plain forms the major part of the areafollowed by Sand Sheets and Sand dunes as patches Palaeo channel is occurred in central partof the study area
The soils classes are mainly loams loamy sand sandy to fine sandy loams and siltyloams Loamy sand is covered in major part of the study area
The combined studies on fluvial geomorphology and Remote sensing studies in northwestern region are carried out by IITs and Delhi University It has been observed that the hugeflood depositions by River Ghaggar Saraswati and other minor rivers at different time intervaland channel migrations in different ages and also Aeolian depositions caused sand dunes indifferent time interval leads to difficulty in aquifer grouping The studies are also conformedthrough sedimentological core sampling analysis during the project The observations areunderstood by regional geomorphology and channels migrations which shown in the belowFig2
Fig2 Fluvial Geomorphological Studies carried out to understand the SubsurfaceAquifer System in North Western Regions
Aquifer Mapping and Management Plan of Faridkot District Punjab State
Page | 5
17 Land Use Land CoverBased on the visual interpretation of satellite data and topographical data land
useland classes have been identified The main classes are Built Up land Agricultural landforestland Land under non agriculture use current fallows and water bodies The Land usepatterns are given in below tableLand use pattern of Faridkot district Punjab (wwwagripbgovin)
Type of Land use Area (ha)
1 Total Geographical area 1419002 Forest 20043 Land put to non-agricultural use 16719 (11)4 Current Fallows 22395 Net area sown 126678 (89)6 Gross cropped area 2529897 Cropping intensity 200
18 River System and Water Resources
No river is flowing through the area but there are some drains which flow during heavyrains and serve as natural drainage The main drains are Tarobri Drain Mari Drain Samadh BhaiDrain and Chand Bhan Drain (Fig3) There is a good network of canals and these passes throughthe area The main canals are Bikaner Canal Sirhind Feeder Rajasthan Feeder Abohar andBathinda branches of Sirhind Canal Bikaner Canal and Bathinda Branch of Sirhind Canal passesthrough northwestern and southeastern margins of the district and Sirhind Feeder RajasthanFeeder Abohar Branch of Sirhind Canal run through the entire length of district in north-southand northeast-southwest directions respectively (Fig4) Sirhind canal system has been servingthe district for irrigation since long time There are large water bodies near Khara PanjgrainJaito Mandi Wara daraka and in Faridkot Town These water bodies generally dry in summer
19 Agriculture amp IrrigationFaridkot is mainly an agricultural district and 70 of the population resided in the rural
areas depends up on agriculture The two main crop seasons in a year are Kharif and Rabi whichis locally known as lsquoSaunirsquo(Summer Harvest Season) and lsquoHarrhirsquo (Winter Harvest Season) Theprinciple Kharif crops are Paddy Maize Bajra Cotton Moong Mash Moth Arhar Sugarcaneetc while important Rabi crops are Wheat Barley Gram Sarson Taramera and Toria etc
Irrigation is carried out by surface water and ground water As major parts of the areaare underlain by saline water so canal water is major source of irrigation In some parts whereground water is available as fresh water lenses than irrigation is covered by skimming wellsknown as multiple well point system Kharif and Rabi is cultivated in study area under two typesof soil ie loamy sand and sandy loam and the sources of irrigation are canal as well astubewells Conjunctive use of canal water and ground water for irrigation is being carried outefficiently in this area
Aquifer Mapping and Management Plan of Faridkot District Punjab State
Page | 6
a Canal Water IrrigationMajor source of irrigation is canal where water from Sirhind canal is utilized for
irrigation The other important distributaries are Abohar Branch Dhulkot distributary systemMari distributary system Faridkot distributary Kotkapura distributary Jaitu distributaryRupana and Doda distributary system The total length of above distributaries which serve inFaridkot district is 22844 km out of which 20649 km is lined and 2185 km is unlined Grossirrigated areas of all the channels are 9025339 ha and cultural command area is 8026656 hawith 294 no of outlets Intensity of irrigation is 140
b Ground Water IrrigationWith the advent of multiple well point systems ground water irrigation is also playing
an important role in development of agriculture economy of the study area This is not onlyrelease the pressure mounted on the canal water supply but also creates the maximum storagein the unconfined aquifer for fresh ground water through return flow and canal seepage
110 IndustriesThere are no major industries in the area except rice mills in Deviwala village and few
poultry farms in the district
111 Mineral ResourcesSince the entire area is occupied by Quaternary sediments no minerals of significant
industrial use are foundAlkaline soils contain saltpetre called Kalmi Shora in local languagewhich has application in chemical oxide glass soap industry and leather tanning are found inthis area It is being extracted at Sirsari and Kot Sukhia villages It occurs as thin slightlyyellowish to dark brown encrustation on the ground surface and is found mostly over the oldhabitation sites lsquoThehsrsquo or over barren kallar lands and cattle sheds
Saltpetre is an important source of Niter (KNO3) which is used in cracker industrymatchbox manufacture and as a fertilizer
112 Water Conservation and Artificial rechargeThe north and eastern part of the area where water level is declining artificial recharge
structures may help in arresting the decline Recharge Trench with injection well structure isthe suitable for artificial recharge Water conservation methods like change in cropping patternchange in Irrigation policy lining of unlined channels timely plantation of paddy promotion ofsprinkler and drip irrigation etc may be adopted to overcome the ground water decline in thearea
Aquifer Mapping and Management Plan of Faridkot District Punjab State
Page | 7
Fig3 Drainage and Water Bodies of Faridkot District
Aquifer Mapping and Management Plan of Faridkot District Punjab State
Page | 8
Fig4 Canal and Distributaries of Faridkot District
Aquifer Mapping and Management Plan of Faridkot District Punjab State
Page | 9
20 DATA COLLECTION AND GENERATION
21 Geology and Hydrogeological dataThe area lies in the central part of Satluj basin of Indo-Gangetic Alluvial plain
Geologically the area is occupied by a thick sequence of Quaternary deposits of Mid-Pleistoceneto Recent age These comprise alternate sequence of fluvial and arid phases The exposedQuaternary Sediments can be broadly classifies as- (i) Older Alluvium of Middle to UpperPleistocene age overlain by (ii) Aeolian deposits of Holocene age The provenance of OlderAlluvium deposited by rivers originated from Himalayas and Aeolian deposits have been laiddown by wind action from Thar Desert of Rajasthan in the southwest part of the area Thegeneralized stratigraphic sequence of the area are given belowGeneralized Stratigraphy Faridkot District (After Garg amp Singh 1993)Age Lithological Unit Lithological Characteristics
Holocene Aeolian Flat Unconsolidated thin veneer of Aeolian sand
Newer Dunes Unconsolidated orange brown sand and silt
Semi consolidated dunes Semi consolidated light to dark brown sand
Older dune Dark brown Aeolian sand and silt withsome vegetal matter
Mid to UpperPleistocene
Older Alluvium Multi-cyclic light grey to brown fine tomedium grained mixture of clay silt andsand with Kankar Light grey to pink stickyclay grayish mica sand with kankar
-----Basement not exposed----
The Principle Aquifer in the study area is Alluvium and the Major Aquifers are OlderAlluvium and Aeolian Alluvium (Fig5) The Ground water occurs in unconfined (water table) andconfined conditions
211 Water Level BehaviorTwenty three monitoring stations of Central Ground Water Board (CGWB) (7
Piezometers and 16 Dugwells) and Eighteen monitoring stations (18 Piezometers) of StateGovernment represent the first aquifer Second and third aquifer is represented by onemonitoring station of CGWB Depth to water level in the area ranges from 145 to 1819 m bglduring pre-monsoon period (Fig6) and 120 to 2015 m bgl during post monsoon period (Fig7)In eastern part water levels are in the range of 10 to 20 m in central part the water levels are inthe range of 5 to 10 m bgl and in western part the water levels are shallower in the range of 2to 5 m Seasonal water level fluctuation shows a rise and fall in the range of 110 to (-) 200 m inwestern and eastern part of the districts respectively during year 2015
Aquifer Mapping and Management Plan of Faridkot District Punjab State
Page | 10
Hydrograph of Different Observation Wells
Fig5 Major Aquifers
Aquifer Mapping and Management Plan of Faridkot District Punjab State
Page | 11
Fig6 Depth to Water level Pre Monsoon 2015
Aquifer Mapping and Management Plan of Faridkot District Punjab State
Page | 12
Fig7 Depth to Water level Post Monsoon 2015
Aquifer Mapping and Management Plan of Faridkot District Punjab State
Page | 13
22 Water Quality DataGround water quality of shallow aquifer (Aquifer-I) is assessed on the basis of chemical
data of National Hydrograph Network stations ie NHNS monitored during Pre monsoonperiod Twenty four groundwater samples are collected during NHNS 2015 and chemicalanalysis is given in Annexure-I The chemical quality of deeper aquifers has to be assessedduring ongoing groundwater exploration programme under NAQUIM
Chemical data of shallow aquifer indicates that ground water is alkaline in nature TheElectrical Conductivity (EC) values ranges from 444 to 8653 microScm at 25oC indicating fresh tomoderately saline The EC values less than 1000 microScm at 25oC have observed at four locationsie Jand Sahib (444) Devi wala (476) Mehmuana (550) and Arianwala (700) respectively TheEC values more than 3000 microScm at 25oC have observed at six locations ie Tehna (8653) BajaKhana (3988) Nangal (3487) Kot Kapura (3299) Mumara (3212) and Sukhanwala (3126) Theground water occurring in the central and south-eastern parts are marginally to highly salineand not suitable for drinking purposes
The chloride concentration in ground water varies broadly between 28 mgl atAriyanwala and also 1544 mgl at Tehna Ground water with fluoride above 15 mgL are foundmainly in Nathuwala (603) Killi (429 ) Kot Kapura (333) Dhilwan kalan (285) Moharewala(195) and Bir Sikhanwala (184) and Nitrate concentration in groundwater above permissiblelimit 15 mgl are found in Kot kapura (144) Killi (140) Dal Singhwala (136)Tehna (118)Nangal (104) Bir Sikhan wala (89) Nathuwala (79) Chand baja (79 ) Wara Daraka (66) Shersinghwala (65) and Sukhanwala(46) The USSL diagrams used for classification of irrigationwater based on EC and SAR shown below observed that ground water occurring in Faridkotdistrict falls under C4S3 C2S1 C4S4 C3S1 C3S3 and C3S2 classes of irrigation classification
Aquifer Mapping and Management Plan of Faridkot District Punjab State
Page | 14
Such waters when used continuously for irrigation they are likely to cause salinityhazards and lead to reduction in crop yields Plot of USSL diagram indicates that ground watersfall under C2S1 and C3S1 classes of irrigation rating
Analysing mechanism and equipments used for chemical analysis are given in table-1Table-1 Analytical methods and equipments used for chemical analysis
S No Parameters Analytical Methods
A Physico-chemical analysis
pHConductivity (EC)Carbonate amp bicarbonate (CO3HCO3)Chloride (Cl)Sulphate (SO4)Nitrate (NO3)Fluoride (F)Total hardness (TH)Calcium (Ca)Magnesium (Mg)Sodium (Na)Potassium (K)Total Dissolved Solids (TDS)
Electrometric methodElectrical conductivity methodTitrimetric methodArgenotometric methodNephloturbidity method
Spectro-photometric methodIon metric methodEDTA-Titri metric methodEDTA-Titri metric methodBy differenceFlame photometric methodFlame photometric methodGravimetric
B Trace elementsHeavy metals
Copper (Cu)Cadmium (Cd)Chromium (Cr)Lead (Pb)Manganese (Mn)Nickel (Ni)Cyanide (Cn)
Iron (Fe)
Digestion followed by AtomicAbsorption Spectrophotometer
(AAS)
Spectrophotometer method
Aquifer Mapping and Management Plan of Faridkot District Punjab State
Page | 15
Fig8 Hill-Piper diagram for Groundwater Quality of Shallow Aquifer of Faridkot District
Aquifer Mapping and Management Plan of Faridkot District Punjab State
Page | 16
Fig8 Groundwater Quality 2015
Aquifer Mapping and Management Plan of Faridkot District Punjab State
Page | 17
23 Geophysical data
To delineate fresh water - saline water interface laterally as well as vertically surfacegeophysical investigations have been carried out in alluvial tracts over parts of the study areaUnder surface geophysical investigations total 44 VES (Fig9) in an area of 1800 sq km wereconducted with current electrical separation of 600 to 1000 m
Fig9 VES Locations in Faridkot District
Aquifer Mapping and Management Plan of Faridkot District Punjab State
Page | 17
23 Geophysical data
To delineate fresh water - saline water interface laterally as well as vertically surfacegeophysical investigations have been carried out in alluvial tracts over parts of the study areaUnder surface geophysical investigations total 44 VES (Fig9) in an area of 1800 sq km wereconducted with current electrical separation of 600 to 1000 m
Fig9 VES Locations in Faridkot District
Aquifer Mapping and Management Plan of Faridkot District Punjab State
Page | 17
23 Geophysical data
To delineate fresh water - saline water interface laterally as well as vertically surfacegeophysical investigations have been carried out in alluvial tracts over parts of the study areaUnder surface geophysical investigations total 44 VES (Fig9) in an area of 1800 sq km wereconducted with current electrical separation of 600 to 1000 m
Fig9 VES Locations in Faridkot District
Aquifer Mapping and Management Plan of Faridkot District Punjab State
Page | 18
Subsurface geophysical investigations include borehole logging The ground waterquality data pertaining to the CGWB exploratory boreholes indicate vertical and lateralvariation in EC values Shallow ground water quality data shows clearly the existence of salinityat shallow depth in the many parts of study area such as Pakka Mahmuana ShirinwalaShersinghwala Dohak Kamiyana Kingra and many other places Electrical conductivity (EC) ofground water is more than 2000 microS cm in major part of the area except at few places Slightimprovement in quality of ground water at deeper depth as compared to shallow depth hasbeen observed at few places These places are Chuggewala Golewalla Nangal Deepsinghwalawhere EC of ground water was found to be within 2000 microS cm within the depth range of 80 to120 m
24 Exploratory drilling State - Data AvailabilityThe Lithologs of Exploratory Well Observation well Piezometer productive wells of
CGWB Punjab State Tubewell Corporation (PSTC) now as Punjab Water ResourcesDevelopment and Management (PWRDM) WRED ( Water Resources and EnvironmentDirectorate) Water Supply and Sanitation (WSS) and Private Wells have been collected andthose supported electrical logs have been validated for aquifer map preparation The details areshown in Table-1
Table-1 Data Availability of Exploration Wells of Faridkot district
SlNo Source of data Depth Range (m) Totallt 100 100-200 200-300 gt300
1 CGWB 2 1 1 8 122 WREDPSTCWSS 15 1 0 3 193 PRIVATE WELLS 1 0 1 0 2Total 18 2 2 11 33
25 Spatial Data DistributionThe actual data of all the wells in the area are plotted on the map of 150000 scale with
5rsquoX5rsquogrid (9 x 9) km (Fig 10) Perusal of table shows that majority of tube wells falls in theshallow aquifer having depth less than 100m and deeper aquifer having depth more than 300mThe grids formations devoid of groundwater exploration are identified as data gaps and theseare to be filled by data generation The Physical record of the availability of exploration data aregiven in Annexure-II
Aquifer Mapping and Management Plan of Faridkot District Punjab State
Page | 19
Fig10 Locations of Exploration Data Availability
Aquifer Mapping and Management Plan of Faridkot District Punjab State
Page | 20
30 DATA INTERPRETATION INTEGRATION AND AQUIFER MAPPINGAll the available data have been validated to generate aquifer map The deepest well in
each quadrant is selected and plotted on the map of 150000 scale with 5rsquoX5rsquogrid (9 x 9) km(Fig11)
Fig11 Locations of validated exploration data
The optimized wells of CGWB PWRDM WRED WSS and Private Wells have been usedto prepare the elevation or collar elevation map to identify the topographic variations onground surface so that it can give the synoptic picture of gradient variations in the water levels
Aquifer Mapping and Management Plan of Faridkot District Punjab State
Page | 21
The topographic elevation values have been plotted to prepare the elevation contour map(Fig12) The locations of validated wells in quadrant and toposheet wise distributions inrespective blocks are given in Table-2 Locations of validated exploratory wells with litholog areshown in Fig13
Fig12 Elevation contour map
Fig13 Locations of validated exploratory wells with Litholog
Aquifer Mapping and Management Plan of Faridkot District Punjab State
Page | 22
Table -2 Summary of optimized exploration wells
Block ToposheetQuadrant Depth Range (m) Elevation(m amsl)
Source ofdata
Location lt 100 100-200 200-300 gt300Faridkot 1A 44J06 Dip Singh Wala - - - 350 201 CGWBFaridkot 3C 44J09 Golewala - - - 34378 1995 CGWBFaridkot 1A 44J14 Tehna - - - 300 205 CGWBFaridkot 3A 44J14 Bhagthala - - - 37195 198 PSTCFaridkot 1A 44J10 Sadhuwala - - - 35970 196 PSTCKot Kapura 1C 44J15 Dal Singhwala - - - 300 211 CGWBKot Kapura 1B 44J15 Jaito Mandi - - - 41920 203 CGWBKot Kapura 2A 44J14 Kot Kapura - - - 42190 206 CGWBKot Kapura 3B 44J14 Nanak Nagri - - 2134 - 210 PRIVATEKot Kapura 1B 44J14 Nangal - - - 300 206 CGWBKot Kapura 3A 44J14 Wara Daraka - - - 300 205 CGWBKot Kapura 2C 44J14 Aulakh - - - 38414 211 PSTCKot Kapura 2B 44J14 Deviwala - - 269 - 207 CGWBMuktsar 2B 44J10 Dohak - 163 - - 197 CGWBGhal khurd 3B 44J09 Toot - - 217 - 196 CGWB
Two exploratory wells from adjacent districts ie Dohak from Muktsar district and Toot from Ferozpur district have beenincorporated for the preparation of lithological fence and cross sections
Aquifer Mapping and Management Plan of Faridkot District Punjab State
Page | 23
31 Sub Surface Disposition311 Previous Work
To delineate and determine the potential aquifer zones evaluation of aquifercharacteristics etc Exploratory drilling was conducted by CGWB at 6 locations in the districtincludes 05 exploratory wells and 1 slim hole between 1975 to 2008 through in-house activitiesand 02 exploratory wells and 2 piezometers through outsourced by Ms WAPCOS Ltd between2011 to 2015 (Fig10) The drilling has been carried out to a maximum depth of about 408 m(Kot Kapura) and revealed the presence of 6 to 12 prominent permeable granular zones withaggregate thickness varying from 28 to 283 m The granular zone consists of fine to mediumsand The slim hole at Golewala and exploratory well at Kot Kapura have abandoned due topoor quality of formation water upto depth of 350m bgl
Further the study of exploratory boreholes drilled in the district revealed the presence ofmultiple aquifer groups up to the maximum drilled depth of 408 m The first aquifer group formsvery shallow water table aquifer (IA) and occurs down to 57 m Below that clay layer starts gettingthickened to about 8-10m separating Aquifer IB down to 120 m The below multi aquifers behavesas semi-confined to confined and consisting of thin sand layers alternating with thicker clay layersOverall flow of ground water is towards south-west direction Further the study of exploratoryboreholes drilled in the area revealed that the area is considered as a single aquifer system up tothe maximum depth of 300 m
312 Present NAQUIM StudyTo understand the sub surface disposition in the study area geological sections and
fence diagram have been prepared by synthesizing the various sub-surface sections on the basisof study of the lithological logs and electrical logs of boreholes drilled by CGWB WRED PSTCand Private Agencies using the RockWorks15 software and a 3D lithological model has beenprepared (Fig14) The 2D lithology sections and 3D lithological fence diagram has beenprepared using lithology model and are shown in Fig15a b amp 16 respectively The aquifers arecomposed of fine to medium sand with clay intercalations The granular zones are extensiveThe aquifer occurring below 252m depth are composed of very fine to medium sand with silt
Based on geophysical borehole logging and use of resistivity profiling followed by thedepth soundings at few selected places fresh-saline water zones are demarcated This analysisis extremely important for the present study and will be referred from time to time as it isobviously the higher resistivity beds represents freshwater zone in contrast in low resistive bedsindicating saline groundwater zoneFig14 3-Dimension Lithological Model
Aquifer Mapping and Management Plan of Faridkot District Punjab State
Page | 24
The major aquifer system of the area is Quaternary alluvial deposits having Older and Aeolianalluvium which mainly comprises of sand silt and clay The top surface layer is mainly silty clayThe lithology along W-E direction shows the variation in lithological thickness ie thin clay layersinter bedded with sand except at Nangal where thick clay layers were identified at 55 m bglThere is inter-layering of sand and clay with thick clay at Golewala and Bhagthala towardswestern side at a depth between 150m to 210m bgl There is thick a inter-layering of sand andclay towards all lithologs except Nanak Nagri shows thin sequence of sand and clay towards SWLithological data of wells are given in Annexure-III
Fig15ab 2-Dimension Lithological Sections
SWE
Aquifer Mapping and Management Plan of Faridkot District Punjab State
Page | 25
Fig16 3-Dimension Lithological Fence
Aquifer Mapping and Management Plan of Faridkot District Punjab State
Page | 26
32 Aquifer Geometry
The aquifer group embodies a number of granular layers alternating with clay lenses Afew clay layers intervening these aquifer groups pinch out against the sand zones at few placesThe marker horizons are traced all over the area by connecting their tops and bottoms Sandyclay layer occurs at the surface covering the unconfined aquifer which is in turn underlain byprominent clay zone It is composed of mainly of medium sand with thin beds of fine sand
Aquifer IA (Very Shallow Aquifer) extends maximum upto 70 m of depth and below thatclay layer starts getting thickened about 10-12m separating Aquifer IB to a maximum depth of123 m Multi layer aquifers are existing in the area each aquifer is separated by thick clay zonesof 25 to 40 m upto 300m depth (Annexure IV) Based on the same criteria to know the broadpicture of the aquifer disposition inter-relationship of granular zones nature geometry andextension of aquifers in the study area the aquifer grouping has been carried out using the sub-surface lithology and a 3-Dimensional aquifer model (Fig17) and aquifer disposition 3D fencediagram has also been prepared using the aquifer model (Fig18) Various groups identified inthe area are given in Table-3 It is very difficult to differentiate the aquifer groups after AquiferGroup I so the whole lithology is considered to be a single aquifer group system The firstaquifer is water table aquifer and extends all over the area The aquifer is mainly composed offine to coarse grained sand
Table-3 Aquifer Grouping in Faridkot DistrictAquifer Group Range Thickness
From To Min Max
Aquifer IA 4 70 29 50
Aquifer IB 64 123 21 52
Multiple Aquifers 133 300 21 85
Fig17 3D Aquifer Disposition Model
Aquifer Mapping and Management Plan of Faridkot District Punjab State
Page | 27
Fig18 3D Aquifer Disposition Fence
Aquifer Mapping and Management Plan of Faridkot District Punjab State
Page | 28
40 GROUND WATER RESOURCESGround water resource estimation of the area have been carried out by taking Dynamic
and In-storage resources of unconfined aquifer and confined aquifer present upto 300m depthThe assessment of dynamic ground water Resources of the study area have been carried outjointly by CGWB and Water Resources and Environment Directorate (WRED) Department ofIrrigation Punjab on the basis of Ground Water Estimation Committee (1997) methodology
The occurrence of potential aquifers (productive granular zones) upto 300 m depth hasbeen demarcated on basis of aquifer wise subsurface mapping The total saturated thickness ofgranular zones was derived from the exploratory borehole data of a particular block Thegranular zones occurring below the zone of water level fluctuation up to the first confining layerhas been considered as static unconfined zone The specific yield value for the unconfinedaquifer has been taken as 60 of 012 which comes as 0072 whereas for the confined aquiferthe storativity value has been considered Since the specific yield is likely to reduce withincrease in depth due to compaction of overlying sediments
Hence the major data elements considered in this estimation are thickness of granularzones specific yieldstorativity and area of both fresh water and salinebrackish water It hasbeen observed that in some of the blocks sufficient data on probable occurrence of granularzones was not available In those cases the existing exploratory data of adjoining blockdistricthas been either extrapolated or interpolated to derive such parameters required for estimationThis assessment of total groundwater resources has been computed based on the availabledata with CGWB amp WRED Department of Irrigation and Punjab
41 Groundwater Resources up to depth of 300ma Dynamic Resources
Block-wise ground water resource potential of the district has been assessed as perGEC-97 as on 31st March 2013 The primary source of recharge in the area is the rainfall Theground water development in all the blocks has exceeded the available recharge thus all theblocks have been categorized as over exploited The overall stage of ground water developmentin the Faridkot district has been assessed to be 160 The block wise details are given in belowTable-4
Table 4 Dynamic Ground Water Resource amp Development Potential (31032013) in mcmAssessmentUnit Block
NetAnnualGroundWater
Availability
ExistingGross
GroundWater Draft
forirrigation
ExistingGross GroundWater Draftfor domestic
andindustrial
water supply
ExistingGross
GroundWater
Draft forAll uses(11+12)
Provision fordomestic
andindustrial
requirementsupply to
2025
Net GroundWater
Availabilityfor futureirrigation
development(10-11-14)
Stage ofGroundWater
Development(1310)
100()
Category
Faridkot 34632 52861 1911 54771 2219 -20448 158Over
Exploited
Kot Kapura 26821 42020 1402 43421 1511 -16709 162Over
Exploited
TOTAL 61453 94880 3313 98193 3730 -37157 160Over
Exploited
Aquifer Mapping and Management Plan of Faridkot District Punjab State
Page | 29
b In-storage Ground Water ResourcesAs per revised guidelines recommended by the Central Level Expert Group on
groundwater resources assessment the resources are separately considered as dynamic and in-storage unconfined In case of alluvial area in-storage resources of unconfined aquifer havebeen computed on the basis of specific yield of aquifer as detailed below
In-storageGround Water
resources(Unconfined
Aquifer)
=
Thickness of the aquifer(granularproductive zone)
below the zone of water levelfluctuation down to the bottom
layer of unconfined aquifer
x Sp Yield ofthe aquifer
x Areal extentof the
aquifer
The dynamic and in-storage ground water resource estimations have been calculated forsingle aquifer group upto 300m of each block of Faridkot district In-storage ground waterresources are estimated for fresh water and saline water resources based on the geophysicalinterpretations of depth to fresh and saline water interface for each block The fresh and salinecalculations are made on the basis of the assumptions on aquifer that is considered asunconfined aquifer so that the specific yield concept is used for resources estimations (Fig19)The detailed resources estimations are calculated in detailed table for fresh and saline waterresources in the below Table-5 6amp 7
Total Availability of Ground Water Resources = Dynamic Resources + In-storage Resources
Fig19 Conceptual figure to understand the fresh and saline water resources in the aquifer up to300 m for Resource Estimation in Unconfined and Confined Aquifer System
(The clay lenses are more dominant in the aquifer and sometimes huge thickness of clay depositsare also observed in the lithologs)
Aquifer Mapping and Management Plan of Faridkot District Punjab State
Page | 29
b In-storage Ground Water ResourcesAs per revised guidelines recommended by the Central Level Expert Group on
groundwater resources assessment the resources are separately considered as dynamic and in-storage unconfined In case of alluvial area in-storage resources of unconfined aquifer havebeen computed on the basis of specific yield of aquifer as detailed below
In-storageGround Water
resources(Unconfined
Aquifer)
=
Thickness of the aquifer(granularproductive zone)
below the zone of water levelfluctuation down to the bottom
layer of unconfined aquifer
x Sp Yield ofthe aquifer
x Areal extentof the
aquifer
The dynamic and in-storage ground water resource estimations have been calculated forsingle aquifer group upto 300m of each block of Faridkot district In-storage ground waterresources are estimated for fresh water and saline water resources based on the geophysicalinterpretations of depth to fresh and saline water interface for each block The fresh and salinecalculations are made on the basis of the assumptions on aquifer that is considered asunconfined aquifer so that the specific yield concept is used for resources estimations (Fig19)The detailed resources estimations are calculated in detailed table for fresh and saline waterresources in the below Table-5 6amp 7
Total Availability of Ground Water Resources = Dynamic Resources + In-storage Resources
Fig19 Conceptual figure to understand the fresh and saline water resources in the aquifer up to300 m for Resource Estimation in Unconfined and Confined Aquifer System
(The clay lenses are more dominant in the aquifer and sometimes huge thickness of clay depositsare also observed in the lithologs)
Aquifer Mapping and Management Plan of Faridkot District Punjab State
Page | 29
b In-storage Ground Water ResourcesAs per revised guidelines recommended by the Central Level Expert Group on
groundwater resources assessment the resources are separately considered as dynamic and in-storage unconfined In case of alluvial area in-storage resources of unconfined aquifer havebeen computed on the basis of specific yield of aquifer as detailed below
In-storageGround Water
resources(Unconfined
Aquifer)
=
Thickness of the aquifer(granularproductive zone)
below the zone of water levelfluctuation down to the bottom
layer of unconfined aquifer
x Sp Yield ofthe aquifer
x Areal extentof the
aquifer
The dynamic and in-storage ground water resource estimations have been calculated forsingle aquifer group upto 300m of each block of Faridkot district In-storage ground waterresources are estimated for fresh water and saline water resources based on the geophysicalinterpretations of depth to fresh and saline water interface for each block The fresh and salinecalculations are made on the basis of the assumptions on aquifer that is considered asunconfined aquifer so that the specific yield concept is used for resources estimations (Fig19)The detailed resources estimations are calculated in detailed table for fresh and saline waterresources in the below Table-5 6amp 7
Total Availability of Ground Water Resources = Dynamic Resources + In-storage Resources
Fig19 Conceptual figure to understand the fresh and saline water resources in the aquifer up to300 m for Resource Estimation in Unconfined and Confined Aquifer System
(The clay lenses are more dominant in the aquifer and sometimes huge thickness of clay depositsare also observed in the lithologs)
Aquifer Mapping and Management Plan of Faridkot District Punjab State
Page | 30
Table-5 Block wise In-Storage Ground Water Resources of Fresh Water Aquifer
GENERAL DESCRIPTION OF THE GROUND WATER ASSESSMENT UNIT OF DISTRICT FARIDKOT PUNJAB STATE (2013)
Type of Ground Water Assessment Unit (Block) Faridkot Blocks
SrNo
Name ofAssessment
Unit
Type offormation
Areal extent (sq km) AveragePre-
monsoonWaterLevel
(m bgl)
Depth tobottom of
Aquiferbased on
Geophysical Interface
amp Boreholelogging(m bgl)
TotalThickness
offormation
belowPre-
monsoonWaterLevel(m)
(7-6)
Totalthickness
of theGranularZones up
to thedepth of
FreshWaterZones
(m)
Thicknessof the
unsaturated
granularZones up
to Pre-monsoon
WL(m)
Thicknessof the
saturatedgranularZones up
to thedepth of
Freshwater
aquiferbelow (m)
(9-10)
AverageSpecific
Yield
In-StorageGroundWater
Resourcesup to thedepth of
FreshWater
Aquifer(ham)
51112
TotalGeographical Area
AssessmentArea
FreshWater
1 2 3 4 5 6 7 8 9 10 11 12 13
1 Faridkot Alluvium 75210 36710 450 152 1475 72 2 69 0072 182375
2
KotKapura Alluvium 66650 61650 1069 106 9531 51 3 48 0072 213062Dist Total (ham) 141860 228406 395438Dist Total (mcm) 3954
ham hectare metremcm million cubic metre
Aquifer Mapping and Management Plan of Faridkot District Punjab State
Page | 31
Table-6 Block Wise In-Storage Ground Water Resources of Saline Aquifers upto 300 m Depth
GENERAL DESCRIPTION OF THE GROUND WATER ASSESSMENT UNIT OF DISTRICT FARIDKOT PUNJAB STATE (2013)Type of Ground Water Assessment Unit (Block) Faridkot BlocksSrNo
Name ofAssessment
Unit
Type offormation
Areal extent (ha) Depth tobottom of
Aquifer basedon Geophysical
Interface ampBoreholelogging(m bgl)
Depth tobottom of
Saline WaterAquifer
based onGeophysicalInterface ampBorelogging
(m bgl)
Totalthickness
of theSaline
Water upto the max
depth(m)
Totalthickness of
theGranular
Zones up tothe depth of
SalineWaterZones
(m)
AverageSpecific
Yield
In-StorageGroundWater
Resourcesup to thedepth of
SalineWater
Aquifer(ham)
51011
TotalGeographical
Area
AssessmentArea
Saline Water
1 2 3 4 5 6 7 8 9 10 111 Faridkot Alluvium 75210 38500 152 300 148 103 0072 2855162 Kot Kapura Alluvium 66650 5000 106 300 194 76 0072 27360
Dist Total (ham) 141860 228406 312876Dist Total (mcm) 3129
ham hectare metremcm million cubic metre
Aquifer Mapping and Management Plan of Faridkot District Punjab State
Page | 32
Table-7 Block Wise Total Availability of Fresh and Saline Groundwater Resources upto 300 m Depth and Volume of unsaturatedgranular zone after 3m upto water level
BLOCK WISE AVAILABILITY OF TOTAL GROUNDWATER RESOURCES IN FARIDKOT DISTRICTSlNo BLOCK Volume of
UnsaturatedGranular Zone
up to Pre-monsoon WL
DynamicGroundwater
Resources(2013)
AQUIFER-I
In-storageGroundwater
Resources UPTOFRESHWATER
Total FreshGroundwater
Resources[(4)+(5)] (HAM)
Total SalineGroundwater
Resources[(3)+(4)](HAM)
Total Availability ofGroundwater
Resources [(6)+(7)]
ham mcm
1 2 3 4 5 6 7 8 91 Faridkot 10830 34632 182375 217007 285516 502523 50252 Kot Kapura 14396 26821 213062 239883 27360 267243 2672
DistTotal (ham) 25227 61453 395438 456891 312876 769767 7698DistTotal (mcm) 252 615 3954 4569 3129
ham hectare metremcm million cubic metre
Aquifer Mapping and Management Plan of Faridkot District Punjab State
Page | 33
50 GROUND WATER ISSUES
51 Ground Water DepletionThe Study area is famous for its paddy and non paddy cultivation The quality of ground
water in the area is suitable for irrigation and drinking purposes therefore the ground water isconstantly being pumped for the irrigation due to its easy access through tube wells at shallowdepths and they are the main source of irrigation This will lead to its deepening of groundwater levels in blocks of Faridkot and Kot Kapura of Faridkot district as the recharge of thegroundwater through rainfall and other sources are less than the overall extraction Thehydrographs also shows the declining water level trend over the years in the district (Fig20) andis categorized as over-exploited This declining water table trend if not checked would assumean alarming situation in the near future affecting agricultural production and thus economyGround Water Recharge and Conservation may be carried out in these areas to overcome thedepletion Other than the groundwater depletion quality and rising water table are the otherissues
Fig20 Long term ground water table variation
52 Rising Water tableIn western parts of the area water table is rising due to less withdrawal of ground water
because of brackish saline quality coupled with easy availability of canal water for domesticand irrigation purposes As such these areas are likely to get water logged in near future Thereis an urgent need to arrest the rising water trend in western part and implement anti-waterlogging schemes
Aquifer Mapping and Management Plan of Faridkot District Punjab State
Page | 34
53 Ground Water QualityThe ground water of the study area is alkaline in nature Ground water in the area is
generally fresh to marginally saline with fluoride concentration above permissible limit (15mgL) are found mainly in Nathuwala (603) Killi (429) Kot Kapura (333) Dhilwan Kalan(285)and Bir Sikhanwala (184) Nitrate concentration above permissible limit (45mgl) are found inSukhanwala (46) Sher singhwala (65) Wara Daraka (66) Dhilwan Kalan (72)Nathuwala (79)Chand Bhaja (79) Bir Sikhanwala (89) Nangal (104) Tehna (118) Dal Singhwala(136) Killi (140)and KotKapura (144) and iron concentration above permissible limit (15 mgL)are observed inDeviwala (177) There is growing concern on deterioration of ground water quality due togeogenic and anthropogenic activities
54 Ground Water Irrigation ScenarioAs per the data available from minor irrigation census 2005-06 the detailed number of
shallow deep tube wells lined unlined water distribution system land holdings of wells aregiven in Table-89 amp10
Table-8 Distribution of Tube wells According to Well Ownerrsquos land holding SizeType of
Tube well(TW)
Marginal(0-1 ha)
Small(1-2 ha)
Semi-Medium(2-4 ha)
Medium(4-10ha)
Big(gt10ha)
Total
Shallow TW 1100 4029 10069 14576 5314 35088
Deep TW 29 197 596 1188 468 2478
Total 1129 4226 10665 15764 5782 37566
Table-9 Distribution of Tube wells According to DepthDepth of Tubewells in metres Total depth
Range0-150m
Depth range 0-20 m 20-40 m 40-60 m 60-70 m 70-90m 90-150m gt150 m
Tubewells 3507 9947 9998 11636 543 1744 191 37566
Tubewells () 9 26 27 31 1 5 1
Table-10 System of Ground water distribution deviceOpen Water Channels
Linedpucca Unlinedkutcha Others Total2093 35455 18 37566
Aquifer Mapping and Management Plan of Faridkot District Punjab State
Page | 35
60 MANAGEMENT STRATEGIES AND AQUIFER MANAGEMENT PLAN
Aquifer mapping is leads to groundwater management plans to be implemented byincluding demand side-management and Ground Water Use Efficiency
An outline of the Aquifer Management Plan for each block is given in Part-II Thisincludes details regarding population rainfall average annual rainfall agriculture and irrigationwater bodies ground water resource availability ground water extraction and water levelbehavior Aquifer disposition and various cross sections have also been given Ground waterresources extraction and other issues including ground water resource enhancement anddemand side innervations have been given
Artificial recharge plan is less feasible in the Faridkot District due to very low availabilityof volume of surplus water (959 mcm) Another focus has been given to minimize the grossdraft by enhancing ground water use efficiency in irrigation system after replacing the waterdistribution system from unlinedkutcha channel to Under Ground Pipeline System (UGPS) inover exploited blocks of the district
61 Scope of ImplementationThis plan is focusing on the technical aspects of the ground water recharge through
various means so that various implementing agencies may get the appropriate technicalguidelines The existingongoing schemes of the central or state govt like MANERGA IWSPPMKSY (Prime Minister Krishi Sinchai Yojna) NABARD funded schemes Urban Developmentschemes departmentally funded projects etc may be benefitted from the recharge plan byincorporating the input in the operational guidelines design and for locating the specific sites
Agriculture University engineering Collages Academic and Research Institution NGOmay also take up the pilot or demonstrative projects in the blocks suitable to them to plan atlocal level as per local conditions
62 Potential of Enhancing the Ground Water Use EfficiencyThe micro level transformation in the ground water management have vast impact
potential to counter extensive ground water depletion faced in the state of Punjab particularlyin overexploited blocks
There are around 35455 (out of 37566) tube wells (9438 ) operated by farmers forirrigation through unlinedKutcha open channel system in study area (Table-10) where waterfrom the tube well is discharge to the agricultural field In this process huge (around 25 )(RKVY 2015) quantity of ground water is wasted in soil moisture and evaporation losses
Around 95 of the tube wells are of shallow depth (20 to 70m) and remaining wells aredeeper depth (70 to gt150 m) existed in the area (Table-9) Thus majority of wells are tappingshallow aquifer which is under stress
Dynamic ground water resources (2013) indicate that Gross ground water draft forirrigation in the district is estimated at 94880 mcm It is expected that around 25 of overdraft can be brought down by switching over to undergroundsurface pipeline based
Aquifer Mapping and Management Plan of Faridkot District Punjab State
Page | 36
distribution from the prevailing unlined open channels Thereby gross draft will be reduced to224 mcm (Table-11a) assuming that there is no crop diversification by the farmers
The benefit will lead to saving of precious ground water resources in overexploitedblocks The measure if implemented will bring down the ground water overdraft from 160 to123 The category of the blocks will also improve resulting in boosting of agriculture andindustrial development otherwise not sustainable in over-exploited blocks (Table-11b)
The tube wells also consume enormous electricity which is subsidized and governmentincur significant revenue on this account The measures therefore will result in saving of energyand money Pollution impact will be reduced whenever diesel engines are used by the farmersThe environmental and ecological condition in the irrigated land will improve Unwanted weedgrowth will also be controlled inside the farm land It is expected to save 1 of the agriculturalland occupied by open channels which can be utilized for cultivation purpose Heavy groundwater overdraft can be reduced by these efforts This will ensure more crops per drop
63 Water saving Potential from Crop Diversification-Change Paddy to MaizeSoya-beanAs the requirement of water for paddy is much high therefore by changing paddy to
maizesoya-bean will help in saving of water For estimating the water saving by cropdiversification it is assumed that one mcm of water will be saved in case of maize or soyabeanplanted in one sq km of land In case of pulses even higher amount of ground water can besaved
The block wise saving of water in mcm by applying various management strategies suchas crop diversification Under Ground Pipe lines (UGPL) in individual land and artificial rechargemethods are given in tables 11a b
Table-11a Scope of Quantitative Impact on Stage of Development after applying variousmanagement strategies in mcm
Block Net GroundWater
Availability(mcm)
TotalIrrigation
Draft(mcm)
PresentStage of
draft(SOD)
() (Asper
2013)
Reduction in draft by different watersaving method
SODafterwards
()
Change ofpaddy
cultivationarea ( ofexisting)
Replacewater
coursesby UGPipes
(mcm)
AdoptArtificialrecharge
(mcm)
ChangePaddy
toMaize(mcm)
Total(mcm)
(2+3+4)
1 2 3 4 5Faridkot 34632 52861 158 12472 484 7245 20201 9969 -
Kot Kapura 26821 42020 162 9915 475 6264 16654 9986 -Total 61453 94880 160 22387 959 13567 36913 9948
Aquifer Mapping and Management Plan of Faridkot District Punjab State
Page | 37
Table-11b Impact on Stage of Development (SOD) after applying various managementstrategies in Faridkot District
Block PresentSOD ()
as on2013
Reductionin SOD ()
afterunlinedchannel
()
ResultantSOD ()
Col(2 - 3)
Reduction inStage of
developmentafter crop
diversificationby
MaizeSoyabean()
ResultantSOD ()
Col(2 - 5)
Reduction inStage of
developmentafter Artificialrecharge ()
ResultantSOD ()
Col(2 - 7)
1 2 3 4 5 6 7 8Faridkot 158 3601 12199 2090 13710 140 15660
KotKapura 162 3697 12503 2340 13860 177 16023
Total 160 3664 12336 2210 13790 178 15822
By adopting all the management strategies resulting in total reduction in stage of groundwaterdevelopment is 6052 Hence overall stage of development afterwards is 9948 and is givenin Table12
Table-12 Overall Stage of Development (SOD) after reduction in Faridkot
Block PresentStage of
development() as on
2013
Reduction instage of
developmentafter unlinedchannel ()
Reduction inStage of
developmentafter crop
diversificationby
MaizeSoyabean()
Reduction inStage of
developmentafter Artificialrecharge ()
TotalReduction in
Stage ofdevelopment
()
(3 +4+5)
Stage ofdevelopmentafterwards
()
(2-6)
1 2 3 4 5 6 7Faridkot 158 3601 2090 140 5831 9969
Kot Kapura 162 3697 2340 177 6214 9986Total 160 3664 2210 178 6052 9948
Aquifer Mapping and Management Plan of Faridkot District Punjab State
Page | 38
70 CONCLUSIONS1 The area lies in the central part of Satluj basin of Indo-Gangetic Alluvial plain
Geologically the area is occupied by a thick sequence of Quaternary deposits of Mid-Pleistocene to Recent age
2 The Principle Aquifer system in the study area is Alluvium and the Major Aquifers areOlder Alluvium and Aeolian Alluvium
3 Lithological characteristics of the area are Multi-cyclic light grey to brown fine tomedium grained mixture of clay silt and sand with Kankar
4 Thick layering of clay with sand at many places can be observed towards south of thedistrict at deeper depths The Ground water occurs in unconfined (water table) andconfined conditions
5 Chemical data of ground water from shallow aquifer indicates that ground water isalkaline and fresh to moderately saline
6 To delineate fresh water - saline water interface laterally as well as vertically surfacegeophysical investigations have been carried out in alluvial tracts
7 To understand the sub surface disposition geological sections and fence diagram havebeen prepared by synthesizing the various sub-surface sections on the basis of study ofthe lithological logs and electrical logs of boreholes drilled by CGWB WRED PSTC andPrivate Agencies using the RockWorks15 software
8 Aquifer IA (Very Shallow Aquifer) extends maximum upto 70 m of depth and below thatclay layer starts getting thickened about 10-12m separating Aquifer IB to a maximumdepth of 123 m Multi layer aquifers are existing in the area each aquifer is separated bythick clay zones of 25 to 40 m upto 300m depth It is very difficult to differentiate theaquifer groups after Aquifer Group I so the whole lithology is considered to be a singleaquifer group system
9 Stage of Ground Water Development of the district is 160 on the basis of Dynamicground water resources 2013 In- storage ground water resources has also beencalculated up to a depth of 300 meters
10 The fresh water resources are inadequate in aquifer upto maximum depth of 106mwhereas saline water is dominant resources below 106 m depth upto 300 m In thenorth of the district towards Faridkot block fresh water is available upto 152m depth
11 Dynamic ground water resources of the study area are 61453 mcm whereas In-storageground water resources up to fresh water zones are 3954 mcm Thus total fresh groundwater resources up to maximum depth of 152 m are 4569 mcm Total saline waterresources up to depth of 300 m are 3129 mcm
12 Main groundwater issues in the area are groundwater depletion quality and risingwater table
13 Considering the high ground water abstraction for irrigation (94880 mcm) andoverdraft (37157 mcm) it is suggested that proposed artificial recharge measures (959mcm) crop diversification measures (13567 mcm) and conserving ground waterthrough laying of underground pipe line (22387 mcm) will be useful
14 Other techniques of water saving and modern irrigation technology to be enforced tomaximize per drop of water use in the district and also to think about the hidden salinewater resources and for its utilizations
Aquifer Mapping and Management Plan of Faridkot District Punjab State
Page | 39
BLOCK WISE
AQUIFER MAPS
AND
MANAGEMENT PLAN
(PART-II)
Aquifer Mapping and Management Plan of Faridkot District Punjab State
Page | 40
I Salient Information of Faridkot Block
Block Area(in Km2)
75210 sq km
District State Faridkot PunjabPopulation Urban Population 2260
Rural Population 179432Total population 181692
Rainfall NormalMonsoon 335 mm
Non-monsoon Rainfall 35 mmAnnual Average Rainfall 349 mm
Agriculture and Irrigation Principal crops Wheat Cotton and PaddyGross cropped area 119562 sq kmNet sown area 59180 sq kmIrrigation practices Canal and Tube well IrrigationCropping intensity 202Area underGround water Irrigation 6159 sq kmSurface water irrigation 51143 sq kmNumber and types of abstraction structures 20927 Tubewells
Ground Water ResourceAvailability and Extraction
Ground water Resources AvailabilityTotal Ground Water Resources available is 5025 mcm (fresh andsaline water) up to the depth of 300m The fresh water resourcesare estimated up to the depth of 152 m on the basis of geophysicalinterpretations The potential granular zones available for freshwater are calculated as 72 m Saline water resources are estimatedon the basis of available well depth (up to 300 m) and the granularzones are counted after depth of 152 m and available zones are 103m Block is categorized as Over-Exploited as per DynamicGroundwater Resources 2013 assessment
Ground water Resources ExtractionDeeper aquifers are marginal to highly saline and not suitable forirrigation purpose as such all users are tapping shallow aquifersDrinking water supply wells of State Government tapping shallowaquifers Therefore the ground water draft could not be assessed fordeeper aquifer
Aquifer Mapping and Management Plan of Faridkot District Punjab State
Page | 41
Existing and future waterdemands
Existing Gross Ground water Draft as on 2013Irrigation 52861 mcmDomestic and industrial water supply 1911 mcmFuture water demandsIrrigation development potential (-)2045 mcmDomestic and industrial water supply up to 2025 years 2219 mcm
Water level behavior Aquifer wise water levelAquifer-IPre Monsoon 145 ndash 1522 m bglPost Monsoon 120 ndash 1310 m bglMean (10 yrs) 100 ndash (-)101 myrTrendsPre Monsoon 018 ndash (-)022 myrPost Monsoon 024 ndash (-)030 myrAquifer-IINo Monitoring stations
Aquifer-IIINo Monitoring stations
HYDROGRAPH SHOWING DECLINING WATER TABLE
Aquifer Mapping and Management Plan of Faridkot District Punjab State
Page | 42
HYDROGRAPH SHOWING DECLINING WATER TABLE
HYDROGRAPH SHOWING DECLINING WATER TABLE
Monitoring well Golewala dried after 2004
Aquifer Mapping and Management Plan of Faridkot District Punjab State
Page | 43
Aquifer Disposition
Number of aquifers 1
Principal aquifer AlluviumMajor Aquifer Older Alluvium Aeolian Alluvium
Exploratory Data AvailabilitySource of Data No of exploration wells as per depth range (m) Total
lt100 100-200 200-300 gt300
CGWB 1 0 0 4 5WREDPSTCWSS 6 1 0 2 9PRIVATE 0 0 0 0 0TOTAL 7 1 0 6 14
Aquifer wise Characteristics (CGWB 2012)AquiferGroup
Geology Type ofAquifer
ThicknessofGranularzones (m)
Transmissivity(m2day)
YieldDischarge
(m3day)
SpecificYield
Storativity
SingleAquiferSystem
Quarter-naryAlluvialdeposits
Unconfined toconfined
175 474 - 2660 939 -55944
12 (0072)
175 x 10-3
-18 x 10-3
Well field proposed in adjacent blockThe Aquifer comprises of fresh and saline water and the major aquifer material is sand Theaquiclude and aquitard comprises of clay clay with siltExploratory Data Validated
Source of Data No of exploration wells as per depth range (m) Totallt100 100-200 200-300 gt300
CGWB 0 0 0 4 4WREDPSTCWSS 0 0 0 2 2PRIVATE 0 0 0 0 0TOTAL 0 0 0 6 6
The data is validated by selecting the deepest well in each quadrant and used for preparation of3-D Litho models 2-D Geological Cross Sections Fence Diagrams and Aquifer Maps
Aquifer Mapping and Management Plan of Faridkot District Punjab State
Page | 44
3-D Lithological Model of Faridkot Block
Lithological Cross Section from Dip Singh Wala to Nangal
Lithological Cross Section from Toot to Nangal
Aquifer Mapping and Management Plan of Faridkot District Punjab State
Page | 45
3-D Lithological Fence Diagram
3-D Aquifer Disposition Fence Diagram
Aquifer Mapping and Management Plan of Faridkot District Punjab State
Page | 45
3-D Lithological Fence Diagram
3-D Aquifer Disposition Fence Diagram
Aquifer Mapping and Management Plan of Faridkot District Punjab State
Page | 45
3-D Lithological Fence Diagram
3-D Aquifer Disposition Fence Diagram
Aquifer Mapping and Management Plan of Faridkot District Punjab State
Page | 46
Ground water Resource Extraction Contamination and other issues in Faridkot Block
Ground WaterResources upto thedepth of 300m
Dynamic Fresh waterresources
34632 mcm
In-storage Fresh waterresources
182375 mcm
In-storage Saline waterresources
285516 mcm
Total 502523 mcmGround WaterExtraction (as per 2013)
Irrigation 52861 mcm
Domestic amp Industrial 1911 mcm
Future Demand for domestic amp Industrial sector(2025) (as per 2013)
2219 mcm
Stage of Groundwater Development 158
Chemical Quality of ground water Ground water in the area is alkaline and pHranges between 794 to 917 Groundwater in the area is fresh to marginal salineEC value of ground water show widevariations and ranges from 444 Scm to8653Scm at 250CRSC values vary from (ndash) 73 to 113 meqLarea is fit for irrigation
Ground water Contamination Issues Fluoride (mgl)Nathuwala (603) Killi(429)Nitrate (mgl)Sukhanwala (46) Sher Singhwala (65)Nathuwala (79) Chand Baja (79) Nangal(104) Tehna (118) Killi (140)Iron (mg)Devi wala (177)
Other issues Water level decline has been observed inmajor parts of the block due to indiscriminate development of ground waterresourcesIn shallow water level area lessdevelopment of ground water resourcecouple with recharge from canal irrigationis causing water logging and inland salinityproblems
Aquifer Mapping and Management Plan of Faridkot District Punjab State
Page | 47
Ground water Resource Enhancement Potential
Aquifer wise space available for recharge and proposed interventions (Supply Side Measures)
Aquifer-I
Volumes of unsaturated zone after 3m upto a desirable depth 10830 mcmSource water requirementavailability for recharge Rain Canal Irrigation return flowTypes and number of structures NAOther interventions proposed Artificial Recharge Roof top Rainwater harvesting will conserve484 mcm volume of water
Demand side interventions
Advanced Irrigation PracticesArea proposed to be covered Entire Block Faridkot (75210 sq km)Volume of Water expected to be conserved under advanced irrigation practices such as lining ofunderground pipelines (Kutcha channel) 12472 mcm
Required Change in cropping pattern
Proposed change in cropping pattern Paddy to Maize Soyabean The overexploitation can bemanaged at sustainable level (100) by changing the Paddy cropArea coverage 15 of the total paddy area needs to change ie7245 sq kmAnticipated volume of water to be saved 7245 mcm
Net AnnualGroundWater
Availability2013
(mcm)
TotalIrrigation Draft
(present)(mcm)
GrossDraft alluses(present)(mcm)
Paddyarea
(Sq km)
RequiredArea to
beChange
fromPaddy toMaize
soyabean
(Sq km)
Amountof
WaterSaved(mcm)
Grossdraftafter
savingof water(mcm)
PresentStage of
development ()
Reductionin Stage ofdevelopme
nt afterMaize
soya bean()
CropDiversifiedarea ()
34632 52861 54771 48300 7245 7245 45616 158 209 15
Alternate Water sourcesSurface water sources Tanks PondsLocation details and availability from such sources outside the area Not AvailableRegulation and Control
Punjab Subsoil Act for delay in paddy plantation should continue in the area
Aquifer Mapping and Management Plan of Faridkot District Punjab State
Page | 48
Other interventions proposed if anyModern Irrigation Practices be adopted for Rabi crops Some of the techniques are given in
the table below (PAU Ludhiana)
SlNo Techniques Water Saving()
Crops
1 Mulching 17 Wheat2 Bed Planting 18-25 Wheat3 Use of Sprinkler and drip
Irrigation70-90 Sugarcane Cotton Sunflower Maize
Other than that by 15 days ponding followed by 2 days of drying can lead to 25 saving of water inpaddy crop
Aquifer Mapping and Management Plan of Faridkot District Punjab State
Page | 49
II Salient Information of Kot Kapura Block
Block Area(in Km2)
66650 sq km
District State Faridkot PunjabPopulation Urban Population 373
Rural Population 221025Total population 221398
Rainfall Normal Monsoon 328 mmNon-monsoon Rainfall 61 mmAnnual Average Rainfall 370 mm
Agriculture and Irrigation Principal crops Wheat Cotton and PaddyGross cropped area 133427 sq kmNet sown area 67498 sq kmIrrigation practices Canal and Tube well IrrigationCropping intensity 198Area underGround water Irrigation 4278 sq kmSurface water irrigation 62899 sq kmNumber and types of abstraction structures 16639 Tubewells
Ground Water ResourceAvailability and Extraction
Ground water Resources AvailabilityTotal Ground Water Resources available is 2672 mcm (fresh andsaline water) up to the depth of 300 m The fresh water resourcesare estimated up to the depth of 106 m on the basis of geophysicalinterpretations The potential granular zones available for freshwater are 51 m Saline water resources are estimated on the basis ofwell (up to 300 m) and the granular zones are counted after depth of106 m and available zones are 76 m Block is categorized as Over-Exploited as per Dynamic Groundwater Resources 2013 assessment
Ground water Resources ExtractionDeeper aquifers are marginal to highly saline and not suitable forirrigation purpose as such all users are tapping shallow aquifersDrinking water supply wells of State Government tapping shallowaquifers Therefore the ground water draft could not be assessed fordeeper aquifer
Aquifer Mapping and Management Plan of Faridkot District Punjab State
Page | 50
Existing and future waterdemands
Existing Gross Ground water Draft as on 2013Irrigation 42020 mcmDomestic and industrial water supply 1402 mcmFuture water demandsIrrigation development potential (-)16709 mcmDomestic and industrial water supply up to 2025 years 1511 mcm
Water level behavior Aquifer wise water levelAquifer-IPre Monsoon 235 ndash 1600 m bglPost Monsoon 155 ndash 1820 m bglMean (10 yrs) 158 ndash (-)086 myrTrendsPre Monsoon 016 ndash (-)026 myrPost Monsoon 015 ndash (-)029 myrAquifer-II (156m)Pre Monsoon 772 m bglPost Monsoon 805 m bglAquifer-III (269m)Pre Monsoon NAPost Monsoon 820 m bgl
HYDROGRAPH SHOWING DECLINING WATER TABLE
Aquifer Mapping and Management Plan of Faridkot District Punjab State
Page | 51
HYDROGRAPH SHOWING DECLINING WATER TABLE
HYDROGRAPH SHOWING DECLINING WATER TABLE
Aquifer Mapping and Management Plan of Faridkot District Punjab State
Page | 52
Aquifer Disposition
Number of aquifers 1
Principal aquifer AlluviumMajor Aquifer Older Alluvium Aeolian Alluvium
Exploratory Data AvailabilitySource of Data No of exploration wells as per depth range (m) Total
lt100 100-200 200-300 gt300
CGWB 2 1 1 4 8WREDPSTCWSS 8 0 0 1 9PRIVATE 1 0 1 0 2TOTAL 11 1 2 5 19
Aquifer wise Characteristics (CGWB2015)AquiferGroup
Geology Type ofAquifer
ThicknessofGranularzones (m)
Transmi-ssivity(m2day)
Yield(m3day)
SpecificYield
Storativity
SingleAquiferSystem
QuaternaryAlluvialdeposits
Unconfinedto confined
127 547 -2990
3668 12 (0072) 72x10-4
Well field proposed in this block (Site Location Deviwala)The Aquifer comprises of fresh and saline water and the major aquifer material is sand Theaquiclude and aquitard comprises of clay clay with siltExploratory Data Validated
Source of Data No of exploration wells as per depth range (m) Totallt100 100-200 200-300 gt300
CGWB 0 0 1 4 5WREDPSTCWSS 0 0 0 1 1PRIVATE 0 0 1 0 1TOTAL 0 0 2 5 7
The data is validated by selecting the deepest well in each quadrant and used for preparation of3-D Litho models 2-D Geological Cross Sections Fence Diagrams and Aquifer Maps
Aquifer Mapping and Management Plan of Faridkot District Punjab State
Page | 53
3-D Lithological model of Kot Kapura Block
Lithological Cross section from Wara Daraka to Aulakh
Lithological Cross section from Nangal to Dal Singhwala
Aquifer Mapping and Management Plan of Faridkot District Punjab State
Page | 54
3-D Lithological Fence Diagram
3-D Aquifer Disposition Fence Diagram
Aquifer Mapping and Management Plan of Faridkot District Punjab State
Page | 54
3-D Lithological Fence Diagram
3-D Aquifer Disposition Fence Diagram
Aquifer Mapping and Management Plan of Faridkot District Punjab State
Page | 54
3-D Lithological Fence Diagram
3-D Aquifer Disposition Fence Diagram
Aquifer Mapping and Management Plan of Faridkot District Punjab State
Page | 55
Ground water Resource Extraction Contamination and other issues in Kot Kapura Block
Ground WaterResources upto thedepth of 300m
Dynamic Fresh waterresources
26821 mcm
In-storage Fresh waterresources
213062 mcm
In-storage Saline waterresources
27360 mcm
Total 267243 mcmGround WaterExtraction (as per 2013)
Irrigation 42020 mcm
Domestic amp Industrial 1402 mcm
Future Demand for domestic amp Industrial sector(2025) (as per 2013)
1511 mcm
Stage of Groundwater Development 162
Chemical Quality of ground water Ground water in the area is alkaline and pHranges between 820 to 893 Ground waterin the area is slightly fresh to marginalsaline EC value of the ground water showwide variations and ranges from 1154Scm to 3988 Scm at 250CRSC values are varies from -003 to 1100meqL and the area is fit for irrigation
Ground water Contamination Issues Fluoride (mgl)Kot Kapura (333) Dhilwan kalan (285)Moharewala ( 195) Bir Sikhanwala ( 184)Nitrate (mgl)Wara Daraka (66) Dhilwan Kalan (72)Moharewala (78) Bir sikhan wala (89)KotKapura (144)
Other issues Water level decline has been observed inmajor parts of the block due to indiscriminate development of ground waterresourcesIn shallow water level area lessdevelopment of ground water resourcecouple with recharge from canal irrigation iscausing water logging and inland salinityproblems
Aquifer Mapping and Management Plan of Faridkot District Punjab State
Page | 56
Ground water Resource Enhancement Potential
Aquifer wise space available for recharge and proposed interventions (Supply Side Measures)
Aquifer-I
Volume of unsaturated zone after 3m upto a desirable depth 14396 mcmSource water requirementavailability for recharge Rain Canal Irrigation return flowTypes and number of structures NAOther interventions proposed Artificial Recharge Roof top Rainwater harvesting will conserve475 mcm volume of water
Demand side interventions
Advanced Irrigation PracticesArea proposed to be covered Entire Kot Kapura Block (66650 sq km)Volume of Water expected to be conserved under advanced irrigation practices such as lining ofunderground pipelines (Kutcha channel) etc 9915 mcm
Required Change in cropping pattern
Proposed change in cropping pattern Rice to Maize Soyabean The overexploitation can bemanaged at sustainable level (100) by changing the Paddy cropArea coverage 12 of the total rice area needs to change ie 6264 sq kmAnticipated volume of water to be saved 6264 mcm
Net AnnualGroundWater
Availability2013
(mcm)
TotalIrrigation Draft
(present)(mcm)
GrossDraft alluses(present)(mcm)
Paddyarea
(Sq km)
RequiredArea to be
Changefrom
Paddy toMaize
soya bean(Sq km)
Amountof
WaterSaved(mcm)
Grossdraftafter
savingof water(mcm)
PresentStage of
development ()
Reductionin Stage ofdevelopme
nt afterMaize
soya bean()
CropDiversifiedarea ()
26821 42020 43421 52200 6264 6264 35756 162 234 12
Alternate Water sourcesSurface water sources Tanks PondsLocation details and availability from such sources outside the area Not AvailableRegulation and Control
Punjab Subsoil Act for delay in paddy plantation should continue in the area
Other interventions proposed if anyModern Irrigation Practices be adopted for Rabi crops Some of the techniques are given in
the table below (PAU Ludhiana)
Aquifer Mapping and Management Plan of Faridkot District Punjab State
Page | 57
SlNo Techniques Water Saving()
Crops
1 Mulching 17 Wheat2 Bed Planting 18-25 Wheat3 Use of Sprinkler and drip
Irrigation70-90 Sugarcane Cotton Sunflower Maize
Other than that by 15 days ponding followed by 2 days of drying can lead to 25 saving of water inpaddy crop
Aquifer Mapping and Management Plan of Faridkot District Punjab State
Page | 58
Annexure-I
Nd Not Determined BDL Below Detection Limit
Aquifer Mapping and Management Plan of Faridkot District Punjab State
Page | 59
Annexure-IIData Availability of Exploration Wells of Faridkot district
SlNo LOCATION LONGITUDE LATITUDE DEPTH ELEVATION BLOCK DEPARTMENT1 Dal Singhwala 74950 30469 300 211 Kot Kapura CGWB2 Dip Singh Wala 74483 30742 300 201 Faridkot CGWB3 Golewala 74692 30792 300 1995 Faridkot CGWB4 Jaito Mandi 74891 30446 300 203 Kot Kapura CGWB5 Kot Kapura 74814 30576 300 206 Kot Kapura CGWB6 Nanak Nagri 74893 30581 200 210 Kot Kapura PRIVATE7 Nangal 74869 30669 300 206 Faridkot CGWB8 Tehna 74790 30690 300 205 Faridkot CGWB9 Wara Daraka 74797 30548 300 205 Kot Kapura CGWB
10 Aulakh 74920 30643 300 211 Kot Kapura PSTC11 Bhagthala 74786 30777 300 198 Faridkot PSTC12 Sadhuwala 74559 30717 300 196 Faridkot PSTC13 Deviwala 74870 30612 269 207 Kot Kapura CGWB14 Deviwala-I 74870 30612 156 207 Kot Kapura CGWB15 Kouni 74675 30760 60 194 Faridkot WSS16 Ghugiana 74639 30746 60 198 Faridkot WSS17 Pahluwala 74763 30799 60 203 Faridkot WSS18 Faridkot 74763 30681 60 203 Faridkot WSS19 Doda Bhundar 75016 30470 121 212 Kot Kapura WRED20 Dhudi 74849 30700 60 207 Faridkot WSS21 Ratti Rori 74811 30647 60 208 Faridkot WSS22 Chak Kalyan 74705 30572 60 203 Kot Kapura WSS23 Kot Kapura 74812 30596 60 208 Kot Kapura WSS24 Behbal Kalan 74913 30531 60 210 Kot Kapura WSS25 Rorian Kapura 74815 30439 60 207 Kot Kapura WSS26 Panjgrain 74914 30608 70 211 Kot Kapura PRIVATE27 Fatehgarh 74943 30405 60 208 Kot Kapura WSS
28Bhurj JawarSingh 74987 30535 60 211 Kot Kapura WRED
29 Dewarana 74766 30593 30 206 Kot Kapura WRED30 Sher Singhwala 74628 30665 65 195 Faridkot CGWB31 Bir Sikhan wala 74849 30627 65 207 Kot Kapura CGWB32 Dohak 74603 30632 163 197 Muktsar CGWB33 Toot 74645 30829 217 196 Ghal khurd CGWB
Two exploratory wells from adjacent districts ie Dohak from Muktsar district and Toot fromFerozpur district have been incorporated for the preparation of lithological fence and crosssections
Aquifer Mapping and Management Plan of Faridkot District Punjab State
Page | 60
Annexure-IIILITHOLOGICAL DATA OF WELLS IN FARIDKOT DISTRICT
Well Location Depth from Depth to Lithology Thickness
Dal Singhwala
0 13 Clay 1313 20 Fresh Sand 720 28 Clay 828 57 Fresh Sand 2957 64 Clay 764 75 Saline Sand 1175 78 Clay 378 97 Saline Sand 1997 108 Clay 11
108 117 Saline Sand 9117 122 Clay 5122 134 Saline Sand 12134 157 Clay 23157 173 Saline Sand 16173 179 Clay 6179 184 Saline Sand 5184 211 Clay 27211 219 Saline Sand 8219 253 Clay 34253 259 Saline Sand 6259 278 Clay 19278 293 Saline Sand 15293 298 Clay 5298 300 Saline Sand 2
Dip Singh Wala
0 8 Fresh Sand 88 36 Clay 28
36 68 Fresh Sand 3268 755 Clay 75
755 805 Fresh Sand 5805 83 Clay 2583 92 Fresh Sand 992 93 Clay 193 109 Saline Sand 16
109 113 Clay 4113 116 Saline Sand 3116 120 Clay 4120 132 Saline Sand 12
Aquifer Mapping and Management Plan of Faridkot District Punjab State
Page | 61
Dip Singh Wala 132 146 Clay 14146 162 Saline Sand 16162 168 Clay 6168 192 Saline Sand 24192 195 Clay 3195 197 Saline Sand 2197 2015 Clay 45
2015 209 Saline Sand 75209 2135 Clay 45
2135 2175 Saline Sand 42175 221 Clay 35221 237 Saline Sand 16237 2865 Clay 495
2865 2895 Saline Sand 32895 293 Clay 35293 296 Saline Sand 3296 300 Clay 4
Golewala
0 75 Clay 7575 2885 Fresh Sand 2135
2885 40 Clay 111540 525 Fresh Sand 125
525 60 Clay 7560 88 Saline Sand 2888 93 Clay 593 103 Saline Sand 10
103 1325 Clay 2951325 1375 Saline Sand 51375 155 Clay 175155 1575 Saline Sand 25
1575 182 Clay 245182 2035 Saline Sand 215
2035 2285 Clay 252285 234 Saline Sand 55234 253 Clay 19253 2725 Saline Sand 195
2725 280 Clay 75280 2975 Saline Sand 175
2975 300 Clay 25Jaito Mandi 0 15 Clay 15
15 25 Fresh Sand 1025 28 Clay 3
Aquifer Mapping and Management Plan of Faridkot District Punjab State
Page | 62
Jaito Mandi 28 42 Fresh Sand 1442 46 Clay 446 59 Fresh Sand 1359 80 Clay 2180 915 Fresh Sand 115
915 103 Clay 115103 107 Fresh Sand 4107 1555 Clay 485
1555 1715 Fresh Sand 161715 191 Clay 195191 213 Saline Sand 22213 220 Clay 7220 223 Saline Sand 3223 238 Clay 15238 255 Saline Sand 17255 273 Clay 18273 2785 Saline Sand 55
2785 2805 Clay 22805 283 Saline Sand 25283 2985 Clay 155
2985 300 Saline Sand 15
Kot Kapura
0 14 Clay 1414 21 Fresh Sand 721 25 Clay 425 355 Fresh Sand 105
355 37 Clay 1537 50 Fresh Sand 1350 57 Clay 757 64 Fresh Sand 764 69 Clay 569 77 Fresh Sand 877 88 Clay 1188 99 Fresh Sand 1199 103 Clay 4
103 106 Saline Sand 3106 123 Clay 17123 1286 Saline Sand 56
1286 130 Clay 14130 1326 Saline Sand 26
1326 134 Clay 14134 1355 Saline Sand 15
Aquifer Mapping and Management Plan of Faridkot District Punjab State
Page | 63
Kot Kapura
1355 1492 Clay 1371492 1518 Saline Sand 261518 155 Clay 32155 1584 Saline Sand 34
1584 161 Clay 26161 1796 Saline Sand 186
1796 1812 Clay 161812 1838 Saline Sand 261838 1865 Clay 271865 2045 Saline Sand 182045 207 Clay 25207 2125 Saline Sand 55
2125 249 Clay 365249 2545 Saline Sand 55
2545 280 Clay 255280 2944 Saline Sand 144
2944 300 Clay 56
Nanak Nagri
0 136 Clay 136136 208 Fresh Sand 72208 265 Clay 57265 305 Fresh Sand 4305 34 Clay 3534 368 Fresh Sand 28
368 388 Clay 2388 40 Fresh Sand 1240 428 Clay 28
428 46 Fresh Sand 3246 695 Clay 235
695 712 Fresh Sand 17712 785 Clay 73785 815 Fresh Sand 3815 84 Clay 2584 87 Fresh Sand 387 92 Clay 592 936 Saline Sand 16
936 988 Clay 52988 100 Saline Sand 12100 1085 Clay 85
1085 1115 Saline Sand 31115 118 Clay 65118 120 Saline Sand 2
Aquifer Mapping and Management Plan of Faridkot District Punjab State
Page | 64
Nanak Nagri 120 128 Clay 8128 1296 Saline Sand 16
1296 130 Clay 04130 1316 Saline Sand 16
1316 135 Clay 34135 1368 Saline Sand 18
1368 165 Clay 282165 1676 Saline Sand 26
1676 184 Clay 164184 1868 Saline Sand 28
1868 1905 Clay 371905 1948 Saline Sand 431948 2134 Clay 186
Nangal
0 8 Clay 88 20 Fresh Sand 12
20 23 Clay 323 28 Fresh Sand 528 29 Clay 129 41 Fresh Sand 1241 72 Clay 3172 80 Fresh Sand 880 91 Clay 1191 124 Fresh Sand 33
124 151 Clay 27151 158 Fresh Sand 7158 163 Clay 5163 171 Fresh Sand 8171 181 Clay 10181 187 Fresh Sand 6187 193 Clay 6193 199 Fresh Sand 6199 203 Clay 4203 219 Fresh Sand 16219 224 Clay 5224 233 Saline Sand 9233 243 Clay 10243 249 Saline Sand 6249 251 Clay 2251 257 Saline Sand 6257 300 Clay 43
Tehna 0 8 Clay 8
Aquifer Mapping and Management Plan of Faridkot District Punjab State
Page | 65
Tehna
8 23 Fresh Sand 1523 28 Clay 528 32 Fresh Sand 432 37 Clay 537 41 Fresh Sand 441 59 Clay 1859 63 Fresh Sand 463 69 Clay 669 72 Fresh Sand 372 102 Clay 30
102 106 Fresh Sand 4106 120 Clay 14120 123 Fresh Sand 3123 133 Clay 10133 136 Fresh Sand 3136 145 Clay 9145 150 Fresh Sand 5150 158 Clay 8158 163 Fresh Sand 5163 168 Clay 5168 172 Fresh Sand 4172 176 Clay 4176 184 Fresh Sand 8184 210 Clay 26210 215 Fresh Sand 5215 221 Clay 6221 225 Fresh Sand 4225 254 Clay 29254 264 Fresh Sand 10264 267 Clay 3267 275 Fresh Sand 8275 294 Clay 19294 300 Fresh Sand 6
Wara Daraka
0 15 Clay 1515 22 Fresh Sand 722 28 Clay 628 48 Fresh Sand 2048 52 Clay 452 61 Fresh Sand 961 65 Clay 465 75 Fresh Sand 10
Aquifer Mapping and Management Plan of Faridkot District Punjab State
Page | 66
Wara Daraka
75 84 Clay 984 86 Saline Sand 286 91 Clay 591 97 Saline Sand 697 101 Clay 4
101 119 Saline Sand 18119 124 Clay 5124 129 Saline Sand 5129 150 Clay 21150 172 Saline Sand 22172 184 Clay 12184 188 Saline Sand 4188 196 Clay 8196 205 Saline Sand 9205 234 Clay 29234 239 Saline Sand 5239 274 Clay 35274 281 Saline Sand 7281 300 Clay 19
Aulakh
0 1829 Clay 18291829 4573 Fresh Sand 27444573 7621 Clay 30487621 9146 Fresh Sand 15259146 10975 Clay 1829
10975 1128 Saline Sand 3051128 13414 Clay 2134
13414 16768 Saline Sand 335416768 20112 Clay 334420112 21036 Saline Sand 92421036 21341 Clay 30521341 21951 Saline Sand 6121951 2256 Clay 6092256 245 Saline Sand 194245 300 Clay 55
Bhagthala
0 35 Clay 3535 1829 Fresh Sand 1479
1829 41 Clay 227141 53 Fresh Sand 1253 63 Clay 1063 8537 Saline Sand 2237
8537 92 Clay 663
Aquifer Mapping and Management Plan of Faridkot District Punjab State
Page | 67
92 102 Saline Sand 10102 1311 Clay 291
1311 13415 Saline Sand 30513415 16768 Clay 335316768 17073 Saline Sand 30517073 185 Clay 1427
185 203 Saline Sand 18203 22866 Clay 2566
22866 23476 Saline Sand 6123476 253 Clay 1824
253 273 Saline Sand 20273 280 Clay 7280 294 Saline Sand 14294 300 Clay 6
Sadhuwala
0 61 Fresh Sand 6161 3049 Clay 2439
3049 52 Saline Sand 215152 625 Clay 105
625 725 Saline Sand 10725 77 Clay 4577 84 Saline Sand 784 91 Clay 791 107 Saline Sand 16
107 110 Clay 3110 114 Saline Sand 4114 118 Clay 4118 130 Saline Sand 12130 14339 Clay 1339
14339 16463 Saline Sand 212416463 17683 Clay 12217683 207 Saline Sand 3017
207 2115 Clay 452115 2155 Saline Sand 42155 219 Clay 35219 235 Saline Sand 16235 237 Clay 2237 25624 Saline Sand 1924
25624 27134 Clay 15127134 300 Saline Sand 2866
Deviwala0 15 Clay 15
15 23 Fresh Sand 8
Aquifer Mapping and Management Plan of Faridkot District Punjab State
Page | 68
Deviwala
23 38 Clay 1538 46 Fresh Sand 846 48 Clay 248 53 Fresh Sand 553 61 Clay 861 65 Fresh Sand 465 72 Clay 772 78 Fresh Sand 678 94 Clay 1694 106 Fresh Sand 12
106 109 Clay 3109 112 Saline Sand 3112 128 Clay 16128 140 Saline Sand 12140 158 Clay 18158 163 Saline Sand 5163 179 Clay 16179 183 Saline Sand 4183 187 Clay 4187 196 Saline Sand 9196 202 Clay 6202 213 Saline Sand 11213 218 Clay 5218 223 Saline Sand 5223 252 Clay 29252 258 Saline Sand 6258 263 Clay 5263 269 Saline Sand 6
Dohak
0 8 Clay 88 10 Fresh Sand 2
10 21 Clay 1121 33 Saline Sand 1233 41 Clay 841 79 Saline Sand 3879 89 Clay 1089 95 Saline Sand 695 99 Clay 499 112 Saline Sand 13
112 116 Clay 4116 139 Saline Sand 23139 154 Clay 15
Aquifer Mapping and Management Plan of Faridkot District Punjab State
Page | 69
154 163 Saline Sand 9
Toot
0 15 Clay 1515 198 Fresh Sand 48
198 21 Clay 1221 474 Fresh Sand 264
474 51 Clay 3651 552 Fresh Sand 42
552 626 Clay 74626 766 Fresh Sand 14766 101 Clay 244101 104 Fresh Sand 3104 113 Clay 9113 116 Fresh Sand 3116 143 Clay 27143 146 Saline Sand 3146 167 Clay 21167 170 Saline Sand 3170 182 Clay 12182 204 Saline Sand 22204 214 Clay 10214 217 Saline Sand 3
Aquifer Mapping and Management Plan of Faridkot District Punjab State
Page | 70
Annexure-IVAQUIFER GROUPING OF WELL LOCATIONS IN FARIDKOT DISTRICT
Well location Depth from Depth to Aquifer Thickness FreshGranular
Zones
SalineGranular
Zones
Dal Singhwala
0 15 Unsaturated Zone 15 215 57 Aquifer Group-IA 42 3457 64 Aquiclude-IA 764 134 Aquifer Group-IB 70 51
134 157 Aquiclude-IB 23157 300 Multiple Aquifers 143 52
Dip Singh Wala
0 5 Unsaturated Zone 5 55 68 Aquifer Group-IA 63 35
68 755 Aquiclude-IA 75755 132 Aquifer Group-IB 565 14 31132 146 Aquiclude-IB 14146 300 Multiple Aquifers 154 755
Golewala
0 4 Unsaturated Zone 4 14 525 Aquifer Group-IA 485 33
525 60 Aquiclude-IA 7560 103 Aquifer Group-IB 43 38
103 155 Aquiclude-IB 52155 300 Multiple Aquifers 145 665
Jaito Mandi
0 14 Unsaturated Zone 14 114 59 Aquifer Group-IA 45 3759 80 Aquiclude-IA 2180 107 Aquifer Group-IB 27 155
107 1555 Aquiclude-IB 4851555 300 Multiple Aquifers 1445 16 515
Kot Kapura
0 9 Unsaturated Zone 9 29 77 Aquifer Group-IA 68 455
77 88 Aquiclude-IA 1188 106 Aquifer Group-IB 18 11 3
106 155 Aquiclude-IB 49155 300 Multiple Aquifers 145 68
Nanak Nagri
0 12 Unsaturated Zone 12 112 46 Aquifer Group-IA 34 18446 69 Aquiclude-IA 2369 131 Aquifer Group-IB 62 77 11
131 165 Aquiclude-IB 34165 2134 Multiple Aquifers 484 97
Nangal 0 9 Unsaturated Zone 9 1
Aquifer Mapping and Management Plan of Faridkot District Punjab State
Page | 71
Nangal
9 41 Aquifer Group-IA 32 2941 72 Aquiclude-IA 3172 124 Aquifer Group-IB 52 41
124 151 Aquiclude-IB 27151 300 Multiple Aquifers 149 43 21
Tehna
0 10 Unsaturated Zone 10 210 41 Aquifer Group-IA 31 18741 59 Aquiclude-IA 1859 106 Aquifer Group-IB 47 33
106 158 Aquiclude-IB 52158 300 Multiple Aquifers 142 50
Wara Daraka
0 4 Unsaturated Zone 4 04 75 Aquifer Group-IA 71 46
75 84 Aquiclude-IA 984 129 Aquifer Group-IB 45 31
129 150 Aquiclude-IB 21150 300 Multiple Aquifers 150 47
Aulakh
0 17 Unsaturated Zone 17 217 46 Aquifer Group-IA 29 2646 76 Aquiclude-IA 3076 113 Aquifer Group-IB 37 1525 305
113 134 Aquiclude-IB 21134 300 Multiple Aquifers 166 6828
Bhagthala
0 4 Unsaturated Zone 4 14 53 Aquifer Group-IA 49 24
53 63 Aquiclude-IA 1063 102 Aquifer Group-IB 39 3237
102 168 Aquiclude-IB 66168 300 Multiple Aquifers 132 6115
Sadhuwala
0 5 Unsaturated Zone 5 55 52 Aquifer Group-IA 47 2151
52 63 Aquiclude-IA 1163 130 Aquifer Group-IB 67 49
130 144 Aquiclude-IB 14144 300 Multiple Aquifers 156 11931
Deviwala
0 8 Unsaturated Zone 8 28 78 Aquifer Group-IA 70 31
78 94 Aquiclude-IA 1694 112 Aquifer Group-IB 18 12 3
112 128 Aquiclude-IB 16128 269 Multiple Aquifers 141 58
Aquifer Mapping and Management Plan of Faridkot District Punjab State
Page | 72
Dohak
0 3 Unsaturated Zone 3 03 79 Aquifer Group-IA 76 2 50
79 89 Aquiclude-IA 1089 139 Aquifer Group-IB 50 42
139 154 Aquiclude-IB 15154 163 Multiple Aquifers 9 9
Toot
0 9 Unsaturated Zone 9 19 55 Aquifer Group-IA 46 354
55 63 Aquiclude-IA 863 116 Aquifer Group-IB 53 25
116 143 Aquiclude-IB 27143 217 Multiple Aquifers 74 31
- कदरीय भमि जल बोरड
-
- जल ससाधन नदी विकास और गगा सरकषण मतरालय
- भारत सरकार
-
- contents naquim faridkotpdf (p1-5)
- Final Faridkot edited 170317pdf (p6-77)
-

Aquifer Mapping and Management Plan of Faridkot District Punjab State
Page | 9
20 DATA COLLECTION AND GENERATION
21 Geology and Hydrogeological dataThe area lies in the central part of Satluj basin of Indo-Gangetic Alluvial plain
Geologically the area is occupied by a thick sequence of Quaternary deposits of Mid-Pleistoceneto Recent age These comprise alternate sequence of fluvial and arid phases The exposedQuaternary Sediments can be broadly classifies as- (i) Older Alluvium of Middle to UpperPleistocene age overlain by (ii) Aeolian deposits of Holocene age The provenance of OlderAlluvium deposited by rivers originated from Himalayas and Aeolian deposits have been laiddown by wind action from Thar Desert of Rajasthan in the southwest part of the area Thegeneralized stratigraphic sequence of the area are given belowGeneralized Stratigraphy Faridkot District (After Garg amp Singh 1993)Age Lithological Unit Lithological Characteristics
Holocene Aeolian Flat Unconsolidated thin veneer of Aeolian sand
Newer Dunes Unconsolidated orange brown sand and silt
Semi consolidated dunes Semi consolidated light to dark brown sand
Older dune Dark brown Aeolian sand and silt withsome vegetal matter
Mid to UpperPleistocene
Older Alluvium Multi-cyclic light grey to brown fine tomedium grained mixture of clay silt andsand with Kankar Light grey to pink stickyclay grayish mica sand with kankar
-----Basement not exposed----
The Principle Aquifer in the study area is Alluvium and the Major Aquifers are OlderAlluvium and Aeolian Alluvium (Fig5) The Ground water occurs in unconfined (water table) andconfined conditions
211 Water Level BehaviorTwenty three monitoring stations of Central Ground Water Board (CGWB) (7
Piezometers and 16 Dugwells) and Eighteen monitoring stations (18 Piezometers) of StateGovernment represent the first aquifer Second and third aquifer is represented by onemonitoring station of CGWB Depth to water level in the area ranges from 145 to 1819 m bglduring pre-monsoon period (Fig6) and 120 to 2015 m bgl during post monsoon period (Fig7)In eastern part water levels are in the range of 10 to 20 m in central part the water levels are inthe range of 5 to 10 m bgl and in western part the water levels are shallower in the range of 2to 5 m Seasonal water level fluctuation shows a rise and fall in the range of 110 to (-) 200 m inwestern and eastern part of the districts respectively during year 2015
Aquifer Mapping and Management Plan of Faridkot District Punjab State
Page | 10
Hydrograph of Different Observation Wells
Fig5 Major Aquifers
Aquifer Mapping and Management Plan of Faridkot District Punjab State
Page | 11
Fig6 Depth to Water level Pre Monsoon 2015
Aquifer Mapping and Management Plan of Faridkot District Punjab State
Page | 12
Fig7 Depth to Water level Post Monsoon 2015
Aquifer Mapping and Management Plan of Faridkot District Punjab State
Page | 13
22 Water Quality DataGround water quality of shallow aquifer (Aquifer-I) is assessed on the basis of chemical
data of National Hydrograph Network stations ie NHNS monitored during Pre monsoonperiod Twenty four groundwater samples are collected during NHNS 2015 and chemicalanalysis is given in Annexure-I The chemical quality of deeper aquifers has to be assessedduring ongoing groundwater exploration programme under NAQUIM
Chemical data of shallow aquifer indicates that ground water is alkaline in nature TheElectrical Conductivity (EC) values ranges from 444 to 8653 microScm at 25oC indicating fresh tomoderately saline The EC values less than 1000 microScm at 25oC have observed at four locationsie Jand Sahib (444) Devi wala (476) Mehmuana (550) and Arianwala (700) respectively TheEC values more than 3000 microScm at 25oC have observed at six locations ie Tehna (8653) BajaKhana (3988) Nangal (3487) Kot Kapura (3299) Mumara (3212) and Sukhanwala (3126) Theground water occurring in the central and south-eastern parts are marginally to highly salineand not suitable for drinking purposes
The chloride concentration in ground water varies broadly between 28 mgl atAriyanwala and also 1544 mgl at Tehna Ground water with fluoride above 15 mgL are foundmainly in Nathuwala (603) Killi (429 ) Kot Kapura (333) Dhilwan kalan (285) Moharewala(195) and Bir Sikhanwala (184) and Nitrate concentration in groundwater above permissiblelimit 15 mgl are found in Kot kapura (144) Killi (140) Dal Singhwala (136)Tehna (118)Nangal (104) Bir Sikhan wala (89) Nathuwala (79) Chand baja (79 ) Wara Daraka (66) Shersinghwala (65) and Sukhanwala(46) The USSL diagrams used for classification of irrigationwater based on EC and SAR shown below observed that ground water occurring in Faridkotdistrict falls under C4S3 C2S1 C4S4 C3S1 C3S3 and C3S2 classes of irrigation classification
Aquifer Mapping and Management Plan of Faridkot District Punjab State
Page | 14
Such waters when used continuously for irrigation they are likely to cause salinityhazards and lead to reduction in crop yields Plot of USSL diagram indicates that ground watersfall under C2S1 and C3S1 classes of irrigation rating
Analysing mechanism and equipments used for chemical analysis are given in table-1Table-1 Analytical methods and equipments used for chemical analysis
S No Parameters Analytical Methods
A Physico-chemical analysis
pHConductivity (EC)Carbonate amp bicarbonate (CO3HCO3)Chloride (Cl)Sulphate (SO4)Nitrate (NO3)Fluoride (F)Total hardness (TH)Calcium (Ca)Magnesium (Mg)Sodium (Na)Potassium (K)Total Dissolved Solids (TDS)
Electrometric methodElectrical conductivity methodTitrimetric methodArgenotometric methodNephloturbidity method
Spectro-photometric methodIon metric methodEDTA-Titri metric methodEDTA-Titri metric methodBy differenceFlame photometric methodFlame photometric methodGravimetric
B Trace elementsHeavy metals
Copper (Cu)Cadmium (Cd)Chromium (Cr)Lead (Pb)Manganese (Mn)Nickel (Ni)Cyanide (Cn)
Iron (Fe)
Digestion followed by AtomicAbsorption Spectrophotometer
(AAS)
Spectrophotometer method
Aquifer Mapping and Management Plan of Faridkot District Punjab State
Page | 15
Fig8 Hill-Piper diagram for Groundwater Quality of Shallow Aquifer of Faridkot District
Aquifer Mapping and Management Plan of Faridkot District Punjab State
Page | 16
Fig8 Groundwater Quality 2015
Aquifer Mapping and Management Plan of Faridkot District Punjab State
Page | 17
23 Geophysical data
To delineate fresh water - saline water interface laterally as well as vertically surfacegeophysical investigations have been carried out in alluvial tracts over parts of the study areaUnder surface geophysical investigations total 44 VES (Fig9) in an area of 1800 sq km wereconducted with current electrical separation of 600 to 1000 m
Fig9 VES Locations in Faridkot District
Aquifer Mapping and Management Plan of Faridkot District Punjab State
Page | 17
23 Geophysical data
To delineate fresh water - saline water interface laterally as well as vertically surfacegeophysical investigations have been carried out in alluvial tracts over parts of the study areaUnder surface geophysical investigations total 44 VES (Fig9) in an area of 1800 sq km wereconducted with current electrical separation of 600 to 1000 m
Fig9 VES Locations in Faridkot District
Aquifer Mapping and Management Plan of Faridkot District Punjab State
Page | 17
23 Geophysical data
To delineate fresh water - saline water interface laterally as well as vertically surfacegeophysical investigations have been carried out in alluvial tracts over parts of the study areaUnder surface geophysical investigations total 44 VES (Fig9) in an area of 1800 sq km wereconducted with current electrical separation of 600 to 1000 m
Fig9 VES Locations in Faridkot District
Aquifer Mapping and Management Plan of Faridkot District Punjab State
Page | 18
Subsurface geophysical investigations include borehole logging The ground waterquality data pertaining to the CGWB exploratory boreholes indicate vertical and lateralvariation in EC values Shallow ground water quality data shows clearly the existence of salinityat shallow depth in the many parts of study area such as Pakka Mahmuana ShirinwalaShersinghwala Dohak Kamiyana Kingra and many other places Electrical conductivity (EC) ofground water is more than 2000 microS cm in major part of the area except at few places Slightimprovement in quality of ground water at deeper depth as compared to shallow depth hasbeen observed at few places These places are Chuggewala Golewalla Nangal Deepsinghwalawhere EC of ground water was found to be within 2000 microS cm within the depth range of 80 to120 m
24 Exploratory drilling State - Data AvailabilityThe Lithologs of Exploratory Well Observation well Piezometer productive wells of
CGWB Punjab State Tubewell Corporation (PSTC) now as Punjab Water ResourcesDevelopment and Management (PWRDM) WRED ( Water Resources and EnvironmentDirectorate) Water Supply and Sanitation (WSS) and Private Wells have been collected andthose supported electrical logs have been validated for aquifer map preparation The details areshown in Table-1
Table-1 Data Availability of Exploration Wells of Faridkot district
SlNo Source of data Depth Range (m) Totallt 100 100-200 200-300 gt300
1 CGWB 2 1 1 8 122 WREDPSTCWSS 15 1 0 3 193 PRIVATE WELLS 1 0 1 0 2Total 18 2 2 11 33
25 Spatial Data DistributionThe actual data of all the wells in the area are plotted on the map of 150000 scale with
5rsquoX5rsquogrid (9 x 9) km (Fig 10) Perusal of table shows that majority of tube wells falls in theshallow aquifer having depth less than 100m and deeper aquifer having depth more than 300mThe grids formations devoid of groundwater exploration are identified as data gaps and theseare to be filled by data generation The Physical record of the availability of exploration data aregiven in Annexure-II
Aquifer Mapping and Management Plan of Faridkot District Punjab State
Page | 19
Fig10 Locations of Exploration Data Availability
Aquifer Mapping and Management Plan of Faridkot District Punjab State
Page | 20
30 DATA INTERPRETATION INTEGRATION AND AQUIFER MAPPINGAll the available data have been validated to generate aquifer map The deepest well in
each quadrant is selected and plotted on the map of 150000 scale with 5rsquoX5rsquogrid (9 x 9) km(Fig11)
Fig11 Locations of validated exploration data
The optimized wells of CGWB PWRDM WRED WSS and Private Wells have been usedto prepare the elevation or collar elevation map to identify the topographic variations onground surface so that it can give the synoptic picture of gradient variations in the water levels
Aquifer Mapping and Management Plan of Faridkot District Punjab State
Page | 21
The topographic elevation values have been plotted to prepare the elevation contour map(Fig12) The locations of validated wells in quadrant and toposheet wise distributions inrespective blocks are given in Table-2 Locations of validated exploratory wells with litholog areshown in Fig13
Fig12 Elevation contour map
Fig13 Locations of validated exploratory wells with Litholog
Aquifer Mapping and Management Plan of Faridkot District Punjab State
Page | 22
Table -2 Summary of optimized exploration wells
Block ToposheetQuadrant Depth Range (m) Elevation(m amsl)
Source ofdata
Location lt 100 100-200 200-300 gt300Faridkot 1A 44J06 Dip Singh Wala - - - 350 201 CGWBFaridkot 3C 44J09 Golewala - - - 34378 1995 CGWBFaridkot 1A 44J14 Tehna - - - 300 205 CGWBFaridkot 3A 44J14 Bhagthala - - - 37195 198 PSTCFaridkot 1A 44J10 Sadhuwala - - - 35970 196 PSTCKot Kapura 1C 44J15 Dal Singhwala - - - 300 211 CGWBKot Kapura 1B 44J15 Jaito Mandi - - - 41920 203 CGWBKot Kapura 2A 44J14 Kot Kapura - - - 42190 206 CGWBKot Kapura 3B 44J14 Nanak Nagri - - 2134 - 210 PRIVATEKot Kapura 1B 44J14 Nangal - - - 300 206 CGWBKot Kapura 3A 44J14 Wara Daraka - - - 300 205 CGWBKot Kapura 2C 44J14 Aulakh - - - 38414 211 PSTCKot Kapura 2B 44J14 Deviwala - - 269 - 207 CGWBMuktsar 2B 44J10 Dohak - 163 - - 197 CGWBGhal khurd 3B 44J09 Toot - - 217 - 196 CGWB
Two exploratory wells from adjacent districts ie Dohak from Muktsar district and Toot from Ferozpur district have beenincorporated for the preparation of lithological fence and cross sections
Aquifer Mapping and Management Plan of Faridkot District Punjab State
Page | 23
31 Sub Surface Disposition311 Previous Work
To delineate and determine the potential aquifer zones evaluation of aquifercharacteristics etc Exploratory drilling was conducted by CGWB at 6 locations in the districtincludes 05 exploratory wells and 1 slim hole between 1975 to 2008 through in-house activitiesand 02 exploratory wells and 2 piezometers through outsourced by Ms WAPCOS Ltd between2011 to 2015 (Fig10) The drilling has been carried out to a maximum depth of about 408 m(Kot Kapura) and revealed the presence of 6 to 12 prominent permeable granular zones withaggregate thickness varying from 28 to 283 m The granular zone consists of fine to mediumsand The slim hole at Golewala and exploratory well at Kot Kapura have abandoned due topoor quality of formation water upto depth of 350m bgl
Further the study of exploratory boreholes drilled in the district revealed the presence ofmultiple aquifer groups up to the maximum drilled depth of 408 m The first aquifer group formsvery shallow water table aquifer (IA) and occurs down to 57 m Below that clay layer starts gettingthickened to about 8-10m separating Aquifer IB down to 120 m The below multi aquifers behavesas semi-confined to confined and consisting of thin sand layers alternating with thicker clay layersOverall flow of ground water is towards south-west direction Further the study of exploratoryboreholes drilled in the area revealed that the area is considered as a single aquifer system up tothe maximum depth of 300 m
312 Present NAQUIM StudyTo understand the sub surface disposition in the study area geological sections and
fence diagram have been prepared by synthesizing the various sub-surface sections on the basisof study of the lithological logs and electrical logs of boreholes drilled by CGWB WRED PSTCand Private Agencies using the RockWorks15 software and a 3D lithological model has beenprepared (Fig14) The 2D lithology sections and 3D lithological fence diagram has beenprepared using lithology model and are shown in Fig15a b amp 16 respectively The aquifers arecomposed of fine to medium sand with clay intercalations The granular zones are extensiveThe aquifer occurring below 252m depth are composed of very fine to medium sand with silt
Based on geophysical borehole logging and use of resistivity profiling followed by thedepth soundings at few selected places fresh-saline water zones are demarcated This analysisis extremely important for the present study and will be referred from time to time as it isobviously the higher resistivity beds represents freshwater zone in contrast in low resistive bedsindicating saline groundwater zoneFig14 3-Dimension Lithological Model
Aquifer Mapping and Management Plan of Faridkot District Punjab State
Page | 24
The major aquifer system of the area is Quaternary alluvial deposits having Older and Aeolianalluvium which mainly comprises of sand silt and clay The top surface layer is mainly silty clayThe lithology along W-E direction shows the variation in lithological thickness ie thin clay layersinter bedded with sand except at Nangal where thick clay layers were identified at 55 m bglThere is inter-layering of sand and clay with thick clay at Golewala and Bhagthala towardswestern side at a depth between 150m to 210m bgl There is thick a inter-layering of sand andclay towards all lithologs except Nanak Nagri shows thin sequence of sand and clay towards SWLithological data of wells are given in Annexure-III
Fig15ab 2-Dimension Lithological Sections
SWE
Aquifer Mapping and Management Plan of Faridkot District Punjab State
Page | 25
Fig16 3-Dimension Lithological Fence
Aquifer Mapping and Management Plan of Faridkot District Punjab State
Page | 26
32 Aquifer Geometry
The aquifer group embodies a number of granular layers alternating with clay lenses Afew clay layers intervening these aquifer groups pinch out against the sand zones at few placesThe marker horizons are traced all over the area by connecting their tops and bottoms Sandyclay layer occurs at the surface covering the unconfined aquifer which is in turn underlain byprominent clay zone It is composed of mainly of medium sand with thin beds of fine sand
Aquifer IA (Very Shallow Aquifer) extends maximum upto 70 m of depth and below thatclay layer starts getting thickened about 10-12m separating Aquifer IB to a maximum depth of123 m Multi layer aquifers are existing in the area each aquifer is separated by thick clay zonesof 25 to 40 m upto 300m depth (Annexure IV) Based on the same criteria to know the broadpicture of the aquifer disposition inter-relationship of granular zones nature geometry andextension of aquifers in the study area the aquifer grouping has been carried out using the sub-surface lithology and a 3-Dimensional aquifer model (Fig17) and aquifer disposition 3D fencediagram has also been prepared using the aquifer model (Fig18) Various groups identified inthe area are given in Table-3 It is very difficult to differentiate the aquifer groups after AquiferGroup I so the whole lithology is considered to be a single aquifer group system The firstaquifer is water table aquifer and extends all over the area The aquifer is mainly composed offine to coarse grained sand
Table-3 Aquifer Grouping in Faridkot DistrictAquifer Group Range Thickness
From To Min Max
Aquifer IA 4 70 29 50
Aquifer IB 64 123 21 52
Multiple Aquifers 133 300 21 85
Fig17 3D Aquifer Disposition Model
Aquifer Mapping and Management Plan of Faridkot District Punjab State
Page | 27
Fig18 3D Aquifer Disposition Fence
Aquifer Mapping and Management Plan of Faridkot District Punjab State
Page | 28
40 GROUND WATER RESOURCESGround water resource estimation of the area have been carried out by taking Dynamic
and In-storage resources of unconfined aquifer and confined aquifer present upto 300m depthThe assessment of dynamic ground water Resources of the study area have been carried outjointly by CGWB and Water Resources and Environment Directorate (WRED) Department ofIrrigation Punjab on the basis of Ground Water Estimation Committee (1997) methodology
The occurrence of potential aquifers (productive granular zones) upto 300 m depth hasbeen demarcated on basis of aquifer wise subsurface mapping The total saturated thickness ofgranular zones was derived from the exploratory borehole data of a particular block Thegranular zones occurring below the zone of water level fluctuation up to the first confining layerhas been considered as static unconfined zone The specific yield value for the unconfinedaquifer has been taken as 60 of 012 which comes as 0072 whereas for the confined aquiferthe storativity value has been considered Since the specific yield is likely to reduce withincrease in depth due to compaction of overlying sediments
Hence the major data elements considered in this estimation are thickness of granularzones specific yieldstorativity and area of both fresh water and salinebrackish water It hasbeen observed that in some of the blocks sufficient data on probable occurrence of granularzones was not available In those cases the existing exploratory data of adjoining blockdistricthas been either extrapolated or interpolated to derive such parameters required for estimationThis assessment of total groundwater resources has been computed based on the availabledata with CGWB amp WRED Department of Irrigation and Punjab
41 Groundwater Resources up to depth of 300ma Dynamic Resources
Block-wise ground water resource potential of the district has been assessed as perGEC-97 as on 31st March 2013 The primary source of recharge in the area is the rainfall Theground water development in all the blocks has exceeded the available recharge thus all theblocks have been categorized as over exploited The overall stage of ground water developmentin the Faridkot district has been assessed to be 160 The block wise details are given in belowTable-4
Table 4 Dynamic Ground Water Resource amp Development Potential (31032013) in mcmAssessmentUnit Block
NetAnnualGroundWater
Availability
ExistingGross
GroundWater Draft
forirrigation
ExistingGross GroundWater Draftfor domestic
andindustrial
water supply
ExistingGross
GroundWater
Draft forAll uses(11+12)
Provision fordomestic
andindustrial
requirementsupply to
2025
Net GroundWater
Availabilityfor futureirrigation
development(10-11-14)
Stage ofGroundWater
Development(1310)
100()
Category
Faridkot 34632 52861 1911 54771 2219 -20448 158Over
Exploited
Kot Kapura 26821 42020 1402 43421 1511 -16709 162Over
Exploited
TOTAL 61453 94880 3313 98193 3730 -37157 160Over
Exploited
Aquifer Mapping and Management Plan of Faridkot District Punjab State
Page | 29
b In-storage Ground Water ResourcesAs per revised guidelines recommended by the Central Level Expert Group on
groundwater resources assessment the resources are separately considered as dynamic and in-storage unconfined In case of alluvial area in-storage resources of unconfined aquifer havebeen computed on the basis of specific yield of aquifer as detailed below
In-storageGround Water
resources(Unconfined
Aquifer)
=
Thickness of the aquifer(granularproductive zone)
below the zone of water levelfluctuation down to the bottom
layer of unconfined aquifer
x Sp Yield ofthe aquifer
x Areal extentof the
aquifer
The dynamic and in-storage ground water resource estimations have been calculated forsingle aquifer group upto 300m of each block of Faridkot district In-storage ground waterresources are estimated for fresh water and saline water resources based on the geophysicalinterpretations of depth to fresh and saline water interface for each block The fresh and salinecalculations are made on the basis of the assumptions on aquifer that is considered asunconfined aquifer so that the specific yield concept is used for resources estimations (Fig19)The detailed resources estimations are calculated in detailed table for fresh and saline waterresources in the below Table-5 6amp 7
Total Availability of Ground Water Resources = Dynamic Resources + In-storage Resources
Fig19 Conceptual figure to understand the fresh and saline water resources in the aquifer up to300 m for Resource Estimation in Unconfined and Confined Aquifer System
(The clay lenses are more dominant in the aquifer and sometimes huge thickness of clay depositsare also observed in the lithologs)
Aquifer Mapping and Management Plan of Faridkot District Punjab State
Page | 29
b In-storage Ground Water ResourcesAs per revised guidelines recommended by the Central Level Expert Group on
groundwater resources assessment the resources are separately considered as dynamic and in-storage unconfined In case of alluvial area in-storage resources of unconfined aquifer havebeen computed on the basis of specific yield of aquifer as detailed below
In-storageGround Water
resources(Unconfined
Aquifer)
=
Thickness of the aquifer(granularproductive zone)
below the zone of water levelfluctuation down to the bottom
layer of unconfined aquifer
x Sp Yield ofthe aquifer
x Areal extentof the
aquifer
The dynamic and in-storage ground water resource estimations have been calculated forsingle aquifer group upto 300m of each block of Faridkot district In-storage ground waterresources are estimated for fresh water and saline water resources based on the geophysicalinterpretations of depth to fresh and saline water interface for each block The fresh and salinecalculations are made on the basis of the assumptions on aquifer that is considered asunconfined aquifer so that the specific yield concept is used for resources estimations (Fig19)The detailed resources estimations are calculated in detailed table for fresh and saline waterresources in the below Table-5 6amp 7
Total Availability of Ground Water Resources = Dynamic Resources + In-storage Resources
Fig19 Conceptual figure to understand the fresh and saline water resources in the aquifer up to300 m for Resource Estimation in Unconfined and Confined Aquifer System
(The clay lenses are more dominant in the aquifer and sometimes huge thickness of clay depositsare also observed in the lithologs)
Aquifer Mapping and Management Plan of Faridkot District Punjab State
Page | 29
b In-storage Ground Water ResourcesAs per revised guidelines recommended by the Central Level Expert Group on
groundwater resources assessment the resources are separately considered as dynamic and in-storage unconfined In case of alluvial area in-storage resources of unconfined aquifer havebeen computed on the basis of specific yield of aquifer as detailed below
In-storageGround Water
resources(Unconfined
Aquifer)
=
Thickness of the aquifer(granularproductive zone)
below the zone of water levelfluctuation down to the bottom
layer of unconfined aquifer
x Sp Yield ofthe aquifer
x Areal extentof the
aquifer
The dynamic and in-storage ground water resource estimations have been calculated forsingle aquifer group upto 300m of each block of Faridkot district In-storage ground waterresources are estimated for fresh water and saline water resources based on the geophysicalinterpretations of depth to fresh and saline water interface for each block The fresh and salinecalculations are made on the basis of the assumptions on aquifer that is considered asunconfined aquifer so that the specific yield concept is used for resources estimations (Fig19)The detailed resources estimations are calculated in detailed table for fresh and saline waterresources in the below Table-5 6amp 7
Total Availability of Ground Water Resources = Dynamic Resources + In-storage Resources
Fig19 Conceptual figure to understand the fresh and saline water resources in the aquifer up to300 m for Resource Estimation in Unconfined and Confined Aquifer System
(The clay lenses are more dominant in the aquifer and sometimes huge thickness of clay depositsare also observed in the lithologs)
Aquifer Mapping and Management Plan of Faridkot District Punjab State
Page | 30
Table-5 Block wise In-Storage Ground Water Resources of Fresh Water Aquifer
GENERAL DESCRIPTION OF THE GROUND WATER ASSESSMENT UNIT OF DISTRICT FARIDKOT PUNJAB STATE (2013)
Type of Ground Water Assessment Unit (Block) Faridkot Blocks
SrNo
Name ofAssessment
Unit
Type offormation
Areal extent (sq km) AveragePre-
monsoonWaterLevel
(m bgl)
Depth tobottom of
Aquiferbased on
Geophysical Interface
amp Boreholelogging(m bgl)
TotalThickness
offormation
belowPre-
monsoonWaterLevel(m)
(7-6)
Totalthickness
of theGranularZones up
to thedepth of
FreshWaterZones
(m)
Thicknessof the
unsaturated
granularZones up
to Pre-monsoon
WL(m)
Thicknessof the
saturatedgranularZones up
to thedepth of
Freshwater
aquiferbelow (m)
(9-10)
AverageSpecific
Yield
In-StorageGroundWater
Resourcesup to thedepth of
FreshWater
Aquifer(ham)
51112
TotalGeographical Area
AssessmentArea
FreshWater
1 2 3 4 5 6 7 8 9 10 11 12 13
1 Faridkot Alluvium 75210 36710 450 152 1475 72 2 69 0072 182375
2
KotKapura Alluvium 66650 61650 1069 106 9531 51 3 48 0072 213062Dist Total (ham) 141860 228406 395438Dist Total (mcm) 3954
ham hectare metremcm million cubic metre
Aquifer Mapping and Management Plan of Faridkot District Punjab State
Page | 31
Table-6 Block Wise In-Storage Ground Water Resources of Saline Aquifers upto 300 m Depth
GENERAL DESCRIPTION OF THE GROUND WATER ASSESSMENT UNIT OF DISTRICT FARIDKOT PUNJAB STATE (2013)Type of Ground Water Assessment Unit (Block) Faridkot BlocksSrNo
Name ofAssessment
Unit
Type offormation
Areal extent (ha) Depth tobottom of
Aquifer basedon Geophysical
Interface ampBoreholelogging(m bgl)
Depth tobottom of
Saline WaterAquifer
based onGeophysicalInterface ampBorelogging
(m bgl)
Totalthickness
of theSaline
Water upto the max
depth(m)
Totalthickness of
theGranular
Zones up tothe depth of
SalineWaterZones
(m)
AverageSpecific
Yield
In-StorageGroundWater
Resourcesup to thedepth of
SalineWater
Aquifer(ham)
51011
TotalGeographical
Area
AssessmentArea
Saline Water
1 2 3 4 5 6 7 8 9 10 111 Faridkot Alluvium 75210 38500 152 300 148 103 0072 2855162 Kot Kapura Alluvium 66650 5000 106 300 194 76 0072 27360
Dist Total (ham) 141860 228406 312876Dist Total (mcm) 3129
ham hectare metremcm million cubic metre
Aquifer Mapping and Management Plan of Faridkot District Punjab State
Page | 32
Table-7 Block Wise Total Availability of Fresh and Saline Groundwater Resources upto 300 m Depth and Volume of unsaturatedgranular zone after 3m upto water level
BLOCK WISE AVAILABILITY OF TOTAL GROUNDWATER RESOURCES IN FARIDKOT DISTRICTSlNo BLOCK Volume of
UnsaturatedGranular Zone
up to Pre-monsoon WL
DynamicGroundwater
Resources(2013)
AQUIFER-I
In-storageGroundwater
Resources UPTOFRESHWATER
Total FreshGroundwater
Resources[(4)+(5)] (HAM)
Total SalineGroundwater
Resources[(3)+(4)](HAM)
Total Availability ofGroundwater
Resources [(6)+(7)]
ham mcm
1 2 3 4 5 6 7 8 91 Faridkot 10830 34632 182375 217007 285516 502523 50252 Kot Kapura 14396 26821 213062 239883 27360 267243 2672
DistTotal (ham) 25227 61453 395438 456891 312876 769767 7698DistTotal (mcm) 252 615 3954 4569 3129
ham hectare metremcm million cubic metre
Aquifer Mapping and Management Plan of Faridkot District Punjab State
Page | 33
50 GROUND WATER ISSUES
51 Ground Water DepletionThe Study area is famous for its paddy and non paddy cultivation The quality of ground
water in the area is suitable for irrigation and drinking purposes therefore the ground water isconstantly being pumped for the irrigation due to its easy access through tube wells at shallowdepths and they are the main source of irrigation This will lead to its deepening of groundwater levels in blocks of Faridkot and Kot Kapura of Faridkot district as the recharge of thegroundwater through rainfall and other sources are less than the overall extraction Thehydrographs also shows the declining water level trend over the years in the district (Fig20) andis categorized as over-exploited This declining water table trend if not checked would assumean alarming situation in the near future affecting agricultural production and thus economyGround Water Recharge and Conservation may be carried out in these areas to overcome thedepletion Other than the groundwater depletion quality and rising water table are the otherissues
Fig20 Long term ground water table variation
52 Rising Water tableIn western parts of the area water table is rising due to less withdrawal of ground water
because of brackish saline quality coupled with easy availability of canal water for domesticand irrigation purposes As such these areas are likely to get water logged in near future Thereis an urgent need to arrest the rising water trend in western part and implement anti-waterlogging schemes
Aquifer Mapping and Management Plan of Faridkot District Punjab State
Page | 34
53 Ground Water QualityThe ground water of the study area is alkaline in nature Ground water in the area is
generally fresh to marginally saline with fluoride concentration above permissible limit (15mgL) are found mainly in Nathuwala (603) Killi (429) Kot Kapura (333) Dhilwan Kalan(285)and Bir Sikhanwala (184) Nitrate concentration above permissible limit (45mgl) are found inSukhanwala (46) Sher singhwala (65) Wara Daraka (66) Dhilwan Kalan (72)Nathuwala (79)Chand Bhaja (79) Bir Sikhanwala (89) Nangal (104) Tehna (118) Dal Singhwala(136) Killi (140)and KotKapura (144) and iron concentration above permissible limit (15 mgL)are observed inDeviwala (177) There is growing concern on deterioration of ground water quality due togeogenic and anthropogenic activities
54 Ground Water Irrigation ScenarioAs per the data available from minor irrigation census 2005-06 the detailed number of
shallow deep tube wells lined unlined water distribution system land holdings of wells aregiven in Table-89 amp10
Table-8 Distribution of Tube wells According to Well Ownerrsquos land holding SizeType of
Tube well(TW)
Marginal(0-1 ha)
Small(1-2 ha)
Semi-Medium(2-4 ha)
Medium(4-10ha)
Big(gt10ha)
Total
Shallow TW 1100 4029 10069 14576 5314 35088
Deep TW 29 197 596 1188 468 2478
Total 1129 4226 10665 15764 5782 37566
Table-9 Distribution of Tube wells According to DepthDepth of Tubewells in metres Total depth
Range0-150m
Depth range 0-20 m 20-40 m 40-60 m 60-70 m 70-90m 90-150m gt150 m
Tubewells 3507 9947 9998 11636 543 1744 191 37566
Tubewells () 9 26 27 31 1 5 1
Table-10 System of Ground water distribution deviceOpen Water Channels
Linedpucca Unlinedkutcha Others Total2093 35455 18 37566
Aquifer Mapping and Management Plan of Faridkot District Punjab State
Page | 35
60 MANAGEMENT STRATEGIES AND AQUIFER MANAGEMENT PLAN
Aquifer mapping is leads to groundwater management plans to be implemented byincluding demand side-management and Ground Water Use Efficiency
An outline of the Aquifer Management Plan for each block is given in Part-II Thisincludes details regarding population rainfall average annual rainfall agriculture and irrigationwater bodies ground water resource availability ground water extraction and water levelbehavior Aquifer disposition and various cross sections have also been given Ground waterresources extraction and other issues including ground water resource enhancement anddemand side innervations have been given
Artificial recharge plan is less feasible in the Faridkot District due to very low availabilityof volume of surplus water (959 mcm) Another focus has been given to minimize the grossdraft by enhancing ground water use efficiency in irrigation system after replacing the waterdistribution system from unlinedkutcha channel to Under Ground Pipeline System (UGPS) inover exploited blocks of the district
61 Scope of ImplementationThis plan is focusing on the technical aspects of the ground water recharge through
various means so that various implementing agencies may get the appropriate technicalguidelines The existingongoing schemes of the central or state govt like MANERGA IWSPPMKSY (Prime Minister Krishi Sinchai Yojna) NABARD funded schemes Urban Developmentschemes departmentally funded projects etc may be benefitted from the recharge plan byincorporating the input in the operational guidelines design and for locating the specific sites
Agriculture University engineering Collages Academic and Research Institution NGOmay also take up the pilot or demonstrative projects in the blocks suitable to them to plan atlocal level as per local conditions
62 Potential of Enhancing the Ground Water Use EfficiencyThe micro level transformation in the ground water management have vast impact
potential to counter extensive ground water depletion faced in the state of Punjab particularlyin overexploited blocks
There are around 35455 (out of 37566) tube wells (9438 ) operated by farmers forirrigation through unlinedKutcha open channel system in study area (Table-10) where waterfrom the tube well is discharge to the agricultural field In this process huge (around 25 )(RKVY 2015) quantity of ground water is wasted in soil moisture and evaporation losses
Around 95 of the tube wells are of shallow depth (20 to 70m) and remaining wells aredeeper depth (70 to gt150 m) existed in the area (Table-9) Thus majority of wells are tappingshallow aquifer which is under stress
Dynamic ground water resources (2013) indicate that Gross ground water draft forirrigation in the district is estimated at 94880 mcm It is expected that around 25 of overdraft can be brought down by switching over to undergroundsurface pipeline based
Aquifer Mapping and Management Plan of Faridkot District Punjab State
Page | 36
distribution from the prevailing unlined open channels Thereby gross draft will be reduced to224 mcm (Table-11a) assuming that there is no crop diversification by the farmers
The benefit will lead to saving of precious ground water resources in overexploitedblocks The measure if implemented will bring down the ground water overdraft from 160 to123 The category of the blocks will also improve resulting in boosting of agriculture andindustrial development otherwise not sustainable in over-exploited blocks (Table-11b)
The tube wells also consume enormous electricity which is subsidized and governmentincur significant revenue on this account The measures therefore will result in saving of energyand money Pollution impact will be reduced whenever diesel engines are used by the farmersThe environmental and ecological condition in the irrigated land will improve Unwanted weedgrowth will also be controlled inside the farm land It is expected to save 1 of the agriculturalland occupied by open channels which can be utilized for cultivation purpose Heavy groundwater overdraft can be reduced by these efforts This will ensure more crops per drop
63 Water saving Potential from Crop Diversification-Change Paddy to MaizeSoya-beanAs the requirement of water for paddy is much high therefore by changing paddy to
maizesoya-bean will help in saving of water For estimating the water saving by cropdiversification it is assumed that one mcm of water will be saved in case of maize or soyabeanplanted in one sq km of land In case of pulses even higher amount of ground water can besaved
The block wise saving of water in mcm by applying various management strategies suchas crop diversification Under Ground Pipe lines (UGPL) in individual land and artificial rechargemethods are given in tables 11a b
Table-11a Scope of Quantitative Impact on Stage of Development after applying variousmanagement strategies in mcm
Block Net GroundWater
Availability(mcm)
TotalIrrigation
Draft(mcm)
PresentStage of
draft(SOD)
() (Asper
2013)
Reduction in draft by different watersaving method
SODafterwards
()
Change ofpaddy
cultivationarea ( ofexisting)
Replacewater
coursesby UGPipes
(mcm)
AdoptArtificialrecharge
(mcm)
ChangePaddy
toMaize(mcm)
Total(mcm)
(2+3+4)
1 2 3 4 5Faridkot 34632 52861 158 12472 484 7245 20201 9969 -
Kot Kapura 26821 42020 162 9915 475 6264 16654 9986 -Total 61453 94880 160 22387 959 13567 36913 9948
Aquifer Mapping and Management Plan of Faridkot District Punjab State
Page | 37
Table-11b Impact on Stage of Development (SOD) after applying various managementstrategies in Faridkot District
Block PresentSOD ()
as on2013
Reductionin SOD ()
afterunlinedchannel
()
ResultantSOD ()
Col(2 - 3)
Reduction inStage of
developmentafter crop
diversificationby
MaizeSoyabean()
ResultantSOD ()
Col(2 - 5)
Reduction inStage of
developmentafter Artificialrecharge ()
ResultantSOD ()
Col(2 - 7)
1 2 3 4 5 6 7 8Faridkot 158 3601 12199 2090 13710 140 15660
KotKapura 162 3697 12503 2340 13860 177 16023
Total 160 3664 12336 2210 13790 178 15822
By adopting all the management strategies resulting in total reduction in stage of groundwaterdevelopment is 6052 Hence overall stage of development afterwards is 9948 and is givenin Table12
Table-12 Overall Stage of Development (SOD) after reduction in Faridkot
Block PresentStage of
development() as on
2013
Reduction instage of
developmentafter unlinedchannel ()
Reduction inStage of
developmentafter crop
diversificationby
MaizeSoyabean()
Reduction inStage of
developmentafter Artificialrecharge ()
TotalReduction in
Stage ofdevelopment
()
(3 +4+5)
Stage ofdevelopmentafterwards
()
(2-6)
1 2 3 4 5 6 7Faridkot 158 3601 2090 140 5831 9969
Kot Kapura 162 3697 2340 177 6214 9986Total 160 3664 2210 178 6052 9948
Aquifer Mapping and Management Plan of Faridkot District Punjab State
Page | 38
70 CONCLUSIONS1 The area lies in the central part of Satluj basin of Indo-Gangetic Alluvial plain
Geologically the area is occupied by a thick sequence of Quaternary deposits of Mid-Pleistocene to Recent age
2 The Principle Aquifer system in the study area is Alluvium and the Major Aquifers areOlder Alluvium and Aeolian Alluvium
3 Lithological characteristics of the area are Multi-cyclic light grey to brown fine tomedium grained mixture of clay silt and sand with Kankar
4 Thick layering of clay with sand at many places can be observed towards south of thedistrict at deeper depths The Ground water occurs in unconfined (water table) andconfined conditions
5 Chemical data of ground water from shallow aquifer indicates that ground water isalkaline and fresh to moderately saline
6 To delineate fresh water - saline water interface laterally as well as vertically surfacegeophysical investigations have been carried out in alluvial tracts
7 To understand the sub surface disposition geological sections and fence diagram havebeen prepared by synthesizing the various sub-surface sections on the basis of study ofthe lithological logs and electrical logs of boreholes drilled by CGWB WRED PSTC andPrivate Agencies using the RockWorks15 software
8 Aquifer IA (Very Shallow Aquifer) extends maximum upto 70 m of depth and below thatclay layer starts getting thickened about 10-12m separating Aquifer IB to a maximumdepth of 123 m Multi layer aquifers are existing in the area each aquifer is separated bythick clay zones of 25 to 40 m upto 300m depth It is very difficult to differentiate theaquifer groups after Aquifer Group I so the whole lithology is considered to be a singleaquifer group system
9 Stage of Ground Water Development of the district is 160 on the basis of Dynamicground water resources 2013 In- storage ground water resources has also beencalculated up to a depth of 300 meters
10 The fresh water resources are inadequate in aquifer upto maximum depth of 106mwhereas saline water is dominant resources below 106 m depth upto 300 m In thenorth of the district towards Faridkot block fresh water is available upto 152m depth
11 Dynamic ground water resources of the study area are 61453 mcm whereas In-storageground water resources up to fresh water zones are 3954 mcm Thus total fresh groundwater resources up to maximum depth of 152 m are 4569 mcm Total saline waterresources up to depth of 300 m are 3129 mcm
12 Main groundwater issues in the area are groundwater depletion quality and risingwater table
13 Considering the high ground water abstraction for irrigation (94880 mcm) andoverdraft (37157 mcm) it is suggested that proposed artificial recharge measures (959mcm) crop diversification measures (13567 mcm) and conserving ground waterthrough laying of underground pipe line (22387 mcm) will be useful
14 Other techniques of water saving and modern irrigation technology to be enforced tomaximize per drop of water use in the district and also to think about the hidden salinewater resources and for its utilizations
Aquifer Mapping and Management Plan of Faridkot District Punjab State
Page | 39
BLOCK WISE
AQUIFER MAPS
AND
MANAGEMENT PLAN
(PART-II)
Aquifer Mapping and Management Plan of Faridkot District Punjab State
Page | 40
I Salient Information of Faridkot Block
Block Area(in Km2)
75210 sq km
District State Faridkot PunjabPopulation Urban Population 2260
Rural Population 179432Total population 181692
Rainfall NormalMonsoon 335 mm
Non-monsoon Rainfall 35 mmAnnual Average Rainfall 349 mm
Agriculture and Irrigation Principal crops Wheat Cotton and PaddyGross cropped area 119562 sq kmNet sown area 59180 sq kmIrrigation practices Canal and Tube well IrrigationCropping intensity 202Area underGround water Irrigation 6159 sq kmSurface water irrigation 51143 sq kmNumber and types of abstraction structures 20927 Tubewells
Ground Water ResourceAvailability and Extraction
Ground water Resources AvailabilityTotal Ground Water Resources available is 5025 mcm (fresh andsaline water) up to the depth of 300m The fresh water resourcesare estimated up to the depth of 152 m on the basis of geophysicalinterpretations The potential granular zones available for freshwater are calculated as 72 m Saline water resources are estimatedon the basis of available well depth (up to 300 m) and the granularzones are counted after depth of 152 m and available zones are 103m Block is categorized as Over-Exploited as per DynamicGroundwater Resources 2013 assessment
Ground water Resources ExtractionDeeper aquifers are marginal to highly saline and not suitable forirrigation purpose as such all users are tapping shallow aquifersDrinking water supply wells of State Government tapping shallowaquifers Therefore the ground water draft could not be assessed fordeeper aquifer
Aquifer Mapping and Management Plan of Faridkot District Punjab State
Page | 41
Existing and future waterdemands
Existing Gross Ground water Draft as on 2013Irrigation 52861 mcmDomestic and industrial water supply 1911 mcmFuture water demandsIrrigation development potential (-)2045 mcmDomestic and industrial water supply up to 2025 years 2219 mcm
Water level behavior Aquifer wise water levelAquifer-IPre Monsoon 145 ndash 1522 m bglPost Monsoon 120 ndash 1310 m bglMean (10 yrs) 100 ndash (-)101 myrTrendsPre Monsoon 018 ndash (-)022 myrPost Monsoon 024 ndash (-)030 myrAquifer-IINo Monitoring stations
Aquifer-IIINo Monitoring stations
HYDROGRAPH SHOWING DECLINING WATER TABLE
Aquifer Mapping and Management Plan of Faridkot District Punjab State
Page | 42
HYDROGRAPH SHOWING DECLINING WATER TABLE
HYDROGRAPH SHOWING DECLINING WATER TABLE
Monitoring well Golewala dried after 2004
Aquifer Mapping and Management Plan of Faridkot District Punjab State
Page | 43
Aquifer Disposition
Number of aquifers 1
Principal aquifer AlluviumMajor Aquifer Older Alluvium Aeolian Alluvium
Exploratory Data AvailabilitySource of Data No of exploration wells as per depth range (m) Total
lt100 100-200 200-300 gt300
CGWB 1 0 0 4 5WREDPSTCWSS 6 1 0 2 9PRIVATE 0 0 0 0 0TOTAL 7 1 0 6 14
Aquifer wise Characteristics (CGWB 2012)AquiferGroup
Geology Type ofAquifer
ThicknessofGranularzones (m)
Transmissivity(m2day)
YieldDischarge
(m3day)
SpecificYield
Storativity
SingleAquiferSystem
Quarter-naryAlluvialdeposits
Unconfined toconfined
175 474 - 2660 939 -55944
12 (0072)
175 x 10-3
-18 x 10-3
Well field proposed in adjacent blockThe Aquifer comprises of fresh and saline water and the major aquifer material is sand Theaquiclude and aquitard comprises of clay clay with siltExploratory Data Validated
Source of Data No of exploration wells as per depth range (m) Totallt100 100-200 200-300 gt300
CGWB 0 0 0 4 4WREDPSTCWSS 0 0 0 2 2PRIVATE 0 0 0 0 0TOTAL 0 0 0 6 6
The data is validated by selecting the deepest well in each quadrant and used for preparation of3-D Litho models 2-D Geological Cross Sections Fence Diagrams and Aquifer Maps
Aquifer Mapping and Management Plan of Faridkot District Punjab State
Page | 44
3-D Lithological Model of Faridkot Block
Lithological Cross Section from Dip Singh Wala to Nangal
Lithological Cross Section from Toot to Nangal
Aquifer Mapping and Management Plan of Faridkot District Punjab State
Page | 45
3-D Lithological Fence Diagram
3-D Aquifer Disposition Fence Diagram
Aquifer Mapping and Management Plan of Faridkot District Punjab State
Page | 45
3-D Lithological Fence Diagram
3-D Aquifer Disposition Fence Diagram
Aquifer Mapping and Management Plan of Faridkot District Punjab State
Page | 45
3-D Lithological Fence Diagram
3-D Aquifer Disposition Fence Diagram
Aquifer Mapping and Management Plan of Faridkot District Punjab State
Page | 46
Ground water Resource Extraction Contamination and other issues in Faridkot Block
Ground WaterResources upto thedepth of 300m
Dynamic Fresh waterresources
34632 mcm
In-storage Fresh waterresources
182375 mcm
In-storage Saline waterresources
285516 mcm
Total 502523 mcmGround WaterExtraction (as per 2013)
Irrigation 52861 mcm
Domestic amp Industrial 1911 mcm
Future Demand for domestic amp Industrial sector(2025) (as per 2013)
2219 mcm
Stage of Groundwater Development 158
Chemical Quality of ground water Ground water in the area is alkaline and pHranges between 794 to 917 Groundwater in the area is fresh to marginal salineEC value of ground water show widevariations and ranges from 444 Scm to8653Scm at 250CRSC values vary from (ndash) 73 to 113 meqLarea is fit for irrigation
Ground water Contamination Issues Fluoride (mgl)Nathuwala (603) Killi(429)Nitrate (mgl)Sukhanwala (46) Sher Singhwala (65)Nathuwala (79) Chand Baja (79) Nangal(104) Tehna (118) Killi (140)Iron (mg)Devi wala (177)
Other issues Water level decline has been observed inmajor parts of the block due to indiscriminate development of ground waterresourcesIn shallow water level area lessdevelopment of ground water resourcecouple with recharge from canal irrigationis causing water logging and inland salinityproblems
Aquifer Mapping and Management Plan of Faridkot District Punjab State
Page | 47
Ground water Resource Enhancement Potential
Aquifer wise space available for recharge and proposed interventions (Supply Side Measures)
Aquifer-I
Volumes of unsaturated zone after 3m upto a desirable depth 10830 mcmSource water requirementavailability for recharge Rain Canal Irrigation return flowTypes and number of structures NAOther interventions proposed Artificial Recharge Roof top Rainwater harvesting will conserve484 mcm volume of water
Demand side interventions
Advanced Irrigation PracticesArea proposed to be covered Entire Block Faridkot (75210 sq km)Volume of Water expected to be conserved under advanced irrigation practices such as lining ofunderground pipelines (Kutcha channel) 12472 mcm
Required Change in cropping pattern
Proposed change in cropping pattern Paddy to Maize Soyabean The overexploitation can bemanaged at sustainable level (100) by changing the Paddy cropArea coverage 15 of the total paddy area needs to change ie7245 sq kmAnticipated volume of water to be saved 7245 mcm
Net AnnualGroundWater
Availability2013
(mcm)
TotalIrrigation Draft
(present)(mcm)
GrossDraft alluses(present)(mcm)
Paddyarea
(Sq km)
RequiredArea to
beChange
fromPaddy toMaize
soyabean
(Sq km)
Amountof
WaterSaved(mcm)
Grossdraftafter
savingof water(mcm)
PresentStage of
development ()
Reductionin Stage ofdevelopme
nt afterMaize
soya bean()
CropDiversifiedarea ()
34632 52861 54771 48300 7245 7245 45616 158 209 15
Alternate Water sourcesSurface water sources Tanks PondsLocation details and availability from such sources outside the area Not AvailableRegulation and Control
Punjab Subsoil Act for delay in paddy plantation should continue in the area
Aquifer Mapping and Management Plan of Faridkot District Punjab State
Page | 48
Other interventions proposed if anyModern Irrigation Practices be adopted for Rabi crops Some of the techniques are given in
the table below (PAU Ludhiana)
SlNo Techniques Water Saving()
Crops
1 Mulching 17 Wheat2 Bed Planting 18-25 Wheat3 Use of Sprinkler and drip
Irrigation70-90 Sugarcane Cotton Sunflower Maize
Other than that by 15 days ponding followed by 2 days of drying can lead to 25 saving of water inpaddy crop
Aquifer Mapping and Management Plan of Faridkot District Punjab State
Page | 49
II Salient Information of Kot Kapura Block
Block Area(in Km2)
66650 sq km
District State Faridkot PunjabPopulation Urban Population 373
Rural Population 221025Total population 221398
Rainfall Normal Monsoon 328 mmNon-monsoon Rainfall 61 mmAnnual Average Rainfall 370 mm
Agriculture and Irrigation Principal crops Wheat Cotton and PaddyGross cropped area 133427 sq kmNet sown area 67498 sq kmIrrigation practices Canal and Tube well IrrigationCropping intensity 198Area underGround water Irrigation 4278 sq kmSurface water irrigation 62899 sq kmNumber and types of abstraction structures 16639 Tubewells
Ground Water ResourceAvailability and Extraction
Ground water Resources AvailabilityTotal Ground Water Resources available is 2672 mcm (fresh andsaline water) up to the depth of 300 m The fresh water resourcesare estimated up to the depth of 106 m on the basis of geophysicalinterpretations The potential granular zones available for freshwater are 51 m Saline water resources are estimated on the basis ofwell (up to 300 m) and the granular zones are counted after depth of106 m and available zones are 76 m Block is categorized as Over-Exploited as per Dynamic Groundwater Resources 2013 assessment
Ground water Resources ExtractionDeeper aquifers are marginal to highly saline and not suitable forirrigation purpose as such all users are tapping shallow aquifersDrinking water supply wells of State Government tapping shallowaquifers Therefore the ground water draft could not be assessed fordeeper aquifer
Aquifer Mapping and Management Plan of Faridkot District Punjab State
Page | 50
Existing and future waterdemands
Existing Gross Ground water Draft as on 2013Irrigation 42020 mcmDomestic and industrial water supply 1402 mcmFuture water demandsIrrigation development potential (-)16709 mcmDomestic and industrial water supply up to 2025 years 1511 mcm
Water level behavior Aquifer wise water levelAquifer-IPre Monsoon 235 ndash 1600 m bglPost Monsoon 155 ndash 1820 m bglMean (10 yrs) 158 ndash (-)086 myrTrendsPre Monsoon 016 ndash (-)026 myrPost Monsoon 015 ndash (-)029 myrAquifer-II (156m)Pre Monsoon 772 m bglPost Monsoon 805 m bglAquifer-III (269m)Pre Monsoon NAPost Monsoon 820 m bgl
HYDROGRAPH SHOWING DECLINING WATER TABLE
Aquifer Mapping and Management Plan of Faridkot District Punjab State
Page | 51
HYDROGRAPH SHOWING DECLINING WATER TABLE
HYDROGRAPH SHOWING DECLINING WATER TABLE
Aquifer Mapping and Management Plan of Faridkot District Punjab State
Page | 52
Aquifer Disposition
Number of aquifers 1
Principal aquifer AlluviumMajor Aquifer Older Alluvium Aeolian Alluvium
Exploratory Data AvailabilitySource of Data No of exploration wells as per depth range (m) Total
lt100 100-200 200-300 gt300
CGWB 2 1 1 4 8WREDPSTCWSS 8 0 0 1 9PRIVATE 1 0 1 0 2TOTAL 11 1 2 5 19
Aquifer wise Characteristics (CGWB2015)AquiferGroup
Geology Type ofAquifer
ThicknessofGranularzones (m)
Transmi-ssivity(m2day)
Yield(m3day)
SpecificYield
Storativity
SingleAquiferSystem
QuaternaryAlluvialdeposits
Unconfinedto confined
127 547 -2990
3668 12 (0072) 72x10-4
Well field proposed in this block (Site Location Deviwala)The Aquifer comprises of fresh and saline water and the major aquifer material is sand Theaquiclude and aquitard comprises of clay clay with siltExploratory Data Validated
Source of Data No of exploration wells as per depth range (m) Totallt100 100-200 200-300 gt300
CGWB 0 0 1 4 5WREDPSTCWSS 0 0 0 1 1PRIVATE 0 0 1 0 1TOTAL 0 0 2 5 7
The data is validated by selecting the deepest well in each quadrant and used for preparation of3-D Litho models 2-D Geological Cross Sections Fence Diagrams and Aquifer Maps
Aquifer Mapping and Management Plan of Faridkot District Punjab State
Page | 53
3-D Lithological model of Kot Kapura Block
Lithological Cross section from Wara Daraka to Aulakh
Lithological Cross section from Nangal to Dal Singhwala
Aquifer Mapping and Management Plan of Faridkot District Punjab State
Page | 54
3-D Lithological Fence Diagram
3-D Aquifer Disposition Fence Diagram
Aquifer Mapping and Management Plan of Faridkot District Punjab State
Page | 54
3-D Lithological Fence Diagram
3-D Aquifer Disposition Fence Diagram
Aquifer Mapping and Management Plan of Faridkot District Punjab State
Page | 54
3-D Lithological Fence Diagram
3-D Aquifer Disposition Fence Diagram
Aquifer Mapping and Management Plan of Faridkot District Punjab State
Page | 55
Ground water Resource Extraction Contamination and other issues in Kot Kapura Block
Ground WaterResources upto thedepth of 300m
Dynamic Fresh waterresources
26821 mcm
In-storage Fresh waterresources
213062 mcm
In-storage Saline waterresources
27360 mcm
Total 267243 mcmGround WaterExtraction (as per 2013)
Irrigation 42020 mcm
Domestic amp Industrial 1402 mcm
Future Demand for domestic amp Industrial sector(2025) (as per 2013)
1511 mcm
Stage of Groundwater Development 162
Chemical Quality of ground water Ground water in the area is alkaline and pHranges between 820 to 893 Ground waterin the area is slightly fresh to marginalsaline EC value of the ground water showwide variations and ranges from 1154Scm to 3988 Scm at 250CRSC values are varies from -003 to 1100meqL and the area is fit for irrigation
Ground water Contamination Issues Fluoride (mgl)Kot Kapura (333) Dhilwan kalan (285)Moharewala ( 195) Bir Sikhanwala ( 184)Nitrate (mgl)Wara Daraka (66) Dhilwan Kalan (72)Moharewala (78) Bir sikhan wala (89)KotKapura (144)
Other issues Water level decline has been observed inmajor parts of the block due to indiscriminate development of ground waterresourcesIn shallow water level area lessdevelopment of ground water resourcecouple with recharge from canal irrigation iscausing water logging and inland salinityproblems
Aquifer Mapping and Management Plan of Faridkot District Punjab State
Page | 56
Ground water Resource Enhancement Potential
Aquifer wise space available for recharge and proposed interventions (Supply Side Measures)
Aquifer-I
Volume of unsaturated zone after 3m upto a desirable depth 14396 mcmSource water requirementavailability for recharge Rain Canal Irrigation return flowTypes and number of structures NAOther interventions proposed Artificial Recharge Roof top Rainwater harvesting will conserve475 mcm volume of water
Demand side interventions
Advanced Irrigation PracticesArea proposed to be covered Entire Kot Kapura Block (66650 sq km)Volume of Water expected to be conserved under advanced irrigation practices such as lining ofunderground pipelines (Kutcha channel) etc 9915 mcm
Required Change in cropping pattern
Proposed change in cropping pattern Rice to Maize Soyabean The overexploitation can bemanaged at sustainable level (100) by changing the Paddy cropArea coverage 12 of the total rice area needs to change ie 6264 sq kmAnticipated volume of water to be saved 6264 mcm
Net AnnualGroundWater
Availability2013
(mcm)
TotalIrrigation Draft
(present)(mcm)
GrossDraft alluses(present)(mcm)
Paddyarea
(Sq km)
RequiredArea to be
Changefrom
Paddy toMaize
soya bean(Sq km)
Amountof
WaterSaved(mcm)
Grossdraftafter
savingof water(mcm)
PresentStage of
development ()
Reductionin Stage ofdevelopme
nt afterMaize
soya bean()
CropDiversifiedarea ()
26821 42020 43421 52200 6264 6264 35756 162 234 12
Alternate Water sourcesSurface water sources Tanks PondsLocation details and availability from such sources outside the area Not AvailableRegulation and Control
Punjab Subsoil Act for delay in paddy plantation should continue in the area
Other interventions proposed if anyModern Irrigation Practices be adopted for Rabi crops Some of the techniques are given in
the table below (PAU Ludhiana)
Aquifer Mapping and Management Plan of Faridkot District Punjab State
Page | 57
SlNo Techniques Water Saving()
Crops
1 Mulching 17 Wheat2 Bed Planting 18-25 Wheat3 Use of Sprinkler and drip
Irrigation70-90 Sugarcane Cotton Sunflower Maize
Other than that by 15 days ponding followed by 2 days of drying can lead to 25 saving of water inpaddy crop
Aquifer Mapping and Management Plan of Faridkot District Punjab State
Page | 58
Annexure-I
Nd Not Determined BDL Below Detection Limit
Aquifer Mapping and Management Plan of Faridkot District Punjab State
Page | 59
Annexure-IIData Availability of Exploration Wells of Faridkot district
SlNo LOCATION LONGITUDE LATITUDE DEPTH ELEVATION BLOCK DEPARTMENT1 Dal Singhwala 74950 30469 300 211 Kot Kapura CGWB2 Dip Singh Wala 74483 30742 300 201 Faridkot CGWB3 Golewala 74692 30792 300 1995 Faridkot CGWB4 Jaito Mandi 74891 30446 300 203 Kot Kapura CGWB5 Kot Kapura 74814 30576 300 206 Kot Kapura CGWB6 Nanak Nagri 74893 30581 200 210 Kot Kapura PRIVATE7 Nangal 74869 30669 300 206 Faridkot CGWB8 Tehna 74790 30690 300 205 Faridkot CGWB9 Wara Daraka 74797 30548 300 205 Kot Kapura CGWB
10 Aulakh 74920 30643 300 211 Kot Kapura PSTC11 Bhagthala 74786 30777 300 198 Faridkot PSTC12 Sadhuwala 74559 30717 300 196 Faridkot PSTC13 Deviwala 74870 30612 269 207 Kot Kapura CGWB14 Deviwala-I 74870 30612 156 207 Kot Kapura CGWB15 Kouni 74675 30760 60 194 Faridkot WSS16 Ghugiana 74639 30746 60 198 Faridkot WSS17 Pahluwala 74763 30799 60 203 Faridkot WSS18 Faridkot 74763 30681 60 203 Faridkot WSS19 Doda Bhundar 75016 30470 121 212 Kot Kapura WRED20 Dhudi 74849 30700 60 207 Faridkot WSS21 Ratti Rori 74811 30647 60 208 Faridkot WSS22 Chak Kalyan 74705 30572 60 203 Kot Kapura WSS23 Kot Kapura 74812 30596 60 208 Kot Kapura WSS24 Behbal Kalan 74913 30531 60 210 Kot Kapura WSS25 Rorian Kapura 74815 30439 60 207 Kot Kapura WSS26 Panjgrain 74914 30608 70 211 Kot Kapura PRIVATE27 Fatehgarh 74943 30405 60 208 Kot Kapura WSS
28Bhurj JawarSingh 74987 30535 60 211 Kot Kapura WRED
29 Dewarana 74766 30593 30 206 Kot Kapura WRED30 Sher Singhwala 74628 30665 65 195 Faridkot CGWB31 Bir Sikhan wala 74849 30627 65 207 Kot Kapura CGWB32 Dohak 74603 30632 163 197 Muktsar CGWB33 Toot 74645 30829 217 196 Ghal khurd CGWB
Two exploratory wells from adjacent districts ie Dohak from Muktsar district and Toot fromFerozpur district have been incorporated for the preparation of lithological fence and crosssections
Aquifer Mapping and Management Plan of Faridkot District Punjab State
Page | 60
Annexure-IIILITHOLOGICAL DATA OF WELLS IN FARIDKOT DISTRICT
Well Location Depth from Depth to Lithology Thickness
Dal Singhwala
0 13 Clay 1313 20 Fresh Sand 720 28 Clay 828 57 Fresh Sand 2957 64 Clay 764 75 Saline Sand 1175 78 Clay 378 97 Saline Sand 1997 108 Clay 11
108 117 Saline Sand 9117 122 Clay 5122 134 Saline Sand 12134 157 Clay 23157 173 Saline Sand 16173 179 Clay 6179 184 Saline Sand 5184 211 Clay 27211 219 Saline Sand 8219 253 Clay 34253 259 Saline Sand 6259 278 Clay 19278 293 Saline Sand 15293 298 Clay 5298 300 Saline Sand 2
Dip Singh Wala
0 8 Fresh Sand 88 36 Clay 28
36 68 Fresh Sand 3268 755 Clay 75
755 805 Fresh Sand 5805 83 Clay 2583 92 Fresh Sand 992 93 Clay 193 109 Saline Sand 16
109 113 Clay 4113 116 Saline Sand 3116 120 Clay 4120 132 Saline Sand 12
Aquifer Mapping and Management Plan of Faridkot District Punjab State
Page | 61
Dip Singh Wala 132 146 Clay 14146 162 Saline Sand 16162 168 Clay 6168 192 Saline Sand 24192 195 Clay 3195 197 Saline Sand 2197 2015 Clay 45
2015 209 Saline Sand 75209 2135 Clay 45
2135 2175 Saline Sand 42175 221 Clay 35221 237 Saline Sand 16237 2865 Clay 495
2865 2895 Saline Sand 32895 293 Clay 35293 296 Saline Sand 3296 300 Clay 4
Golewala
0 75 Clay 7575 2885 Fresh Sand 2135
2885 40 Clay 111540 525 Fresh Sand 125
525 60 Clay 7560 88 Saline Sand 2888 93 Clay 593 103 Saline Sand 10
103 1325 Clay 2951325 1375 Saline Sand 51375 155 Clay 175155 1575 Saline Sand 25
1575 182 Clay 245182 2035 Saline Sand 215
2035 2285 Clay 252285 234 Saline Sand 55234 253 Clay 19253 2725 Saline Sand 195
2725 280 Clay 75280 2975 Saline Sand 175
2975 300 Clay 25Jaito Mandi 0 15 Clay 15
15 25 Fresh Sand 1025 28 Clay 3
Aquifer Mapping and Management Plan of Faridkot District Punjab State
Page | 62
Jaito Mandi 28 42 Fresh Sand 1442 46 Clay 446 59 Fresh Sand 1359 80 Clay 2180 915 Fresh Sand 115
915 103 Clay 115103 107 Fresh Sand 4107 1555 Clay 485
1555 1715 Fresh Sand 161715 191 Clay 195191 213 Saline Sand 22213 220 Clay 7220 223 Saline Sand 3223 238 Clay 15238 255 Saline Sand 17255 273 Clay 18273 2785 Saline Sand 55
2785 2805 Clay 22805 283 Saline Sand 25283 2985 Clay 155
2985 300 Saline Sand 15
Kot Kapura
0 14 Clay 1414 21 Fresh Sand 721 25 Clay 425 355 Fresh Sand 105
355 37 Clay 1537 50 Fresh Sand 1350 57 Clay 757 64 Fresh Sand 764 69 Clay 569 77 Fresh Sand 877 88 Clay 1188 99 Fresh Sand 1199 103 Clay 4
103 106 Saline Sand 3106 123 Clay 17123 1286 Saline Sand 56
1286 130 Clay 14130 1326 Saline Sand 26
1326 134 Clay 14134 1355 Saline Sand 15
Aquifer Mapping and Management Plan of Faridkot District Punjab State
Page | 63
Kot Kapura
1355 1492 Clay 1371492 1518 Saline Sand 261518 155 Clay 32155 1584 Saline Sand 34
1584 161 Clay 26161 1796 Saline Sand 186
1796 1812 Clay 161812 1838 Saline Sand 261838 1865 Clay 271865 2045 Saline Sand 182045 207 Clay 25207 2125 Saline Sand 55
2125 249 Clay 365249 2545 Saline Sand 55
2545 280 Clay 255280 2944 Saline Sand 144
2944 300 Clay 56
Nanak Nagri
0 136 Clay 136136 208 Fresh Sand 72208 265 Clay 57265 305 Fresh Sand 4305 34 Clay 3534 368 Fresh Sand 28
368 388 Clay 2388 40 Fresh Sand 1240 428 Clay 28
428 46 Fresh Sand 3246 695 Clay 235
695 712 Fresh Sand 17712 785 Clay 73785 815 Fresh Sand 3815 84 Clay 2584 87 Fresh Sand 387 92 Clay 592 936 Saline Sand 16
936 988 Clay 52988 100 Saline Sand 12100 1085 Clay 85
1085 1115 Saline Sand 31115 118 Clay 65118 120 Saline Sand 2
Aquifer Mapping and Management Plan of Faridkot District Punjab State
Page | 64
Nanak Nagri 120 128 Clay 8128 1296 Saline Sand 16
1296 130 Clay 04130 1316 Saline Sand 16
1316 135 Clay 34135 1368 Saline Sand 18
1368 165 Clay 282165 1676 Saline Sand 26
1676 184 Clay 164184 1868 Saline Sand 28
1868 1905 Clay 371905 1948 Saline Sand 431948 2134 Clay 186
Nangal
0 8 Clay 88 20 Fresh Sand 12
20 23 Clay 323 28 Fresh Sand 528 29 Clay 129 41 Fresh Sand 1241 72 Clay 3172 80 Fresh Sand 880 91 Clay 1191 124 Fresh Sand 33
124 151 Clay 27151 158 Fresh Sand 7158 163 Clay 5163 171 Fresh Sand 8171 181 Clay 10181 187 Fresh Sand 6187 193 Clay 6193 199 Fresh Sand 6199 203 Clay 4203 219 Fresh Sand 16219 224 Clay 5224 233 Saline Sand 9233 243 Clay 10243 249 Saline Sand 6249 251 Clay 2251 257 Saline Sand 6257 300 Clay 43
Tehna 0 8 Clay 8
Aquifer Mapping and Management Plan of Faridkot District Punjab State
Page | 65
Tehna
8 23 Fresh Sand 1523 28 Clay 528 32 Fresh Sand 432 37 Clay 537 41 Fresh Sand 441 59 Clay 1859 63 Fresh Sand 463 69 Clay 669 72 Fresh Sand 372 102 Clay 30
102 106 Fresh Sand 4106 120 Clay 14120 123 Fresh Sand 3123 133 Clay 10133 136 Fresh Sand 3136 145 Clay 9145 150 Fresh Sand 5150 158 Clay 8158 163 Fresh Sand 5163 168 Clay 5168 172 Fresh Sand 4172 176 Clay 4176 184 Fresh Sand 8184 210 Clay 26210 215 Fresh Sand 5215 221 Clay 6221 225 Fresh Sand 4225 254 Clay 29254 264 Fresh Sand 10264 267 Clay 3267 275 Fresh Sand 8275 294 Clay 19294 300 Fresh Sand 6
Wara Daraka
0 15 Clay 1515 22 Fresh Sand 722 28 Clay 628 48 Fresh Sand 2048 52 Clay 452 61 Fresh Sand 961 65 Clay 465 75 Fresh Sand 10
Aquifer Mapping and Management Plan of Faridkot District Punjab State
Page | 66
Wara Daraka
75 84 Clay 984 86 Saline Sand 286 91 Clay 591 97 Saline Sand 697 101 Clay 4
101 119 Saline Sand 18119 124 Clay 5124 129 Saline Sand 5129 150 Clay 21150 172 Saline Sand 22172 184 Clay 12184 188 Saline Sand 4188 196 Clay 8196 205 Saline Sand 9205 234 Clay 29234 239 Saline Sand 5239 274 Clay 35274 281 Saline Sand 7281 300 Clay 19
Aulakh
0 1829 Clay 18291829 4573 Fresh Sand 27444573 7621 Clay 30487621 9146 Fresh Sand 15259146 10975 Clay 1829
10975 1128 Saline Sand 3051128 13414 Clay 2134
13414 16768 Saline Sand 335416768 20112 Clay 334420112 21036 Saline Sand 92421036 21341 Clay 30521341 21951 Saline Sand 6121951 2256 Clay 6092256 245 Saline Sand 194245 300 Clay 55
Bhagthala
0 35 Clay 3535 1829 Fresh Sand 1479
1829 41 Clay 227141 53 Fresh Sand 1253 63 Clay 1063 8537 Saline Sand 2237
8537 92 Clay 663
Aquifer Mapping and Management Plan of Faridkot District Punjab State
Page | 67
92 102 Saline Sand 10102 1311 Clay 291
1311 13415 Saline Sand 30513415 16768 Clay 335316768 17073 Saline Sand 30517073 185 Clay 1427
185 203 Saline Sand 18203 22866 Clay 2566
22866 23476 Saline Sand 6123476 253 Clay 1824
253 273 Saline Sand 20273 280 Clay 7280 294 Saline Sand 14294 300 Clay 6
Sadhuwala
0 61 Fresh Sand 6161 3049 Clay 2439
3049 52 Saline Sand 215152 625 Clay 105
625 725 Saline Sand 10725 77 Clay 4577 84 Saline Sand 784 91 Clay 791 107 Saline Sand 16
107 110 Clay 3110 114 Saline Sand 4114 118 Clay 4118 130 Saline Sand 12130 14339 Clay 1339
14339 16463 Saline Sand 212416463 17683 Clay 12217683 207 Saline Sand 3017
207 2115 Clay 452115 2155 Saline Sand 42155 219 Clay 35219 235 Saline Sand 16235 237 Clay 2237 25624 Saline Sand 1924
25624 27134 Clay 15127134 300 Saline Sand 2866
Deviwala0 15 Clay 15
15 23 Fresh Sand 8
Aquifer Mapping and Management Plan of Faridkot District Punjab State
Page | 68
Deviwala
23 38 Clay 1538 46 Fresh Sand 846 48 Clay 248 53 Fresh Sand 553 61 Clay 861 65 Fresh Sand 465 72 Clay 772 78 Fresh Sand 678 94 Clay 1694 106 Fresh Sand 12
106 109 Clay 3109 112 Saline Sand 3112 128 Clay 16128 140 Saline Sand 12140 158 Clay 18158 163 Saline Sand 5163 179 Clay 16179 183 Saline Sand 4183 187 Clay 4187 196 Saline Sand 9196 202 Clay 6202 213 Saline Sand 11213 218 Clay 5218 223 Saline Sand 5223 252 Clay 29252 258 Saline Sand 6258 263 Clay 5263 269 Saline Sand 6
Dohak
0 8 Clay 88 10 Fresh Sand 2
10 21 Clay 1121 33 Saline Sand 1233 41 Clay 841 79 Saline Sand 3879 89 Clay 1089 95 Saline Sand 695 99 Clay 499 112 Saline Sand 13
112 116 Clay 4116 139 Saline Sand 23139 154 Clay 15
Aquifer Mapping and Management Plan of Faridkot District Punjab State
Page | 69
154 163 Saline Sand 9
Toot
0 15 Clay 1515 198 Fresh Sand 48
198 21 Clay 1221 474 Fresh Sand 264
474 51 Clay 3651 552 Fresh Sand 42
552 626 Clay 74626 766 Fresh Sand 14766 101 Clay 244101 104 Fresh Sand 3104 113 Clay 9113 116 Fresh Sand 3116 143 Clay 27143 146 Saline Sand 3146 167 Clay 21167 170 Saline Sand 3170 182 Clay 12182 204 Saline Sand 22204 214 Clay 10214 217 Saline Sand 3
Aquifer Mapping and Management Plan of Faridkot District Punjab State
Page | 70
Annexure-IVAQUIFER GROUPING OF WELL LOCATIONS IN FARIDKOT DISTRICT
Well location Depth from Depth to Aquifer Thickness FreshGranular
Zones
SalineGranular
Zones
Dal Singhwala
0 15 Unsaturated Zone 15 215 57 Aquifer Group-IA 42 3457 64 Aquiclude-IA 764 134 Aquifer Group-IB 70 51
134 157 Aquiclude-IB 23157 300 Multiple Aquifers 143 52
Dip Singh Wala
0 5 Unsaturated Zone 5 55 68 Aquifer Group-IA 63 35
68 755 Aquiclude-IA 75755 132 Aquifer Group-IB 565 14 31132 146 Aquiclude-IB 14146 300 Multiple Aquifers 154 755
Golewala
0 4 Unsaturated Zone 4 14 525 Aquifer Group-IA 485 33
525 60 Aquiclude-IA 7560 103 Aquifer Group-IB 43 38
103 155 Aquiclude-IB 52155 300 Multiple Aquifers 145 665
Jaito Mandi
0 14 Unsaturated Zone 14 114 59 Aquifer Group-IA 45 3759 80 Aquiclude-IA 2180 107 Aquifer Group-IB 27 155
107 1555 Aquiclude-IB 4851555 300 Multiple Aquifers 1445 16 515
Kot Kapura
0 9 Unsaturated Zone 9 29 77 Aquifer Group-IA 68 455
77 88 Aquiclude-IA 1188 106 Aquifer Group-IB 18 11 3
106 155 Aquiclude-IB 49155 300 Multiple Aquifers 145 68
Nanak Nagri
0 12 Unsaturated Zone 12 112 46 Aquifer Group-IA 34 18446 69 Aquiclude-IA 2369 131 Aquifer Group-IB 62 77 11
131 165 Aquiclude-IB 34165 2134 Multiple Aquifers 484 97
Nangal 0 9 Unsaturated Zone 9 1
Aquifer Mapping and Management Plan of Faridkot District Punjab State
Page | 71
Nangal
9 41 Aquifer Group-IA 32 2941 72 Aquiclude-IA 3172 124 Aquifer Group-IB 52 41
124 151 Aquiclude-IB 27151 300 Multiple Aquifers 149 43 21
Tehna
0 10 Unsaturated Zone 10 210 41 Aquifer Group-IA 31 18741 59 Aquiclude-IA 1859 106 Aquifer Group-IB 47 33
106 158 Aquiclude-IB 52158 300 Multiple Aquifers 142 50
Wara Daraka
0 4 Unsaturated Zone 4 04 75 Aquifer Group-IA 71 46
75 84 Aquiclude-IA 984 129 Aquifer Group-IB 45 31
129 150 Aquiclude-IB 21150 300 Multiple Aquifers 150 47
Aulakh
0 17 Unsaturated Zone 17 217 46 Aquifer Group-IA 29 2646 76 Aquiclude-IA 3076 113 Aquifer Group-IB 37 1525 305
113 134 Aquiclude-IB 21134 300 Multiple Aquifers 166 6828
Bhagthala
0 4 Unsaturated Zone 4 14 53 Aquifer Group-IA 49 24
53 63 Aquiclude-IA 1063 102 Aquifer Group-IB 39 3237
102 168 Aquiclude-IB 66168 300 Multiple Aquifers 132 6115
Sadhuwala
0 5 Unsaturated Zone 5 55 52 Aquifer Group-IA 47 2151
52 63 Aquiclude-IA 1163 130 Aquifer Group-IB 67 49
130 144 Aquiclude-IB 14144 300 Multiple Aquifers 156 11931
Deviwala
0 8 Unsaturated Zone 8 28 78 Aquifer Group-IA 70 31
78 94 Aquiclude-IA 1694 112 Aquifer Group-IB 18 12 3
112 128 Aquiclude-IB 16128 269 Multiple Aquifers 141 58
Aquifer Mapping and Management Plan of Faridkot District Punjab State
Page | 72
Dohak
0 3 Unsaturated Zone 3 03 79 Aquifer Group-IA 76 2 50
79 89 Aquiclude-IA 1089 139 Aquifer Group-IB 50 42
139 154 Aquiclude-IB 15154 163 Multiple Aquifers 9 9
Toot
0 9 Unsaturated Zone 9 19 55 Aquifer Group-IA 46 354
55 63 Aquiclude-IA 863 116 Aquifer Group-IB 53 25
116 143 Aquiclude-IB 27143 217 Multiple Aquifers 74 31
- कदरीय भमि जल बोरड
-
- जल ससाधन नदी विकास और गगा सरकषण मतरालय
- भारत सरकार
-
- contents naquim faridkotpdf (p1-5)
- Final Faridkot edited 170317pdf (p6-77)
-
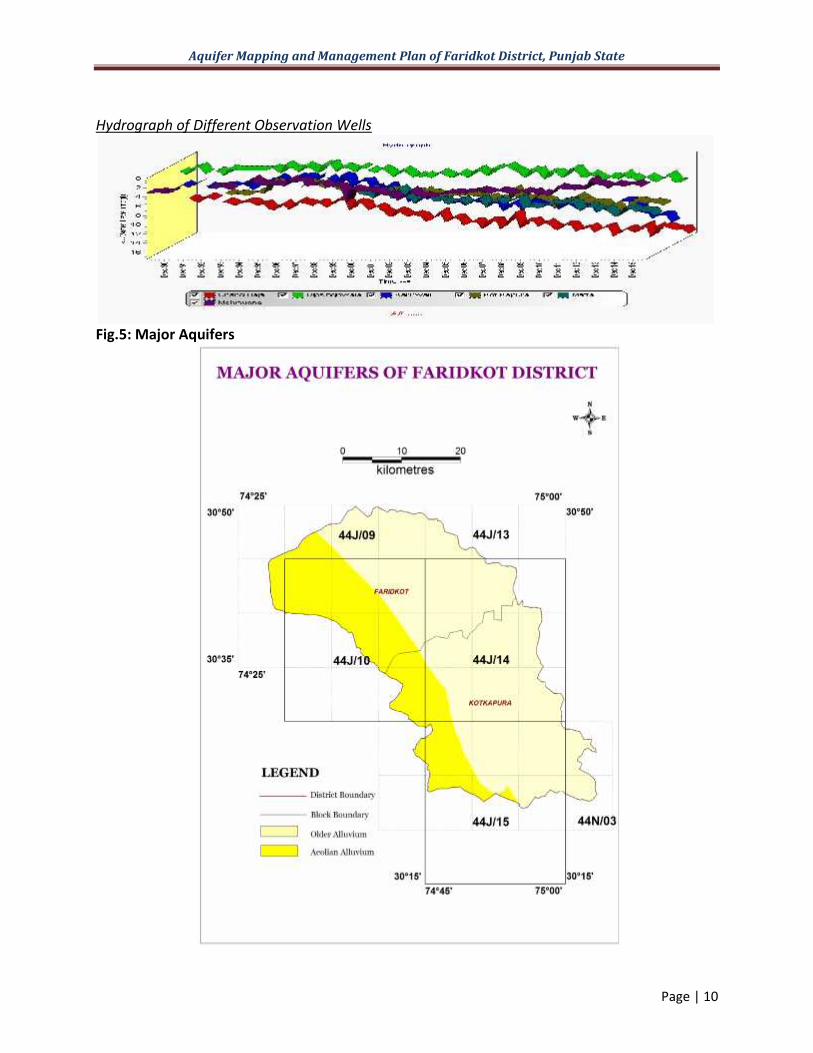
Aquifer Mapping and Management Plan of Faridkot District Punjab State
Page | 17
23 Geophysical data
To delineate fresh water - saline water interface laterally as well as vertically surfacegeophysical investigations have been carried out in alluvial tracts over parts of the study areaUnder surface geophysical investigations total 44 VES (Fig9) in an area of 1800 sq km wereconducted with current electrical separation of 600 to 1000 m
Fig9 VES Locations in Faridkot District
Aquifer Mapping and Management Plan of Faridkot District Punjab State
Page | 18
Subsurface geophysical investigations include borehole logging The ground waterquality data pertaining to the CGWB exploratory boreholes indicate vertical and lateralvariation in EC values Shallow ground water quality data shows clearly the existence of salinityat shallow depth in the many parts of study area such as Pakka Mahmuana ShirinwalaShersinghwala Dohak Kamiyana Kingra and many other places Electrical conductivity (EC) ofground water is more than 2000 microS cm in major part of the area except at few places Slightimprovement in quality of ground water at deeper depth as compared to shallow depth hasbeen observed at few places These places are Chuggewala Golewalla Nangal Deepsinghwalawhere EC of ground water was found to be within 2000 microS cm within the depth range of 80 to120 m
24 Exploratory drilling State - Data AvailabilityThe Lithologs of Exploratory Well Observation well Piezometer productive wells of
CGWB Punjab State Tubewell Corporation (PSTC) now as Punjab Water ResourcesDevelopment and Management (PWRDM) WRED ( Water Resources and EnvironmentDirectorate) Water Supply and Sanitation (WSS) and Private Wells have been collected andthose supported electrical logs have been validated for aquifer map preparation The details areshown in Table-1
Table-1 Data Availability of Exploration Wells of Faridkot district
SlNo Source of data Depth Range (m) Totallt 100 100-200 200-300 gt300
1 CGWB 2 1 1 8 122 WREDPSTCWSS 15 1 0 3 193 PRIVATE WELLS 1 0 1 0 2Total 18 2 2 11 33
25 Spatial Data DistributionThe actual data of all the wells in the area are plotted on the map of 150000 scale with
5rsquoX5rsquogrid (9 x 9) km (Fig 10) Perusal of table shows that majority of tube wells falls in theshallow aquifer having depth less than 100m and deeper aquifer having depth more than 300mThe grids formations devoid of groundwater exploration are identified as data gaps and theseare to be filled by data generation The Physical record of the availability of exploration data aregiven in Annexure-II
Aquifer Mapping and Management Plan of Faridkot District Punjab State
Page | 19
Fig10 Locations of Exploration Data Availability
Aquifer Mapping and Management Plan of Faridkot District Punjab State
Page | 20
30 DATA INTERPRETATION INTEGRATION AND AQUIFER MAPPINGAll the available data have been validated to generate aquifer map The deepest well in
each quadrant is selected and plotted on the map of 150000 scale with 5rsquoX5rsquogrid (9 x 9) km(Fig11)
Fig11 Locations of validated exploration data
The optimized wells of CGWB PWRDM WRED WSS and Private Wells have been usedto prepare the elevation or collar elevation map to identify the topographic variations onground surface so that it can give the synoptic picture of gradient variations in the water levels
Aquifer Mapping and Management Plan of Faridkot District Punjab State
Page | 21
The topographic elevation values have been plotted to prepare the elevation contour map(Fig12) The locations of validated wells in quadrant and toposheet wise distributions inrespective blocks are given in Table-2 Locations of validated exploratory wells with litholog areshown in Fig13
Fig12 Elevation contour map
Fig13 Locations of validated exploratory wells with Litholog
Aquifer Mapping and Management Plan of Faridkot District Punjab State
Page | 22
Table -2 Summary of optimized exploration wells
Block ToposheetQuadrant Depth Range (m) Elevation(m amsl)
Source ofdata
Location lt 100 100-200 200-300 gt300Faridkot 1A 44J06 Dip Singh Wala - - - 350 201 CGWBFaridkot 3C 44J09 Golewala - - - 34378 1995 CGWBFaridkot 1A 44J14 Tehna - - - 300 205 CGWBFaridkot 3A 44J14 Bhagthala - - - 37195 198 PSTCFaridkot 1A 44J10 Sadhuwala - - - 35970 196 PSTCKot Kapura 1C 44J15 Dal Singhwala - - - 300 211 CGWBKot Kapura 1B 44J15 Jaito Mandi - - - 41920 203 CGWBKot Kapura 2A 44J14 Kot Kapura - - - 42190 206 CGWBKot Kapura 3B 44J14 Nanak Nagri - - 2134 - 210 PRIVATEKot Kapura 1B 44J14 Nangal - - - 300 206 CGWBKot Kapura 3A 44J14 Wara Daraka - - - 300 205 CGWBKot Kapura 2C 44J14 Aulakh - - - 38414 211 PSTCKot Kapura 2B 44J14 Deviwala - - 269 - 207 CGWBMuktsar 2B 44J10 Dohak - 163 - - 197 CGWBGhal khurd 3B 44J09 Toot - - 217 - 196 CGWB
Two exploratory wells from adjacent districts ie Dohak from Muktsar district and Toot from Ferozpur district have beenincorporated for the preparation of lithological fence and cross sections
Aquifer Mapping and Management Plan of Faridkot District Punjab State
Page | 23
31 Sub Surface Disposition311 Previous Work
To delineate and determine the potential aquifer zones evaluation of aquifercharacteristics etc Exploratory drilling was conducted by CGWB at 6 locations in the districtincludes 05 exploratory wells and 1 slim hole between 1975 to 2008 through in-house activitiesand 02 exploratory wells and 2 piezometers through outsourced by Ms WAPCOS Ltd between2011 to 2015 (Fig10) The drilling has been carried out to a maximum depth of about 408 m(Kot Kapura) and revealed the presence of 6 to 12 prominent permeable granular zones withaggregate thickness varying from 28 to 283 m The granular zone consists of fine to mediumsand The slim hole at Golewala and exploratory well at Kot Kapura have abandoned due topoor quality of formation water upto depth of 350m bgl
Further the study of exploratory boreholes drilled in the district revealed the presence ofmultiple aquifer groups up to the maximum drilled depth of 408 m The first aquifer group formsvery shallow water table aquifer (IA) and occurs down to 57 m Below that clay layer starts gettingthickened to about 8-10m separating Aquifer IB down to 120 m The below multi aquifers behavesas semi-confined to confined and consisting of thin sand layers alternating with thicker clay layersOverall flow of ground water is towards south-west direction Further the study of exploratoryboreholes drilled in the area revealed that the area is considered as a single aquifer system up tothe maximum depth of 300 m
312 Present NAQUIM StudyTo understand the sub surface disposition in the study area geological sections and
fence diagram have been prepared by synthesizing the various sub-surface sections on the basisof study of the lithological logs and electrical logs of boreholes drilled by CGWB WRED PSTCand Private Agencies using the RockWorks15 software and a 3D lithological model has beenprepared (Fig14) The 2D lithology sections and 3D lithological fence diagram has beenprepared using lithology model and are shown in Fig15a b amp 16 respectively The aquifers arecomposed of fine to medium sand with clay intercalations The granular zones are extensiveThe aquifer occurring below 252m depth are composed of very fine to medium sand with silt
Based on geophysical borehole logging and use of resistivity profiling followed by thedepth soundings at few selected places fresh-saline water zones are demarcated This analysisis extremely important for the present study and will be referred from time to time as it isobviously the higher resistivity beds represents freshwater zone in contrast in low resistive bedsindicating saline groundwater zoneFig14 3-Dimension Lithological Model
Aquifer Mapping and Management Plan of Faridkot District Punjab State
Page | 24
The major aquifer system of the area is Quaternary alluvial deposits having Older and Aeolianalluvium which mainly comprises of sand silt and clay The top surface layer is mainly silty clayThe lithology along W-E direction shows the variation in lithological thickness ie thin clay layersinter bedded with sand except at Nangal where thick clay layers were identified at 55 m bglThere is inter-layering of sand and clay with thick clay at Golewala and Bhagthala towardswestern side at a depth between 150m to 210m bgl There is thick a inter-layering of sand andclay towards all lithologs except Nanak Nagri shows thin sequence of sand and clay towards SWLithological data of wells are given in Annexure-III
Fig15ab 2-Dimension Lithological Sections
SWE
Aquifer Mapping and Management Plan of Faridkot District Punjab State
Page | 25
Fig16 3-Dimension Lithological Fence
Aquifer Mapping and Management Plan of Faridkot District Punjab State
Page | 26
32 Aquifer Geometry
The aquifer group embodies a number of granular layers alternating with clay lenses Afew clay layers intervening these aquifer groups pinch out against the sand zones at few placesThe marker horizons are traced all over the area by connecting their tops and bottoms Sandyclay layer occurs at the surface covering the unconfined aquifer which is in turn underlain byprominent clay zone It is composed of mainly of medium sand with thin beds of fine sand
Aquifer IA (Very Shallow Aquifer) extends maximum upto 70 m of depth and below thatclay layer starts getting thickened about 10-12m separating Aquifer IB to a maximum depth of123 m Multi layer aquifers are existing in the area each aquifer is separated by thick clay zonesof 25 to 40 m upto 300m depth (Annexure IV) Based on the same criteria to know the broadpicture of the aquifer disposition inter-relationship of granular zones nature geometry andextension of aquifers in the study area the aquifer grouping has been carried out using the sub-surface lithology and a 3-Dimensional aquifer model (Fig17) and aquifer disposition 3D fencediagram has also been prepared using the aquifer model (Fig18) Various groups identified inthe area are given in Table-3 It is very difficult to differentiate the aquifer groups after AquiferGroup I so the whole lithology is considered to be a single aquifer group system The firstaquifer is water table aquifer and extends all over the area The aquifer is mainly composed offine to coarse grained sand
Table-3 Aquifer Grouping in Faridkot DistrictAquifer Group Range Thickness
From To Min Max
Aquifer IA 4 70 29 50
Aquifer IB 64 123 21 52
Multiple Aquifers 133 300 21 85
Fig17 3D Aquifer Disposition Model
Aquifer Mapping and Management Plan of Faridkot District Punjab State
Page | 27
Fig18 3D Aquifer Disposition Fence
Aquifer Mapping and Management Plan of Faridkot District Punjab State
Page | 28
40 GROUND WATER RESOURCESGround water resource estimation of the area have been carried out by taking Dynamic
and In-storage resources of unconfined aquifer and confined aquifer present upto 300m depthThe assessment of dynamic ground water Resources of the study area have been carried outjointly by CGWB and Water Resources and Environment Directorate (WRED) Department ofIrrigation Punjab on the basis of Ground Water Estimation Committee (1997) methodology
The occurrence of potential aquifers (productive granular zones) upto 300 m depth hasbeen demarcated on basis of aquifer wise subsurface mapping The total saturated thickness ofgranular zones was derived from the exploratory borehole data of a particular block Thegranular zones occurring below the zone of water level fluctuation up to the first confining layerhas been considered as static unconfined zone The specific yield value for the unconfinedaquifer has been taken as 60 of 012 which comes as 0072 whereas for the confined aquiferthe storativity value has been considered Since the specific yield is likely to reduce withincrease in depth due to compaction of overlying sediments
Hence the major data elements considered in this estimation are thickness of granularzones specific yieldstorativity and area of both fresh water and salinebrackish water It hasbeen observed that in some of the blocks sufficient data on probable occurrence of granularzones was not available In those cases the existing exploratory data of adjoining blockdistricthas been either extrapolated or interpolated to derive such parameters required for estimationThis assessment of total groundwater resources has been computed based on the availabledata with CGWB amp WRED Department of Irrigation and Punjab
41 Groundwater Resources up to depth of 300ma Dynamic Resources
Block-wise ground water resource potential of the district has been assessed as perGEC-97 as on 31st March 2013 The primary source of recharge in the area is the rainfall Theground water development in all the blocks has exceeded the available recharge thus all theblocks have been categorized as over exploited The overall stage of ground water developmentin the Faridkot district has been assessed to be 160 The block wise details are given in belowTable-4
Table 4 Dynamic Ground Water Resource amp Development Potential (31032013) in mcmAssessmentUnit Block
NetAnnualGroundWater
Availability
ExistingGross
GroundWater Draft
forirrigation
ExistingGross GroundWater Draftfor domestic
andindustrial
water supply
ExistingGross
GroundWater
Draft forAll uses(11+12)
Provision fordomestic
andindustrial
requirementsupply to
2025
Net GroundWater
Availabilityfor futureirrigation
development(10-11-14)
Stage ofGroundWater
Development(1310)
100()
Category
Faridkot 34632 52861 1911 54771 2219 -20448 158Over
Exploited
Kot Kapura 26821 42020 1402 43421 1511 -16709 162Over
Exploited
TOTAL 61453 94880 3313 98193 3730 -37157 160Over
Exploited
Aquifer Mapping and Management Plan of Faridkot District Punjab State
Page | 29
b In-storage Ground Water ResourcesAs per revised guidelines recommended by the Central Level Expert Group on
groundwater resources assessment the resources are separately considered as dynamic and in-storage unconfined In case of alluvial area in-storage resources of unconfined aquifer havebeen computed on the basis of specific yield of aquifer as detailed below
In-storageGround Water
resources(Unconfined
Aquifer)
=
Thickness of the aquifer(granularproductive zone)
below the zone of water levelfluctuation down to the bottom
layer of unconfined aquifer
x Sp Yield ofthe aquifer
x Areal extentof the
aquifer
The dynamic and in-storage ground water resource estimations have been calculated forsingle aquifer group upto 300m of each block of Faridkot district In-storage ground waterresources are estimated for fresh water and saline water resources based on the geophysicalinterpretations of depth to fresh and saline water interface for each block The fresh and salinecalculations are made on the basis of the assumptions on aquifer that is considered asunconfined aquifer so that the specific yield concept is used for resources estimations (Fig19)The detailed resources estimations are calculated in detailed table for fresh and saline waterresources in the below Table-5 6amp 7
Total Availability of Ground Water Resources = Dynamic Resources + In-storage Resources
Fig19 Conceptual figure to understand the fresh and saline water resources in the aquifer up to300 m for Resource Estimation in Unconfined and Confined Aquifer System
(The clay lenses are more dominant in the aquifer and sometimes huge thickness of clay depositsare also observed in the lithologs)
Aquifer Mapping and Management Plan of Faridkot District Punjab State
Page | 29
b In-storage Ground Water ResourcesAs per revised guidelines recommended by the Central Level Expert Group on
groundwater resources assessment the resources are separately considered as dynamic and in-storage unconfined In case of alluvial area in-storage resources of unconfined aquifer havebeen computed on the basis of specific yield of aquifer as detailed below
In-storageGround Water
resources(Unconfined
Aquifer)
=
Thickness of the aquifer(granularproductive zone)
below the zone of water levelfluctuation down to the bottom
layer of unconfined aquifer
x Sp Yield ofthe aquifer
x Areal extentof the
aquifer
The dynamic and in-storage ground water resource estimations have been calculated forsingle aquifer group upto 300m of each block of Faridkot district In-storage ground waterresources are estimated for fresh water and saline water resources based on the geophysicalinterpretations of depth to fresh and saline water interface for each block The fresh and salinecalculations are made on the basis of the assumptions on aquifer that is considered asunconfined aquifer so that the specific yield concept is used for resources estimations (Fig19)The detailed resources estimations are calculated in detailed table for fresh and saline waterresources in the below Table-5 6amp 7
Total Availability of Ground Water Resources = Dynamic Resources + In-storage Resources
Fig19 Conceptual figure to understand the fresh and saline water resources in the aquifer up to300 m for Resource Estimation in Unconfined and Confined Aquifer System
(The clay lenses are more dominant in the aquifer and sometimes huge thickness of clay depositsare also observed in the lithologs)
Aquifer Mapping and Management Plan of Faridkot District Punjab State
Page | 29
b In-storage Ground Water ResourcesAs per revised guidelines recommended by the Central Level Expert Group on
groundwater resources assessment the resources are separately considered as dynamic and in-storage unconfined In case of alluvial area in-storage resources of unconfined aquifer havebeen computed on the basis of specific yield of aquifer as detailed below
In-storageGround Water
resources(Unconfined
Aquifer)
=
Thickness of the aquifer(granularproductive zone)
below the zone of water levelfluctuation down to the bottom
layer of unconfined aquifer
x Sp Yield ofthe aquifer
x Areal extentof the
aquifer
The dynamic and in-storage ground water resource estimations have been calculated forsingle aquifer group upto 300m of each block of Faridkot district In-storage ground waterresources are estimated for fresh water and saline water resources based on the geophysicalinterpretations of depth to fresh and saline water interface for each block The fresh and salinecalculations are made on the basis of the assumptions on aquifer that is considered asunconfined aquifer so that the specific yield concept is used for resources estimations (Fig19)The detailed resources estimations are calculated in detailed table for fresh and saline waterresources in the below Table-5 6amp 7
Total Availability of Ground Water Resources = Dynamic Resources + In-storage Resources
Fig19 Conceptual figure to understand the fresh and saline water resources in the aquifer up to300 m for Resource Estimation in Unconfined and Confined Aquifer System
(The clay lenses are more dominant in the aquifer and sometimes huge thickness of clay depositsare also observed in the lithologs)
Aquifer Mapping and Management Plan of Faridkot District Punjab State
Page | 30
Table-5 Block wise In-Storage Ground Water Resources of Fresh Water Aquifer
GENERAL DESCRIPTION OF THE GROUND WATER ASSESSMENT UNIT OF DISTRICT FARIDKOT PUNJAB STATE (2013)
Type of Ground Water Assessment Unit (Block) Faridkot Blocks
SrNo
Name ofAssessment
Unit
Type offormation
Areal extent (sq km) AveragePre-
monsoonWaterLevel
(m bgl)
Depth tobottom of
Aquiferbased on
Geophysical Interface
amp Boreholelogging(m bgl)
TotalThickness
offormation
belowPre-
monsoonWaterLevel(m)
(7-6)
Totalthickness
of theGranularZones up
to thedepth of
FreshWaterZones
(m)
Thicknessof the
unsaturated
granularZones up
to Pre-monsoon
WL(m)
Thicknessof the
saturatedgranularZones up
to thedepth of
Freshwater
aquiferbelow (m)
(9-10)
AverageSpecific
Yield
In-StorageGroundWater
Resourcesup to thedepth of
FreshWater
Aquifer(ham)
51112
TotalGeographical Area
AssessmentArea
FreshWater
1 2 3 4 5 6 7 8 9 10 11 12 13
1 Faridkot Alluvium 75210 36710 450 152 1475 72 2 69 0072 182375
2
KotKapura Alluvium 66650 61650 1069 106 9531 51 3 48 0072 213062Dist Total (ham) 141860 228406 395438Dist Total (mcm) 3954
ham hectare metremcm million cubic metre
Aquifer Mapping and Management Plan of Faridkot District Punjab State
Page | 31
Table-6 Block Wise In-Storage Ground Water Resources of Saline Aquifers upto 300 m Depth
GENERAL DESCRIPTION OF THE GROUND WATER ASSESSMENT UNIT OF DISTRICT FARIDKOT PUNJAB STATE (2013)Type of Ground Water Assessment Unit (Block) Faridkot BlocksSrNo
Name ofAssessment
Unit
Type offormation
Areal extent (ha) Depth tobottom of
Aquifer basedon Geophysical
Interface ampBoreholelogging(m bgl)
Depth tobottom of
Saline WaterAquifer
based onGeophysicalInterface ampBorelogging
(m bgl)
Totalthickness
of theSaline
Water upto the max
depth(m)
Totalthickness of
theGranular
Zones up tothe depth of
SalineWaterZones
(m)
AverageSpecific
Yield
In-StorageGroundWater
Resourcesup to thedepth of
SalineWater
Aquifer(ham)
51011
TotalGeographical
Area
AssessmentArea
Saline Water
1 2 3 4 5 6 7 8 9 10 111 Faridkot Alluvium 75210 38500 152 300 148 103 0072 2855162 Kot Kapura Alluvium 66650 5000 106 300 194 76 0072 27360
Dist Total (ham) 141860 228406 312876Dist Total (mcm) 3129
ham hectare metremcm million cubic metre
Aquifer Mapping and Management Plan of Faridkot District Punjab State
Page | 32
Table-7 Block Wise Total Availability of Fresh and Saline Groundwater Resources upto 300 m Depth and Volume of unsaturatedgranular zone after 3m upto water level
BLOCK WISE AVAILABILITY OF TOTAL GROUNDWATER RESOURCES IN FARIDKOT DISTRICTSlNo BLOCK Volume of
UnsaturatedGranular Zone
up to Pre-monsoon WL
DynamicGroundwater
Resources(2013)
AQUIFER-I
In-storageGroundwater
Resources UPTOFRESHWATER
Total FreshGroundwater
Resources[(4)+(5)] (HAM)
Total SalineGroundwater
Resources[(3)+(4)](HAM)
Total Availability ofGroundwater
Resources [(6)+(7)]
ham mcm
1 2 3 4 5 6 7 8 91 Faridkot 10830 34632 182375 217007 285516 502523 50252 Kot Kapura 14396 26821 213062 239883 27360 267243 2672
DistTotal (ham) 25227 61453 395438 456891 312876 769767 7698DistTotal (mcm) 252 615 3954 4569 3129
ham hectare metremcm million cubic metre
Aquifer Mapping and Management Plan of Faridkot District Punjab State
Page | 33
50 GROUND WATER ISSUES
51 Ground Water DepletionThe Study area is famous for its paddy and non paddy cultivation The quality of ground
water in the area is suitable for irrigation and drinking purposes therefore the ground water isconstantly being pumped for the irrigation due to its easy access through tube wells at shallowdepths and they are the main source of irrigation This will lead to its deepening of groundwater levels in blocks of Faridkot and Kot Kapura of Faridkot district as the recharge of thegroundwater through rainfall and other sources are less than the overall extraction Thehydrographs also shows the declining water level trend over the years in the district (Fig20) andis categorized as over-exploited This declining water table trend if not checked would assumean alarming situation in the near future affecting agricultural production and thus economyGround Water Recharge and Conservation may be carried out in these areas to overcome thedepletion Other than the groundwater depletion quality and rising water table are the otherissues
Fig20 Long term ground water table variation
52 Rising Water tableIn western parts of the area water table is rising due to less withdrawal of ground water
because of brackish saline quality coupled with easy availability of canal water for domesticand irrigation purposes As such these areas are likely to get water logged in near future Thereis an urgent need to arrest the rising water trend in western part and implement anti-waterlogging schemes
Aquifer Mapping and Management Plan of Faridkot District Punjab State
Page | 34
53 Ground Water QualityThe ground water of the study area is alkaline in nature Ground water in the area is
generally fresh to marginally saline with fluoride concentration above permissible limit (15mgL) are found mainly in Nathuwala (603) Killi (429) Kot Kapura (333) Dhilwan Kalan(285)and Bir Sikhanwala (184) Nitrate concentration above permissible limit (45mgl) are found inSukhanwala (46) Sher singhwala (65) Wara Daraka (66) Dhilwan Kalan (72)Nathuwala (79)Chand Bhaja (79) Bir Sikhanwala (89) Nangal (104) Tehna (118) Dal Singhwala(136) Killi (140)and KotKapura (144) and iron concentration above permissible limit (15 mgL)are observed inDeviwala (177) There is growing concern on deterioration of ground water quality due togeogenic and anthropogenic activities
54 Ground Water Irrigation ScenarioAs per the data available from minor irrigation census 2005-06 the detailed number of
shallow deep tube wells lined unlined water distribution system land holdings of wells aregiven in Table-89 amp10
Table-8 Distribution of Tube wells According to Well Ownerrsquos land holding SizeType of
Tube well(TW)
Marginal(0-1 ha)
Small(1-2 ha)
Semi-Medium(2-4 ha)
Medium(4-10ha)
Big(gt10ha)
Total
Shallow TW 1100 4029 10069 14576 5314 35088
Deep TW 29 197 596 1188 468 2478
Total 1129 4226 10665 15764 5782 37566
Table-9 Distribution of Tube wells According to DepthDepth of Tubewells in metres Total depth
Range0-150m
Depth range 0-20 m 20-40 m 40-60 m 60-70 m 70-90m 90-150m gt150 m
Tubewells 3507 9947 9998 11636 543 1744 191 37566
Tubewells () 9 26 27 31 1 5 1
Table-10 System of Ground water distribution deviceOpen Water Channels
Linedpucca Unlinedkutcha Others Total2093 35455 18 37566
Aquifer Mapping and Management Plan of Faridkot District Punjab State
Page | 35
60 MANAGEMENT STRATEGIES AND AQUIFER MANAGEMENT PLAN
Aquifer mapping is leads to groundwater management plans to be implemented byincluding demand side-management and Ground Water Use Efficiency
An outline of the Aquifer Management Plan for each block is given in Part-II Thisincludes details regarding population rainfall average annual rainfall agriculture and irrigationwater bodies ground water resource availability ground water extraction and water levelbehavior Aquifer disposition and various cross sections have also been given Ground waterresources extraction and other issues including ground water resource enhancement anddemand side innervations have been given
Artificial recharge plan is less feasible in the Faridkot District due to very low availabilityof volume of surplus water (959 mcm) Another focus has been given to minimize the grossdraft by enhancing ground water use efficiency in irrigation system after replacing the waterdistribution system from unlinedkutcha channel to Under Ground Pipeline System (UGPS) inover exploited blocks of the district
61 Scope of ImplementationThis plan is focusing on the technical aspects of the ground water recharge through
various means so that various implementing agencies may get the appropriate technicalguidelines The existingongoing schemes of the central or state govt like MANERGA IWSPPMKSY (Prime Minister Krishi Sinchai Yojna) NABARD funded schemes Urban Developmentschemes departmentally funded projects etc may be benefitted from the recharge plan byincorporating the input in the operational guidelines design and for locating the specific sites
Agriculture University engineering Collages Academic and Research Institution NGOmay also take up the pilot or demonstrative projects in the blocks suitable to them to plan atlocal level as per local conditions
62 Potential of Enhancing the Ground Water Use EfficiencyThe micro level transformation in the ground water management have vast impact
potential to counter extensive ground water depletion faced in the state of Punjab particularlyin overexploited blocks
There are around 35455 (out of 37566) tube wells (9438 ) operated by farmers forirrigation through unlinedKutcha open channel system in study area (Table-10) where waterfrom the tube well is discharge to the agricultural field In this process huge (around 25 )(RKVY 2015) quantity of ground water is wasted in soil moisture and evaporation losses
Around 95 of the tube wells are of shallow depth (20 to 70m) and remaining wells aredeeper depth (70 to gt150 m) existed in the area (Table-9) Thus majority of wells are tappingshallow aquifer which is under stress
Dynamic ground water resources (2013) indicate that Gross ground water draft forirrigation in the district is estimated at 94880 mcm It is expected that around 25 of overdraft can be brought down by switching over to undergroundsurface pipeline based
Aquifer Mapping and Management Plan of Faridkot District Punjab State
Page | 36
distribution from the prevailing unlined open channels Thereby gross draft will be reduced to224 mcm (Table-11a) assuming that there is no crop diversification by the farmers
The benefit will lead to saving of precious ground water resources in overexploitedblocks The measure if implemented will bring down the ground water overdraft from 160 to123 The category of the blocks will also improve resulting in boosting of agriculture andindustrial development otherwise not sustainable in over-exploited blocks (Table-11b)
The tube wells also consume enormous electricity which is subsidized and governmentincur significant revenue on this account The measures therefore will result in saving of energyand money Pollution impact will be reduced whenever diesel engines are used by the farmersThe environmental and ecological condition in the irrigated land will improve Unwanted weedgrowth will also be controlled inside the farm land It is expected to save 1 of the agriculturalland occupied by open channels which can be utilized for cultivation purpose Heavy groundwater overdraft can be reduced by these efforts This will ensure more crops per drop
63 Water saving Potential from Crop Diversification-Change Paddy to MaizeSoya-beanAs the requirement of water for paddy is much high therefore by changing paddy to
maizesoya-bean will help in saving of water For estimating the water saving by cropdiversification it is assumed that one mcm of water will be saved in case of maize or soyabeanplanted in one sq km of land In case of pulses even higher amount of ground water can besaved
The block wise saving of water in mcm by applying various management strategies suchas crop diversification Under Ground Pipe lines (UGPL) in individual land and artificial rechargemethods are given in tables 11a b
Table-11a Scope of Quantitative Impact on Stage of Development after applying variousmanagement strategies in mcm
Block Net GroundWater
Availability(mcm)
TotalIrrigation
Draft(mcm)
PresentStage of
draft(SOD)
() (Asper
2013)
Reduction in draft by different watersaving method
SODafterwards
()
Change ofpaddy
cultivationarea ( ofexisting)
Replacewater
coursesby UGPipes
(mcm)
AdoptArtificialrecharge
(mcm)
ChangePaddy
toMaize(mcm)
Total(mcm)
(2+3+4)
1 2 3 4 5Faridkot 34632 52861 158 12472 484 7245 20201 9969 -
Kot Kapura 26821 42020 162 9915 475 6264 16654 9986 -Total 61453 94880 160 22387 959 13567 36913 9948
Aquifer Mapping and Management Plan of Faridkot District Punjab State
Page | 37
Table-11b Impact on Stage of Development (SOD) after applying various managementstrategies in Faridkot District
Block PresentSOD ()
as on2013
Reductionin SOD ()
afterunlinedchannel
()
ResultantSOD ()
Col(2 - 3)
Reduction inStage of
developmentafter crop
diversificationby
MaizeSoyabean()
ResultantSOD ()
Col(2 - 5)
Reduction inStage of
developmentafter Artificialrecharge ()
ResultantSOD ()
Col(2 - 7)
1 2 3 4 5 6 7 8Faridkot 158 3601 12199 2090 13710 140 15660
KotKapura 162 3697 12503 2340 13860 177 16023
Total 160 3664 12336 2210 13790 178 15822
By adopting all the management strategies resulting in total reduction in stage of groundwaterdevelopment is 6052 Hence overall stage of development afterwards is 9948 and is givenin Table12
Table-12 Overall Stage of Development (SOD) after reduction in Faridkot
Block PresentStage of
development() as on
2013
Reduction instage of
developmentafter unlinedchannel ()
Reduction inStage of
developmentafter crop
diversificationby
MaizeSoyabean()
Reduction inStage of
developmentafter Artificialrecharge ()
TotalReduction in
Stage ofdevelopment
()
(3 +4+5)
Stage ofdevelopmentafterwards
()
(2-6)
1 2 3 4 5 6 7Faridkot 158 3601 2090 140 5831 9969
Kot Kapura 162 3697 2340 177 6214 9986Total 160 3664 2210 178 6052 9948
Aquifer Mapping and Management Plan of Faridkot District Punjab State
Page | 38
70 CONCLUSIONS1 The area lies in the central part of Satluj basin of Indo-Gangetic Alluvial plain
Geologically the area is occupied by a thick sequence of Quaternary deposits of Mid-Pleistocene to Recent age
2 The Principle Aquifer system in the study area is Alluvium and the Major Aquifers areOlder Alluvium and Aeolian Alluvium
3 Lithological characteristics of the area are Multi-cyclic light grey to brown fine tomedium grained mixture of clay silt and sand with Kankar
4 Thick layering of clay with sand at many places can be observed towards south of thedistrict at deeper depths The Ground water occurs in unconfined (water table) andconfined conditions
5 Chemical data of ground water from shallow aquifer indicates that ground water isalkaline and fresh to moderately saline
6 To delineate fresh water - saline water interface laterally as well as vertically surfacegeophysical investigations have been carried out in alluvial tracts
7 To understand the sub surface disposition geological sections and fence diagram havebeen prepared by synthesizing the various sub-surface sections on the basis of study ofthe lithological logs and electrical logs of boreholes drilled by CGWB WRED PSTC andPrivate Agencies using the RockWorks15 software
8 Aquifer IA (Very Shallow Aquifer) extends maximum upto 70 m of depth and below thatclay layer starts getting thickened about 10-12m separating Aquifer IB to a maximumdepth of 123 m Multi layer aquifers are existing in the area each aquifer is separated bythick clay zones of 25 to 40 m upto 300m depth It is very difficult to differentiate theaquifer groups after Aquifer Group I so the whole lithology is considered to be a singleaquifer group system
9 Stage of Ground Water Development of the district is 160 on the basis of Dynamicground water resources 2013 In- storage ground water resources has also beencalculated up to a depth of 300 meters
10 The fresh water resources are inadequate in aquifer upto maximum depth of 106mwhereas saline water is dominant resources below 106 m depth upto 300 m In thenorth of the district towards Faridkot block fresh water is available upto 152m depth
11 Dynamic ground water resources of the study area are 61453 mcm whereas In-storageground water resources up to fresh water zones are 3954 mcm Thus total fresh groundwater resources up to maximum depth of 152 m are 4569 mcm Total saline waterresources up to depth of 300 m are 3129 mcm
12 Main groundwater issues in the area are groundwater depletion quality and risingwater table
13 Considering the high ground water abstraction for irrigation (94880 mcm) andoverdraft (37157 mcm) it is suggested that proposed artificial recharge measures (959mcm) crop diversification measures (13567 mcm) and conserving ground waterthrough laying of underground pipe line (22387 mcm) will be useful
14 Other techniques of water saving and modern irrigation technology to be enforced tomaximize per drop of water use in the district and also to think about the hidden salinewater resources and for its utilizations
Aquifer Mapping and Management Plan of Faridkot District Punjab State
Page | 39
BLOCK WISE
AQUIFER MAPS
AND
MANAGEMENT PLAN
(PART-II)
Aquifer Mapping and Management Plan of Faridkot District Punjab State
Page | 40
I Salient Information of Faridkot Block
Block Area(in Km2)
75210 sq km
District State Faridkot PunjabPopulation Urban Population 2260
Rural Population 179432Total population 181692
Rainfall NormalMonsoon 335 mm
Non-monsoon Rainfall 35 mmAnnual Average Rainfall 349 mm
Agriculture and Irrigation Principal crops Wheat Cotton and PaddyGross cropped area 119562 sq kmNet sown area 59180 sq kmIrrigation practices Canal and Tube well IrrigationCropping intensity 202Area underGround water Irrigation 6159 sq kmSurface water irrigation 51143 sq kmNumber and types of abstraction structures 20927 Tubewells
Ground Water ResourceAvailability and Extraction
Ground water Resources AvailabilityTotal Ground Water Resources available is 5025 mcm (fresh andsaline water) up to the depth of 300m The fresh water resourcesare estimated up to the depth of 152 m on the basis of geophysicalinterpretations The potential granular zones available for freshwater are calculated as 72 m Saline water resources are estimatedon the basis of available well depth (up to 300 m) and the granularzones are counted after depth of 152 m and available zones are 103m Block is categorized as Over-Exploited as per DynamicGroundwater Resources 2013 assessment
Ground water Resources ExtractionDeeper aquifers are marginal to highly saline and not suitable forirrigation purpose as such all users are tapping shallow aquifersDrinking water supply wells of State Government tapping shallowaquifers Therefore the ground water draft could not be assessed fordeeper aquifer
Aquifer Mapping and Management Plan of Faridkot District Punjab State
Page | 41
Existing and future waterdemands
Existing Gross Ground water Draft as on 2013Irrigation 52861 mcmDomestic and industrial water supply 1911 mcmFuture water demandsIrrigation development potential (-)2045 mcmDomestic and industrial water supply up to 2025 years 2219 mcm
Water level behavior Aquifer wise water levelAquifer-IPre Monsoon 145 ndash 1522 m bglPost Monsoon 120 ndash 1310 m bglMean (10 yrs) 100 ndash (-)101 myrTrendsPre Monsoon 018 ndash (-)022 myrPost Monsoon 024 ndash (-)030 myrAquifer-IINo Monitoring stations
Aquifer-IIINo Monitoring stations
HYDROGRAPH SHOWING DECLINING WATER TABLE
Aquifer Mapping and Management Plan of Faridkot District Punjab State
Page | 42
HYDROGRAPH SHOWING DECLINING WATER TABLE
HYDROGRAPH SHOWING DECLINING WATER TABLE
Monitoring well Golewala dried after 2004
Aquifer Mapping and Management Plan of Faridkot District Punjab State
Page | 43
Aquifer Disposition
Number of aquifers 1
Principal aquifer AlluviumMajor Aquifer Older Alluvium Aeolian Alluvium
Exploratory Data AvailabilitySource of Data No of exploration wells as per depth range (m) Total
lt100 100-200 200-300 gt300
CGWB 1 0 0 4 5WREDPSTCWSS 6 1 0 2 9PRIVATE 0 0 0 0 0TOTAL 7 1 0 6 14
Aquifer wise Characteristics (CGWB 2012)AquiferGroup
Geology Type ofAquifer
ThicknessofGranularzones (m)
Transmissivity(m2day)
YieldDischarge
(m3day)
SpecificYield
Storativity
SingleAquiferSystem
Quarter-naryAlluvialdeposits
Unconfined toconfined
175 474 - 2660 939 -55944
12 (0072)
175 x 10-3
-18 x 10-3
Well field proposed in adjacent blockThe Aquifer comprises of fresh and saline water and the major aquifer material is sand Theaquiclude and aquitard comprises of clay clay with siltExploratory Data Validated
Source of Data No of exploration wells as per depth range (m) Totallt100 100-200 200-300 gt300
CGWB 0 0 0 4 4WREDPSTCWSS 0 0 0 2 2PRIVATE 0 0 0 0 0TOTAL 0 0 0 6 6
The data is validated by selecting the deepest well in each quadrant and used for preparation of3-D Litho models 2-D Geological Cross Sections Fence Diagrams and Aquifer Maps
Aquifer Mapping and Management Plan of Faridkot District Punjab State
Page | 44
3-D Lithological Model of Faridkot Block
Lithological Cross Section from Dip Singh Wala to Nangal
Lithological Cross Section from Toot to Nangal
Aquifer Mapping and Management Plan of Faridkot District Punjab State
Page | 45
3-D Lithological Fence Diagram
3-D Aquifer Disposition Fence Diagram
Aquifer Mapping and Management Plan of Faridkot District Punjab State
Page | 45
3-D Lithological Fence Diagram
3-D Aquifer Disposition Fence Diagram
Aquifer Mapping and Management Plan of Faridkot District Punjab State
Page | 45
3-D Lithological Fence Diagram
3-D Aquifer Disposition Fence Diagram
Aquifer Mapping and Management Plan of Faridkot District Punjab State
Page | 46
Ground water Resource Extraction Contamination and other issues in Faridkot Block
Ground WaterResources upto thedepth of 300m
Dynamic Fresh waterresources
34632 mcm
In-storage Fresh waterresources
182375 mcm
In-storage Saline waterresources
285516 mcm
Total 502523 mcmGround WaterExtraction (as per 2013)
Irrigation 52861 mcm
Domestic amp Industrial 1911 mcm
Future Demand for domestic amp Industrial sector(2025) (as per 2013)
2219 mcm
Stage of Groundwater Development 158
Chemical Quality of ground water Ground water in the area is alkaline and pHranges between 794 to 917 Groundwater in the area is fresh to marginal salineEC value of ground water show widevariations and ranges from 444 Scm to8653Scm at 250CRSC values vary from (ndash) 73 to 113 meqLarea is fit for irrigation
Ground water Contamination Issues Fluoride (mgl)Nathuwala (603) Killi(429)Nitrate (mgl)Sukhanwala (46) Sher Singhwala (65)Nathuwala (79) Chand Baja (79) Nangal(104) Tehna (118) Killi (140)Iron (mg)Devi wala (177)
Other issues Water level decline has been observed inmajor parts of the block due to indiscriminate development of ground waterresourcesIn shallow water level area lessdevelopment of ground water resourcecouple with recharge from canal irrigationis causing water logging and inland salinityproblems
Aquifer Mapping and Management Plan of Faridkot District Punjab State
Page | 47
Ground water Resource Enhancement Potential
Aquifer wise space available for recharge and proposed interventions (Supply Side Measures)
Aquifer-I
Volumes of unsaturated zone after 3m upto a desirable depth 10830 mcmSource water requirementavailability for recharge Rain Canal Irrigation return flowTypes and number of structures NAOther interventions proposed Artificial Recharge Roof top Rainwater harvesting will conserve484 mcm volume of water
Demand side interventions
Advanced Irrigation PracticesArea proposed to be covered Entire Block Faridkot (75210 sq km)Volume of Water expected to be conserved under advanced irrigation practices such as lining ofunderground pipelines (Kutcha channel) 12472 mcm
Required Change in cropping pattern
Proposed change in cropping pattern Paddy to Maize Soyabean The overexploitation can bemanaged at sustainable level (100) by changing the Paddy cropArea coverage 15 of the total paddy area needs to change ie7245 sq kmAnticipated volume of water to be saved 7245 mcm
Net AnnualGroundWater
Availability2013
(mcm)
TotalIrrigation Draft
(present)(mcm)
GrossDraft alluses(present)(mcm)
Paddyarea
(Sq km)
RequiredArea to
beChange
fromPaddy toMaize
soyabean
(Sq km)
Amountof
WaterSaved(mcm)
Grossdraftafter
savingof water(mcm)
PresentStage of
development ()
Reductionin Stage ofdevelopme
nt afterMaize
soya bean()
CropDiversifiedarea ()
34632 52861 54771 48300 7245 7245 45616 158 209 15
Alternate Water sourcesSurface water sources Tanks PondsLocation details and availability from such sources outside the area Not AvailableRegulation and Control
Punjab Subsoil Act for delay in paddy plantation should continue in the area
Aquifer Mapping and Management Plan of Faridkot District Punjab State
Page | 48
Other interventions proposed if anyModern Irrigation Practices be adopted for Rabi crops Some of the techniques are given in
the table below (PAU Ludhiana)
SlNo Techniques Water Saving()
Crops
1 Mulching 17 Wheat2 Bed Planting 18-25 Wheat3 Use of Sprinkler and drip
Irrigation70-90 Sugarcane Cotton Sunflower Maize
Other than that by 15 days ponding followed by 2 days of drying can lead to 25 saving of water inpaddy crop
Aquifer Mapping and Management Plan of Faridkot District Punjab State
Page | 49
II Salient Information of Kot Kapura Block
Block Area(in Km2)
66650 sq km
District State Faridkot PunjabPopulation Urban Population 373
Rural Population 221025Total population 221398
Rainfall Normal Monsoon 328 mmNon-monsoon Rainfall 61 mmAnnual Average Rainfall 370 mm
Agriculture and Irrigation Principal crops Wheat Cotton and PaddyGross cropped area 133427 sq kmNet sown area 67498 sq kmIrrigation practices Canal and Tube well IrrigationCropping intensity 198Area underGround water Irrigation 4278 sq kmSurface water irrigation 62899 sq kmNumber and types of abstraction structures 16639 Tubewells
Ground Water ResourceAvailability and Extraction
Ground water Resources AvailabilityTotal Ground Water Resources available is 2672 mcm (fresh andsaline water) up to the depth of 300 m The fresh water resourcesare estimated up to the depth of 106 m on the basis of geophysicalinterpretations The potential granular zones available for freshwater are 51 m Saline water resources are estimated on the basis ofwell (up to 300 m) and the granular zones are counted after depth of106 m and available zones are 76 m Block is categorized as Over-Exploited as per Dynamic Groundwater Resources 2013 assessment
Ground water Resources ExtractionDeeper aquifers are marginal to highly saline and not suitable forirrigation purpose as such all users are tapping shallow aquifersDrinking water supply wells of State Government tapping shallowaquifers Therefore the ground water draft could not be assessed fordeeper aquifer
Aquifer Mapping and Management Plan of Faridkot District Punjab State
Page | 50
Existing and future waterdemands
Existing Gross Ground water Draft as on 2013Irrigation 42020 mcmDomestic and industrial water supply 1402 mcmFuture water demandsIrrigation development potential (-)16709 mcmDomestic and industrial water supply up to 2025 years 1511 mcm
Water level behavior Aquifer wise water levelAquifer-IPre Monsoon 235 ndash 1600 m bglPost Monsoon 155 ndash 1820 m bglMean (10 yrs) 158 ndash (-)086 myrTrendsPre Monsoon 016 ndash (-)026 myrPost Monsoon 015 ndash (-)029 myrAquifer-II (156m)Pre Monsoon 772 m bglPost Monsoon 805 m bglAquifer-III (269m)Pre Monsoon NAPost Monsoon 820 m bgl
HYDROGRAPH SHOWING DECLINING WATER TABLE
Aquifer Mapping and Management Plan of Faridkot District Punjab State
Page | 51
HYDROGRAPH SHOWING DECLINING WATER TABLE
HYDROGRAPH SHOWING DECLINING WATER TABLE
Aquifer Mapping and Management Plan of Faridkot District Punjab State
Page | 52
Aquifer Disposition
Number of aquifers 1
Principal aquifer AlluviumMajor Aquifer Older Alluvium Aeolian Alluvium
Exploratory Data AvailabilitySource of Data No of exploration wells as per depth range (m) Total
lt100 100-200 200-300 gt300
CGWB 2 1 1 4 8WREDPSTCWSS 8 0 0 1 9PRIVATE 1 0 1 0 2TOTAL 11 1 2 5 19
Aquifer wise Characteristics (CGWB2015)AquiferGroup
Geology Type ofAquifer
ThicknessofGranularzones (m)
Transmi-ssivity(m2day)
Yield(m3day)
SpecificYield
Storativity
SingleAquiferSystem
QuaternaryAlluvialdeposits
Unconfinedto confined
127 547 -2990
3668 12 (0072) 72x10-4
Well field proposed in this block (Site Location Deviwala)The Aquifer comprises of fresh and saline water and the major aquifer material is sand Theaquiclude and aquitard comprises of clay clay with siltExploratory Data Validated
Source of Data No of exploration wells as per depth range (m) Totallt100 100-200 200-300 gt300
CGWB 0 0 1 4 5WREDPSTCWSS 0 0 0 1 1PRIVATE 0 0 1 0 1TOTAL 0 0 2 5 7
The data is validated by selecting the deepest well in each quadrant and used for preparation of3-D Litho models 2-D Geological Cross Sections Fence Diagrams and Aquifer Maps
Aquifer Mapping and Management Plan of Faridkot District Punjab State
Page | 53
3-D Lithological model of Kot Kapura Block
Lithological Cross section from Wara Daraka to Aulakh
Lithological Cross section from Nangal to Dal Singhwala
Aquifer Mapping and Management Plan of Faridkot District Punjab State
Page | 54
3-D Lithological Fence Diagram
3-D Aquifer Disposition Fence Diagram
Aquifer Mapping and Management Plan of Faridkot District Punjab State
Page | 54
3-D Lithological Fence Diagram
3-D Aquifer Disposition Fence Diagram
Aquifer Mapping and Management Plan of Faridkot District Punjab State
Page | 54
3-D Lithological Fence Diagram
3-D Aquifer Disposition Fence Diagram
Aquifer Mapping and Management Plan of Faridkot District Punjab State
Page | 55
Ground water Resource Extraction Contamination and other issues in Kot Kapura Block
Ground WaterResources upto thedepth of 300m
Dynamic Fresh waterresources
26821 mcm
In-storage Fresh waterresources
213062 mcm
In-storage Saline waterresources
27360 mcm
Total 267243 mcmGround WaterExtraction (as per 2013)
Irrigation 42020 mcm
Domestic amp Industrial 1402 mcm
Future Demand for domestic amp Industrial sector(2025) (as per 2013)
1511 mcm
Stage of Groundwater Development 162
Chemical Quality of ground water Ground water in the area is alkaline and pHranges between 820 to 893 Ground waterin the area is slightly fresh to marginalsaline EC value of the ground water showwide variations and ranges from 1154Scm to 3988 Scm at 250CRSC values are varies from -003 to 1100meqL and the area is fit for irrigation
Ground water Contamination Issues Fluoride (mgl)Kot Kapura (333) Dhilwan kalan (285)Moharewala ( 195) Bir Sikhanwala ( 184)Nitrate (mgl)Wara Daraka (66) Dhilwan Kalan (72)Moharewala (78) Bir sikhan wala (89)KotKapura (144)
Other issues Water level decline has been observed inmajor parts of the block due to indiscriminate development of ground waterresourcesIn shallow water level area lessdevelopment of ground water resourcecouple with recharge from canal irrigation iscausing water logging and inland salinityproblems
Aquifer Mapping and Management Plan of Faridkot District Punjab State
Page | 56
Ground water Resource Enhancement Potential
Aquifer wise space available for recharge and proposed interventions (Supply Side Measures)
Aquifer-I
Volume of unsaturated zone after 3m upto a desirable depth 14396 mcmSource water requirementavailability for recharge Rain Canal Irrigation return flowTypes and number of structures NAOther interventions proposed Artificial Recharge Roof top Rainwater harvesting will conserve475 mcm volume of water
Demand side interventions
Advanced Irrigation PracticesArea proposed to be covered Entire Kot Kapura Block (66650 sq km)Volume of Water expected to be conserved under advanced irrigation practices such as lining ofunderground pipelines (Kutcha channel) etc 9915 mcm
Required Change in cropping pattern
Proposed change in cropping pattern Rice to Maize Soyabean The overexploitation can bemanaged at sustainable level (100) by changing the Paddy cropArea coverage 12 of the total rice area needs to change ie 6264 sq kmAnticipated volume of water to be saved 6264 mcm
Net AnnualGroundWater
Availability2013
(mcm)
TotalIrrigation Draft
(present)(mcm)
GrossDraft alluses(present)(mcm)
Paddyarea
(Sq km)
RequiredArea to be
Changefrom
Paddy toMaize
soya bean(Sq km)
Amountof
WaterSaved(mcm)
Grossdraftafter
savingof water(mcm)
PresentStage of
development ()
Reductionin Stage ofdevelopme
nt afterMaize
soya bean()
CropDiversifiedarea ()
26821 42020 43421 52200 6264 6264 35756 162 234 12
Alternate Water sourcesSurface water sources Tanks PondsLocation details and availability from such sources outside the area Not AvailableRegulation and Control
Punjab Subsoil Act for delay in paddy plantation should continue in the area
Other interventions proposed if anyModern Irrigation Practices be adopted for Rabi crops Some of the techniques are given in
the table below (PAU Ludhiana)
Aquifer Mapping and Management Plan of Faridkot District Punjab State
Page | 57
SlNo Techniques Water Saving()
Crops
1 Mulching 17 Wheat2 Bed Planting 18-25 Wheat3 Use of Sprinkler and drip
Irrigation70-90 Sugarcane Cotton Sunflower Maize
Other than that by 15 days ponding followed by 2 days of drying can lead to 25 saving of water inpaddy crop
Aquifer Mapping and Management Plan of Faridkot District Punjab State
Page | 58
Annexure-I
Nd Not Determined BDL Below Detection Limit
Aquifer Mapping and Management Plan of Faridkot District Punjab State
Page | 59
Annexure-IIData Availability of Exploration Wells of Faridkot district
SlNo LOCATION LONGITUDE LATITUDE DEPTH ELEVATION BLOCK DEPARTMENT1 Dal Singhwala 74950 30469 300 211 Kot Kapura CGWB2 Dip Singh Wala 74483 30742 300 201 Faridkot CGWB3 Golewala 74692 30792 300 1995 Faridkot CGWB4 Jaito Mandi 74891 30446 300 203 Kot Kapura CGWB5 Kot Kapura 74814 30576 300 206 Kot Kapura CGWB6 Nanak Nagri 74893 30581 200 210 Kot Kapura PRIVATE7 Nangal 74869 30669 300 206 Faridkot CGWB8 Tehna 74790 30690 300 205 Faridkot CGWB9 Wara Daraka 74797 30548 300 205 Kot Kapura CGWB
10 Aulakh 74920 30643 300 211 Kot Kapura PSTC11 Bhagthala 74786 30777 300 198 Faridkot PSTC12 Sadhuwala 74559 30717 300 196 Faridkot PSTC13 Deviwala 74870 30612 269 207 Kot Kapura CGWB14 Deviwala-I 74870 30612 156 207 Kot Kapura CGWB15 Kouni 74675 30760 60 194 Faridkot WSS16 Ghugiana 74639 30746 60 198 Faridkot WSS17 Pahluwala 74763 30799 60 203 Faridkot WSS18 Faridkot 74763 30681 60 203 Faridkot WSS19 Doda Bhundar 75016 30470 121 212 Kot Kapura WRED20 Dhudi 74849 30700 60 207 Faridkot WSS21 Ratti Rori 74811 30647 60 208 Faridkot WSS22 Chak Kalyan 74705 30572 60 203 Kot Kapura WSS23 Kot Kapura 74812 30596 60 208 Kot Kapura WSS24 Behbal Kalan 74913 30531 60 210 Kot Kapura WSS25 Rorian Kapura 74815 30439 60 207 Kot Kapura WSS26 Panjgrain 74914 30608 70 211 Kot Kapura PRIVATE27 Fatehgarh 74943 30405 60 208 Kot Kapura WSS
28Bhurj JawarSingh 74987 30535 60 211 Kot Kapura WRED
29 Dewarana 74766 30593 30 206 Kot Kapura WRED30 Sher Singhwala 74628 30665 65 195 Faridkot CGWB31 Bir Sikhan wala 74849 30627 65 207 Kot Kapura CGWB32 Dohak 74603 30632 163 197 Muktsar CGWB33 Toot 74645 30829 217 196 Ghal khurd CGWB
Two exploratory wells from adjacent districts ie Dohak from Muktsar district and Toot fromFerozpur district have been incorporated for the preparation of lithological fence and crosssections
Aquifer Mapping and Management Plan of Faridkot District Punjab State
Page | 60
Annexure-IIILITHOLOGICAL DATA OF WELLS IN FARIDKOT DISTRICT
Well Location Depth from Depth to Lithology Thickness
Dal Singhwala
0 13 Clay 1313 20 Fresh Sand 720 28 Clay 828 57 Fresh Sand 2957 64 Clay 764 75 Saline Sand 1175 78 Clay 378 97 Saline Sand 1997 108 Clay 11
108 117 Saline Sand 9117 122 Clay 5122 134 Saline Sand 12134 157 Clay 23157 173 Saline Sand 16173 179 Clay 6179 184 Saline Sand 5184 211 Clay 27211 219 Saline Sand 8219 253 Clay 34253 259 Saline Sand 6259 278 Clay 19278 293 Saline Sand 15293 298 Clay 5298 300 Saline Sand 2
Dip Singh Wala
0 8 Fresh Sand 88 36 Clay 28
36 68 Fresh Sand 3268 755 Clay 75
755 805 Fresh Sand 5805 83 Clay 2583 92 Fresh Sand 992 93 Clay 193 109 Saline Sand 16
109 113 Clay 4113 116 Saline Sand 3116 120 Clay 4120 132 Saline Sand 12
Aquifer Mapping and Management Plan of Faridkot District Punjab State
Page | 61
Dip Singh Wala 132 146 Clay 14146 162 Saline Sand 16162 168 Clay 6168 192 Saline Sand 24192 195 Clay 3195 197 Saline Sand 2197 2015 Clay 45
2015 209 Saline Sand 75209 2135 Clay 45
2135 2175 Saline Sand 42175 221 Clay 35221 237 Saline Sand 16237 2865 Clay 495
2865 2895 Saline Sand 32895 293 Clay 35293 296 Saline Sand 3296 300 Clay 4
Golewala
0 75 Clay 7575 2885 Fresh Sand 2135
2885 40 Clay 111540 525 Fresh Sand 125
525 60 Clay 7560 88 Saline Sand 2888 93 Clay 593 103 Saline Sand 10
103 1325 Clay 2951325 1375 Saline Sand 51375 155 Clay 175155 1575 Saline Sand 25
1575 182 Clay 245182 2035 Saline Sand 215
2035 2285 Clay 252285 234 Saline Sand 55234 253 Clay 19253 2725 Saline Sand 195
2725 280 Clay 75280 2975 Saline Sand 175
2975 300 Clay 25Jaito Mandi 0 15 Clay 15
15 25 Fresh Sand 1025 28 Clay 3
Aquifer Mapping and Management Plan of Faridkot District Punjab State
Page | 62
Jaito Mandi 28 42 Fresh Sand 1442 46 Clay 446 59 Fresh Sand 1359 80 Clay 2180 915 Fresh Sand 115
915 103 Clay 115103 107 Fresh Sand 4107 1555 Clay 485
1555 1715 Fresh Sand 161715 191 Clay 195191 213 Saline Sand 22213 220 Clay 7220 223 Saline Sand 3223 238 Clay 15238 255 Saline Sand 17255 273 Clay 18273 2785 Saline Sand 55
2785 2805 Clay 22805 283 Saline Sand 25283 2985 Clay 155
2985 300 Saline Sand 15
Kot Kapura
0 14 Clay 1414 21 Fresh Sand 721 25 Clay 425 355 Fresh Sand 105
355 37 Clay 1537 50 Fresh Sand 1350 57 Clay 757 64 Fresh Sand 764 69 Clay 569 77 Fresh Sand 877 88 Clay 1188 99 Fresh Sand 1199 103 Clay 4
103 106 Saline Sand 3106 123 Clay 17123 1286 Saline Sand 56
1286 130 Clay 14130 1326 Saline Sand 26
1326 134 Clay 14134 1355 Saline Sand 15
Aquifer Mapping and Management Plan of Faridkot District Punjab State
Page | 63
Kot Kapura
1355 1492 Clay 1371492 1518 Saline Sand 261518 155 Clay 32155 1584 Saline Sand 34
1584 161 Clay 26161 1796 Saline Sand 186
1796 1812 Clay 161812 1838 Saline Sand 261838 1865 Clay 271865 2045 Saline Sand 182045 207 Clay 25207 2125 Saline Sand 55
2125 249 Clay 365249 2545 Saline Sand 55
2545 280 Clay 255280 2944 Saline Sand 144
2944 300 Clay 56
Nanak Nagri
0 136 Clay 136136 208 Fresh Sand 72208 265 Clay 57265 305 Fresh Sand 4305 34 Clay 3534 368 Fresh Sand 28
368 388 Clay 2388 40 Fresh Sand 1240 428 Clay 28
428 46 Fresh Sand 3246 695 Clay 235
695 712 Fresh Sand 17712 785 Clay 73785 815 Fresh Sand 3815 84 Clay 2584 87 Fresh Sand 387 92 Clay 592 936 Saline Sand 16
936 988 Clay 52988 100 Saline Sand 12100 1085 Clay 85
1085 1115 Saline Sand 31115 118 Clay 65118 120 Saline Sand 2
Aquifer Mapping and Management Plan of Faridkot District Punjab State
Page | 64
Nanak Nagri 120 128 Clay 8128 1296 Saline Sand 16
1296 130 Clay 04130 1316 Saline Sand 16
1316 135 Clay 34135 1368 Saline Sand 18
1368 165 Clay 282165 1676 Saline Sand 26
1676 184 Clay 164184 1868 Saline Sand 28
1868 1905 Clay 371905 1948 Saline Sand 431948 2134 Clay 186
Nangal
0 8 Clay 88 20 Fresh Sand 12
20 23 Clay 323 28 Fresh Sand 528 29 Clay 129 41 Fresh Sand 1241 72 Clay 3172 80 Fresh Sand 880 91 Clay 1191 124 Fresh Sand 33
124 151 Clay 27151 158 Fresh Sand 7158 163 Clay 5163 171 Fresh Sand 8171 181 Clay 10181 187 Fresh Sand 6187 193 Clay 6193 199 Fresh Sand 6199 203 Clay 4203 219 Fresh Sand 16219 224 Clay 5224 233 Saline Sand 9233 243 Clay 10243 249 Saline Sand 6249 251 Clay 2251 257 Saline Sand 6257 300 Clay 43
Tehna 0 8 Clay 8
Aquifer Mapping and Management Plan of Faridkot District Punjab State
Page | 65
Tehna
8 23 Fresh Sand 1523 28 Clay 528 32 Fresh Sand 432 37 Clay 537 41 Fresh Sand 441 59 Clay 1859 63 Fresh Sand 463 69 Clay 669 72 Fresh Sand 372 102 Clay 30
102 106 Fresh Sand 4106 120 Clay 14120 123 Fresh Sand 3123 133 Clay 10133 136 Fresh Sand 3136 145 Clay 9145 150 Fresh Sand 5150 158 Clay 8158 163 Fresh Sand 5163 168 Clay 5168 172 Fresh Sand 4172 176 Clay 4176 184 Fresh Sand 8184 210 Clay 26210 215 Fresh Sand 5215 221 Clay 6221 225 Fresh Sand 4225 254 Clay 29254 264 Fresh Sand 10264 267 Clay 3267 275 Fresh Sand 8275 294 Clay 19294 300 Fresh Sand 6
Wara Daraka
0 15 Clay 1515 22 Fresh Sand 722 28 Clay 628 48 Fresh Sand 2048 52 Clay 452 61 Fresh Sand 961 65 Clay 465 75 Fresh Sand 10
Aquifer Mapping and Management Plan of Faridkot District Punjab State
Page | 66
Wara Daraka
75 84 Clay 984 86 Saline Sand 286 91 Clay 591 97 Saline Sand 697 101 Clay 4
101 119 Saline Sand 18119 124 Clay 5124 129 Saline Sand 5129 150 Clay 21150 172 Saline Sand 22172 184 Clay 12184 188 Saline Sand 4188 196 Clay 8196 205 Saline Sand 9205 234 Clay 29234 239 Saline Sand 5239 274 Clay 35274 281 Saline Sand 7281 300 Clay 19
Aulakh
0 1829 Clay 18291829 4573 Fresh Sand 27444573 7621 Clay 30487621 9146 Fresh Sand 15259146 10975 Clay 1829
10975 1128 Saline Sand 3051128 13414 Clay 2134
13414 16768 Saline Sand 335416768 20112 Clay 334420112 21036 Saline Sand 92421036 21341 Clay 30521341 21951 Saline Sand 6121951 2256 Clay 6092256 245 Saline Sand 194245 300 Clay 55
Bhagthala
0 35 Clay 3535 1829 Fresh Sand 1479
1829 41 Clay 227141 53 Fresh Sand 1253 63 Clay 1063 8537 Saline Sand 2237
8537 92 Clay 663
Aquifer Mapping and Management Plan of Faridkot District Punjab State
Page | 67
92 102 Saline Sand 10102 1311 Clay 291
1311 13415 Saline Sand 30513415 16768 Clay 335316768 17073 Saline Sand 30517073 185 Clay 1427
185 203 Saline Sand 18203 22866 Clay 2566
22866 23476 Saline Sand 6123476 253 Clay 1824
253 273 Saline Sand 20273 280 Clay 7280 294 Saline Sand 14294 300 Clay 6
Sadhuwala
0 61 Fresh Sand 6161 3049 Clay 2439
3049 52 Saline Sand 215152 625 Clay 105
625 725 Saline Sand 10725 77 Clay 4577 84 Saline Sand 784 91 Clay 791 107 Saline Sand 16
107 110 Clay 3110 114 Saline Sand 4114 118 Clay 4118 130 Saline Sand 12130 14339 Clay 1339
14339 16463 Saline Sand 212416463 17683 Clay 12217683 207 Saline Sand 3017
207 2115 Clay 452115 2155 Saline Sand 42155 219 Clay 35219 235 Saline Sand 16235 237 Clay 2237 25624 Saline Sand 1924
25624 27134 Clay 15127134 300 Saline Sand 2866
Deviwala0 15 Clay 15
15 23 Fresh Sand 8
Aquifer Mapping and Management Plan of Faridkot District Punjab State
Page | 68
Deviwala
23 38 Clay 1538 46 Fresh Sand 846 48 Clay 248 53 Fresh Sand 553 61 Clay 861 65 Fresh Sand 465 72 Clay 772 78 Fresh Sand 678 94 Clay 1694 106 Fresh Sand 12
106 109 Clay 3109 112 Saline Sand 3112 128 Clay 16128 140 Saline Sand 12140 158 Clay 18158 163 Saline Sand 5163 179 Clay 16179 183 Saline Sand 4183 187 Clay 4187 196 Saline Sand 9196 202 Clay 6202 213 Saline Sand 11213 218 Clay 5218 223 Saline Sand 5223 252 Clay 29252 258 Saline Sand 6258 263 Clay 5263 269 Saline Sand 6
Dohak
0 8 Clay 88 10 Fresh Sand 2
10 21 Clay 1121 33 Saline Sand 1233 41 Clay 841 79 Saline Sand 3879 89 Clay 1089 95 Saline Sand 695 99 Clay 499 112 Saline Sand 13
112 116 Clay 4116 139 Saline Sand 23139 154 Clay 15
Aquifer Mapping and Management Plan of Faridkot District Punjab State
Page | 69
154 163 Saline Sand 9
Toot
0 15 Clay 1515 198 Fresh Sand 48
198 21 Clay 1221 474 Fresh Sand 264
474 51 Clay 3651 552 Fresh Sand 42
552 626 Clay 74626 766 Fresh Sand 14766 101 Clay 244101 104 Fresh Sand 3104 113 Clay 9113 116 Fresh Sand 3116 143 Clay 27143 146 Saline Sand 3146 167 Clay 21167 170 Saline Sand 3170 182 Clay 12182 204 Saline Sand 22204 214 Clay 10214 217 Saline Sand 3
Aquifer Mapping and Management Plan of Faridkot District Punjab State
Page | 70
Annexure-IVAQUIFER GROUPING OF WELL LOCATIONS IN FARIDKOT DISTRICT
Well location Depth from Depth to Aquifer Thickness FreshGranular
Zones
SalineGranular
Zones
Dal Singhwala
0 15 Unsaturated Zone 15 215 57 Aquifer Group-IA 42 3457 64 Aquiclude-IA 764 134 Aquifer Group-IB 70 51
134 157 Aquiclude-IB 23157 300 Multiple Aquifers 143 52
Dip Singh Wala
0 5 Unsaturated Zone 5 55 68 Aquifer Group-IA 63 35
68 755 Aquiclude-IA 75755 132 Aquifer Group-IB 565 14 31132 146 Aquiclude-IB 14146 300 Multiple Aquifers 154 755
Golewala
0 4 Unsaturated Zone 4 14 525 Aquifer Group-IA 485 33
525 60 Aquiclude-IA 7560 103 Aquifer Group-IB 43 38
103 155 Aquiclude-IB 52155 300 Multiple Aquifers 145 665
Jaito Mandi
0 14 Unsaturated Zone 14 114 59 Aquifer Group-IA 45 3759 80 Aquiclude-IA 2180 107 Aquifer Group-IB 27 155
107 1555 Aquiclude-IB 4851555 300 Multiple Aquifers 1445 16 515
Kot Kapura
0 9 Unsaturated Zone 9 29 77 Aquifer Group-IA 68 455
77 88 Aquiclude-IA 1188 106 Aquifer Group-IB 18 11 3
106 155 Aquiclude-IB 49155 300 Multiple Aquifers 145 68
Nanak Nagri
0 12 Unsaturated Zone 12 112 46 Aquifer Group-IA 34 18446 69 Aquiclude-IA 2369 131 Aquifer Group-IB 62 77 11
131 165 Aquiclude-IB 34165 2134 Multiple Aquifers 484 97
Nangal 0 9 Unsaturated Zone 9 1
Aquifer Mapping and Management Plan of Faridkot District Punjab State
Page | 71
Nangal
9 41 Aquifer Group-IA 32 2941 72 Aquiclude-IA 3172 124 Aquifer Group-IB 52 41
124 151 Aquiclude-IB 27151 300 Multiple Aquifers 149 43 21
Tehna
0 10 Unsaturated Zone 10 210 41 Aquifer Group-IA 31 18741 59 Aquiclude-IA 1859 106 Aquifer Group-IB 47 33
106 158 Aquiclude-IB 52158 300 Multiple Aquifers 142 50
Wara Daraka
0 4 Unsaturated Zone 4 04 75 Aquifer Group-IA 71 46
75 84 Aquiclude-IA 984 129 Aquifer Group-IB 45 31
129 150 Aquiclude-IB 21150 300 Multiple Aquifers 150 47
Aulakh
0 17 Unsaturated Zone 17 217 46 Aquifer Group-IA 29 2646 76 Aquiclude-IA 3076 113 Aquifer Group-IB 37 1525 305
113 134 Aquiclude-IB 21134 300 Multiple Aquifers 166 6828
Bhagthala
0 4 Unsaturated Zone 4 14 53 Aquifer Group-IA 49 24
53 63 Aquiclude-IA 1063 102 Aquifer Group-IB 39 3237
102 168 Aquiclude-IB 66168 300 Multiple Aquifers 132 6115
Sadhuwala
0 5 Unsaturated Zone 5 55 52 Aquifer Group-IA 47 2151
52 63 Aquiclude-IA 1163 130 Aquifer Group-IB 67 49
130 144 Aquiclude-IB 14144 300 Multiple Aquifers 156 11931
Deviwala
0 8 Unsaturated Zone 8 28 78 Aquifer Group-IA 70 31
78 94 Aquiclude-IA 1694 112 Aquifer Group-IB 18 12 3
112 128 Aquiclude-IB 16128 269 Multiple Aquifers 141 58
Aquifer Mapping and Management Plan of Faridkot District Punjab State
Page | 72
Dohak
0 3 Unsaturated Zone 3 03 79 Aquifer Group-IA 76 2 50
79 89 Aquiclude-IA 1089 139 Aquifer Group-IB 50 42
139 154 Aquiclude-IB 15154 163 Multiple Aquifers 9 9
Toot
0 9 Unsaturated Zone 9 19 55 Aquifer Group-IA 46 354
55 63 Aquiclude-IA 863 116 Aquifer Group-IB 53 25
116 143 Aquiclude-IB 27143 217 Multiple Aquifers 74 31
- कदरीय भमि जल बोरड
-
- जल ससाधन नदी विकास और गगा सरकषण मतरालय
- भारत सरकार
-
- contents naquim faridkotpdf (p1-5)
- Final Faridkot edited 170317pdf (p6-77)
-

Aquifer Mapping and Management Plan of Faridkot District Punjab State
Page | 20
30 DATA INTERPRETATION INTEGRATION AND AQUIFER MAPPINGAll the available data have been validated to generate aquifer map The deepest well in
each quadrant is selected and plotted on the map of 150000 scale with 5rsquoX5rsquogrid (9 x 9) km(Fig11)
Fig11 Locations of validated exploration data
The optimized wells of CGWB PWRDM WRED WSS and Private Wells have been usedto prepare the elevation or collar elevation map to identify the topographic variations onground surface so that it can give the synoptic picture of gradient variations in the water levels
Aquifer Mapping and Management Plan of Faridkot District Punjab State
Page | 21
The topographic elevation values have been plotted to prepare the elevation contour map(Fig12) The locations of validated wells in quadrant and toposheet wise distributions inrespective blocks are given in Table-2 Locations of validated exploratory wells with litholog areshown in Fig13
Fig12 Elevation contour map
Fig13 Locations of validated exploratory wells with Litholog
Aquifer Mapping and Management Plan of Faridkot District Punjab State
Page | 22
Table -2 Summary of optimized exploration wells
Block ToposheetQuadrant Depth Range (m) Elevation(m amsl)
Source ofdata
Location lt 100 100-200 200-300 gt300Faridkot 1A 44J06 Dip Singh Wala - - - 350 201 CGWBFaridkot 3C 44J09 Golewala - - - 34378 1995 CGWBFaridkot 1A 44J14 Tehna - - - 300 205 CGWBFaridkot 3A 44J14 Bhagthala - - - 37195 198 PSTCFaridkot 1A 44J10 Sadhuwala - - - 35970 196 PSTCKot Kapura 1C 44J15 Dal Singhwala - - - 300 211 CGWBKot Kapura 1B 44J15 Jaito Mandi - - - 41920 203 CGWBKot Kapura 2A 44J14 Kot Kapura - - - 42190 206 CGWBKot Kapura 3B 44J14 Nanak Nagri - - 2134 - 210 PRIVATEKot Kapura 1B 44J14 Nangal - - - 300 206 CGWBKot Kapura 3A 44J14 Wara Daraka - - - 300 205 CGWBKot Kapura 2C 44J14 Aulakh - - - 38414 211 PSTCKot Kapura 2B 44J14 Deviwala - - 269 - 207 CGWBMuktsar 2B 44J10 Dohak - 163 - - 197 CGWBGhal khurd 3B 44J09 Toot - - 217 - 196 CGWB
Two exploratory wells from adjacent districts ie Dohak from Muktsar district and Toot from Ferozpur district have beenincorporated for the preparation of lithological fence and cross sections
Aquifer Mapping and Management Plan of Faridkot District Punjab State
Page | 23
31 Sub Surface Disposition311 Previous Work
To delineate and determine the potential aquifer zones evaluation of aquifercharacteristics etc Exploratory drilling was conducted by CGWB at 6 locations in the districtincludes 05 exploratory wells and 1 slim hole between 1975 to 2008 through in-house activitiesand 02 exploratory wells and 2 piezometers through outsourced by Ms WAPCOS Ltd between2011 to 2015 (Fig10) The drilling has been carried out to a maximum depth of about 408 m(Kot Kapura) and revealed the presence of 6 to 12 prominent permeable granular zones withaggregate thickness varying from 28 to 283 m The granular zone consists of fine to mediumsand The slim hole at Golewala and exploratory well at Kot Kapura have abandoned due topoor quality of formation water upto depth of 350m bgl
Further the study of exploratory boreholes drilled in the district revealed the presence ofmultiple aquifer groups up to the maximum drilled depth of 408 m The first aquifer group formsvery shallow water table aquifer (IA) and occurs down to 57 m Below that clay layer starts gettingthickened to about 8-10m separating Aquifer IB down to 120 m The below multi aquifers behavesas semi-confined to confined and consisting of thin sand layers alternating with thicker clay layersOverall flow of ground water is towards south-west direction Further the study of exploratoryboreholes drilled in the area revealed that the area is considered as a single aquifer system up tothe maximum depth of 300 m
312 Present NAQUIM StudyTo understand the sub surface disposition in the study area geological sections and
fence diagram have been prepared by synthesizing the various sub-surface sections on the basisof study of the lithological logs and electrical logs of boreholes drilled by CGWB WRED PSTCand Private Agencies using the RockWorks15 software and a 3D lithological model has beenprepared (Fig14) The 2D lithology sections and 3D lithological fence diagram has beenprepared using lithology model and are shown in Fig15a b amp 16 respectively The aquifers arecomposed of fine to medium sand with clay intercalations The granular zones are extensiveThe aquifer occurring below 252m depth are composed of very fine to medium sand with silt
Based on geophysical borehole logging and use of resistivity profiling followed by thedepth soundings at few selected places fresh-saline water zones are demarcated This analysisis extremely important for the present study and will be referred from time to time as it isobviously the higher resistivity beds represents freshwater zone in contrast in low resistive bedsindicating saline groundwater zoneFig14 3-Dimension Lithological Model
Aquifer Mapping and Management Plan of Faridkot District Punjab State
Page | 24
The major aquifer system of the area is Quaternary alluvial deposits having Older and Aeolianalluvium which mainly comprises of sand silt and clay The top surface layer is mainly silty clayThe lithology along W-E direction shows the variation in lithological thickness ie thin clay layersinter bedded with sand except at Nangal where thick clay layers were identified at 55 m bglThere is inter-layering of sand and clay with thick clay at Golewala and Bhagthala towardswestern side at a depth between 150m to 210m bgl There is thick a inter-layering of sand andclay towards all lithologs except Nanak Nagri shows thin sequence of sand and clay towards SWLithological data of wells are given in Annexure-III
Fig15ab 2-Dimension Lithological Sections
SWE
Aquifer Mapping and Management Plan of Faridkot District Punjab State
Page | 25
Fig16 3-Dimension Lithological Fence
Aquifer Mapping and Management Plan of Faridkot District Punjab State
Page | 26
32 Aquifer Geometry
The aquifer group embodies a number of granular layers alternating with clay lenses Afew clay layers intervening these aquifer groups pinch out against the sand zones at few placesThe marker horizons are traced all over the area by connecting their tops and bottoms Sandyclay layer occurs at the surface covering the unconfined aquifer which is in turn underlain byprominent clay zone It is composed of mainly of medium sand with thin beds of fine sand
Aquifer IA (Very Shallow Aquifer) extends maximum upto 70 m of depth and below thatclay layer starts getting thickened about 10-12m separating Aquifer IB to a maximum depth of123 m Multi layer aquifers are existing in the area each aquifer is separated by thick clay zonesof 25 to 40 m upto 300m depth (Annexure IV) Based on the same criteria to know the broadpicture of the aquifer disposition inter-relationship of granular zones nature geometry andextension of aquifers in the study area the aquifer grouping has been carried out using the sub-surface lithology and a 3-Dimensional aquifer model (Fig17) and aquifer disposition 3D fencediagram has also been prepared using the aquifer model (Fig18) Various groups identified inthe area are given in Table-3 It is very difficult to differentiate the aquifer groups after AquiferGroup I so the whole lithology is considered to be a single aquifer group system The firstaquifer is water table aquifer and extends all over the area The aquifer is mainly composed offine to coarse grained sand
Table-3 Aquifer Grouping in Faridkot DistrictAquifer Group Range Thickness
From To Min Max
Aquifer IA 4 70 29 50
Aquifer IB 64 123 21 52
Multiple Aquifers 133 300 21 85
Fig17 3D Aquifer Disposition Model
Aquifer Mapping and Management Plan of Faridkot District Punjab State
Page | 27
Fig18 3D Aquifer Disposition Fence
Aquifer Mapping and Management Plan of Faridkot District Punjab State
Page | 28
40 GROUND WATER RESOURCESGround water resource estimation of the area have been carried out by taking Dynamic
and In-storage resources of unconfined aquifer and confined aquifer present upto 300m depthThe assessment of dynamic ground water Resources of the study area have been carried outjointly by CGWB and Water Resources and Environment Directorate (WRED) Department ofIrrigation Punjab on the basis of Ground Water Estimation Committee (1997) methodology
The occurrence of potential aquifers (productive granular zones) upto 300 m depth hasbeen demarcated on basis of aquifer wise subsurface mapping The total saturated thickness ofgranular zones was derived from the exploratory borehole data of a particular block Thegranular zones occurring below the zone of water level fluctuation up to the first confining layerhas been considered as static unconfined zone The specific yield value for the unconfinedaquifer has been taken as 60 of 012 which comes as 0072 whereas for the confined aquiferthe storativity value has been considered Since the specific yield is likely to reduce withincrease in depth due to compaction of overlying sediments
Hence the major data elements considered in this estimation are thickness of granularzones specific yieldstorativity and area of both fresh water and salinebrackish water It hasbeen observed that in some of the blocks sufficient data on probable occurrence of granularzones was not available In those cases the existing exploratory data of adjoining blockdistricthas been either extrapolated or interpolated to derive such parameters required for estimationThis assessment of total groundwater resources has been computed based on the availabledata with CGWB amp WRED Department of Irrigation and Punjab
41 Groundwater Resources up to depth of 300ma Dynamic Resources
Block-wise ground water resource potential of the district has been assessed as perGEC-97 as on 31st March 2013 The primary source of recharge in the area is the rainfall Theground water development in all the blocks has exceeded the available recharge thus all theblocks have been categorized as over exploited The overall stage of ground water developmentin the Faridkot district has been assessed to be 160 The block wise details are given in belowTable-4
Table 4 Dynamic Ground Water Resource amp Development Potential (31032013) in mcmAssessmentUnit Block
NetAnnualGroundWater
Availability
ExistingGross
GroundWater Draft
forirrigation
ExistingGross GroundWater Draftfor domestic
andindustrial
water supply
ExistingGross
GroundWater
Draft forAll uses(11+12)
Provision fordomestic
andindustrial
requirementsupply to
2025
Net GroundWater
Availabilityfor futureirrigation
development(10-11-14)
Stage ofGroundWater
Development(1310)
100()
Category
Faridkot 34632 52861 1911 54771 2219 -20448 158Over
Exploited
Kot Kapura 26821 42020 1402 43421 1511 -16709 162Over
Exploited
TOTAL 61453 94880 3313 98193 3730 -37157 160Over
Exploited
Aquifer Mapping and Management Plan of Faridkot District Punjab State
Page | 29
b In-storage Ground Water ResourcesAs per revised guidelines recommended by the Central Level Expert Group on
groundwater resources assessment the resources are separately considered as dynamic and in-storage unconfined In case of alluvial area in-storage resources of unconfined aquifer havebeen computed on the basis of specific yield of aquifer as detailed below
In-storageGround Water
resources(Unconfined
Aquifer)
=
Thickness of the aquifer(granularproductive zone)
below the zone of water levelfluctuation down to the bottom
layer of unconfined aquifer
x Sp Yield ofthe aquifer
x Areal extentof the
aquifer
The dynamic and in-storage ground water resource estimations have been calculated forsingle aquifer group upto 300m of each block of Faridkot district In-storage ground waterresources are estimated for fresh water and saline water resources based on the geophysicalinterpretations of depth to fresh and saline water interface for each block The fresh and salinecalculations are made on the basis of the assumptions on aquifer that is considered asunconfined aquifer so that the specific yield concept is used for resources estimations (Fig19)The detailed resources estimations are calculated in detailed table for fresh and saline waterresources in the below Table-5 6amp 7
Total Availability of Ground Water Resources = Dynamic Resources + In-storage Resources
Fig19 Conceptual figure to understand the fresh and saline water resources in the aquifer up to300 m for Resource Estimation in Unconfined and Confined Aquifer System
(The clay lenses are more dominant in the aquifer and sometimes huge thickness of clay depositsare also observed in the lithologs)
Aquifer Mapping and Management Plan of Faridkot District Punjab State
Page | 29
b In-storage Ground Water ResourcesAs per revised guidelines recommended by the Central Level Expert Group on
groundwater resources assessment the resources are separately considered as dynamic and in-storage unconfined In case of alluvial area in-storage resources of unconfined aquifer havebeen computed on the basis of specific yield of aquifer as detailed below
In-storageGround Water
resources(Unconfined
Aquifer)
=
Thickness of the aquifer(granularproductive zone)
below the zone of water levelfluctuation down to the bottom
layer of unconfined aquifer
x Sp Yield ofthe aquifer
x Areal extentof the
aquifer
The dynamic and in-storage ground water resource estimations have been calculated forsingle aquifer group upto 300m of each block of Faridkot district In-storage ground waterresources are estimated for fresh water and saline water resources based on the geophysicalinterpretations of depth to fresh and saline water interface for each block The fresh and salinecalculations are made on the basis of the assumptions on aquifer that is considered asunconfined aquifer so that the specific yield concept is used for resources estimations (Fig19)The detailed resources estimations are calculated in detailed table for fresh and saline waterresources in the below Table-5 6amp 7
Total Availability of Ground Water Resources = Dynamic Resources + In-storage Resources
Fig19 Conceptual figure to understand the fresh and saline water resources in the aquifer up to300 m for Resource Estimation in Unconfined and Confined Aquifer System
(The clay lenses are more dominant in the aquifer and sometimes huge thickness of clay depositsare also observed in the lithologs)
Aquifer Mapping and Management Plan of Faridkot District Punjab State
Page | 29
b In-storage Ground Water ResourcesAs per revised guidelines recommended by the Central Level Expert Group on
groundwater resources assessment the resources are separately considered as dynamic and in-storage unconfined In case of alluvial area in-storage resources of unconfined aquifer havebeen computed on the basis of specific yield of aquifer as detailed below
In-storageGround Water
resources(Unconfined
Aquifer)
=
Thickness of the aquifer(granularproductive zone)
below the zone of water levelfluctuation down to the bottom
layer of unconfined aquifer
x Sp Yield ofthe aquifer
x Areal extentof the
aquifer
The dynamic and in-storage ground water resource estimations have been calculated forsingle aquifer group upto 300m of each block of Faridkot district In-storage ground waterresources are estimated for fresh water and saline water resources based on the geophysicalinterpretations of depth to fresh and saline water interface for each block The fresh and salinecalculations are made on the basis of the assumptions on aquifer that is considered asunconfined aquifer so that the specific yield concept is used for resources estimations (Fig19)The detailed resources estimations are calculated in detailed table for fresh and saline waterresources in the below Table-5 6amp 7
Total Availability of Ground Water Resources = Dynamic Resources + In-storage Resources
Fig19 Conceptual figure to understand the fresh and saline water resources in the aquifer up to300 m for Resource Estimation in Unconfined and Confined Aquifer System
(The clay lenses are more dominant in the aquifer and sometimes huge thickness of clay depositsare also observed in the lithologs)
Aquifer Mapping and Management Plan of Faridkot District Punjab State
Page | 30
Table-5 Block wise In-Storage Ground Water Resources of Fresh Water Aquifer
GENERAL DESCRIPTION OF THE GROUND WATER ASSESSMENT UNIT OF DISTRICT FARIDKOT PUNJAB STATE (2013)
Type of Ground Water Assessment Unit (Block) Faridkot Blocks
SrNo
Name ofAssessment
Unit
Type offormation
Areal extent (sq km) AveragePre-
monsoonWaterLevel
(m bgl)
Depth tobottom of
Aquiferbased on
Geophysical Interface
amp Boreholelogging(m bgl)
TotalThickness
offormation
belowPre-
monsoonWaterLevel(m)
(7-6)
Totalthickness
of theGranularZones up
to thedepth of
FreshWaterZones
(m)
Thicknessof the
unsaturated
granularZones up
to Pre-monsoon
WL(m)
Thicknessof the
saturatedgranularZones up
to thedepth of
Freshwater
aquiferbelow (m)
(9-10)
AverageSpecific
Yield
In-StorageGroundWater
Resourcesup to thedepth of
FreshWater
Aquifer(ham)
51112
TotalGeographical Area
AssessmentArea
FreshWater
1 2 3 4 5 6 7 8 9 10 11 12 13
1 Faridkot Alluvium 75210 36710 450 152 1475 72 2 69 0072 182375
2
KotKapura Alluvium 66650 61650 1069 106 9531 51 3 48 0072 213062Dist Total (ham) 141860 228406 395438Dist Total (mcm) 3954
ham hectare metremcm million cubic metre
Aquifer Mapping and Management Plan of Faridkot District Punjab State
Page | 31
Table-6 Block Wise In-Storage Ground Water Resources of Saline Aquifers upto 300 m Depth
GENERAL DESCRIPTION OF THE GROUND WATER ASSESSMENT UNIT OF DISTRICT FARIDKOT PUNJAB STATE (2013)Type of Ground Water Assessment Unit (Block) Faridkot BlocksSrNo
Name ofAssessment
Unit
Type offormation
Areal extent (ha) Depth tobottom of
Aquifer basedon Geophysical
Interface ampBoreholelogging(m bgl)
Depth tobottom of
Saline WaterAquifer
based onGeophysicalInterface ampBorelogging
(m bgl)
Totalthickness
of theSaline
Water upto the max
depth(m)
Totalthickness of
theGranular
Zones up tothe depth of
SalineWaterZones
(m)
AverageSpecific
Yield
In-StorageGroundWater
Resourcesup to thedepth of
SalineWater
Aquifer(ham)
51011
TotalGeographical
Area
AssessmentArea
Saline Water
1 2 3 4 5 6 7 8 9 10 111 Faridkot Alluvium 75210 38500 152 300 148 103 0072 2855162 Kot Kapura Alluvium 66650 5000 106 300 194 76 0072 27360
Dist Total (ham) 141860 228406 312876Dist Total (mcm) 3129
ham hectare metremcm million cubic metre
Aquifer Mapping and Management Plan of Faridkot District Punjab State
Page | 32
Table-7 Block Wise Total Availability of Fresh and Saline Groundwater Resources upto 300 m Depth and Volume of unsaturatedgranular zone after 3m upto water level
BLOCK WISE AVAILABILITY OF TOTAL GROUNDWATER RESOURCES IN FARIDKOT DISTRICTSlNo BLOCK Volume of
UnsaturatedGranular Zone
up to Pre-monsoon WL
DynamicGroundwater
Resources(2013)
AQUIFER-I
In-storageGroundwater
Resources UPTOFRESHWATER
Total FreshGroundwater
Resources[(4)+(5)] (HAM)
Total SalineGroundwater
Resources[(3)+(4)](HAM)
Total Availability ofGroundwater
Resources [(6)+(7)]
ham mcm
1 2 3 4 5 6 7 8 91 Faridkot 10830 34632 182375 217007 285516 502523 50252 Kot Kapura 14396 26821 213062 239883 27360 267243 2672
DistTotal (ham) 25227 61453 395438 456891 312876 769767 7698DistTotal (mcm) 252 615 3954 4569 3129
ham hectare metremcm million cubic metre
Aquifer Mapping and Management Plan of Faridkot District Punjab State
Page | 33
50 GROUND WATER ISSUES
51 Ground Water DepletionThe Study area is famous for its paddy and non paddy cultivation The quality of ground
water in the area is suitable for irrigation and drinking purposes therefore the ground water isconstantly being pumped for the irrigation due to its easy access through tube wells at shallowdepths and they are the main source of irrigation This will lead to its deepening of groundwater levels in blocks of Faridkot and Kot Kapura of Faridkot district as the recharge of thegroundwater through rainfall and other sources are less than the overall extraction Thehydrographs also shows the declining water level trend over the years in the district (Fig20) andis categorized as over-exploited This declining water table trend if not checked would assumean alarming situation in the near future affecting agricultural production and thus economyGround Water Recharge and Conservation may be carried out in these areas to overcome thedepletion Other than the groundwater depletion quality and rising water table are the otherissues
Fig20 Long term ground water table variation
52 Rising Water tableIn western parts of the area water table is rising due to less withdrawal of ground water
because of brackish saline quality coupled with easy availability of canal water for domesticand irrigation purposes As such these areas are likely to get water logged in near future Thereis an urgent need to arrest the rising water trend in western part and implement anti-waterlogging schemes
Aquifer Mapping and Management Plan of Faridkot District Punjab State
Page | 34
53 Ground Water QualityThe ground water of the study area is alkaline in nature Ground water in the area is
generally fresh to marginally saline with fluoride concentration above permissible limit (15mgL) are found mainly in Nathuwala (603) Killi (429) Kot Kapura (333) Dhilwan Kalan(285)and Bir Sikhanwala (184) Nitrate concentration above permissible limit (45mgl) are found inSukhanwala (46) Sher singhwala (65) Wara Daraka (66) Dhilwan Kalan (72)Nathuwala (79)Chand Bhaja (79) Bir Sikhanwala (89) Nangal (104) Tehna (118) Dal Singhwala(136) Killi (140)and KotKapura (144) and iron concentration above permissible limit (15 mgL)are observed inDeviwala (177) There is growing concern on deterioration of ground water quality due togeogenic and anthropogenic activities
54 Ground Water Irrigation ScenarioAs per the data available from minor irrigation census 2005-06 the detailed number of
shallow deep tube wells lined unlined water distribution system land holdings of wells aregiven in Table-89 amp10
Table-8 Distribution of Tube wells According to Well Ownerrsquos land holding SizeType of
Tube well(TW)
Marginal(0-1 ha)
Small(1-2 ha)
Semi-Medium(2-4 ha)
Medium(4-10ha)
Big(gt10ha)
Total
Shallow TW 1100 4029 10069 14576 5314 35088
Deep TW 29 197 596 1188 468 2478
Total 1129 4226 10665 15764 5782 37566
Table-9 Distribution of Tube wells According to DepthDepth of Tubewells in metres Total depth
Range0-150m
Depth range 0-20 m 20-40 m 40-60 m 60-70 m 70-90m 90-150m gt150 m
Tubewells 3507 9947 9998 11636 543 1744 191 37566
Tubewells () 9 26 27 31 1 5 1
Table-10 System of Ground water distribution deviceOpen Water Channels
Linedpucca Unlinedkutcha Others Total2093 35455 18 37566
Aquifer Mapping and Management Plan of Faridkot District Punjab State
Page | 35
60 MANAGEMENT STRATEGIES AND AQUIFER MANAGEMENT PLAN
Aquifer mapping is leads to groundwater management plans to be implemented byincluding demand side-management and Ground Water Use Efficiency
An outline of the Aquifer Management Plan for each block is given in Part-II Thisincludes details regarding population rainfall average annual rainfall agriculture and irrigationwater bodies ground water resource availability ground water extraction and water levelbehavior Aquifer disposition and various cross sections have also been given Ground waterresources extraction and other issues including ground water resource enhancement anddemand side innervations have been given
Artificial recharge plan is less feasible in the Faridkot District due to very low availabilityof volume of surplus water (959 mcm) Another focus has been given to minimize the grossdraft by enhancing ground water use efficiency in irrigation system after replacing the waterdistribution system from unlinedkutcha channel to Under Ground Pipeline System (UGPS) inover exploited blocks of the district
61 Scope of ImplementationThis plan is focusing on the technical aspects of the ground water recharge through
various means so that various implementing agencies may get the appropriate technicalguidelines The existingongoing schemes of the central or state govt like MANERGA IWSPPMKSY (Prime Minister Krishi Sinchai Yojna) NABARD funded schemes Urban Developmentschemes departmentally funded projects etc may be benefitted from the recharge plan byincorporating the input in the operational guidelines design and for locating the specific sites
Agriculture University engineering Collages Academic and Research Institution NGOmay also take up the pilot or demonstrative projects in the blocks suitable to them to plan atlocal level as per local conditions
62 Potential of Enhancing the Ground Water Use EfficiencyThe micro level transformation in the ground water management have vast impact
potential to counter extensive ground water depletion faced in the state of Punjab particularlyin overexploited blocks
There are around 35455 (out of 37566) tube wells (9438 ) operated by farmers forirrigation through unlinedKutcha open channel system in study area (Table-10) where waterfrom the tube well is discharge to the agricultural field In this process huge (around 25 )(RKVY 2015) quantity of ground water is wasted in soil moisture and evaporation losses
Around 95 of the tube wells are of shallow depth (20 to 70m) and remaining wells aredeeper depth (70 to gt150 m) existed in the area (Table-9) Thus majority of wells are tappingshallow aquifer which is under stress
Dynamic ground water resources (2013) indicate that Gross ground water draft forirrigation in the district is estimated at 94880 mcm It is expected that around 25 of overdraft can be brought down by switching over to undergroundsurface pipeline based
Aquifer Mapping and Management Plan of Faridkot District Punjab State
Page | 36
distribution from the prevailing unlined open channels Thereby gross draft will be reduced to224 mcm (Table-11a) assuming that there is no crop diversification by the farmers
The benefit will lead to saving of precious ground water resources in overexploitedblocks The measure if implemented will bring down the ground water overdraft from 160 to123 The category of the blocks will also improve resulting in boosting of agriculture andindustrial development otherwise not sustainable in over-exploited blocks (Table-11b)
The tube wells also consume enormous electricity which is subsidized and governmentincur significant revenue on this account The measures therefore will result in saving of energyand money Pollution impact will be reduced whenever diesel engines are used by the farmersThe environmental and ecological condition in the irrigated land will improve Unwanted weedgrowth will also be controlled inside the farm land It is expected to save 1 of the agriculturalland occupied by open channels which can be utilized for cultivation purpose Heavy groundwater overdraft can be reduced by these efforts This will ensure more crops per drop
63 Water saving Potential from Crop Diversification-Change Paddy to MaizeSoya-beanAs the requirement of water for paddy is much high therefore by changing paddy to
maizesoya-bean will help in saving of water For estimating the water saving by cropdiversification it is assumed that one mcm of water will be saved in case of maize or soyabeanplanted in one sq km of land In case of pulses even higher amount of ground water can besaved
The block wise saving of water in mcm by applying various management strategies suchas crop diversification Under Ground Pipe lines (UGPL) in individual land and artificial rechargemethods are given in tables 11a b
Table-11a Scope of Quantitative Impact on Stage of Development after applying variousmanagement strategies in mcm
Block Net GroundWater
Availability(mcm)
TotalIrrigation
Draft(mcm)
PresentStage of
draft(SOD)
() (Asper
2013)
Reduction in draft by different watersaving method
SODafterwards
()
Change ofpaddy
cultivationarea ( ofexisting)
Replacewater
coursesby UGPipes
(mcm)
AdoptArtificialrecharge
(mcm)
ChangePaddy
toMaize(mcm)
Total(mcm)
(2+3+4)
1 2 3 4 5Faridkot 34632 52861 158 12472 484 7245 20201 9969 -
Kot Kapura 26821 42020 162 9915 475 6264 16654 9986 -Total 61453 94880 160 22387 959 13567 36913 9948
Aquifer Mapping and Management Plan of Faridkot District Punjab State
Page | 37
Table-11b Impact on Stage of Development (SOD) after applying various managementstrategies in Faridkot District
Block PresentSOD ()
as on2013
Reductionin SOD ()
afterunlinedchannel
()
ResultantSOD ()
Col(2 - 3)
Reduction inStage of
developmentafter crop
diversificationby
MaizeSoyabean()
ResultantSOD ()
Col(2 - 5)
Reduction inStage of
developmentafter Artificialrecharge ()
ResultantSOD ()
Col(2 - 7)
1 2 3 4 5 6 7 8Faridkot 158 3601 12199 2090 13710 140 15660
KotKapura 162 3697 12503 2340 13860 177 16023
Total 160 3664 12336 2210 13790 178 15822
By adopting all the management strategies resulting in total reduction in stage of groundwaterdevelopment is 6052 Hence overall stage of development afterwards is 9948 and is givenin Table12
Table-12 Overall Stage of Development (SOD) after reduction in Faridkot
Block PresentStage of
development() as on
2013
Reduction instage of
developmentafter unlinedchannel ()
Reduction inStage of
developmentafter crop
diversificationby
MaizeSoyabean()
Reduction inStage of
developmentafter Artificialrecharge ()
TotalReduction in
Stage ofdevelopment
()
(3 +4+5)
Stage ofdevelopmentafterwards
()
(2-6)
1 2 3 4 5 6 7Faridkot 158 3601 2090 140 5831 9969
Kot Kapura 162 3697 2340 177 6214 9986Total 160 3664 2210 178 6052 9948
Aquifer Mapping and Management Plan of Faridkot District Punjab State
Page | 38
70 CONCLUSIONS1 The area lies in the central part of Satluj basin of Indo-Gangetic Alluvial plain
Geologically the area is occupied by a thick sequence of Quaternary deposits of Mid-Pleistocene to Recent age
2 The Principle Aquifer system in the study area is Alluvium and the Major Aquifers areOlder Alluvium and Aeolian Alluvium
3 Lithological characteristics of the area are Multi-cyclic light grey to brown fine tomedium grained mixture of clay silt and sand with Kankar
4 Thick layering of clay with sand at many places can be observed towards south of thedistrict at deeper depths The Ground water occurs in unconfined (water table) andconfined conditions
5 Chemical data of ground water from shallow aquifer indicates that ground water isalkaline and fresh to moderately saline
6 To delineate fresh water - saline water interface laterally as well as vertically surfacegeophysical investigations have been carried out in alluvial tracts
7 To understand the sub surface disposition geological sections and fence diagram havebeen prepared by synthesizing the various sub-surface sections on the basis of study ofthe lithological logs and electrical logs of boreholes drilled by CGWB WRED PSTC andPrivate Agencies using the RockWorks15 software
8 Aquifer IA (Very Shallow Aquifer) extends maximum upto 70 m of depth and below thatclay layer starts getting thickened about 10-12m separating Aquifer IB to a maximumdepth of 123 m Multi layer aquifers are existing in the area each aquifer is separated bythick clay zones of 25 to 40 m upto 300m depth It is very difficult to differentiate theaquifer groups after Aquifer Group I so the whole lithology is considered to be a singleaquifer group system
9 Stage of Ground Water Development of the district is 160 on the basis of Dynamicground water resources 2013 In- storage ground water resources has also beencalculated up to a depth of 300 meters
10 The fresh water resources are inadequate in aquifer upto maximum depth of 106mwhereas saline water is dominant resources below 106 m depth upto 300 m In thenorth of the district towards Faridkot block fresh water is available upto 152m depth
11 Dynamic ground water resources of the study area are 61453 mcm whereas In-storageground water resources up to fresh water zones are 3954 mcm Thus total fresh groundwater resources up to maximum depth of 152 m are 4569 mcm Total saline waterresources up to depth of 300 m are 3129 mcm
12 Main groundwater issues in the area are groundwater depletion quality and risingwater table
13 Considering the high ground water abstraction for irrigation (94880 mcm) andoverdraft (37157 mcm) it is suggested that proposed artificial recharge measures (959mcm) crop diversification measures (13567 mcm) and conserving ground waterthrough laying of underground pipe line (22387 mcm) will be useful
14 Other techniques of water saving and modern irrigation technology to be enforced tomaximize per drop of water use in the district and also to think about the hidden salinewater resources and for its utilizations
Aquifer Mapping and Management Plan of Faridkot District Punjab State
Page | 39
BLOCK WISE
AQUIFER MAPS
AND
MANAGEMENT PLAN
(PART-II)
Aquifer Mapping and Management Plan of Faridkot District Punjab State
Page | 40
I Salient Information of Faridkot Block
Block Area(in Km2)
75210 sq km
District State Faridkot PunjabPopulation Urban Population 2260
Rural Population 179432Total population 181692
Rainfall NormalMonsoon 335 mm
Non-monsoon Rainfall 35 mmAnnual Average Rainfall 349 mm
Agriculture and Irrigation Principal crops Wheat Cotton and PaddyGross cropped area 119562 sq kmNet sown area 59180 sq kmIrrigation practices Canal and Tube well IrrigationCropping intensity 202Area underGround water Irrigation 6159 sq kmSurface water irrigation 51143 sq kmNumber and types of abstraction structures 20927 Tubewells
Ground Water ResourceAvailability and Extraction
Ground water Resources AvailabilityTotal Ground Water Resources available is 5025 mcm (fresh andsaline water) up to the depth of 300m The fresh water resourcesare estimated up to the depth of 152 m on the basis of geophysicalinterpretations The potential granular zones available for freshwater are calculated as 72 m Saline water resources are estimatedon the basis of available well depth (up to 300 m) and the granularzones are counted after depth of 152 m and available zones are 103m Block is categorized as Over-Exploited as per DynamicGroundwater Resources 2013 assessment
Ground water Resources ExtractionDeeper aquifers are marginal to highly saline and not suitable forirrigation purpose as such all users are tapping shallow aquifersDrinking water supply wells of State Government tapping shallowaquifers Therefore the ground water draft could not be assessed fordeeper aquifer
Aquifer Mapping and Management Plan of Faridkot District Punjab State
Page | 41
Existing and future waterdemands
Existing Gross Ground water Draft as on 2013Irrigation 52861 mcmDomestic and industrial water supply 1911 mcmFuture water demandsIrrigation development potential (-)2045 mcmDomestic and industrial water supply up to 2025 years 2219 mcm
Water level behavior Aquifer wise water levelAquifer-IPre Monsoon 145 ndash 1522 m bglPost Monsoon 120 ndash 1310 m bglMean (10 yrs) 100 ndash (-)101 myrTrendsPre Monsoon 018 ndash (-)022 myrPost Monsoon 024 ndash (-)030 myrAquifer-IINo Monitoring stations
Aquifer-IIINo Monitoring stations
HYDROGRAPH SHOWING DECLINING WATER TABLE
Aquifer Mapping and Management Plan of Faridkot District Punjab State
Page | 42
HYDROGRAPH SHOWING DECLINING WATER TABLE
HYDROGRAPH SHOWING DECLINING WATER TABLE
Monitoring well Golewala dried after 2004
Aquifer Mapping and Management Plan of Faridkot District Punjab State
Page | 43
Aquifer Disposition
Number of aquifers 1
Principal aquifer AlluviumMajor Aquifer Older Alluvium Aeolian Alluvium
Exploratory Data AvailabilitySource of Data No of exploration wells as per depth range (m) Total
lt100 100-200 200-300 gt300
CGWB 1 0 0 4 5WREDPSTCWSS 6 1 0 2 9PRIVATE 0 0 0 0 0TOTAL 7 1 0 6 14
Aquifer wise Characteristics (CGWB 2012)AquiferGroup
Geology Type ofAquifer
ThicknessofGranularzones (m)
Transmissivity(m2day)
YieldDischarge
(m3day)
SpecificYield
Storativity
SingleAquiferSystem
Quarter-naryAlluvialdeposits
Unconfined toconfined
175 474 - 2660 939 -55944
12 (0072)
175 x 10-3
-18 x 10-3
Well field proposed in adjacent blockThe Aquifer comprises of fresh and saline water and the major aquifer material is sand Theaquiclude and aquitard comprises of clay clay with siltExploratory Data Validated
Source of Data No of exploration wells as per depth range (m) Totallt100 100-200 200-300 gt300
CGWB 0 0 0 4 4WREDPSTCWSS 0 0 0 2 2PRIVATE 0 0 0 0 0TOTAL 0 0 0 6 6
The data is validated by selecting the deepest well in each quadrant and used for preparation of3-D Litho models 2-D Geological Cross Sections Fence Diagrams and Aquifer Maps
Aquifer Mapping and Management Plan of Faridkot District Punjab State
Page | 44
3-D Lithological Model of Faridkot Block
Lithological Cross Section from Dip Singh Wala to Nangal
Lithological Cross Section from Toot to Nangal
Aquifer Mapping and Management Plan of Faridkot District Punjab State
Page | 45
3-D Lithological Fence Diagram
3-D Aquifer Disposition Fence Diagram
Aquifer Mapping and Management Plan of Faridkot District Punjab State
Page | 45
3-D Lithological Fence Diagram
3-D Aquifer Disposition Fence Diagram
Aquifer Mapping and Management Plan of Faridkot District Punjab State
Page | 45
3-D Lithological Fence Diagram
3-D Aquifer Disposition Fence Diagram
Aquifer Mapping and Management Plan of Faridkot District Punjab State
Page | 46
Ground water Resource Extraction Contamination and other issues in Faridkot Block
Ground WaterResources upto thedepth of 300m
Dynamic Fresh waterresources
34632 mcm
In-storage Fresh waterresources
182375 mcm
In-storage Saline waterresources
285516 mcm
Total 502523 mcmGround WaterExtraction (as per 2013)
Irrigation 52861 mcm
Domestic amp Industrial 1911 mcm
Future Demand for domestic amp Industrial sector(2025) (as per 2013)
2219 mcm
Stage of Groundwater Development 158
Chemical Quality of ground water Ground water in the area is alkaline and pHranges between 794 to 917 Groundwater in the area is fresh to marginal salineEC value of ground water show widevariations and ranges from 444 Scm to8653Scm at 250CRSC values vary from (ndash) 73 to 113 meqLarea is fit for irrigation
Ground water Contamination Issues Fluoride (mgl)Nathuwala (603) Killi(429)Nitrate (mgl)Sukhanwala (46) Sher Singhwala (65)Nathuwala (79) Chand Baja (79) Nangal(104) Tehna (118) Killi (140)Iron (mg)Devi wala (177)
Other issues Water level decline has been observed inmajor parts of the block due to indiscriminate development of ground waterresourcesIn shallow water level area lessdevelopment of ground water resourcecouple with recharge from canal irrigationis causing water logging and inland salinityproblems
Aquifer Mapping and Management Plan of Faridkot District Punjab State
Page | 47
Ground water Resource Enhancement Potential
Aquifer wise space available for recharge and proposed interventions (Supply Side Measures)
Aquifer-I
Volumes of unsaturated zone after 3m upto a desirable depth 10830 mcmSource water requirementavailability for recharge Rain Canal Irrigation return flowTypes and number of structures NAOther interventions proposed Artificial Recharge Roof top Rainwater harvesting will conserve484 mcm volume of water
Demand side interventions
Advanced Irrigation PracticesArea proposed to be covered Entire Block Faridkot (75210 sq km)Volume of Water expected to be conserved under advanced irrigation practices such as lining ofunderground pipelines (Kutcha channel) 12472 mcm
Required Change in cropping pattern
Proposed change in cropping pattern Paddy to Maize Soyabean The overexploitation can bemanaged at sustainable level (100) by changing the Paddy cropArea coverage 15 of the total paddy area needs to change ie7245 sq kmAnticipated volume of water to be saved 7245 mcm
Net AnnualGroundWater
Availability2013
(mcm)
TotalIrrigation Draft
(present)(mcm)
GrossDraft alluses(present)(mcm)
Paddyarea
(Sq km)
RequiredArea to
beChange
fromPaddy toMaize
soyabean
(Sq km)
Amountof
WaterSaved(mcm)
Grossdraftafter
savingof water(mcm)
PresentStage of
development ()
Reductionin Stage ofdevelopme
nt afterMaize
soya bean()
CropDiversifiedarea ()
34632 52861 54771 48300 7245 7245 45616 158 209 15
Alternate Water sourcesSurface water sources Tanks PondsLocation details and availability from such sources outside the area Not AvailableRegulation and Control
Punjab Subsoil Act for delay in paddy plantation should continue in the area
Aquifer Mapping and Management Plan of Faridkot District Punjab State
Page | 48
Other interventions proposed if anyModern Irrigation Practices be adopted for Rabi crops Some of the techniques are given in
the table below (PAU Ludhiana)
SlNo Techniques Water Saving()
Crops
1 Mulching 17 Wheat2 Bed Planting 18-25 Wheat3 Use of Sprinkler and drip
Irrigation70-90 Sugarcane Cotton Sunflower Maize
Other than that by 15 days ponding followed by 2 days of drying can lead to 25 saving of water inpaddy crop
Aquifer Mapping and Management Plan of Faridkot District Punjab State
Page | 49
II Salient Information of Kot Kapura Block
Block Area(in Km2)
66650 sq km
District State Faridkot PunjabPopulation Urban Population 373
Rural Population 221025Total population 221398
Rainfall Normal Monsoon 328 mmNon-monsoon Rainfall 61 mmAnnual Average Rainfall 370 mm
Agriculture and Irrigation Principal crops Wheat Cotton and PaddyGross cropped area 133427 sq kmNet sown area 67498 sq kmIrrigation practices Canal and Tube well IrrigationCropping intensity 198Area underGround water Irrigation 4278 sq kmSurface water irrigation 62899 sq kmNumber and types of abstraction structures 16639 Tubewells
Ground Water ResourceAvailability and Extraction
Ground water Resources AvailabilityTotal Ground Water Resources available is 2672 mcm (fresh andsaline water) up to the depth of 300 m The fresh water resourcesare estimated up to the depth of 106 m on the basis of geophysicalinterpretations The potential granular zones available for freshwater are 51 m Saline water resources are estimated on the basis ofwell (up to 300 m) and the granular zones are counted after depth of106 m and available zones are 76 m Block is categorized as Over-Exploited as per Dynamic Groundwater Resources 2013 assessment
Ground water Resources ExtractionDeeper aquifers are marginal to highly saline and not suitable forirrigation purpose as such all users are tapping shallow aquifersDrinking water supply wells of State Government tapping shallowaquifers Therefore the ground water draft could not be assessed fordeeper aquifer
Aquifer Mapping and Management Plan of Faridkot District Punjab State
Page | 50
Existing and future waterdemands
Existing Gross Ground water Draft as on 2013Irrigation 42020 mcmDomestic and industrial water supply 1402 mcmFuture water demandsIrrigation development potential (-)16709 mcmDomestic and industrial water supply up to 2025 years 1511 mcm
Water level behavior Aquifer wise water levelAquifer-IPre Monsoon 235 ndash 1600 m bglPost Monsoon 155 ndash 1820 m bglMean (10 yrs) 158 ndash (-)086 myrTrendsPre Monsoon 016 ndash (-)026 myrPost Monsoon 015 ndash (-)029 myrAquifer-II (156m)Pre Monsoon 772 m bglPost Monsoon 805 m bglAquifer-III (269m)Pre Monsoon NAPost Monsoon 820 m bgl
HYDROGRAPH SHOWING DECLINING WATER TABLE
Aquifer Mapping and Management Plan of Faridkot District Punjab State
Page | 51
HYDROGRAPH SHOWING DECLINING WATER TABLE
HYDROGRAPH SHOWING DECLINING WATER TABLE
Aquifer Mapping and Management Plan of Faridkot District Punjab State
Page | 52
Aquifer Disposition
Number of aquifers 1
Principal aquifer AlluviumMajor Aquifer Older Alluvium Aeolian Alluvium
Exploratory Data AvailabilitySource of Data No of exploration wells as per depth range (m) Total
lt100 100-200 200-300 gt300
CGWB 2 1 1 4 8WREDPSTCWSS 8 0 0 1 9PRIVATE 1 0 1 0 2TOTAL 11 1 2 5 19
Aquifer wise Characteristics (CGWB2015)AquiferGroup
Geology Type ofAquifer
ThicknessofGranularzones (m)
Transmi-ssivity(m2day)
Yield(m3day)
SpecificYield
Storativity
SingleAquiferSystem
QuaternaryAlluvialdeposits
Unconfinedto confined
127 547 -2990
3668 12 (0072) 72x10-4
Well field proposed in this block (Site Location Deviwala)The Aquifer comprises of fresh and saline water and the major aquifer material is sand Theaquiclude and aquitard comprises of clay clay with siltExploratory Data Validated
Source of Data No of exploration wells as per depth range (m) Totallt100 100-200 200-300 gt300
CGWB 0 0 1 4 5WREDPSTCWSS 0 0 0 1 1PRIVATE 0 0 1 0 1TOTAL 0 0 2 5 7
The data is validated by selecting the deepest well in each quadrant and used for preparation of3-D Litho models 2-D Geological Cross Sections Fence Diagrams and Aquifer Maps
Aquifer Mapping and Management Plan of Faridkot District Punjab State
Page | 53
3-D Lithological model of Kot Kapura Block
Lithological Cross section from Wara Daraka to Aulakh
Lithological Cross section from Nangal to Dal Singhwala
Aquifer Mapping and Management Plan of Faridkot District Punjab State
Page | 54
3-D Lithological Fence Diagram
3-D Aquifer Disposition Fence Diagram
Aquifer Mapping and Management Plan of Faridkot District Punjab State
Page | 54
3-D Lithological Fence Diagram
3-D Aquifer Disposition Fence Diagram
Aquifer Mapping and Management Plan of Faridkot District Punjab State
Page | 54
3-D Lithological Fence Diagram
3-D Aquifer Disposition Fence Diagram
Aquifer Mapping and Management Plan of Faridkot District Punjab State
Page | 55
Ground water Resource Extraction Contamination and other issues in Kot Kapura Block
Ground WaterResources upto thedepth of 300m
Dynamic Fresh waterresources
26821 mcm
In-storage Fresh waterresources
213062 mcm
In-storage Saline waterresources
27360 mcm
Total 267243 mcmGround WaterExtraction (as per 2013)
Irrigation 42020 mcm
Domestic amp Industrial 1402 mcm
Future Demand for domestic amp Industrial sector(2025) (as per 2013)
1511 mcm
Stage of Groundwater Development 162
Chemical Quality of ground water Ground water in the area is alkaline and pHranges between 820 to 893 Ground waterin the area is slightly fresh to marginalsaline EC value of the ground water showwide variations and ranges from 1154Scm to 3988 Scm at 250CRSC values are varies from -003 to 1100meqL and the area is fit for irrigation
Ground water Contamination Issues Fluoride (mgl)Kot Kapura (333) Dhilwan kalan (285)Moharewala ( 195) Bir Sikhanwala ( 184)Nitrate (mgl)Wara Daraka (66) Dhilwan Kalan (72)Moharewala (78) Bir sikhan wala (89)KotKapura (144)
Other issues Water level decline has been observed inmajor parts of the block due to indiscriminate development of ground waterresourcesIn shallow water level area lessdevelopment of ground water resourcecouple with recharge from canal irrigation iscausing water logging and inland salinityproblems
Aquifer Mapping and Management Plan of Faridkot District Punjab State
Page | 56
Ground water Resource Enhancement Potential
Aquifer wise space available for recharge and proposed interventions (Supply Side Measures)
Aquifer-I
Volume of unsaturated zone after 3m upto a desirable depth 14396 mcmSource water requirementavailability for recharge Rain Canal Irrigation return flowTypes and number of structures NAOther interventions proposed Artificial Recharge Roof top Rainwater harvesting will conserve475 mcm volume of water
Demand side interventions
Advanced Irrigation PracticesArea proposed to be covered Entire Kot Kapura Block (66650 sq km)Volume of Water expected to be conserved under advanced irrigation practices such as lining ofunderground pipelines (Kutcha channel) etc 9915 mcm
Required Change in cropping pattern
Proposed change in cropping pattern Rice to Maize Soyabean The overexploitation can bemanaged at sustainable level (100) by changing the Paddy cropArea coverage 12 of the total rice area needs to change ie 6264 sq kmAnticipated volume of water to be saved 6264 mcm
Net AnnualGroundWater
Availability2013
(mcm)
TotalIrrigation Draft
(present)(mcm)
GrossDraft alluses(present)(mcm)
Paddyarea
(Sq km)
RequiredArea to be
Changefrom
Paddy toMaize
soya bean(Sq km)
Amountof
WaterSaved(mcm)
Grossdraftafter
savingof water(mcm)
PresentStage of
development ()
Reductionin Stage ofdevelopme
nt afterMaize
soya bean()
CropDiversifiedarea ()
26821 42020 43421 52200 6264 6264 35756 162 234 12
Alternate Water sourcesSurface water sources Tanks PondsLocation details and availability from such sources outside the area Not AvailableRegulation and Control
Punjab Subsoil Act for delay in paddy plantation should continue in the area
Other interventions proposed if anyModern Irrigation Practices be adopted for Rabi crops Some of the techniques are given in
the table below (PAU Ludhiana)
Aquifer Mapping and Management Plan of Faridkot District Punjab State
Page | 57
SlNo Techniques Water Saving()
Crops
1 Mulching 17 Wheat2 Bed Planting 18-25 Wheat3 Use of Sprinkler and drip
Irrigation70-90 Sugarcane Cotton Sunflower Maize
Other than that by 15 days ponding followed by 2 days of drying can lead to 25 saving of water inpaddy crop
Aquifer Mapping and Management Plan of Faridkot District Punjab State
Page | 58
Annexure-I
Nd Not Determined BDL Below Detection Limit
Aquifer Mapping and Management Plan of Faridkot District Punjab State
Page | 59
Annexure-IIData Availability of Exploration Wells of Faridkot district
SlNo LOCATION LONGITUDE LATITUDE DEPTH ELEVATION BLOCK DEPARTMENT1 Dal Singhwala 74950 30469 300 211 Kot Kapura CGWB2 Dip Singh Wala 74483 30742 300 201 Faridkot CGWB3 Golewala 74692 30792 300 1995 Faridkot CGWB4 Jaito Mandi 74891 30446 300 203 Kot Kapura CGWB5 Kot Kapura 74814 30576 300 206 Kot Kapura CGWB6 Nanak Nagri 74893 30581 200 210 Kot Kapura PRIVATE7 Nangal 74869 30669 300 206 Faridkot CGWB8 Tehna 74790 30690 300 205 Faridkot CGWB9 Wara Daraka 74797 30548 300 205 Kot Kapura CGWB
10 Aulakh 74920 30643 300 211 Kot Kapura PSTC11 Bhagthala 74786 30777 300 198 Faridkot PSTC12 Sadhuwala 74559 30717 300 196 Faridkot PSTC13 Deviwala 74870 30612 269 207 Kot Kapura CGWB14 Deviwala-I 74870 30612 156 207 Kot Kapura CGWB15 Kouni 74675 30760 60 194 Faridkot WSS16 Ghugiana 74639 30746 60 198 Faridkot WSS17 Pahluwala 74763 30799 60 203 Faridkot WSS18 Faridkot 74763 30681 60 203 Faridkot WSS19 Doda Bhundar 75016 30470 121 212 Kot Kapura WRED20 Dhudi 74849 30700 60 207 Faridkot WSS21 Ratti Rori 74811 30647 60 208 Faridkot WSS22 Chak Kalyan 74705 30572 60 203 Kot Kapura WSS23 Kot Kapura 74812 30596 60 208 Kot Kapura WSS24 Behbal Kalan 74913 30531 60 210 Kot Kapura WSS25 Rorian Kapura 74815 30439 60 207 Kot Kapura WSS26 Panjgrain 74914 30608 70 211 Kot Kapura PRIVATE27 Fatehgarh 74943 30405 60 208 Kot Kapura WSS
28Bhurj JawarSingh 74987 30535 60 211 Kot Kapura WRED
29 Dewarana 74766 30593 30 206 Kot Kapura WRED30 Sher Singhwala 74628 30665 65 195 Faridkot CGWB31 Bir Sikhan wala 74849 30627 65 207 Kot Kapura CGWB32 Dohak 74603 30632 163 197 Muktsar CGWB33 Toot 74645 30829 217 196 Ghal khurd CGWB
Two exploratory wells from adjacent districts ie Dohak from Muktsar district and Toot fromFerozpur district have been incorporated for the preparation of lithological fence and crosssections
Aquifer Mapping and Management Plan of Faridkot District Punjab State
Page | 60
Annexure-IIILITHOLOGICAL DATA OF WELLS IN FARIDKOT DISTRICT
Well Location Depth from Depth to Lithology Thickness
Dal Singhwala
0 13 Clay 1313 20 Fresh Sand 720 28 Clay 828 57 Fresh Sand 2957 64 Clay 764 75 Saline Sand 1175 78 Clay 378 97 Saline Sand 1997 108 Clay 11
108 117 Saline Sand 9117 122 Clay 5122 134 Saline Sand 12134 157 Clay 23157 173 Saline Sand 16173 179 Clay 6179 184 Saline Sand 5184 211 Clay 27211 219 Saline Sand 8219 253 Clay 34253 259 Saline Sand 6259 278 Clay 19278 293 Saline Sand 15293 298 Clay 5298 300 Saline Sand 2
Dip Singh Wala
0 8 Fresh Sand 88 36 Clay 28
36 68 Fresh Sand 3268 755 Clay 75
755 805 Fresh Sand 5805 83 Clay 2583 92 Fresh Sand 992 93 Clay 193 109 Saline Sand 16
109 113 Clay 4113 116 Saline Sand 3116 120 Clay 4120 132 Saline Sand 12
Aquifer Mapping and Management Plan of Faridkot District Punjab State
Page | 61
Dip Singh Wala 132 146 Clay 14146 162 Saline Sand 16162 168 Clay 6168 192 Saline Sand 24192 195 Clay 3195 197 Saline Sand 2197 2015 Clay 45
2015 209 Saline Sand 75209 2135 Clay 45
2135 2175 Saline Sand 42175 221 Clay 35221 237 Saline Sand 16237 2865 Clay 495
2865 2895 Saline Sand 32895 293 Clay 35293 296 Saline Sand 3296 300 Clay 4
Golewala
0 75 Clay 7575 2885 Fresh Sand 2135
2885 40 Clay 111540 525 Fresh Sand 125
525 60 Clay 7560 88 Saline Sand 2888 93 Clay 593 103 Saline Sand 10
103 1325 Clay 2951325 1375 Saline Sand 51375 155 Clay 175155 1575 Saline Sand 25
1575 182 Clay 245182 2035 Saline Sand 215
2035 2285 Clay 252285 234 Saline Sand 55234 253 Clay 19253 2725 Saline Sand 195
2725 280 Clay 75280 2975 Saline Sand 175
2975 300 Clay 25Jaito Mandi 0 15 Clay 15
15 25 Fresh Sand 1025 28 Clay 3
Aquifer Mapping and Management Plan of Faridkot District Punjab State
Page | 62
Jaito Mandi 28 42 Fresh Sand 1442 46 Clay 446 59 Fresh Sand 1359 80 Clay 2180 915 Fresh Sand 115
915 103 Clay 115103 107 Fresh Sand 4107 1555 Clay 485
1555 1715 Fresh Sand 161715 191 Clay 195191 213 Saline Sand 22213 220 Clay 7220 223 Saline Sand 3223 238 Clay 15238 255 Saline Sand 17255 273 Clay 18273 2785 Saline Sand 55
2785 2805 Clay 22805 283 Saline Sand 25283 2985 Clay 155
2985 300 Saline Sand 15
Kot Kapura
0 14 Clay 1414 21 Fresh Sand 721 25 Clay 425 355 Fresh Sand 105
355 37 Clay 1537 50 Fresh Sand 1350 57 Clay 757 64 Fresh Sand 764 69 Clay 569 77 Fresh Sand 877 88 Clay 1188 99 Fresh Sand 1199 103 Clay 4
103 106 Saline Sand 3106 123 Clay 17123 1286 Saline Sand 56
1286 130 Clay 14130 1326 Saline Sand 26
1326 134 Clay 14134 1355 Saline Sand 15
Aquifer Mapping and Management Plan of Faridkot District Punjab State
Page | 63
Kot Kapura
1355 1492 Clay 1371492 1518 Saline Sand 261518 155 Clay 32155 1584 Saline Sand 34
1584 161 Clay 26161 1796 Saline Sand 186
1796 1812 Clay 161812 1838 Saline Sand 261838 1865 Clay 271865 2045 Saline Sand 182045 207 Clay 25207 2125 Saline Sand 55
2125 249 Clay 365249 2545 Saline Sand 55
2545 280 Clay 255280 2944 Saline Sand 144
2944 300 Clay 56
Nanak Nagri
0 136 Clay 136136 208 Fresh Sand 72208 265 Clay 57265 305 Fresh Sand 4305 34 Clay 3534 368 Fresh Sand 28
368 388 Clay 2388 40 Fresh Sand 1240 428 Clay 28
428 46 Fresh Sand 3246 695 Clay 235
695 712 Fresh Sand 17712 785 Clay 73785 815 Fresh Sand 3815 84 Clay 2584 87 Fresh Sand 387 92 Clay 592 936 Saline Sand 16
936 988 Clay 52988 100 Saline Sand 12100 1085 Clay 85
1085 1115 Saline Sand 31115 118 Clay 65118 120 Saline Sand 2
Aquifer Mapping and Management Plan of Faridkot District Punjab State
Page | 64
Nanak Nagri 120 128 Clay 8128 1296 Saline Sand 16
1296 130 Clay 04130 1316 Saline Sand 16
1316 135 Clay 34135 1368 Saline Sand 18
1368 165 Clay 282165 1676 Saline Sand 26
1676 184 Clay 164184 1868 Saline Sand 28
1868 1905 Clay 371905 1948 Saline Sand 431948 2134 Clay 186
Nangal
0 8 Clay 88 20 Fresh Sand 12
20 23 Clay 323 28 Fresh Sand 528 29 Clay 129 41 Fresh Sand 1241 72 Clay 3172 80 Fresh Sand 880 91 Clay 1191 124 Fresh Sand 33
124 151 Clay 27151 158 Fresh Sand 7158 163 Clay 5163 171 Fresh Sand 8171 181 Clay 10181 187 Fresh Sand 6187 193 Clay 6193 199 Fresh Sand 6199 203 Clay 4203 219 Fresh Sand 16219 224 Clay 5224 233 Saline Sand 9233 243 Clay 10243 249 Saline Sand 6249 251 Clay 2251 257 Saline Sand 6257 300 Clay 43
Tehna 0 8 Clay 8
Aquifer Mapping and Management Plan of Faridkot District Punjab State
Page | 65
Tehna
8 23 Fresh Sand 1523 28 Clay 528 32 Fresh Sand 432 37 Clay 537 41 Fresh Sand 441 59 Clay 1859 63 Fresh Sand 463 69 Clay 669 72 Fresh Sand 372 102 Clay 30
102 106 Fresh Sand 4106 120 Clay 14120 123 Fresh Sand 3123 133 Clay 10133 136 Fresh Sand 3136 145 Clay 9145 150 Fresh Sand 5150 158 Clay 8158 163 Fresh Sand 5163 168 Clay 5168 172 Fresh Sand 4172 176 Clay 4176 184 Fresh Sand 8184 210 Clay 26210 215 Fresh Sand 5215 221 Clay 6221 225 Fresh Sand 4225 254 Clay 29254 264 Fresh Sand 10264 267 Clay 3267 275 Fresh Sand 8275 294 Clay 19294 300 Fresh Sand 6
Wara Daraka
0 15 Clay 1515 22 Fresh Sand 722 28 Clay 628 48 Fresh Sand 2048 52 Clay 452 61 Fresh Sand 961 65 Clay 465 75 Fresh Sand 10
Aquifer Mapping and Management Plan of Faridkot District Punjab State
Page | 66
Wara Daraka
75 84 Clay 984 86 Saline Sand 286 91 Clay 591 97 Saline Sand 697 101 Clay 4
101 119 Saline Sand 18119 124 Clay 5124 129 Saline Sand 5129 150 Clay 21150 172 Saline Sand 22172 184 Clay 12184 188 Saline Sand 4188 196 Clay 8196 205 Saline Sand 9205 234 Clay 29234 239 Saline Sand 5239 274 Clay 35274 281 Saline Sand 7281 300 Clay 19
Aulakh
0 1829 Clay 18291829 4573 Fresh Sand 27444573 7621 Clay 30487621 9146 Fresh Sand 15259146 10975 Clay 1829
10975 1128 Saline Sand 3051128 13414 Clay 2134
13414 16768 Saline Sand 335416768 20112 Clay 334420112 21036 Saline Sand 92421036 21341 Clay 30521341 21951 Saline Sand 6121951 2256 Clay 6092256 245 Saline Sand 194245 300 Clay 55
Bhagthala
0 35 Clay 3535 1829 Fresh Sand 1479
1829 41 Clay 227141 53 Fresh Sand 1253 63 Clay 1063 8537 Saline Sand 2237
8537 92 Clay 663
Aquifer Mapping and Management Plan of Faridkot District Punjab State
Page | 67
92 102 Saline Sand 10102 1311 Clay 291
1311 13415 Saline Sand 30513415 16768 Clay 335316768 17073 Saline Sand 30517073 185 Clay 1427
185 203 Saline Sand 18203 22866 Clay 2566
22866 23476 Saline Sand 6123476 253 Clay 1824
253 273 Saline Sand 20273 280 Clay 7280 294 Saline Sand 14294 300 Clay 6
Sadhuwala
0 61 Fresh Sand 6161 3049 Clay 2439
3049 52 Saline Sand 215152 625 Clay 105
625 725 Saline Sand 10725 77 Clay 4577 84 Saline Sand 784 91 Clay 791 107 Saline Sand 16
107 110 Clay 3110 114 Saline Sand 4114 118 Clay 4118 130 Saline Sand 12130 14339 Clay 1339
14339 16463 Saline Sand 212416463 17683 Clay 12217683 207 Saline Sand 3017
207 2115 Clay 452115 2155 Saline Sand 42155 219 Clay 35219 235 Saline Sand 16235 237 Clay 2237 25624 Saline Sand 1924
25624 27134 Clay 15127134 300 Saline Sand 2866
Deviwala0 15 Clay 15
15 23 Fresh Sand 8
Aquifer Mapping and Management Plan of Faridkot District Punjab State
Page | 68
Deviwala
23 38 Clay 1538 46 Fresh Sand 846 48 Clay 248 53 Fresh Sand 553 61 Clay 861 65 Fresh Sand 465 72 Clay 772 78 Fresh Sand 678 94 Clay 1694 106 Fresh Sand 12
106 109 Clay 3109 112 Saline Sand 3112 128 Clay 16128 140 Saline Sand 12140 158 Clay 18158 163 Saline Sand 5163 179 Clay 16179 183 Saline Sand 4183 187 Clay 4187 196 Saline Sand 9196 202 Clay 6202 213 Saline Sand 11213 218 Clay 5218 223 Saline Sand 5223 252 Clay 29252 258 Saline Sand 6258 263 Clay 5263 269 Saline Sand 6
Dohak
0 8 Clay 88 10 Fresh Sand 2
10 21 Clay 1121 33 Saline Sand 1233 41 Clay 841 79 Saline Sand 3879 89 Clay 1089 95 Saline Sand 695 99 Clay 499 112 Saline Sand 13
112 116 Clay 4116 139 Saline Sand 23139 154 Clay 15
Aquifer Mapping and Management Plan of Faridkot District Punjab State
Page | 69
154 163 Saline Sand 9
Toot
0 15 Clay 1515 198 Fresh Sand 48
198 21 Clay 1221 474 Fresh Sand 264
474 51 Clay 3651 552 Fresh Sand 42
552 626 Clay 74626 766 Fresh Sand 14766 101 Clay 244101 104 Fresh Sand 3104 113 Clay 9113 116 Fresh Sand 3116 143 Clay 27143 146 Saline Sand 3146 167 Clay 21167 170 Saline Sand 3170 182 Clay 12182 204 Saline Sand 22204 214 Clay 10214 217 Saline Sand 3
Aquifer Mapping and Management Plan of Faridkot District Punjab State
Page | 70
Annexure-IVAQUIFER GROUPING OF WELL LOCATIONS IN FARIDKOT DISTRICT
Well location Depth from Depth to Aquifer Thickness FreshGranular
Zones
SalineGranular
Zones
Dal Singhwala
0 15 Unsaturated Zone 15 215 57 Aquifer Group-IA 42 3457 64 Aquiclude-IA 764 134 Aquifer Group-IB 70 51
134 157 Aquiclude-IB 23157 300 Multiple Aquifers 143 52
Dip Singh Wala
0 5 Unsaturated Zone 5 55 68 Aquifer Group-IA 63 35
68 755 Aquiclude-IA 75755 132 Aquifer Group-IB 565 14 31132 146 Aquiclude-IB 14146 300 Multiple Aquifers 154 755
Golewala
0 4 Unsaturated Zone 4 14 525 Aquifer Group-IA 485 33
525 60 Aquiclude-IA 7560 103 Aquifer Group-IB 43 38
103 155 Aquiclude-IB 52155 300 Multiple Aquifers 145 665
Jaito Mandi
0 14 Unsaturated Zone 14 114 59 Aquifer Group-IA 45 3759 80 Aquiclude-IA 2180 107 Aquifer Group-IB 27 155
107 1555 Aquiclude-IB 4851555 300 Multiple Aquifers 1445 16 515
Kot Kapura
0 9 Unsaturated Zone 9 29 77 Aquifer Group-IA 68 455
77 88 Aquiclude-IA 1188 106 Aquifer Group-IB 18 11 3
106 155 Aquiclude-IB 49155 300 Multiple Aquifers 145 68
Nanak Nagri
0 12 Unsaturated Zone 12 112 46 Aquifer Group-IA 34 18446 69 Aquiclude-IA 2369 131 Aquifer Group-IB 62 77 11
131 165 Aquiclude-IB 34165 2134 Multiple Aquifers 484 97
Nangal 0 9 Unsaturated Zone 9 1
Aquifer Mapping and Management Plan of Faridkot District Punjab State
Page | 71
Nangal
9 41 Aquifer Group-IA 32 2941 72 Aquiclude-IA 3172 124 Aquifer Group-IB 52 41
124 151 Aquiclude-IB 27151 300 Multiple Aquifers 149 43 21
Tehna
0 10 Unsaturated Zone 10 210 41 Aquifer Group-IA 31 18741 59 Aquiclude-IA 1859 106 Aquifer Group-IB 47 33
106 158 Aquiclude-IB 52158 300 Multiple Aquifers 142 50
Wara Daraka
0 4 Unsaturated Zone 4 04 75 Aquifer Group-IA 71 46
75 84 Aquiclude-IA 984 129 Aquifer Group-IB 45 31
129 150 Aquiclude-IB 21150 300 Multiple Aquifers 150 47
Aulakh
0 17 Unsaturated Zone 17 217 46 Aquifer Group-IA 29 2646 76 Aquiclude-IA 3076 113 Aquifer Group-IB 37 1525 305
113 134 Aquiclude-IB 21134 300 Multiple Aquifers 166 6828
Bhagthala
0 4 Unsaturated Zone 4 14 53 Aquifer Group-IA 49 24
53 63 Aquiclude-IA 1063 102 Aquifer Group-IB 39 3237
102 168 Aquiclude-IB 66168 300 Multiple Aquifers 132 6115
Sadhuwala
0 5 Unsaturated Zone 5 55 52 Aquifer Group-IA 47 2151
52 63 Aquiclude-IA 1163 130 Aquifer Group-IB 67 49
130 144 Aquiclude-IB 14144 300 Multiple Aquifers 156 11931
Deviwala
0 8 Unsaturated Zone 8 28 78 Aquifer Group-IA 70 31
78 94 Aquiclude-IA 1694 112 Aquifer Group-IB 18 12 3
112 128 Aquiclude-IB 16128 269 Multiple Aquifers 141 58
Aquifer Mapping and Management Plan of Faridkot District Punjab State
Page | 72
Dohak
0 3 Unsaturated Zone 3 03 79 Aquifer Group-IA 76 2 50
79 89 Aquiclude-IA 1089 139 Aquifer Group-IB 50 42
139 154 Aquiclude-IB 15154 163 Multiple Aquifers 9 9
Toot
0 9 Unsaturated Zone 9 19 55 Aquifer Group-IA 46 354
55 63 Aquiclude-IA 863 116 Aquifer Group-IB 53 25
116 143 Aquiclude-IB 27143 217 Multiple Aquifers 74 31
- कदरीय भमि जल बोरड
-
- जल ससाधन नदी विकास और गगा सरकषण मतरालय
- भारत सरकार
-
- contents naquim faridkotpdf (p1-5)
- Final Faridkot edited 170317pdf (p6-77)
-
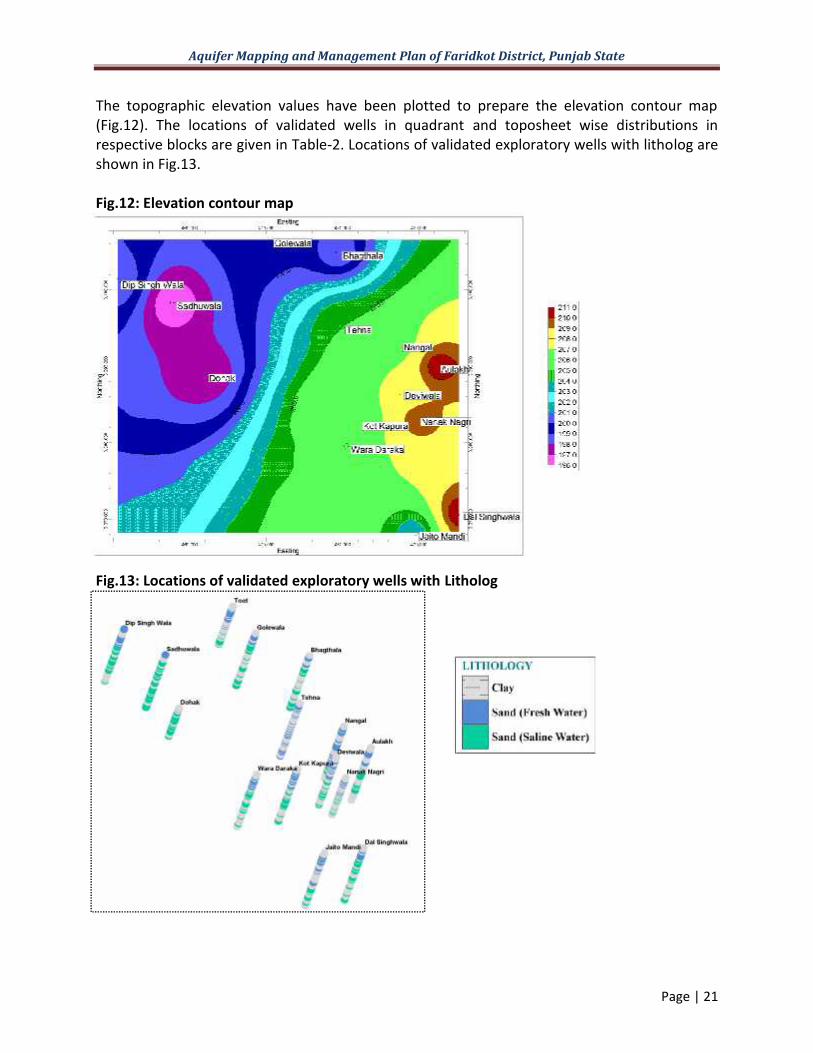
Aquifer Mapping and Management Plan of Faridkot District Punjab State
Page | 29
b In-storage Ground Water ResourcesAs per revised guidelines recommended by the Central Level Expert Group on
groundwater resources assessment the resources are separately considered as dynamic and in-storage unconfined In case of alluvial area in-storage resources of unconfined aquifer havebeen computed on the basis of specific yield of aquifer as detailed below
In-storageGround Water
resources(Unconfined
Aquifer)
=
Thickness of the aquifer(granularproductive zone)
below the zone of water levelfluctuation down to the bottom
layer of unconfined aquifer
x Sp Yield ofthe aquifer
x Areal extentof the
aquifer
The dynamic and in-storage ground water resource estimations have been calculated forsingle aquifer group upto 300m of each block of Faridkot district In-storage ground waterresources are estimated for fresh water and saline water resources based on the geophysicalinterpretations of depth to fresh and saline water interface for each block The fresh and salinecalculations are made on the basis of the assumptions on aquifer that is considered asunconfined aquifer so that the specific yield concept is used for resources estimations (Fig19)The detailed resources estimations are calculated in detailed table for fresh and saline waterresources in the below Table-5 6amp 7
Total Availability of Ground Water Resources = Dynamic Resources + In-storage Resources
Fig19 Conceptual figure to understand the fresh and saline water resources in the aquifer up to300 m for Resource Estimation in Unconfined and Confined Aquifer System
(The clay lenses are more dominant in the aquifer and sometimes huge thickness of clay depositsare also observed in the lithologs)
Aquifer Mapping and Management Plan of Faridkot District Punjab State
Page | 30
Table-5 Block wise In-Storage Ground Water Resources of Fresh Water Aquifer
GENERAL DESCRIPTION OF THE GROUND WATER ASSESSMENT UNIT OF DISTRICT FARIDKOT PUNJAB STATE (2013)
Type of Ground Water Assessment Unit (Block) Faridkot Blocks
SrNo
Name ofAssessment
Unit
Type offormation
Areal extent (sq km) AveragePre-
monsoonWaterLevel
(m bgl)
Depth tobottom of
Aquiferbased on
Geophysical Interface
amp Boreholelogging(m bgl)
TotalThickness
offormation
belowPre-
monsoonWaterLevel(m)
(7-6)
Totalthickness
of theGranularZones up
to thedepth of
FreshWaterZones
(m)
Thicknessof the
unsaturated
granularZones up
to Pre-monsoon
WL(m)
Thicknessof the
saturatedgranularZones up
to thedepth of
Freshwater
aquiferbelow (m)
(9-10)
AverageSpecific
Yield
In-StorageGroundWater
Resourcesup to thedepth of
FreshWater
Aquifer(ham)
51112
TotalGeographical Area
AssessmentArea
FreshWater
1 2 3 4 5 6 7 8 9 10 11 12 13
1 Faridkot Alluvium 75210 36710 450 152 1475 72 2 69 0072 182375
2
KotKapura Alluvium 66650 61650 1069 106 9531 51 3 48 0072 213062Dist Total (ham) 141860 228406 395438Dist Total (mcm) 3954
ham hectare metremcm million cubic metre
Aquifer Mapping and Management Plan of Faridkot District Punjab State
Page | 31
Table-6 Block Wise In-Storage Ground Water Resources of Saline Aquifers upto 300 m Depth
GENERAL DESCRIPTION OF THE GROUND WATER ASSESSMENT UNIT OF DISTRICT FARIDKOT PUNJAB STATE (2013)Type of Ground Water Assessment Unit (Block) Faridkot BlocksSrNo
Name ofAssessment
Unit
Type offormation
Areal extent (ha) Depth tobottom of
Aquifer basedon Geophysical
Interface ampBoreholelogging(m bgl)
Depth tobottom of
Saline WaterAquifer
based onGeophysicalInterface ampBorelogging
(m bgl)
Totalthickness
of theSaline
Water upto the max
depth(m)
Totalthickness of
theGranular
Zones up tothe depth of
SalineWaterZones
(m)
AverageSpecific
Yield
In-StorageGroundWater
Resourcesup to thedepth of
SalineWater
Aquifer(ham)
51011
TotalGeographical
Area
AssessmentArea
Saline Water
1 2 3 4 5 6 7 8 9 10 111 Faridkot Alluvium 75210 38500 152 300 148 103 0072 2855162 Kot Kapura Alluvium 66650 5000 106 300 194 76 0072 27360
Dist Total (ham) 141860 228406 312876Dist Total (mcm) 3129
ham hectare metremcm million cubic metre
Aquifer Mapping and Management Plan of Faridkot District Punjab State
Page | 32
Table-7 Block Wise Total Availability of Fresh and Saline Groundwater Resources upto 300 m Depth and Volume of unsaturatedgranular zone after 3m upto water level
BLOCK WISE AVAILABILITY OF TOTAL GROUNDWATER RESOURCES IN FARIDKOT DISTRICTSlNo BLOCK Volume of
UnsaturatedGranular Zone
up to Pre-monsoon WL
DynamicGroundwater
Resources(2013)
AQUIFER-I
In-storageGroundwater
Resources UPTOFRESHWATER
Total FreshGroundwater
Resources[(4)+(5)] (HAM)
Total SalineGroundwater
Resources[(3)+(4)](HAM)
Total Availability ofGroundwater
Resources [(6)+(7)]
ham mcm
1 2 3 4 5 6 7 8 91 Faridkot 10830 34632 182375 217007 285516 502523 50252 Kot Kapura 14396 26821 213062 239883 27360 267243 2672
DistTotal (ham) 25227 61453 395438 456891 312876 769767 7698DistTotal (mcm) 252 615 3954 4569 3129
ham hectare metremcm million cubic metre
Aquifer Mapping and Management Plan of Faridkot District Punjab State
Page | 33
50 GROUND WATER ISSUES
51 Ground Water DepletionThe Study area is famous for its paddy and non paddy cultivation The quality of ground
water in the area is suitable for irrigation and drinking purposes therefore the ground water isconstantly being pumped for the irrigation due to its easy access through tube wells at shallowdepths and they are the main source of irrigation This will lead to its deepening of groundwater levels in blocks of Faridkot and Kot Kapura of Faridkot district as the recharge of thegroundwater through rainfall and other sources are less than the overall extraction Thehydrographs also shows the declining water level trend over the years in the district (Fig20) andis categorized as over-exploited This declining water table trend if not checked would assumean alarming situation in the near future affecting agricultural production and thus economyGround Water Recharge and Conservation may be carried out in these areas to overcome thedepletion Other than the groundwater depletion quality and rising water table are the otherissues
Fig20 Long term ground water table variation
52 Rising Water tableIn western parts of the area water table is rising due to less withdrawal of ground water
because of brackish saline quality coupled with easy availability of canal water for domesticand irrigation purposes As such these areas are likely to get water logged in near future Thereis an urgent need to arrest the rising water trend in western part and implement anti-waterlogging schemes
Aquifer Mapping and Management Plan of Faridkot District Punjab State
Page | 34
53 Ground Water QualityThe ground water of the study area is alkaline in nature Ground water in the area is
generally fresh to marginally saline with fluoride concentration above permissible limit (15mgL) are found mainly in Nathuwala (603) Killi (429) Kot Kapura (333) Dhilwan Kalan(285)and Bir Sikhanwala (184) Nitrate concentration above permissible limit (45mgl) are found inSukhanwala (46) Sher singhwala (65) Wara Daraka (66) Dhilwan Kalan (72)Nathuwala (79)Chand Bhaja (79) Bir Sikhanwala (89) Nangal (104) Tehna (118) Dal Singhwala(136) Killi (140)and KotKapura (144) and iron concentration above permissible limit (15 mgL)are observed inDeviwala (177) There is growing concern on deterioration of ground water quality due togeogenic and anthropogenic activities
54 Ground Water Irrigation ScenarioAs per the data available from minor irrigation census 2005-06 the detailed number of
shallow deep tube wells lined unlined water distribution system land holdings of wells aregiven in Table-89 amp10
Table-8 Distribution of Tube wells According to Well Ownerrsquos land holding SizeType of
Tube well(TW)
Marginal(0-1 ha)
Small(1-2 ha)
Semi-Medium(2-4 ha)
Medium(4-10ha)
Big(gt10ha)
Total
Shallow TW 1100 4029 10069 14576 5314 35088
Deep TW 29 197 596 1188 468 2478
Total 1129 4226 10665 15764 5782 37566
Table-9 Distribution of Tube wells According to DepthDepth of Tubewells in metres Total depth
Range0-150m
Depth range 0-20 m 20-40 m 40-60 m 60-70 m 70-90m 90-150m gt150 m
Tubewells 3507 9947 9998 11636 543 1744 191 37566
Tubewells () 9 26 27 31 1 5 1
Table-10 System of Ground water distribution deviceOpen Water Channels
Linedpucca Unlinedkutcha Others Total2093 35455 18 37566
Aquifer Mapping and Management Plan of Faridkot District Punjab State
Page | 35
60 MANAGEMENT STRATEGIES AND AQUIFER MANAGEMENT PLAN
Aquifer mapping is leads to groundwater management plans to be implemented byincluding demand side-management and Ground Water Use Efficiency
An outline of the Aquifer Management Plan for each block is given in Part-II Thisincludes details regarding population rainfall average annual rainfall agriculture and irrigationwater bodies ground water resource availability ground water extraction and water levelbehavior Aquifer disposition and various cross sections have also been given Ground waterresources extraction and other issues including ground water resource enhancement anddemand side innervations have been given
Artificial recharge plan is less feasible in the Faridkot District due to very low availabilityof volume of surplus water (959 mcm) Another focus has been given to minimize the grossdraft by enhancing ground water use efficiency in irrigation system after replacing the waterdistribution system from unlinedkutcha channel to Under Ground Pipeline System (UGPS) inover exploited blocks of the district
61 Scope of ImplementationThis plan is focusing on the technical aspects of the ground water recharge through
various means so that various implementing agencies may get the appropriate technicalguidelines The existingongoing schemes of the central or state govt like MANERGA IWSPPMKSY (Prime Minister Krishi Sinchai Yojna) NABARD funded schemes Urban Developmentschemes departmentally funded projects etc may be benefitted from the recharge plan byincorporating the input in the operational guidelines design and for locating the specific sites
Agriculture University engineering Collages Academic and Research Institution NGOmay also take up the pilot or demonstrative projects in the blocks suitable to them to plan atlocal level as per local conditions
62 Potential of Enhancing the Ground Water Use EfficiencyThe micro level transformation in the ground water management have vast impact
potential to counter extensive ground water depletion faced in the state of Punjab particularlyin overexploited blocks
There are around 35455 (out of 37566) tube wells (9438 ) operated by farmers forirrigation through unlinedKutcha open channel system in study area (Table-10) where waterfrom the tube well is discharge to the agricultural field In this process huge (around 25 )(RKVY 2015) quantity of ground water is wasted in soil moisture and evaporation losses
Around 95 of the tube wells are of shallow depth (20 to 70m) and remaining wells aredeeper depth (70 to gt150 m) existed in the area (Table-9) Thus majority of wells are tappingshallow aquifer which is under stress
Dynamic ground water resources (2013) indicate that Gross ground water draft forirrigation in the district is estimated at 94880 mcm It is expected that around 25 of overdraft can be brought down by switching over to undergroundsurface pipeline based
Aquifer Mapping and Management Plan of Faridkot District Punjab State
Page | 36
distribution from the prevailing unlined open channels Thereby gross draft will be reduced to224 mcm (Table-11a) assuming that there is no crop diversification by the farmers
The benefit will lead to saving of precious ground water resources in overexploitedblocks The measure if implemented will bring down the ground water overdraft from 160 to123 The category of the blocks will also improve resulting in boosting of agriculture andindustrial development otherwise not sustainable in over-exploited blocks (Table-11b)
The tube wells also consume enormous electricity which is subsidized and governmentincur significant revenue on this account The measures therefore will result in saving of energyand money Pollution impact will be reduced whenever diesel engines are used by the farmersThe environmental and ecological condition in the irrigated land will improve Unwanted weedgrowth will also be controlled inside the farm land It is expected to save 1 of the agriculturalland occupied by open channels which can be utilized for cultivation purpose Heavy groundwater overdraft can be reduced by these efforts This will ensure more crops per drop
63 Water saving Potential from Crop Diversification-Change Paddy to MaizeSoya-beanAs the requirement of water for paddy is much high therefore by changing paddy to
maizesoya-bean will help in saving of water For estimating the water saving by cropdiversification it is assumed that one mcm of water will be saved in case of maize or soyabeanplanted in one sq km of land In case of pulses even higher amount of ground water can besaved
The block wise saving of water in mcm by applying various management strategies suchas crop diversification Under Ground Pipe lines (UGPL) in individual land and artificial rechargemethods are given in tables 11a b
Table-11a Scope of Quantitative Impact on Stage of Development after applying variousmanagement strategies in mcm
Block Net GroundWater
Availability(mcm)
TotalIrrigation
Draft(mcm)
PresentStage of
draft(SOD)
() (Asper
2013)
Reduction in draft by different watersaving method
SODafterwards
()
Change ofpaddy
cultivationarea ( ofexisting)
Replacewater
coursesby UGPipes
(mcm)
AdoptArtificialrecharge
(mcm)
ChangePaddy
toMaize(mcm)
Total(mcm)
(2+3+4)
1 2 3 4 5Faridkot 34632 52861 158 12472 484 7245 20201 9969 -
Kot Kapura 26821 42020 162 9915 475 6264 16654 9986 -Total 61453 94880 160 22387 959 13567 36913 9948
Aquifer Mapping and Management Plan of Faridkot District Punjab State
Page | 37
Table-11b Impact on Stage of Development (SOD) after applying various managementstrategies in Faridkot District
Block PresentSOD ()
as on2013
Reductionin SOD ()
afterunlinedchannel
()
ResultantSOD ()
Col(2 - 3)
Reduction inStage of
developmentafter crop
diversificationby
MaizeSoyabean()
ResultantSOD ()
Col(2 - 5)
Reduction inStage of
developmentafter Artificialrecharge ()
ResultantSOD ()
Col(2 - 7)
1 2 3 4 5 6 7 8Faridkot 158 3601 12199 2090 13710 140 15660
KotKapura 162 3697 12503 2340 13860 177 16023
Total 160 3664 12336 2210 13790 178 15822
By adopting all the management strategies resulting in total reduction in stage of groundwaterdevelopment is 6052 Hence overall stage of development afterwards is 9948 and is givenin Table12
Table-12 Overall Stage of Development (SOD) after reduction in Faridkot
Block PresentStage of
development() as on
2013
Reduction instage of
developmentafter unlinedchannel ()
Reduction inStage of
developmentafter crop
diversificationby
MaizeSoyabean()
Reduction inStage of
developmentafter Artificialrecharge ()
TotalReduction in
Stage ofdevelopment
()
(3 +4+5)
Stage ofdevelopmentafterwards
()
(2-6)
1 2 3 4 5 6 7Faridkot 158 3601 2090 140 5831 9969
Kot Kapura 162 3697 2340 177 6214 9986Total 160 3664 2210 178 6052 9948
Aquifer Mapping and Management Plan of Faridkot District Punjab State
Page | 38
70 CONCLUSIONS1 The area lies in the central part of Satluj basin of Indo-Gangetic Alluvial plain
Geologically the area is occupied by a thick sequence of Quaternary deposits of Mid-Pleistocene to Recent age
2 The Principle Aquifer system in the study area is Alluvium and the Major Aquifers areOlder Alluvium and Aeolian Alluvium
3 Lithological characteristics of the area are Multi-cyclic light grey to brown fine tomedium grained mixture of clay silt and sand with Kankar
4 Thick layering of clay with sand at many places can be observed towards south of thedistrict at deeper depths The Ground water occurs in unconfined (water table) andconfined conditions
5 Chemical data of ground water from shallow aquifer indicates that ground water isalkaline and fresh to moderately saline
6 To delineate fresh water - saline water interface laterally as well as vertically surfacegeophysical investigations have been carried out in alluvial tracts
7 To understand the sub surface disposition geological sections and fence diagram havebeen prepared by synthesizing the various sub-surface sections on the basis of study ofthe lithological logs and electrical logs of boreholes drilled by CGWB WRED PSTC andPrivate Agencies using the RockWorks15 software
8 Aquifer IA (Very Shallow Aquifer) extends maximum upto 70 m of depth and below thatclay layer starts getting thickened about 10-12m separating Aquifer IB to a maximumdepth of 123 m Multi layer aquifers are existing in the area each aquifer is separated bythick clay zones of 25 to 40 m upto 300m depth It is very difficult to differentiate theaquifer groups after Aquifer Group I so the whole lithology is considered to be a singleaquifer group system
9 Stage of Ground Water Development of the district is 160 on the basis of Dynamicground water resources 2013 In- storage ground water resources has also beencalculated up to a depth of 300 meters
10 The fresh water resources are inadequate in aquifer upto maximum depth of 106mwhereas saline water is dominant resources below 106 m depth upto 300 m In thenorth of the district towards Faridkot block fresh water is available upto 152m depth
11 Dynamic ground water resources of the study area are 61453 mcm whereas In-storageground water resources up to fresh water zones are 3954 mcm Thus total fresh groundwater resources up to maximum depth of 152 m are 4569 mcm Total saline waterresources up to depth of 300 m are 3129 mcm
12 Main groundwater issues in the area are groundwater depletion quality and risingwater table
13 Considering the high ground water abstraction for irrigation (94880 mcm) andoverdraft (37157 mcm) it is suggested that proposed artificial recharge measures (959mcm) crop diversification measures (13567 mcm) and conserving ground waterthrough laying of underground pipe line (22387 mcm) will be useful
14 Other techniques of water saving and modern irrigation technology to be enforced tomaximize per drop of water use in the district and also to think about the hidden salinewater resources and for its utilizations
Aquifer Mapping and Management Plan of Faridkot District Punjab State
Page | 39
BLOCK WISE
AQUIFER MAPS
AND
MANAGEMENT PLAN
(PART-II)
Aquifer Mapping and Management Plan of Faridkot District Punjab State
Page | 40
I Salient Information of Faridkot Block
Block Area(in Km2)
75210 sq km
District State Faridkot PunjabPopulation Urban Population 2260
Rural Population 179432Total population 181692
Rainfall NormalMonsoon 335 mm
Non-monsoon Rainfall 35 mmAnnual Average Rainfall 349 mm
Agriculture and Irrigation Principal crops Wheat Cotton and PaddyGross cropped area 119562 sq kmNet sown area 59180 sq kmIrrigation practices Canal and Tube well IrrigationCropping intensity 202Area underGround water Irrigation 6159 sq kmSurface water irrigation 51143 sq kmNumber and types of abstraction structures 20927 Tubewells
Ground Water ResourceAvailability and Extraction
Ground water Resources AvailabilityTotal Ground Water Resources available is 5025 mcm (fresh andsaline water) up to the depth of 300m The fresh water resourcesare estimated up to the depth of 152 m on the basis of geophysicalinterpretations The potential granular zones available for freshwater are calculated as 72 m Saline water resources are estimatedon the basis of available well depth (up to 300 m) and the granularzones are counted after depth of 152 m and available zones are 103m Block is categorized as Over-Exploited as per DynamicGroundwater Resources 2013 assessment
Ground water Resources ExtractionDeeper aquifers are marginal to highly saline and not suitable forirrigation purpose as such all users are tapping shallow aquifersDrinking water supply wells of State Government tapping shallowaquifers Therefore the ground water draft could not be assessed fordeeper aquifer
Aquifer Mapping and Management Plan of Faridkot District Punjab State
Page | 41
Existing and future waterdemands
Existing Gross Ground water Draft as on 2013Irrigation 52861 mcmDomestic and industrial water supply 1911 mcmFuture water demandsIrrigation development potential (-)2045 mcmDomestic and industrial water supply up to 2025 years 2219 mcm
Water level behavior Aquifer wise water levelAquifer-IPre Monsoon 145 ndash 1522 m bglPost Monsoon 120 ndash 1310 m bglMean (10 yrs) 100 ndash (-)101 myrTrendsPre Monsoon 018 ndash (-)022 myrPost Monsoon 024 ndash (-)030 myrAquifer-IINo Monitoring stations
Aquifer-IIINo Monitoring stations
HYDROGRAPH SHOWING DECLINING WATER TABLE
Aquifer Mapping and Management Plan of Faridkot District Punjab State
Page | 42
HYDROGRAPH SHOWING DECLINING WATER TABLE
HYDROGRAPH SHOWING DECLINING WATER TABLE
Monitoring well Golewala dried after 2004
Aquifer Mapping and Management Plan of Faridkot District Punjab State
Page | 43
Aquifer Disposition
Number of aquifers 1
Principal aquifer AlluviumMajor Aquifer Older Alluvium Aeolian Alluvium
Exploratory Data AvailabilitySource of Data No of exploration wells as per depth range (m) Total
lt100 100-200 200-300 gt300
CGWB 1 0 0 4 5WREDPSTCWSS 6 1 0 2 9PRIVATE 0 0 0 0 0TOTAL 7 1 0 6 14
Aquifer wise Characteristics (CGWB 2012)AquiferGroup
Geology Type ofAquifer
ThicknessofGranularzones (m)
Transmissivity(m2day)
YieldDischarge
(m3day)
SpecificYield
Storativity
SingleAquiferSystem
Quarter-naryAlluvialdeposits
Unconfined toconfined
175 474 - 2660 939 -55944
12 (0072)
175 x 10-3
-18 x 10-3
Well field proposed in adjacent blockThe Aquifer comprises of fresh and saline water and the major aquifer material is sand Theaquiclude and aquitard comprises of clay clay with siltExploratory Data Validated
Source of Data No of exploration wells as per depth range (m) Totallt100 100-200 200-300 gt300
CGWB 0 0 0 4 4WREDPSTCWSS 0 0 0 2 2PRIVATE 0 0 0 0 0TOTAL 0 0 0 6 6
The data is validated by selecting the deepest well in each quadrant and used for preparation of3-D Litho models 2-D Geological Cross Sections Fence Diagrams and Aquifer Maps
Aquifer Mapping and Management Plan of Faridkot District Punjab State
Page | 44
3-D Lithological Model of Faridkot Block
Lithological Cross Section from Dip Singh Wala to Nangal
Lithological Cross Section from Toot to Nangal
Aquifer Mapping and Management Plan of Faridkot District Punjab State
Page | 45
3-D Lithological Fence Diagram
3-D Aquifer Disposition Fence Diagram
Aquifer Mapping and Management Plan of Faridkot District Punjab State
Page | 45
3-D Lithological Fence Diagram
3-D Aquifer Disposition Fence Diagram
Aquifer Mapping and Management Plan of Faridkot District Punjab State
Page | 45
3-D Lithological Fence Diagram
3-D Aquifer Disposition Fence Diagram
Aquifer Mapping and Management Plan of Faridkot District Punjab State
Page | 46
Ground water Resource Extraction Contamination and other issues in Faridkot Block
Ground WaterResources upto thedepth of 300m
Dynamic Fresh waterresources
34632 mcm
In-storage Fresh waterresources
182375 mcm
In-storage Saline waterresources
285516 mcm
Total 502523 mcmGround WaterExtraction (as per 2013)
Irrigation 52861 mcm
Domestic amp Industrial 1911 mcm
Future Demand for domestic amp Industrial sector(2025) (as per 2013)
2219 mcm
Stage of Groundwater Development 158
Chemical Quality of ground water Ground water in the area is alkaline and pHranges between 794 to 917 Groundwater in the area is fresh to marginal salineEC value of ground water show widevariations and ranges from 444 Scm to8653Scm at 250CRSC values vary from (ndash) 73 to 113 meqLarea is fit for irrigation
Ground water Contamination Issues Fluoride (mgl)Nathuwala (603) Killi(429)Nitrate (mgl)Sukhanwala (46) Sher Singhwala (65)Nathuwala (79) Chand Baja (79) Nangal(104) Tehna (118) Killi (140)Iron (mg)Devi wala (177)
Other issues Water level decline has been observed inmajor parts of the block due to indiscriminate development of ground waterresourcesIn shallow water level area lessdevelopment of ground water resourcecouple with recharge from canal irrigationis causing water logging and inland salinityproblems
Aquifer Mapping and Management Plan of Faridkot District Punjab State
Page | 47
Ground water Resource Enhancement Potential
Aquifer wise space available for recharge and proposed interventions (Supply Side Measures)
Aquifer-I
Volumes of unsaturated zone after 3m upto a desirable depth 10830 mcmSource water requirementavailability for recharge Rain Canal Irrigation return flowTypes and number of structures NAOther interventions proposed Artificial Recharge Roof top Rainwater harvesting will conserve484 mcm volume of water
Demand side interventions
Advanced Irrigation PracticesArea proposed to be covered Entire Block Faridkot (75210 sq km)Volume of Water expected to be conserved under advanced irrigation practices such as lining ofunderground pipelines (Kutcha channel) 12472 mcm
Required Change in cropping pattern
Proposed change in cropping pattern Paddy to Maize Soyabean The overexploitation can bemanaged at sustainable level (100) by changing the Paddy cropArea coverage 15 of the total paddy area needs to change ie7245 sq kmAnticipated volume of water to be saved 7245 mcm
Net AnnualGroundWater
Availability2013
(mcm)
TotalIrrigation Draft
(present)(mcm)
GrossDraft alluses(present)(mcm)
Paddyarea
(Sq km)
RequiredArea to
beChange
fromPaddy toMaize
soyabean
(Sq km)
Amountof
WaterSaved(mcm)
Grossdraftafter
savingof water(mcm)
PresentStage of
development ()
Reductionin Stage ofdevelopme
nt afterMaize
soya bean()
CropDiversifiedarea ()
34632 52861 54771 48300 7245 7245 45616 158 209 15
Alternate Water sourcesSurface water sources Tanks PondsLocation details and availability from such sources outside the area Not AvailableRegulation and Control
Punjab Subsoil Act for delay in paddy plantation should continue in the area
Aquifer Mapping and Management Plan of Faridkot District Punjab State
Page | 48
Other interventions proposed if anyModern Irrigation Practices be adopted for Rabi crops Some of the techniques are given in
the table below (PAU Ludhiana)
SlNo Techniques Water Saving()
Crops
1 Mulching 17 Wheat2 Bed Planting 18-25 Wheat3 Use of Sprinkler and drip
Irrigation70-90 Sugarcane Cotton Sunflower Maize
Other than that by 15 days ponding followed by 2 days of drying can lead to 25 saving of water inpaddy crop
Aquifer Mapping and Management Plan of Faridkot District Punjab State
Page | 49
II Salient Information of Kot Kapura Block
Block Area(in Km2)
66650 sq km
District State Faridkot PunjabPopulation Urban Population 373
Rural Population 221025Total population 221398
Rainfall Normal Monsoon 328 mmNon-monsoon Rainfall 61 mmAnnual Average Rainfall 370 mm
Agriculture and Irrigation Principal crops Wheat Cotton and PaddyGross cropped area 133427 sq kmNet sown area 67498 sq kmIrrigation practices Canal and Tube well IrrigationCropping intensity 198Area underGround water Irrigation 4278 sq kmSurface water irrigation 62899 sq kmNumber and types of abstraction structures 16639 Tubewells
Ground Water ResourceAvailability and Extraction
Ground water Resources AvailabilityTotal Ground Water Resources available is 2672 mcm (fresh andsaline water) up to the depth of 300 m The fresh water resourcesare estimated up to the depth of 106 m on the basis of geophysicalinterpretations The potential granular zones available for freshwater are 51 m Saline water resources are estimated on the basis ofwell (up to 300 m) and the granular zones are counted after depth of106 m and available zones are 76 m Block is categorized as Over-Exploited as per Dynamic Groundwater Resources 2013 assessment
Ground water Resources ExtractionDeeper aquifers are marginal to highly saline and not suitable forirrigation purpose as such all users are tapping shallow aquifersDrinking water supply wells of State Government tapping shallowaquifers Therefore the ground water draft could not be assessed fordeeper aquifer
Aquifer Mapping and Management Plan of Faridkot District Punjab State
Page | 50
Existing and future waterdemands
Existing Gross Ground water Draft as on 2013Irrigation 42020 mcmDomestic and industrial water supply 1402 mcmFuture water demandsIrrigation development potential (-)16709 mcmDomestic and industrial water supply up to 2025 years 1511 mcm
Water level behavior Aquifer wise water levelAquifer-IPre Monsoon 235 ndash 1600 m bglPost Monsoon 155 ndash 1820 m bglMean (10 yrs) 158 ndash (-)086 myrTrendsPre Monsoon 016 ndash (-)026 myrPost Monsoon 015 ndash (-)029 myrAquifer-II (156m)Pre Monsoon 772 m bglPost Monsoon 805 m bglAquifer-III (269m)Pre Monsoon NAPost Monsoon 820 m bgl
HYDROGRAPH SHOWING DECLINING WATER TABLE
Aquifer Mapping and Management Plan of Faridkot District Punjab State
Page | 51
HYDROGRAPH SHOWING DECLINING WATER TABLE
HYDROGRAPH SHOWING DECLINING WATER TABLE
Aquifer Mapping and Management Plan of Faridkot District Punjab State
Page | 52
Aquifer Disposition
Number of aquifers 1
Principal aquifer AlluviumMajor Aquifer Older Alluvium Aeolian Alluvium
Exploratory Data AvailabilitySource of Data No of exploration wells as per depth range (m) Total
lt100 100-200 200-300 gt300
CGWB 2 1 1 4 8WREDPSTCWSS 8 0 0 1 9PRIVATE 1 0 1 0 2TOTAL 11 1 2 5 19
Aquifer wise Characteristics (CGWB2015)AquiferGroup
Geology Type ofAquifer
ThicknessofGranularzones (m)
Transmi-ssivity(m2day)
Yield(m3day)
SpecificYield
Storativity
SingleAquiferSystem
QuaternaryAlluvialdeposits
Unconfinedto confined
127 547 -2990
3668 12 (0072) 72x10-4
Well field proposed in this block (Site Location Deviwala)The Aquifer comprises of fresh and saline water and the major aquifer material is sand Theaquiclude and aquitard comprises of clay clay with siltExploratory Data Validated
Source of Data No of exploration wells as per depth range (m) Totallt100 100-200 200-300 gt300
CGWB 0 0 1 4 5WREDPSTCWSS 0 0 0 1 1PRIVATE 0 0 1 0 1TOTAL 0 0 2 5 7
The data is validated by selecting the deepest well in each quadrant and used for preparation of3-D Litho models 2-D Geological Cross Sections Fence Diagrams and Aquifer Maps
Aquifer Mapping and Management Plan of Faridkot District Punjab State
Page | 53
3-D Lithological model of Kot Kapura Block
Lithological Cross section from Wara Daraka to Aulakh
Lithological Cross section from Nangal to Dal Singhwala
Aquifer Mapping and Management Plan of Faridkot District Punjab State
Page | 54
3-D Lithological Fence Diagram
3-D Aquifer Disposition Fence Diagram
Aquifer Mapping and Management Plan of Faridkot District Punjab State
Page | 54
3-D Lithological Fence Diagram
3-D Aquifer Disposition Fence Diagram
Aquifer Mapping and Management Plan of Faridkot District Punjab State
Page | 54
3-D Lithological Fence Diagram
3-D Aquifer Disposition Fence Diagram
Aquifer Mapping and Management Plan of Faridkot District Punjab State
Page | 55
Ground water Resource Extraction Contamination and other issues in Kot Kapura Block
Ground WaterResources upto thedepth of 300m
Dynamic Fresh waterresources
26821 mcm
In-storage Fresh waterresources
213062 mcm
In-storage Saline waterresources
27360 mcm
Total 267243 mcmGround WaterExtraction (as per 2013)
Irrigation 42020 mcm
Domestic amp Industrial 1402 mcm
Future Demand for domestic amp Industrial sector(2025) (as per 2013)
1511 mcm
Stage of Groundwater Development 162
Chemical Quality of ground water Ground water in the area is alkaline and pHranges between 820 to 893 Ground waterin the area is slightly fresh to marginalsaline EC value of the ground water showwide variations and ranges from 1154Scm to 3988 Scm at 250CRSC values are varies from -003 to 1100meqL and the area is fit for irrigation
Ground water Contamination Issues Fluoride (mgl)Kot Kapura (333) Dhilwan kalan (285)Moharewala ( 195) Bir Sikhanwala ( 184)Nitrate (mgl)Wara Daraka (66) Dhilwan Kalan (72)Moharewala (78) Bir sikhan wala (89)KotKapura (144)
Other issues Water level decline has been observed inmajor parts of the block due to indiscriminate development of ground waterresourcesIn shallow water level area lessdevelopment of ground water resourcecouple with recharge from canal irrigation iscausing water logging and inland salinityproblems
Aquifer Mapping and Management Plan of Faridkot District Punjab State
Page | 56
Ground water Resource Enhancement Potential
Aquifer wise space available for recharge and proposed interventions (Supply Side Measures)
Aquifer-I
Volume of unsaturated zone after 3m upto a desirable depth 14396 mcmSource water requirementavailability for recharge Rain Canal Irrigation return flowTypes and number of structures NAOther interventions proposed Artificial Recharge Roof top Rainwater harvesting will conserve475 mcm volume of water
Demand side interventions
Advanced Irrigation PracticesArea proposed to be covered Entire Kot Kapura Block (66650 sq km)Volume of Water expected to be conserved under advanced irrigation practices such as lining ofunderground pipelines (Kutcha channel) etc 9915 mcm
Required Change in cropping pattern
Proposed change in cropping pattern Rice to Maize Soyabean The overexploitation can bemanaged at sustainable level (100) by changing the Paddy cropArea coverage 12 of the total rice area needs to change ie 6264 sq kmAnticipated volume of water to be saved 6264 mcm
Net AnnualGroundWater
Availability2013
(mcm)
TotalIrrigation Draft
(present)(mcm)
GrossDraft alluses(present)(mcm)
Paddyarea
(Sq km)
RequiredArea to be
Changefrom
Paddy toMaize
soya bean(Sq km)
Amountof
WaterSaved(mcm)
Grossdraftafter
savingof water(mcm)
PresentStage of
development ()
Reductionin Stage ofdevelopme
nt afterMaize
soya bean()
CropDiversifiedarea ()
26821 42020 43421 52200 6264 6264 35756 162 234 12
Alternate Water sourcesSurface water sources Tanks PondsLocation details and availability from such sources outside the area Not AvailableRegulation and Control
Punjab Subsoil Act for delay in paddy plantation should continue in the area
Other interventions proposed if anyModern Irrigation Practices be adopted for Rabi crops Some of the techniques are given in
the table below (PAU Ludhiana)
Aquifer Mapping and Management Plan of Faridkot District Punjab State
Page | 57
SlNo Techniques Water Saving()
Crops
1 Mulching 17 Wheat2 Bed Planting 18-25 Wheat3 Use of Sprinkler and drip
Irrigation70-90 Sugarcane Cotton Sunflower Maize
Other than that by 15 days ponding followed by 2 days of drying can lead to 25 saving of water inpaddy crop
Aquifer Mapping and Management Plan of Faridkot District Punjab State
Page | 58
Annexure-I
Nd Not Determined BDL Below Detection Limit
Aquifer Mapping and Management Plan of Faridkot District Punjab State
Page | 59
Annexure-IIData Availability of Exploration Wells of Faridkot district
SlNo LOCATION LONGITUDE LATITUDE DEPTH ELEVATION BLOCK DEPARTMENT1 Dal Singhwala 74950 30469 300 211 Kot Kapura CGWB2 Dip Singh Wala 74483 30742 300 201 Faridkot CGWB3 Golewala 74692 30792 300 1995 Faridkot CGWB4 Jaito Mandi 74891 30446 300 203 Kot Kapura CGWB5 Kot Kapura 74814 30576 300 206 Kot Kapura CGWB6 Nanak Nagri 74893 30581 200 210 Kot Kapura PRIVATE7 Nangal 74869 30669 300 206 Faridkot CGWB8 Tehna 74790 30690 300 205 Faridkot CGWB9 Wara Daraka 74797 30548 300 205 Kot Kapura CGWB
10 Aulakh 74920 30643 300 211 Kot Kapura PSTC11 Bhagthala 74786 30777 300 198 Faridkot PSTC12 Sadhuwala 74559 30717 300 196 Faridkot PSTC13 Deviwala 74870 30612 269 207 Kot Kapura CGWB14 Deviwala-I 74870 30612 156 207 Kot Kapura CGWB15 Kouni 74675 30760 60 194 Faridkot WSS16 Ghugiana 74639 30746 60 198 Faridkot WSS17 Pahluwala 74763 30799 60 203 Faridkot WSS18 Faridkot 74763 30681 60 203 Faridkot WSS19 Doda Bhundar 75016 30470 121 212 Kot Kapura WRED20 Dhudi 74849 30700 60 207 Faridkot WSS21 Ratti Rori 74811 30647 60 208 Faridkot WSS22 Chak Kalyan 74705 30572 60 203 Kot Kapura WSS23 Kot Kapura 74812 30596 60 208 Kot Kapura WSS24 Behbal Kalan 74913 30531 60 210 Kot Kapura WSS25 Rorian Kapura 74815 30439 60 207 Kot Kapura WSS26 Panjgrain 74914 30608 70 211 Kot Kapura PRIVATE27 Fatehgarh 74943 30405 60 208 Kot Kapura WSS
28Bhurj JawarSingh 74987 30535 60 211 Kot Kapura WRED
29 Dewarana 74766 30593 30 206 Kot Kapura WRED30 Sher Singhwala 74628 30665 65 195 Faridkot CGWB31 Bir Sikhan wala 74849 30627 65 207 Kot Kapura CGWB32 Dohak 74603 30632 163 197 Muktsar CGWB33 Toot 74645 30829 217 196 Ghal khurd CGWB
Two exploratory wells from adjacent districts ie Dohak from Muktsar district and Toot fromFerozpur district have been incorporated for the preparation of lithological fence and crosssections
Aquifer Mapping and Management Plan of Faridkot District Punjab State
Page | 60
Annexure-IIILITHOLOGICAL DATA OF WELLS IN FARIDKOT DISTRICT
Well Location Depth from Depth to Lithology Thickness
Dal Singhwala
0 13 Clay 1313 20 Fresh Sand 720 28 Clay 828 57 Fresh Sand 2957 64 Clay 764 75 Saline Sand 1175 78 Clay 378 97 Saline Sand 1997 108 Clay 11
108 117 Saline Sand 9117 122 Clay 5122 134 Saline Sand 12134 157 Clay 23157 173 Saline Sand 16173 179 Clay 6179 184 Saline Sand 5184 211 Clay 27211 219 Saline Sand 8219 253 Clay 34253 259 Saline Sand 6259 278 Clay 19278 293 Saline Sand 15293 298 Clay 5298 300 Saline Sand 2
Dip Singh Wala
0 8 Fresh Sand 88 36 Clay 28
36 68 Fresh Sand 3268 755 Clay 75
755 805 Fresh Sand 5805 83 Clay 2583 92 Fresh Sand 992 93 Clay 193 109 Saline Sand 16
109 113 Clay 4113 116 Saline Sand 3116 120 Clay 4120 132 Saline Sand 12
Aquifer Mapping and Management Plan of Faridkot District Punjab State
Page | 61
Dip Singh Wala 132 146 Clay 14146 162 Saline Sand 16162 168 Clay 6168 192 Saline Sand 24192 195 Clay 3195 197 Saline Sand 2197 2015 Clay 45
2015 209 Saline Sand 75209 2135 Clay 45
2135 2175 Saline Sand 42175 221 Clay 35221 237 Saline Sand 16237 2865 Clay 495
2865 2895 Saline Sand 32895 293 Clay 35293 296 Saline Sand 3296 300 Clay 4
Golewala
0 75 Clay 7575 2885 Fresh Sand 2135
2885 40 Clay 111540 525 Fresh Sand 125
525 60 Clay 7560 88 Saline Sand 2888 93 Clay 593 103 Saline Sand 10
103 1325 Clay 2951325 1375 Saline Sand 51375 155 Clay 175155 1575 Saline Sand 25
1575 182 Clay 245182 2035 Saline Sand 215
2035 2285 Clay 252285 234 Saline Sand 55234 253 Clay 19253 2725 Saline Sand 195
2725 280 Clay 75280 2975 Saline Sand 175
2975 300 Clay 25Jaito Mandi 0 15 Clay 15
15 25 Fresh Sand 1025 28 Clay 3
Aquifer Mapping and Management Plan of Faridkot District Punjab State
Page | 62
Jaito Mandi 28 42 Fresh Sand 1442 46 Clay 446 59 Fresh Sand 1359 80 Clay 2180 915 Fresh Sand 115
915 103 Clay 115103 107 Fresh Sand 4107 1555 Clay 485
1555 1715 Fresh Sand 161715 191 Clay 195191 213 Saline Sand 22213 220 Clay 7220 223 Saline Sand 3223 238 Clay 15238 255 Saline Sand 17255 273 Clay 18273 2785 Saline Sand 55
2785 2805 Clay 22805 283 Saline Sand 25283 2985 Clay 155
2985 300 Saline Sand 15
Kot Kapura
0 14 Clay 1414 21 Fresh Sand 721 25 Clay 425 355 Fresh Sand 105
355 37 Clay 1537 50 Fresh Sand 1350 57 Clay 757 64 Fresh Sand 764 69 Clay 569 77 Fresh Sand 877 88 Clay 1188 99 Fresh Sand 1199 103 Clay 4
103 106 Saline Sand 3106 123 Clay 17123 1286 Saline Sand 56
1286 130 Clay 14130 1326 Saline Sand 26
1326 134 Clay 14134 1355 Saline Sand 15
Aquifer Mapping and Management Plan of Faridkot District Punjab State
Page | 63
Kot Kapura
1355 1492 Clay 1371492 1518 Saline Sand 261518 155 Clay 32155 1584 Saline Sand 34
1584 161 Clay 26161 1796 Saline Sand 186
1796 1812 Clay 161812 1838 Saline Sand 261838 1865 Clay 271865 2045 Saline Sand 182045 207 Clay 25207 2125 Saline Sand 55
2125 249 Clay 365249 2545 Saline Sand 55
2545 280 Clay 255280 2944 Saline Sand 144
2944 300 Clay 56
Nanak Nagri
0 136 Clay 136136 208 Fresh Sand 72208 265 Clay 57265 305 Fresh Sand 4305 34 Clay 3534 368 Fresh Sand 28
368 388 Clay 2388 40 Fresh Sand 1240 428 Clay 28
428 46 Fresh Sand 3246 695 Clay 235
695 712 Fresh Sand 17712 785 Clay 73785 815 Fresh Sand 3815 84 Clay 2584 87 Fresh Sand 387 92 Clay 592 936 Saline Sand 16
936 988 Clay 52988 100 Saline Sand 12100 1085 Clay 85
1085 1115 Saline Sand 31115 118 Clay 65118 120 Saline Sand 2
Aquifer Mapping and Management Plan of Faridkot District Punjab State
Page | 64
Nanak Nagri 120 128 Clay 8128 1296 Saline Sand 16
1296 130 Clay 04130 1316 Saline Sand 16
1316 135 Clay 34135 1368 Saline Sand 18
1368 165 Clay 282165 1676 Saline Sand 26
1676 184 Clay 164184 1868 Saline Sand 28
1868 1905 Clay 371905 1948 Saline Sand 431948 2134 Clay 186
Nangal
0 8 Clay 88 20 Fresh Sand 12
20 23 Clay 323 28 Fresh Sand 528 29 Clay 129 41 Fresh Sand 1241 72 Clay 3172 80 Fresh Sand 880 91 Clay 1191 124 Fresh Sand 33
124 151 Clay 27151 158 Fresh Sand 7158 163 Clay 5163 171 Fresh Sand 8171 181 Clay 10181 187 Fresh Sand 6187 193 Clay 6193 199 Fresh Sand 6199 203 Clay 4203 219 Fresh Sand 16219 224 Clay 5224 233 Saline Sand 9233 243 Clay 10243 249 Saline Sand 6249 251 Clay 2251 257 Saline Sand 6257 300 Clay 43
Tehna 0 8 Clay 8
Aquifer Mapping and Management Plan of Faridkot District Punjab State
Page | 65
Tehna
8 23 Fresh Sand 1523 28 Clay 528 32 Fresh Sand 432 37 Clay 537 41 Fresh Sand 441 59 Clay 1859 63 Fresh Sand 463 69 Clay 669 72 Fresh Sand 372 102 Clay 30
102 106 Fresh Sand 4106 120 Clay 14120 123 Fresh Sand 3123 133 Clay 10133 136 Fresh Sand 3136 145 Clay 9145 150 Fresh Sand 5150 158 Clay 8158 163 Fresh Sand 5163 168 Clay 5168 172 Fresh Sand 4172 176 Clay 4176 184 Fresh Sand 8184 210 Clay 26210 215 Fresh Sand 5215 221 Clay 6221 225 Fresh Sand 4225 254 Clay 29254 264 Fresh Sand 10264 267 Clay 3267 275 Fresh Sand 8275 294 Clay 19294 300 Fresh Sand 6
Wara Daraka
0 15 Clay 1515 22 Fresh Sand 722 28 Clay 628 48 Fresh Sand 2048 52 Clay 452 61 Fresh Sand 961 65 Clay 465 75 Fresh Sand 10
Aquifer Mapping and Management Plan of Faridkot District Punjab State
Page | 66
Wara Daraka
75 84 Clay 984 86 Saline Sand 286 91 Clay 591 97 Saline Sand 697 101 Clay 4
101 119 Saline Sand 18119 124 Clay 5124 129 Saline Sand 5129 150 Clay 21150 172 Saline Sand 22172 184 Clay 12184 188 Saline Sand 4188 196 Clay 8196 205 Saline Sand 9205 234 Clay 29234 239 Saline Sand 5239 274 Clay 35274 281 Saline Sand 7281 300 Clay 19
Aulakh
0 1829 Clay 18291829 4573 Fresh Sand 27444573 7621 Clay 30487621 9146 Fresh Sand 15259146 10975 Clay 1829
10975 1128 Saline Sand 3051128 13414 Clay 2134
13414 16768 Saline Sand 335416768 20112 Clay 334420112 21036 Saline Sand 92421036 21341 Clay 30521341 21951 Saline Sand 6121951 2256 Clay 6092256 245 Saline Sand 194245 300 Clay 55
Bhagthala
0 35 Clay 3535 1829 Fresh Sand 1479
1829 41 Clay 227141 53 Fresh Sand 1253 63 Clay 1063 8537 Saline Sand 2237
8537 92 Clay 663
Aquifer Mapping and Management Plan of Faridkot District Punjab State
Page | 67
92 102 Saline Sand 10102 1311 Clay 291
1311 13415 Saline Sand 30513415 16768 Clay 335316768 17073 Saline Sand 30517073 185 Clay 1427
185 203 Saline Sand 18203 22866 Clay 2566
22866 23476 Saline Sand 6123476 253 Clay 1824
253 273 Saline Sand 20273 280 Clay 7280 294 Saline Sand 14294 300 Clay 6
Sadhuwala
0 61 Fresh Sand 6161 3049 Clay 2439
3049 52 Saline Sand 215152 625 Clay 105
625 725 Saline Sand 10725 77 Clay 4577 84 Saline Sand 784 91 Clay 791 107 Saline Sand 16
107 110 Clay 3110 114 Saline Sand 4114 118 Clay 4118 130 Saline Sand 12130 14339 Clay 1339
14339 16463 Saline Sand 212416463 17683 Clay 12217683 207 Saline Sand 3017
207 2115 Clay 452115 2155 Saline Sand 42155 219 Clay 35219 235 Saline Sand 16235 237 Clay 2237 25624 Saline Sand 1924
25624 27134 Clay 15127134 300 Saline Sand 2866
Deviwala0 15 Clay 15
15 23 Fresh Sand 8
Aquifer Mapping and Management Plan of Faridkot District Punjab State
Page | 68
Deviwala
23 38 Clay 1538 46 Fresh Sand 846 48 Clay 248 53 Fresh Sand 553 61 Clay 861 65 Fresh Sand 465 72 Clay 772 78 Fresh Sand 678 94 Clay 1694 106 Fresh Sand 12
106 109 Clay 3109 112 Saline Sand 3112 128 Clay 16128 140 Saline Sand 12140 158 Clay 18158 163 Saline Sand 5163 179 Clay 16179 183 Saline Sand 4183 187 Clay 4187 196 Saline Sand 9196 202 Clay 6202 213 Saline Sand 11213 218 Clay 5218 223 Saline Sand 5223 252 Clay 29252 258 Saline Sand 6258 263 Clay 5263 269 Saline Sand 6
Dohak
0 8 Clay 88 10 Fresh Sand 2
10 21 Clay 1121 33 Saline Sand 1233 41 Clay 841 79 Saline Sand 3879 89 Clay 1089 95 Saline Sand 695 99 Clay 499 112 Saline Sand 13
112 116 Clay 4116 139 Saline Sand 23139 154 Clay 15
Aquifer Mapping and Management Plan of Faridkot District Punjab State
Page | 69
154 163 Saline Sand 9
Toot
0 15 Clay 1515 198 Fresh Sand 48
198 21 Clay 1221 474 Fresh Sand 264
474 51 Clay 3651 552 Fresh Sand 42
552 626 Clay 74626 766 Fresh Sand 14766 101 Clay 244101 104 Fresh Sand 3104 113 Clay 9113 116 Fresh Sand 3116 143 Clay 27143 146 Saline Sand 3146 167 Clay 21167 170 Saline Sand 3170 182 Clay 12182 204 Saline Sand 22204 214 Clay 10214 217 Saline Sand 3
Aquifer Mapping and Management Plan of Faridkot District Punjab State
Page | 70
Annexure-IVAQUIFER GROUPING OF WELL LOCATIONS IN FARIDKOT DISTRICT
Well location Depth from Depth to Aquifer Thickness FreshGranular
Zones
SalineGranular
Zones
Dal Singhwala
0 15 Unsaturated Zone 15 215 57 Aquifer Group-IA 42 3457 64 Aquiclude-IA 764 134 Aquifer Group-IB 70 51
134 157 Aquiclude-IB 23157 300 Multiple Aquifers 143 52
Dip Singh Wala
0 5 Unsaturated Zone 5 55 68 Aquifer Group-IA 63 35
68 755 Aquiclude-IA 75755 132 Aquifer Group-IB 565 14 31132 146 Aquiclude-IB 14146 300 Multiple Aquifers 154 755
Golewala
0 4 Unsaturated Zone 4 14 525 Aquifer Group-IA 485 33
525 60 Aquiclude-IA 7560 103 Aquifer Group-IB 43 38
103 155 Aquiclude-IB 52155 300 Multiple Aquifers 145 665
Jaito Mandi
0 14 Unsaturated Zone 14 114 59 Aquifer Group-IA 45 3759 80 Aquiclude-IA 2180 107 Aquifer Group-IB 27 155
107 1555 Aquiclude-IB 4851555 300 Multiple Aquifers 1445 16 515
Kot Kapura
0 9 Unsaturated Zone 9 29 77 Aquifer Group-IA 68 455
77 88 Aquiclude-IA 1188 106 Aquifer Group-IB 18 11 3
106 155 Aquiclude-IB 49155 300 Multiple Aquifers 145 68
Nanak Nagri
0 12 Unsaturated Zone 12 112 46 Aquifer Group-IA 34 18446 69 Aquiclude-IA 2369 131 Aquifer Group-IB 62 77 11
131 165 Aquiclude-IB 34165 2134 Multiple Aquifers 484 97
Nangal 0 9 Unsaturated Zone 9 1
Aquifer Mapping and Management Plan of Faridkot District Punjab State
Page | 71
Nangal
9 41 Aquifer Group-IA 32 2941 72 Aquiclude-IA 3172 124 Aquifer Group-IB 52 41
124 151 Aquiclude-IB 27151 300 Multiple Aquifers 149 43 21
Tehna
0 10 Unsaturated Zone 10 210 41 Aquifer Group-IA 31 18741 59 Aquiclude-IA 1859 106 Aquifer Group-IB 47 33
106 158 Aquiclude-IB 52158 300 Multiple Aquifers 142 50
Wara Daraka
0 4 Unsaturated Zone 4 04 75 Aquifer Group-IA 71 46
75 84 Aquiclude-IA 984 129 Aquifer Group-IB 45 31
129 150 Aquiclude-IB 21150 300 Multiple Aquifers 150 47
Aulakh
0 17 Unsaturated Zone 17 217 46 Aquifer Group-IA 29 2646 76 Aquiclude-IA 3076 113 Aquifer Group-IB 37 1525 305
113 134 Aquiclude-IB 21134 300 Multiple Aquifers 166 6828
Bhagthala
0 4 Unsaturated Zone 4 14 53 Aquifer Group-IA 49 24
53 63 Aquiclude-IA 1063 102 Aquifer Group-IB 39 3237
102 168 Aquiclude-IB 66168 300 Multiple Aquifers 132 6115
Sadhuwala
0 5 Unsaturated Zone 5 55 52 Aquifer Group-IA 47 2151
52 63 Aquiclude-IA 1163 130 Aquifer Group-IB 67 49
130 144 Aquiclude-IB 14144 300 Multiple Aquifers 156 11931
Deviwala
0 8 Unsaturated Zone 8 28 78 Aquifer Group-IA 70 31
78 94 Aquiclude-IA 1694 112 Aquifer Group-IB 18 12 3
112 128 Aquiclude-IB 16128 269 Multiple Aquifers 141 58
Aquifer Mapping and Management Plan of Faridkot District Punjab State
Page | 72
Dohak
0 3 Unsaturated Zone 3 03 79 Aquifer Group-IA 76 2 50
79 89 Aquiclude-IA 1089 139 Aquifer Group-IB 50 42
139 154 Aquiclude-IB 15154 163 Multiple Aquifers 9 9
Toot
0 9 Unsaturated Zone 9 19 55 Aquifer Group-IA 46 354
55 63 Aquiclude-IA 863 116 Aquifer Group-IB 53 25
116 143 Aquiclude-IB 27143 217 Multiple Aquifers 74 31
- कदरीय भमि जल बोरड
-
- जल ससाधन नदी विकास और गगा सरकषण मतरालय
- भारत सरकार
-
- contents naquim faridkotpdf (p1-5)
- Final Faridkot edited 170317pdf (p6-77)
-

Aquifer Mapping and Management Plan of Faridkot District Punjab State
Page | 36
distribution from the prevailing unlined open channels Thereby gross draft will be reduced to224 mcm (Table-11a) assuming that there is no crop diversification by the farmers
The benefit will lead to saving of precious ground water resources in overexploitedblocks The measure if implemented will bring down the ground water overdraft from 160 to123 The category of the blocks will also improve resulting in boosting of agriculture andindustrial development otherwise not sustainable in over-exploited blocks (Table-11b)
The tube wells also consume enormous electricity which is subsidized and governmentincur significant revenue on this account The measures therefore will result in saving of energyand money Pollution impact will be reduced whenever diesel engines are used by the farmersThe environmental and ecological condition in the irrigated land will improve Unwanted weedgrowth will also be controlled inside the farm land It is expected to save 1 of the agriculturalland occupied by open channels which can be utilized for cultivation purpose Heavy groundwater overdraft can be reduced by these efforts This will ensure more crops per drop
63 Water saving Potential from Crop Diversification-Change Paddy to MaizeSoya-beanAs the requirement of water for paddy is much high therefore by changing paddy to
maizesoya-bean will help in saving of water For estimating the water saving by cropdiversification it is assumed that one mcm of water will be saved in case of maize or soyabeanplanted in one sq km of land In case of pulses even higher amount of ground water can besaved
The block wise saving of water in mcm by applying various management strategies suchas crop diversification Under Ground Pipe lines (UGPL) in individual land and artificial rechargemethods are given in tables 11a b
Table-11a Scope of Quantitative Impact on Stage of Development after applying variousmanagement strategies in mcm
Block Net GroundWater
Availability(mcm)
TotalIrrigation
Draft(mcm)
PresentStage of
draft(SOD)
() (Asper
2013)
Reduction in draft by different watersaving method
SODafterwards
()
Change ofpaddy
cultivationarea ( ofexisting)
Replacewater
coursesby UGPipes
(mcm)
AdoptArtificialrecharge
(mcm)
ChangePaddy
toMaize(mcm)
Total(mcm)
(2+3+4)
1 2 3 4 5Faridkot 34632 52861 158 12472 484 7245 20201 9969 -
Kot Kapura 26821 42020 162 9915 475 6264 16654 9986 -Total 61453 94880 160 22387 959 13567 36913 9948
Aquifer Mapping and Management Plan of Faridkot District Punjab State
Page | 37
Table-11b Impact on Stage of Development (SOD) after applying various managementstrategies in Faridkot District
Block PresentSOD ()
as on2013
Reductionin SOD ()
afterunlinedchannel
()
ResultantSOD ()
Col(2 - 3)
Reduction inStage of
developmentafter crop
diversificationby
MaizeSoyabean()
ResultantSOD ()
Col(2 - 5)
Reduction inStage of
developmentafter Artificialrecharge ()
ResultantSOD ()
Col(2 - 7)
1 2 3 4 5 6 7 8Faridkot 158 3601 12199 2090 13710 140 15660
KotKapura 162 3697 12503 2340 13860 177 16023
Total 160 3664 12336 2210 13790 178 15822
By adopting all the management strategies resulting in total reduction in stage of groundwaterdevelopment is 6052 Hence overall stage of development afterwards is 9948 and is givenin Table12
Table-12 Overall Stage of Development (SOD) after reduction in Faridkot
Block PresentStage of
development() as on
2013
Reduction instage of
developmentafter unlinedchannel ()
Reduction inStage of
developmentafter crop
diversificationby
MaizeSoyabean()
Reduction inStage of
developmentafter Artificialrecharge ()
TotalReduction in
Stage ofdevelopment
()
(3 +4+5)
Stage ofdevelopmentafterwards
()
(2-6)
1 2 3 4 5 6 7Faridkot 158 3601 2090 140 5831 9969
Kot Kapura 162 3697 2340 177 6214 9986Total 160 3664 2210 178 6052 9948
Aquifer Mapping and Management Plan of Faridkot District Punjab State
Page | 38
70 CONCLUSIONS1 The area lies in the central part of Satluj basin of Indo-Gangetic Alluvial plain
Geologically the area is occupied by a thick sequence of Quaternary deposits of Mid-Pleistocene to Recent age
2 The Principle Aquifer system in the study area is Alluvium and the Major Aquifers areOlder Alluvium and Aeolian Alluvium
3 Lithological characteristics of the area are Multi-cyclic light grey to brown fine tomedium grained mixture of clay silt and sand with Kankar
4 Thick layering of clay with sand at many places can be observed towards south of thedistrict at deeper depths The Ground water occurs in unconfined (water table) andconfined conditions
5 Chemical data of ground water from shallow aquifer indicates that ground water isalkaline and fresh to moderately saline
6 To delineate fresh water - saline water interface laterally as well as vertically surfacegeophysical investigations have been carried out in alluvial tracts
7 To understand the sub surface disposition geological sections and fence diagram havebeen prepared by synthesizing the various sub-surface sections on the basis of study ofthe lithological logs and electrical logs of boreholes drilled by CGWB WRED PSTC andPrivate Agencies using the RockWorks15 software
8 Aquifer IA (Very Shallow Aquifer) extends maximum upto 70 m of depth and below thatclay layer starts getting thickened about 10-12m separating Aquifer IB to a maximumdepth of 123 m Multi layer aquifers are existing in the area each aquifer is separated bythick clay zones of 25 to 40 m upto 300m depth It is very difficult to differentiate theaquifer groups after Aquifer Group I so the whole lithology is considered to be a singleaquifer group system
9 Stage of Ground Water Development of the district is 160 on the basis of Dynamicground water resources 2013 In- storage ground water resources has also beencalculated up to a depth of 300 meters
10 The fresh water resources are inadequate in aquifer upto maximum depth of 106mwhereas saline water is dominant resources below 106 m depth upto 300 m In thenorth of the district towards Faridkot block fresh water is available upto 152m depth
11 Dynamic ground water resources of the study area are 61453 mcm whereas In-storageground water resources up to fresh water zones are 3954 mcm Thus total fresh groundwater resources up to maximum depth of 152 m are 4569 mcm Total saline waterresources up to depth of 300 m are 3129 mcm
12 Main groundwater issues in the area are groundwater depletion quality and risingwater table
13 Considering the high ground water abstraction for irrigation (94880 mcm) andoverdraft (37157 mcm) it is suggested that proposed artificial recharge measures (959mcm) crop diversification measures (13567 mcm) and conserving ground waterthrough laying of underground pipe line (22387 mcm) will be useful
14 Other techniques of water saving and modern irrigation technology to be enforced tomaximize per drop of water use in the district and also to think about the hidden salinewater resources and for its utilizations
Aquifer Mapping and Management Plan of Faridkot District Punjab State
Page | 39
BLOCK WISE
AQUIFER MAPS
AND
MANAGEMENT PLAN
(PART-II)
Aquifer Mapping and Management Plan of Faridkot District Punjab State
Page | 40
I Salient Information of Faridkot Block
Block Area(in Km2)
75210 sq km
District State Faridkot PunjabPopulation Urban Population 2260
Rural Population 179432Total population 181692
Rainfall NormalMonsoon 335 mm
Non-monsoon Rainfall 35 mmAnnual Average Rainfall 349 mm
Agriculture and Irrigation Principal crops Wheat Cotton and PaddyGross cropped area 119562 sq kmNet sown area 59180 sq kmIrrigation practices Canal and Tube well IrrigationCropping intensity 202Area underGround water Irrigation 6159 sq kmSurface water irrigation 51143 sq kmNumber and types of abstraction structures 20927 Tubewells
Ground Water ResourceAvailability and Extraction
Ground water Resources AvailabilityTotal Ground Water Resources available is 5025 mcm (fresh andsaline water) up to the depth of 300m The fresh water resourcesare estimated up to the depth of 152 m on the basis of geophysicalinterpretations The potential granular zones available for freshwater are calculated as 72 m Saline water resources are estimatedon the basis of available well depth (up to 300 m) and the granularzones are counted after depth of 152 m and available zones are 103m Block is categorized as Over-Exploited as per DynamicGroundwater Resources 2013 assessment
Ground water Resources ExtractionDeeper aquifers are marginal to highly saline and not suitable forirrigation purpose as such all users are tapping shallow aquifersDrinking water supply wells of State Government tapping shallowaquifers Therefore the ground water draft could not be assessed fordeeper aquifer
Aquifer Mapping and Management Plan of Faridkot District Punjab State
Page | 41
Existing and future waterdemands
Existing Gross Ground water Draft as on 2013Irrigation 52861 mcmDomestic and industrial water supply 1911 mcmFuture water demandsIrrigation development potential (-)2045 mcmDomestic and industrial water supply up to 2025 years 2219 mcm
Water level behavior Aquifer wise water levelAquifer-IPre Monsoon 145 ndash 1522 m bglPost Monsoon 120 ndash 1310 m bglMean (10 yrs) 100 ndash (-)101 myrTrendsPre Monsoon 018 ndash (-)022 myrPost Monsoon 024 ndash (-)030 myrAquifer-IINo Monitoring stations
Aquifer-IIINo Monitoring stations
HYDROGRAPH SHOWING DECLINING WATER TABLE
Aquifer Mapping and Management Plan of Faridkot District Punjab State
Page | 42
HYDROGRAPH SHOWING DECLINING WATER TABLE
HYDROGRAPH SHOWING DECLINING WATER TABLE
Monitoring well Golewala dried after 2004
Aquifer Mapping and Management Plan of Faridkot District Punjab State
Page | 43
Aquifer Disposition
Number of aquifers 1
Principal aquifer AlluviumMajor Aquifer Older Alluvium Aeolian Alluvium
Exploratory Data AvailabilitySource of Data No of exploration wells as per depth range (m) Total
lt100 100-200 200-300 gt300
CGWB 1 0 0 4 5WREDPSTCWSS 6 1 0 2 9PRIVATE 0 0 0 0 0TOTAL 7 1 0 6 14
Aquifer wise Characteristics (CGWB 2012)AquiferGroup
Geology Type ofAquifer
ThicknessofGranularzones (m)
Transmissivity(m2day)
YieldDischarge
(m3day)
SpecificYield
Storativity
SingleAquiferSystem
Quarter-naryAlluvialdeposits
Unconfined toconfined
175 474 - 2660 939 -55944
12 (0072)
175 x 10-3
-18 x 10-3
Well field proposed in adjacent blockThe Aquifer comprises of fresh and saline water and the major aquifer material is sand Theaquiclude and aquitard comprises of clay clay with siltExploratory Data Validated
Source of Data No of exploration wells as per depth range (m) Totallt100 100-200 200-300 gt300
CGWB 0 0 0 4 4WREDPSTCWSS 0 0 0 2 2PRIVATE 0 0 0 0 0TOTAL 0 0 0 6 6
The data is validated by selecting the deepest well in each quadrant and used for preparation of3-D Litho models 2-D Geological Cross Sections Fence Diagrams and Aquifer Maps
Aquifer Mapping and Management Plan of Faridkot District Punjab State
Page | 44
3-D Lithological Model of Faridkot Block
Lithological Cross Section from Dip Singh Wala to Nangal
Lithological Cross Section from Toot to Nangal
Aquifer Mapping and Management Plan of Faridkot District Punjab State
Page | 45
3-D Lithological Fence Diagram
3-D Aquifer Disposition Fence Diagram
Aquifer Mapping and Management Plan of Faridkot District Punjab State
Page | 45
3-D Lithological Fence Diagram
3-D Aquifer Disposition Fence Diagram
Aquifer Mapping and Management Plan of Faridkot District Punjab State
Page | 45
3-D Lithological Fence Diagram
3-D Aquifer Disposition Fence Diagram
Aquifer Mapping and Management Plan of Faridkot District Punjab State
Page | 46
Ground water Resource Extraction Contamination and other issues in Faridkot Block
Ground WaterResources upto thedepth of 300m
Dynamic Fresh waterresources
34632 mcm
In-storage Fresh waterresources
182375 mcm
In-storage Saline waterresources
285516 mcm
Total 502523 mcmGround WaterExtraction (as per 2013)
Irrigation 52861 mcm
Domestic amp Industrial 1911 mcm
Future Demand for domestic amp Industrial sector(2025) (as per 2013)
2219 mcm
Stage of Groundwater Development 158
Chemical Quality of ground water Ground water in the area is alkaline and pHranges between 794 to 917 Groundwater in the area is fresh to marginal salineEC value of ground water show widevariations and ranges from 444 Scm to8653Scm at 250CRSC values vary from (ndash) 73 to 113 meqLarea is fit for irrigation
Ground water Contamination Issues Fluoride (mgl)Nathuwala (603) Killi(429)Nitrate (mgl)Sukhanwala (46) Sher Singhwala (65)Nathuwala (79) Chand Baja (79) Nangal(104) Tehna (118) Killi (140)Iron (mg)Devi wala (177)
Other issues Water level decline has been observed inmajor parts of the block due to indiscriminate development of ground waterresourcesIn shallow water level area lessdevelopment of ground water resourcecouple with recharge from canal irrigationis causing water logging and inland salinityproblems
Aquifer Mapping and Management Plan of Faridkot District Punjab State
Page | 47
Ground water Resource Enhancement Potential
Aquifer wise space available for recharge and proposed interventions (Supply Side Measures)
Aquifer-I
Volumes of unsaturated zone after 3m upto a desirable depth 10830 mcmSource water requirementavailability for recharge Rain Canal Irrigation return flowTypes and number of structures NAOther interventions proposed Artificial Recharge Roof top Rainwater harvesting will conserve484 mcm volume of water
Demand side interventions
Advanced Irrigation PracticesArea proposed to be covered Entire Block Faridkot (75210 sq km)Volume of Water expected to be conserved under advanced irrigation practices such as lining ofunderground pipelines (Kutcha channel) 12472 mcm
Required Change in cropping pattern
Proposed change in cropping pattern Paddy to Maize Soyabean The overexploitation can bemanaged at sustainable level (100) by changing the Paddy cropArea coverage 15 of the total paddy area needs to change ie7245 sq kmAnticipated volume of water to be saved 7245 mcm
Net AnnualGroundWater
Availability2013
(mcm)
TotalIrrigation Draft
(present)(mcm)
GrossDraft alluses(present)(mcm)
Paddyarea
(Sq km)
RequiredArea to
beChange
fromPaddy toMaize
soyabean
(Sq km)
Amountof
WaterSaved(mcm)
Grossdraftafter
savingof water(mcm)
PresentStage of
development ()
Reductionin Stage ofdevelopme
nt afterMaize
soya bean()
CropDiversifiedarea ()
34632 52861 54771 48300 7245 7245 45616 158 209 15
Alternate Water sourcesSurface water sources Tanks PondsLocation details and availability from such sources outside the area Not AvailableRegulation and Control
Punjab Subsoil Act for delay in paddy plantation should continue in the area
Aquifer Mapping and Management Plan of Faridkot District Punjab State
Page | 48
Other interventions proposed if anyModern Irrigation Practices be adopted for Rabi crops Some of the techniques are given in
the table below (PAU Ludhiana)
SlNo Techniques Water Saving()
Crops
1 Mulching 17 Wheat2 Bed Planting 18-25 Wheat3 Use of Sprinkler and drip
Irrigation70-90 Sugarcane Cotton Sunflower Maize
Other than that by 15 days ponding followed by 2 days of drying can lead to 25 saving of water inpaddy crop
Aquifer Mapping and Management Plan of Faridkot District Punjab State
Page | 49
II Salient Information of Kot Kapura Block
Block Area(in Km2)
66650 sq km
District State Faridkot PunjabPopulation Urban Population 373
Rural Population 221025Total population 221398
Rainfall Normal Monsoon 328 mmNon-monsoon Rainfall 61 mmAnnual Average Rainfall 370 mm
Agriculture and Irrigation Principal crops Wheat Cotton and PaddyGross cropped area 133427 sq kmNet sown area 67498 sq kmIrrigation practices Canal and Tube well IrrigationCropping intensity 198Area underGround water Irrigation 4278 sq kmSurface water irrigation 62899 sq kmNumber and types of abstraction structures 16639 Tubewells
Ground Water ResourceAvailability and Extraction
Ground water Resources AvailabilityTotal Ground Water Resources available is 2672 mcm (fresh andsaline water) up to the depth of 300 m The fresh water resourcesare estimated up to the depth of 106 m on the basis of geophysicalinterpretations The potential granular zones available for freshwater are 51 m Saline water resources are estimated on the basis ofwell (up to 300 m) and the granular zones are counted after depth of106 m and available zones are 76 m Block is categorized as Over-Exploited as per Dynamic Groundwater Resources 2013 assessment
Ground water Resources ExtractionDeeper aquifers are marginal to highly saline and not suitable forirrigation purpose as such all users are tapping shallow aquifersDrinking water supply wells of State Government tapping shallowaquifers Therefore the ground water draft could not be assessed fordeeper aquifer
Aquifer Mapping and Management Plan of Faridkot District Punjab State
Page | 50
Existing and future waterdemands
Existing Gross Ground water Draft as on 2013Irrigation 42020 mcmDomestic and industrial water supply 1402 mcmFuture water demandsIrrigation development potential (-)16709 mcmDomestic and industrial water supply up to 2025 years 1511 mcm
Water level behavior Aquifer wise water levelAquifer-IPre Monsoon 235 ndash 1600 m bglPost Monsoon 155 ndash 1820 m bglMean (10 yrs) 158 ndash (-)086 myrTrendsPre Monsoon 016 ndash (-)026 myrPost Monsoon 015 ndash (-)029 myrAquifer-II (156m)Pre Monsoon 772 m bglPost Monsoon 805 m bglAquifer-III (269m)Pre Monsoon NAPost Monsoon 820 m bgl
HYDROGRAPH SHOWING DECLINING WATER TABLE
Aquifer Mapping and Management Plan of Faridkot District Punjab State
Page | 51
HYDROGRAPH SHOWING DECLINING WATER TABLE
HYDROGRAPH SHOWING DECLINING WATER TABLE
Aquifer Mapping and Management Plan of Faridkot District Punjab State
Page | 52
Aquifer Disposition
Number of aquifers 1
Principal aquifer AlluviumMajor Aquifer Older Alluvium Aeolian Alluvium
Exploratory Data AvailabilitySource of Data No of exploration wells as per depth range (m) Total
lt100 100-200 200-300 gt300
CGWB 2 1 1 4 8WREDPSTCWSS 8 0 0 1 9PRIVATE 1 0 1 0 2TOTAL 11 1 2 5 19
Aquifer wise Characteristics (CGWB2015)AquiferGroup
Geology Type ofAquifer
ThicknessofGranularzones (m)
Transmi-ssivity(m2day)
Yield(m3day)
SpecificYield
Storativity
SingleAquiferSystem
QuaternaryAlluvialdeposits
Unconfinedto confined
127 547 -2990
3668 12 (0072) 72x10-4
Well field proposed in this block (Site Location Deviwala)The Aquifer comprises of fresh and saline water and the major aquifer material is sand Theaquiclude and aquitard comprises of clay clay with siltExploratory Data Validated
Source of Data No of exploration wells as per depth range (m) Totallt100 100-200 200-300 gt300
CGWB 0 0 1 4 5WREDPSTCWSS 0 0 0 1 1PRIVATE 0 0 1 0 1TOTAL 0 0 2 5 7
The data is validated by selecting the deepest well in each quadrant and used for preparation of3-D Litho models 2-D Geological Cross Sections Fence Diagrams and Aquifer Maps
Aquifer Mapping and Management Plan of Faridkot District Punjab State
Page | 53
3-D Lithological model of Kot Kapura Block
Lithological Cross section from Wara Daraka to Aulakh
Lithological Cross section from Nangal to Dal Singhwala
Aquifer Mapping and Management Plan of Faridkot District Punjab State
Page | 54
3-D Lithological Fence Diagram
3-D Aquifer Disposition Fence Diagram
Aquifer Mapping and Management Plan of Faridkot District Punjab State
Page | 54
3-D Lithological Fence Diagram
3-D Aquifer Disposition Fence Diagram
Aquifer Mapping and Management Plan of Faridkot District Punjab State
Page | 54
3-D Lithological Fence Diagram
3-D Aquifer Disposition Fence Diagram
Aquifer Mapping and Management Plan of Faridkot District Punjab State
Page | 55
Ground water Resource Extraction Contamination and other issues in Kot Kapura Block
Ground WaterResources upto thedepth of 300m
Dynamic Fresh waterresources
26821 mcm
In-storage Fresh waterresources
213062 mcm
In-storage Saline waterresources
27360 mcm
Total 267243 mcmGround WaterExtraction (as per 2013)
Irrigation 42020 mcm
Domestic amp Industrial 1402 mcm
Future Demand for domestic amp Industrial sector(2025) (as per 2013)
1511 mcm
Stage of Groundwater Development 162
Chemical Quality of ground water Ground water in the area is alkaline and pHranges between 820 to 893 Ground waterin the area is slightly fresh to marginalsaline EC value of the ground water showwide variations and ranges from 1154Scm to 3988 Scm at 250CRSC values are varies from -003 to 1100meqL and the area is fit for irrigation
Ground water Contamination Issues Fluoride (mgl)Kot Kapura (333) Dhilwan kalan (285)Moharewala ( 195) Bir Sikhanwala ( 184)Nitrate (mgl)Wara Daraka (66) Dhilwan Kalan (72)Moharewala (78) Bir sikhan wala (89)KotKapura (144)
Other issues Water level decline has been observed inmajor parts of the block due to indiscriminate development of ground waterresourcesIn shallow water level area lessdevelopment of ground water resourcecouple with recharge from canal irrigation iscausing water logging and inland salinityproblems
Aquifer Mapping and Management Plan of Faridkot District Punjab State
Page | 56
Ground water Resource Enhancement Potential
Aquifer wise space available for recharge and proposed interventions (Supply Side Measures)
Aquifer-I
Volume of unsaturated zone after 3m upto a desirable depth 14396 mcmSource water requirementavailability for recharge Rain Canal Irrigation return flowTypes and number of structures NAOther interventions proposed Artificial Recharge Roof top Rainwater harvesting will conserve475 mcm volume of water
Demand side interventions
Advanced Irrigation PracticesArea proposed to be covered Entire Kot Kapura Block (66650 sq km)Volume of Water expected to be conserved under advanced irrigation practices such as lining ofunderground pipelines (Kutcha channel) etc 9915 mcm
Required Change in cropping pattern
Proposed change in cropping pattern Rice to Maize Soyabean The overexploitation can bemanaged at sustainable level (100) by changing the Paddy cropArea coverage 12 of the total rice area needs to change ie 6264 sq kmAnticipated volume of water to be saved 6264 mcm
Net AnnualGroundWater
Availability2013
(mcm)
TotalIrrigation Draft
(present)(mcm)
GrossDraft alluses(present)(mcm)
Paddyarea
(Sq km)
RequiredArea to be
Changefrom
Paddy toMaize
soya bean(Sq km)
Amountof
WaterSaved(mcm)
Grossdraftafter
savingof water(mcm)
PresentStage of
development ()
Reductionin Stage ofdevelopme
nt afterMaize
soya bean()
CropDiversifiedarea ()
26821 42020 43421 52200 6264 6264 35756 162 234 12
Alternate Water sourcesSurface water sources Tanks PondsLocation details and availability from such sources outside the area Not AvailableRegulation and Control
Punjab Subsoil Act for delay in paddy plantation should continue in the area
Other interventions proposed if anyModern Irrigation Practices be adopted for Rabi crops Some of the techniques are given in
the table below (PAU Ludhiana)
Aquifer Mapping and Management Plan of Faridkot District Punjab State
Page | 57
SlNo Techniques Water Saving()
Crops
1 Mulching 17 Wheat2 Bed Planting 18-25 Wheat3 Use of Sprinkler and drip
Irrigation70-90 Sugarcane Cotton Sunflower Maize
Other than that by 15 days ponding followed by 2 days of drying can lead to 25 saving of water inpaddy crop
Aquifer Mapping and Management Plan of Faridkot District Punjab State
Page | 58
Annexure-I
Nd Not Determined BDL Below Detection Limit
Aquifer Mapping and Management Plan of Faridkot District Punjab State
Page | 59
Annexure-IIData Availability of Exploration Wells of Faridkot district
SlNo LOCATION LONGITUDE LATITUDE DEPTH ELEVATION BLOCK DEPARTMENT1 Dal Singhwala 74950 30469 300 211 Kot Kapura CGWB2 Dip Singh Wala 74483 30742 300 201 Faridkot CGWB3 Golewala 74692 30792 300 1995 Faridkot CGWB4 Jaito Mandi 74891 30446 300 203 Kot Kapura CGWB5 Kot Kapura 74814 30576 300 206 Kot Kapura CGWB6 Nanak Nagri 74893 30581 200 210 Kot Kapura PRIVATE7 Nangal 74869 30669 300 206 Faridkot CGWB8 Tehna 74790 30690 300 205 Faridkot CGWB9 Wara Daraka 74797 30548 300 205 Kot Kapura CGWB
10 Aulakh 74920 30643 300 211 Kot Kapura PSTC11 Bhagthala 74786 30777 300 198 Faridkot PSTC12 Sadhuwala 74559 30717 300 196 Faridkot PSTC13 Deviwala 74870 30612 269 207 Kot Kapura CGWB14 Deviwala-I 74870 30612 156 207 Kot Kapura CGWB15 Kouni 74675 30760 60 194 Faridkot WSS16 Ghugiana 74639 30746 60 198 Faridkot WSS17 Pahluwala 74763 30799 60 203 Faridkot WSS18 Faridkot 74763 30681 60 203 Faridkot WSS19 Doda Bhundar 75016 30470 121 212 Kot Kapura WRED20 Dhudi 74849 30700 60 207 Faridkot WSS21 Ratti Rori 74811 30647 60 208 Faridkot WSS22 Chak Kalyan 74705 30572 60 203 Kot Kapura WSS23 Kot Kapura 74812 30596 60 208 Kot Kapura WSS24 Behbal Kalan 74913 30531 60 210 Kot Kapura WSS25 Rorian Kapura 74815 30439 60 207 Kot Kapura WSS26 Panjgrain 74914 30608 70 211 Kot Kapura PRIVATE27 Fatehgarh 74943 30405 60 208 Kot Kapura WSS
28Bhurj JawarSingh 74987 30535 60 211 Kot Kapura WRED
29 Dewarana 74766 30593 30 206 Kot Kapura WRED30 Sher Singhwala 74628 30665 65 195 Faridkot CGWB31 Bir Sikhan wala 74849 30627 65 207 Kot Kapura CGWB32 Dohak 74603 30632 163 197 Muktsar CGWB33 Toot 74645 30829 217 196 Ghal khurd CGWB
Two exploratory wells from adjacent districts ie Dohak from Muktsar district and Toot fromFerozpur district have been incorporated for the preparation of lithological fence and crosssections
Aquifer Mapping and Management Plan of Faridkot District Punjab State
Page | 60
Annexure-IIILITHOLOGICAL DATA OF WELLS IN FARIDKOT DISTRICT
Well Location Depth from Depth to Lithology Thickness
Dal Singhwala
0 13 Clay 1313 20 Fresh Sand 720 28 Clay 828 57 Fresh Sand 2957 64 Clay 764 75 Saline Sand 1175 78 Clay 378 97 Saline Sand 1997 108 Clay 11
108 117 Saline Sand 9117 122 Clay 5122 134 Saline Sand 12134 157 Clay 23157 173 Saline Sand 16173 179 Clay 6179 184 Saline Sand 5184 211 Clay 27211 219 Saline Sand 8219 253 Clay 34253 259 Saline Sand 6259 278 Clay 19278 293 Saline Sand 15293 298 Clay 5298 300 Saline Sand 2
Dip Singh Wala
0 8 Fresh Sand 88 36 Clay 28
36 68 Fresh Sand 3268 755 Clay 75
755 805 Fresh Sand 5805 83 Clay 2583 92 Fresh Sand 992 93 Clay 193 109 Saline Sand 16
109 113 Clay 4113 116 Saline Sand 3116 120 Clay 4120 132 Saline Sand 12
Aquifer Mapping and Management Plan of Faridkot District Punjab State
Page | 61
Dip Singh Wala 132 146 Clay 14146 162 Saline Sand 16162 168 Clay 6168 192 Saline Sand 24192 195 Clay 3195 197 Saline Sand 2197 2015 Clay 45
2015 209 Saline Sand 75209 2135 Clay 45
2135 2175 Saline Sand 42175 221 Clay 35221 237 Saline Sand 16237 2865 Clay 495
2865 2895 Saline Sand 32895 293 Clay 35293 296 Saline Sand 3296 300 Clay 4
Golewala
0 75 Clay 7575 2885 Fresh Sand 2135
2885 40 Clay 111540 525 Fresh Sand 125
525 60 Clay 7560 88 Saline Sand 2888 93 Clay 593 103 Saline Sand 10
103 1325 Clay 2951325 1375 Saline Sand 51375 155 Clay 175155 1575 Saline Sand 25
1575 182 Clay 245182 2035 Saline Sand 215
2035 2285 Clay 252285 234 Saline Sand 55234 253 Clay 19253 2725 Saline Sand 195
2725 280 Clay 75280 2975 Saline Sand 175
2975 300 Clay 25Jaito Mandi 0 15 Clay 15
15 25 Fresh Sand 1025 28 Clay 3
Aquifer Mapping and Management Plan of Faridkot District Punjab State
Page | 62
Jaito Mandi 28 42 Fresh Sand 1442 46 Clay 446 59 Fresh Sand 1359 80 Clay 2180 915 Fresh Sand 115
915 103 Clay 115103 107 Fresh Sand 4107 1555 Clay 485
1555 1715 Fresh Sand 161715 191 Clay 195191 213 Saline Sand 22213 220 Clay 7220 223 Saline Sand 3223 238 Clay 15238 255 Saline Sand 17255 273 Clay 18273 2785 Saline Sand 55
2785 2805 Clay 22805 283 Saline Sand 25283 2985 Clay 155
2985 300 Saline Sand 15
Kot Kapura
0 14 Clay 1414 21 Fresh Sand 721 25 Clay 425 355 Fresh Sand 105
355 37 Clay 1537 50 Fresh Sand 1350 57 Clay 757 64 Fresh Sand 764 69 Clay 569 77 Fresh Sand 877 88 Clay 1188 99 Fresh Sand 1199 103 Clay 4
103 106 Saline Sand 3106 123 Clay 17123 1286 Saline Sand 56
1286 130 Clay 14130 1326 Saline Sand 26
1326 134 Clay 14134 1355 Saline Sand 15
Aquifer Mapping and Management Plan of Faridkot District Punjab State
Page | 63
Kot Kapura
1355 1492 Clay 1371492 1518 Saline Sand 261518 155 Clay 32155 1584 Saline Sand 34
1584 161 Clay 26161 1796 Saline Sand 186
1796 1812 Clay 161812 1838 Saline Sand 261838 1865 Clay 271865 2045 Saline Sand 182045 207 Clay 25207 2125 Saline Sand 55
2125 249 Clay 365249 2545 Saline Sand 55
2545 280 Clay 255280 2944 Saline Sand 144
2944 300 Clay 56
Nanak Nagri
0 136 Clay 136136 208 Fresh Sand 72208 265 Clay 57265 305 Fresh Sand 4305 34 Clay 3534 368 Fresh Sand 28
368 388 Clay 2388 40 Fresh Sand 1240 428 Clay 28
428 46 Fresh Sand 3246 695 Clay 235
695 712 Fresh Sand 17712 785 Clay 73785 815 Fresh Sand 3815 84 Clay 2584 87 Fresh Sand 387 92 Clay 592 936 Saline Sand 16
936 988 Clay 52988 100 Saline Sand 12100 1085 Clay 85
1085 1115 Saline Sand 31115 118 Clay 65118 120 Saline Sand 2
Aquifer Mapping and Management Plan of Faridkot District Punjab State
Page | 64
Nanak Nagri 120 128 Clay 8128 1296 Saline Sand 16
1296 130 Clay 04130 1316 Saline Sand 16
1316 135 Clay 34135 1368 Saline Sand 18
1368 165 Clay 282165 1676 Saline Sand 26
1676 184 Clay 164184 1868 Saline Sand 28
1868 1905 Clay 371905 1948 Saline Sand 431948 2134 Clay 186
Nangal
0 8 Clay 88 20 Fresh Sand 12
20 23 Clay 323 28 Fresh Sand 528 29 Clay 129 41 Fresh Sand 1241 72 Clay 3172 80 Fresh Sand 880 91 Clay 1191 124 Fresh Sand 33
124 151 Clay 27151 158 Fresh Sand 7158 163 Clay 5163 171 Fresh Sand 8171 181 Clay 10181 187 Fresh Sand 6187 193 Clay 6193 199 Fresh Sand 6199 203 Clay 4203 219 Fresh Sand 16219 224 Clay 5224 233 Saline Sand 9233 243 Clay 10243 249 Saline Sand 6249 251 Clay 2251 257 Saline Sand 6257 300 Clay 43
Tehna 0 8 Clay 8
Aquifer Mapping and Management Plan of Faridkot District Punjab State
Page | 65
Tehna
8 23 Fresh Sand 1523 28 Clay 528 32 Fresh Sand 432 37 Clay 537 41 Fresh Sand 441 59 Clay 1859 63 Fresh Sand 463 69 Clay 669 72 Fresh Sand 372 102 Clay 30
102 106 Fresh Sand 4106 120 Clay 14120 123 Fresh Sand 3123 133 Clay 10133 136 Fresh Sand 3136 145 Clay 9145 150 Fresh Sand 5150 158 Clay 8158 163 Fresh Sand 5163 168 Clay 5168 172 Fresh Sand 4172 176 Clay 4176 184 Fresh Sand 8184 210 Clay 26210 215 Fresh Sand 5215 221 Clay 6221 225 Fresh Sand 4225 254 Clay 29254 264 Fresh Sand 10264 267 Clay 3267 275 Fresh Sand 8275 294 Clay 19294 300 Fresh Sand 6
Wara Daraka
0 15 Clay 1515 22 Fresh Sand 722 28 Clay 628 48 Fresh Sand 2048 52 Clay 452 61 Fresh Sand 961 65 Clay 465 75 Fresh Sand 10
Aquifer Mapping and Management Plan of Faridkot District Punjab State
Page | 66
Wara Daraka
75 84 Clay 984 86 Saline Sand 286 91 Clay 591 97 Saline Sand 697 101 Clay 4
101 119 Saline Sand 18119 124 Clay 5124 129 Saline Sand 5129 150 Clay 21150 172 Saline Sand 22172 184 Clay 12184 188 Saline Sand 4188 196 Clay 8196 205 Saline Sand 9205 234 Clay 29234 239 Saline Sand 5239 274 Clay 35274 281 Saline Sand 7281 300 Clay 19
Aulakh
0 1829 Clay 18291829 4573 Fresh Sand 27444573 7621 Clay 30487621 9146 Fresh Sand 15259146 10975 Clay 1829
10975 1128 Saline Sand 3051128 13414 Clay 2134
13414 16768 Saline Sand 335416768 20112 Clay 334420112 21036 Saline Sand 92421036 21341 Clay 30521341 21951 Saline Sand 6121951 2256 Clay 6092256 245 Saline Sand 194245 300 Clay 55
Bhagthala
0 35 Clay 3535 1829 Fresh Sand 1479
1829 41 Clay 227141 53 Fresh Sand 1253 63 Clay 1063 8537 Saline Sand 2237
8537 92 Clay 663
Aquifer Mapping and Management Plan of Faridkot District Punjab State
Page | 67
92 102 Saline Sand 10102 1311 Clay 291
1311 13415 Saline Sand 30513415 16768 Clay 335316768 17073 Saline Sand 30517073 185 Clay 1427
185 203 Saline Sand 18203 22866 Clay 2566
22866 23476 Saline Sand 6123476 253 Clay 1824
253 273 Saline Sand 20273 280 Clay 7280 294 Saline Sand 14294 300 Clay 6
Sadhuwala
0 61 Fresh Sand 6161 3049 Clay 2439
3049 52 Saline Sand 215152 625 Clay 105
625 725 Saline Sand 10725 77 Clay 4577 84 Saline Sand 784 91 Clay 791 107 Saline Sand 16
107 110 Clay 3110 114 Saline Sand 4114 118 Clay 4118 130 Saline Sand 12130 14339 Clay 1339
14339 16463 Saline Sand 212416463 17683 Clay 12217683 207 Saline Sand 3017
207 2115 Clay 452115 2155 Saline Sand 42155 219 Clay 35219 235 Saline Sand 16235 237 Clay 2237 25624 Saline Sand 1924
25624 27134 Clay 15127134 300 Saline Sand 2866
Deviwala0 15 Clay 15
15 23 Fresh Sand 8
Aquifer Mapping and Management Plan of Faridkot District Punjab State
Page | 68
Deviwala
23 38 Clay 1538 46 Fresh Sand 846 48 Clay 248 53 Fresh Sand 553 61 Clay 861 65 Fresh Sand 465 72 Clay 772 78 Fresh Sand 678 94 Clay 1694 106 Fresh Sand 12
106 109 Clay 3109 112 Saline Sand 3112 128 Clay 16128 140 Saline Sand 12140 158 Clay 18158 163 Saline Sand 5163 179 Clay 16179 183 Saline Sand 4183 187 Clay 4187 196 Saline Sand 9196 202 Clay 6202 213 Saline Sand 11213 218 Clay 5218 223 Saline Sand 5223 252 Clay 29252 258 Saline Sand 6258 263 Clay 5263 269 Saline Sand 6
Dohak
0 8 Clay 88 10 Fresh Sand 2
10 21 Clay 1121 33 Saline Sand 1233 41 Clay 841 79 Saline Sand 3879 89 Clay 1089 95 Saline Sand 695 99 Clay 499 112 Saline Sand 13
112 116 Clay 4116 139 Saline Sand 23139 154 Clay 15
Aquifer Mapping and Management Plan of Faridkot District Punjab State
Page | 69
154 163 Saline Sand 9
Toot
0 15 Clay 1515 198 Fresh Sand 48
198 21 Clay 1221 474 Fresh Sand 264
474 51 Clay 3651 552 Fresh Sand 42
552 626 Clay 74626 766 Fresh Sand 14766 101 Clay 244101 104 Fresh Sand 3104 113 Clay 9113 116 Fresh Sand 3116 143 Clay 27143 146 Saline Sand 3146 167 Clay 21167 170 Saline Sand 3170 182 Clay 12182 204 Saline Sand 22204 214 Clay 10214 217 Saline Sand 3
Aquifer Mapping and Management Plan of Faridkot District Punjab State
Page | 70
Annexure-IVAQUIFER GROUPING OF WELL LOCATIONS IN FARIDKOT DISTRICT
Well location Depth from Depth to Aquifer Thickness FreshGranular
Zones
SalineGranular
Zones
Dal Singhwala
0 15 Unsaturated Zone 15 215 57 Aquifer Group-IA 42 3457 64 Aquiclude-IA 764 134 Aquifer Group-IB 70 51
134 157 Aquiclude-IB 23157 300 Multiple Aquifers 143 52
Dip Singh Wala
0 5 Unsaturated Zone 5 55 68 Aquifer Group-IA 63 35
68 755 Aquiclude-IA 75755 132 Aquifer Group-IB 565 14 31132 146 Aquiclude-IB 14146 300 Multiple Aquifers 154 755
Golewala
0 4 Unsaturated Zone 4 14 525 Aquifer Group-IA 485 33
525 60 Aquiclude-IA 7560 103 Aquifer Group-IB 43 38
103 155 Aquiclude-IB 52155 300 Multiple Aquifers 145 665
Jaito Mandi
0 14 Unsaturated Zone 14 114 59 Aquifer Group-IA 45 3759 80 Aquiclude-IA 2180 107 Aquifer Group-IB 27 155
107 1555 Aquiclude-IB 4851555 300 Multiple Aquifers 1445 16 515
Kot Kapura
0 9 Unsaturated Zone 9 29 77 Aquifer Group-IA 68 455
77 88 Aquiclude-IA 1188 106 Aquifer Group-IB 18 11 3
106 155 Aquiclude-IB 49155 300 Multiple Aquifers 145 68
Nanak Nagri
0 12 Unsaturated Zone 12 112 46 Aquifer Group-IA 34 18446 69 Aquiclude-IA 2369 131 Aquifer Group-IB 62 77 11
131 165 Aquiclude-IB 34165 2134 Multiple Aquifers 484 97
Nangal 0 9 Unsaturated Zone 9 1
Aquifer Mapping and Management Plan of Faridkot District Punjab State
Page | 71
Nangal
9 41 Aquifer Group-IA 32 2941 72 Aquiclude-IA 3172 124 Aquifer Group-IB 52 41
124 151 Aquiclude-IB 27151 300 Multiple Aquifers 149 43 21
Tehna
0 10 Unsaturated Zone 10 210 41 Aquifer Group-IA 31 18741 59 Aquiclude-IA 1859 106 Aquifer Group-IB 47 33
106 158 Aquiclude-IB 52158 300 Multiple Aquifers 142 50
Wara Daraka
0 4 Unsaturated Zone 4 04 75 Aquifer Group-IA 71 46
75 84 Aquiclude-IA 984 129 Aquifer Group-IB 45 31
129 150 Aquiclude-IB 21150 300 Multiple Aquifers 150 47
Aulakh
0 17 Unsaturated Zone 17 217 46 Aquifer Group-IA 29 2646 76 Aquiclude-IA 3076 113 Aquifer Group-IB 37 1525 305
113 134 Aquiclude-IB 21134 300 Multiple Aquifers 166 6828
Bhagthala
0 4 Unsaturated Zone 4 14 53 Aquifer Group-IA 49 24
53 63 Aquiclude-IA 1063 102 Aquifer Group-IB 39 3237
102 168 Aquiclude-IB 66168 300 Multiple Aquifers 132 6115
Sadhuwala
0 5 Unsaturated Zone 5 55 52 Aquifer Group-IA 47 2151
52 63 Aquiclude-IA 1163 130 Aquifer Group-IB 67 49
130 144 Aquiclude-IB 14144 300 Multiple Aquifers 156 11931
Deviwala
0 8 Unsaturated Zone 8 28 78 Aquifer Group-IA 70 31
78 94 Aquiclude-IA 1694 112 Aquifer Group-IB 18 12 3
112 128 Aquiclude-IB 16128 269 Multiple Aquifers 141 58
Aquifer Mapping and Management Plan of Faridkot District Punjab State
Page | 72
Dohak
0 3 Unsaturated Zone 3 03 79 Aquifer Group-IA 76 2 50
79 89 Aquiclude-IA 1089 139 Aquifer Group-IB 50 42
139 154 Aquiclude-IB 15154 163 Multiple Aquifers 9 9
Toot
0 9 Unsaturated Zone 9 19 55 Aquifer Group-IA 46 354
55 63 Aquiclude-IA 863 116 Aquifer Group-IB 53 25
116 143 Aquiclude-IB 27143 217 Multiple Aquifers 74 31
- कदरीय भमि जल बोरड
-
- जल ससाधन नदी विकास और गगा सरकषण मतरालय
- भारत सरकार
-
- contents naquim faridkotpdf (p1-5)
- Final Faridkot edited 170317pdf (p6-77)
-
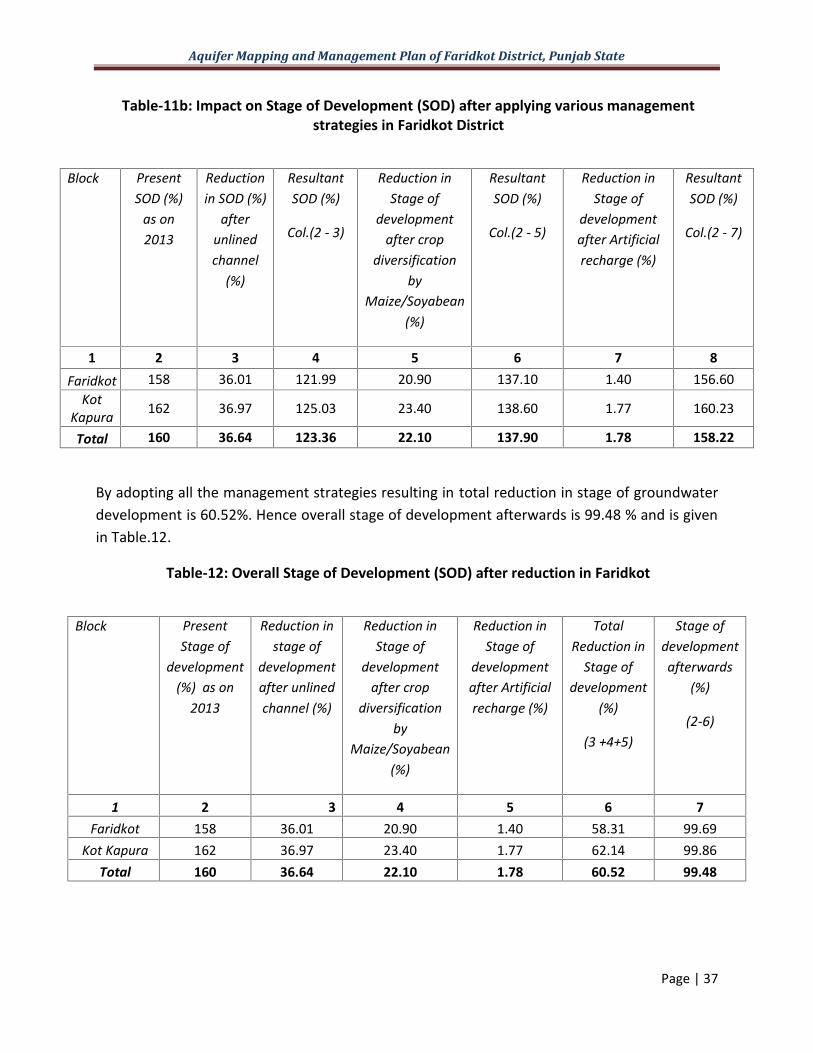
Aquifer Mapping and Management Plan of Faridkot District Punjab State
Page | 45
3-D Lithological Fence Diagram
3-D Aquifer Disposition Fence Diagram
Aquifer Mapping and Management Plan of Faridkot District Punjab State
Page | 45
3-D Lithological Fence Diagram
3-D Aquifer Disposition Fence Diagram
Aquifer Mapping and Management Plan of Faridkot District Punjab State
Page | 45
3-D Lithological Fence Diagram
3-D Aquifer Disposition Fence Diagram
Aquifer Mapping and Management Plan of Faridkot District Punjab State
Page | 46
Ground water Resource Extraction Contamination and other issues in Faridkot Block
Ground WaterResources upto thedepth of 300m
Dynamic Fresh waterresources
34632 mcm
In-storage Fresh waterresources
182375 mcm
In-storage Saline waterresources
285516 mcm
Total 502523 mcmGround WaterExtraction (as per 2013)
Irrigation 52861 mcm
Domestic amp Industrial 1911 mcm
Future Demand for domestic amp Industrial sector(2025) (as per 2013)
2219 mcm
Stage of Groundwater Development 158
Chemical Quality of ground water Ground water in the area is alkaline and pHranges between 794 to 917 Groundwater in the area is fresh to marginal salineEC value of ground water show widevariations and ranges from 444 Scm to8653Scm at 250CRSC values vary from (ndash) 73 to 113 meqLarea is fit for irrigation
Ground water Contamination Issues Fluoride (mgl)Nathuwala (603) Killi(429)Nitrate (mgl)Sukhanwala (46) Sher Singhwala (65)Nathuwala (79) Chand Baja (79) Nangal(104) Tehna (118) Killi (140)Iron (mg)Devi wala (177)
Other issues Water level decline has been observed inmajor parts of the block due to indiscriminate development of ground waterresourcesIn shallow water level area lessdevelopment of ground water resourcecouple with recharge from canal irrigationis causing water logging and inland salinityproblems
Aquifer Mapping and Management Plan of Faridkot District Punjab State
Page | 47
Ground water Resource Enhancement Potential
Aquifer wise space available for recharge and proposed interventions (Supply Side Measures)
Aquifer-I
Volumes of unsaturated zone after 3m upto a desirable depth 10830 mcmSource water requirementavailability for recharge Rain Canal Irrigation return flowTypes and number of structures NAOther interventions proposed Artificial Recharge Roof top Rainwater harvesting will conserve484 mcm volume of water
Demand side interventions
Advanced Irrigation PracticesArea proposed to be covered Entire Block Faridkot (75210 sq km)Volume of Water expected to be conserved under advanced irrigation practices such as lining ofunderground pipelines (Kutcha channel) 12472 mcm
Required Change in cropping pattern
Proposed change in cropping pattern Paddy to Maize Soyabean The overexploitation can bemanaged at sustainable level (100) by changing the Paddy cropArea coverage 15 of the total paddy area needs to change ie7245 sq kmAnticipated volume of water to be saved 7245 mcm
Net AnnualGroundWater
Availability2013
(mcm)
TotalIrrigation Draft
(present)(mcm)
GrossDraft alluses(present)(mcm)
Paddyarea
(Sq km)
RequiredArea to
beChange
fromPaddy toMaize
soyabean
(Sq km)
Amountof
WaterSaved(mcm)
Grossdraftafter
savingof water(mcm)
PresentStage of
development ()
Reductionin Stage ofdevelopme
nt afterMaize
soya bean()
CropDiversifiedarea ()
34632 52861 54771 48300 7245 7245 45616 158 209 15
Alternate Water sourcesSurface water sources Tanks PondsLocation details and availability from such sources outside the area Not AvailableRegulation and Control
Punjab Subsoil Act for delay in paddy plantation should continue in the area
Aquifer Mapping and Management Plan of Faridkot District Punjab State
Page | 48
Other interventions proposed if anyModern Irrigation Practices be adopted for Rabi crops Some of the techniques are given in
the table below (PAU Ludhiana)
SlNo Techniques Water Saving()
Crops
1 Mulching 17 Wheat2 Bed Planting 18-25 Wheat3 Use of Sprinkler and drip
Irrigation70-90 Sugarcane Cotton Sunflower Maize
Other than that by 15 days ponding followed by 2 days of drying can lead to 25 saving of water inpaddy crop
Aquifer Mapping and Management Plan of Faridkot District Punjab State
Page | 49
II Salient Information of Kot Kapura Block
Block Area(in Km2)
66650 sq km
District State Faridkot PunjabPopulation Urban Population 373
Rural Population 221025Total population 221398
Rainfall Normal Monsoon 328 mmNon-monsoon Rainfall 61 mmAnnual Average Rainfall 370 mm
Agriculture and Irrigation Principal crops Wheat Cotton and PaddyGross cropped area 133427 sq kmNet sown area 67498 sq kmIrrigation practices Canal and Tube well IrrigationCropping intensity 198Area underGround water Irrigation 4278 sq kmSurface water irrigation 62899 sq kmNumber and types of abstraction structures 16639 Tubewells
Ground Water ResourceAvailability and Extraction
Ground water Resources AvailabilityTotal Ground Water Resources available is 2672 mcm (fresh andsaline water) up to the depth of 300 m The fresh water resourcesare estimated up to the depth of 106 m on the basis of geophysicalinterpretations The potential granular zones available for freshwater are 51 m Saline water resources are estimated on the basis ofwell (up to 300 m) and the granular zones are counted after depth of106 m and available zones are 76 m Block is categorized as Over-Exploited as per Dynamic Groundwater Resources 2013 assessment
Ground water Resources ExtractionDeeper aquifers are marginal to highly saline and not suitable forirrigation purpose as such all users are tapping shallow aquifersDrinking water supply wells of State Government tapping shallowaquifers Therefore the ground water draft could not be assessed fordeeper aquifer
Aquifer Mapping and Management Plan of Faridkot District Punjab State
Page | 50
Existing and future waterdemands
Existing Gross Ground water Draft as on 2013Irrigation 42020 mcmDomestic and industrial water supply 1402 mcmFuture water demandsIrrigation development potential (-)16709 mcmDomestic and industrial water supply up to 2025 years 1511 mcm
Water level behavior Aquifer wise water levelAquifer-IPre Monsoon 235 ndash 1600 m bglPost Monsoon 155 ndash 1820 m bglMean (10 yrs) 158 ndash (-)086 myrTrendsPre Monsoon 016 ndash (-)026 myrPost Monsoon 015 ndash (-)029 myrAquifer-II (156m)Pre Monsoon 772 m bglPost Monsoon 805 m bglAquifer-III (269m)Pre Monsoon NAPost Monsoon 820 m bgl
HYDROGRAPH SHOWING DECLINING WATER TABLE
Aquifer Mapping and Management Plan of Faridkot District Punjab State
Page | 51
HYDROGRAPH SHOWING DECLINING WATER TABLE
HYDROGRAPH SHOWING DECLINING WATER TABLE
Aquifer Mapping and Management Plan of Faridkot District Punjab State
Page | 52
Aquifer Disposition
Number of aquifers 1
Principal aquifer AlluviumMajor Aquifer Older Alluvium Aeolian Alluvium
Exploratory Data AvailabilitySource of Data No of exploration wells as per depth range (m) Total
lt100 100-200 200-300 gt300
CGWB 2 1 1 4 8WREDPSTCWSS 8 0 0 1 9PRIVATE 1 0 1 0 2TOTAL 11 1 2 5 19
Aquifer wise Characteristics (CGWB2015)AquiferGroup
Geology Type ofAquifer
ThicknessofGranularzones (m)
Transmi-ssivity(m2day)
Yield(m3day)
SpecificYield
Storativity
SingleAquiferSystem
QuaternaryAlluvialdeposits
Unconfinedto confined
127 547 -2990
3668 12 (0072) 72x10-4
Well field proposed in this block (Site Location Deviwala)The Aquifer comprises of fresh and saline water and the major aquifer material is sand Theaquiclude and aquitard comprises of clay clay with siltExploratory Data Validated
Source of Data No of exploration wells as per depth range (m) Totallt100 100-200 200-300 gt300
CGWB 0 0 1 4 5WREDPSTCWSS 0 0 0 1 1PRIVATE 0 0 1 0 1TOTAL 0 0 2 5 7
The data is validated by selecting the deepest well in each quadrant and used for preparation of3-D Litho models 2-D Geological Cross Sections Fence Diagrams and Aquifer Maps
Aquifer Mapping and Management Plan of Faridkot District Punjab State
Page | 53
3-D Lithological model of Kot Kapura Block
Lithological Cross section from Wara Daraka to Aulakh
Lithological Cross section from Nangal to Dal Singhwala
Aquifer Mapping and Management Plan of Faridkot District Punjab State
Page | 54
3-D Lithological Fence Diagram
3-D Aquifer Disposition Fence Diagram
Aquifer Mapping and Management Plan of Faridkot District Punjab State
Page | 54
3-D Lithological Fence Diagram
3-D Aquifer Disposition Fence Diagram
Aquifer Mapping and Management Plan of Faridkot District Punjab State
Page | 54
3-D Lithological Fence Diagram
3-D Aquifer Disposition Fence Diagram
Aquifer Mapping and Management Plan of Faridkot District Punjab State
Page | 55
Ground water Resource Extraction Contamination and other issues in Kot Kapura Block
Ground WaterResources upto thedepth of 300m
Dynamic Fresh waterresources
26821 mcm
In-storage Fresh waterresources
213062 mcm
In-storage Saline waterresources
27360 mcm
Total 267243 mcmGround WaterExtraction (as per 2013)
Irrigation 42020 mcm
Domestic amp Industrial 1402 mcm
Future Demand for domestic amp Industrial sector(2025) (as per 2013)
1511 mcm
Stage of Groundwater Development 162
Chemical Quality of ground water Ground water in the area is alkaline and pHranges between 820 to 893 Ground waterin the area is slightly fresh to marginalsaline EC value of the ground water showwide variations and ranges from 1154Scm to 3988 Scm at 250CRSC values are varies from -003 to 1100meqL and the area is fit for irrigation
Ground water Contamination Issues Fluoride (mgl)Kot Kapura (333) Dhilwan kalan (285)Moharewala ( 195) Bir Sikhanwala ( 184)Nitrate (mgl)Wara Daraka (66) Dhilwan Kalan (72)Moharewala (78) Bir sikhan wala (89)KotKapura (144)
Other issues Water level decline has been observed inmajor parts of the block due to indiscriminate development of ground waterresourcesIn shallow water level area lessdevelopment of ground water resourcecouple with recharge from canal irrigation iscausing water logging and inland salinityproblems
Aquifer Mapping and Management Plan of Faridkot District Punjab State
Page | 56
Ground water Resource Enhancement Potential
Aquifer wise space available for recharge and proposed interventions (Supply Side Measures)
Aquifer-I
Volume of unsaturated zone after 3m upto a desirable depth 14396 mcmSource water requirementavailability for recharge Rain Canal Irrigation return flowTypes and number of structures NAOther interventions proposed Artificial Recharge Roof top Rainwater harvesting will conserve475 mcm volume of water
Demand side interventions
Advanced Irrigation PracticesArea proposed to be covered Entire Kot Kapura Block (66650 sq km)Volume of Water expected to be conserved under advanced irrigation practices such as lining ofunderground pipelines (Kutcha channel) etc 9915 mcm
Required Change in cropping pattern
Proposed change in cropping pattern Rice to Maize Soyabean The overexploitation can bemanaged at sustainable level (100) by changing the Paddy cropArea coverage 12 of the total rice area needs to change ie 6264 sq kmAnticipated volume of water to be saved 6264 mcm
Net AnnualGroundWater
Availability2013
(mcm)
TotalIrrigation Draft
(present)(mcm)
GrossDraft alluses(present)(mcm)
Paddyarea
(Sq km)
RequiredArea to be
Changefrom
Paddy toMaize
soya bean(Sq km)
Amountof
WaterSaved(mcm)
Grossdraftafter
savingof water(mcm)
PresentStage of
development ()
Reductionin Stage ofdevelopme
nt afterMaize
soya bean()
CropDiversifiedarea ()
26821 42020 43421 52200 6264 6264 35756 162 234 12
Alternate Water sourcesSurface water sources Tanks PondsLocation details and availability from such sources outside the area Not AvailableRegulation and Control
Punjab Subsoil Act for delay in paddy plantation should continue in the area
Other interventions proposed if anyModern Irrigation Practices be adopted for Rabi crops Some of the techniques are given in
the table below (PAU Ludhiana)
Aquifer Mapping and Management Plan of Faridkot District Punjab State
Page | 57
SlNo Techniques Water Saving()
Crops
1 Mulching 17 Wheat2 Bed Planting 18-25 Wheat3 Use of Sprinkler and drip
Irrigation70-90 Sugarcane Cotton Sunflower Maize
Other than that by 15 days ponding followed by 2 days of drying can lead to 25 saving of water inpaddy crop
Aquifer Mapping and Management Plan of Faridkot District Punjab State
Page | 58
Annexure-I
Nd Not Determined BDL Below Detection Limit
Aquifer Mapping and Management Plan of Faridkot District Punjab State
Page | 59
Annexure-IIData Availability of Exploration Wells of Faridkot district
SlNo LOCATION LONGITUDE LATITUDE DEPTH ELEVATION BLOCK DEPARTMENT1 Dal Singhwala 74950 30469 300 211 Kot Kapura CGWB2 Dip Singh Wala 74483 30742 300 201 Faridkot CGWB3 Golewala 74692 30792 300 1995 Faridkot CGWB4 Jaito Mandi 74891 30446 300 203 Kot Kapura CGWB5 Kot Kapura 74814 30576 300 206 Kot Kapura CGWB6 Nanak Nagri 74893 30581 200 210 Kot Kapura PRIVATE7 Nangal 74869 30669 300 206 Faridkot CGWB8 Tehna 74790 30690 300 205 Faridkot CGWB9 Wara Daraka 74797 30548 300 205 Kot Kapura CGWB
10 Aulakh 74920 30643 300 211 Kot Kapura PSTC11 Bhagthala 74786 30777 300 198 Faridkot PSTC12 Sadhuwala 74559 30717 300 196 Faridkot PSTC13 Deviwala 74870 30612 269 207 Kot Kapura CGWB14 Deviwala-I 74870 30612 156 207 Kot Kapura CGWB15 Kouni 74675 30760 60 194 Faridkot WSS16 Ghugiana 74639 30746 60 198 Faridkot WSS17 Pahluwala 74763 30799 60 203 Faridkot WSS18 Faridkot 74763 30681 60 203 Faridkot WSS19 Doda Bhundar 75016 30470 121 212 Kot Kapura WRED20 Dhudi 74849 30700 60 207 Faridkot WSS21 Ratti Rori 74811 30647 60 208 Faridkot WSS22 Chak Kalyan 74705 30572 60 203 Kot Kapura WSS23 Kot Kapura 74812 30596 60 208 Kot Kapura WSS24 Behbal Kalan 74913 30531 60 210 Kot Kapura WSS25 Rorian Kapura 74815 30439 60 207 Kot Kapura WSS26 Panjgrain 74914 30608 70 211 Kot Kapura PRIVATE27 Fatehgarh 74943 30405 60 208 Kot Kapura WSS
28Bhurj JawarSingh 74987 30535 60 211 Kot Kapura WRED
29 Dewarana 74766 30593 30 206 Kot Kapura WRED30 Sher Singhwala 74628 30665 65 195 Faridkot CGWB31 Bir Sikhan wala 74849 30627 65 207 Kot Kapura CGWB32 Dohak 74603 30632 163 197 Muktsar CGWB33 Toot 74645 30829 217 196 Ghal khurd CGWB
Two exploratory wells from adjacent districts ie Dohak from Muktsar district and Toot fromFerozpur district have been incorporated for the preparation of lithological fence and crosssections
Aquifer Mapping and Management Plan of Faridkot District Punjab State
Page | 60
Annexure-IIILITHOLOGICAL DATA OF WELLS IN FARIDKOT DISTRICT
Well Location Depth from Depth to Lithology Thickness
Dal Singhwala
0 13 Clay 1313 20 Fresh Sand 720 28 Clay 828 57 Fresh Sand 2957 64 Clay 764 75 Saline Sand 1175 78 Clay 378 97 Saline Sand 1997 108 Clay 11
108 117 Saline Sand 9117 122 Clay 5122 134 Saline Sand 12134 157 Clay 23157 173 Saline Sand 16173 179 Clay 6179 184 Saline Sand 5184 211 Clay 27211 219 Saline Sand 8219 253 Clay 34253 259 Saline Sand 6259 278 Clay 19278 293 Saline Sand 15293 298 Clay 5298 300 Saline Sand 2
Dip Singh Wala
0 8 Fresh Sand 88 36 Clay 28
36 68 Fresh Sand 3268 755 Clay 75
755 805 Fresh Sand 5805 83 Clay 2583 92 Fresh Sand 992 93 Clay 193 109 Saline Sand 16
109 113 Clay 4113 116 Saline Sand 3116 120 Clay 4120 132 Saline Sand 12
Aquifer Mapping and Management Plan of Faridkot District Punjab State
Page | 61
Dip Singh Wala 132 146 Clay 14146 162 Saline Sand 16162 168 Clay 6168 192 Saline Sand 24192 195 Clay 3195 197 Saline Sand 2197 2015 Clay 45
2015 209 Saline Sand 75209 2135 Clay 45
2135 2175 Saline Sand 42175 221 Clay 35221 237 Saline Sand 16237 2865 Clay 495
2865 2895 Saline Sand 32895 293 Clay 35293 296 Saline Sand 3296 300 Clay 4
Golewala
0 75 Clay 7575 2885 Fresh Sand 2135
2885 40 Clay 111540 525 Fresh Sand 125
525 60 Clay 7560 88 Saline Sand 2888 93 Clay 593 103 Saline Sand 10
103 1325 Clay 2951325 1375 Saline Sand 51375 155 Clay 175155 1575 Saline Sand 25
1575 182 Clay 245182 2035 Saline Sand 215
2035 2285 Clay 252285 234 Saline Sand 55234 253 Clay 19253 2725 Saline Sand 195
2725 280 Clay 75280 2975 Saline Sand 175
2975 300 Clay 25Jaito Mandi 0 15 Clay 15
15 25 Fresh Sand 1025 28 Clay 3
Aquifer Mapping and Management Plan of Faridkot District Punjab State
Page | 62
Jaito Mandi 28 42 Fresh Sand 1442 46 Clay 446 59 Fresh Sand 1359 80 Clay 2180 915 Fresh Sand 115
915 103 Clay 115103 107 Fresh Sand 4107 1555 Clay 485
1555 1715 Fresh Sand 161715 191 Clay 195191 213 Saline Sand 22213 220 Clay 7220 223 Saline Sand 3223 238 Clay 15238 255 Saline Sand 17255 273 Clay 18273 2785 Saline Sand 55
2785 2805 Clay 22805 283 Saline Sand 25283 2985 Clay 155
2985 300 Saline Sand 15
Kot Kapura
0 14 Clay 1414 21 Fresh Sand 721 25 Clay 425 355 Fresh Sand 105
355 37 Clay 1537 50 Fresh Sand 1350 57 Clay 757 64 Fresh Sand 764 69 Clay 569 77 Fresh Sand 877 88 Clay 1188 99 Fresh Sand 1199 103 Clay 4
103 106 Saline Sand 3106 123 Clay 17123 1286 Saline Sand 56
1286 130 Clay 14130 1326 Saline Sand 26
1326 134 Clay 14134 1355 Saline Sand 15
Aquifer Mapping and Management Plan of Faridkot District Punjab State
Page | 63
Kot Kapura
1355 1492 Clay 1371492 1518 Saline Sand 261518 155 Clay 32155 1584 Saline Sand 34
1584 161 Clay 26161 1796 Saline Sand 186
1796 1812 Clay 161812 1838 Saline Sand 261838 1865 Clay 271865 2045 Saline Sand 182045 207 Clay 25207 2125 Saline Sand 55
2125 249 Clay 365249 2545 Saline Sand 55
2545 280 Clay 255280 2944 Saline Sand 144
2944 300 Clay 56
Nanak Nagri
0 136 Clay 136136 208 Fresh Sand 72208 265 Clay 57265 305 Fresh Sand 4305 34 Clay 3534 368 Fresh Sand 28
368 388 Clay 2388 40 Fresh Sand 1240 428 Clay 28
428 46 Fresh Sand 3246 695 Clay 235
695 712 Fresh Sand 17712 785 Clay 73785 815 Fresh Sand 3815 84 Clay 2584 87 Fresh Sand 387 92 Clay 592 936 Saline Sand 16
936 988 Clay 52988 100 Saline Sand 12100 1085 Clay 85
1085 1115 Saline Sand 31115 118 Clay 65118 120 Saline Sand 2
Aquifer Mapping and Management Plan of Faridkot District Punjab State
Page | 64
Nanak Nagri 120 128 Clay 8128 1296 Saline Sand 16
1296 130 Clay 04130 1316 Saline Sand 16
1316 135 Clay 34135 1368 Saline Sand 18
1368 165 Clay 282165 1676 Saline Sand 26
1676 184 Clay 164184 1868 Saline Sand 28
1868 1905 Clay 371905 1948 Saline Sand 431948 2134 Clay 186
Nangal
0 8 Clay 88 20 Fresh Sand 12
20 23 Clay 323 28 Fresh Sand 528 29 Clay 129 41 Fresh Sand 1241 72 Clay 3172 80 Fresh Sand 880 91 Clay 1191 124 Fresh Sand 33
124 151 Clay 27151 158 Fresh Sand 7158 163 Clay 5163 171 Fresh Sand 8171 181 Clay 10181 187 Fresh Sand 6187 193 Clay 6193 199 Fresh Sand 6199 203 Clay 4203 219 Fresh Sand 16219 224 Clay 5224 233 Saline Sand 9233 243 Clay 10243 249 Saline Sand 6249 251 Clay 2251 257 Saline Sand 6257 300 Clay 43
Tehna 0 8 Clay 8
Aquifer Mapping and Management Plan of Faridkot District Punjab State
Page | 65
Tehna
8 23 Fresh Sand 1523 28 Clay 528 32 Fresh Sand 432 37 Clay 537 41 Fresh Sand 441 59 Clay 1859 63 Fresh Sand 463 69 Clay 669 72 Fresh Sand 372 102 Clay 30
102 106 Fresh Sand 4106 120 Clay 14120 123 Fresh Sand 3123 133 Clay 10133 136 Fresh Sand 3136 145 Clay 9145 150 Fresh Sand 5150 158 Clay 8158 163 Fresh Sand 5163 168 Clay 5168 172 Fresh Sand 4172 176 Clay 4176 184 Fresh Sand 8184 210 Clay 26210 215 Fresh Sand 5215 221 Clay 6221 225 Fresh Sand 4225 254 Clay 29254 264 Fresh Sand 10264 267 Clay 3267 275 Fresh Sand 8275 294 Clay 19294 300 Fresh Sand 6
Wara Daraka
0 15 Clay 1515 22 Fresh Sand 722 28 Clay 628 48 Fresh Sand 2048 52 Clay 452 61 Fresh Sand 961 65 Clay 465 75 Fresh Sand 10
Aquifer Mapping and Management Plan of Faridkot District Punjab State
Page | 66
Wara Daraka
75 84 Clay 984 86 Saline Sand 286 91 Clay 591 97 Saline Sand 697 101 Clay 4
101 119 Saline Sand 18119 124 Clay 5124 129 Saline Sand 5129 150 Clay 21150 172 Saline Sand 22172 184 Clay 12184 188 Saline Sand 4188 196 Clay 8196 205 Saline Sand 9205 234 Clay 29234 239 Saline Sand 5239 274 Clay 35274 281 Saline Sand 7281 300 Clay 19
Aulakh
0 1829 Clay 18291829 4573 Fresh Sand 27444573 7621 Clay 30487621 9146 Fresh Sand 15259146 10975 Clay 1829
10975 1128 Saline Sand 3051128 13414 Clay 2134
13414 16768 Saline Sand 335416768 20112 Clay 334420112 21036 Saline Sand 92421036 21341 Clay 30521341 21951 Saline Sand 6121951 2256 Clay 6092256 245 Saline Sand 194245 300 Clay 55
Bhagthala
0 35 Clay 3535 1829 Fresh Sand 1479
1829 41 Clay 227141 53 Fresh Sand 1253 63 Clay 1063 8537 Saline Sand 2237
8537 92 Clay 663
Aquifer Mapping and Management Plan of Faridkot District Punjab State
Page | 67
92 102 Saline Sand 10102 1311 Clay 291
1311 13415 Saline Sand 30513415 16768 Clay 335316768 17073 Saline Sand 30517073 185 Clay 1427
185 203 Saline Sand 18203 22866 Clay 2566
22866 23476 Saline Sand 6123476 253 Clay 1824
253 273 Saline Sand 20273 280 Clay 7280 294 Saline Sand 14294 300 Clay 6
Sadhuwala
0 61 Fresh Sand 6161 3049 Clay 2439
3049 52 Saline Sand 215152 625 Clay 105
625 725 Saline Sand 10725 77 Clay 4577 84 Saline Sand 784 91 Clay 791 107 Saline Sand 16
107 110 Clay 3110 114 Saline Sand 4114 118 Clay 4118 130 Saline Sand 12130 14339 Clay 1339
14339 16463 Saline Sand 212416463 17683 Clay 12217683 207 Saline Sand 3017
207 2115 Clay 452115 2155 Saline Sand 42155 219 Clay 35219 235 Saline Sand 16235 237 Clay 2237 25624 Saline Sand 1924
25624 27134 Clay 15127134 300 Saline Sand 2866
Deviwala0 15 Clay 15
15 23 Fresh Sand 8
Aquifer Mapping and Management Plan of Faridkot District Punjab State
Page | 68
Deviwala
23 38 Clay 1538 46 Fresh Sand 846 48 Clay 248 53 Fresh Sand 553 61 Clay 861 65 Fresh Sand 465 72 Clay 772 78 Fresh Sand 678 94 Clay 1694 106 Fresh Sand 12
106 109 Clay 3109 112 Saline Sand 3112 128 Clay 16128 140 Saline Sand 12140 158 Clay 18158 163 Saline Sand 5163 179 Clay 16179 183 Saline Sand 4183 187 Clay 4187 196 Saline Sand 9196 202 Clay 6202 213 Saline Sand 11213 218 Clay 5218 223 Saline Sand 5223 252 Clay 29252 258 Saline Sand 6258 263 Clay 5263 269 Saline Sand 6
Dohak
0 8 Clay 88 10 Fresh Sand 2
10 21 Clay 1121 33 Saline Sand 1233 41 Clay 841 79 Saline Sand 3879 89 Clay 1089 95 Saline Sand 695 99 Clay 499 112 Saline Sand 13
112 116 Clay 4116 139 Saline Sand 23139 154 Clay 15
Aquifer Mapping and Management Plan of Faridkot District Punjab State
Page | 69
154 163 Saline Sand 9
Toot
0 15 Clay 1515 198 Fresh Sand 48
198 21 Clay 1221 474 Fresh Sand 264
474 51 Clay 3651 552 Fresh Sand 42
552 626 Clay 74626 766 Fresh Sand 14766 101 Clay 244101 104 Fresh Sand 3104 113 Clay 9113 116 Fresh Sand 3116 143 Clay 27143 146 Saline Sand 3146 167 Clay 21167 170 Saline Sand 3170 182 Clay 12182 204 Saline Sand 22204 214 Clay 10214 217 Saline Sand 3
Aquifer Mapping and Management Plan of Faridkot District Punjab State
Page | 70
Annexure-IVAQUIFER GROUPING OF WELL LOCATIONS IN FARIDKOT DISTRICT
Well location Depth from Depth to Aquifer Thickness FreshGranular
Zones
SalineGranular
Zones
Dal Singhwala
0 15 Unsaturated Zone 15 215 57 Aquifer Group-IA 42 3457 64 Aquiclude-IA 764 134 Aquifer Group-IB 70 51
134 157 Aquiclude-IB 23157 300 Multiple Aquifers 143 52
Dip Singh Wala
0 5 Unsaturated Zone 5 55 68 Aquifer Group-IA 63 35
68 755 Aquiclude-IA 75755 132 Aquifer Group-IB 565 14 31132 146 Aquiclude-IB 14146 300 Multiple Aquifers 154 755
Golewala
0 4 Unsaturated Zone 4 14 525 Aquifer Group-IA 485 33
525 60 Aquiclude-IA 7560 103 Aquifer Group-IB 43 38
103 155 Aquiclude-IB 52155 300 Multiple Aquifers 145 665
Jaito Mandi
0 14 Unsaturated Zone 14 114 59 Aquifer Group-IA 45 3759 80 Aquiclude-IA 2180 107 Aquifer Group-IB 27 155
107 1555 Aquiclude-IB 4851555 300 Multiple Aquifers 1445 16 515
Kot Kapura
0 9 Unsaturated Zone 9 29 77 Aquifer Group-IA 68 455
77 88 Aquiclude-IA 1188 106 Aquifer Group-IB 18 11 3
106 155 Aquiclude-IB 49155 300 Multiple Aquifers 145 68
Nanak Nagri
0 12 Unsaturated Zone 12 112 46 Aquifer Group-IA 34 18446 69 Aquiclude-IA 2369 131 Aquifer Group-IB 62 77 11
131 165 Aquiclude-IB 34165 2134 Multiple Aquifers 484 97
Nangal 0 9 Unsaturated Zone 9 1
Aquifer Mapping and Management Plan of Faridkot District Punjab State
Page | 71
Nangal
9 41 Aquifer Group-IA 32 2941 72 Aquiclude-IA 3172 124 Aquifer Group-IB 52 41
124 151 Aquiclude-IB 27151 300 Multiple Aquifers 149 43 21
Tehna
0 10 Unsaturated Zone 10 210 41 Aquifer Group-IA 31 18741 59 Aquiclude-IA 1859 106 Aquifer Group-IB 47 33
106 158 Aquiclude-IB 52158 300 Multiple Aquifers 142 50
Wara Daraka
0 4 Unsaturated Zone 4 04 75 Aquifer Group-IA 71 46
75 84 Aquiclude-IA 984 129 Aquifer Group-IB 45 31
129 150 Aquiclude-IB 21150 300 Multiple Aquifers 150 47
Aulakh
0 17 Unsaturated Zone 17 217 46 Aquifer Group-IA 29 2646 76 Aquiclude-IA 3076 113 Aquifer Group-IB 37 1525 305
113 134 Aquiclude-IB 21134 300 Multiple Aquifers 166 6828
Bhagthala
0 4 Unsaturated Zone 4 14 53 Aquifer Group-IA 49 24
53 63 Aquiclude-IA 1063 102 Aquifer Group-IB 39 3237
102 168 Aquiclude-IB 66168 300 Multiple Aquifers 132 6115
Sadhuwala
0 5 Unsaturated Zone 5 55 52 Aquifer Group-IA 47 2151
52 63 Aquiclude-IA 1163 130 Aquifer Group-IB 67 49
130 144 Aquiclude-IB 14144 300 Multiple Aquifers 156 11931
Deviwala
0 8 Unsaturated Zone 8 28 78 Aquifer Group-IA 70 31
78 94 Aquiclude-IA 1694 112 Aquifer Group-IB 18 12 3
112 128 Aquiclude-IB 16128 269 Multiple Aquifers 141 58
Aquifer Mapping and Management Plan of Faridkot District Punjab State
Page | 72
Dohak
0 3 Unsaturated Zone 3 03 79 Aquifer Group-IA 76 2 50
79 89 Aquiclude-IA 1089 139 Aquifer Group-IB 50 42
139 154 Aquiclude-IB 15154 163 Multiple Aquifers 9 9
Toot
0 9 Unsaturated Zone 9 19 55 Aquifer Group-IA 46 354
55 63 Aquiclude-IA 863 116 Aquifer Group-IB 53 25
116 143 Aquiclude-IB 27143 217 Multiple Aquifers 74 31
- कदरीय भमि जल बोरड
-
- जल ससाधन नदी विकास और गगा सरकषण मतरालय
- भारत सरकार
-
- contents naquim faridkotpdf (p1-5)
- Final Faridkot edited 170317pdf (p6-77)
-

Aquifer Mapping and Management Plan of Faridkot District Punjab State
Page | 52
Aquifer Disposition
Number of aquifers 1
Principal aquifer AlluviumMajor Aquifer Older Alluvium Aeolian Alluvium
Exploratory Data AvailabilitySource of Data No of exploration wells as per depth range (m) Total
lt100 100-200 200-300 gt300
CGWB 2 1 1 4 8WREDPSTCWSS 8 0 0 1 9PRIVATE 1 0 1 0 2TOTAL 11 1 2 5 19
Aquifer wise Characteristics (CGWB2015)AquiferGroup
Geology Type ofAquifer
ThicknessofGranularzones (m)
Transmi-ssivity(m2day)
Yield(m3day)
SpecificYield
Storativity
SingleAquiferSystem
QuaternaryAlluvialdeposits
Unconfinedto confined
127 547 -2990
3668 12 (0072) 72x10-4
Well field proposed in this block (Site Location Deviwala)The Aquifer comprises of fresh and saline water and the major aquifer material is sand Theaquiclude and aquitard comprises of clay clay with siltExploratory Data Validated
Source of Data No of exploration wells as per depth range (m) Totallt100 100-200 200-300 gt300
CGWB 0 0 1 4 5WREDPSTCWSS 0 0 0 1 1PRIVATE 0 0 1 0 1TOTAL 0 0 2 5 7
The data is validated by selecting the deepest well in each quadrant and used for preparation of3-D Litho models 2-D Geological Cross Sections Fence Diagrams and Aquifer Maps
Aquifer Mapping and Management Plan of Faridkot District Punjab State
Page | 53
3-D Lithological model of Kot Kapura Block
Lithological Cross section from Wara Daraka to Aulakh
Lithological Cross section from Nangal to Dal Singhwala
Aquifer Mapping and Management Plan of Faridkot District Punjab State
Page | 54
3-D Lithological Fence Diagram
3-D Aquifer Disposition Fence Diagram
Aquifer Mapping and Management Plan of Faridkot District Punjab State
Page | 54
3-D Lithological Fence Diagram
3-D Aquifer Disposition Fence Diagram
Aquifer Mapping and Management Plan of Faridkot District Punjab State
Page | 54
3-D Lithological Fence Diagram
3-D Aquifer Disposition Fence Diagram
Aquifer Mapping and Management Plan of Faridkot District Punjab State
Page | 55
Ground water Resource Extraction Contamination and other issues in Kot Kapura Block
Ground WaterResources upto thedepth of 300m
Dynamic Fresh waterresources
26821 mcm
In-storage Fresh waterresources
213062 mcm
In-storage Saline waterresources
27360 mcm
Total 267243 mcmGround WaterExtraction (as per 2013)
Irrigation 42020 mcm
Domestic amp Industrial 1402 mcm
Future Demand for domestic amp Industrial sector(2025) (as per 2013)
1511 mcm
Stage of Groundwater Development 162
Chemical Quality of ground water Ground water in the area is alkaline and pHranges between 820 to 893 Ground waterin the area is slightly fresh to marginalsaline EC value of the ground water showwide variations and ranges from 1154Scm to 3988 Scm at 250CRSC values are varies from -003 to 1100meqL and the area is fit for irrigation
Ground water Contamination Issues Fluoride (mgl)Kot Kapura (333) Dhilwan kalan (285)Moharewala ( 195) Bir Sikhanwala ( 184)Nitrate (mgl)Wara Daraka (66) Dhilwan Kalan (72)Moharewala (78) Bir sikhan wala (89)KotKapura (144)
Other issues Water level decline has been observed inmajor parts of the block due to indiscriminate development of ground waterresourcesIn shallow water level area lessdevelopment of ground water resourcecouple with recharge from canal irrigation iscausing water logging and inland salinityproblems
Aquifer Mapping and Management Plan of Faridkot District Punjab State
Page | 56
Ground water Resource Enhancement Potential
Aquifer wise space available for recharge and proposed interventions (Supply Side Measures)
Aquifer-I
Volume of unsaturated zone after 3m upto a desirable depth 14396 mcmSource water requirementavailability for recharge Rain Canal Irrigation return flowTypes and number of structures NAOther interventions proposed Artificial Recharge Roof top Rainwater harvesting will conserve475 mcm volume of water
Demand side interventions
Advanced Irrigation PracticesArea proposed to be covered Entire Kot Kapura Block (66650 sq km)Volume of Water expected to be conserved under advanced irrigation practices such as lining ofunderground pipelines (Kutcha channel) etc 9915 mcm
Required Change in cropping pattern
Proposed change in cropping pattern Rice to Maize Soyabean The overexploitation can bemanaged at sustainable level (100) by changing the Paddy cropArea coverage 12 of the total rice area needs to change ie 6264 sq kmAnticipated volume of water to be saved 6264 mcm
Net AnnualGroundWater
Availability2013
(mcm)
TotalIrrigation Draft
(present)(mcm)
GrossDraft alluses(present)(mcm)
Paddyarea
(Sq km)
RequiredArea to be
Changefrom
Paddy toMaize
soya bean(Sq km)
Amountof
WaterSaved(mcm)
Grossdraftafter
savingof water(mcm)
PresentStage of
development ()
Reductionin Stage ofdevelopme
nt afterMaize
soya bean()
CropDiversifiedarea ()
26821 42020 43421 52200 6264 6264 35756 162 234 12
Alternate Water sourcesSurface water sources Tanks PondsLocation details and availability from such sources outside the area Not AvailableRegulation and Control
Punjab Subsoil Act for delay in paddy plantation should continue in the area
Other interventions proposed if anyModern Irrigation Practices be adopted for Rabi crops Some of the techniques are given in
the table below (PAU Ludhiana)
Aquifer Mapping and Management Plan of Faridkot District Punjab State
Page | 57
SlNo Techniques Water Saving()
Crops
1 Mulching 17 Wheat2 Bed Planting 18-25 Wheat3 Use of Sprinkler and drip
Irrigation70-90 Sugarcane Cotton Sunflower Maize
Other than that by 15 days ponding followed by 2 days of drying can lead to 25 saving of water inpaddy crop
Aquifer Mapping and Management Plan of Faridkot District Punjab State
Page | 58
Annexure-I
Nd Not Determined BDL Below Detection Limit
Aquifer Mapping and Management Plan of Faridkot District Punjab State
Page | 59
Annexure-IIData Availability of Exploration Wells of Faridkot district
SlNo LOCATION LONGITUDE LATITUDE DEPTH ELEVATION BLOCK DEPARTMENT1 Dal Singhwala 74950 30469 300 211 Kot Kapura CGWB2 Dip Singh Wala 74483 30742 300 201 Faridkot CGWB3 Golewala 74692 30792 300 1995 Faridkot CGWB4 Jaito Mandi 74891 30446 300 203 Kot Kapura CGWB5 Kot Kapura 74814 30576 300 206 Kot Kapura CGWB6 Nanak Nagri 74893 30581 200 210 Kot Kapura PRIVATE7 Nangal 74869 30669 300 206 Faridkot CGWB8 Tehna 74790 30690 300 205 Faridkot CGWB9 Wara Daraka 74797 30548 300 205 Kot Kapura CGWB
10 Aulakh 74920 30643 300 211 Kot Kapura PSTC11 Bhagthala 74786 30777 300 198 Faridkot PSTC12 Sadhuwala 74559 30717 300 196 Faridkot PSTC13 Deviwala 74870 30612 269 207 Kot Kapura CGWB14 Deviwala-I 74870 30612 156 207 Kot Kapura CGWB15 Kouni 74675 30760 60 194 Faridkot WSS16 Ghugiana 74639 30746 60 198 Faridkot WSS17 Pahluwala 74763 30799 60 203 Faridkot WSS18 Faridkot 74763 30681 60 203 Faridkot WSS19 Doda Bhundar 75016 30470 121 212 Kot Kapura WRED20 Dhudi 74849 30700 60 207 Faridkot WSS21 Ratti Rori 74811 30647 60 208 Faridkot WSS22 Chak Kalyan 74705 30572 60 203 Kot Kapura WSS23 Kot Kapura 74812 30596 60 208 Kot Kapura WSS24 Behbal Kalan 74913 30531 60 210 Kot Kapura WSS25 Rorian Kapura 74815 30439 60 207 Kot Kapura WSS26 Panjgrain 74914 30608 70 211 Kot Kapura PRIVATE27 Fatehgarh 74943 30405 60 208 Kot Kapura WSS
28Bhurj JawarSingh 74987 30535 60 211 Kot Kapura WRED
29 Dewarana 74766 30593 30 206 Kot Kapura WRED30 Sher Singhwala 74628 30665 65 195 Faridkot CGWB31 Bir Sikhan wala 74849 30627 65 207 Kot Kapura CGWB32 Dohak 74603 30632 163 197 Muktsar CGWB33 Toot 74645 30829 217 196 Ghal khurd CGWB
Two exploratory wells from adjacent districts ie Dohak from Muktsar district and Toot fromFerozpur district have been incorporated for the preparation of lithological fence and crosssections
Aquifer Mapping and Management Plan of Faridkot District Punjab State
Page | 60
Annexure-IIILITHOLOGICAL DATA OF WELLS IN FARIDKOT DISTRICT
Well Location Depth from Depth to Lithology Thickness
Dal Singhwala
0 13 Clay 1313 20 Fresh Sand 720 28 Clay 828 57 Fresh Sand 2957 64 Clay 764 75 Saline Sand 1175 78 Clay 378 97 Saline Sand 1997 108 Clay 11
108 117 Saline Sand 9117 122 Clay 5122 134 Saline Sand 12134 157 Clay 23157 173 Saline Sand 16173 179 Clay 6179 184 Saline Sand 5184 211 Clay 27211 219 Saline Sand 8219 253 Clay 34253 259 Saline Sand 6259 278 Clay 19278 293 Saline Sand 15293 298 Clay 5298 300 Saline Sand 2
Dip Singh Wala
0 8 Fresh Sand 88 36 Clay 28
36 68 Fresh Sand 3268 755 Clay 75
755 805 Fresh Sand 5805 83 Clay 2583 92 Fresh Sand 992 93 Clay 193 109 Saline Sand 16
109 113 Clay 4113 116 Saline Sand 3116 120 Clay 4120 132 Saline Sand 12
Aquifer Mapping and Management Plan of Faridkot District Punjab State
Page | 61
Dip Singh Wala 132 146 Clay 14146 162 Saline Sand 16162 168 Clay 6168 192 Saline Sand 24192 195 Clay 3195 197 Saline Sand 2197 2015 Clay 45
2015 209 Saline Sand 75209 2135 Clay 45
2135 2175 Saline Sand 42175 221 Clay 35221 237 Saline Sand 16237 2865 Clay 495
2865 2895 Saline Sand 32895 293 Clay 35293 296 Saline Sand 3296 300 Clay 4
Golewala
0 75 Clay 7575 2885 Fresh Sand 2135
2885 40 Clay 111540 525 Fresh Sand 125
525 60 Clay 7560 88 Saline Sand 2888 93 Clay 593 103 Saline Sand 10
103 1325 Clay 2951325 1375 Saline Sand 51375 155 Clay 175155 1575 Saline Sand 25
1575 182 Clay 245182 2035 Saline Sand 215
2035 2285 Clay 252285 234 Saline Sand 55234 253 Clay 19253 2725 Saline Sand 195
2725 280 Clay 75280 2975 Saline Sand 175
2975 300 Clay 25Jaito Mandi 0 15 Clay 15
15 25 Fresh Sand 1025 28 Clay 3
Aquifer Mapping and Management Plan of Faridkot District Punjab State
Page | 62
Jaito Mandi 28 42 Fresh Sand 1442 46 Clay 446 59 Fresh Sand 1359 80 Clay 2180 915 Fresh Sand 115
915 103 Clay 115103 107 Fresh Sand 4107 1555 Clay 485
1555 1715 Fresh Sand 161715 191 Clay 195191 213 Saline Sand 22213 220 Clay 7220 223 Saline Sand 3223 238 Clay 15238 255 Saline Sand 17255 273 Clay 18273 2785 Saline Sand 55
2785 2805 Clay 22805 283 Saline Sand 25283 2985 Clay 155
2985 300 Saline Sand 15
Kot Kapura
0 14 Clay 1414 21 Fresh Sand 721 25 Clay 425 355 Fresh Sand 105
355 37 Clay 1537 50 Fresh Sand 1350 57 Clay 757 64 Fresh Sand 764 69 Clay 569 77 Fresh Sand 877 88 Clay 1188 99 Fresh Sand 1199 103 Clay 4
103 106 Saline Sand 3106 123 Clay 17123 1286 Saline Sand 56
1286 130 Clay 14130 1326 Saline Sand 26
1326 134 Clay 14134 1355 Saline Sand 15
Aquifer Mapping and Management Plan of Faridkot District Punjab State
Page | 63
Kot Kapura
1355 1492 Clay 1371492 1518 Saline Sand 261518 155 Clay 32155 1584 Saline Sand 34
1584 161 Clay 26161 1796 Saline Sand 186
1796 1812 Clay 161812 1838 Saline Sand 261838 1865 Clay 271865 2045 Saline Sand 182045 207 Clay 25207 2125 Saline Sand 55
2125 249 Clay 365249 2545 Saline Sand 55
2545 280 Clay 255280 2944 Saline Sand 144
2944 300 Clay 56
Nanak Nagri
0 136 Clay 136136 208 Fresh Sand 72208 265 Clay 57265 305 Fresh Sand 4305 34 Clay 3534 368 Fresh Sand 28
368 388 Clay 2388 40 Fresh Sand 1240 428 Clay 28
428 46 Fresh Sand 3246 695 Clay 235
695 712 Fresh Sand 17712 785 Clay 73785 815 Fresh Sand 3815 84 Clay 2584 87 Fresh Sand 387 92 Clay 592 936 Saline Sand 16
936 988 Clay 52988 100 Saline Sand 12100 1085 Clay 85
1085 1115 Saline Sand 31115 118 Clay 65118 120 Saline Sand 2
Aquifer Mapping and Management Plan of Faridkot District Punjab State
Page | 64
Nanak Nagri 120 128 Clay 8128 1296 Saline Sand 16
1296 130 Clay 04130 1316 Saline Sand 16
1316 135 Clay 34135 1368 Saline Sand 18
1368 165 Clay 282165 1676 Saline Sand 26
1676 184 Clay 164184 1868 Saline Sand 28
1868 1905 Clay 371905 1948 Saline Sand 431948 2134 Clay 186
Nangal
0 8 Clay 88 20 Fresh Sand 12
20 23 Clay 323 28 Fresh Sand 528 29 Clay 129 41 Fresh Sand 1241 72 Clay 3172 80 Fresh Sand 880 91 Clay 1191 124 Fresh Sand 33
124 151 Clay 27151 158 Fresh Sand 7158 163 Clay 5163 171 Fresh Sand 8171 181 Clay 10181 187 Fresh Sand 6187 193 Clay 6193 199 Fresh Sand 6199 203 Clay 4203 219 Fresh Sand 16219 224 Clay 5224 233 Saline Sand 9233 243 Clay 10243 249 Saline Sand 6249 251 Clay 2251 257 Saline Sand 6257 300 Clay 43
Tehna 0 8 Clay 8
Aquifer Mapping and Management Plan of Faridkot District Punjab State
Page | 65
Tehna
8 23 Fresh Sand 1523 28 Clay 528 32 Fresh Sand 432 37 Clay 537 41 Fresh Sand 441 59 Clay 1859 63 Fresh Sand 463 69 Clay 669 72 Fresh Sand 372 102 Clay 30
102 106 Fresh Sand 4106 120 Clay 14120 123 Fresh Sand 3123 133 Clay 10133 136 Fresh Sand 3136 145 Clay 9145 150 Fresh Sand 5150 158 Clay 8158 163 Fresh Sand 5163 168 Clay 5168 172 Fresh Sand 4172 176 Clay 4176 184 Fresh Sand 8184 210 Clay 26210 215 Fresh Sand 5215 221 Clay 6221 225 Fresh Sand 4225 254 Clay 29254 264 Fresh Sand 10264 267 Clay 3267 275 Fresh Sand 8275 294 Clay 19294 300 Fresh Sand 6
Wara Daraka
0 15 Clay 1515 22 Fresh Sand 722 28 Clay 628 48 Fresh Sand 2048 52 Clay 452 61 Fresh Sand 961 65 Clay 465 75 Fresh Sand 10
Aquifer Mapping and Management Plan of Faridkot District Punjab State
Page | 66
Wara Daraka
75 84 Clay 984 86 Saline Sand 286 91 Clay 591 97 Saline Sand 697 101 Clay 4
101 119 Saline Sand 18119 124 Clay 5124 129 Saline Sand 5129 150 Clay 21150 172 Saline Sand 22172 184 Clay 12184 188 Saline Sand 4188 196 Clay 8196 205 Saline Sand 9205 234 Clay 29234 239 Saline Sand 5239 274 Clay 35274 281 Saline Sand 7281 300 Clay 19
Aulakh
0 1829 Clay 18291829 4573 Fresh Sand 27444573 7621 Clay 30487621 9146 Fresh Sand 15259146 10975 Clay 1829
10975 1128 Saline Sand 3051128 13414 Clay 2134
13414 16768 Saline Sand 335416768 20112 Clay 334420112 21036 Saline Sand 92421036 21341 Clay 30521341 21951 Saline Sand 6121951 2256 Clay 6092256 245 Saline Sand 194245 300 Clay 55
Bhagthala
0 35 Clay 3535 1829 Fresh Sand 1479
1829 41 Clay 227141 53 Fresh Sand 1253 63 Clay 1063 8537 Saline Sand 2237
8537 92 Clay 663
Aquifer Mapping and Management Plan of Faridkot District Punjab State
Page | 67
92 102 Saline Sand 10102 1311 Clay 291
1311 13415 Saline Sand 30513415 16768 Clay 335316768 17073 Saline Sand 30517073 185 Clay 1427
185 203 Saline Sand 18203 22866 Clay 2566
22866 23476 Saline Sand 6123476 253 Clay 1824
253 273 Saline Sand 20273 280 Clay 7280 294 Saline Sand 14294 300 Clay 6
Sadhuwala
0 61 Fresh Sand 6161 3049 Clay 2439
3049 52 Saline Sand 215152 625 Clay 105
625 725 Saline Sand 10725 77 Clay 4577 84 Saline Sand 784 91 Clay 791 107 Saline Sand 16
107 110 Clay 3110 114 Saline Sand 4114 118 Clay 4118 130 Saline Sand 12130 14339 Clay 1339
14339 16463 Saline Sand 212416463 17683 Clay 12217683 207 Saline Sand 3017
207 2115 Clay 452115 2155 Saline Sand 42155 219 Clay 35219 235 Saline Sand 16235 237 Clay 2237 25624 Saline Sand 1924
25624 27134 Clay 15127134 300 Saline Sand 2866
Deviwala0 15 Clay 15
15 23 Fresh Sand 8
Aquifer Mapping and Management Plan of Faridkot District Punjab State
Page | 68
Deviwala
23 38 Clay 1538 46 Fresh Sand 846 48 Clay 248 53 Fresh Sand 553 61 Clay 861 65 Fresh Sand 465 72 Clay 772 78 Fresh Sand 678 94 Clay 1694 106 Fresh Sand 12
106 109 Clay 3109 112 Saline Sand 3112 128 Clay 16128 140 Saline Sand 12140 158 Clay 18158 163 Saline Sand 5163 179 Clay 16179 183 Saline Sand 4183 187 Clay 4187 196 Saline Sand 9196 202 Clay 6202 213 Saline Sand 11213 218 Clay 5218 223 Saline Sand 5223 252 Clay 29252 258 Saline Sand 6258 263 Clay 5263 269 Saline Sand 6
Dohak
0 8 Clay 88 10 Fresh Sand 2
10 21 Clay 1121 33 Saline Sand 1233 41 Clay 841 79 Saline Sand 3879 89 Clay 1089 95 Saline Sand 695 99 Clay 499 112 Saline Sand 13
112 116 Clay 4116 139 Saline Sand 23139 154 Clay 15
Aquifer Mapping and Management Plan of Faridkot District Punjab State
Page | 69
154 163 Saline Sand 9
Toot
0 15 Clay 1515 198 Fresh Sand 48
198 21 Clay 1221 474 Fresh Sand 264
474 51 Clay 3651 552 Fresh Sand 42
552 626 Clay 74626 766 Fresh Sand 14766 101 Clay 244101 104 Fresh Sand 3104 113 Clay 9113 116 Fresh Sand 3116 143 Clay 27143 146 Saline Sand 3146 167 Clay 21167 170 Saline Sand 3170 182 Clay 12182 204 Saline Sand 22204 214 Clay 10214 217 Saline Sand 3
Aquifer Mapping and Management Plan of Faridkot District Punjab State
Page | 70
Annexure-IVAQUIFER GROUPING OF WELL LOCATIONS IN FARIDKOT DISTRICT
Well location Depth from Depth to Aquifer Thickness FreshGranular
Zones
SalineGranular
Zones
Dal Singhwala
0 15 Unsaturated Zone 15 215 57 Aquifer Group-IA 42 3457 64 Aquiclude-IA 764 134 Aquifer Group-IB 70 51
134 157 Aquiclude-IB 23157 300 Multiple Aquifers 143 52
Dip Singh Wala
0 5 Unsaturated Zone 5 55 68 Aquifer Group-IA 63 35
68 755 Aquiclude-IA 75755 132 Aquifer Group-IB 565 14 31132 146 Aquiclude-IB 14146 300 Multiple Aquifers 154 755
Golewala
0 4 Unsaturated Zone 4 14 525 Aquifer Group-IA 485 33
525 60 Aquiclude-IA 7560 103 Aquifer Group-IB 43 38
103 155 Aquiclude-IB 52155 300 Multiple Aquifers 145 665
Jaito Mandi
0 14 Unsaturated Zone 14 114 59 Aquifer Group-IA 45 3759 80 Aquiclude-IA 2180 107 Aquifer Group-IB 27 155
107 1555 Aquiclude-IB 4851555 300 Multiple Aquifers 1445 16 515
Kot Kapura
0 9 Unsaturated Zone 9 29 77 Aquifer Group-IA 68 455
77 88 Aquiclude-IA 1188 106 Aquifer Group-IB 18 11 3
106 155 Aquiclude-IB 49155 300 Multiple Aquifers 145 68
Nanak Nagri
0 12 Unsaturated Zone 12 112 46 Aquifer Group-IA 34 18446 69 Aquiclude-IA 2369 131 Aquifer Group-IB 62 77 11
131 165 Aquiclude-IB 34165 2134 Multiple Aquifers 484 97
Nangal 0 9 Unsaturated Zone 9 1
Aquifer Mapping and Management Plan of Faridkot District Punjab State
Page | 71
Nangal
9 41 Aquifer Group-IA 32 2941 72 Aquiclude-IA 3172 124 Aquifer Group-IB 52 41
124 151 Aquiclude-IB 27151 300 Multiple Aquifers 149 43 21
Tehna
0 10 Unsaturated Zone 10 210 41 Aquifer Group-IA 31 18741 59 Aquiclude-IA 1859 106 Aquifer Group-IB 47 33
106 158 Aquiclude-IB 52158 300 Multiple Aquifers 142 50
Wara Daraka
0 4 Unsaturated Zone 4 04 75 Aquifer Group-IA 71 46
75 84 Aquiclude-IA 984 129 Aquifer Group-IB 45 31
129 150 Aquiclude-IB 21150 300 Multiple Aquifers 150 47
Aulakh
0 17 Unsaturated Zone 17 217 46 Aquifer Group-IA 29 2646 76 Aquiclude-IA 3076 113 Aquifer Group-IB 37 1525 305
113 134 Aquiclude-IB 21134 300 Multiple Aquifers 166 6828
Bhagthala
0 4 Unsaturated Zone 4 14 53 Aquifer Group-IA 49 24
53 63 Aquiclude-IA 1063 102 Aquifer Group-IB 39 3237
102 168 Aquiclude-IB 66168 300 Multiple Aquifers 132 6115
Sadhuwala
0 5 Unsaturated Zone 5 55 52 Aquifer Group-IA 47 2151
52 63 Aquiclude-IA 1163 130 Aquifer Group-IB 67 49
130 144 Aquiclude-IB 14144 300 Multiple Aquifers 156 11931
Deviwala
0 8 Unsaturated Zone 8 28 78 Aquifer Group-IA 70 31
78 94 Aquiclude-IA 1694 112 Aquifer Group-IB 18 12 3
112 128 Aquiclude-IB 16128 269 Multiple Aquifers 141 58
Aquifer Mapping and Management Plan of Faridkot District Punjab State
Page | 72
Dohak
0 3 Unsaturated Zone 3 03 79 Aquifer Group-IA 76 2 50
79 89 Aquiclude-IA 1089 139 Aquifer Group-IB 50 42
139 154 Aquiclude-IB 15154 163 Multiple Aquifers 9 9
Toot
0 9 Unsaturated Zone 9 19 55 Aquifer Group-IA 46 354
55 63 Aquiclude-IA 863 116 Aquifer Group-IB 53 25
116 143 Aquiclude-IB 27143 217 Multiple Aquifers 74 31
- कदरीय भमि जल बोरड
-
- जल ससाधन नदी विकास और गगा सरकषण मतरालय
- भारत सरकार
-
- contents naquim faridkotpdf (p1-5)
- Final Faridkot edited 170317pdf (p6-77)
-
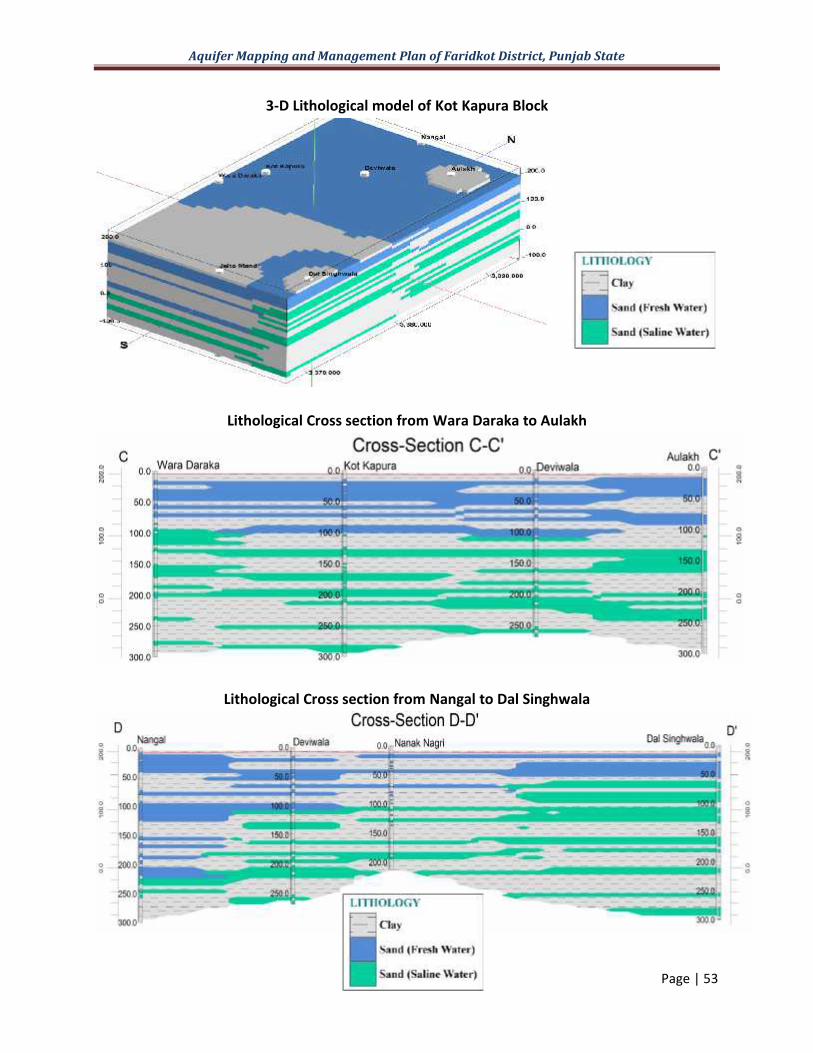
Aquifer Mapping and Management Plan of Faridkot District Punjab State
Page | 54
3-D Lithological Fence Diagram
3-D Aquifer Disposition Fence Diagram
Aquifer Mapping and Management Plan of Faridkot District Punjab State
Page | 54
3-D Lithological Fence Diagram
3-D Aquifer Disposition Fence Diagram
Aquifer Mapping and Management Plan of Faridkot District Punjab State
Page | 54
3-D Lithological Fence Diagram
3-D Aquifer Disposition Fence Diagram
Aquifer Mapping and Management Plan of Faridkot District Punjab State
Page | 55
Ground water Resource Extraction Contamination and other issues in Kot Kapura Block
Ground WaterResources upto thedepth of 300m
Dynamic Fresh waterresources
26821 mcm
In-storage Fresh waterresources
213062 mcm
In-storage Saline waterresources
27360 mcm
Total 267243 mcmGround WaterExtraction (as per 2013)
Irrigation 42020 mcm
Domestic amp Industrial 1402 mcm
Future Demand for domestic amp Industrial sector(2025) (as per 2013)
1511 mcm
Stage of Groundwater Development 162
Chemical Quality of ground water Ground water in the area is alkaline and pHranges between 820 to 893 Ground waterin the area is slightly fresh to marginalsaline EC value of the ground water showwide variations and ranges from 1154Scm to 3988 Scm at 250CRSC values are varies from -003 to 1100meqL and the area is fit for irrigation
Ground water Contamination Issues Fluoride (mgl)Kot Kapura (333) Dhilwan kalan (285)Moharewala ( 195) Bir Sikhanwala ( 184)Nitrate (mgl)Wara Daraka (66) Dhilwan Kalan (72)Moharewala (78) Bir sikhan wala (89)KotKapura (144)
Other issues Water level decline has been observed inmajor parts of the block due to indiscriminate development of ground waterresourcesIn shallow water level area lessdevelopment of ground water resourcecouple with recharge from canal irrigation iscausing water logging and inland salinityproblems
Aquifer Mapping and Management Plan of Faridkot District Punjab State
Page | 56
Ground water Resource Enhancement Potential
Aquifer wise space available for recharge and proposed interventions (Supply Side Measures)
Aquifer-I
Volume of unsaturated zone after 3m upto a desirable depth 14396 mcmSource water requirementavailability for recharge Rain Canal Irrigation return flowTypes and number of structures NAOther interventions proposed Artificial Recharge Roof top Rainwater harvesting will conserve475 mcm volume of water
Demand side interventions
Advanced Irrigation PracticesArea proposed to be covered Entire Kot Kapura Block (66650 sq km)Volume of Water expected to be conserved under advanced irrigation practices such as lining ofunderground pipelines (Kutcha channel) etc 9915 mcm
Required Change in cropping pattern
Proposed change in cropping pattern Rice to Maize Soyabean The overexploitation can bemanaged at sustainable level (100) by changing the Paddy cropArea coverage 12 of the total rice area needs to change ie 6264 sq kmAnticipated volume of water to be saved 6264 mcm
Net AnnualGroundWater
Availability2013
(mcm)
TotalIrrigation Draft
(present)(mcm)
GrossDraft alluses(present)(mcm)
Paddyarea
(Sq km)
RequiredArea to be
Changefrom
Paddy toMaize
soya bean(Sq km)
Amountof
WaterSaved(mcm)
Grossdraftafter
savingof water(mcm)
PresentStage of
development ()
Reductionin Stage ofdevelopme
nt afterMaize
soya bean()
CropDiversifiedarea ()
26821 42020 43421 52200 6264 6264 35756 162 234 12
Alternate Water sourcesSurface water sources Tanks PondsLocation details and availability from such sources outside the area Not AvailableRegulation and Control
Punjab Subsoil Act for delay in paddy plantation should continue in the area
Other interventions proposed if anyModern Irrigation Practices be adopted for Rabi crops Some of the techniques are given in
the table below (PAU Ludhiana)
Aquifer Mapping and Management Plan of Faridkot District Punjab State
Page | 57
SlNo Techniques Water Saving()
Crops
1 Mulching 17 Wheat2 Bed Planting 18-25 Wheat3 Use of Sprinkler and drip
Irrigation70-90 Sugarcane Cotton Sunflower Maize
Other than that by 15 days ponding followed by 2 days of drying can lead to 25 saving of water inpaddy crop
Aquifer Mapping and Management Plan of Faridkot District Punjab State
Page | 58
Annexure-I
Nd Not Determined BDL Below Detection Limit
Aquifer Mapping and Management Plan of Faridkot District Punjab State
Page | 59
Annexure-IIData Availability of Exploration Wells of Faridkot district
SlNo LOCATION LONGITUDE LATITUDE DEPTH ELEVATION BLOCK DEPARTMENT1 Dal Singhwala 74950 30469 300 211 Kot Kapura CGWB2 Dip Singh Wala 74483 30742 300 201 Faridkot CGWB3 Golewala 74692 30792 300 1995 Faridkot CGWB4 Jaito Mandi 74891 30446 300 203 Kot Kapura CGWB5 Kot Kapura 74814 30576 300 206 Kot Kapura CGWB6 Nanak Nagri 74893 30581 200 210 Kot Kapura PRIVATE7 Nangal 74869 30669 300 206 Faridkot CGWB8 Tehna 74790 30690 300 205 Faridkot CGWB9 Wara Daraka 74797 30548 300 205 Kot Kapura CGWB
10 Aulakh 74920 30643 300 211 Kot Kapura PSTC11 Bhagthala 74786 30777 300 198 Faridkot PSTC12 Sadhuwala 74559 30717 300 196 Faridkot PSTC13 Deviwala 74870 30612 269 207 Kot Kapura CGWB14 Deviwala-I 74870 30612 156 207 Kot Kapura CGWB15 Kouni 74675 30760 60 194 Faridkot WSS16 Ghugiana 74639 30746 60 198 Faridkot WSS17 Pahluwala 74763 30799 60 203 Faridkot WSS18 Faridkot 74763 30681 60 203 Faridkot WSS19 Doda Bhundar 75016 30470 121 212 Kot Kapura WRED20 Dhudi 74849 30700 60 207 Faridkot WSS21 Ratti Rori 74811 30647 60 208 Faridkot WSS22 Chak Kalyan 74705 30572 60 203 Kot Kapura WSS23 Kot Kapura 74812 30596 60 208 Kot Kapura WSS24 Behbal Kalan 74913 30531 60 210 Kot Kapura WSS25 Rorian Kapura 74815 30439 60 207 Kot Kapura WSS26 Panjgrain 74914 30608 70 211 Kot Kapura PRIVATE27 Fatehgarh 74943 30405 60 208 Kot Kapura WSS
28Bhurj JawarSingh 74987 30535 60 211 Kot Kapura WRED
29 Dewarana 74766 30593 30 206 Kot Kapura WRED30 Sher Singhwala 74628 30665 65 195 Faridkot CGWB31 Bir Sikhan wala 74849 30627 65 207 Kot Kapura CGWB32 Dohak 74603 30632 163 197 Muktsar CGWB33 Toot 74645 30829 217 196 Ghal khurd CGWB
Two exploratory wells from adjacent districts ie Dohak from Muktsar district and Toot fromFerozpur district have been incorporated for the preparation of lithological fence and crosssections
Aquifer Mapping and Management Plan of Faridkot District Punjab State
Page | 60
Annexure-IIILITHOLOGICAL DATA OF WELLS IN FARIDKOT DISTRICT
Well Location Depth from Depth to Lithology Thickness
Dal Singhwala
0 13 Clay 1313 20 Fresh Sand 720 28 Clay 828 57 Fresh Sand 2957 64 Clay 764 75 Saline Sand 1175 78 Clay 378 97 Saline Sand 1997 108 Clay 11
108 117 Saline Sand 9117 122 Clay 5122 134 Saline Sand 12134 157 Clay 23157 173 Saline Sand 16173 179 Clay 6179 184 Saline Sand 5184 211 Clay 27211 219 Saline Sand 8219 253 Clay 34253 259 Saline Sand 6259 278 Clay 19278 293 Saline Sand 15293 298 Clay 5298 300 Saline Sand 2
Dip Singh Wala
0 8 Fresh Sand 88 36 Clay 28
36 68 Fresh Sand 3268 755 Clay 75
755 805 Fresh Sand 5805 83 Clay 2583 92 Fresh Sand 992 93 Clay 193 109 Saline Sand 16
109 113 Clay 4113 116 Saline Sand 3116 120 Clay 4120 132 Saline Sand 12
Aquifer Mapping and Management Plan of Faridkot District Punjab State
Page | 61
Dip Singh Wala 132 146 Clay 14146 162 Saline Sand 16162 168 Clay 6168 192 Saline Sand 24192 195 Clay 3195 197 Saline Sand 2197 2015 Clay 45
2015 209 Saline Sand 75209 2135 Clay 45
2135 2175 Saline Sand 42175 221 Clay 35221 237 Saline Sand 16237 2865 Clay 495
2865 2895 Saline Sand 32895 293 Clay 35293 296 Saline Sand 3296 300 Clay 4
Golewala
0 75 Clay 7575 2885 Fresh Sand 2135
2885 40 Clay 111540 525 Fresh Sand 125
525 60 Clay 7560 88 Saline Sand 2888 93 Clay 593 103 Saline Sand 10
103 1325 Clay 2951325 1375 Saline Sand 51375 155 Clay 175155 1575 Saline Sand 25
1575 182 Clay 245182 2035 Saline Sand 215
2035 2285 Clay 252285 234 Saline Sand 55234 253 Clay 19253 2725 Saline Sand 195
2725 280 Clay 75280 2975 Saline Sand 175
2975 300 Clay 25Jaito Mandi 0 15 Clay 15
15 25 Fresh Sand 1025 28 Clay 3
Aquifer Mapping and Management Plan of Faridkot District Punjab State
Page | 62
Jaito Mandi 28 42 Fresh Sand 1442 46 Clay 446 59 Fresh Sand 1359 80 Clay 2180 915 Fresh Sand 115
915 103 Clay 115103 107 Fresh Sand 4107 1555 Clay 485
1555 1715 Fresh Sand 161715 191 Clay 195191 213 Saline Sand 22213 220 Clay 7220 223 Saline Sand 3223 238 Clay 15238 255 Saline Sand 17255 273 Clay 18273 2785 Saline Sand 55
2785 2805 Clay 22805 283 Saline Sand 25283 2985 Clay 155
2985 300 Saline Sand 15
Kot Kapura
0 14 Clay 1414 21 Fresh Sand 721 25 Clay 425 355 Fresh Sand 105
355 37 Clay 1537 50 Fresh Sand 1350 57 Clay 757 64 Fresh Sand 764 69 Clay 569 77 Fresh Sand 877 88 Clay 1188 99 Fresh Sand 1199 103 Clay 4
103 106 Saline Sand 3106 123 Clay 17123 1286 Saline Sand 56
1286 130 Clay 14130 1326 Saline Sand 26
1326 134 Clay 14134 1355 Saline Sand 15
Aquifer Mapping and Management Plan of Faridkot District Punjab State
Page | 63
Kot Kapura
1355 1492 Clay 1371492 1518 Saline Sand 261518 155 Clay 32155 1584 Saline Sand 34
1584 161 Clay 26161 1796 Saline Sand 186
1796 1812 Clay 161812 1838 Saline Sand 261838 1865 Clay 271865 2045 Saline Sand 182045 207 Clay 25207 2125 Saline Sand 55
2125 249 Clay 365249 2545 Saline Sand 55
2545 280 Clay 255280 2944 Saline Sand 144
2944 300 Clay 56
Nanak Nagri
0 136 Clay 136136 208 Fresh Sand 72208 265 Clay 57265 305 Fresh Sand 4305 34 Clay 3534 368 Fresh Sand 28
368 388 Clay 2388 40 Fresh Sand 1240 428 Clay 28
428 46 Fresh Sand 3246 695 Clay 235
695 712 Fresh Sand 17712 785 Clay 73785 815 Fresh Sand 3815 84 Clay 2584 87 Fresh Sand 387 92 Clay 592 936 Saline Sand 16
936 988 Clay 52988 100 Saline Sand 12100 1085 Clay 85
1085 1115 Saline Sand 31115 118 Clay 65118 120 Saline Sand 2
Aquifer Mapping and Management Plan of Faridkot District Punjab State
Page | 64
Nanak Nagri 120 128 Clay 8128 1296 Saline Sand 16
1296 130 Clay 04130 1316 Saline Sand 16
1316 135 Clay 34135 1368 Saline Sand 18
1368 165 Clay 282165 1676 Saline Sand 26
1676 184 Clay 164184 1868 Saline Sand 28
1868 1905 Clay 371905 1948 Saline Sand 431948 2134 Clay 186
Nangal
0 8 Clay 88 20 Fresh Sand 12
20 23 Clay 323 28 Fresh Sand 528 29 Clay 129 41 Fresh Sand 1241 72 Clay 3172 80 Fresh Sand 880 91 Clay 1191 124 Fresh Sand 33
124 151 Clay 27151 158 Fresh Sand 7158 163 Clay 5163 171 Fresh Sand 8171 181 Clay 10181 187 Fresh Sand 6187 193 Clay 6193 199 Fresh Sand 6199 203 Clay 4203 219 Fresh Sand 16219 224 Clay 5224 233 Saline Sand 9233 243 Clay 10243 249 Saline Sand 6249 251 Clay 2251 257 Saline Sand 6257 300 Clay 43
Tehna 0 8 Clay 8
Aquifer Mapping and Management Plan of Faridkot District Punjab State
Page | 65
Tehna
8 23 Fresh Sand 1523 28 Clay 528 32 Fresh Sand 432 37 Clay 537 41 Fresh Sand 441 59 Clay 1859 63 Fresh Sand 463 69 Clay 669 72 Fresh Sand 372 102 Clay 30
102 106 Fresh Sand 4106 120 Clay 14120 123 Fresh Sand 3123 133 Clay 10133 136 Fresh Sand 3136 145 Clay 9145 150 Fresh Sand 5150 158 Clay 8158 163 Fresh Sand 5163 168 Clay 5168 172 Fresh Sand 4172 176 Clay 4176 184 Fresh Sand 8184 210 Clay 26210 215 Fresh Sand 5215 221 Clay 6221 225 Fresh Sand 4225 254 Clay 29254 264 Fresh Sand 10264 267 Clay 3267 275 Fresh Sand 8275 294 Clay 19294 300 Fresh Sand 6
Wara Daraka
0 15 Clay 1515 22 Fresh Sand 722 28 Clay 628 48 Fresh Sand 2048 52 Clay 452 61 Fresh Sand 961 65 Clay 465 75 Fresh Sand 10
Aquifer Mapping and Management Plan of Faridkot District Punjab State
Page | 66
Wara Daraka
75 84 Clay 984 86 Saline Sand 286 91 Clay 591 97 Saline Sand 697 101 Clay 4
101 119 Saline Sand 18119 124 Clay 5124 129 Saline Sand 5129 150 Clay 21150 172 Saline Sand 22172 184 Clay 12184 188 Saline Sand 4188 196 Clay 8196 205 Saline Sand 9205 234 Clay 29234 239 Saline Sand 5239 274 Clay 35274 281 Saline Sand 7281 300 Clay 19
Aulakh
0 1829 Clay 18291829 4573 Fresh Sand 27444573 7621 Clay 30487621 9146 Fresh Sand 15259146 10975 Clay 1829
10975 1128 Saline Sand 3051128 13414 Clay 2134
13414 16768 Saline Sand 335416768 20112 Clay 334420112 21036 Saline Sand 92421036 21341 Clay 30521341 21951 Saline Sand 6121951 2256 Clay 6092256 245 Saline Sand 194245 300 Clay 55
Bhagthala
0 35 Clay 3535 1829 Fresh Sand 1479
1829 41 Clay 227141 53 Fresh Sand 1253 63 Clay 1063 8537 Saline Sand 2237
8537 92 Clay 663
Aquifer Mapping and Management Plan of Faridkot District Punjab State
Page | 67
92 102 Saline Sand 10102 1311 Clay 291
1311 13415 Saline Sand 30513415 16768 Clay 335316768 17073 Saline Sand 30517073 185 Clay 1427
185 203 Saline Sand 18203 22866 Clay 2566
22866 23476 Saline Sand 6123476 253 Clay 1824
253 273 Saline Sand 20273 280 Clay 7280 294 Saline Sand 14294 300 Clay 6
Sadhuwala
0 61 Fresh Sand 6161 3049 Clay 2439
3049 52 Saline Sand 215152 625 Clay 105
625 725 Saline Sand 10725 77 Clay 4577 84 Saline Sand 784 91 Clay 791 107 Saline Sand 16
107 110 Clay 3110 114 Saline Sand 4114 118 Clay 4118 130 Saline Sand 12130 14339 Clay 1339
14339 16463 Saline Sand 212416463 17683 Clay 12217683 207 Saline Sand 3017
207 2115 Clay 452115 2155 Saline Sand 42155 219 Clay 35219 235 Saline Sand 16235 237 Clay 2237 25624 Saline Sand 1924
25624 27134 Clay 15127134 300 Saline Sand 2866
Deviwala0 15 Clay 15
15 23 Fresh Sand 8
Aquifer Mapping and Management Plan of Faridkot District Punjab State
Page | 68
Deviwala
23 38 Clay 1538 46 Fresh Sand 846 48 Clay 248 53 Fresh Sand 553 61 Clay 861 65 Fresh Sand 465 72 Clay 772 78 Fresh Sand 678 94 Clay 1694 106 Fresh Sand 12
106 109 Clay 3109 112 Saline Sand 3112 128 Clay 16128 140 Saline Sand 12140 158 Clay 18158 163 Saline Sand 5163 179 Clay 16179 183 Saline Sand 4183 187 Clay 4187 196 Saline Sand 9196 202 Clay 6202 213 Saline Sand 11213 218 Clay 5218 223 Saline Sand 5223 252 Clay 29252 258 Saline Sand 6258 263 Clay 5263 269 Saline Sand 6
Dohak
0 8 Clay 88 10 Fresh Sand 2
10 21 Clay 1121 33 Saline Sand 1233 41 Clay 841 79 Saline Sand 3879 89 Clay 1089 95 Saline Sand 695 99 Clay 499 112 Saline Sand 13
112 116 Clay 4116 139 Saline Sand 23139 154 Clay 15
Aquifer Mapping and Management Plan of Faridkot District Punjab State
Page | 69
154 163 Saline Sand 9
Toot
0 15 Clay 1515 198 Fresh Sand 48
198 21 Clay 1221 474 Fresh Sand 264
474 51 Clay 3651 552 Fresh Sand 42
552 626 Clay 74626 766 Fresh Sand 14766 101 Clay 244101 104 Fresh Sand 3104 113 Clay 9113 116 Fresh Sand 3116 143 Clay 27143 146 Saline Sand 3146 167 Clay 21167 170 Saline Sand 3170 182 Clay 12182 204 Saline Sand 22204 214 Clay 10214 217 Saline Sand 3
Aquifer Mapping and Management Plan of Faridkot District Punjab State
Page | 70
Annexure-IVAQUIFER GROUPING OF WELL LOCATIONS IN FARIDKOT DISTRICT
Well location Depth from Depth to Aquifer Thickness FreshGranular
Zones
SalineGranular
Zones
Dal Singhwala
0 15 Unsaturated Zone 15 215 57 Aquifer Group-IA 42 3457 64 Aquiclude-IA 764 134 Aquifer Group-IB 70 51
134 157 Aquiclude-IB 23157 300 Multiple Aquifers 143 52
Dip Singh Wala
0 5 Unsaturated Zone 5 55 68 Aquifer Group-IA 63 35
68 755 Aquiclude-IA 75755 132 Aquifer Group-IB 565 14 31132 146 Aquiclude-IB 14146 300 Multiple Aquifers 154 755
Golewala
0 4 Unsaturated Zone 4 14 525 Aquifer Group-IA 485 33
525 60 Aquiclude-IA 7560 103 Aquifer Group-IB 43 38
103 155 Aquiclude-IB 52155 300 Multiple Aquifers 145 665
Jaito Mandi
0 14 Unsaturated Zone 14 114 59 Aquifer Group-IA 45 3759 80 Aquiclude-IA 2180 107 Aquifer Group-IB 27 155
107 1555 Aquiclude-IB 4851555 300 Multiple Aquifers 1445 16 515
Kot Kapura
0 9 Unsaturated Zone 9 29 77 Aquifer Group-IA 68 455
77 88 Aquiclude-IA 1188 106 Aquifer Group-IB 18 11 3
106 155 Aquiclude-IB 49155 300 Multiple Aquifers 145 68
Nanak Nagri
0 12 Unsaturated Zone 12 112 46 Aquifer Group-IA 34 18446 69 Aquiclude-IA 2369 131 Aquifer Group-IB 62 77 11
131 165 Aquiclude-IB 34165 2134 Multiple Aquifers 484 97
Nangal 0 9 Unsaturated Zone 9 1
Aquifer Mapping and Management Plan of Faridkot District Punjab State
Page | 71
Nangal
9 41 Aquifer Group-IA 32 2941 72 Aquiclude-IA 3172 124 Aquifer Group-IB 52 41
124 151 Aquiclude-IB 27151 300 Multiple Aquifers 149 43 21
Tehna
0 10 Unsaturated Zone 10 210 41 Aquifer Group-IA 31 18741 59 Aquiclude-IA 1859 106 Aquifer Group-IB 47 33
106 158 Aquiclude-IB 52158 300 Multiple Aquifers 142 50
Wara Daraka
0 4 Unsaturated Zone 4 04 75 Aquifer Group-IA 71 46
75 84 Aquiclude-IA 984 129 Aquifer Group-IB 45 31
129 150 Aquiclude-IB 21150 300 Multiple Aquifers 150 47
Aulakh
0 17 Unsaturated Zone 17 217 46 Aquifer Group-IA 29 2646 76 Aquiclude-IA 3076 113 Aquifer Group-IB 37 1525 305
113 134 Aquiclude-IB 21134 300 Multiple Aquifers 166 6828
Bhagthala
0 4 Unsaturated Zone 4 14 53 Aquifer Group-IA 49 24
53 63 Aquiclude-IA 1063 102 Aquifer Group-IB 39 3237
102 168 Aquiclude-IB 66168 300 Multiple Aquifers 132 6115
Sadhuwala
0 5 Unsaturated Zone 5 55 52 Aquifer Group-IA 47 2151
52 63 Aquiclude-IA 1163 130 Aquifer Group-IB 67 49
130 144 Aquiclude-IB 14144 300 Multiple Aquifers 156 11931
Deviwala
0 8 Unsaturated Zone 8 28 78 Aquifer Group-IA 70 31
78 94 Aquiclude-IA 1694 112 Aquifer Group-IB 18 12 3
112 128 Aquiclude-IB 16128 269 Multiple Aquifers 141 58
Aquifer Mapping and Management Plan of Faridkot District Punjab State
Page | 72
Dohak
0 3 Unsaturated Zone 3 03 79 Aquifer Group-IA 76 2 50
79 89 Aquiclude-IA 1089 139 Aquifer Group-IB 50 42
139 154 Aquiclude-IB 15154 163 Multiple Aquifers 9 9
Toot
0 9 Unsaturated Zone 9 19 55 Aquifer Group-IA 46 354
55 63 Aquiclude-IA 863 116 Aquifer Group-IB 53 25
116 143 Aquiclude-IB 27143 217 Multiple Aquifers 74 31
- कदरीय भमि जल बोरड
-
- जल ससाधन नदी विकास और गगा सरकषण मतरालय
- भारत सरकार
-
- contents naquim faridkotpdf (p1-5)
- Final Faridkot edited 170317pdf (p6-77)
-

Aquifer Mapping and Management Plan of Faridkot District Punjab State
Page | 72
Dohak
0 3 Unsaturated Zone 3 03 79 Aquifer Group-IA 76 2 50
79 89 Aquiclude-IA 1089 139 Aquifer Group-IB 50 42
139 154 Aquiclude-IB 15154 163 Multiple Aquifers 9 9
Toot
0 9 Unsaturated Zone 9 19 55 Aquifer Group-IA 46 354
55 63 Aquiclude-IA 863 116 Aquifer Group-IB 53 25
116 143 Aquiclude-IB 27143 217 Multiple Aquifers 74 31
- कदरीय भमि जल बोरड
-
- जल ससाधन नदी विकास और गगा सरकषण मतरालय
- भारत सरकार
-
- contents naquim faridkotpdf (p1-5)
- Final Faridkot edited 170317pdf (p6-77)
-

- कदरीय भमि जल बोरड
-
- जल ससाधन नदी विकास और गगा सरकषण मतरालय
- भारत सरकार
-
- contents naquim faridkotpdf (p1-5)
- Final Faridkot edited 170317pdf (p6-77)
-