far eastern new century
TRANSCRIPT

IR publication – Mar 2020
Far Eastern New Century(TWSE: 1402)

1
About FENC
Far Eastern New Century (“FENC”) is a publicly traded company (http://www.fenc.com/?lang=en) in Taiwan with a market
capitalization of approximately US$5 billion. It’s a constituent of the MSCI ESG Leaders Indexes and FTSE4Good
Emerging Index. FENC is also the flagship company of Far Eastern Group and has diversified businesses ranging from
production business, to property development and investments. The production business spans the petrochemical,
polyester, and textiles businesses.
Regarding its production business, FENC aims to expand its green material business by increasing its scale of recycled
products. After expanding its capacities in Taiwan, Japan and the United States, FENC has become one of the world’s
largest post-consumer recycled polyester producers. With high quality and speed to market, FENC’s products have been
accepted and adopted by well-known global brands including Coca-Cola, Nike and Adidas.
FENC is a global top-three PET producer in terms of capacity and the leading PET producer in Asia. The Company
remains agile and flexible in business operations, maintaining its ability to expand and thrive in the global landscape. The
production sites of FENC, located in Taiwan, the United States, Vietnam, China, Japan and Southeast Asia, have been
vertically integrated into a streamlined system from production to sale. FENC’s strategy is to strengthen its position as a
leading polyester producer by maintaining long-term client partnerships, upgrading its product mix and enhancing research
and development capabilities.
Currently FENC has total investment properties of 200,000 pings (662,000 square meters) in Taiwan, the majority of which
are located in prime areas of northern Taiwan. The Taipei Far Eastern Telecom Park (Tpark) project in Banqiao, New
Taipei City is one of FENC’s development priorities.
The majority of the Company’s investment portfolio is listed companies on the Taiwan Stock Exchange with proven track
records, including Asia Cement Co., Far EasTone Telecommunications Co., Far Eastern International Bank, Oriental Union
Chemical Co., Far Eastern Department Stores Limited, and Everest Textile Co. Limited, thus providing the Company
consistent dividend and investment income each year.

2
• Company Highlights
• Company Overview
• Strategic Summary
– Production business strategy
– Property development plan
– Dividend policy
– CAPEX
• Financials
• Recent Achievements & CSR
Table of Contents

3
• A constituent of the MSCI ESG Leaders Indexes, FTSE4Good Emerging Index & TWSE CG 100 Index
• Consistent Dividends Payout (refer to page 19)
• Management Efforts on the Production Business (refer to page 7-13)
• With a fully integrated polyester value chain, the combined operating margin of the Production Business turned a loss of
NT$ -2.2 bn in 2012 to a profit of NT$ 3.6 bn in 1-3Q, 2019. The turnaround in operating margin is attributable to:
− Long term client partnerships and a better product mix.
− R&D efforts: The Taiwan in-house R&D center cooperates with well-known brand clients to customize specialty products.
− From an Asian to a global producer: FENC grew via organic growth or acquisitions in order to better service existing
clients locally, such as Coca Cola, Nike, Columbia, and avoid antidumping duties imposed across borders. (refer to page 8)
− Asia’s largest recycled PET (R-PET) producer: R-PET capacity expansion in Taiwan, Japan and U.S. to meet strong
demand from the brands green missions.(refer to page 10)
• Investment Properties (refer to page 14-18)
• Investments & Others (refer to page 6)
Company Highlights
Percentage of combined revenues of Polyester &
Textiles Businesses from green products
27% 28% 29%
billion billion billion
NT$ NT$ NT$
4
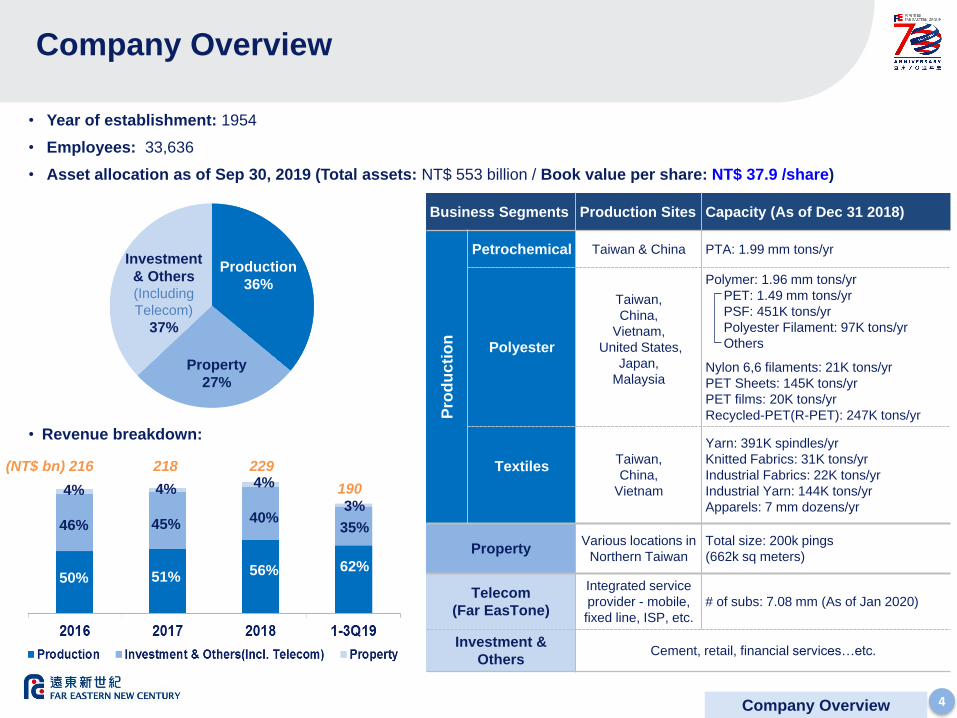
• Year of establishment: 1954
• Employees: 33,636
• Asset allocation as of Sep 30, 2019 (Total assets: NT$ 553 billion / Book value per share: NT$ 37.9 /share)
Business Segments Production Sites Capacity (As of Dec 31 2018)
Pro
du
cti
on
Petrochemical Taiwan & China PTA: 1.99 mm tons/yr
Polyester
Taiwan,
China,
Vietnam,
United States,
Japan,
Malaysia
Polymer: 1.96 mm tons/yr
PET: 1.49 mm tons/yr
PSF: 451K tons/yr
Polyester Filament: 97K tons/yr
Others
Nylon 6,6 filaments: 21K tons/yr
PET Sheets: 145K tons/yr
PET films: 20K tons/yr
Recycled-PET(R-PET): 247K tons/yr
TextilesTaiwan,
China,
Vietnam
Yarn: 391K spindles/yr
Knitted Fabrics: 31K tons/yr
Industrial Fabrics: 22K tons/yr
Industrial Yarn: 144K tons/yr
Apparels: 7 mm dozens/yr
PropertyVarious locations in
Northern Taiwan
Total size: 200k pings
(662k sq meters)
Telecom
(Far EasTone)
Integrated service
provider - mobile,
fixed line, ISP, etc.
# of subs: 7.08 mm (As of Jan 2020)
Investment &
OthersCement, retail, financial services…etc.
Company Overview
Company Overview
• Revenue breakdown:
Production
36%
Property
27%
Investment
& Others(Including
Telecom)
37%
4%
46%
50%
4%
45%
51%
4%
40%
56%
3%
35%
62%
(NT$ bn) 216 218 229
190
5
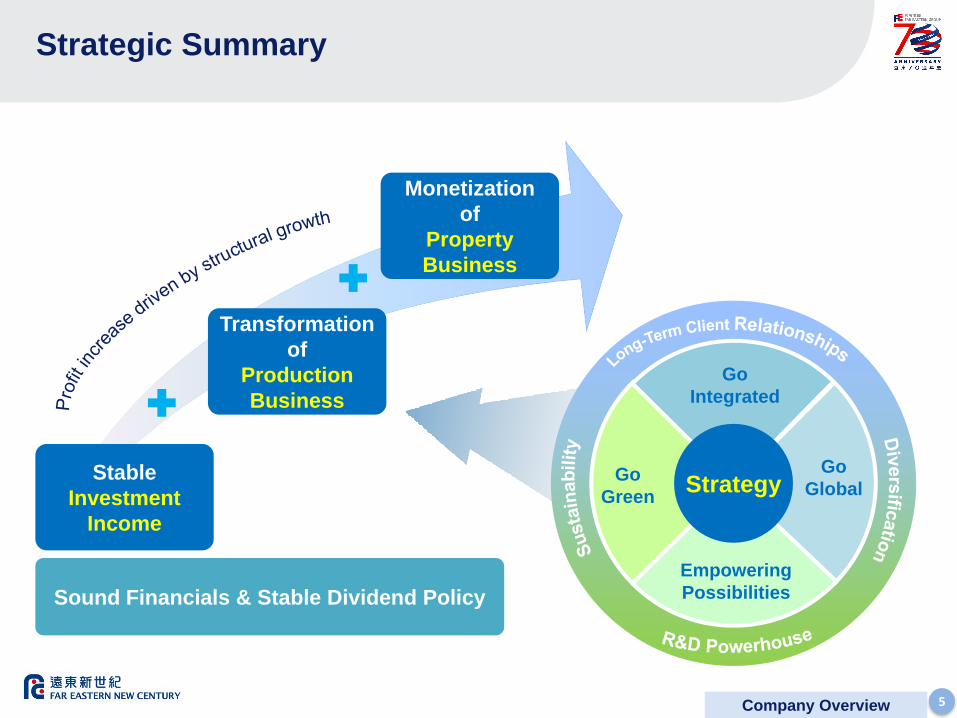
Strategic Summary
Stable
Investment
Income
Transformation
of
Production
Business
Monetization
of
Property
Business
Sound Financials & Stable Dividend Policy
Company Overview
StrategyGo
Green
Go
Global
Go
Integrated
Empowering
Possibilities
6
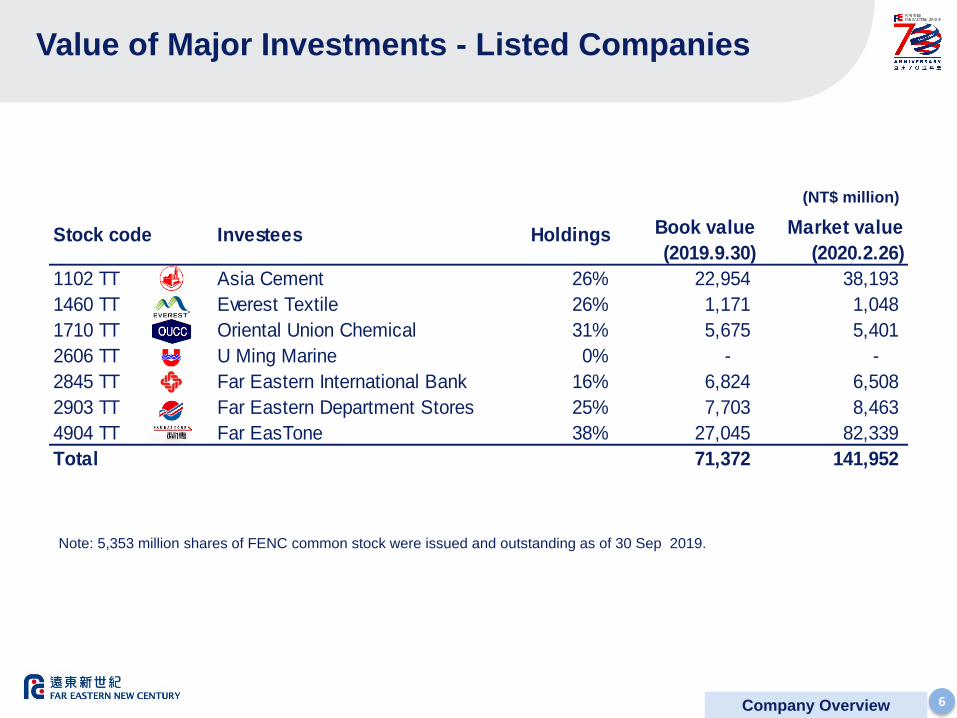
Value of Major Investments - Listed Companies
(NT$ million)
Note: 5,353 million shares of FENC common stock were issued and outstanding as of 30 Sep 2019.
Company Overview
Stock code Investees Holdings Book value
(2019.9.30)
Market value
(2020.2.26)
1102 TT Asia Cement 26% 22,954 38,193
1460 TT Everest Textile 26% 1,171 1,048
1710 TT Oriental Union Chemical 31% 5,675 5,401
2606 TT U Ming Marine 0% - -
2845 TT Far Eastern International Bank 16% 6,824 6,508
2903 TT Far Eastern Department Stores 25% 7,703 8,463
4904 TT Far EasTone 38% 27,045 82,339
Total 71,372 141,952
7
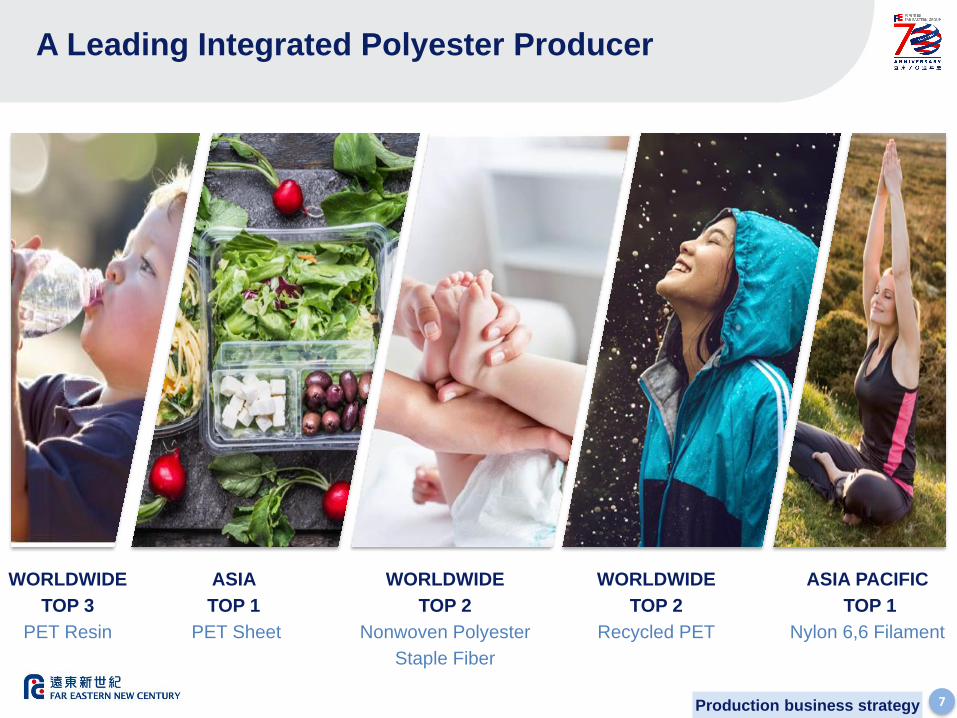
A Leading Integrated Polyester Producer
WORLDWIDE
TOP 2
Recycled PET
ASIA PACIFIC
TOP 1
Nylon 6,6 Filament
WORLDWIDE
TOP 3
PET Resin
ASIA
TOP 1
PET Sheet
WORLDWIDE
TOP 2
Nonwoven Polyester
Staple Fiber
Production business strategy

8Polyester Staple Fiber(PSF) High Tenacity Polyester Yarn (HTY)
Go Global: From An Asian to A Global Producer
(Note) :The CCP JV project with Alpek & Indorama, annual planned capacity of PET 1.1 MM & PTA 1.3 MM tons, is currently under
construction. Each party has the right to off-take one-third of the capacity and to source its feedstock independently.
PET
PSF (Trial run)
Fabric
Apparel
Vietnam3
R-PET
Japan
PET
Malaysia
5
6
Via M&A(Note)
PET (2018)
CCP JV (2018)
R-PET (2019)
U.S.4
• Globalization of the de-globalization era: production site diversification and flexible sales & distribution
to mitigate the effects of trade barriers.
Production business strategy
PTA / PET
PSF HTY
Filament / Fabric
R-PET
Taiwan 1
PTA / PET
PSF HTY
Filament / Fabric
Apparel
China2
2
3
44
Exports5
6
1
• FENC’s production sites are in Taiwan, China, Vietnam, United States, Japan and Malaysia.
9
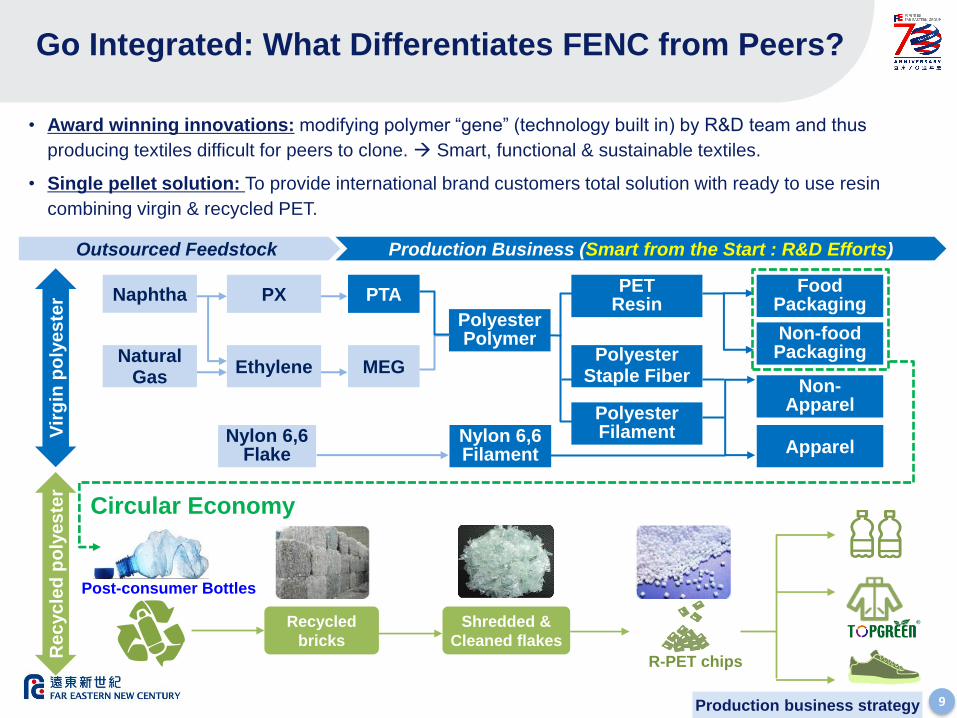
• Award winning innovations: modifying polymer “gene” (technology built in) by R&D team and thus
producing textiles difficult for peers to clone. Smart, functional & sustainable textiles.
• Single pellet solution: To provide international brand customers total solution with ready to use resin
combining virgin & recycled PET.
Production business strategy
Recycled
bricks
R-PET chips
Shredded &
Cleaned flakes
Post-consumer Bottles
Production Business (Smart from the Start : R&D Efforts)Outsourced Feedstock
Natural Gas
FoodPackaging
Non-foodPackaging
Apparel
PTA
MEG
PX
Ethylene
Naphtha
PolyesterStaple Fiber
Non-ApparelPolyester
Filament
PETResin
PolyesterPolymer
Nylon 6,6Filament
Nylon 6,6 Flake
Circular Economy
Vir
gin
po
lyes
ter
Rec
ycle
d p
oly
es
ter
Go Integrated: What Differentiates FENC from Peers?
10
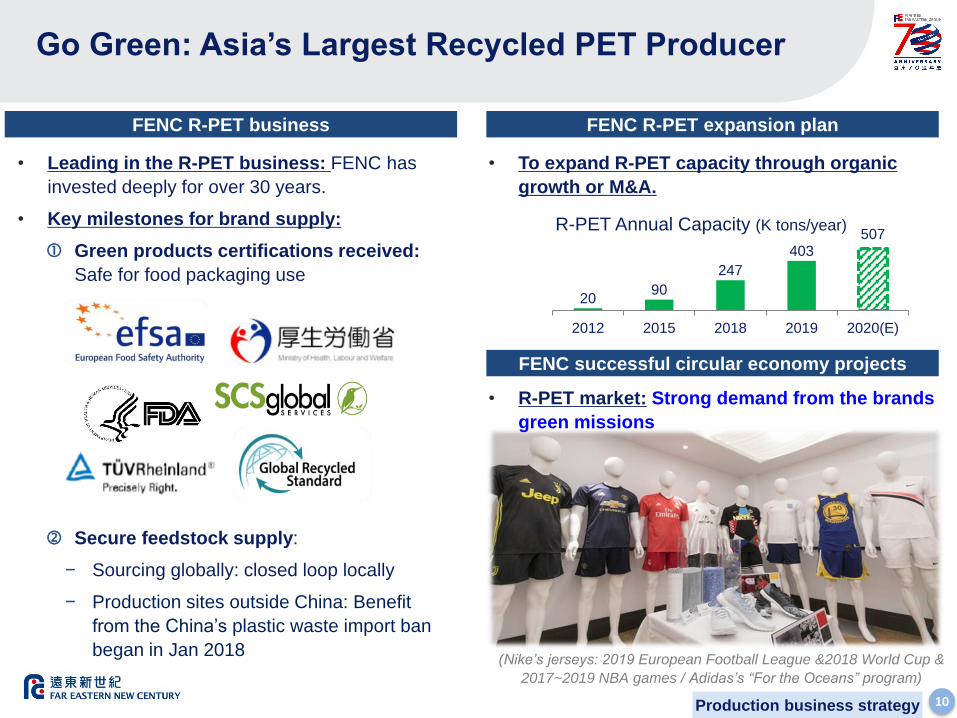
Go Green: Asia’s Largest Recycled PET Producer
FENC R-PET expansion plan
2090
247
403507
2012 2015 2018 2019 2020(E)
R-PET Annual Capacity (K tons/year)
FENC R-PET business
• Leading in the R-PET business: FENC has
invested deeply for over 30 years.
• Key milestones for brand supply:
Green products certifications received:
Safe for food packaging use
Secure feedstock supply:
− Sourcing globally: closed loop locally
− Production sites outside China: Benefit
from the China’s plastic waste import ban
began in Jan 2018
• R-PET market: Strong demand from the brands
green missions
FENC successful circular economy projects
• To expand R-PET capacity through organic
growth or M&A.
(Nike’s jerseys: 2019 European Football League &2018 World Cup &
2017~2019 NBA games / Adidas’s “For the Oceans” program)
Production business strategy
11
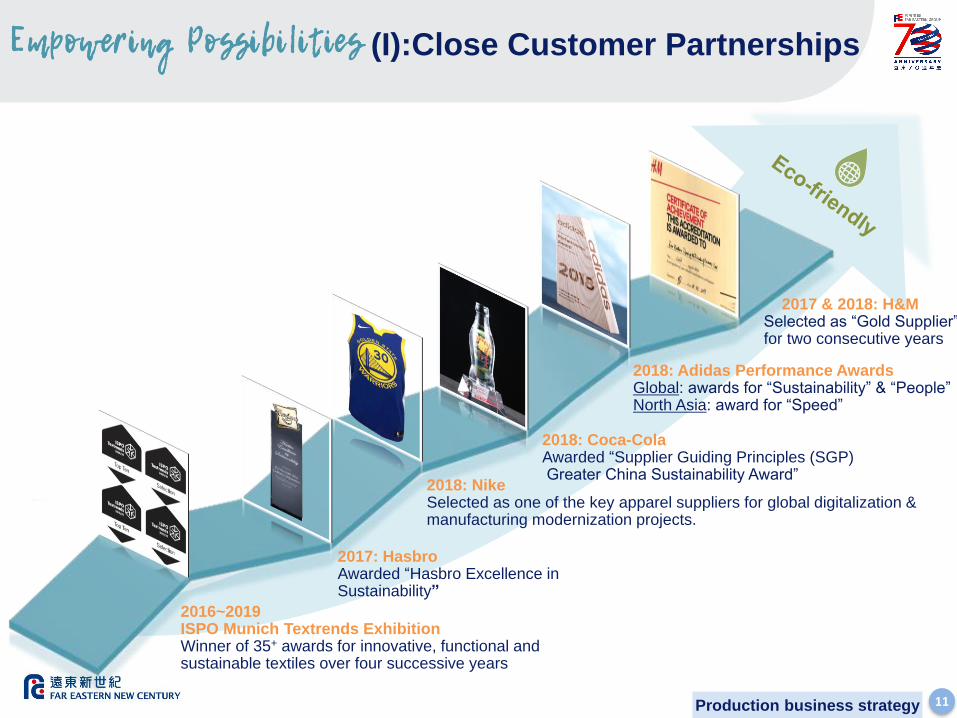
(I):Close Customer Partnerships
Production business strategy
2016~2019 ISPO Munich Textrends Exhibition Winner of 35+ awards for innovative, functional and sustainable textiles over four successive years
2017: HasbroAwarded “Hasbro Excellence in Sustainability”
2018: NikeSelected as one of the key apparel suppliers for global digitalization & manufacturing modernization projects.
2018: Coca-ColaAwarded “Supplier Guiding Principles (SGP)Greater China Sustainability Award”
2018: Adidas Performance AwardsGlobal: awards for “Sustainability” & “People” North Asia: award for “Speed”
2017 & 2018: H&M Selected as “Gold Supplier” for two consecutive years
12
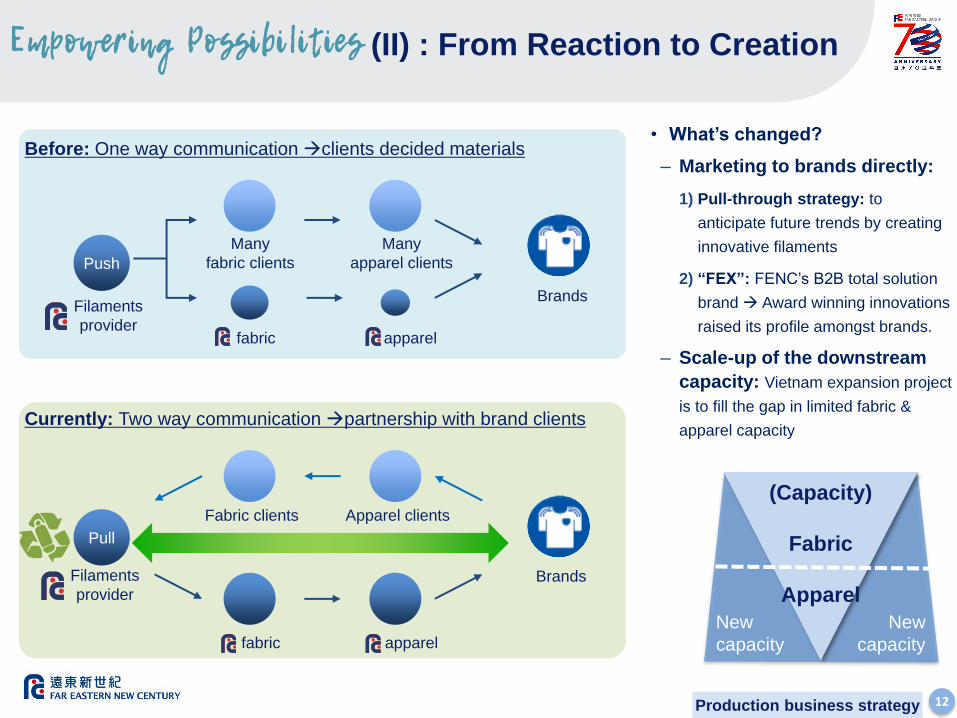
Fabric clients Apparel clients
BrandsFilaments
provider
fabric apparel
Pull
Currently: Two way communication partnership with brand clients
(II) : From Reaction to Creation
• What’s changed?
– Marketing to brands directly:
1) Pull-through strategy: to
anticipate future trends by creating
innovative filaments
2) “FEX”: FENC’s B2B total solution
brand Award winning innovations
raised its profile amongst brands.
– Scale-up of the downstream
capacity: Vietnam expansion project
is to fill the gap in limited fabric &
apparel capacity
Filaments
provider
Many
fabric clients
fabric
Many
apparel clients
apparel
Brands
Before: One way communication clients decided materials
Push
Production business strategy
(Capacity)
Fabric
Apparel
New
capacity
New
capacity

13
Invest in the Future: Post Consumer Textile Recycling
~ 30% of the
polyester
output
~ 70% of the
polyester
output
Commercial Run From Lab to Trial Run
• FENC® TopGreen® rTex is a world’s first that will be able to recycle the polyester from all types
of post-consumer textiles, including mixed streams.
Note: Video introduction please refer to https://www.youtube.com/watch?v=6rs5Eb2uKN8
Production business strategy
14
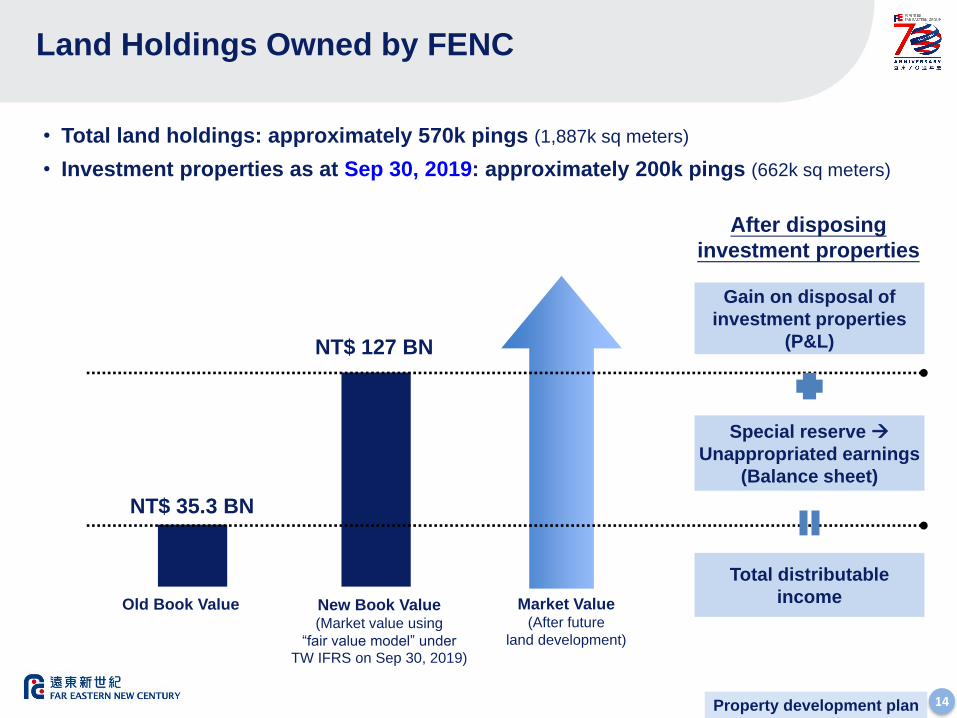
New Book Value(Market value using
“fair value model” under
TW IFRS on Sep 30, 2019)
• Total land holdings: approximately 570k pings (1,887k sq meters)
• Investment properties as at Sep 30, 2019: approximately 200k pings (662k sq meters)
Land Holdings Owned by FENC
NT$ 35.3 BN
NT$ 127 BN
Old Book Value Market Value(After future
land development)
Property development plan
After disposing
investment properties
Gain on disposal of
investment properties
(P&L)
Special reserve
Unappropriated earnings
(Balance sheet)
Total distributable
income

15
BanqiaoSize: 82,967 pings (274,621 sq meters)
Book value: 60~65% of investment properties
Investment Properties – Major Pieces of Land
a) Land holdings in Taipei City include self-use and investment properties
b) 1 ping = 3.31 sq m = 35.58 sq ft
Taipei City (Note a)
Size: 1,651 pings (5,465 sq meters)
Yilan (SPA resort)Size: 30,694 pings (101,597 sq meters)
Phase I plan: villa concept, around 200 rooms
HualienSize: 9,446 pings (31,266 sq meters)
OthersSize: 11,476 pings (37,986 sq meters)
Property development plan
Taishan & WuguSize: 16,250 pings (53,788 sq meters)
Tau Yuan CitySize: 38,407 pings (127,127 sq meters)
16
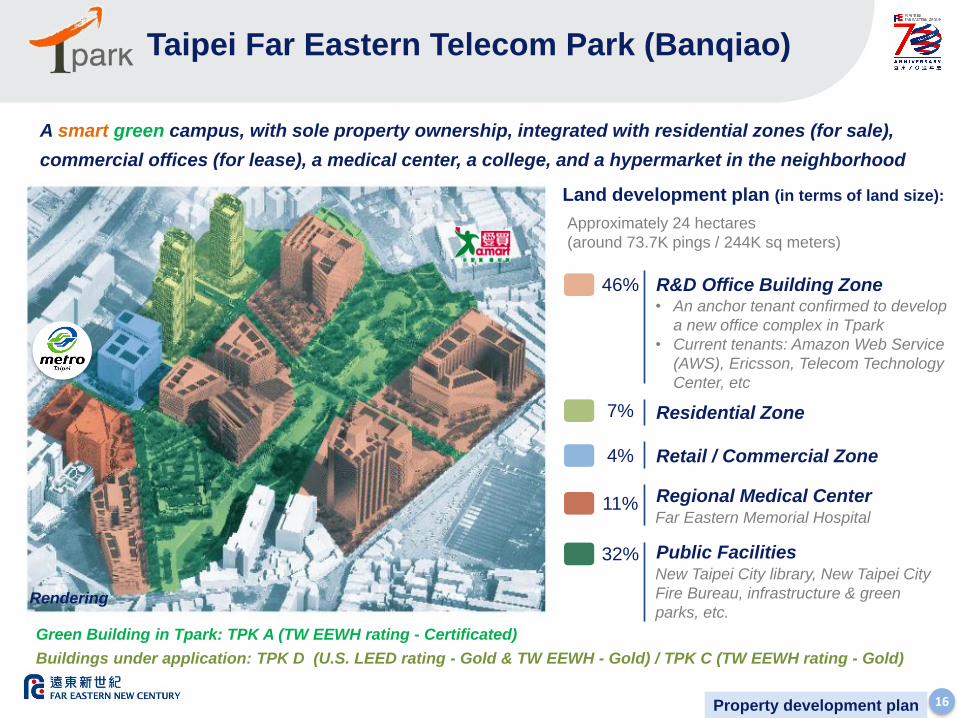
A smart green campus, with sole property ownership, integrated with residential zones (for sale),
commercial offices (for lease), a medical center, a college, and a hypermarket in the neighborhood
Taipei Far Eastern Telecom Park (Banqiao)
Property development plan
New Taipei City library, New Taipei City
Fire Bureau, infrastructure & green
parks, etc.
R&D Office Building Zone• An anchor tenant confirmed to develop
a new office complex in Tpark
• Current tenants: Amazon Web Service
(AWS), Ericsson, Telecom Technology
Center, etc
Approximately 24 hectares
(around 73.7K pings / 244K sq meters)
7%
4%
11%
46%
Residential Zone
Retail / Commercial Zone
Regional Medical Center
Public Facilities
Land development plan (in terms of land size):
32%
Far Eastern Memorial Hospital
Rendering
Green Building in Tpark: TPK A (TW EEWH rating - Certificated)
Buildings under application: TPK D (U.S. LEED rating - Gold & TW EEWH - Gold) / TPK C (TW EEWH rating - Gold)
17
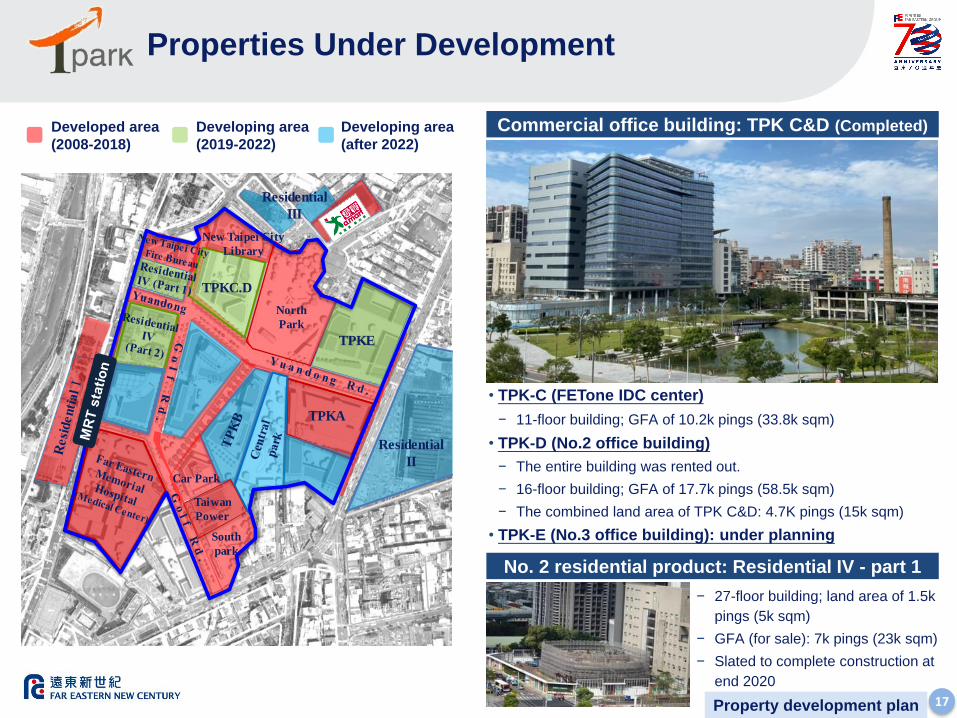
Properties Under Development
Developed Area Developing Area (2019-2021) Developing Area (2021~)
Car Park
South
park
TPKC.D
North
Park
New Taipei City
Library
Residential
III
TPKA
Residential
II
Taiwan
Power
TPKE
Developed area
(2008-2018)
Developing area
(2019-2022)
Developing area
(after 2022)
• TPK-C (FETone IDC center)
− 11-floor building; GFA of 10.2k pings (33.8k sqm)
• TPK-D (No.2 office building)
− The entire building was rented out.
− 16-floor building; GFA of 17.7k pings (58.5k sqm)
− The combined land area of TPK C&D: 4.7K pings (15k sqm)
• TPK-E (No.3 office building): under planning
Commercial office building: TPK C&D (Completed)
− 27-floor building; land area of 1.5k
pings (5k sqm)
− GFA (for sale): 7k pings (23k sqm)
− Slated to complete construction at
end 2020
No. 2 residential product: Residential IV - part 1
Property development plan
18
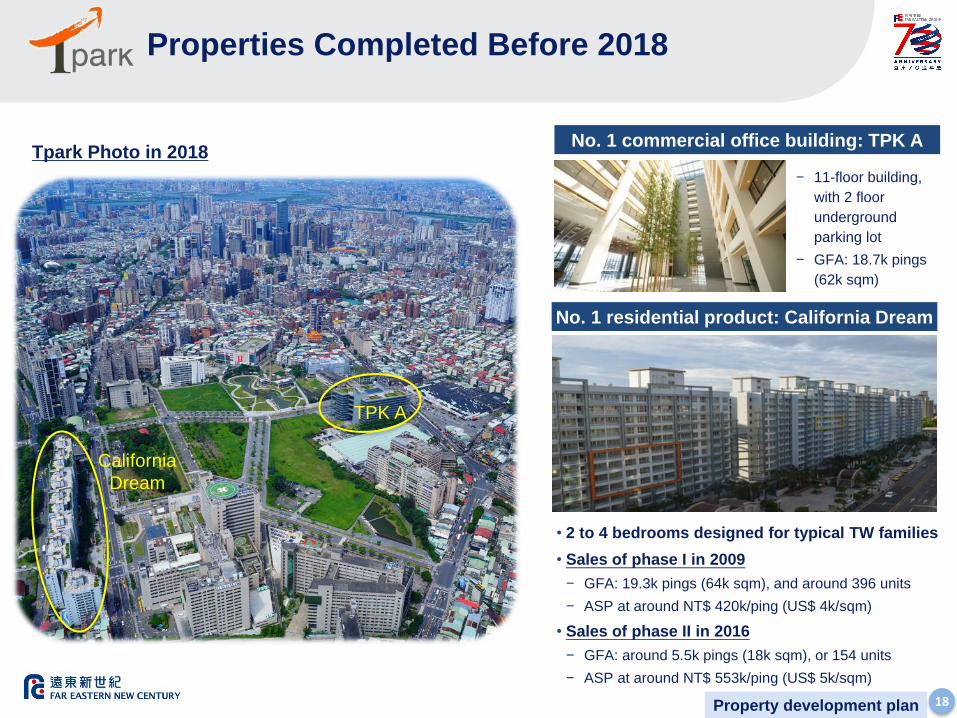
Properties Completed Before 2018
TPK A
California
Dream
Tpark Photo in 2018
• 2 to 4 bedrooms designed for typical TW families
• Sales of phase I in 2009
− GFA: 19.3k pings (64k sqm), and around 396 units
− ASP at around NT$ 420k/ping (US$ 4k/sqm)
• Sales of phase II in 2016
− GFA: around 5.5k pings (18k sqm), or 154 units
− ASP at around NT$ 553k/ping (US$ 5k/sqm)
No. 1 residential product: California Dream
− 11-floor building,
with 2 floor
underground
parking lot
− GFA: 18.7k pings
(62k sqm)
No. 1 commercial office building: TPK A
Property development plan

19
Dividends Payout History
Dividend policy
20
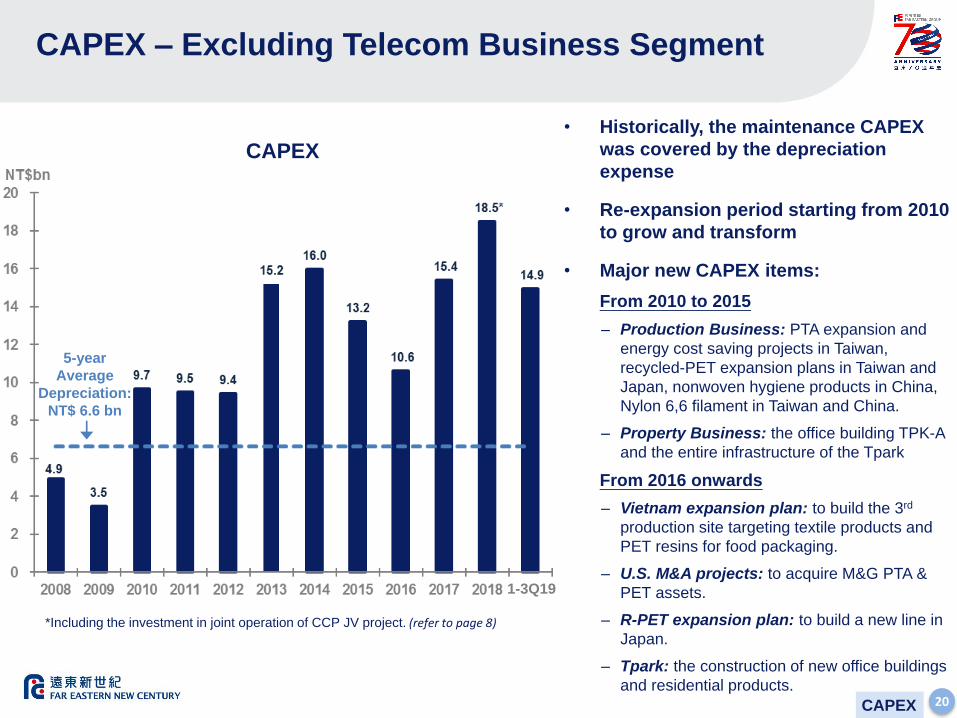
1-3Q19
• Historically, the maintenance CAPEX
was covered by the depreciation
expense
• Re-expansion period starting from 2010
to grow and transform
• Major new CAPEX items:
From 2010 to 2015
– Production Business: PTA expansion and
energy cost saving projects in Taiwan,
recycled-PET expansion plans in Taiwan and
Japan, nonwoven hygiene products in China,
Nylon 6,6 filament in Taiwan and China.
– Property Business: the office building TPK-A
and the entire infrastructure of the Tpark
From 2016 onwards
– Vietnam expansion plan: to build the 3rd
production site targeting textile products and
PET resins for food packaging.
– U.S. M&A projects: to acquire M&G PTA &
PET assets.
– R-PET expansion plan: to build a new line in
Japan.
– Tpark: the construction of new office buildings
and residential products.
CAPEX – Excluding Telecom Business Segment
CAPEX
5-year
Average
Depreciation:
NT$ 6.6 bn
CAPEX
*Including the investment in joint operation of CCP JV project. (refer to page 8)
21
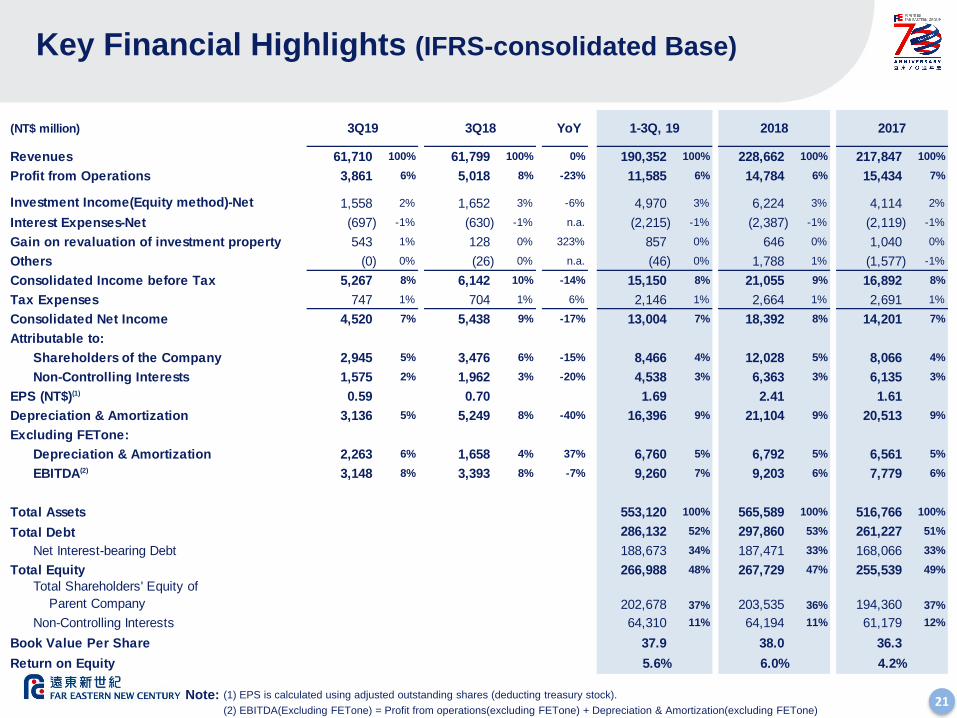
Key Financial Highlights (IFRS-consolidated Base)
(1) EPS is calculated using adjusted outstanding shares (deducting treasury stock). Note:(2) EBITDA(Excluding FETone) = Profit from operations(excluding FETone) + Depreciation & Amortization(excluding FETone)
(NT$ million) YoY
Revenues 61,710 100% 61,799 100% 0% 190,352 100% 228,662 100% 217,847 100%
Profit from Operations 3,861 6% 5,018 8% -23% 11,585 6% 14,784 6% 15,434 7%
1,558 2% 1,652 3% -6% 4,970 3% 6,224 3% 4,114 2%
Interest Expenses-Net (697) -1% (630) -1% n.a. (2,215) -1% (2,387) -1% (2,119) -1%
Gain on revaluation of investment property 543 1% 128 0% 323% 857 0% 646 0% 1,040 0%
Others (0) 0% (26) 0% n.a. (46) 0% 1,788 1% (1,577) -1%
Consolidated Income before Tax 5,267 8% 6,142 10% -14% 15,150 8% 21,055 9% 16,892 8%
Tax Expenses 747 1% 704 1% 6% 2,146 1% 2,664 1% 2,691 1%
Consolidated Net Income 4,520 7% 5,438 9% -17% 13,004 7% 18,392 8% 14,201 7%
Attributable to:
Shareholders of the Company 2,945 5% 3,476 6% -15% 8,466 4% 12,028 5% 8,066 4%
Non-Controlling Interests 1,575 2% 1,962 3% -20% 4,538 3% 6,363 3% 6,135 3%
EPS (NT$)(1) 0.59 0.70 1.69 2.41 1.61
Depreciation & Amortization 3,136 5% 5,249 8% -40% 16,396 9% 21,104 9% 20,513 9%
Excluding FETone:
Depreciation & Amortization 2,263 6% 1,658 4% 37% 6,760 5% 6,792 5% 6,561 5%
EBITDA(2) 3,148 8% 3,393 8% -7% 9,260 7% 9,203 6% 7,779 6%
Total Assets 553,120 100% 565,589 100% 516,766 100%
Total Debt 286,132 52% 297,860 53% 261,227 51%
Net Interest-bearing Debt 188,673 34% 187,471 33% 168,066 33%
Total Equity 266,988 48% 267,729 47% 255,539 49%
202,678 37% 203,535 36% 194,360 37%
Non-Controlling Interests 64,310 11% 64,194 11% 61,179 12%
Book Value Per Share 37.9 38.0 36.3
Return on Equity 5.6% 6.0% 4.2%
2017
Investment Income(Equity method)-Net
Total Shareholders' Equity of
Parent Company
3Q19 3Q18 1-3Q, 19 2018
22
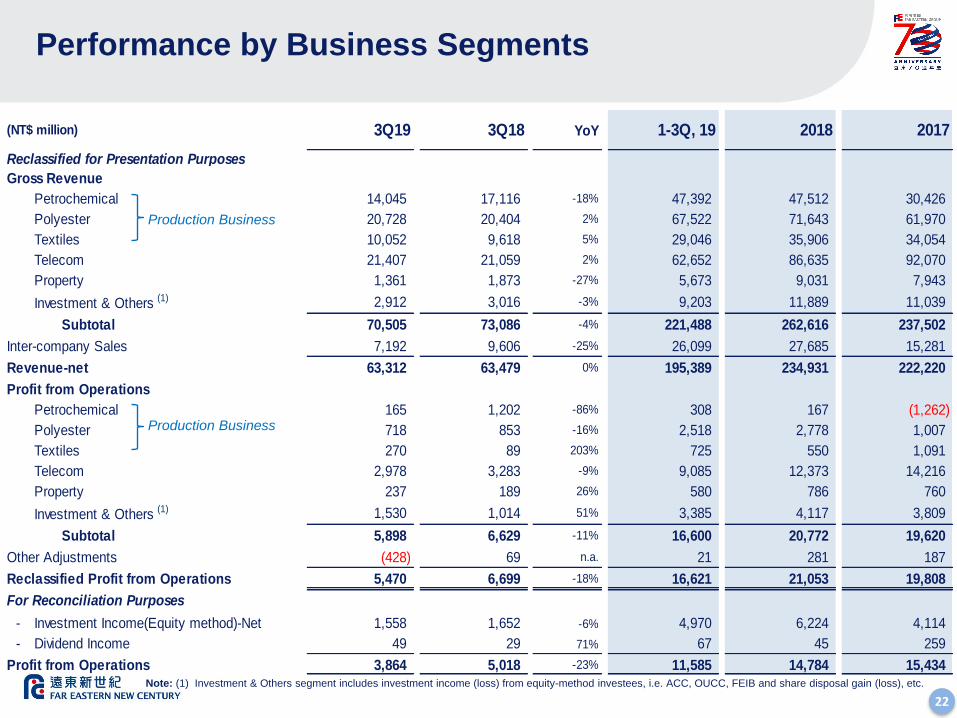
Performance by Business Segments
Production Business
Production Business
Note: (1) Investment & Others segment includes investment income (loss) from equity-method investees, i.e. ACC, OUCC, FEIB and share disposal gain (loss), etc.
(NT$ million) 3Q19 3Q18 YoY 1-3Q, 19 2018 2017
Reclassified for Presentation Purposes
Gross Revenue
Petrochemical 14,045 17,116 -18% 47,392 47,512 30,426
Polyester 20,728 20,404 2% 67,522 71,643 61,970
Textiles 10,052 9,618 5% 29,046 35,906 34,054
Telecom 21,407 21,059 2% 62,652 86,635 92,070
Property 1,361 1,873 -27% 5,673 9,031 7,943
Investment & Others (1) 2,912 3,016 -3% 9,203 11,889 11,039
Subtotal 70,505 73,086 -4% 221,488 262,616 237,502
Inter-company Sales 7,192 9,606 -25% 26,099 27,685 15,281
Revenue-net 63,312 63,479 0% 195,389 234,931 222,220
Profit from Operations
Petrochemical 165 1,202 -86% 308 167 (1,262)
Polyester 718 853 -16% 2,518 2,778 1,007
Textiles 270 89 203% 725 550 1,091
Telecom 2,978 3,283 -9% 9,085 12,373 14,216
Property 237 189 26% 580 786 760
Investment & Others (1) 1,530 1,014 51% 3,385 4,117 3,809
Subtotal 5,898 6,629 -11% 16,600 20,772 19,620
Other Adjustments (428) 69 n.a. 21 281 187
Reclassified Profit from Operations 5,470 6,699 -18% 16,621 21,053 19,808
For Reconciliation Purposes
- 1,558 1,652 -6% 4,970 6,224 4,114
- Dividend Income 49 29 71% 67 45 259
Profit from Operations 3,864 5,018 -23% 11,585 14,784 15,434
Investment Income(Equity method)-Net
23
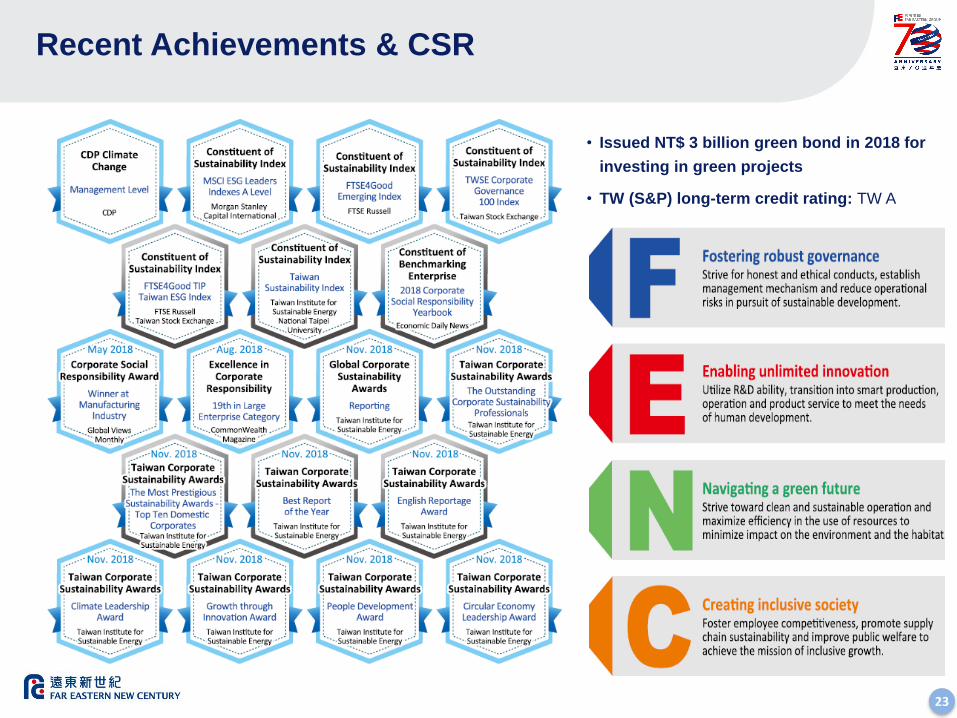
Recent Achievements & CSR
• Issued NT$ 3 billion green bond in 2018 for
investing in green projects
• TW (S&P) long-term credit rating: TW A
24
For further information, please contact
IR Team, Finance Department
IR email box: [email protected]
Company website: www.fenc.com
Can also be reached as follows,
Carol Wang (886) 2 2733-8000 ext.8537; [email protected]
Chialing Chao (886) 2 2733-8000 ext.8470; [email protected]
Jarvis Liu (886) 2 2733-8000 ext.8492; [email protected]
Q&A

25
This presentation is prepared by Far Eastern New Century Corporation (the “Company”) and
is solely for the purpose of corporate communication and general reference only. The
presentation is not intended as an offer to sell, or to solicit an offer to buy or form any basis of
investment decision for any class of securities of the Company in any jurisdiction. All such
information should not be used or relied on without professional advice. The presentation is a
brief summary in nature and does not purport to be a complete description of the Company,
its business, its current or historical operating results or its future prospects.
This presentation is provided without any warranty or representation of any kind, either
expressed or implied. The Company specifically disclaims all responsibilities in respect of any
use or reliance of any information, whether financial or otherwise, contained in this
presentation. Neither this presentation nor any of its contents may be reproduced to a third
party without the prior written consent of the Company.
Disclaimer