falsework cap and sill beams - bureau of transportation
TRANSCRIPT
Investigation of Flange Failures in Falsework Cap and Sill Beams Recommendations for the Design of Beams and Posts in Bridge Falsework Final Report
Report CA06-0629 December 2008
Division of Research & Innovation

Investigation of Flange Failures in Falsework Cap and Sill Beams Recommendations for the Design of Beams and Posts in Bridge Falsework
Final Report
Report No. CA06-0629
December 2008
Prepared By:
Department of Civil & Environmental Engineering
University of Nevada Reno, NV 89557
Prepared For:
California Department of Transportation Engineering Services Center
1801 30th Street Sacramento, CA 95816
California Department of Transportation Division of Research and Innovation, MS-83
1227 O Street Sacramento, CA 95814
DISCLAIMER STATEMENT
This document is disseminated in the interest of information exchange. The contents of this report reflect the views of the authors who are responsible for the facts and accuracy of the data presented herein. The contents do not necessarily reflect the official views or policies of the State of California or the Federal Highway Administration. This publication does not constitute a standard, specification or regulation. This report does not constitute an endorsement by the Department of any product described herein.

STATE OF CALIFORNIA DEPARTMENT OF TRANSPORTATION TECHNICAL REPORT DOCUMENTATION PAGE TR0003 (REV. 10/98)
1. REPORT NUMBER
CA06-0629
2. GOVERNMENT ASSOCIATION NUMBER
3. RECIPIENT’S CATALOG NUMBER
4. TITLE AND SUBTITLE Investigation of Flange Failures in Falsework Cap and Sill Beams: Recommendations for the Design of Beams and Posts in Bridge Falsework.
5. REPORT DATE
December, 2008 6. PERFORMING ORGANIZATION CODE
7. AUTHOR(S) Lyle Carden, Ahmad Itani, Gokhan Pekcan
8. PERFORMING ORGANIZATION REPORT NO.
UNR / CCEER 05-11
9. PERFORMING ORGANIZATION NAME AND ADDRESS
Department of Civil & Environmental Engineering University of Nevada Reno, NV 89557-0152
10. WORK UNIT NUMBER
11. CONTRACT OR GRANT NUMBER
DRI Research Task No. 0629 Contract No. 59A0445
12. SPONSORING AGENCY AND ADDRESS
California Department of Transportation Engineering Services Center 1801 30th Street Sacramento, CA 95816 California Department of Transportation Division of Research and Innovation, MS-83 1227 O Street Sacramento, CA 95814
13. TYPE OF REPORT AND PERIOD COVERED
Final Report
14. SPONSORING AGENCY CODE
913
15. SUPPLEMENTAL NOTES
This report may also be referenced as report UNR / CCEER 05-11 published by the University of Nevada, Reno.
16. ABSTRACT
Recent field observations in bridge falsework identified potential deficiencies in the design of falsework resulting in localized bending in sill and cap beam flanges and lateral buckling in other beams. Possible limits states associated with the bearing of timber and steel posts on cap and sill beams are investigated in this report. The critical limit states are related to flange bending, post crushing or yielding, web yielding, web crippling, lateral web buckling and corbel crushing. Different methods are investigated for predicting the capacity of the flange. The first assumes a uniform stress distribution resulting in bending of the flange. This is adequate for timber posts, but not as accurate at the second more elaborate method which accounts for an interaction between flange bending and post compression strength, found to be effective for timber posts. The third method uses an effective bearing area of the post, which is more effective with steel posts. For beams with relatively thick webs, such as those typically used in bridge falsework, the web was found to have a greater capacity than the flange and posts. The critical web limit state was web yielding (referred to as web crippling in the Caltrans Falsework manual) with variations of existing equations found to be appropriate for predicting the capacity. Web crippling (as defined by ASCE) is found to generally not govern the design, particularly when two sill beams are stacked on top of each other. Blocking may be used to increase the flange bending and web yielding capacity, although lateral bracing or stiffeners are recommended to increase lateral buckling capacity. Design equations are presented in allowable stress design format for the consideration of the critical limit states in a falsework bent. These are compared to current Caltrans design practice and other relevant specifications. Two design examples are also provided to demonstrate the application of these equations, one using timber posts and a second using steel posts. .
17. KEY WORDS
Bridge Falsework, Falsework Beam Design, Flange Failure, Bottom Flange Bending, Buckling, Cap Beam Bending, Cap Beam Shear, Design Equation
18. DISTRIBUTION STATEMENT No restrictions. This document is available to the public through the National Technical Information Service, Springfield, VA 22161
19. SECURITY CLASSIFICATION (of this report)
Unclassified
20. NUMBER OF PAGES 170 Pages
21. PRICE
Reproduction of completed page authorized

Report No. CCEER 05-11
Recommendations for the Design of Beams and Posts in
Bridge Falsework
Lyle P. CardenAhmad M. ItaniGokhan Pekcan
________________________________________________________________________
Center for Civil Engineering Earthquake ResearchUniversity of Nevada, Reno
January, 2006


Technical Report Documentation Page
1. Report No.
2. Government Accession No.
3. Recipient’s Catalog No.
4. Title and Subtitle
Investigation of Flange Failures in Falsework Cap and Sill Beam
5. Report Date
January 20, 2006
Recommendations for the Design of Beams and Posts in Bridge Falsework
6. Performing Organization Code
7. Author(s)
Lyle Carden, Ahmad Itani, Gokhan Pekcan
8. Performing Organization Report No.
UNR / CCEER 05-11
9. Performing Organization Name and Address
Department of Civil and Environmental Engineering Universit y of Nevada
10. Work Unit No. (TRAIS)
Reno, Nevada 89557-0152
11. Contract or Grant No.
12. Sponsoring Agency Name and Address
California Department of Transportation Engineering Service Center
13. Type of Report and Period Covered
Final Report
1801 30th St., West Building MS 9-2/5i Sacramento, California 95816
14. Sponsoring Agency Code
15. Supplementary Notes
Prepared in cooperation with the State of California Department of Transportation. 16. Abstract
Recent field observations in bridge falsework identified potential deficiencies in the design of falsework resulting in localized bending in sill and cap beam flanges and lateral buckling in other beams. Possible limits states associated with the bearing of timber and steel posts on cap and sill beams are investigated in this report. The critical limit states are related to flange bending, post crushing or yielding, web yielding, web crippling, lateral web buckling and corbel crushing. Different methods are investigated for predicting the capacity of the flange. The first assumes a uniform stress distribution resulting in bending of the flange. This is adequate for timber posts, but not as accurate at the second more elaborate method which accounts for an interaction between flange bending and post compression strength, found to be effective for timber posts. The third method uses an effective bearing area of the post, which is more effective with steel posts. For beams with relatively thick webs, such as those typically used in bridge falsework, the web was found to have a greater capacity than the flange and posts. The critical web limit state was web yielding (refered to as web crippling in the Caltrans Falsework manual) with variations of existing equations found to be appropriate for predicting the capacity. Web crippling (as defined by ASCE) is found to generally not govern the design. Lateral web buckling may govern the design, particularly when two sill beams are stacked on top of each other. Blocking may be used to increase the flange bending and web yielding capacity, although lateral bracing or stiffeners are recommended to increase lateral buckling capacity. Design equations are presented in allowable stress design format for the consideration of the critical limit states in a falsework bent. These are compared to current Caltrans design practice and other relevant specifications. Two design examples are also provided to demonstrate the application of these equations, one using timber posts and a second using steel posts.
17. Key Words
bottom flange bending, buckling, cap beam, cap beam bending, cap beam shear, design equation, falsework, falsework beams, falsework design, flange buckling, flange failure, flange-post interaction, lateral buckling, patch loads, post yielding, posts, sill beam, steel posts, timber blocking timber corbels, timber posts, top flange bending, University of Nevada, web buckling, web crippling, web yielding
18. Distribution Statement
Unlimited
19. Security Classification (of this report)
Unclassified
20. Security Classification (of this page)
Unclassified
21. No. of Pages
166 pages 22. Price
Form DOT F 1700.7 (8-72) Reproduction of completed page authorized


ABSTRACT
Recent field observations in br idge falsework identified pot ential deficiencies in thedesign of falsework resulting in localized bending in sill and cap beam flanges and lateralbuckling in other beams. Possible limits states associated with the bearing of timber andsteel posts on cap and sill beams are investigated in this report. The critical limit states arerelated to flange bending, pos t crushing or yielding, web yi elding, web crippling, lateralweb buckling and corbel crushing. Dif ferent methods are investigated for predicting thecapacity of the flange. The first assumes a uniform stress distribution resulting in bendingof the flange. This is ade quate for timber posts, but not as accurate at the second moreelaborate method which acc ounts for an interaction betw een flange bending and postcompression strength, found to be ef fective for timber posts. The third method uses aneffective bearing area of the post, which is more effective with steel posts. For beams withrelatively thick webs, such as those typically used in bridge falsework, the web was foundto have a greater capacity than th e flange and posts. The critical web limit state was webyielding (refered to as web crippling in the Caltrans Falsework manual) with variations ofexisting equations found to be appropriate for predicting the capacity. Web crippling (asdefined by ASCE) is found to generally not govern the design. Lateral web buckling maygovern the design, particularly when two sill beams are stacked on top of each other .Blocking may be used to increase the flange bending and web yielding capacity, althoughlateral bracing or stif feners are recommended to increas e lateral buckling capacity .Design equations are presented in allowable stress design fo rmat for the co nsideration ofthe critical limit states in a falsework bent. These are compared to current Caltrans designpractice and other relevant specifications. T wo design ex amples are also provided todemonstrate the application of these equations, one using timber posts and a second usingsteel posts.
i

ii

ACKNOWLEDGEMENTS
The authors would like to extend their gr atitude to the California Department ofTransportation for funding of this study under contract number 59A0445, with specialthanks to John Lammers and Peter Lee for their assistance and direction. They would alsolike the thank the laboratory manager , Patrick Laplace and and de velopment technician,Paul Lucas for their assistan ce. To the under graduate assistants, Michael Schreiber andMathew Ethridge, thank you also for your tireless efforts.
iii

iv

TABLE OF CONTENTS
SECTION PAGE
ABSTRACT I
ACKNOWLEDGEMENTS III
TABLE OF CONTENTS V
LIST OF FIGURES IX
LIST OF TABLES XIII
LIST OF SYMBOLS XV
1 INTRODUCTION 1
2 EXPERIMENTS ON FALSEWORK COMPONENTS AND SUB-ASSEMBLIES 52.1 Overview 52.2 Setup of Sub-assembly Experiments on Beams with Posts and Corbels 52.3 Coupon Tests 62.4 Component Experiments 9
2.4.1 Timber Posts 92.4.2 Timber Corbels 112.4.3 Timber Blocking 122.4.4 Steel Post 12
2.5 Sub-assembly Experiments on Beams with Posts and Corbels 152.5.1 Overview 152.5.2 Beams with Resulting in Post-Flange Bending and Post Crushing 152.5.3 Beams with Timber Posts and Timber Corbels Resulting in Corbel Crushing 202.5.4 Beams with Steel Posts and Three Timber Corbels Resulting in Corbel Crushing and
Post Yielding 222.5.5 Beams with Rigid Patch Loads and No Corbels Resulting in Web Yielding 23
2.6 Comparison of Failure Load with Load where Flaking is Observed 26
3 FINITE ELEMENT ANALYSIS OF FALSEWORK BEAMS 513.1 Overview 513.2 Properties of the Finite Element Models 513.3 Comparisons between the Experimental and Finite Element Results 55
3.3.1 Overview 553.3.2 Post-flange Bending - Post Crushing Capacity 553.3.3 Corbel-flange Bending - Corbel Crushing 563.3.4 Web Yielding and Lateral Buckling 58
3.4 Other Finite Element Analysis Results 613.4.1 Other Configurations not Considered Experimentally 613.4.2 Prevention of Lateral Buckling 623.4.3 Effect of Eccentricity 62
v

4 PREDICTION OF THE FLANGE BENDING, POST AND CORBEL CAPACITIES 654.1 Overview 654.2 Post-flange Bending Limit State 654.3 Post Compression Strength in the Flange-Post Connection Region 684.4 Interaction between Flange Bending and Post Compression Limit States 694.5 Effective Post Bearing Area for Calculating Flange-Post Capacity 694.6 Corbel-flange Bending Limit State 704.7 Corbel Strength 724.8 Strength of Blocking 734.9 Comparison of Calculated Strengths with Finite Element Analysis 73
4.9.1 Capacity of Post-flange and Post for the Concentrically Loaded Unblocked Beams 734.9.2 Effect of Eccentricity and Blocking on the Capacity of the Post-flange and Post 764.9.3 Capacity of the Corbel-flange and Corbels 79
4.10 Comparison of Calculated Limit States with Experimental Results 81
5 PREDICTION OF THE WEB YIELDING, CRIPPLING AND LATERAL BUCKLING CAPACITY 85
5.1 Overview 855.2 Web Yielding and Crippling 855.3 Web Buckling 865.4 Strength of Blocking 875.5 Comparison of Calculated Strengths with Finite Element Analysis 88
5.5.1 Localized Capacity of Web for Braced Beams 885.5.2 Lateral Web Buckling Capacity 91
5.6 Comparison of Calculated Strengths with Finite Element Analysis 93
6 PROPOSED DESIGN OF FALSEWORK BEAMS AND POSTS FOR GRAVITY LOADS 95
6.1 Overview 956.2 Design of Critical Members and Connections for Gravity Loads 95
6.2.1 Cap Beam Members for Flexure and Shear 956.2.2 Lateral Web Buckling in a Cap Beam 956.2.3 Web Yielding in a Cap Beam 966.2.4 Post-flange Bending in a Cap Beam with a Timber Post 97
6.2.4.1 Method 1 - Simplified Method 976.2.4.2 Method 2 - Interaction Method 97
6.2.5 Localized Yielding of a Steel Post from Bearing of the Cap Beam 986.2.6 Timber Post Design 996.2.7 Steel Post Design 1016.2.8 Localized Yielding of a Steel Post due to Bearing onto a Sill Beam 1036.2.9 Flange Bending-Post Crushing in a Sill Beam with a Timber Post 1036.2.10 Web Yielding in a Sill Beam 1036.2.11 Lateral Web Buckling in a Sill Beam 1036.2.12 Corbel-flange Bending in a Sill Beam 1036.2.13 Corbel Capacity 104
6.3 Comparison of Different Limit States in Beams and Posts 1046.3.1 Comparison using Actual Strengths 1046.3.2 Comparison using Allowable Stresses based Current Caltrans Provisions 106
vi

6.3.3 Comparison using Allowable Stresses based Recommended Provisions 107
7 DESIGN EXAMPLES 1097.1 Overview 1097.2 Design of Falsework with Timber Posts 109
7.2.1 Loads 1097.2.2 Cap Beam Bending 1097.2.3 Cap Beam Shear 1117.2.4 Lateral Web Buckling in the Cap Beam 1117.2.5 Web Yielding in the Cap Beam 1127.2.6 Localized Flange Bending in the Flange-Post Joint Region in the Cap Beam 1127.2.7 Post Compression Strength 1137.2.8 Flange-post Interaction, Web Yielding and Web Buckling in the Sill Beam 1137.2.9 Corbel-flange Bending in Sill Beam 1137.2.10 Corbels 114
7.3 Design of Falsework with Steel Posts 1147.3.1 Loads 1147.3.2 Cap Beam Bending 1147.3.3 Cap Beam Shear 1167.3.4 Lateral Web Buckling in the Cap Beam 1167.3.5 Web Yielding in the Cap Beam 1177.3.6 Localized Post Yielding in the Cap Beam 1177.3.7 Post Compression Strength 1187.3.8 Flange-post Interaction, Web Yielding and Web Buckling in the Sill Beam 1187.3.9 Corbel-flange Bending in Sill Beam 1197.3.10 Corbels 119
8 SUMMARY, CONCLUSIONS AND RECOMMENDATIONS 1218.1 Summary and Conclusions 1218.2 Recommendations 122
REFERENCES 125
APPENDIX 1 PREDICTION OF THE FLANGE BENDING, POST AND CORBEL CA-PACITIES USING LOAD AND RESISTANCE FACTOR DESIGN 127
APPENDIX 2 GENERAL LAYOUT AND TYPICAL CROSS SECTIONS OF BRIDGE FALSEWORK FOR THE ARCH ROAD STAGE 4 BRIDGE 129
vii

viii
LIST OF FIGURES
FIGURE HEADING PAGEFIGURE 1-1 Bridge Falsework for the Petaluma River Bridge at the intersection of California State
Routes 101 and 116 1FIGURE 1-2 Bridge Falsework for Railroad Avenue Overcrossing at Pittsburg, California 2FIGURE 1-3 Localized flange bending failure in sill beam (J. Lammers, Caltrans, Personal
communication) 3FIGURE 1-4 Instability of sill beam resulting in lateral deformation of web (J. Lammers, Caltrans,
Personal communication) 3FIGURE 2-1 Sub-assembly setup with actuator, timber post, steel beam, restraints and corbels 6FIGURE 2-2 Typical experimental setup for beam with timber post and corbels 7FIGURE 2-3 Sub-assembly setup without timber corbels 8FIGURE 2-4 Sub-assembly setup without a post or timber corbels 8FIGURE 2-5 Component experiment on 4 foot long 12x12 in. Timber Post 10FIGURE 2-6 Actuator force vs slider displacement for different post component experiments 10FIGURE 2-7 Stiffness vs slider displacement for post component experiment (Post 1) 12FIGURE 2-8 Component experiment on 4 foot long 12x12 in. timber corbel 13FIGURE 2-9 Actuator force vs slider displacement for timber corbel 13FIGURE 2-10 Component experiment on blocking in load frame 14FIGURE 2-11 Actuator force vs actuator displacement for three timber block component experiments
14FIGURE 2-12 Component experiment on 4 ft. long 18 in. diameter steel post 16FIGURE 2-13 Actuator force vs slider displacement for timber corbel 16FIGURE 2-14 Actuator force vs slider displacement for 1253TPNBSCRE0 - Beam 18 27FIGURE 2-15 Flange bending and post deformation observed during loading of 1253TPNBSCRE0 -
Beam 18 27FIGURE 2-16 Strain gages on beam close to where flaking of lime paint is first observed 28FIGURE 2-17 Actuator force vs strain in two strain gages located close to the yield line location in
1253TPNBSCRE0 - Beam 18 28FIGURE 2-18 Actuator force vs slider displacement for 1253TPBSCRE0 - Beam 19 29FIGURE 2-19 Actuator force vs slider displacement for 1253TPNBSCRE12 - Beam 16 29FIGURE 2-20 Actuator force vs slider displacement for 1253TPBSCRE12 - Beam 17 30FIGURE 2-21 Actuator force vs slider displacement for 1253TPNBSCRE6 - Beam 14 30FIGURE 2-22 Actuator force vs strain in four strain gages located close to the yield line locations in
1253TPNBSCRE6 - Beam 14 31FIGURE 2-23 Actuator force vs slider displacement for 1253TPBSCRE6 - Beam 15 31FIGURE 2-24 Actuator force vs slider displacement for 1473TPNBSCRE0 - Beam 20 32FIGURE 2-25 Actuator force vs slider displacement for 1473TPBSCRE0 - Beam 21 32FIGURE 2-26 Actuator force vs slider displacement for 1473TPNBSCRE6 - Beam 27 33FIGURE 2-27 Actuator force vs slider displacement for 1473TPBSCRE0 - Beam 25 33FIGURE 2-28 Actuator force vs slider displacement for 1490TPNBSCRE0 - Beam 22 34FIGURE 2-29 Actuator force vs slider displacement for 1490TPBSCRE0 - Beam 23 34FIGURE 2-30 Actuator force vs slider displacement for 1490TPNBSCRE0 - Beam 24 35FIGURE 2-31 Actuator force vs slider displacement for 1253TPNBTCRE0 - Beam 12 35FIGURE 2-32 Corbel-flange bending, corbel crushing and post crushing after the completion of
1253TPNBTCRE0 - Beam 12 36FIGURE 2-33 Actuator force vs slider displacement for 1253TPBTCRE0 - Beam 13 36FIGURE 2-34 Actuator force vs slider displacement for 1490TPNBTCRE0 - Beam 1 37FIGURE 2-35 Actuator force vs slider displacement for 1490TPNBTCRE6 - Beam 4 37FIGURE 2-36 Actuator force vs slider displacement for 1490SPNBTCRE0 - Beam 2 38FIGURE 2-37 Onset of yielding and buckling in the steel post for 1490SPNBTCRE0 - Beam 2 38
ix

FIGURE 2-38 Actuator force vs slider displacement for 1490SPNBTCRE6 - Beam 3 39FIGURE 2-39 Actuator force vs slider displacement for 1253NPNBNCRE0 - Beam 10 39FIGURE 2-40 Post-elastic buckling/crippling of the web in 1253NPNBNCRE0 - Beam 10 40FIGURE 2-41 Actuator force vs slider displacement for 1253NPNBNCRE6 - Beam 11 40FIGURE 2-42 Actuator force vs slider displacement for 1473NPNBNCRE0 - Beam 9 41FIGURE 2-43 Actuator force vs slider displacement for 1473NPNBNCRE6 - Beam 8 41FIGURE 2-44 Actuator force vs slider displacement for 1490NPNBNCRE0 - Beam 6 42FIGURE 2-45 Actuator force vs slider displacement for 1490NPNBNCRE6 - Beam 7 42FIGURE 2-46 Actuator force vs slider displacement for 1473TPNBNCNRE0 - Beam 29 43FIGURE 2-47 Actuator force vs slider displacement for 1473TPBNCNRE0 - Beam 30 43FIGURE 2-48 Failure of post during experiment on unrestrained beam 1473TPNBNCNRE6 - Beam 31
44FIGURE 2-49 Actuator force vs slider displacement for 1473TPNBNCNRE6 - Beam 31 44FIGURE 2-50 Actuator force vs slider displacement for 1473TPBNCNRE6 - Beam 32 45FIGURE 2-51 Actuator force vs slider displacement for 1490TPNBNCNRE0 - Beam 26 45FIGURE 2-52 Lateral Buckling of 1490TPNBNCNRE0 - Beam 26 46FIGURE 2-53 Actuator force vs slider displacement for 1490TPBNCNRE0 - Beam 28 46FIGURE 2-54 Actuator force vs slider displacement for 1490NPNBNCNRE0 - Beam 5 47FIGURE 2-55 Comparison of observed load when flaking occurred with calculated failure load from
experiments with post-flange-post failure 48FIGURE 2-56 Comparison of observed load when flaking occurred with calculated failure load from
experiments with flange-corbel failure 48FIGURE 2-57 Comparison of observed load when flaking occurred with calculated failure load from
experiments with web yielding failure 49FIGURE 3-1 Finite element models for a) a timber post and beam, b) a steel post and beam, c) a beam
with a rigid patch load and d) long double stacked beam and post 52FIGURE 3-2 Force-displacement curve for a finite element model of a timber post compared to the
experimental data 53FIGURE 3-3 Force-displacement curve for a finite element model of a timber block compared to the
experimental data 54FIGURE 3-4 Force-displacement curve for a finite element model of a timber corbel compared to the
component experimental 54FIGURE 3-5 Force-displacement curve for finite element model of HP12x53 beam and timber post
exhibiting flange bending and post crushing 57FIGURE 3-6 Force-displacement curve for finite element model of HP12x53 beam and timber post
with blocking exhibiting flange bending and post crushing 57FIGURE 3-7 Failure load from finite element analysis compared with experimental failure load for
beams exhibiting flange-post failure 58FIGURE 3-8 Force-displacement curve for finite element model of HP12x53 beam with corbels and
posts exhibiting corbel-flange bending and corbel crushing 59FIGURE 3-9 Failure load from finite element analysis compared with experimental failure load for
beams exhibiting flange-corbel failure 59FIGURE 3-10 Force-displacement curve for the FE model of the HP12x53 beam with a concentric rigid
patch load exhibiting web yielding and post-elastic buckling/crippling 60FIGURE 3-11 Force-displacement curve for the finite element model of the unrestrained W14x90 beam
with a timber post resulting in lateral web buckling 60FIGURE 3-12 Failure load from finite element analysis compared with experimental failure load for
beams exhibiting web yielding and lateral buckling 61FIGURE 3-13 Finite element model of beam with stiffener to prevent lateral buckling 62FIGURE 3-14 Failure load of beams with different eccentricities between the beam and post 63FIGURE 4-1 Yield line pattern on beams for a post patch load assuming a uniform stress distribution in
the post 66
x

FIGURE 4-2 Cross section of a beam for a patch load assuming a triangular stress distribution in the post 68
FIGURE 4-3 Effective area of a) timber post and b) steel post for calculation of ultimate post load 70FIGURE 4-4 Yield line pattern on corbel-flange of sill beam due to reaction from the corbels 71FIGURE 4-5 Comparison of flange bending capacity with failure load from the finite element models
for different beams 74FIGURE 4-6 Comparison of post capacity for a short length of post with failure load from the finite
element models for different beams 74FIGURE 4-7 Calculated flange-post capacity a) using the minimum of the flange bending strength with
β=11 and post strength and b) using the interaction equation between flange bending strength with β=18 and post strength, compared to failure load from the finite element models for different beams 75
FIGURE 4-8 Comparison of calculated flange-post capacity using effective post bearing area with failure load from the finite element models for different beams 77
FIGURE 4-9 Comparison of calculated flange-timber post capacity using interaction equation with finite element failure load for beams with blocking and eccentricities 77
FIGURE 4-10 Comparison of calculated flange-timber post capacity using minimum of flange (β=11) and post strength with finite element failure load for beams with blocking and eccentricities 78
FIGURE 4-11 Comparison of calculated steel post capacity using effective yielding area with finite element failure load for beams with blocking and eccentricities 79
FIGURE 4-12 Comparison of calculated corbel capacity with finite element failure load for beams with corbel failures 80
FIGURE 4-13 Comparison of calculated flange-timber post capacity using interaction equation with finite element failure load for beams with blocking and eccentricities 82
FIGURE 4-14 Comparison of calculated flange-timber post capacity using minimum of flange capacity (β=11) and post capacity with finite element failure load for beams with blocking and eccentricities 83
FIGURE 4-15 Comparison of calculated corbel capacity with experimental failure load for beams with and without eccentricities 83
FIGURE 5-1 Effective web yielding region for a) timber post and b) steel post 86FIGURE 5-2 Calculated web yielding, and crippling capacity versus finite element failure load for
concentrically load, unblocked beams 89FIGURE 5-3 Calculated web yielding capacity (α=2) versus finite element failure load for different
beams with blocking and eccentricities 89FIGURE 5-4 Calculated web yielding capacity (α=5) versus finite element failure load for different
beams with blocking and eccentricities 90FIGURE 5-5 Calculated web crippling capacity versus finite element failure load for different beams
with blocking and eccentricities 90FIGURE 5-6 Calculated lateral web buckling capacity versus finite element failure load for 10 ft. long
beams without blocking or eccentricities 92FIGURE 5-7 Comparison of calculated ultimate load using web yielding and lateral web buckling
equations with the experimental failure load 92FIGURE 6-1 Column stability factor, Cp, for 12 x 12 in. Number 2 Douglas Fir posts of different
lengths (AFPA 2001) 100FIGURE 6-2 Allowable stress vs post length for 12 x 12 in. Number 2 Douglas Fir timber posts based
on the NDS specifications and Caltrans Falsework Manual 100FIGURE 6-3 Allowable stress vs post length for 18 in. diameter 3/8 in. thick round hollow steel post
based on the AISC specifications and Caltrans Falsework Manual 102FIGURE 7-1 Portion of a falsework bent with timber post identifying critical limits states 110FIGURE 7-2 Portion of a falsework bent with steel post identifying critical limits states 115
xi

xii

LIST OF TABLES
TABLE HEADING PAGE
TABLE 2-1 Combinations of beams, posts, corbels, blocking and eccentricities used i experiments 9TABLE 2-2 Summary of results from coupon tests 9TABLE 4-1 β1 values for beams assuming uniform and triangular stress distributions and 11.5 in.
square patch load 67TABLE 4-2 β2 values for beams assuming uniform stress distributions, 11.5 in. wide corbels and a
spacing between corbels of 24 in. 72TABLE 6-1 Comparison of calculated ultimate beam, post and corbel loads based on actual strengths
from experiments (kip) 105TABLE 6-2 Comparison of calculated allowable beam, post and corbel loads based on original Caltrans
allowable stresses (kip) 106TABLE 6-3 Comparison of calculated allowable beam-post loads based on recommended strengths
from experiments (kip) 107
xiii

xiv

LIST OF SYMBOLS
Ab Cross sectional area of blockingAbg Bearing areaAp Cross sectional area of postAw Area of webbc Width of corbelbf Width of flangebfeff Effective outstanding flange widthbp Width of postbpeff Effective post width outside web regionc Factor for timber typeCp Column stability factord Depth of beamdp Depth of postE Elastic modulusfb Applied bending stressfbg Applied bearing stressfcw Applied stress in webfcp Applied stress in postfv Applied shear stressFb Allowable bending stressFc' Nominal or allowable compressive stressFc* Allowable compressive stress in post without modification for
column stabilityNominal or a llowable c ompressive s tress pe rpendicular to thegrain
Fcb' Allowable stress in blockingFcE Euler buckling load as applied to timber postFcf Allowable effective stress in flangeFcp Allowable stress in steel postFcp' Allowable stress in timber postFcpb Allowable stress in steel post accounting for blockingFcr Critical stress
Fc⊥'
xv

Fcw Allowable compressive stress in webFcwb Allowable compressive stress in web accounting for blockingFe Euler buckling loadFgf Allowable effective bearing stressFv Allowable shear stressFyf Minimum specified yield strength of flangeFyp Minimum specified yield strength of postFyw Minimum specified yield strength of webh Clear height of web between flanges less the fillet radiusk Distance from outer face of flange to toe of webk1 Distance from center of web to edge of fillet in beamK Effective length factorKcE Timber compression stability constantle Effective length of postleff Effective length of webL Length of beam or postM Maximum applied bending momentN Length of bearingp Applied distributed loadP Applied axial loadPb Axial load capacity of blockingPu Axial load capacity of blockingr Radius of gyrationR Applied loadRc Bearing capacity of corbelRf1 Flange load capacity due to a post patch loadRf2 Flange load capacity due to a patch load from corbelsRn Nominal load capacityRp Localized load capacity of post Rw Web load capacityRu Ultimate applied loadsc Center to center spacing of outermost corbels in a corbel grouptep Thickness of end plate of steel post
xvi

tf Flange thicknesstp Wall thickness of steel posttw Thickness of webw Applied distributed loadW WeightV Applied shear forceZ Plastic section modulus
α Stress gradient factorβ1 Flange bending factor due to a post loadβ2 Flange bending factor due to a corbel loadγ Blocking effectiveness factorλ Time effect factor (load duration factor)φ Resistance factorφb Resistance factor for bendingφc Resistance factor for compressionθ Angle of yield line
xvii

xviii

SECTION 1INTRODUCTION
Falsework is used in the construction of cast-in-place box gi rder bridges, foundextensively on the west coast of the United S tates. Falsework is defined at the temporarystructure that supports the main structure dur ing construction, in contrast to formwork,which consists of the tempor ary components used to provi de the desired shape to astructure. Construction falsew ork in bridges typi cally consists of: timber or concretefoundations pads; timber corbels, sand jacks and wedges; steel sill beams; timber or roundhollow steel posts; steel cap be ams, timber or steel s tringer beams and timber joists.These are stabilized for lateral loads using a series of timber or cable braces. An exampleof these components with st eel posts and stringer beams is shown in Figure 1-1, while aanother example with timber posts is shown in Figure 1-2.
Historically failure of falsework has occurred due to a number of causes, from events thatresult in overload of the falsework, to inad equate design and checking of the falsework(Hadipriono 1986) Generally these failures can be prevented by proper execution of anestablished design procedure and appropriate construction management. However, recentfield observations highlighted possible design deficiencies in the type of falsework shownin Figures 1-1 and 1-2. In some cases lo calized flange bending was observed at theinterface between the cap and sill beams and posts, as illustrated in Figure 1-3. While local
FIGURE 1-1 Bridge Falsework for the Petaluma River Bridge at the intersection of California State Routes 101 and 116
1

web yielding of the beam may be checked dur ing design, there is no available method forchecking the flange bending capa city required to resis t the ef fects of a flexib le patchloading from a timber or steel post. In another example of falsework failure, lateralinstability of a beam is observed through deformation of an unrestrained web, as shown inFigure 1-4. Sill and cap be ams are generally not braced and not stif fened, thus thepotential f or late ral instabil ity is much gre ater tha n fo r a beams in other typicalapplications. Thus the stab ility of the beams should be considered in design, althoughthere is currently no rational method for such consideration.
The AISC LRFD specifications for structural steel buildings (AISC 2005) allows for thecalculation of flange bending ca pacity in beam column joints. The ultima te load in thecolumn flange as sumes that a tensile line load is applied to the column flange from thebeam flange (Graham et al. 1959). A yield line pattern in the column flange and a uniformstress distribution from the beam flange is then assumed in order to calculate the ultimatecapacity of the flange. Howeve r, this equation is very cons ervative if ap plied to flangebending from compressive patch loading as the region of flange available to resist the load
FIGURE 1-2 Bridge Falsework for Railroad Avenue Overcrossing at Pittsburg, California
2

is much g reater for a patch load than a li ne load and a compression load allows lar gestresses around the web. Past studies on the effect of patch loading (Roberts and Rockey1979, Roberts and Markovic 1983, Elgaaly 1983, Roberts and Newark 1997, Gracianoand Edlund 2003) have generally assumed rigi d patch loads which ha ve not resulted inflange bending other than that required for deformation of the web. A rigid patch load isdefined as one where the patc h load does not deform resu lting in a redistribution ofstresses if the loaded member de forms. This is in contra st to a flexible patch load whichdeforms as the loaded member deforms resu lting in a more cons tant distribution ofstresses. The case of a flex ible patch load provided by a timber post has not beenconsidered and, therefore, there is no method for predicting the resulting capacity of thebeam flange.
FIGURE 1-3 Localized flange bending failure in sill beam (J. Lammers, Caltrans, Personal communication)
FIGURE 1-4 Instability of sill beam resulting in lateral deformation of web (J. Lammers, Caltrans, Personal communication)
3

The effect of patch loading on the web of beams or columns has been considered by anumber of researchers. As a result there are two limit stat es considered for th e localizedloading of a beam web, local web yielding that governs for stocky webs, summarized byGalambos (1976), and web crippling that gove rns for more slender webs, as summarizedby Elgaaly (1983). Chen and Newlin (1973) developed an expression for the localizedbuckling of beam webs for an equal and opposite concentrated load applied to both edgesof the web, based on classic plate buckling theory (Timoshenko and Gere 1961). As withthe equation developed for flange bending, this equation is expected to be conservative foran applied patch loading, where the area of web involved in re sisting the load isconsiderably greater than for concentrated loads. The buckling equation developed byChen and Newlin (1973) also assumes that both flanges ar e restrained from lateraldeformation. If there are no stif feners at any location along a beam, then it may bepossible for buckling of the web with lateral deformation of one of the flanges.
Thus, in development of design criteria for unstiffened beams used in bridge falsework,further study is required to investigate the effect of patch loads from timber and steel postson bending of the beam flanges, yielding or crushing of the posts, and yielding, cripplingor lateral buckling of the web.
The objectives of this study are to:
• Experimentally investigate the flange bending capacity of typical falsework beamssubjected to patch loading from timber and steel posts.
• Experimentally investigate the localized critical web limit states in falsework beamsfor timber and steel post loads.
• Experimentally investigate global instability of the web without the use of stif fenersand lateral bracing.
• Determine effectiveness of blocking in increasing the flange and web capacities.
• Determine the impact of accidential eccentricity between the centroid of a timber orsteel posts and centroid of the beams.
• Compar e the c urrent des ign equa tions and allowable stresse s in the CaltransFalsework Manual with other current design specifications.
• Provide recommendations for changes to the current design procedure to preventfuture failures of falsework beams.
The scope of this study is limi ted to experiments on subassemblies of timber or steel postand beam joint regions. Finite element analyses are used to investigate the longer beamsand posts for cr itical c ases. Sever al t ypical size fals ework beams are consideredexperimentally with a larger range of beams used in finite element analyses. The focus ofthis study is on the critical components in fa lsework with the stability of falseworksystems not considered.
4

SECTION 2EXPERIMENTS ON FALSEWORK COMPONENTS AND SUB-ASSEMBLIES
2.1 Overview
A series of compo nent experi ments were performed on shor t lengths of typical timberposts, timber corbels and steel posts used in bridge falsework. Sub-assembly experimentswere also performed with timb er and steel posts bearing ont o short beam segments usingbeams with sizes like those typically used in bridge falsework. In some cases corbels werealso placed under the beam. The set-u p and results from each of th e component andsubassembly experiments are outlined below.
2.2 Setup of Sub-assembly Experiments on Beams with Posts and Corbels
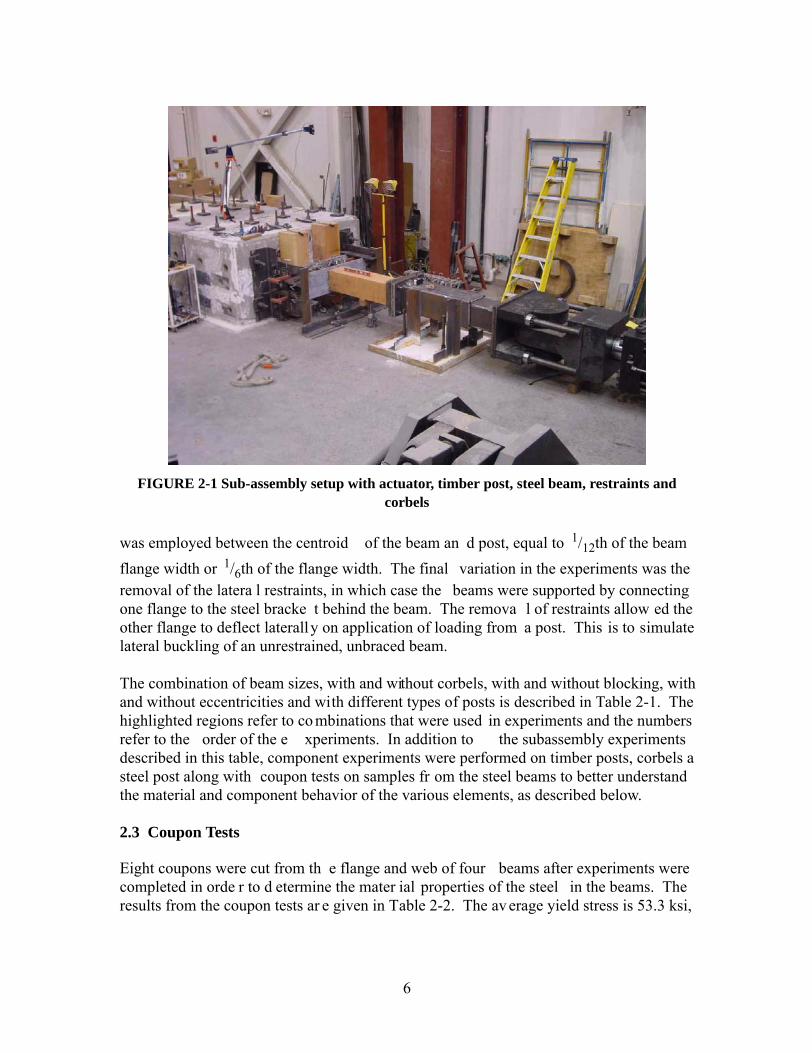
A series of experiments were performed to study the dif ferent limit states in a beam-postconnection region. A typical setup with a 48 in. long 12x12 in. timber post, 48 in. longsteel beam and 48 in. long 12x12 in. timber corbels centered 24 in. apart behind the beam,is shown in Figure 2-1. The configuration and dimensions of a typical experiment with atimber post and corbels are shown in Figur e 2-2. The actual vertically orientatedfalsework was orientated horizon tally to facilitate loading during experiments. The post-flange is consisted to be the flange adjoining the post while the corbel-flange is the flangebearing against the timber or steel corbels, as for a sill beam in typical falsework. A capbeam would be similar , although only the post -flange need be con sidered as there are nocorbels.
The flanges were restrained at the ends of the 48 in. long beam segments by a steel frame,as shown in the figure, pr eventing lateral instability of the beams for studying thelocalized flange and post limit states. Lo ads were ap plied to the end of the 48 in. longposts through a slider, to limit lateral deformation at the end of the post, in turn attached toa displacement controlled h ydraulic actuator. Three dif ferent beam sections were used,including ASTM A572Gr50 HP12x53 and HP14x73 beams, and ASTM A992 W14x90beams. Number 2 Douglas Fir 12 x 12 in. tim ber members were used for the posts andcorbels, while an 18 in. diameter 3/8 in. thick round hollow steel section with a 1/2 in. thickbase plate was also used to simulate a steel post in two experiments. In these experimentsan additional corbel was placed directly in line with the centroid of the columns. In someexperiments the timber corbels were replaced with steel plates as shown in Figure 2-3 inorder to eliminate the ef fect of the corbels from the system. In oth er experiments, thatfocused on web yielding and crippling, a rigid 12 x 12 in.steel plate was used instead of apost, as shown in Figure 2-4. Some experiments also used 6 x 8 in. Number 2 Douglas Firtimber blocking, placed between the flanges on both sides of the web. This blocking issometimes used in falsework in an attempt to increase the flange and web capacity of thebeams and was investigated to determine its effectiveness. In some cases an e ccentricity
5
was employed between the centroid of the beam an d post, equal to 1/12th of the beamflange width or 1/6th of the flange width. The final variation in the experiments was theremoval of the latera l restraints, in which case the beams were supported by connectingone flange to the steel bracke t behind the beam. The remova l of restraints allow ed theother flange to deflect laterally on application of loading from a post. This is to simulatelateral buckling of an unrestrained, unbraced beam.
The combination of beam sizes, with and without corbels, with and without blocking, withand without eccentricities and with different types of posts is described in Table 2-1. Thehighlighted regions refer to co mbinations that were used in experiments and the numbersrefer to the order of the e xperiments. In addition to the subassembly experimentsdescribed in this table, component experiments were performed on timber posts, corbels asteel post along with coupon tests on samples fr om the steel beams to better understandthe material and component behavior of the various elements, as described below.
2.3 Coupon Tests
Eight coupons were cut from th e flange and web of four beams after experiments werecompleted in orde r to d etermine the mater ial properties of the steel in the beams. Theresults from the coupon tests ar e given in Table 2-2. The av erage yield stress is 53.3 ksi,
FIGURE 2-1 Sub-assembly setup with actuator, timber post, steel beam, restraints and corbels
6

FIG
UR
E 2
-2 T
ypic
al e
xper
imen
tal s
etup
for
beam
with
tim
ber
post
and
cor
bels
7

FIGURE 2-3 Sub-assembly setup without timber corbels
FIGURE 2-4 Sub-assembly setup without a post or timber corbels
8
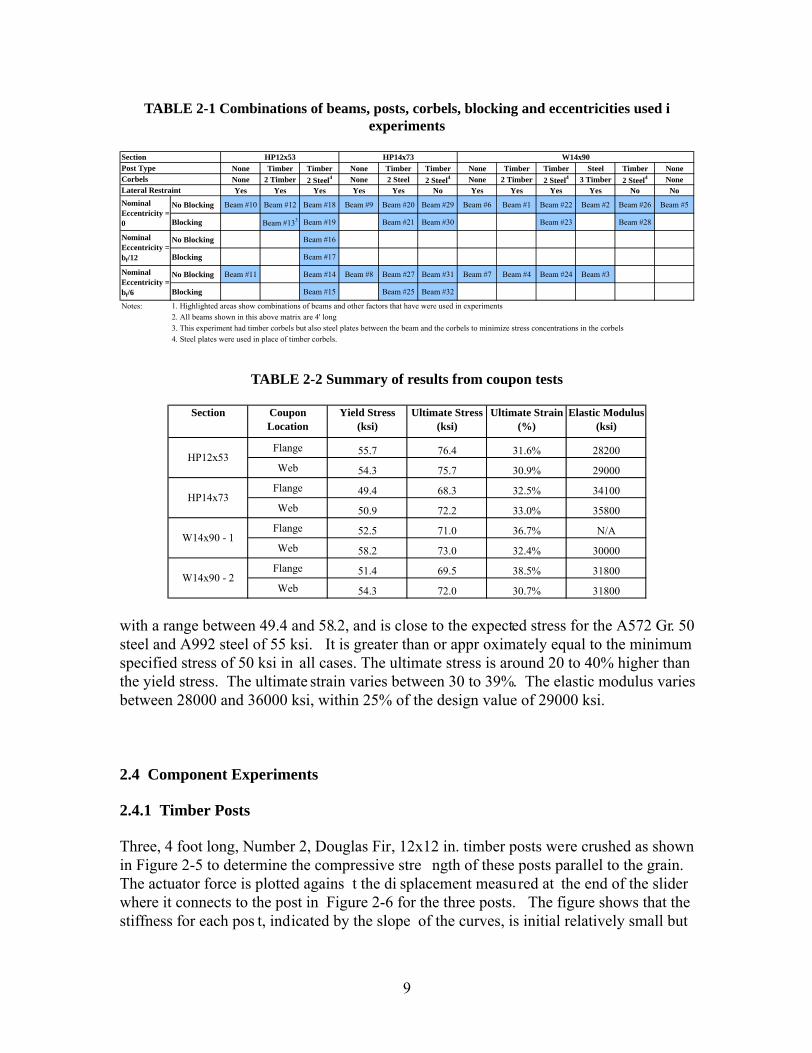
with a range between 49.4 and 58.2, and is close to the expected stress for the A572 Gr. 50steel and A992 steel of 55 ksi. It is greater than or appr oximately equal to the minimumspecified stress of 50 ksi in all cases. The ultimate stress is around 20 to 40% higher thanthe yield stress. The ultimate strain varies between 30 to 39%. The elastic modulus variesbetween 28000 and 36000 ksi, within 25% of the design value of 29000 ksi.
2.4 Component Experiments
2.4.1 Timber Posts
Three, 4 foot long, Number 2, Douglas Fir, 12x12 in. timber posts were crushed as shownin Figure 2-5 to determine the compressive stre ngth of these posts parallel to the grain.The actuator force is plotted agains t the di splacement measured at the end of the sliderwhere it connects to the post in Figure 2-6 for the three posts. The figure shows that thestiffness for each pos t, indicated by the slope of the curves, is initial relatively small but
TABLE 2-1 Combinations of beams, posts, corbels, blocking and eccentricities used i experiments
TABLE 2-2 Summary of results from coupon tests
None Timber Timber None Timber Timber None Timber Timber Steel Timber NoneNone 2 Timber 2 Steel4 None 2 Steel 2 Steel4 None 2 Timber 2 Steel4 3 Timber 2 Steel4 NoneYes Yes Yes Yes Yes No Yes Yes Yes Yes No No
No Blocking Beam #10 Beam #12 Beam #18 Beam #9 Beam #20 Beam #29 Beam #6 Beam #1 Beam #22 Beam #2 Beam #26 Beam #5
Blocking Beam #133 Beam #19 Beam #21 Beam #30 Beam #23 Beam #28
No Blocking Beam #16
Blocking Beam #17
No Blocking Beam #11 Beam #14 Beam #8 Beam #27 Beam #31 Beam #7 Beam #4 Beam #24 Beam #3
Blocking Beam #15 Beam #25 Beam #32
Notes: 1. Highlighted areas show combinations of beams and other factors that have were used in experiments2. All beams shown in this above matrix are 4' long3. This experiment had timber corbels but also steel plates between the beam and the corbels to minimize stress concentrations in the corbels4. Steel plates were used in place of timber corbels.
Nominal Eccentricity = bf/12
Nominal Eccentricity = bf/6
CorbelsLateral RestraintNominal Eccentricity = 0
W14x90Post TypeSection HP12x53 HP14x73
Section Coupon Location
Yield Stress (ksi)
Ultimate Stress (ksi)
Ultimate Strain (%)
Elastic Modulus (ksi)
Flange 55.7 76.4 31.6% 28200Web 54.3 75.7 30.9% 29000
Flange 49.4 68.3 32.5% 34100Web 50.9 72.2 33.0% 35800
Flange 52.5 71.0 36.7% N/AWeb 58.2 73.0 32.4% 30000
Flange 51.4 69.5 38.5% 31800Web 54.3 72.0 30.7% 31800
HP12x53
HP14x73
W14x90 - 1
W14x90 - 2
9

FIGURE 2-5 Component experiment on 4 foot long 12x12 in. Timber Post
FIGURE 2-6 Actuator force vs slider displacement for different post component experiments
0
50
100
150
200
250
300
350
400
450
500
0 0.5 1 1.5 2 2.5 3Displacement (in)
Act
uato
r For
ce (k
ip)
0
225
450
675
900
1125
1350
1575
18000 13 25 38 50 63 75
Displacement (mm)
Act
uato
r For
ce (k
N)
Post 1Post 2Post 3
10
increases as any gaps between the ends of the post and adjacent reactions are closed. Oncethis happens the max imum stif fness is rea ched. As the load cont inues to inc rease thestiffness star ts to dr op a gain indicating the onset of crus hing of the post. When themaximum load is reached, s evere crus hing a nd splitting of the post is observed. Themaximum load in posts 1 and 2 is within 10% of each other, however the maximum loadin post 3 is 30-40% less. This is indicative of the large variability possible in these postsparticularly as they are Number 2 specimens thus splitting and imperfections are typicallyfound in the members. The lower strength is also attributed to a lack of squareness, whichwas most pronounced at the end of this post, and resulted in stress concentrations in part ofthe post inducing premature failure of the post. This is a typical feature of falsework postsand therefore a conservative design of the post is required.
The failure load in each post and all other experiments was not defined as the maximumload, but at a load where the stiffness of the post dropped to 50% of its initial stiffness. Theinitial stiffness was defined from the force-displacement curve between 25 and 75% of theestimated failure load. This was used in order to define significant crushing or yieldingand was generally with in 10 to 15% of the maximum ap plied force for each ex perimentwhere a reduction in force was o bserved after failure. In some experiments such as thosewhere timber corbels crushed, as described in the following section, a reduction in forcewas not observed. Instead the force con tinued to increase up to lar ge inelasticdisplacements. In this case a definition of failur e load as above was necessary to definefailure.
The stiffness of Post 1 is pl otted against the slider displa cement in Figure 2-7 with someaveraging of the data used to smooth the stif fness. The initial stif fness for this post wa sestimated at 975 kip/in. The force in the post corresponding to where the load dropped to50% of th is initial s tiffness was determined and defined as the failu re load. The failureloads were 367, 337 and 221 kip respectivel y for the three timber post componentexperiments, as shown by the dashed lines in Figure 2 for each of the posts. Thecorresponding axial failure compression st resses were 2770, 2 540 and 1670 psi based on11.5 in square actual post dimensions.
2.4.2 Timber Corbels
A component experiment wa s performed on a 12x12 in. Numb er 2 Douglas Fir timbercorbel, as shown in Figure 2-8. A 15 in. wide patch load was applied to the corbel, similarto the 14 to 15 in. wide flange of a typical falsework beam. The corbel was identical to thetimber post except that the load was applied perpendicular to the grain. The failure load inthe corbel was defined when the stif fness reduced to 50% of the initial stif fness using thesame procedure as for the ti mber post. U nlike the timb er post, however , the force-displacement curve in Figure 2-9 shows that once the failure load was reached the forcedid not drop but continued to increase as the timber in the corbel densified with increasingdeformation. Thus failure of a corbel is likely to be less catastrophic than failure of thepost as it continues to carry th e load after failure. The fa ilure load for the corb el was
11

calculated at 93 kip, correspondi ng to a failure bearing stre ss of 540 psi for the 1 1.5 in.wide member.
2.4.3 Timber Blocking
Component experiments, with axial loads applied using a lo ad frame as s hown in Figure2-10, were performed on three timber blocks . The resulting force-displacement curvesfor the three blocks are shown in Figure 2-11. The failure load for the blocks was quitevariable. The strength in the blocks was much higher than the nominal strength based onthe NDS wood specifications (AFPA 1996) and, in one case, the force in the blockingreached the capacity of the actuator in the load frame. However , as the stif fness of theblocking just started to drop, the failure load was determined just before the experimentwas terminated at 199 kip. The failure load s for the other two bl ocks were 159 and 133kip respectively. The fail ure loads corresponded to st resses of 4820, 3850 and 3220 psirespectively based on 7.5 x 5.5 actual blocking dimensions.
2.4.4 Steel Post
A component experiment was also conducted on a 18 in. diameter 3/8 in. thick A500Grade B (42 ksi minimum specified yield stress) steel post, as shown in Figure 2-12. Thebase plate of the post was 1/2 in thick A36 steel connected to the post using a 5/16 in. fillet
FIGURE 2-7 Stiffness vs slider displacement for post component experiment (Post 1)
-500
0
500
1000
1500
2000
0 0.5 1 1.5 2 2.5 3
Displacement (in)
Stiff
ness
(kip
/in)
-70
-35
0
35
70
105
140
175
210
2450 13 25 38 50 63 75
Displacement (mm)
Stiff
ness
(kN
/mm
)
12

FIGURE 2-8 Component experiment on 4 foot long 12x12 in. timber corbel
FIGURE 2-9 Actuator force vs slider displacement for timber corbel
0
50
100
150
200
250
300
350
400
450
500
0 0.5 1 1.5 2 2.5 3
Displacement (in)
Act
uato
r For
ce (k
ip)
0
225
450
675
900
1125
1350
1575
18000 13 25 38 50 63 75
Displacement (mm)
Act
uato
r For
ce (k
N)
13

FIGURE 2-10 Component experiment on blocking in load frame
FIGURE 2-11 Actuator force vs actuator displacement for three timber block component experiments
0
50
100
150
200
250
0 0.2 0.4 0.6 0.8 1
Displacement (in)
Act
uato
r For
ce (k
ip)
0
225
450
675
900
11250 5 10 15 20 25
Displacement (mm)
Act
uato
r For
ce (k
N)
Block 1Block 3Block 2
14

weld. At the end attached to the slider a 1 1/2 in. thick plate was weld ed to the post. Thefailure load in the s teel post was ca lculated at 811 kip as using the same definition forfailure as for the timber posts and corbel. At around the failure load, the onset of yieldingand buckling was observed in the post near the end with the 1/2 in base plate. The forcedisplacement curve in Figure 2-13 does not show a reduction in force after yielding of thepost, although the post is at the upper capacity of the actuator, therefore the experimenthad to be terminated once the onset of yielding was observed.
2.5 Sub-assembly Experiments on Beams with Posts and Corbels
2.5.1 Overview
The behavior of each of the sub-assembly experiments is described in this section. Theexperiments with steel corbels are first discussed which resulted in crushing or yielding ofthe timber or steel post respectively in conjunction with bending of the a post-flange of thebeam. The next set of experiments discusse d are the beams with corbels, which res ultedin bending of the corbel-flange and crushing of the corbels. The third set of experimentsconsidered are those without any posts or corbels which resulted in yielding and bucklingof the web. The final set of experiments are those beams without any lateral restraints insome cases resulting in lateral web buckling. A summary of each experiment is given,along with actuator force versus slider displacement curves. Each beam is named basedon: the section size; whether is has a timber, steel or no post; whether it has blocking or noblocking; the use of a timber, steel, or no corbel; whether or not it is restrained, and, whatlevel of eccentricity it has between the post and beam. The number referring to the beamnumber in Table 2-1 is also given.
2.5.2 Beams with Resulting in Post-Flange Bending and Post Crushing
1253TPNBSCRE0 - Beam 18
This was one of the smallest section cons idered, loaded through a timber post, withoutblocking, with steel corbels, laterally restrained at the flanges and without any eccentricitybetween the beam and post. As an increasi ng load was applied axially through a timberpost the s tiffness o f the f orce-displacement curve (Fig. 2-14) incr eased u ntil it be cameconstant at around 50 kip up to a force of approximately 240 kip. The initial stiffening ofthe s ystem was typical for all of the expe riments as the gaps between the dif ferentcomponents closed. Flaking, i ndicative of plastic deformat ion, was observed in the post-flange close to the locations of the strain gauges at a force of around 210 kip. As the loadincreased the onset of post deformation around the web of the beam was observed asnecessary to allow the post-flange to bend, as shown in Figure 2-15. The force-displacement curve started to flatten, as shown in Figure 2-14. The failure load, based ona 50% reduction in stif fness, was calculated at 237 kip th erefore was around 13% greaterthan the load when flakin g was first obser ved in this beam. The maximum load was
15

FIGURE 2-12 Component experiment on 4 ft. long 18 in. diameter steel post
FIGURE 2-13 Actuator force vs slider displacement for timber corbel
0
100
200
300
400
500
600
700
800
900
1000
0 0.2 0.4 0.6 0.8 1
Displacement (in)
Act
uato
r For
ce (k
ip)
0
450
900
1350
1800
2250
2700
3150
3600
4050
45000 5 10 15 20 25
Displacement (mm)
Act
uato
r For
ce (k
N)
16
reached at 243 kip at which point post crushi ng was observed. No corbel-flange yieldingor web deformation was observed in this experiment.
Two strain gages located on the flange of this beam around where yielding was firstobserved, as shown in Figure 2- 16, are plotted against the ac tuator force in Figure 2-17.One strain gage shows possibl e yielding due to fl attening of the curve at around 205 kip,close the point where flaking was first observed. The second strain gage shows flatteningat close to 230 kip, around where the failure load was calculated. Therefore the failureload is consistent with the observed inelastic behavior in the flange using these straingages. Similar observations can be made for the other beams exhibiting flange bendingwhen strain gages were located close to the observed yield lines.
1253TPBSCRE0 - Beam 19
This experiment was identical to the last except that blocking was used between the post-and corbel-flanges on both side s of the web. As the load was applied to the post thestiffness increased until the elastic stiffness was reached. Then the post started to deformaround the web and flange as in the previous experiment corresponding to a reduction instiffness (Fig. 2-18). Engagement of the blocking increased the failure load with onset offlaking on the post-flange observed at around 310 kip, although the calculated failure loadwas a little less at 289 ki p. The maximum load was reached at 320 kip, whichcorresponded to flange bending and timber pos t failure. Slight bending was observed inthe corbel-flange as well, though not enough to cause flaking. There was no observed webdeformation.
1253TPNBSCRE12 - Beam 16
The loading was applied axially through tim ber post in this e xperiment with aneccentricity of b f/12 (1.0 in.) between the post a nd unblocked beam. The force-displacement curve (Fig. 2-19) was similar to that for the conce ntrically loade d cas ealthough the stiffness was smaller, which could be due to dif ferent material properties aswell as the eccentricity. The post deformed around the web of the beam as in the previouscases, with the ef fect of th e eccentricity simply moving the deformation laterally in thepost. Flaking in the post-flange was obser ved at around 200 kip and the failure load wascalculated at 212 kip. The maximum forc e was observed at 225 kip, along with severepost deformation and further yi elding of the post-flange. Th erefore, although the failureand maximum loads were reduced by around 10%, there was not an appreciable change inresponse compared to the concentrically loaded case.
1253TPBSCRE12 - Beam 17
The same eccentricity as the previous case was imposed with blocking also used betweenthe flanges. The observed response of the beam was similar to the previous blocked case.The force-displacement curve (Fig. 2-20) showed typical st iffening, followed by a period
17

of elastic response, followed by a reduction in stif fness due to post crushing. After aninitial drop in load the force increas ed sl ightly then plateaued as the forces wereredistributed through the post, although failure was considered to have occurred prior tothis behavior. The failure load was calculated to be 284 kip. No flaking was observed inthe flange until a fo rce of 320 kip was reached. There was a small amount of bendingprior to this, as a small gap observed between the blocking and the flange closed, but thiswas not sufficient to cause yielding. The load reached a maximum of 335 kip.
253TPNBSCRE6 - Beam 14
This unblocked beam had a larger eccentricity equal to bf/6 (2.0 in.). The response (Fig. 2-21) was almost identical to the previously described unblocked case. The failure load wascalculated to be 221 kip. At this point, bending of th e post-flange and flaking wasobserved close to the lo cation of the strain gauges. Figu re 2-22 shows the strains in fourgages on the post-flange of the beam located close to the yield lines, with two on each sideof the web. These strain gages all show the onset of yielding at a force of between 210 to220 kip. Despite the eccentricity the strain gages on both sides of the web show yieldingat a similar force. The force reached a maximum of 230 kip before being reduced ascomplete post crushing was observed.
1253TPBSCRE6 - Beam 15
This eccentrically loaded bloc ked beam p erformed similarl y to the previo us case withblocking. Upon yielding of the beam and crushing of the post an immediate reduction inload was not observed (Fig. 2-23), instead th e load plateaued. The failure load wa scalculated at 285 kip. At around 300 kip yielding of the post was observed with someinelastic bending in the post-flange observed at this time. The maximum load was reachedafter significant inelastic deformation at 335 kip, when the post completely crushed.
1473TPNBSCRE0 - Beam 20
This was the next size beam considered, loaded concentr ically without blocking. Theresponse (Fig. 2-24) was similar to that for the smaller beam, although the failure load wasincreased due to increased flange bending capacity, even though th e post had a similarstrength. The failure load wa s calculated to be 275 kip with a maximum load reached of290 kip, whereupon the onset of bending in th e post-flange was obs erved. Flaking wasobserved at around 290 kip. Crushing of the post and the flange appeared to occur almostsimultaneously. No corbel-flange yielding was observed.
1473TPBSCRE0 - Beam 21
The same configuration as above was used for this beam with additional blocking betweenthe flanges. At 340 kip the onset of flaking was observed in the post-flange, although itwas limited as the blocking was activated. The failure load was calculated at 381 kip (Fig.
18

2-25). The maximum load was around 395 kip, after which the post failed. Relativelylittle bending was observed in the post-flange due to bloc king, but it wa s enough to beconsidered failure of the beam.
1473TPNBSCRE6 - Beam 27
This unblocked beam had an eccentricity between the beam and post of bf/6 (1.2 in.). Thefailure load was calculated to be approximately 283 kip, thus very similar to theconcentrically loaded beam. Bending in the post-flange was observed along with suddenpost deformation at failure. No flaking was observed until after the maximum load wa sreached. The load dropped quickly after th e maximum load was reached, as shown inFigure 2-26.
1473TPBSCRE6 - Beam 25
The blocked, eccentrically loaded beam has a reduced strength compared to theconcentrically loaded beam, although this could be lar gely due to a variation in poststrength. The failure load was calculated to be 310 kip. The load-displacement curve (Fig.2-27) peaked at around 320 kip and stayed rela tively constant over 0.4 inches of applieddisplacement. Some initial post-f lange flaking was observed as post deformationincreased, but was limited once blocking was activated until well after the maximum loadwas reached. At large displacements, the timber block split, resulting in significant flangebending and an reduction in the load carrying capacity at this stage.
1490TPNBSCRE0 - Beam 22
This is the first of the W14x90 beams, concen trically loaded, without blocking. As withthe other beam sizes flaking was observed in the post-flange, although at a higher load ofaround 300 kip due to the thicker flange. Th e failure load was cal culated to be 291 kip.The force peaked at 320 kip a nd stayed constant for about 0.2 inches of applied postdisplacement, after which is started to dr op, as shown in Figure 2-28. The failure wasthrough a combination of flange bending and post crushing as for the previous beams.
1490TPBSCRE0 - Beam 23
With blocking, the response (Fig. 2-29) of the W14x90 beam was similar to the unblockedcase. The failure load was calculated at 307 kip with a small amount of flaking around theblock observed at around 325 kip. Bending of the post-fl ange diminished once theblocking became effective. The load rose to a maximum of 335 kip at which time failurewas observed largely through crushing of the post. As in all previous experiments, no webyielding was observed.
19

1490TPNBSCRE6 - Beam 24
This eccentrically loaded, unblocked beam performed similarly to the concentricallyloaded beam. The failure load was calcula ted at 293 kip. Flaking around the post-flangewas observed at the same level of force. The load reached a maximum of appro ximately300 kip (Fig. 2-30), at which poi nt web yielding was observed. In this experiment theonset of web yielding was observed through fl aking of the web at the maximum load,attributed to the eccentricity coupled with a relatively thin web compared to the flangethickness. Despite the web inelasticity , it did not significantly af fect the performance ofthe beam.
Summary
In summary all beams loaded with timber pos ts resulted in some measu re of post-flangedeformation coupled with pos t deformation around the web of the beam and subsequentcrushing. The failure load of the flange-post joint region app eared to be coupled to thethickness of the flange and st rength of the post. Eccentric ity had minimal ef fect on theresponse with some reduction in failure load observed, but typically no more than 10%.Blocking increased the failure load, with some flange deformation observed to engage theblocking, but an overall reductio n in flange deformation resu lted in an increase in theflange-post joint capacity.
2.5.3 Beams with Timber Posts and Timber Corbels Resulting in Corbel Crushing
1253TPNBTCRE0 - Beam 12
This set of beams had 2 timber corbels behind the corbel-fla nge of each beam. This wa sintended to simulate sill beams, although usually a sand jack, blocks and wedges would beused between the sill beam and corbel. For each beam in this section the load was appliedaxially through a timber post. In this b eam, the load increased to around 100 kip thenapparent inelastic deformation started to occur, as illustrated by Figure 2-31. Thisapparent yielding was attributed to crushing of the corbels as we ll as bending of thecorbel-flange of the beam as shown in Figure 2-32 shown after the completion of theexperiment. In this res pect these exper iments may not be quite like what would beobserved in the field, as the sand jack and blocks may redu ce the concentration of corbeldeformation around the web of the beam, resulti ng in increased capacity in the corbels.The failure load was calculate d at 131 kip, also corresponding to the observation of limepaint flaking on the corbel-flange of the beam. Unlike when post crushing was observed,the load continued to increase after the corbels started to crush, therefore this limit state ismuch less catastrophic than one involving post crushing. At 170 kip, there was significantcracking in the timber corbels. Soon after , the experiment was pa used to remove someinstruments then resumed. As the load reached 200 kip, be nding in the post-flange wasobserved with flaking of the li me paint. At the maximum lo ad of 240 kip, the post, post-flange, and corbel-flange all had significant deformation and yielding although the load
20

continued to increase. The e xperiment was terminated as the limit of instruments w asreached.
1253TPBTCRE0 - Beam 13
In this experiment two 1 in. thick, 12 x 12 in. steel plates were used b etween the corbel-flange and each timber corbel to simulate to the presence of jacks and wedges. Blockingwas also used between the beam flanges. The use of the plates at the corbels increased thefailure load to 202 kip, compared to 131 kip for the previous beam. At the failure load, theonset of crushing in the co rbels was observed. This is considered a more realisticrepresentation of the actual conditions found in the field and corresponds to an averageindividual corbel failure load of 101 kip, within 9% of the 93 kip load measured during thecomponent experiment. In this beam no corbel-flange bending was observed around thecorbels. At a force of 260 kip, the onset of post crus hing was observed and the loadstarted to drop (Fig. 2-33).
1490TPNBTCRE0 - Beam 1
In this larger beam the configuration was similar to that for Beam 12. There were no steelplates between the corbel-flange and corbels, which resulted in corbel-flange bending inconjunction with corbel crushing. The failure load was calculated at 234 kip close to thepoint where corbel-flange be nding and flaking of the lime paint was observed at around240 kip. At this point the force-displacement curve started to flatten (Fig. 2-34). Theexperiment was held to make observations at this level allowing th e force to drop due tocreep in the system, although this was regained as soon as the loading was reapplied. Ataround 250 kip further bending of the corbel-flange was obse rved. The post-flange alsoexhibited some bending along with deformation of the post. This behavior continued untilan ultimate load of 356 kip was reached at which point the end of the post crushed.
1490TPNBTCRE6 - Beam 4
This was the same as the previous experiment except for an eccentricity between the postand beam of bf/6 (2.4 in.). This appeared to result in a more gradual transition between theelastic and inelastic deformation of the corbel . The failure load was calculated to b e 190kip, although Figure 2-35 shows that there was no clear transition to indicate inelasticbehavior. At around 250 kip flaking of the li me paint on due to bending in the corbel-flange was observed. The post crushed shortly after, at a maximum load of 270 kip, withsome post-flange bending also observed.
Summary
Corbel crushing typically occurred befo re post crushing and flange bending, althoughcorbel crushing was not catastrophic and allowed an increase in forces leading to eventualcomplete failure due to post and post-flange failure. Allowing be nding of the corbel-
21

flange reduced the corbel cap acity, although this is conservative, as in the field the sandjacks and blocks between the beam and corbel are likely to reduce stress concentrations inthe corbel.
2.5.4 Beams with Steel Posts and Three Timber Corbels Resulting in Corbel Crushing and Post Yielding
1490SPNBTCRE0 - Beam 2
In this section two beams were considered wi th steel pos ts. For th e first beam the postload was applied concentrically to the beam. Three corbels were placed behind the beam,including one directly under where the load was applied and the other two centered 12 in.each side of the middle co rbel. The force-displacement curve (Fig. 2-36) for thisexperiment was elastic (after initiating full contact of the various components) up to anobserved load of around 250 kip. At this load, deformation of the corbels behind the beambegan to be observed. The failure load was calculated at 292 ki p as the stif fnessdecreased. Corbel-flange yielding was observed through flaking of the whitewash paint at330 kip as the load continued to increase. At 400 kip corbel -flange yielding hadprogressed along the entire length of the beam. At 475 kip some deformation of the post-flange was observed with bending in the base plate of the steel post. Yielding of the post-flange though whitewash flaking was observed at this level. The onset of buckling of theend of the post in line with the beam flange was also obs erved, as shown in Figure 2-37.The ultimate load wa s reached at 520 kip at which time the corbels where unable tomaintain the load, while significant buckling of the post was also observed.
1490SPNBTCRE6 - Beam 3
In this experiment the load was applied ecce ntrically to th e beam through the steel post.The force-displacement response (Fig. 2-38) was almost identical to that for theconcentrically loaded beam. The failure load was calcula ted to be 270 kip. At 340 kip,flaking was observed in the corbel-flange. Flaking stretched across the length of the beamat 400 kip. The onset of localized post yielding was apparent at around 425 kip on oneside of the post. The force continued to increase up to a force of 525 kip. At the end of theexperiment some localized web yielding was observed.
Summary
The strength of the steel posts appeared to the governed by localized yielding andcrippling of the post where it bears onto the web of the beam. This is similar to yieldingthat may be observed in the we b of beams when a concentrat ed load is applied to thebeam. An eccentricity has little effect on the response of the post as it simply moves theyielding region to a new region of the post, still in line with the web of the beam. As theend of the steel post is rigid, no flange be nding is observed until after yielding andcrippling of the post is obser ved. The strength of the corb els in these experiments was
22

similar to those observed previously, with some reduction in strength due to bending of thecorbel-flange.
2.5.5 Beams with Rigid Patch Loads and No Corbels Resulting in Web Yielding
1253NPNBNCRE0 - Beam 10
As the timber and steel pos ts failed before significant deformation was observed in theweb of the beams, rigid patch loads from a steel plate were applied to a series of beams toinvestigate critical web limit states. All the beams in this series were laterally restrained toprevent lateral deformation of the post-flange. This b eam, an HP12x53, was one of thesmallest sections, although it has the same size web as the W14x90. The load was appliedthrough the rigid 12 x 12 in. patc h load as shown in Figure 2-4. The force-displacementcurve for this beam is shown in Figure 2-39. At 240 kip, the onset of flaking in the webwas observed, although the failure load was not calculated until the force reached 370 kip.The maximum load was reached at 380 kip. At the failure load significant yielding of theweb was observed along with an onset of lateral deformat ion in the web. As thedeformation increased beyond the maximum lo ad and the load began to drop, the webstarted to buckle/ cripple as shown in Figure 2-40. As th is deformation occurs aftersignificant yielding wa s observed, it was considered post-elastic buckling/crippling.There was no evidence of flange bending or yielding until significant deformationoccurred in the web and was consistent with that required to allow deformation of the web.
1253NPNBNCRE6 - Beam 11
This is almost identical to the previous beam except that the load was appliedeccentrically. However , as the patch load was rigid, it was found the ef fect of theeccentricity was minimal. The failure load was calculated at 370 kip, identical to theprevious beam. At the failure load, the ons et of web yielding wa s observed. The firstyielding was observed near the center of the web indicating an onset of web buckling. Themaximum force was reached at 380 kip (Fig. 2-41) at which point buckling becameevident.
1473NPNBNCRE0 - Beam 9
This was the next s ize larger beam with loading applied c oncentrically using the patchload as in the previous two beams. At 325 kip, the onset of web flaking was observedbefore it was observed that th e upper lateral restraints were slipping resulting in a smalllateral deformation of the post-flange. The experiment was paused to tighten the restraintsthen resumed. The failure load was calc ulated at 417 kip. The maximum load wasreached at 440 kip (Fig. 2-42). This load was potentially reduced due to the small lateraldeformation, although comparisons with the following beam do not suggest this wassignificant.
1473NPNBNCRE6 - Beam 8
23

Similar to the previous beam but with an eccentricity , the failure load was calculated at419 kip, almost identical to the previous beam. The maximum force was reached at 480kip (Fig. 2-43). W eb yielding followed by post-elastic cr ippling/buckling was observedas in previous experiments.
1490NPNBNCRE0 - Beam 6
This was a concentrically loaded W14x90 beam and its response followed the pattern ofthe previous beams. Even though the web was relatively thinner compared to the flange,post-elastic buckling/crippling was observed. At 410 kip the onset of web buckling wasobserved through flaking of the web, although th e failure load was cal culated at 457 kip.The force reached a maximum at 470 kip before going into a gradual decline as shown inFigure 2-44.
1490NPNBNCRE6 - Beam 7
As with the previous beams the eccentricity from the rigid patch lo ad resulting in littlechange in response, in fact the loads in this beam were slightly larger than in the previousbeam. At 430 kip, the onset of web flaking was observed. The failure load was observedat 510 kip. The maximum load was reached at 530 kip (Fig. 2-45).
Summary
Web deformation for the se beams where the flanges were late rally restrained to preventlateral deformation of the fl ange were categorized by yiel ding followed by post-elasticbuckling/crippling the web. Th e ef fect of eccentricity from the rigid patch load wa snegligible. The yielding of the web occurred at lar ger forces than post crus hing oryielding and flange bending obser ved in previous experiment s. Beams with No LateralRestraints Resulting in Possible Lateral Web Buckling
1473TPNBSCNRE0 - Beam 29
As falsework is not typically braced or st iffened, a series of beams without lateralrestraints were considered. For these beams the loads were applied concentrically thougha timber post. As the load was applied to the beam the post-flange and end of the poststarted to deform. The failur e loa d was c alculated in th e beam due to post and flangedeformation at 300 kip. At 310 kip, flaking of the lime paint was observed on the post-flange. A maximum load of 315 kip was reached at which point some flaking of the painton the web was observed indi cating web bending. Despite some bending sudden lateralbuckling was no observed. The load then dropped due to crushing of the post (Fig. 2-46).With n o latera l r estraints this beam esse ntially per formed the sa me a s the equiv alentrestrained beam (Beam 20).
1473TPBSCNRE0 - Beam 30
24

This beam was the same as the previous except blocking was placed between the flanges.As a result it was expected that the load would be greater than in the previous beam,potentially inducing buckling in the beam. However, due to an apparently weak post, thefailure load for this beam was calculated at 275 kip, less than for the previous experiment.After initial crushing of the post, the failure load was maintained and increased slightly upto a maximum of 300 kip at a lar ge deformation until eventually dropping, as shown inFigure 2-47. No web deformation was observed.
1473TPNBSCNRE6 - Beam 31
The load was applied eccentrically to this unstiffened beam through a timber post. Theload increased up to a calculated failure lo ad of 332 kip, around when the post failed, asshown in Figure 2-48. After the maximum load of 340 kip wa s reached web yielding wasobserved due to the orientation of the failed post fragments. It also resulted in some flangebending. The force-displacement curve is shown in Figure 2-49.
1473TPBSCNRE6 - Beam 32
In this experiment the eccentrically loaded beam was also blocked. The failure load in thisbeam was again much less than expected due to another relatively weak post. The failureload was calculated at 190 kip. The maxi mum load was reached at 195 kip. Flangebending and post crushing were observed, but no web bending was seen until the postbecame more heavily damaged and the load wa s redistributed into the side of the flange(Fig. 2-50).
1490TPNBSCNRE0 - Beam 26
Although heavier than the previous four beams, this beam had a thinner web and thickerflange, therefore was more susceptible to lateral buckling of the web. The failure load wascalculated to be 276 kip when there was a reduction in stiffness, although this appeared tobe somewhat premature. Th e maximum load was reached at 310 kip at which point thepost-flange suddenly deformed laterally through buckling of the web. This can be seenfrom the sudden drop in load in Figure 2-51. The deformed shape of this beam is shown inFigure 2-52. No bending in the flange was observed during the experiment.
1490TPBSCNRE0 - Beam 28
This beam had the sa me co nfiguration as the last but included blocking between theflanges. As a result, buckli ng was not observed in this be am and failure occurred due toflange bending and post crushing at a load of 360 kip. The maximum force was reached at420 kip. There was no buckling of the beam indicating that bl ocking may have beeneffective at increased the buckling capacity. As there was no buckling, Figure 2-53 showsthat there was no sudden drop in load after failure as observed in the previous beam.
25
1490NPNBNCNRE0 - Beam 5
This beam was similar to the Beam 27 excep t that the load was applied though a rigidpatch load instead of the fle xible timber post. Despite being rigi d the patch load had asmall allowance for lateral deformation through tolerances in the slider. As a result lateralbuckling was also observed in this beam. The failure load was calculated at 320 kip, closeto the maximum load of 330 kip. In this beam the load di d not drop as in the previousbeam as the lateral deformati on of the post was limited and thus did not allow a lateraldeformation that resulted in a lar ge reduction in the load. The force displacement curvefor this beam is shown in Figure 2-54. This beam shows that the lateral buckling was notjust limited to timber posts but is possible for other types of posts.
Summary
This section showed that the HP14x73 beams wi th thicker webs were not susceptible tolateral buckling, however the W14x90 beams with thinner webs were susceptible when nolateral bracing or stiffeners are used in falsework beams. The buckled mechanism is suchthat the e ntire le ngth of th e beam tends to deflect side ways unlike lateral torsionalbuckling in beams where part of the beam may buckle between braces through torsional aswell as the lateral deformation of the flange. This limit state, where a long portion of thebeam deflects laterally through buckling of the web is similar to that observed infalsework failure shown in Figur e 1-4, therefore is a realistic limit s tate. Comparison ofBeams 27 and 28 indicated that blocking was ef fective at re ducing the propensity of abeam to buckle laterally . How ever, with li mited data it is dif ficult to make conclusionsabout the ef fectiveness of blocking. As there is no positive c onnection between theblocking and the flanges, unlike with a welded stiffener or bracing, the effectiveness of theblocking is questionable. Consequently, bracing or stiffeners are recommended for beamsthat are susceptible to buckling.
2.6 Comparison of Failure Load with Load where Flaking is Observed
For each of the beams, the observed load when flaking occu rred on the beam flange, withflaking typically located initially at the edge of the fillet between the flange and web underthe post is compared with the failure load ba sed on the change in stif fness as previouslydefined. Figure 2-55 shows a comparison of the observed flaking load with the calculatedfailure load for the beams whic h fa iled due to post-flange bend ing and timber postcrushing. The vertical axis ha s the observed load divided by the calculated failure load,while the horizontal axis gives the calculated failure load. The different series representdifferent configurations, with and without blocking and with different eccentricities. Thedifferent points in each series represent the dif ferent s ize be ams. W ith the steel posts,flaking was not observed in the beams until af ter the posts had already yielded and, thus,
26

FIGURE 2-14 Actuator force vs slider displacement for 1253TPNBSCRE0 - Beam 18
FIGURE 2-15 Flange bending and post deformation observed during loading of 1253TPNBSCRE0 - Beam 18
0
50
100
150
200
250
300
350
400
0 0.2 0.4 0.6 0.8 1
Displacement (in)
Act
uato
r For
ce (k
ip)
0
225
450
675
900
1125
1350
1575
18000 5 10 15 20 25
Displacement (mm)
Act
uato
r For
ce (k
N)
27

FIGURE 2-16 Strain gages on beam close to where flaking of lime paint is first observed
FIGURE 2-17 Actuator force vs strain in two strain gages located close to the yield line location in 1253TPNBSCRE0 - Beam 18
0
50
100
150
200
250
300
350
400
-10000 -8000 -6000 -4000 -2000 0 2000 4000 6000 8000 10000
Strain (microstrain)
Act
uato
r For
ce (k
ip)
0
225
450
675
900
1125
1350
1575
1800-1 -0.8 -0.6 -0.4 -0.2 0 0.2 0.4 0.6 0.8 1
Strain (%)
Act
uato
r For
ce (k
N)
Strain Gage 1Strain Gage 2
28

FIGURE 2-18 Actuator force vs slider displacement for 1253TPBSCRE0 - Beam 19
FIGURE 2-19 Actuator force vs slider displacement for 1253TPNBSCRE12 - Beam 16
0
50
100
150
200
250
300
350
400
0 0.2 0.4 0.6 0.8 1
Displacement (in)
Act
uato
r For
ce (k
ip)
0
225
450
675
900
1125
1350
1575
18000 5 10 15 20 25
Displacement (mm)
Act
uato
r For
ce (k
N)
0
50
100
150
200
250
300
350
400
0 0.2 0.4 0.6 0.8 1
Displacement (in)
Act
uato
r For
ce (k
ip)
0
225
450
675
900
1125
1350
1575
18000 5 10 15 20 25
Displacement (mm)
Act
uato
r For
ce (k
N)
29

FIGURE 2-20 Actuator force vs slider displacement for 1253TPBSCRE12 - Beam 17
FIGURE 2-21 Actuator force vs slider displacement for 1253TPNBSCRE6 - Beam 14
0
50
100
150
200
250
300
350
400
0 0.2 0.4 0.6 0.8 1
Displacement (in)
Act
uato
r For
ce (k
ip)
0
225
450
675
900
1125
1350
1575
18000 5 10 15 20 25
Displacement (mm)
Act
uato
r For
ce (k
N)
0
50
100
150
200
250
300
350
400
0 0.2 0.4 0.6 0.8 1
Displacement (in)
Act
uato
r For
ce (k
ip)
0
225
450
675
900
1125
1350
1575
18000 5 10 15 20 25
Displacement (mm)
Act
uato
r For
ce (k
N)
30

FIGURE 2-22 Actuator force vs strain in four strain gages located close to the yield line locations in 1253TPNBSCRE6 - Beam 14
FIGURE 2-23 Actuator force vs slider displacement for 1253TPBSCRE6 - Beam 15
0
50
100
150
200
250
300
350
400
-10000 -8000 -6000 -4000 -2000 0 2000 4000 6000 8000 10000
Strain (microstrain)
Act
uato
r For
ce (k
ip)
0
225
450
675
900
1125
1350
1575
1800-1 -0.8 -0.6 -0.4 -0.2 0 0.2 0.4 0.6 0.8 1
Strain (%)
Act
uato
r For
ce (k
N)
Top Flange Strain Gauge 1Top Flange Strain Gauge 2Top Flange Strain Gauge 3Top Flange Strain Gauge 4
0
50
100
150
200
250
300
350
400
0 0.1 0.2 0.3 0.4 0.5 0.6 0.7 0.8 0.9 1
Displacement (in)
Act
uato
r For
ce (k
ip)
0
225
450
675
900
1125
1350
1575
18000 5 10 15 20 25
Displacement (mm)
Act
uato
r For
ce (k
N)
31

FIGURE 2-24 Actuator force vs slider displacement for 1473TPNBSCRE0 - Beam 20
FIGURE 2-25 Actuator force vs slider displacement for 1473TPBSCRE0 - Beam 21
0
50
100
150
200
250
300
350
400
0 0.2 0.4 0.6 0.8 1
Displacement (in)
Act
uato
r For
ce (k
ip)
0
225
450
675
900
1125
1350
1575
18000 5 10 15 20 25
Displacement (mm)
Act
uato
r For
ce (k
N)
0
50
100
150
200
250
300
350
400
0 0.2 0.4 0.6 0.8 1
Displacement (in)
Act
uato
r For
ce (k
ip)
0
225
450
675
900
1125
1350
1575
18000 5 10 15 20 25
Displacement (mm)
Act
uato
r For
ce (k
N)
32

FIGURE 2-26 Actuator force vs slider displacement for 1473TPNBSCRE6 - Beam 27
FIGURE 2-27 Actuator force vs slider displacement for 1473TPBSCRE0 - Beam 25
0
50
100
150
200
250
300
350
400
0 0.2 0.4 0.6 0.8 1
Displacement (in)
Act
uato
r For
ce (k
ip)
0
225
450
675
900
1125
1350
1575
18000 5 10 15 20 25
Displacement (mm)
Act
uato
r For
ce (k
N)
0
50
100
150
200
250
300
350
400
0 0.2 0.4 0.6 0.8 1
Displacement (in)
Act
uato
r For
ce (k
ip)
0
225
450
675
900
1125
1350
1575
18000 5 10 15 20 25
Displacement (mm)
Act
uato
r For
ce (k
N)Yield Force
33

FIGURE 2-28 Actuator force vs slider displacement for 1490TPNBSCRE0 - Beam 22
FIGURE 2-29 Actuator force vs slider displacement for 1490TPBSCRE0 - Beam 23
0
50
100
150
200
250
300
350
400
0.0 0.2 0.4 0.6 0.8 1.0
Displacement (in)
Act
uato
r For
ce (k
ip)
0
225
450
675
900
1125
1350
1575
18000 5 10 15 20 25
Displacement (mm)
Act
uato
r For
ce (k
N)
0
50
100
150
200
250
300
350
400
0 0.2 0.4 0.6 0.8 1
Displacement (in)
Act
uato
r For
ce (k
ip)
0
225
450
675
900
1125
1350
1575
18000 5 10 15 20 25
Displacement (mm)
Act
uato
r For
ce (k
N)
34
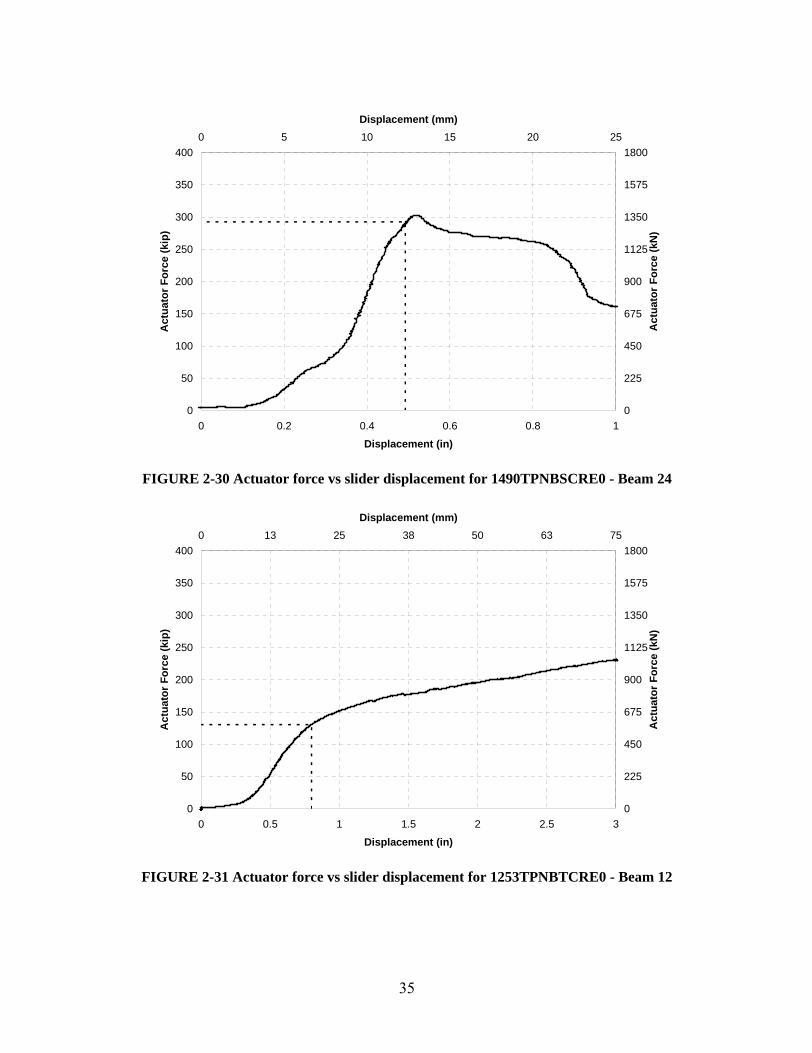
FIGURE 2-30 Actuator force vs slider displacement for 1490TPNBSCRE0 - Beam 24
FIGURE 2-31 Actuator force vs slider displacement for 1253TPNBTCRE0 - Beam 12
0
50
100
150
200
250
300
350
400
0 0.2 0.4 0.6 0.8 1
Displacement (in)
Act
uato
r For
ce (k
ip)
0
225
450
675
900
1125
1350
1575
18000 5 10 15 20 25
Displacement (mm)
Act
uato
r For
ce (k
N)
0
50
100
150
200
250
300
350
400
0 0.5 1 1.5 2 2.5 3
Displacement (in)
Act
uato
r For
ce (k
ip)
0
225
450
675
900
1125
1350
1575
18000 13 25 38 50 63 75
Displacement (mm)
Act
uato
r For
ce (k
N)
35
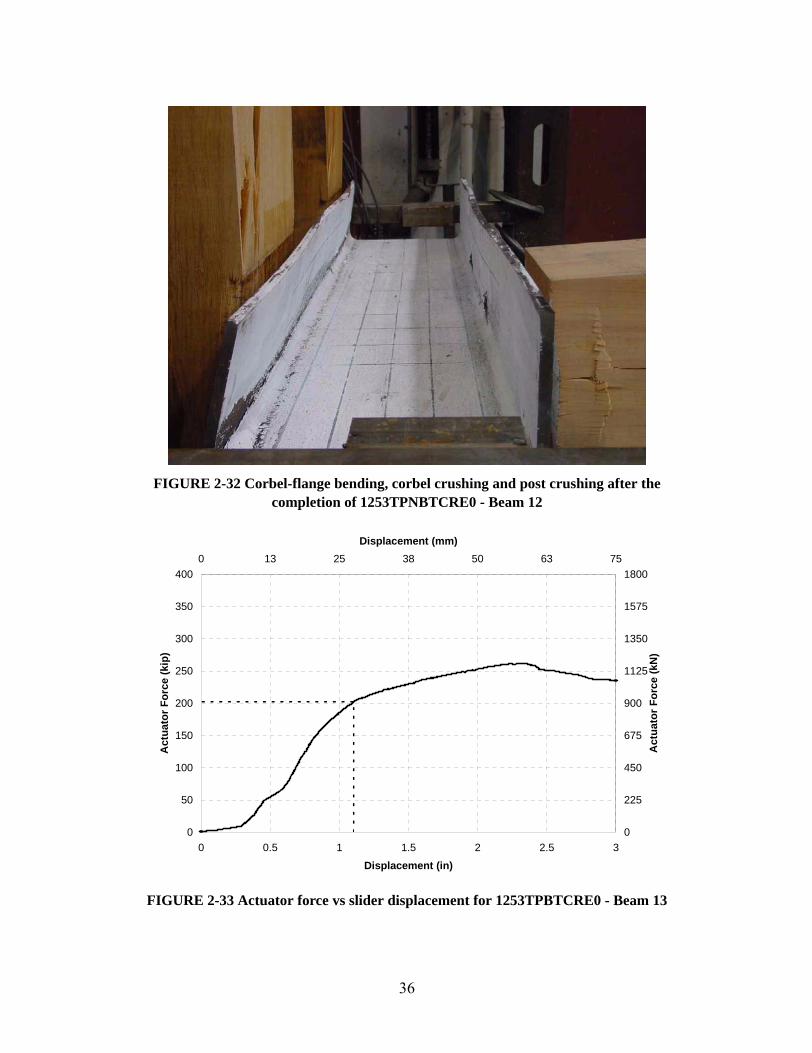
FIGURE 2-32 Corbel-flange bending, corbel crushing and post crushing after the completion of 1253TPNBTCRE0 - Beam 12
FIGURE 2-33 Actuator force vs slider displacement for 1253TPBTCRE0 - Beam 13
0
50
100
150
200
250
300
350
400
0 0.5 1 1.5 2 2.5 3
Displacement (in)
Act
uato
r For
ce (k
ip)
0
225
450
675
900
1125
1350
1575
18000 13 25 38 50 63 75
Displacement (mm)
Act
uato
r For
ce (k
N)
36

FIGURE 2-34 Actuator force vs slider displacement for 1490TPNBTCRE0 - Beam 1
FIGURE 2-35 Actuator force vs slider displacement for 1490TPNBTCRE6 - Beam 4
0
50
100
150
200
250
300
350
400
0 0.5 1 1.5 2 2.5 3
Displacement (in)
Act
uato
r For
ce (k
ip)
0
225
450
675
900
1125
1350
1575
18000 13 25 38 50 63 75
Displacement (mm)
Act
uato
r For
ce (k
N)
0
50
100
150
200
250
300
350
400
0 0.5 1 1.5 2 2.5 3
Displacement (in)
Act
uato
r For
ce (k
ip)
0
225
450
675
900
1125
1350
1575
18000 13 25 38 50 63 75
Displacement (mm)
Act
uato
r For
ce (k
N)
37

FIGURE 2-36 Actuator force vs slider displacement for 1490SPNBTCRE0 - Beam 2
FIGURE 2-37 Onset of yielding and buckling in the steel post for 1490SPNBTCRE0 - Beam 2
0
100
200
300
400
500
600
0 0.5 1 1.5 2 2.5 3 3.5 4 4.5 5
Displacement (in)
Act
uato
r For
ce (k
ip)
0
450
900
1350
1800
2250
27000 13 25 38 50 63 75 88 100 113 125
Displacement (mm)
Act
uato
r For
ce (k
N)
38

FIGURE 2-38 Actuator force vs slider displacement for 1490SPNBTCRE6 - Beam 3
FIGURE 2-39 Actuator force vs slider displacement for 1253NPNBNCRE0 - Beam 10
0
100
200
300
400
500
600
0 0.5 1 1.5 2 2.5 3 3.5 4 4.5 5
Displacement (in)
Act
uato
r For
ce (k
ip)
0
450
900
1350
1800
2250
27000 13 25 38 50 63 75 88 100 113 125
Displacement (mm)
Act
uato
r For
ce (k
N)
0
100
200
300
400
500
600
0 0.2 0.4 0.6 0.8 1
Displacement (in)
Act
uato
r For
ce (k
ip)
0
450
900
1350
1800
2250
27000 5 10 15 20 25
Displacement (mm)
Act
uato
r For
ce (k
N)
39
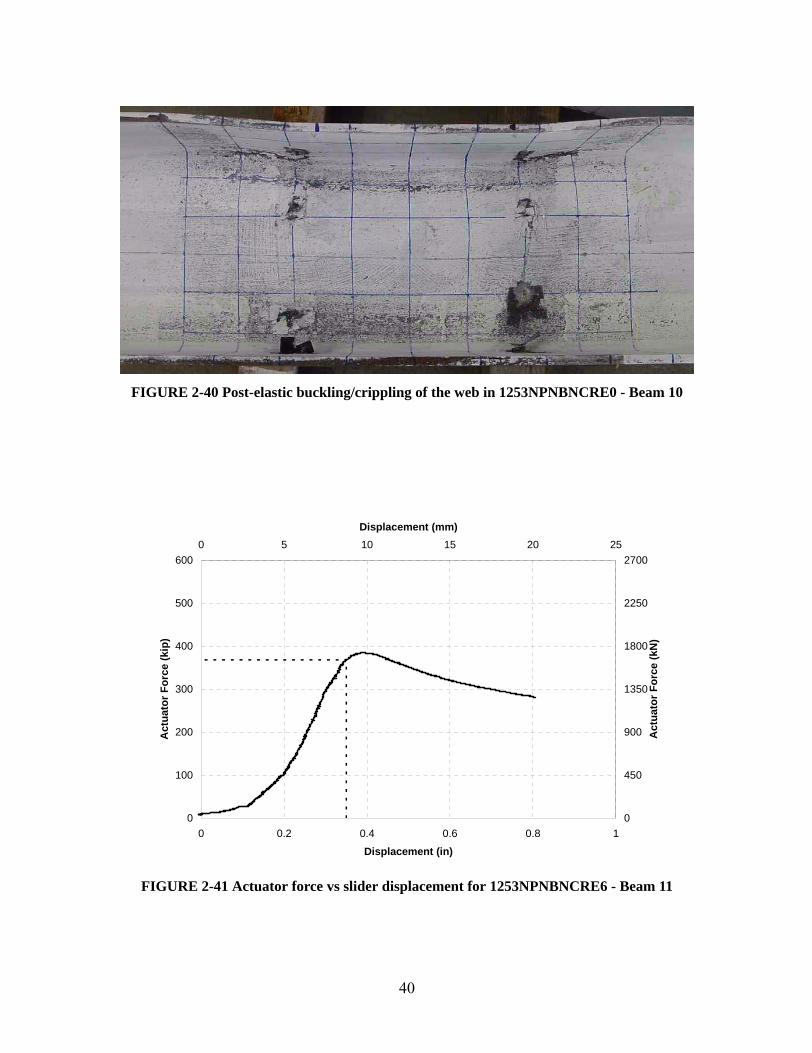
FIGURE 2-40 Post-elastic buckling/crippling of the web in 1253NPNBNCRE0 - Beam 10
FIGURE 2-41 Actuator force vs slider displacement for 1253NPNBNCRE6 - Beam 11
0
100
200
300
400
500
600
0 0.2 0.4 0.6 0.8 1
Displacement (in)
Act
uato
r For
ce (k
ip)
0
450
900
1350
1800
2250
27000 5 10 15 20 25
Displacement (mm)
Act
uato
r For
ce (k
N)
40

FIGURE 2-42 Actuator force vs slider displacement for 1473NPNBNCRE0 - Beam 9
FIGURE 2-43 Actuator force vs slider displacement for 1473NPNBNCRE6 - Beam 8
0
100
200
300
400
500
600
0 0.2 0.4 0.6 0.8 1
Displacement (in)
Act
uato
r For
ce (k
ip)
0
450
900
1350
1800
2250
27000 5 10 15 20 25
Displacement (mm)
Act
uato
r For
ce (k
N)
0
100
200
300
400
500
600
0 0.2 0.4 0.6 0.8 1
Displacement (in)
Act
uato
r For
ce (k
ip)
0
450
900
1350
1800
2250
27000 5 10 15 20 25
Displacement (mm)
Act
uato
r For
ce (k
N)
41

FIGURE 2-44 Actuator force vs slider displacement for 1490NPNBNCRE0 - Beam 6
FIGURE 2-45 Actuator force vs slider displacement for 1490NPNBNCRE6 - Beam 7
0
100
200
300
400
500
600
0.0 0.2 0.4 0.6 0.8 1.0
Displacement (in)
Act
uato
r For
ce (k
ip)
0
450
900
1350
1800
2250
27000 5 10 15 20 25
Displacement (mm)
Act
uato
r For
ce (k
N)
0
100
200
300
400
500
600
0 0.2 0.4 0.6 0.8 1
Displacement (in)
Act
uato
r For
ce (k
ip)
0
450
900
1350
1800
2250
27000 5 10 15 20 25
Displacement (mm)
Act
uato
r For
ce (k
N)
42

FIGURE 2-46 Actuator force vs slider displacement for 1473TPNBNCNRE0 - Beam 29
FIGURE 2-47 Actuator force vs slider displacement for 1473TPBNCNRE0 - Beam 30
0
100
200
300
400
500
0 0.2 0.4 0.6 0.8 1
Displacement (in)
Act
uato
r For
ce (k
ip)
0
450
900
1350
1800
22500 5 10 15 20 25
Displacement (mm)
Act
uato
r For
ce (k
N)
0
100
200
300
400
500
0 0.2 0.4 0.6 0.8 1
Displacement (in)
Act
uato
r For
ce (k
ip)
0
450
900
1350
1800
22500 5 10 15 20 25
Displacement (mm)
Act
uato
r For
ce (k
N)
43
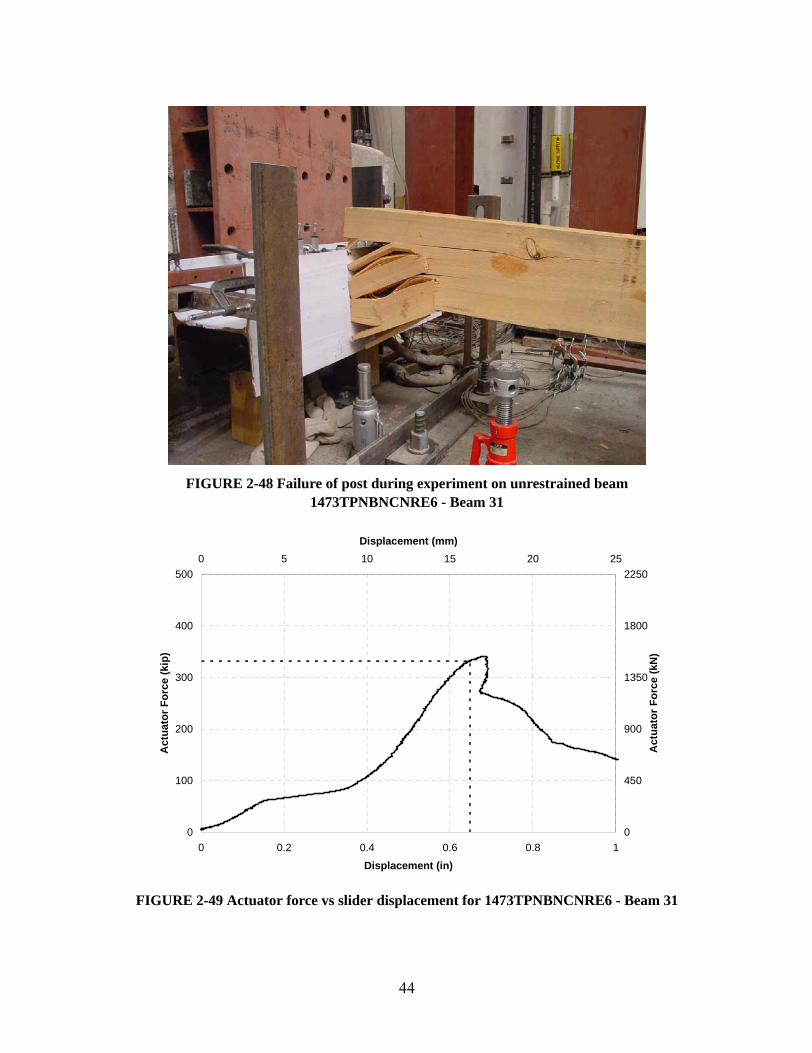
FIGURE 2-48 Failure of post during experiment on unrestrained beam 1473TPNBNCNRE6 - Beam 31
FIGURE 2-49 Actuator force vs slider displacement for 1473TPNBNCNRE6 - Beam 31
0
100
200
300
400
500
0 0.2 0.4 0.6 0.8 1
Displacement (in)
Act
uato
r For
ce (k
ip)
0
450
900
1350
1800
22500 5 10 15 20 25
Displacement (mm)
Act
uato
r For
ce (k
N)
44

FIGURE 2-50 Actuator force vs slider displacement for 1473TPBNCNRE6 - Beam 32
FIGURE 2-51 Actuator force vs slider displacement for 1490TPNBNCNRE0 - Beam 26
0
100
200
300
400
500
0 0.2 0.4 0.6 0.8 1
Displacement (in)
Act
uato
r For
ce (k
ip)
0
450
900
1350
1800
22500 5 10 15 20 25
Displacement (mm)
Act
uato
r For
ce (k
N)
0
100
200
300
400
500
0 0.2 0.4 0.6 0.8 1
Displacement (in)
Act
uato
r For
ce (k
ip)
0
450
900
1350
1800
22500 5 10 15 20 25
Displacement (mm)
Act
uato
r For
ce (k
N)
45
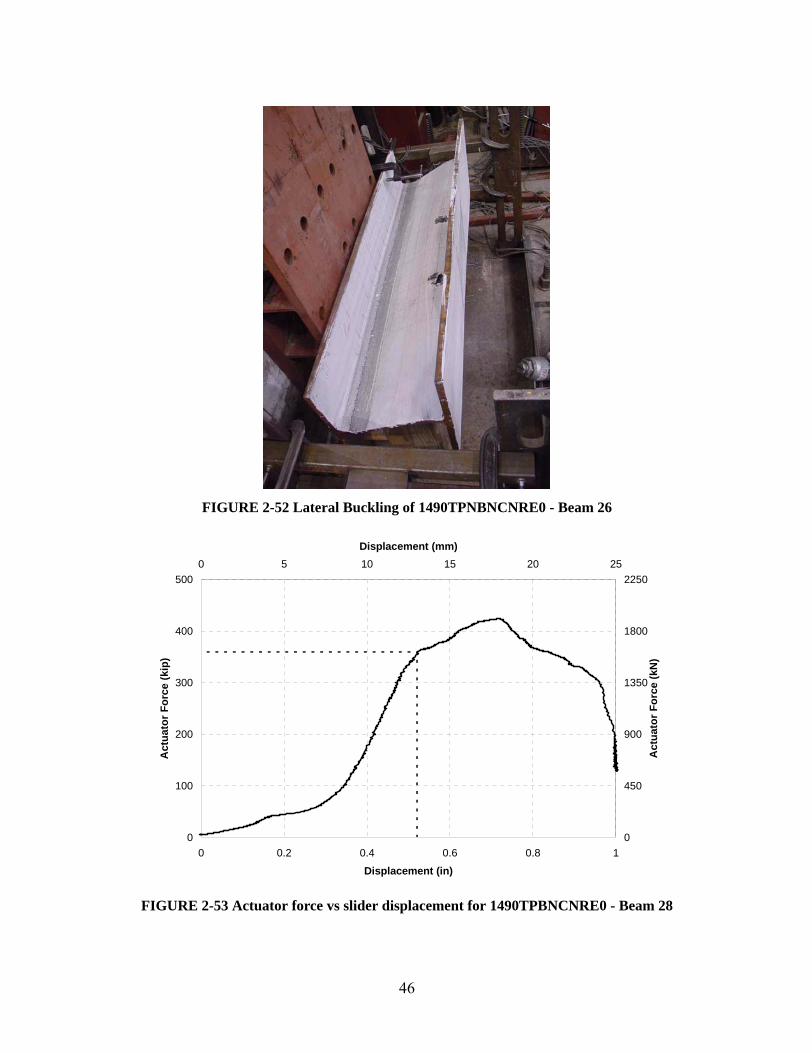
FIGURE 2-52 Lateral Buckling of 1490TPNBNCNRE0 - Beam 26
FIGURE 2-53 Actuator force vs slider displacement for 1490TPBNCNRE0 - Beam 28
0
100
200
300
400
500
0 0.2 0.4 0.6 0.8 1
Displacement (in)
Act
uato
r For
ce (k
ip)
0
450
900
1350
1800
22500 5 10 15 20 25
Displacement (mm)
Act
uato
r For
ce (k
N)
46
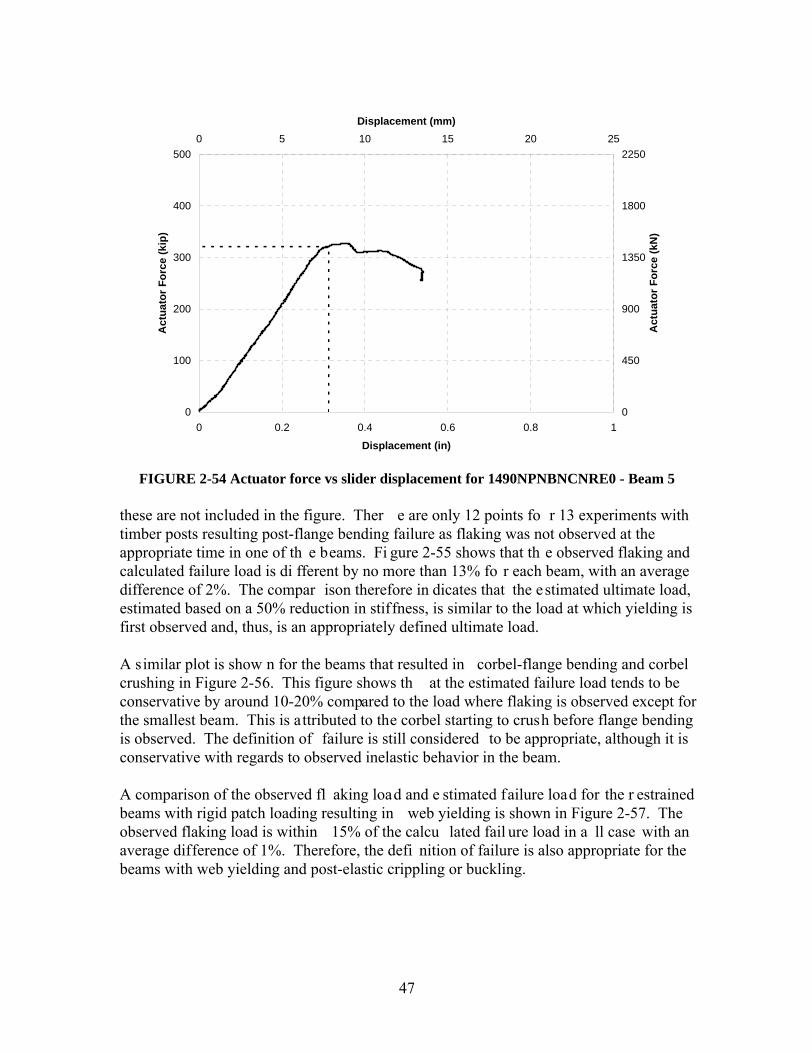
these are not included in the figure. Ther e are only 12 points fo r 13 experiments withtimber posts resulting post-flange bending failure as flaking was not observed at theappropriate time in one of th e beams. Fi gure 2-55 shows that th e observed flaking andcalculated failure load is di fferent by no more than 13% fo r each beam, with an averagedifference of 2%. The compar ison therefore in dicates that the estimated ultimate load,estimated based on a 50% reduction in stiffness, is similar to the load at which yielding isfirst observed and, thus, is an appropriately defined ultimate load.
A similar plot is show n for the beams that resulted in corbel-flange bending and corbelcrushing in Figure 2-56. This figure shows th at the estimated failure load tends to beconservative by around 10-20% compared to the load where flaking is observed except forthe smallest beam. This is attributed to the corbel starting to crush before flange bendingis observed. The definition of failure is still considered to be appropriate, although it isconservative with regards to observed inelastic behavior in the beam.
A comparison of the observed fl aking load and e stimated failure load for the r estrainedbeams with rigid patch loading resulting in web yielding is shown in Figure 2-57. Theobserved flaking load is within 15% of the calcu lated fail ure load in a ll case with anaverage difference of 1%. Therefore, the defi nition of failure is also appropriate for thebeams with web yielding and post-elastic crippling or buckling.
FIGURE 2-54 Actuator force vs slider displacement for 1490NPNBNCNRE0 - Beam 5
0
100
200
300
400
500
0 0.2 0.4 0.6 0.8 1
Displacement (in)
Act
uato
r For
ce (k
ip)
0
450
900
1350
1800
22500 5 10 15 20 25
Displacement (mm)
Act
uato
r For
ce (k
N)
47
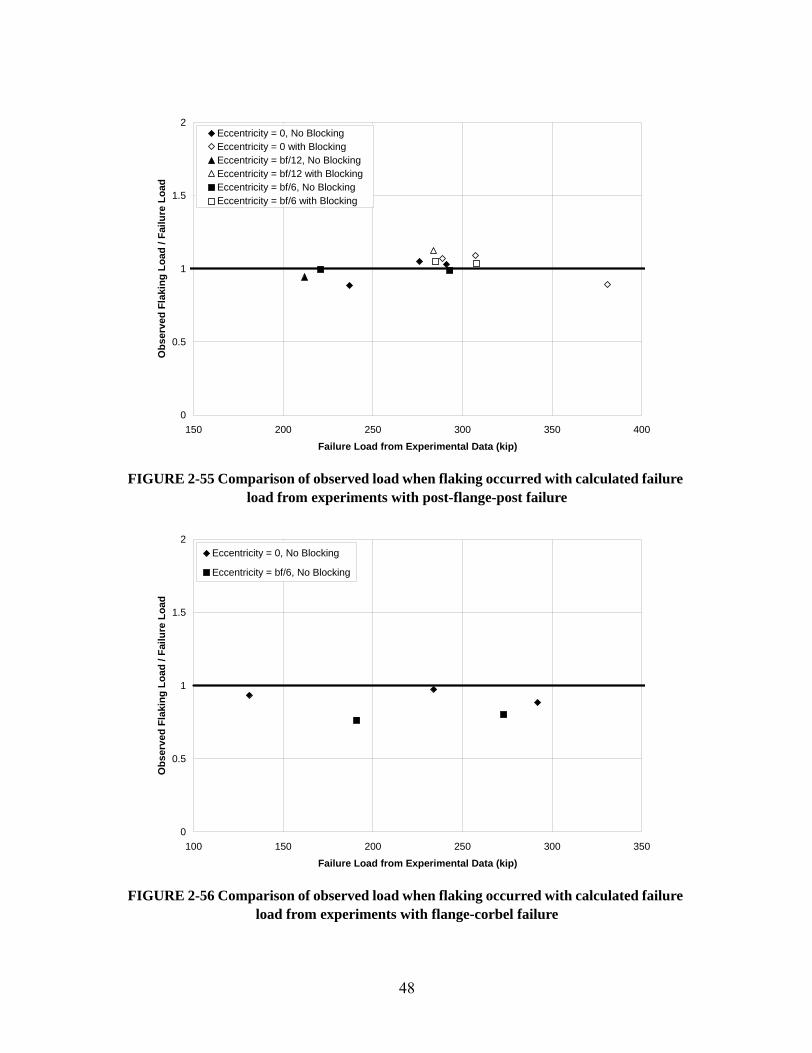
FIGURE 2-55 Comparison of observed load when flaking occurred with calculated failure load from experiments with post-flange-post failure
FIGURE 2-56 Comparison of observed load when flaking occurred with calculated failure load from experiments with flange-corbel failure
0
0.5
1
1.5
2
150 200 250 300 350 400
Failure Load from Experimental Data (kip)
Obs
erve
d Fl
akin
g Lo
ad /
Failu
re L
oad
Eccentricity = 0, No BlockingEccentricity = 0 with BlockingEccentricity = bf/12, No BlockingEccentricity = bf/12 with BlockingEccentricity = bf/6, No BlockingEccentricity = bf/6 with Blocking
0
0.5
1
1.5
2
100 150 200 250 300 350
Failure Load from Experimental Data (kip)
Obs
erve
d Fl
akin
g Lo
ad /
Failu
re L
oad
Eccentricity = 0, No Blocking
Eccentricity = bf/6, No Blocking
48

FIGURE 2-57 Comparison of observed load when flaking occurred with calculated failure load from experiments with web yielding failure
0
0.5
1
1.5
2
100 200 300 400 500 600 700
P from Experimental Data (kip)
P fr
om F
inite
Ele
men
t / P
Exp
erim
enta
l
Eccentricity = 0, No Blocking
Eccentricity = bf/6, No Blocking
49

50
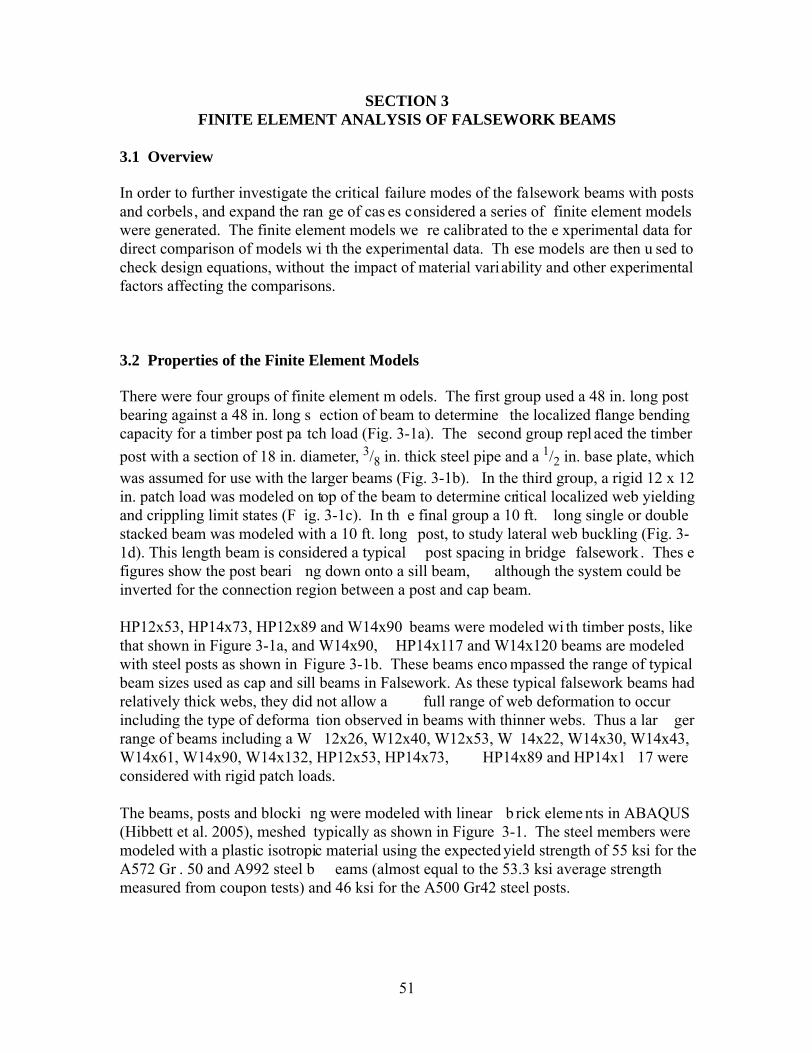
SECTION 3FINITE ELEMENT ANALYSIS OF FALSEWORK BEAMS
3.1 Overview
In order to further investigate the critical failure modes of the falsework beams with postsand corbels, and expand the ran ge of cas es considered a series of finite element modelswere generated. The finite element models we re calibrated to the e xperimental data fordirect comparison of models wi th the experimental data. Th ese models are then u sed tocheck design equations, without the impact of material variability and other experimentalfactors affecting the comparisons.
3.2 Properties of the Finite Element Models
There were four groups of finite element m odels. The first group used a 48 in. long postbearing against a 48 in. long s ection of beam to determine the localized flange bendingcapacity for a timber post pa tch load (Fig. 3-1a). The second group repl aced the timberpost with a section of 18 in. diameter, 3/8 in. thick steel pipe and a 1/2 in. base plate, whichwas assumed for use with the larger beams (Fig. 3-1b). In the third group, a rigid 12 x 12in. patch load was modeled on top of the beam to determine critical localized web yieldingand crippling limit states (F ig. 3-1c). In th e final group a 10 ft. long single or doublestacked beam was modeled with a 10 ft. long post, to study lateral web buckling (Fig. 3-1d). This length beam is considered a typical post spacing in bridge falsework . Thes efigures show the post beari ng down onto a sill beam, although the system could beinverted for the connection region between a post and cap beam.
HP12x53, HP14x73, HP12x89 and W14x90 beams were modeled wi th timber posts, likethat shown in Figure 3-1a, and W14x90, HP14x117 and W14x120 beams are modeledwith steel posts as shown in Figure 3-1b. These beams enco mpassed the range of typicalbeam sizes used as cap and sill beams in Falsework. As these typical falsework beams hadrelatively thick webs, they did not allow a full range of web deformation to occurincluding the type of deforma tion observed in beams with thinner webs. Thus a lar gerrange of beams including a W 12x26, W12x40, W12x53, W 14x22, W14x30, W14x43,W14x61, W14x90, W14x132, HP12x53, HP14x73, HP14x89 and HP14x1 17 wereconsidered with rigid patch loads.
The beams, posts and blocki ng were modeled with linear b rick eleme nts in ABAQUS(Hibbett et al. 2005), meshed typically as shown in Figure 3-1. The steel members weremodeled with a plastic isotropic material using the expected yield strength of 55 ksi for theA572 Gr . 50 and A992 steel b eams (almost equal to the 53.3 ksi average strengthmeasured from coupon tests) and 46 ksi for the A500 Gr42 steel posts.
51

From the component experiments on Posts 1 and 2 for the 1 1.5 in. square Douglas Firtimber posts, the average calculated nominal post strength was 2.7 ksi. This was assumedas the yield stress in the fi nite element model and, in orde r to fit the force displacementcurve, this was increased linearly by 20% up to 2 times the yield strain before beinggradually reducing to zero at a strain of 10% to reflect the reduction in strength due tocrushing. The elastic modulus was assumed to be 550 ksi, based on the average measuredstiffness from experiments. On ly posts 1 and 2 were used to calibrate the finite element
FIGURE 3-1 Finite element models for a) a timber post and beam, b) a steel post and beam, c) a beam with a rigid patch load and d) long double stacked beam and post
52

models as Post 3 was considered atypical of the posts used during the sub-assemblyexperiments. A finite element model of a timber post similar to that shown in Figure 3-1a,but without any beams or other elements was used to compare with the experimental data.The resulting force displacement curve for the post is shown, along with the experimentaldata for Posts 1 and 2, in Figur e 3-2. The stif fness and failure load is shown to comparewell to the experimental data.
The 7.5 x 5.5 in. blocking elements were modeled with a 4.0 ksi yield stress and a 330 ksielastic modulus, based on an average of the three component experiments. After yieldingit was assumed the stress woul d drop to zero at a strain of 10%. The resulting force-displacement curve for the blocking is shown in Figure 3-3 co mpared to the experiments.It is shown to approximate an average response for the three blocks.
The 11.5 in. square corbels were modeled with and elasto-plastic model having an elasticmodulus of 11 ksi and a yield stress of 0.39 ksi. The yield stress was determined from amodified bearing area and is different from the ultima te bearing strength for the co rbelsused in Section 4, but results in a better corr elation with the finite element analysis . Theresulting force displacement curve from a fini te element model of the corbel compared tothe component experiment is shown in Figure 3-4 for a 15 in. long rigid patch load on thecorbel, similar to that used in the corbel experiment. The experimental data matches theinitial stiffness yield and post-yield stiffness of the finite element model.
FIGURE 3-2 Force-displacement curve for a finite element model of a timber post compared to the experimental data
0
50
100
150
200
250
300
350
400
450
500
0 0.5 1 1.5 2 2.5 3
Displacement (in)
Act
uato
r For
ce (k
ip)
0
225
450
675
900
1125
1350
1575
18000 13 25 38 50 63 75
Displacement (mm)
Act
uato
r For
ce (k
N)
Experimental Data Post 1Experimental Data Post 2Finite Element
53

FIGURE 3-3 Force-displacement curve for a finite element model of a timber block compared to the experimental data
FIGURE 3-4 Force-displacement curve for a finite element model of a timber corbel compared to the component experimental
0
50
100
150
200
250
0 0.2 0.4 0.6 0.8 1
Displacement (in)
Act
uato
r For
ce (k
ip)
0
225
450
675
900
11250 5 10 15 20 25
Displacement (mm)
Act
uato
r For
ce (k
N)
Block 1Block 3Block 2Finite Element
0
20
40
60
80
100
120
140
160
180
200
0 0.5 1 1.5 2 2.5 3
Displacement (in)
Act
uato
r For
ce (k
ip)
0
89
178
267
356
445
534
623
712
801
8900 13 25 38 50 63 75
Displacement (mm)
Act
uato
r For
ce (k
N)
ExperimentFinite Element
54
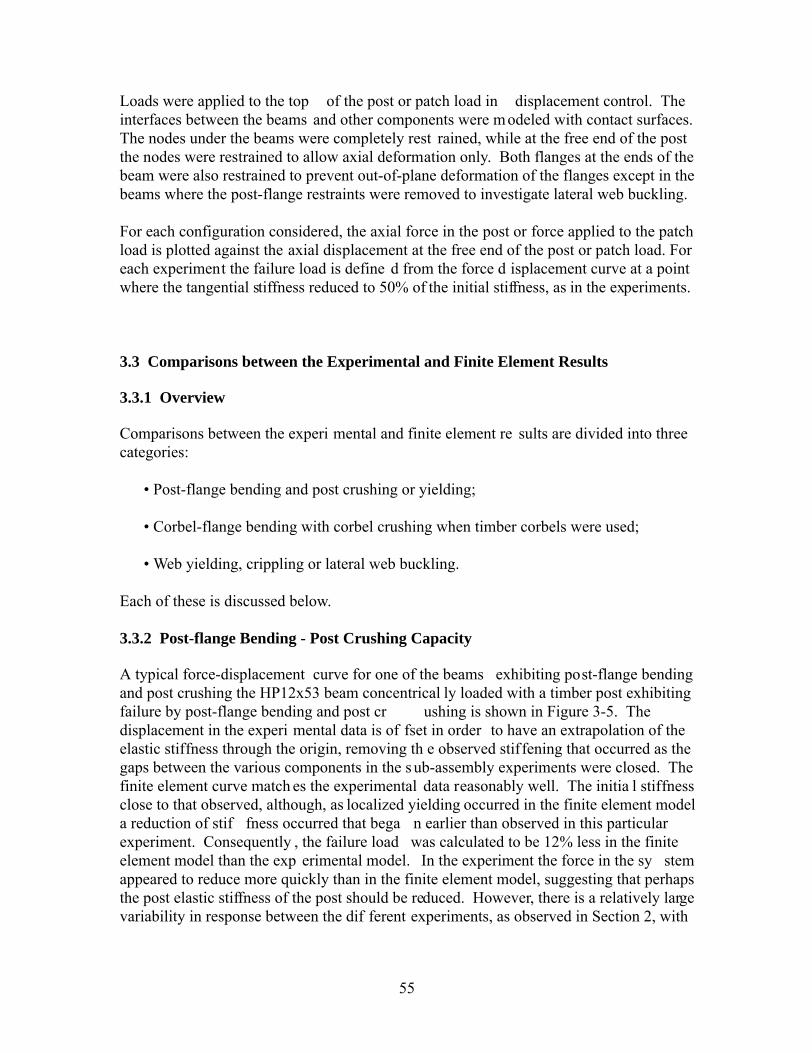
Loads were applied to the top of the post or patch load in displacement control. Theinterfaces between the beams and other components were modeled with contact surfaces.The nodes under the beams were completely rest rained, while at the free end of the postthe nodes were restrained to allow axial deformation only. Both flanges at the ends of thebeam were also restrained to prevent out-of-plane deformation of the flanges except in thebeams where the post-flange restraints were removed to investigate lateral web buckling.
For each configuration considered, the axial force in the post or force applied to the patchload is plotted against the axial displacement at the free end of the post or patch load. Foreach experiment the failure load is define d from the force d isplacement curve at a pointwhere the tangential stiffness reduced to 50% of the initial stiffness, as in the experiments.
3.3 Comparisons between the Experimental and Finite Element Results
3.3.1 Overview
Comparisons between the experi mental and finite element re sults are divided into threecategories:
• Post-flange bending and post crushing or yielding;
• Corbel-flange bending with corbel crushing when timber corbels were used;
• Web yielding, crippling or lateral web buckling.
Each of these is discussed below.
3.3.2 Post-flange Bending - Post Crushing Capacity
A typical force-displacement curve for one of the beams exhibiting post-flange bendingand post crushing the HP12x53 beam concentrical ly loaded with a timber post exhibitingfailure by post-flange bending and post cr ushing is shown in Figure 3-5. Thedisplacement in the experi mental data is of fset in order to have an extrapolation of theelastic stiffness through the origin, removing th e observed stiffening that occurred as thegaps between the various components in the s ub-assembly experiments were closed. Thefinite element curve match es the experimental data reasonably well. The initia l stiffnessclose to that observed, although, as localized yielding occurred in the finite element modela reduction of stif fness occurred that bega n earlier than observed in this particularexperiment. Consequently , the failure load was calculated to be 12% less in the finiteelement model than the exp erimental model. In the experiment the force in the sy stemappeared to reduce more quickly than in the finite element model, suggesting that perhapsthe post elastic stiffness of the post should be reduced. However, there is a relatively largevariability in response between the dif ferent experiments, as observed in Section 2, with
55

other experiments exhibited a more gradual post-elastic reduction in forces. Furthermore,the response after calculation of the failure load is of mini mal consequence as the failureload is the critical factor in determining the performance of the various assemblies. Thusthe post-elastic behavior is considered acceptable.
A similar figure is shown fo r the concentrically loaded HP12x53 with blocking betweenthe flanges in Figure 3-6. In this case the failure load from the finite element model is19% greater than the experiment al failure load. This could be attributed to a number offactors, such as the post or blocks in the experiment being stronger than assumed in thefinite e lement model. Despit e this, the finite element res ponse, particularly in initialstiffness, compared reasonably well with the experimental response.
The failure load from the exp eriments is co mpared to the f ailure loa d f rom the finiteelement models in Figure 3-7. The figure s hows that for the dif ferent configurationsexhibiting flange-post failure, the load from the finite el ement analysis is between 76%and 119% of the experimental load, with an average of 96%. It appeared that the strengthof unblocked beams was conservatively pred icted by the finite element model, by anaverage of 14%, while the capacity of the blocked beams was over predicted by anaverage of 7%. This is cons istent with that observed by the force-displacement curve s(Figs. 3-5 and 3-6), suggest ing an over -prediction of th e blocking strength and underprediction of the post and beam strength. This va riability is attribute d pr imarily to thevariability in the capacity of the dif ferent posts and blocking, which is lar gelyunavoidable. Overall, ther e is good correlation between the experimental and finiteelement res ults. The beams wi th steel posts could not be compared directly to theexperimental data as the fa ilure load was dominated by the corbel response in theexperiments. However, the failure loads calculated from the finite element models were ataround the loads where yielding was observed experimentally in the posts.
3.3.3 Corbel-flange Bending - Corbel Crushing
Finite element models for three beams with timber posts and two timber corbels, and twobeams with stee l pos ts and three timber co rbels were compared to the exper imentalresults. A typical force-displacement curve for one of the beams exhibiting corbel-flangebending and corbel crushing when corbels were placed behind the beams is shown inFigure 3-8. This figure, for the con centrically loaded HP12x53 beam, shows goodcorrelation between the finite element analysis and experimental data, after the removal ofinitial stiffening that occurred as the gaps closed between the vari ous components in thesub-assembly. Consequently , the failure load from the finite element model wa scalculated to be within 4% of that from the experiment. Th is is typical of other beamswith corbels, although the finite element model tends to be more conservative for theseother beams.
The failure load from the expe riments for all the be ams with corbe ls is c ompared to thefailure load from the finite element models in Figure 3-9. The figur e shows that for thedifferent configurations exhibi ting flange-corbel failure, the load from the finite element
56
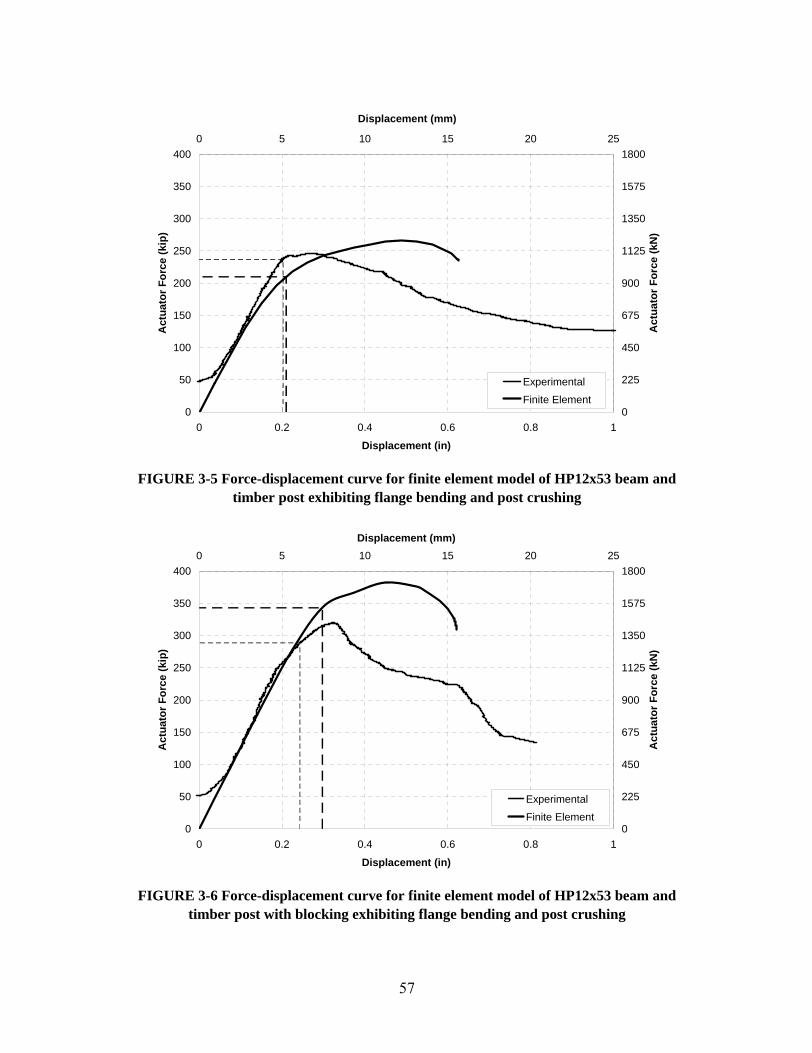
FIGURE 3-5 Force-displacement curve for finite element model of HP12x53 beam and timber post exhibiting flange bending and post crushing
FIGURE 3-6 Force-displacement curve for finite element model of HP12x53 beam and timber post with blocking exhibiting flange bending and post crushing
0
50
100
150
200
250
300
350
400
0 0.2 0.4 0.6 0.8 1
Displacement (in)
Act
uato
r For
ce (k
ip)
0
225
450
675
900
1125
1350
1575
18000 5 10 15 20 25
Displacement (mm)
Act
uato
r For
ce (k
N)
Experimental
Finite Element
0
50
100
150
200
250
300
350
400
0 0.2 0.4 0.6 0.8 1
Displacement (in)
Act
uato
r For
ce (k
ip)
0
225
450
675
900
1125
1350
1575
18000 5 10 15 20 25
Displacement (mm)
Act
uato
r For
ce (k
N)
Experimental
Finite Element
57

analysis is between 76% and 104% of the experime ntal load, with an average of 87%.Thus the models were generally conservativ e, with the variation attributed to thedifference in corbel strengths.
3.3.4 Web Yielding and Lateral Buckling
Finite element models for si x dif ferent beams with rigi d patch loads exhibiting webyielding followed by post-el astic crippling or buckling were compared to theexperiments. The finite el ement and experimental force- displacement curves for theHP12x53 beam with a concentric rigid patch load are comp ared in Figure 3-10. Thiscomparison shows that the shape of the forc e-displacement curves are similar , althoughthe initial stiffness and maximum load reached in the finite element model is much greaterthan measured during experiments. The lower stiffness in the experiments is attributed tothe s lider and patch lo ading ass embly whic h had some fle xibility, that bec omes muchmore apparent in this very ri gid setup. Despite the error in elastic stif fness it does notgreatly affect the yielding of the beam. The calculated failure load from the finite elementmodel is within 5% of that from the experiment. Simi lar observations are made whencomparing the other beams where web yielding occurred.
In addition to the web yieldi ng cases, finite element mode ls with timbe r pos ts andunrestrained post-flanges were developed to simulate lateral buckling for the two W14x90
FIGURE 3-7 Failure load from finite element analysis compared with experimental failure load for beams exhibiting flange-post failure
0
0.5
1
1.5
2
150 200 250 300 350 400
Experimental Failure Load (kip)
Fini
te E
lem
ent F
ailu
re L
oad
/ Exp
erim
enta
l Fai
lure
Loa
d Eccentricity = 0, No BlockingEccentricity = 0 with BlockingEccentricity = bf/12, No BlockingEccentricity = bf/12 with BlockingEccentricity = bf/6, No BlockingEccentricity = bf/6 with Blocking
58

FIGURE 3-8 Force-displacement curve for finite element model of HP12x53 beam with corbels and posts exhibiting corbel-flange bending and corbel crushing
FIGURE 3-9 Failure load from finite element analysis compared with experimental failure load for beams exhibiting flange-corbel failure
0
50
100
150
200
250
300
350
400
0 0.5 1 1.5 2 2.5 3
Displacement (in)
Act
uato
r For
ce (k
ip)
0
225
450
675
900
1125
1350
1575
18000 13 25 38 50 63 75
Displacement (mm)
Act
uato
r For
ce (k
N)
Experimental
Finite Element
0
0.5
1
1.5
2
100 150 200 250 300 350
Experimental Failure Load (kip)
Fini
te E
lem
ent F
ailu
re L
oad
/ Exp
erim
enta
l Fai
lure
Loa
d Eccentricity = 0, No Blocking
Eccentricity = bf/6, No Blocking
59

FIGURE 3-10 Force-displacement curve for the FE model of the HP12x53 beam with a concentric rigid patch load exhibiting web yielding and post-elastic buckling/crippling
FIGURE 3-11 Force-displacement curve for the finite element model of the unrestrained W14x90 beam with a timber post resulting in lateral web buckling
0
50
100
150
200
250
300
350
400
450
500
0 0.2 0.4 0.6 0.8 1
Displacement (in)
Act
uato
r For
ce (k
ip)
0
225
450
675
900
1125
1350
1575
1800
2025
22500 5 10 15 20 25
Displacement (mm)
Act
uato
r For
ce (k
N)
Experimental Data
Finite Element
0
50
100
150
200
250
300
350
400
0 0.2 0.4 0.6 0.8 1
Displacement (in)
Act
uato
r For
ce (k
ip)
0
225
450
675
900
1125
1350
1575
18000 5 10 15 20 25
Displacement (mm)
Act
uato
r For
ce (k
N)
Experimental DataFinite Element
60
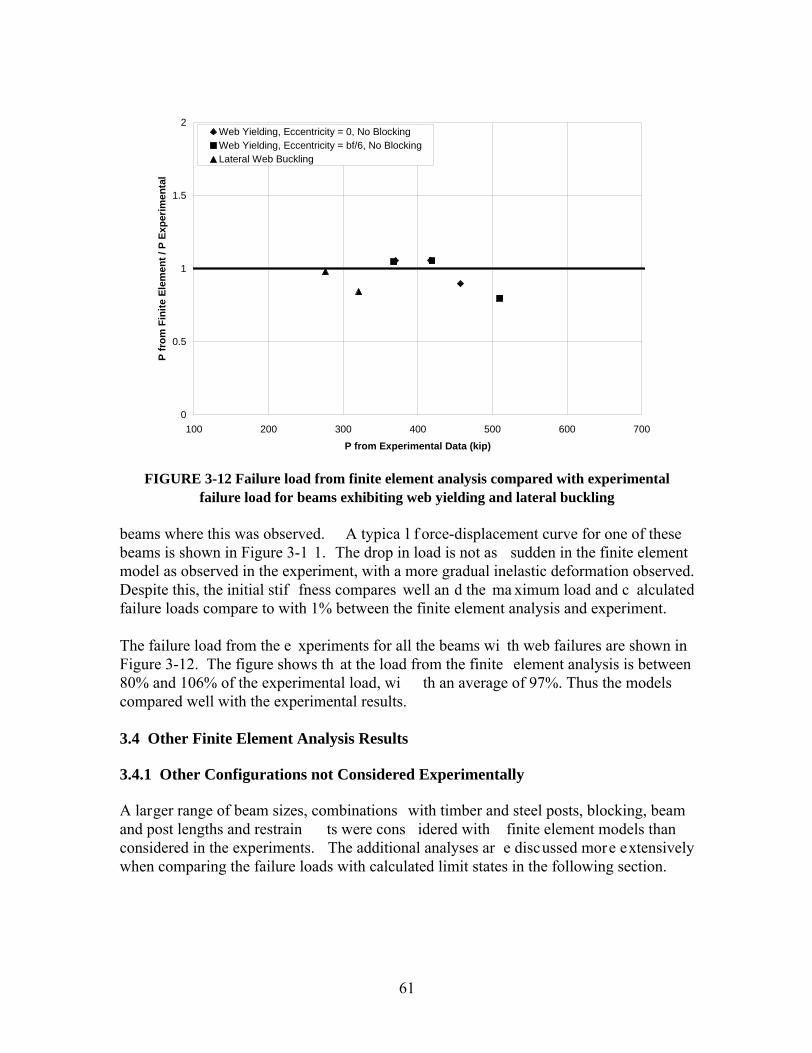
beams where this was observed. A typica l f orce-displacement curve for one of thesebeams is shown in Figure 3-1 1. The drop in load is not as sudden in the finite elementmodel as observed in the experiment, with a more gradual inelastic deformation observed.Despite this, the initial stif fness compares well an d the ma ximum load and c alculatedfailure loads compare to with 1% between the finite element analysis and experiment.
The failure load from the e xperiments for all the beams wi th web failures are shown inFigure 3-12. The figure shows th at the load from the finite element analysis is between80% and 106% of the experimental load, wi th an average of 97%. Thus the modelscompared well with the experimental results.
3.4 Other Finite Element Analysis Results
3.4.1 Other Configurations not Considered Experimentally
A larger range of beam sizes, combinations with timber and steel posts, blocking, beamand post lengths and restrain ts were cons idered with finite element models thanconsidered in the experiments. The additional analyses ar e discussed more extensivelywhen comparing the failure loads with calculated limit states in the following section.
FIGURE 3-12 Failure load from finite element analysis compared with experimental failure load for beams exhibiting web yielding and lateral buckling
0
0.5
1
1.5
2
100 200 300 400 500 600 700
P from Experimental Data (kip)
P fr
om F
inite
Ele
men
t / P
Exp
erim
enta
l
Web Yielding, Eccentricity = 0, No BlockingWeb Yielding, Eccentricity = bf/6, No BlockingLateral Web Buckling
61

3.4.2 Prevention of Lateral Buckling
Lateral torsional buckling cannot be prevente d by adding stif feners to a beam as thetorsional deformation is stil l able to occur . However pure lateral buckling, where thedeformation is due to bending in the web not torsion of the section, can be prevented byusing web stif feners. When stif feners, wi th a th ickness e qual to the thickne ss o f theflange, are added to the beam directly under the post load location, as shown in Figure 3-13, no buckling of the beam is observed. This is due to an increase in the radius ofgyration of the web which can be easily calculated.
Alternatively, lateral bracing could also be used to prevent the lateral buckling of the web.The advantage of using lateral bracing is that it will also prevent any torsional bucklingmodes in the beam, which may be allowed if the top of the beam and bottom of the beamare allowed to rotate due to inadequate stif fness in the supports. This limit state is notconsidered in this study as it requires investigation of a complete system. However, fromthe observed deformation in pa st falsework failures, some deformation of the web isobserved with the beam instab ilities, therefore prevention of the web deformation willprevent instabilities in most cases.
3.4.3 Effect of Eccentricity
The experimental data showed that eccentricity between the centroids of the flange andpost equal to a maximum of 1/6th of the flange width, result ed in some reduction in theflange-post capacity, typicall y around 10-15% when using a ti mber post. W ith a steelpost, each eccentric cas e resulted in an al most iden tical f lange-post c apacity to theconcentric case. To further study the effect of an eccentricity on the failure load, additionalfinite element analyses were performed. T en foot lengt hs of four dif ferent beams weremodelled with 10 ft long posts and dif ferent eccentricities. Th e longer beams and posts
FIGURE 3-13 Finite element model of beam with stiffener to prevent lateral buckling
62

were considered more typical of those in bridge falsework. The calcula ted normalizedfailure load of the beams is plotted with respect to eccentr icity, where the eccentricity isgiven in terms of a multiple of the web thickness, in Figure 3-14. T wo of beams weresmaller than typically used in falsework but were studied in order to determine the effectof eccentricities on beams with more slende r webs where lateral web buckling is thecritical failure mode. The figure shows that for cases which failed though lateral bucklingor flange bending, there wa s around a 17 to 25% reductio n in the capacity at aneccentricity of 6 times the we b thickness. T o ensure that the capacity is redu ced by nomore than 10%, the eccentricity should be limited to 3 times the web thickness. This isconsidered an appropriate maximum limit to be used in design. The re ductions in failureload observed in this figure are consistent with those observed in the experiments.
FIGURE 3-14 Failure load of beams with different eccentricities between the beam and post
0.6
0.7
0.8
0.9
1
0 1 2 3 4 5 6
Eccentricity (x tw)
Failu
re L
oad
/ Fai
lure
Loa
d w
ith N
o Ec
cent
ricity
W14x22W12x26HP12x52HP14x73W14x90
63

64
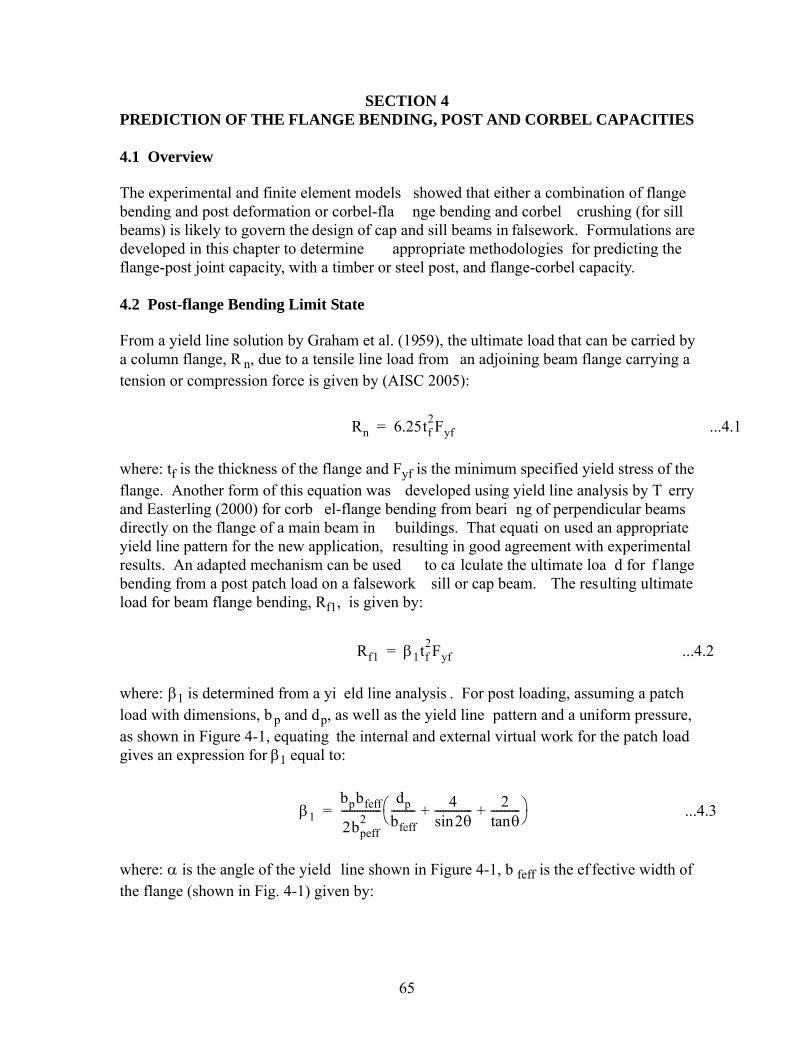
...4.1
3
SECTION 4PREDICTION OF THE FLANGE BENDING, POST AND CORBEL CAPACITIES
4.1 Overview
The experimental and finite element models showed that either a combination of flangebending and post deformation or corbel-fla nge bending and corbel crushing (for sillbeams) is likely to govern the design of cap and sill beams in falsework. Formulations aredeveloped in this chapter to determine appropriate methodologies for predicting theflange-post joint capacity, with a timber or steel post, and flange-corbel capacity.
4.2 Post-flange Bending Limit State
From a yield line solution by Graham et al. (1959), the ultimate load that can be carried bya column flange, R n, due to a tensile line load from an adjoining beam flange carrying atension or compression force is given by (AISC 2005):
where: tf is the thickness of the flange and Fyf is the minimum specified yield stress of theflange. Another form of this equation was developed using yield line analysis by T erryand Easterling (2000) for corb el-flange bending from beari ng of perpendicular beamsdirectly on the flange of a main beam in buildings. That equati on used an appropriateyield line pattern for the new application, resulting in good agreement with experimentalresults. An adapted mechanism can be used to ca lculate the ultimate loa d for f langebending from a post patch load on a falsework sill or cap beam. The resulting ultimateload for beam flange bending, Rf1, is given by:
...4.2
where: β1 is determined from a yi eld line analysis . For post loading, assuming a patchload with dimensions, b p and dp, as well as the yield line pattern and a uniform pressure,as shown in Figure 4-1, equating the internal and external virtual work for the patch loadgives an expression for β1 equal to:
...4.
where: α is the angle of the yield line shown in Figure 4-1, b feff is the ef fective width ofthe flange (shown in Fig. 4-1) given by:
Rn 6.25tf2Fyf=
Rf1 β1tf2Fyf=
β1bpbfeff
2bpeff2
---------------dp
bfeff--------- 4
2θsin-------------- 2
θtan-----------+ +⎝ ⎠
⎛ ⎞=
65
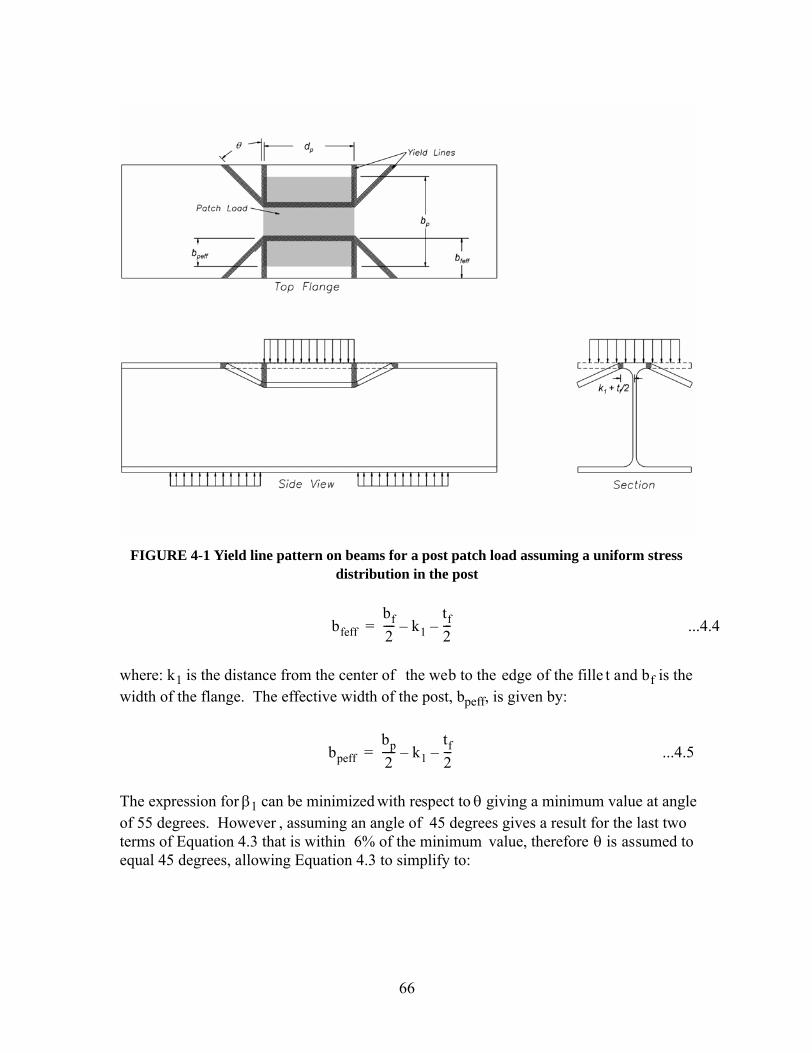
.4
...4where: k1 is the distance from the center of the web to the edge of the fille t and bf is thewidth of the flange. The effective width of the post, bpeff, is given by:
...4.5
The expression for β1 can be minimized with respect to θ giving a minimum value at angleof 55 degrees. However , assuming an angle of 45 degrees gives a result for the last twoterms of Equation 4.3 that is within 6% of the minimum value, therefore θ is assumed toequal 45 degrees, allowing Equation 4.3 to simplify to:
FIGURE 4-1 Yield line pattern on beams for a post patch load assuming a uniform stress distribution in the post
bfeffbf2---- k1–
tf2---–=
bpeffbp2----- k1–
tf2---–=
66

. ...4.6
Note that if dp tends to zero, as for a line load, bp is equal to bf and therefore bpeff is equalto bfeff, and bfeff is assumed to be 0.96 b f/2, then β1 simplifies to 6.25 as in Equation 4.1.For typical falsework applicat ions, where nominal 12 x 12 in. posts are used with actualdimensions, bp and tp, equal to 11.5 in., the values of β1, for different typical beam sizesused in bridge falsework, are given in Table 4-1. The values of β1 range from 10.9 to 18.1for the dif ferent beam sizes c onsidered. Thes e are all grea ter than 6.25, which is to beexpected. In order to simplify the calculation of flange bending capacity, a constant valueof β1 = 11 would be generally conservative for all cases considered.
Analyses show that, before crushing of the post occurs, a uniform stress distribution in thepost is conservative for many beams, particular those with smaller flanges, as post stressesare concentrated around the web of the beam. Therefore, a new expression is developedassuming a trian gular stress distribution (Fig. 4-2) instead of the uniform stressdistribution. The resulting expression for β1 is:
...4.7
The value of β1 for the dif ferent beam sizes assumi ng the triangular stress distribution isgiven in Table 4-1. The values range from 20.1 to 41.9, indicating an ultimate load that isapproximately twice that for the assumed uniform distribution. It is noted that the valuefor the heaviest section considered based on the uniform stress distribution (18.1) is closeto the β1 value for the lightest section considered based on the triangular stress distribution(20.1). Before the t imber post starts to fail locally, it is expect ed that the for the heaviersections a uniform distribution is most appropriate as the flanges will deflect a relativelysmall amount allowing the stresses to be uniform ly distributed in the post, while for thelighter sections the flanges will deflect a greater amount making the triangular stressdistribution more appropriate. Thus β1 conver ges to a valu e of between 18 and 20.Different values for β1 used in determining flange bending capacity are compared with the
TABLE 4-1 β1 values for beams assuming uniform and triangular stress distributions and 11.5 in. square patch load
β1bpbfeff2bpeff---------------
dpbfeff--------- 6+⎝ ⎠
⎛ ⎞=
HP12x53 HP14x73 HP14x89 W14x90 HP14x117 W14x12010.9 13.1 13.6 16.2 14.9 18.120.1 24.4 26.1 35.3 29.9 41.9
SectionUniformTriangular
β13bp
2bfeff
8bpeff3
------------------dp
bfeff--------- 6+⎝ ⎠
⎛ ⎞=
67
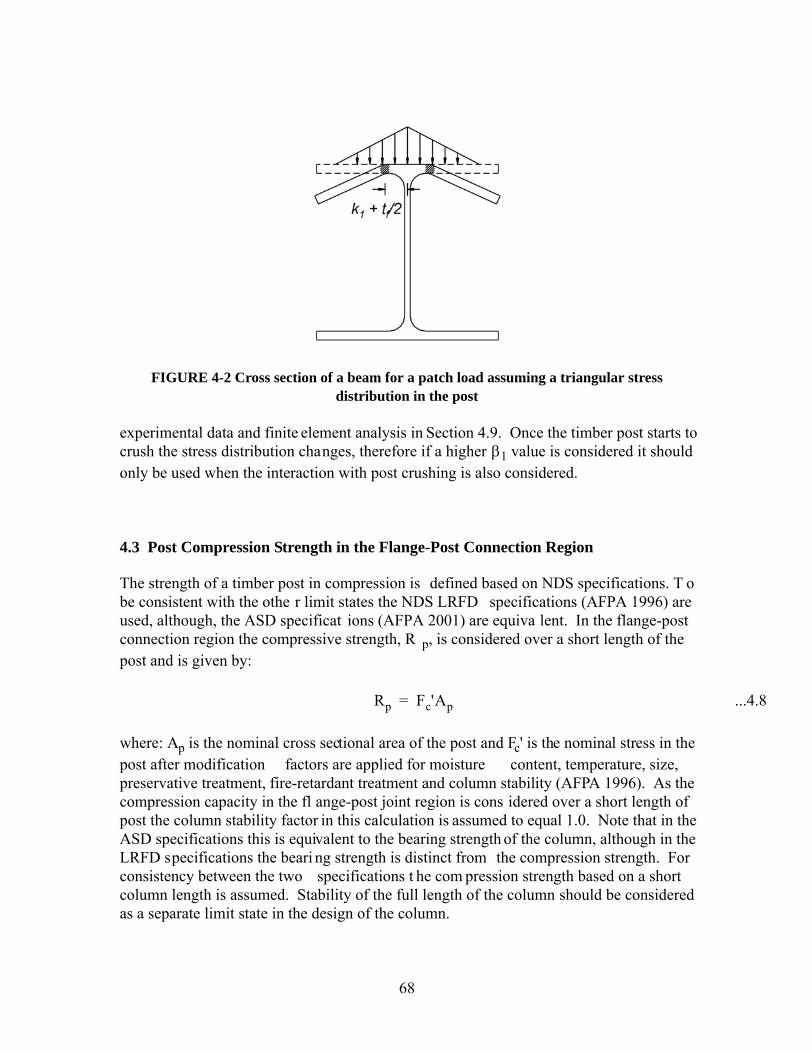
...4.8
experimental data and finite element analysis in Section 4.9. Once the timber post starts tocrush the stress distribution changes, therefore if a higher β1 value is considered it shouldonly be used when the interaction with post crushing is also considered.
4.3 Post Compression Strength in the Flange-Post Connection Region
The strength of a timber post in compression is defined based on NDS specifications. T obe consistent with the othe r limit states the NDS LRFD specifications (AFPA 1996) areused, although, the ASD specificat ions (AFPA 2001) are equiva lent. In the flange-postconnection region the compressive strength, R p, is considered over a short length of thepost and is given by:
where: Ap is the nominal cross sectional area of the post and Fc' is the nominal stress in thepost after modification factors are applied for moisture content, temperature, size,preservative treatment, fire-retardant treatment and column stability (AFPA 1996). As thecompression capacity in the fl ange-post joint region is cons idered over a short length ofpost the column stability factor in this calculation is assumed to equal 1.0. Note that in theASD specifications this is equivalent to the bearing strength of the column, although in theLRFD specifications the beari ng strength is distinct from the compression strength. Forconsistency between the two specifications t he com pression strength based on a shortcolumn length is assumed. Stability of the full length of the column should be consideredas a separate limit state in the design of the column.
FIGURE 4-2 Cross section of a beam for a patch load assuming a triangular stress distribution in the post
Rp Fc'Ap=
68

As a stee l pos t is axially muc h mor e r igid th an a timber post, it does n ot r esult in anapproximately even distribution of stresses in the end of th e post when bearing against abeam with a flexible flange. Consequently, it is recommended that the localized axialcapacity is calculated using the effective post bearing area described in Section 4.5.
4.4 Interaction between Flange Bending and Post Compression Limit States
The force at which bending occurs in the beam flange is related to that for crushing of thepost where in contact with the beam. The flange will not bend unless the post deforms toaccommodate the bending and, c onversely, the compression st rength of the post will bereduced, if flange bending occurs . Therefore, it is helpful to consider an interactionbetween the flange bending a nd post crushing limit states. A number of interactionequations have been proposed for dif ferent applications, such as for interaction betweenaxial loads and bending moments in the design of columns, or for interaction betweenbending and torsional moments in members (AISC 2005). For the interaction betweenpost crushing and flange bending an elliptical relationship is assumed, such that:
...4.9
where: R u is the applied a xial load in the po st. The application of this equation andcomparisons to experimental da ta and finite elemen t models is demonstrated later in thereport.
4.5 Effective Post Bearing Area for Calculating Flange-Post Capacity
An alternative to the interaction equation is considered which focuses on the post crushingof yielding in determining the flange-post capacity. For th is mode l a n ef fective cros ssectional area o f the post is considered to carry the axial load, as s hown in Figure 4-3,calculated using similar assumptions to those used for the web yielding equation in theAISC specifications (AISC 2005) . The ef fective area of th e post is determined by thewidth of the post ef fective in carrying the lo ad multiplied by th e thickness of the postwithin this width. An equation for the capacity of a timber post, Rp, is subsequently givenby:
...4.10
where: α is constant which depends on the slope of the stress gradient assumed throughthe flange, which will be de termined using the experiment al data and finite element
RuRf1--------⎝ ⎠
⎛ ⎞2 Ru
Rp------⎝ ⎠
⎛ ⎞2
+ 1≤
Rp αtf 2k1+( )dpFc'=
69
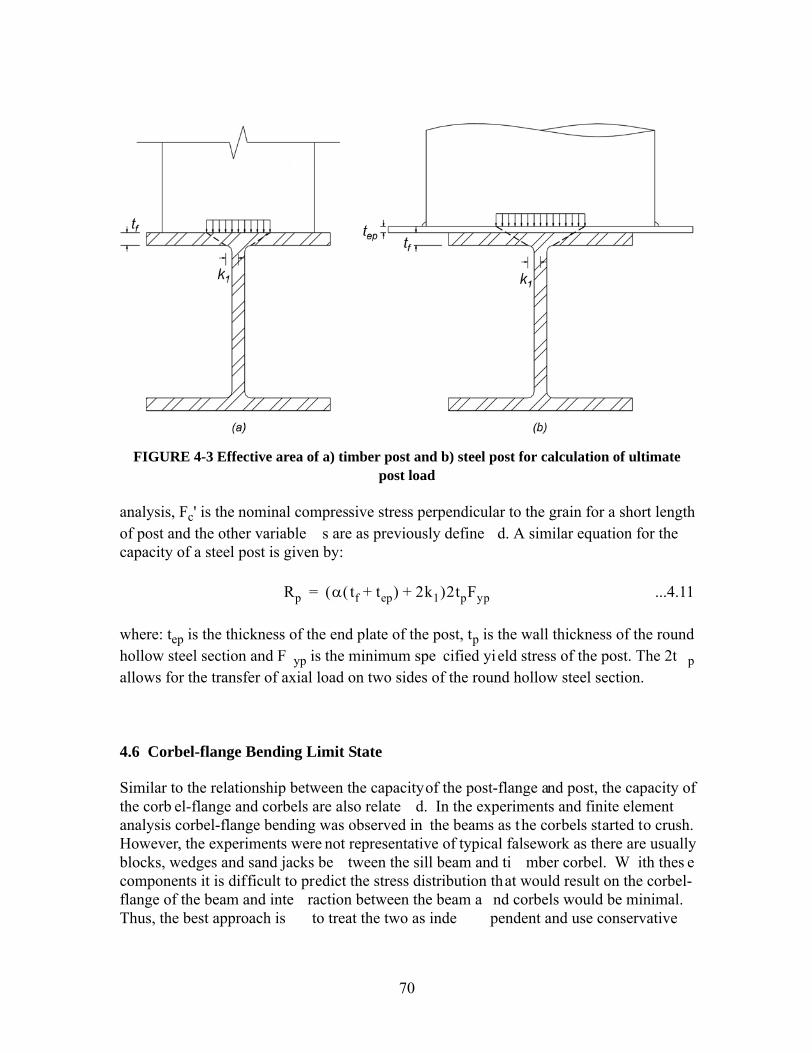
analysis, Fc' is the nominal compressive stress perpendicular to the grain for a short lengthof post and the other variable s are as previously define d. A similar equation for thecapacity of a steel post is given by:
...4.11
where: tep is the thickness of the end plate of the post, tp is the wall thickness of the roundhollow steel section and F yp is the minimum spe cified yield stress of the post. The 2t pallows for the transfer of axial load on two sides of the round hollow steel section.
4.6 Corbel-flange Bending Limit State
Similar to the relationship between the capacity of the post-flange and post, the capacity ofthe corb el-flange and corbels are also relate d. In the experiments and finite elementanalysis corbel-flange bending was observed in the beams as the corbels started to crush.However, the experiments were not representative of typical falsework as there are usuallyblocks, wedges and sand jacks be tween the sill beam and ti mber corbel. W ith thes ecomponents it is difficult to predict the stress distribution that would result on the corbel-flange of the beam and inte raction between the beam a nd corbels would be minimal.Thus, the best approach is to treat the two as inde pendent and use conservative
FIGURE 4-3 Effective area of a) timber post and b) steel post for calculation of ultimate post load
Rp α tf tep+( ) 2k1+( )2tpFyp=
70

.12
...4.13
assumptions with respect to corb el-flange bending and corbel crus hing, then check forboth cas es. Th is assumes that any elements between the beam and corbel have therequired capacity for a continuous transfer of load.
A similar methodology to that used in developing the flange bending equation for thepost-flange can also be used for the corbel -flange where the beams bear onto the co rbelsthrough sand jacks, blocks and wedges. Th e yield line pattern s hown in Figure 4-4 isassumed along with a uni form stress distribution on the fl ange from the corbels. Theresulting ultimate load for beam flange bending, Rf2, is given by:
...4
where: β2 is determined from a yield line anal ysis. Assuming a uniform loading in theshaded area and y ield lin e pattern, as show n in Figure 4-4, equating the internal andexternal virtual work for the patch load gives an expression for β2 equal to:
where: θ is the angle of the yield line shown in Figure 4-4, b feff is the ef fective width ofthe flange (shown in Fig. 4-4) given by equation 4.4, bc is the width of each corbel and s cis the spacing of the outermo st corbels in a group associat ed with each post. Theexpression for β2 can be minimized with respect to θ, although as with the post-flange anangle of 45 degrees gives a result for the last two terms of Equation 4.13 that is within 6%of the minimum value, therefore θ is assumed to equal 45 degrees, allowing Equation 4.13to simplify to:
FIGURE 4-4 Yield line pattern on corbel-flange of sill beam due to reaction from the corbels
Rf2 β2tf2Fyf=
β2bf
2bfeff-------------
bc sc+bfeff
---------------- 42θsin
-------------- 2θtan
-----------+ +⎝ ⎠⎛ ⎞=
71

...4.14
For typical falsework applications, where nominal 12 x 12 in. corbels are used with theactual dimension, bc, equal to 11.5 in., and the spacing of the corbels is 24 in. the value ofβ2 for dif ferent typical beam sizes used in br idge falsework are give n in Table 4-2. Thevalues of β2 range from 13.9 to 17.5 for the dif ferent beam sizes considered. A constantvalue of 14 could be assumed a nd would be within 20% for al l values while at the lowerend of the range. This woul d be conservative for all b eams where the sp acing of theoutmost corbels is 24 in. or greater. Where other corbel spacings are used, and greateraccuracy is desired, Equation 4.14 could be used to calcula te an alternative value for β2.Unlike for the post-flange, a triangular stress distribution is not considered for the corbelas the unifo rm stress distribu tion is conservative and there is mor e unce rtainty in theproperties of the applied load due to the elements includi ng the sand jacks, wedges andblocks located between the corb el and the sill beam, as is further explained in Section4.9.3.
4.7 Corbel Strength
The strength of a corbel in compression is defined based on the strength of timberperpendicular to the grain and the bearing area between the beam and corbel. Thus thecapacity, Rc, is given by:
...4.15
where: Abg is the bearing area and is the nominal stress after modification factors arefor moisture content and other conditions (AFPA 1996).
TABLE 4-2 β2 values for beams assuming uniform stress distributions, 11.5 in. wide corbels and a spacing between corbels of 24 in.
HP12x53 HP14x73 HP14x89 W14x90 HP14x117 W14x12016.2 13.9 14.2 16.6 14.9 17.5
SectionUniform Stress
β2bf
2bfeff-------------
bc sc+bfeff
---------------- 6+⎝ ⎠⎛ ⎞=
Rc Fc⊥'Abg=
Fc⊥'
72

.16
4.8 Strength of Blocking
Generally timber blocks sized between 4 x 4 in. are 6 x 8 in. are used to increase the beam-post joint in fa lsework if deemed nece ssary. The capacity of these members can becalculated based on the axial compression capa city of a short timber member. However,comparison with experimental and analytical studies to follow show that the full cap acityof the blocking is generally not effective, particularly for a steel post, thus the capacity ofthe timber blocking, Pb, can be given by:
...4
where: γ is the blocking ef fectiveness factor, Fc' is the nominal stre ss in the block aftermodification factors are applied (AFPA 1996) and Ab is the combined cross sectional areaof the blocking on both sides of the web.
4.9 Comparison of Calculated Strengths with Finite Element Analysis
4.9.1 Capacity of Post-flange and Post for the Concentrically Loaded Unblocked Beams
The failure loads from the fi nite element models, describe d in Section 3, were comparedwith the calculated capacity using the different equations described above. Firstly, just theconcentrically loaded, unblocked beams are considered. In ca lculating the capacity of thebeams and posts, expected strengths based on 55 ksi yield stress for the steel beams, 46 ksiyield for the steel posts, a nd strengths based on component experiments for the timberposts (2.7 ksi) and blocking (4.0 ksi). The calculated flange bending capacity (Eq. 4.2), asa r atio of the capacity ca lculated from the finite elemen t analysis for the dif ferent sizeconcentrically loaded b eams, is plotted in Figure 4-5. The flange bending capacity wascalculated using three different methods for calculating β, 1) using Equation 4.6 assuminga uniform stress distribution from the pa tch load, 2) using Equation 4.7 assuming atriangular stress distri bution, 3) assuming a c onstant value of β = 11 as a con servativeestimate for an assumed uniform stress distribution and 4) assuming a constant value of β= 18, based on convergence of β from the uniform stress di stribution for the largest beamand the triangular st ress distribution for the smalle st beam. In Figure 4-5, HP12x53,HP14x73, HP12x89 and W14x90 beam s are modeled with ti mber posts and W14x90,HP14x117 and W14x120 beams are m odeled with steel posts. In calculating the flangebending capacity with the steel post, the pos t was assumed to have an ef fective depth, dp,(Fig. 4-1) equal to the diameter of the post (18 in.) a nd effective width, b p, equal to thewidth of the flange. The capacity of the b eams with timber posts are shown with theshaded markers, while the beams with steel posts are shown with unshaded markers.
Figure 4-5 shows that the calculated capacit y of the flang es for the smalles t b eams isconservative compared to the failure load ca lculated from the fini te element analysis,while for the lar ger beams the calculated capacity is unconservative, regardless of the
Pb γFc'Ab=
73

FIGURE 4-5 Comparison of flange bending capacity with failure load from the finite element models for different beams
FIGURE 4-6 Comparison of post capacity for a short length of post with failure load from the finite element models for different beams
0
0.5
1
1.5
2
2.5
3
3.5
4
150 200 250 300 350 400 450 500
Finite Element Failure Load (kip)
Cal
cula
ted
Ulti
mat
e Lo
ad /
Fini
te E
lem
ent F
ailu
re L
oad
Triangular Stress, Timber PostUniform Stress, Timber PostBeta = 18, Timber PostBeta = 11, Timber PostTriangular Stress, Steel PostUniform Stress, Steel PostBeta = 18, Steel PostBeta = 11, Steel Post
0
0.5
1
1.5
2
2.5
3
3.5
4
150 200 250 300 350 400 450 500
Finite Element Failure Load (kip)
Cal
cula
ted
Ulti
mat
e Lo
ad /
Fini
te E
lem
ent F
ailu
re L
oad
Timber Post
Steel Post
74

method for calculating β. Therefore, the flange bending capacity calculations alone didnot give a good estimate of the capacity of the flange-post connection region as the poststrength also needs to be considered.
The nominal axial capacity for a short length of post (Eq. 4.8) is shown in Figure 4-6, as aratio of the capacity of the beam-post connection region for the different beams from finiteelement analysis. The figure shows that the ca lculated capacity of the pos t in all cases isgreater than the capacity of the beam-post connection re gion indicating that the poststrength alone also do es not give a good estimate of the flange-post connection regioncapacity.
When Equation 4.9 is used to model the inte raction between the post capacity and flangecapacity, with the flange capacity ca lculated assuming a constant value for β equal to 18,Figure 4-7 shows that es timated capacity of the beams is mu ch closer to the failure loadfrom the fin ite element analysis, particu larly for the timber po st. The e stimate wa sbetween 80% and 103% of the ul timate capacity from the finite element analysis for thetimber post. When this is compared to the minimum of the flange strength assuming avalue of b equal to 11 (conservative value assuming a uniform stress distribution) and poststrength, the interacti on equation is shown to be more accurate with the timber post.
FIGURE 4-7 Calculated flange-post capacity a) using the minimum of the flange bending strength with β=11 and post strength and b) using the interaction equation between flange
bending strength with β=18 and post strength, compared to failure load from the finite element models for different beams
0
0.5
1
1.5
2
2.5
3
3.5
4
150 200 250 300 350 400 450 500
Finite Element Failure Load (kip)
Cal
cula
ted
Ulti
mat
e Lo
ad /
Fini
te E
lem
ent F
ailu
re L
oad
Minimum of Flange Bending (Beta = 11) and Post, Timber Post
Interaction between Flange Bending (Beta = 18) and Post, Timber Post
Minimum of Flange Bending (Beta = 11) and Post, Steel Post
Interaction between Flange Bending (Beta = 18) and Post, Steel Post
75

However, the minimum of the flange and post strength is generally conservative and onlyunconservative by 9% in the wo rst case with the timber post. Therefo re the us e of thismore simplified method may be justified and is further investigated in following sections.
Neither of the above methods we re conservative or accurate wi th the steel post. This isattributed to the high axial stif fness of the steel post which does not allow the end of thepost to deform as for the timber post.
As an alternative to the interaction equation, the ultimate capacity of the beam-post jointregion is calculated using th e effective bearing area formul ation (Eqs. 4.10 and 4.1 1). Avalue of α = 5 is assumed, based on the 2.5:1 stress gradient assumed for web yielding inbeam column connections by the AISC spec ifications (AISC 2005) , with the resultingcapacities compared to the finite element an alysis given in Figure 4-8 for the dif ferentbeam-post regions. This figure shows that with the timber post the method is excessivelyconservative with an estimated capacity of between 54% and 70% of the capacity from thefinite element analysis . Wh ile it may be possible t o adjust the α value to increase theaccuracy in calculating the capacity of the beam-post joint region with a timber post usingthis method, it is uncertain how dif ferent ratios of beam and post stif fness and strengthwill af fect this v alue. Therefore, th e flange bending models are consid ered moreappropriate than the bearing area model when using a timber post. For the steel post, thebearing area method is more a ccurate but still conservative, with capacities between 84%and 95% of the capacity from the finite element analysis . The ef fective bearing areamethod is therefore more effective than the flange bending methods with the steel post.
4.9.2 Effect of Eccentricity and Blocking on the Capacity of the Post-flange and Post
As the previous section showed two possible methods, were most suitable for calculatingthe capacity of the c oncentrically loaded, unblocked beam with a timber post, these areconsidered for calculating the capacity of beams with blocking and eccentricities betweenthe centroids of the beam and post. Wher e blocking is used, the blocking capacity fromEquation 4.16, assuming the blocki ng is fully ef fective (γ = 1.0), is added to be flangecapacity to give the blocked flange capacity which was substituted for the flange capacityin the interaction equation. It is assumed that an eccentricity has little effect and thus thesame methodology is used when an eccentricity of up to 1/6th of the flange thickness ispresent.
A comparis on of the calculated cap acity of the flange-post joint region based on theinteraction equation (Eq. 4.9) with the failure lo ad from finite elemen t analyses is shownin Figure 4-9 for beams with timber posts. The same four beam sections as those usedpreviously with timber posts are assumed. The figure shows good correlation between thecalculated capacity and the finite element m odels, with a calculated capacity of between80% and 105% of the capacity ca lculated from the finite el ement model, with just twoexceptions. These exceptions are for the larger beams with a large eccentricity, where thecalculated capacity is up to 1 19% of that fr om the finite element model. This leve l of
76
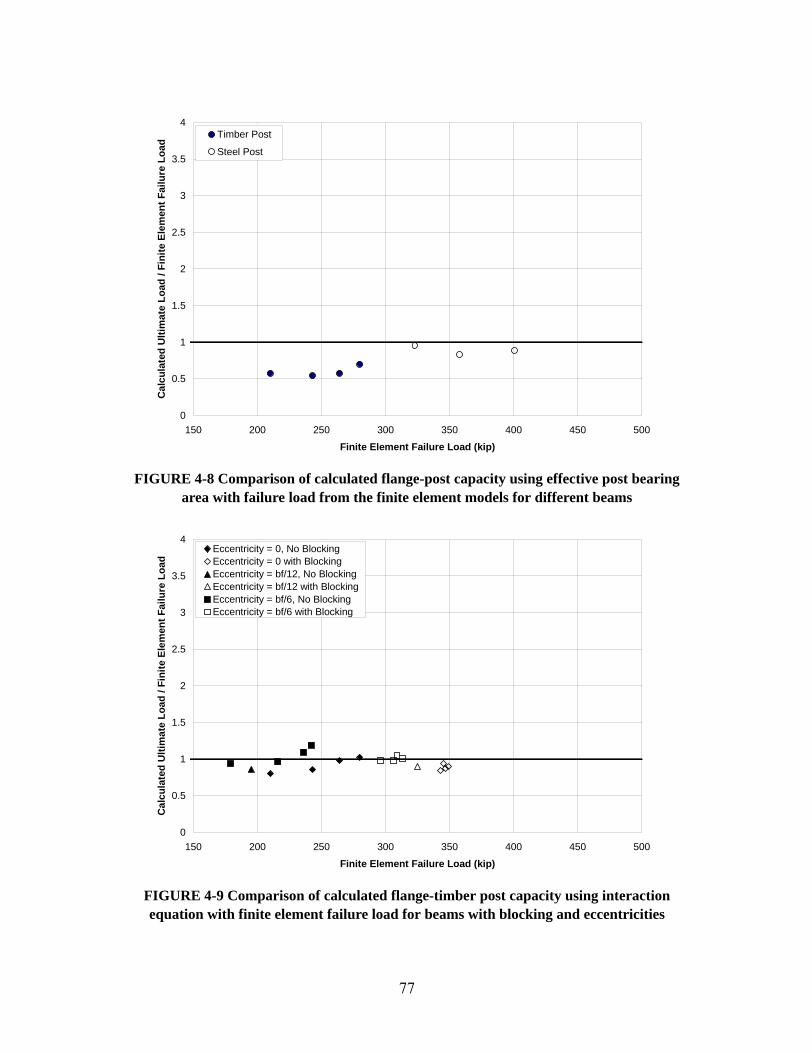
FIGURE 4-8 Comparison of calculated flange-post capacity using effective post bearing area with failure load from the finite element models for different beams
FIGURE 4-9 Comparison of calculated flange-timber post capacity using interaction equation with finite element failure load for beams with blocking and eccentricities
0
0.5
1
1.5
2
2.5
3
3.5
4
150 200 250 300 350 400 450 500
Finite Element Failure Load (kip)
Cal
cula
ted
Ulti
mat
e Lo
ad /
Fini
te E
lem
ent F
ailu
re L
oad
Timber Post
Steel Post
0
0.5
1
1.5
2
2.5
3
3.5
4
150 200 250 300 350 400 450 500
Finite Element Failure Load (kip)
Cal
cula
ted
Ulti
mat
e Lo
ad /
Fini
te E
lem
ent F
ailu
re L
oad
Eccentricity = 0, No BlockingEccentricity = 0 with BlockingEccentricity = bf/12, No BlockingEccentricity = bf/12 with BlockingEccentricity = bf/6, No BlockingEccentricity = bf/6 with Blocking
77
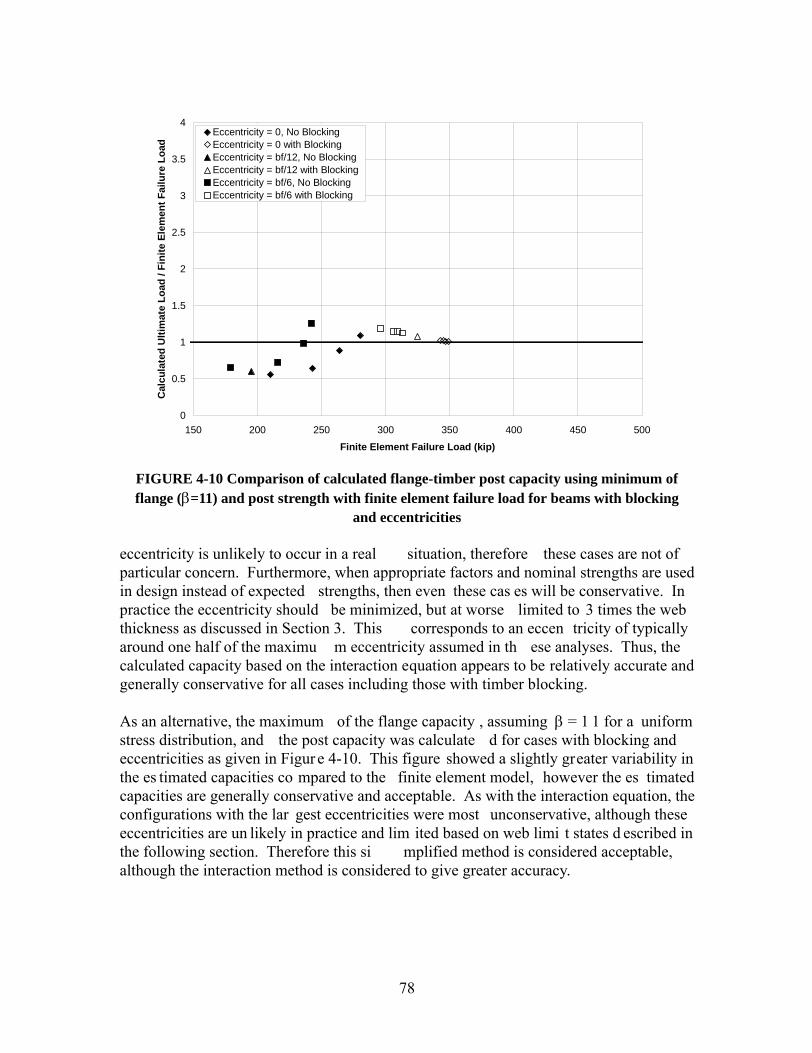
eccentricity is unlikely to occur in a real situation, therefore these cases are not ofparticular concern. Furthermore, when appropriate factors and nominal strengths are usedin design instead of expected strengths, then even these cas es will be conservative. Inpractice the eccentricity should be minimized, but at worse limited to 3 times the webthickness as discussed in Section 3. This corresponds to an eccen tricity of typicallyaround one half of the maximu m eccentricity assumed in th ese analyses. Thus, thecalculated capacity based on the interaction equation appears to be relatively accurate andgenerally conservative for all cases including those with timber blocking.
As an alternative, the maximum of the flange capacity , assuming β = 1 1 for a uniformstress distribution, and the post capacity was calculate d for cases with blocking andeccentricities as given in Figur e 4-10. This figure showed a slightly greater variability inthe es timated capacities co mpared to the finite element model, however the es timatedcapacities are generally conservative and acceptable. As with the interaction equation, theconfigurations with the lar gest eccentricities were most unconservative, although theseeccentricities are un likely in practice and lim ited based on web limi t states d escribed inthe following section. Therefore this si mplified method is considered acceptable,although the interaction method is considered to give greater accuracy.
FIGURE 4-10 Comparison of calculated flange-timber post capacity using minimum of flange (β=11) and post strength with finite element failure load for beams with blocking
and eccentricities
0
0.5
1
1.5
2
2.5
3
3.5
4
150 200 250 300 350 400 450 500
Finite Element Failure Load (kip)
Cal
cula
ted
Ulti
mat
e Lo
ad /
Fini
te E
lem
ent F
ailu
re L
oad
Eccentricity = 0, No BlockingEccentricity = 0 with BlockingEccentricity = bf/12, No BlockingEccentricity = bf/12 with BlockingEccentricity = bf/6, No BlockingEccentricity = bf/6 with Blocking
78
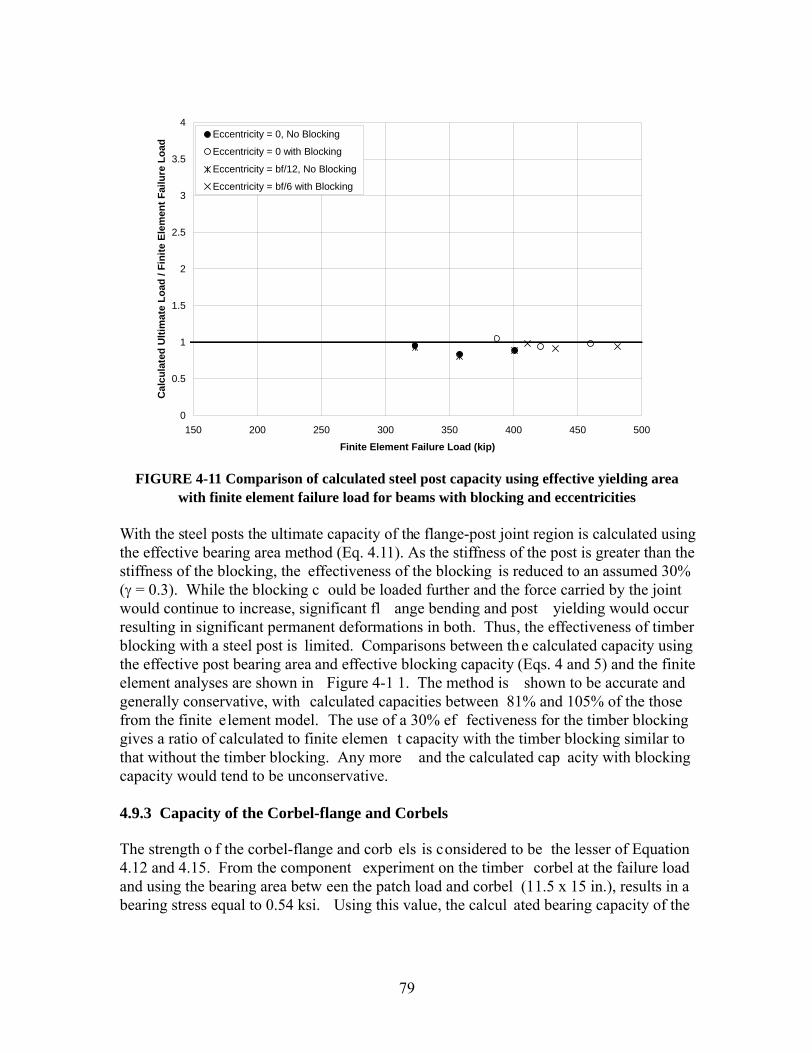
With the steel posts the ultimate capacity of the flange-post joint region is calculated usingthe effective bearing area method (Eq. 4.11). As the stiffness of the post is greater than thestiffness of the blocking, the effectiveness of the blocking is reduced to an assumed 30%(γ = 0.3). While the blocking c ould be loaded further and the force carried by the jointwould continue to increase, significant fl ange bending and post yielding would occurresulting in significant permanent deformations in both. Thus, the effectiveness of timberblocking with a steel post is limited. Comparisons between the calculated capacity usingthe effective post bearing area and effective blocking capacity (Eqs. 4 and 5) and the finiteelement analyses are shown in Figure 4-1 1. The method is shown to be accurate andgenerally conservative, with calculated capacities between 81% and 105% of the thosefrom the finite element model. The use of a 30% ef fectiveness for the timber blockinggives a ratio of calculated to finite elemen t capacity with the timber blocking similar tothat without the timber blocking. Any more and the calculated cap acity with blockingcapacity would tend to be unconservative.
4.9.3 Capacity of the Corbel-flange and Corbels
The strength o f the corbel-flange and corb els is considered to be the lesser of Equation4.12 and 4.15. From the component experiment on the timber corbel at the failure loadand using the bearing area betw een the patch load and corbel (11.5 x 15 in.), results in abearing stress equal to 0.54 ksi. Using this value, the calcul ated bearing capacity of the
FIGURE 4-11 Comparison of calculated steel post capacity using effective yielding area with finite element failure load for beams with blocking and eccentricities
0
0.5
1
1.5
2
2.5
3
3.5
4
150 200 250 300 350 400 450 500
Finite Element Failure Load (kip)
Cal
cula
ted
Ulti
mat
e Lo
ad /
Fini
te E
lem
ent F
ailu
re L
oad
Eccentricity = 0, No Blocking
Eccentricity = 0 with Blocking
Eccentricity = bf/12, No Blocking
Eccentricity = bf/6 with Blocking
79

corbels, using Equation 4.15 for different size beams, is compared to the failure load fromthe finite element models where corbel failure was observed in Figure 4-12. Thecalculated ultimate load due to corbel-flange bending, using Equation 4.12 and assumingβ2 = 14, is also compared to th e finite element failure loads in this figure. It shows thatthe corbel-flange capacity is greater than the failure load fr om the finite element analysiswhile the corbel capacity is close to the fi nite element failure load. Even the corbelcapacity is slightly unconservatively predic ted by the equation, with calculated strengthsbetween 101% and 121% of the finite element fa ilure load. This is attributed to theinteraction between corbel and corbel-flange. In reality, due to the sand jacks and othercomponents between the corbels this interaction is expected to be less than observed in thefinite element models, therefore the calculated capacity would become more conservative.In addition as the failure mechanism exhibits a high level of in elastic behavior , someoverload, if it were to occur , will not result in catastrophic collap se. Therefore theequations for calculating the failure load are considered appropriate.
While not considered in finite element anal ysis or experiments, where the corbe l-flangecapacity is weaker than the capacity of the co rbels, blocking located at the location of thecorbels could be used to increase the effective corbel-flange capacity. The strength of theblocking can be directly added to the strength of the flange, in the same manner as for thepost-flange.
FIGURE 4-12 Comparison of calculated corbel capacity with finite element failure load for beams with corbel failures
0
0.5
1
1.5
2
2.5
3
3.5
4
100 150 200 250 300 350
Finite Element Failure Load (kip)
Cal
cula
ted
Ulti
mat
e Lo
ad /
Fini
te E
lem
ent F
ailu
re L
oad
Corbel Capacity, Eccentricity = 0Corbel Capacity, Eccentricity = bf/6Bottom Flange Capacity, Eccentricity = 0Bottom Flange Capacity, Eccentricity = bf/6
80

4.10 Comparison of Calculated Limit States with Experimental Results
For the beams with timber posts, the capacit y of the flange-post connection region wascalculated using Equation 4.2 ( β = 18) for the flange capaci ty, Equation 4.16 for the postcapacity and Equation 4.9 for the interaction between the flange and post. When blockingwas used this was added to the flange capacity assuming 100% ef fectiveness of theblocking. Expected strengths are again us ed to calculate the beam-pos t capacity. Theresulting calculated capacity of the flange-post region for th e different configurations iscompared in Figure 4-13 to the estimated fail ure load from the experimental data. Theestimated forces are a pproximately equal to or less than the observed forces, at between71% and 105% of that observe d, for all members. The va riability is again lar gelyattributed to the variability of ma terial properties, particularly for the timber members,although the comparison shows that the calculated ultimate load is generally conservativeeven using expected strengths for the members. The lime flaking pa ttern observed in thebeams after considerable inelastic flange be nding was very similar to the yield patternassumed in developing Equation 4.2. Therefore, this method is appropriate for predictingthe capacity of the flange-post connection region with a timber post.
Alternatively, the simplified procedure using the lesser of the flange capacity (with β = 11)and the post capacity was compared to the experimental capacity of the beams. Figure 4-14 shows that there was a lar ger variabili ty between the calculated and experimentalcapacities using this method, however , the cap acities were generall y conservative. Theuse of safety factors in design, such as allo wable stresses or nominal strengths with loadfactors, would ensure that the capacity was not exceeded in the beam-post joint region.Therefore, based on the experimental data, as with the finite element analysis, the simpliedmethod is acceptable but not as accurate as the interaction method.
The effective post bearing area method was used to estimate the cap acity of the flange-post join t region with a stee l post, based on Equation 4.1 1. The failure mode in theexperiments with the steel post was consistent with the effective bearing area assumed forcalculating the ultimate load, with yielding and crippling of the post around where it wasbearing onto the beam in line with the web. Unfortunately the ca lculated ultimate loadcould not be directly compared to the exp erimental data as timber corbels were also us edin experiments with the steel posts and these affected the ultimate load of the system.
The experimental failure load was also compared to the calculated ultimate load for thecorbel-flange and timb er corbels. As the corbel-flange was shown to have a greatercapacity than the timber co rbels for each configuration, only the corbel strength wasconsidered f or c omparison with the exper imental data. Figure 4-15 shows that thecalculated ultimate load ra nges between at between 76 a nd 104% of the experimentalultimate load. The refore, the calculated ultimate load predic ts the fa ilure of the co rbelsrelatively accurately and generally conservatively.
81

FIGURE 4-13 Comparison of calculated flange-timber post capacity using interaction equation with finite element failure load for beams with blocking and eccentricities
0
0.5
1
1.5
2
150 200 250 300 350 400
Experimental Failure Load (kip)
Cal
cula
ted
Ulti
mat
e Lo
ad /
Expe
rimen
tal F
ailu
re L
oad
Eccentricity = 0, No BlockingEccentricity = 0 with BlockingEccentricity = bf/12, No BlockingEccentricity = bf/12 with BlockingEccentricity = bf/6, No BlockingEccentricity = bf/6 with Blocking
0
0.5
1
1.5
2
150 200 250 300 350 400
Finite Element Failure Load (kip)
Cal
cula
ted
Ulti
mat
e Lo
ad /
Fini
te E
lem
ent F
ailu
re L
oad
Eccentricity = 0, No BlockingEccentricity = 0 with BlockingEccentricity = bf/12, No BlockingEccentricity = bf/12 with BlockingEccentricity = bf/6, No BlockingEccentricity = bf/6 with Blocking
82

FIGURE 4-14 Comparison of calculated flange-timber post capacity using minimum of flange capacity (β=11) and post capacity with finite element failure load for beams with
blocking and eccentricities
FIGURE 4-15 Comparison of calculated corbel capacity with experimental failure load for beams with and without eccentricities
0
0.5
1
1.5
2
100 150 200 250 300 350
Experimental Failure Load (kip)
Fini
te E
lem
ent F
ailu
re L
oad
/ Exp
erim
enta
l Fai
lure
Loa
d Eccentricity = 0, No Blocking
Eccentricity = bf/6, No Blocking
83

84

SECTION 5PREDICTION OF THE WEB YIELDING, CRIPPLING AND LATERAL
BUCKLING CAPACITY
5.1 Overview
Finite element analys is and exp erimental data showed that there ar e two c ritical failuremodes for the web of cap and sill beams in falsework. These are web yielding or cripplingof the web , as suming that it is adequately stif fened or braced to prevent lateraldeformation of the flanges, or lateral buckling of the web for inadequately braced beams.While in typica l f alsework bea ms, with re latively heavy webs, flange bending or postcrushing is likely to govern the design of the beams, web yielding and buckling should beconsidered. Lateral web buc kling becomes particularly critical for double stackedfalsework beams.
5.2 Web Yielding and Crippling
The critical limit states for the web of beams in c onnection regions are web yielding andweb crippling. The ultimate capacity of the web based on the web yielding limit state, Rw,loaded with a timber post can be given by:
...5.1
where: α is a factor to allow for the stress grad ient through the flange , k is the distancefrom the outer face of the flange to the toe of the web (Fig. 5-1), dp is the depth of the post,Fyw is the yield stress in the web and tw is the thickness of the web. Based on the CaltransFalsework Manual (Caltrans 2001), α is equal to 2 for a 1:1 stress gradient. However ,based on the AISC specifications, α is equal to 5 for an a ssumed 2.5:1 stress gradientthrough the flange and toe of the web. A ppropriate stress gradie nts are investigatedfurther in Section 5.5.
A similar equation can also be applied when using a steel post given by:
...5.2
where: tep is the thickness of the base plate of the steel post and tp is the wall thickness ofthe round hollow steel s ection (Fig. 7b). This allows for yielding of the web in twolocations, directly under each side of the post.
The web of these beams can also be checked for web crippling. Using the AISCspecifications (AISC 2005) for web crippling, when the patch load is applied in at a
Rw αk dp+( )Fywtw=
Rw 2 α k tep+( ) tp+( )Fywtw=
85

distance from the end of the beam equal to at least one half of the depth of the beam, theultimate load, Rw, is given by:
...5.3
where: d is the de pth of the beam, t f is the thickness of the fl ange and E is the elasticmodulus of the steel beam.
5.3 Web Buckling
Buckling of an unbraced, unstif fened beam, wher e the flange is loaded with a timber orsteel post is assume d to displace sideways through buckling of the web, is synonymouswith column buckling. Unlike the other limit states where deformation is localized in thebeam-post joint region, lateral web buckling o ccurs over a long length of the beam as theflexural stif fness of the flange prevents localized lateral buckli ng. T o calculate thecapacity for this limit state, the web of a beam can be treated like a column assuming thatthe effective length of the beam is equal to the tributary length associated with each post,which will often be equal to the spacing of the posts in a falsework bent. Based on thecolumn buckling equations from the AISC specifications (A ISC 2005), the nominalcapacity of the web of a beam, Rw, can be given by:
FIGURE 5-1 Effective web yielding region for a) timber post and b) steel post
Rw 0.80tw2 1 3 N
d----⎝ ⎠⎛ ⎞ tw
tf-----⎝ ⎠⎛ ⎞+
EFywtftw
-----------------=
86

...5.4
where: leff is the effective tributary length of beam for a particular post and Fcr is equal to0.877Fe, where the Euler buckling load Fe is given by:
...5.5
where: K is the effective length factor, h is the clear height of the web between the flangesless the fillet radius and r is the radius of gyration for the web. This assumes that the webwill result in essentially elastic compression buckling, such that F e < 0.44Fyw, which willbe the case for the web of almost all beam sections. The effective length factor which willideally range between 1.0 and 2.0 for a member that is free of deflect laterally at one end.From finite element analys es described previously for concen trically loaded beams, a Kfactor of 1.7 was found to be appropriate for different beams with a timber post, implyingsome but not full rotational restraint provided by the timber post. W ith a steel post therotational restraint is higher , therefore assuming the s ame K value is conservative. Theradius of gyration for the web alone is given by tw/ . If stiffeners are used to increaseweb buckling capacity then r will increase as calculated using conventional theory. Whenstiffeners are used, with a stif fener thickne ss similar to the web thic kness, la teral webbuckling will not be a critical limit state in bridge falsework and need not be considered.Using the unstiffened radius of gyration and a K factor of 1.7, Fe can be simplified to:
...5.6
For typical beams used in bridge falsework with relatively thick webs, web buckling isunlikely to govern design. However , when beams are stacked on top of each other , as issometimes the case for sill beams in bridge falsework, the value of h in Equation 5.5 willbecome 2h and, as this is subsequently squared, Fe will be reduced by a factor of four. Inthis case even beams with relative thick w ebs will become susceptible to lateral webbuckling.
5.4 Strength of Blocking
When used, experimental and analytical studies to follow show that the full capacity of theblocking may not be effective for increasing the web capacity. The capacity of the timber
Rw twleffFcr=
Feπ2EKhr
-------⎝ ⎠⎛ ⎞ 2---------------=
12
Feπ2E6htw------⎝ ⎠⎛ ⎞ 2--------------=
87

blocking can be given by Equation 4.16 as used for calculating the additional capacity forflange bending. However, with web yielding and crippling the effectiveness factor, γ, willbe reduced. Although experiment al results suggested some increase in the lateral webbuckling capacity for one size b eam, the effectiveness of blocking is difficult to quantifywith web buckling. Thus, it is recommended that either stif feners or lateral bracing beused if necessary to increase the capacity of the web for lateral buckling.
5.5 Comparison of Calculated Strengths with Finite Element Analysis
5.5.1 Localized Capacity of Web for Braced Beams
The calculated web yieldin g and crippling capacity for a range of 12 and 14 in. deepbeams, including: W12x26, W12x40, W12x53, W14x22, W1 4x30, W14x43, W14x61,W14x90, W14x132, HP12x53, HP14x73, HP14x89 and HP14x1 17 are compared to thefailure load from finite element models in Figure 5-2. The finite element model assumeda rigid patch load applied to the beam, with latera l restraints to pr event lateral buckling.As the sections considered typical in bridge falsework, the heavier W and HP sections, allhad relatively thick webs, a larger range of sections with thinner webs were considered toinvestigate potential web crippling. In Figur e 5-2, only concentrically loaded unblockedbeams are considered. In calculating the web yielding capacity two factors to account fordifferent stress gradien ts were used. The first assumed a 1: 1 stress gradient as in theCaltrans Falsework Manual (C altrans 2001) thus had an α value of 2. The secondassumed an α value of 5 for a 2.5:1 stress gradient as in the AISC sp ecifications (AISC2005). The calculated web cri ppling capacity was also compar ed to the finite elementfailure load. Figure 5-2 shows that web yielding assuming an α value of 2 conservativelyand consistently predicts the ultimate w eb capacity o f the beams, with c alculatedcapacities between 85% and 91% of that from the fini te element analyses. An α value of5 typically over -predicts the web yielding capacity by up to 15% compared to the finiteelement model. Although, de formation of the web is observed indicative of webcrippling, as shown in Figure 9c, Figure 5-2 s hows that web crippling generally occurs atforces greater than the web yielding capacity for these beams.
Figure 5-3 compares the calculated web yielding capacity, assuming and α value of 2, forthe different beams including those with eccentrically applied loads and with blocking forthe lar ger beams ty pical of t hose in falsework. This figu re shows that the calculatedcapacity was between 86 and 91% of the ul timate c apacity fro m the f inite ele mentanalysis, thus was consistently and cons ervatively estimated for each beam wheneccentricities and blocking are considere d. The blocking was assumed to be 50%effective, thus was modeled with a γ = 0.5. The cases with blocking resulted in acalculated ultimate load of between 90 and 102% of the ultimate lo ad from the finiteelement analyses, therefore compared well. An equivalent transformed section, where thetimber blocking is converted to an equivalent steel area, could be used instead of using theγ factor for reducing the blocking ef fectiveness. However , as the γ factor results in a
88

FIGURE 5-2 Calculated web yielding, and crippling capacity versus finite element failure load for concentrically load, unblocked beams
FIGURE 5-3 Calculated web yielding capacity (α=2) versus finite element failure load for different beams with blocking and eccentricities
0
0.5
1
1.5
2
2.5
3
3.5
4
100 200 300 400 500 600 700 800 900
Finite Element Failure Load (kip)
Cal
cula
ted
Ulti
mat
e Lo
ad /
Fini
te E
lem
ent F
ailu
re L
oad
Web Yielding, Alpha = 2Web Yielding, Alpha = 5Web Crippling
0
0.5
1
1.5
2
2.5
3
3.5
4
100 200 300 400 500 600 700 800 900
Finite Element Failure Load (kip)
Cal
cula
ted
Ulti
mat
e Lo
ad /
Fini
te E
lem
ent F
ailu
re L
oad
Concentric, No BlockingConcentric, BlockedEccentricity = bf/6, No Blocking
89

FIGURE 5-4 Calculated web yielding capacity (α=5) versus finite element failure load for different beams with blocking and eccentricities
FIGURE 5-5 Calculated web crippling capacity versus finite element failure load for different beams with blocking and eccentricities
0
0.5
1
1.5
2
2.5
3
3.5
4
100 200 300 400 500 600 700 800 900
Finite Element Failure Load (kip)
Cal
cula
ted
Ulti
mat
e Lo
ad /
Fini
te E
lem
ent F
ailu
re L
oad
Concentric, No BlockingConcentric, BlockedEccentricity = bf/6, No Blocking
0
0.5
1
1.5
2
2.5
3
3.5
4
100 200 300 400 500 600 700 800 900
Finite Element Failure Load (kip)
Cal
cula
ted
Ulti
mat
e Lo
ad /
Fini
te E
lem
ent F
ailu
re L
oad
Concentric, No BlockingConcentric, BlockedEccentricity = bf/6, No Blocking
90

relatively accurate and consistent estimate of the ultimate capacity a transformed sectionis not considered necessary. The beam capacity from the eccentrically loaded cases werealmost identical to the co ncentric cases, confirming that with a rigid patch load aneccentricity has no ef fect. A figure similar to Figure 5-3 compares the calculated webyielding capacity of th e beams assuming an α = 5 with the ultima te load from finiteelement analysis in Figure 5-4. The calculat ed capacity is a gain consistent compared tothat from the finite element analysis, but unconservative by up to 19%, with this assumedα value. Therefore, an α = 2 is considered more appropria te. If the ultimate load w asdefined differently, closer to the maximum load in the beam, then the α value of 5 willbecome less unconservative and the load would be tolerable. However, a larger amount ofpermanent deformation would be observed which is undesirable fo r reusing falseworkbeams.
The calculated web crippling capacity is compared to the ultimate load from finite elementanalysis of the beams in Figure 5-5. This fi gure shows that the calculated web cripplingcapacity is greater than the ultimate load governed by the we b yielding limit state for allbut the smallest W12x26 and W 14x22 beams. Even for thes e beams, use of the webyielding formula for calculating the ultimate web capacity is conservative. In design thesafety f actor applied to the web c rippling li mit state is generally greater than for webyielding, thus it may govern for the lighter beams, alt hough not for the heavier beamstypically used in bridge falsework.
5.5.2 Lateral Web Buckling Capacity
The lateral web buckling capacity for the l onger, 120in. long, beams with timber posts iscompared to the calculated capacity in Figure 5-6. Latera l buckling was observed in theW12x26, W12x40, W14x22, W14x30 and W14x43 beam s. When two beams werestacked on top of each other , for th e lar ger beams like t hose typically us ed in bridgefalsework, lateral buckling was obser ved in the HP12x53, HP14x73 and W14x90 beams.Figure 5-6 shows that assuming a K valu e equal to 1.7, the cal culated capacity isconservative compared to the that from the finite element analyses by between 0 an 50%.The large variation is attributed to the sen sitivity of the ef fective length factor , with a Kvalue of 1.2 being appropriate for the beams with the largest discrepancy in the ultimatecapacities. In general the K value of 1.7 is appropriate due to its conservatism.
The effect of post eccentricity was considered in Section 3 for the two beam sections mostsusceptible to buckling. It was found for both sections that for an eccentricity of 6 timesthe web thickness (1.4 in), th e ultimate load dropped by ar ound 18% of the ultimate loadfor the concentrically loaded beams. As th e drop in load is approximately linear , thiscorresponds to a 3% reduction in lo ad for each multiple of web thic kness of eccentricity.The analyses show that eccentricity does have an ef fect on the buckling capacity of theweb and large eccentricities should be avoide d. Although, if accident al eccentricities areminimized and appropriate des ign safety factors are us ed, such eccentricities should notsignificantly affect the stabil ity of a beam. For a reducti on in strength of no more than
91

FIGURE 5-6 Calculated lateral web buckling capacity versus finite element failure load for 10 ft. long beams without blocking or eccentricities
FIGURE 5-7 Comparison of calculated ultimate load using web yielding and lateral web buckling equations with the experimental failure load
0
0.5
1
1.5
2
2.5
3
3.5
4
100 200 300 400 500 600 700 800 900
P from Finite Element Analysis (kip)
P C
alcu
late
d / P
from
Fin
ite E
lem
ent A
naly
sis
Single Beams
Double Stacked Beams
0
0.5
1
1.5
2
100 200 300 400 500 600 700
P from Experimental Data (kip)
P C
alcu
late
d / P
Exp
erim
enta
l
Web Yielding, Eccentricity = 0, No BlockingWeb Yielding, Eccentricity = bf/6, No BlockingLateral Web Buckling, Eccentricity = 0, No BlockingLateral Web Buckling, Eccentricity = bf/6, No Blocking
92

10% of the concentric strengt h, the eccentricity should be limited to 3 times the webthickness.
5.6 Comparison of Calculated Strengths with Finite Element Analysis
The calculated web yielding capacity with an α value of 2 is compared to the experimentfailure load for the d ifferent beams resulting in web yielding or cri ppling in Figure 5-7.For the beams r esulting in latera l buc kling, the calcula ted ultima te load assuming aneffective length factor of 1.7 is also compared. Figure 5-7 shows that the calculatedultimate load in all cases is conservative compared to the observed failure load with thecalculated load ranging be tween 65% and 98% of the observed load. For the HP12x53and HP14x73 sections exhibiting web yielding the calculated lo ad was within 7% of theobserved load. For the W14x90 section the calculated ultimate load up to 30% less thanthe observed load. The larger difference is attributed to the thicker flange which providessome resistance to web yielding through flexure of the flange and is not considered in webyielding equation. However the calculated capacity is conservative. Using an α value of 5as given in the AISC specifications would result in unconservatively calculated ultimateloads in each beam except the W14x90 beams. In reality a value of around 4 may be resultin calculated loads on average closest to th e observed failure loads, although the assumedvalue of 2 is conservative.
The calculated ultimate loads using the web buckling equation are c onservative for theconcentrically loaded (bo th W14x90) beams but accurate for the eccentrically loaded(HP14x73) beam that exhibited la teral buckling. The dif ference is again attributed to theresponse being very sensitive to the assumed effective length. Effective length factors of1.48 and 1.37 respectively would result in calcula ted capacities identical to the observedultimate loa d for the two conc entrically lo aded beams res pectively. As the level ofrotational f ixity at the top of the beam is dif ficult to determine, assuming the moreconservative value of 1.7 is appropriate.
93

94

SECTION 6PROPOSED DESIGN OF FALSEWORK BEAMS AND POSTS FOR GRAVITY
LOADS
6.1 Overview
In this section the design equations currently used for the critical limit states in falseworkbents based on the Caltrans Falsework Ma nual (Caltrans 2001) an d other predominantspecifications, including the 2001 NDS specif ications (AFPA 2001) for timber members,and the AISC Specifications (AISC 2005) fo r steel members, are examined. Equationsfrom the dif ferent specificati ons are contrasted and comp ared with proposed equationsfrom recent investigations. The various components of the falsework bents considered inthis section are the cap beams, timber or steel posts, sill beams and corbels. It is assumedthat the blocks, wedges and sand jacks between the sill beams and corbels are adequate totransfer load between the sill beams and corbels , with rese arch on san d jacks currentlybeing conducted at the Universi ty of California at San Diag o. The stringer beams andelements above these are not considered. Foundation pads ar e also not considered. Theequations in this section are presented in Allowable Stress Design (ASD) format, currentlyused in Caltrans falsework de sign, with equations in Load and Resistance Factor Design(LRFD) format presented in Appendix 1.
6.2 Design of Critical Members and Connections for Gravity Loads
6.2.1 Cap Beam Members for Flexure and Shear
The cap beams should be designed for the be nding moments and shear forces due to theseries of point loads from th e reaction s of the s tringer beam s. Thes e limit s tates us econventional theory that is well establis hed and is included in the Caltrans FalseworkManual.
6.2.2 Lateral Web Buckling in a Cap Beam
In addition to beam bending and shear , an unstif fened, unbraced cap beam should bechecked for lateral web buckling based on E quations 5.4 and 5.5. There are currently nospecifications for web buckling in the Ca ltrans Falsework Manual. The followingequations are based on a modi fication of the column buckling formula in the AISCspecifications. In ASD format the applied stre ss should be less than the critical bucklingstress (fcw < Fcr), where the applied stress, fcw, is given by:
...6.1fcwR
twleff------------=
95

where: R is the reaction from a post, t w is the thickness of the web and l eff is the effectivetributary length of the beam associated wi th a post. The critical buckling stress, F cr, isgiven by:
...6.2
where: the Euler load, Fe, is given by:
...6.3
where: E is the e lastic modulus, h is the clear height between the flanges less the filletradius and r is the radius of gyration. This equation is based on elastic buckling of the webwhich will occur wh en F e < 0.44F yw. Most beam webs will fit into this category andwhere they do not, lateral web buckling need not be checked.
If the design of the beam is controlled by web buckling it is recomme nded that eitherstiffeners welded to the flanges and the web at the post location or bracing of the corbel-flange of the beam be used.
6.2.3 Web Yielding in a Cap Beam
The reaction of the cap beam from the post should be designed for web yielding such thatthe applied s tress in the web is less than the allowable stress (fcw < F cwb). The appliedstress, fcw, in the beam for web yielding is given by:
...6.4
where: k is the distance from the outer face of the flange to the toe of the web, d p is thedepth of the post in the longitudinal beam direction and tw is the thickness of the web.
The allowable stress in a beam allowing for blocking, Fcb, is given by:
...6.5
where: Fcwb is the allowable compressive stress in the web , Fcb' is the allowable stress inthe timber blocking and A b is the cross sectional area of the timber blocking. W ith no
Fcr 0.525Fe=
Feπ2E6htw------⎝ ⎠⎛ ⎞ 2--------------=
fcwR
2k dp+( )tw----------------------------=
Fcwb Fcw 10.5Fcb'Ab
Fcw 2k dp+( )tw--------------------------------------+⎝ ⎠
⎛ ⎞=
96

blocking the term inside the brackets is equal to 1.0. The allowable stress in the web is 27ksi for A36 steel based on the Caltrans S tandard Specifications (C altrans 1992) for webcrippling, which are referred to by th e Falsework Manual. Based on the AISCspecifications, the allowable stress would be 24 ksi for A36 steel or 33 ksi for A572 Gr50or A992 steel.
Equation 6.4 is given in the Falsework Manual, although it is referred to as web crippling.The web crippling equation in the AISC specifications is qui te different. Web yieldingrefers to loc alized ma terial y ielding in th e region of the appl ied load, whereas webcrippling, based on the AISC specifications, refers to localized buckling of the web in theregion of the applied load. For thinner webs web cri ppling may occur before webyielding, although the preceding analysis showed that web yi elding will govern for alltypical falsework beams. T hus, crippling need not be c onsidered in the False workManual. To align the Falsework Manual with current AISC specifications, Equation 3.4should be considered web yielding.
6.2.4 Post-flange Bending in a Cap Beam with a Timber Post
6.2.4.1 Method 1 - Simplified Method
The flange-post capacity is based on flange bending assuming a uniform stressdistribution from a timber post. This limit state is not currently included in the FalseworkManual. The allowable stress in the region between the fla nge of the cap beam and thepost, Fcf, is given by:
...6.6
where: tf is the thickness of the flange, F b is the allowable bending stress in the flange ofthe beam, Fcb' is the allowable stress in the timber blocking, Ab is the cross sectional areaof the timber blocking and Ap is the area of the post.
6.2.4.2 Method 2 - Interaction Method
For a more accurate estimate of the flange -post capacity The conn ection between a sillbeam and a timber post can be designed for the combination of flange bending and postcrushing. The proposed equation for calculating the ca pacity of this connection is basedon Equation 4.9, but rearranged based on and allowable stress in the post such that:
...6.7
Fcf11tf
2Fb Fcb'Ab+Ap
---------------------------------------=
fcp1
Fcf2
------- 1Fcp'2-----------+
⎝ ⎠⎜ ⎟⎛ ⎞
12---–
<
97

where: fcp is the applied stress in the post from the reaction of the cap beam, F cp' is theallowable stress in a short length of post (without modification by the stability factor) andFcf is the allowable stress in the p ost-flange of the cap b eam converted to an equivalentallowable post stress, given by:
...6.8
where: tf is the thickness of the flange, F b is the allowable bending stress in the flange ofthe beam and Ap is the area of the post.
The allowable s tress in the beam flange is 22 ksi based on Caltrans S tandardSpecifications and AISC Spec ifications for A36 steel. For A572 Gr50 or A992 steelbeams the allowable stress is 30 ksi. The allowable stress in a timber post or block loadedparallel to the grain based on Caltrans S tandard Specifications is 1600 psi for a shortlength post or block. For Numb er 2 Douglas Fir timbers the allowable stress is 700 psi,therefore substantially less than the allowable stress in the S tandard Specifications. Thisdiscrepancy is discussed in the following section. The above equation for flange bendingis calibrated based on a 12 x 12 in. post. If two posts ar e used, this equation wouldconservatively predict the fla nge bending capacity . If sma ller posts ar e us ed it wouldagain be conservative as the width of the post relative to the width of the flange would bereduced.
6.2.5 Localized Yielding of a Steel Post from Bearing of the Cap Beam
The localized stresses in a post where a cap beam bears onto a post are designed to be lessthan the allowable stress (fcp < Fcp). With the effective force in any blocking subtracted,the applied localized stress in the post, fcp, is given by:
...6.9
where: tep is the thickness of the end plate of the post, k1 is the distance from the centroidof the beam web to the edge of the fillet and tp is the thickness of the post wall.
The allowable stress in the steel post, allowing for blocking, Fcpb, is given by:
...6.10
Fcf18tf
2Fb Fcb'Ab+Ap
---------------------------------------=
fcpR
5 tf tep+( ) 2k1+( )2tp----------------------------------------------------=
Fcpb Fcp 10.3Fcb'Ab
Fcp 5 tf tbp+( ) 2k1+( )2tp-------------------------------------------------------------+⎝ ⎠
⎛ ⎞=
98
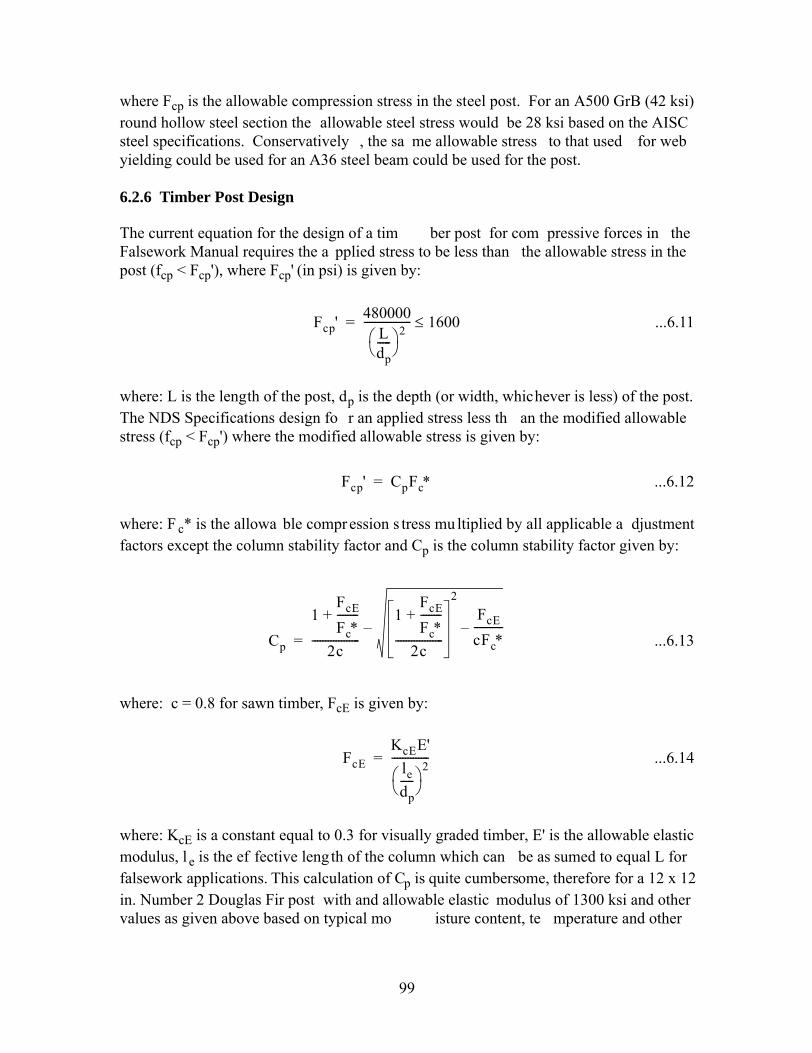
where Fcp is the allowable compression stress in the steel post. For an A500 GrB (42 ksi)round hollow steel section the allowable steel stress would be 28 ksi based on the AISCsteel specifications. Conservatively , the sa me allowable stress to that used for webyielding could be used for an A36 steel beam could be used for the post.
6.2.6 Timber Post Design
The current equation for the design of a tim ber post for com pressive forces in theFalsework Manual requires the a pplied stress to be less than the allowable stress in thepost (fcp < Fcp'), where Fcp' (in psi) is given by:
...6.11
where: L is the length of the post, dp is the depth (or width, whichever is less) of the post.The NDS Specifications design fo r an applied stress less th an the modified allowablestress (fcp < Fcp') where the modified allowable stress is given by:
...6.12
where: F c* is the allowa ble compr ession s tress mu ltiplied by all applicable a djustmentfactors except the column stability factor and Cp is the column stability factor given by:
...6.13
where: c = 0.8 for sawn timber, FcE is given by:
...6.14
where: KcE is a constant equal to 0.3 for visually graded timber, E' is the allowable elasticmodulus, l e is the ef fective length of the column which can be as sumed to equal L forfalsework applications. This calculation of Cp is quite cumbersome, therefore for a 12 x 12in. Number 2 Douglas Fir post with and allowable elastic modulus of 1300 ksi and othervalues as given above based on typical mo isture content, te mperature and other
Fcp' 480000Ldp-----⎝ ⎠⎛ ⎞ 2
------------------ 1600≤=
Fcp' CpFc∗=
Cp
1FcE
Fc∗--------+
2c------------------
1FcE
Fc∗--------+
2c------------------
2FcE
cFc∗-----------––
=
FcEKcEE'
ledp-----⎝ ⎠⎛ ⎞
2--------------=
99
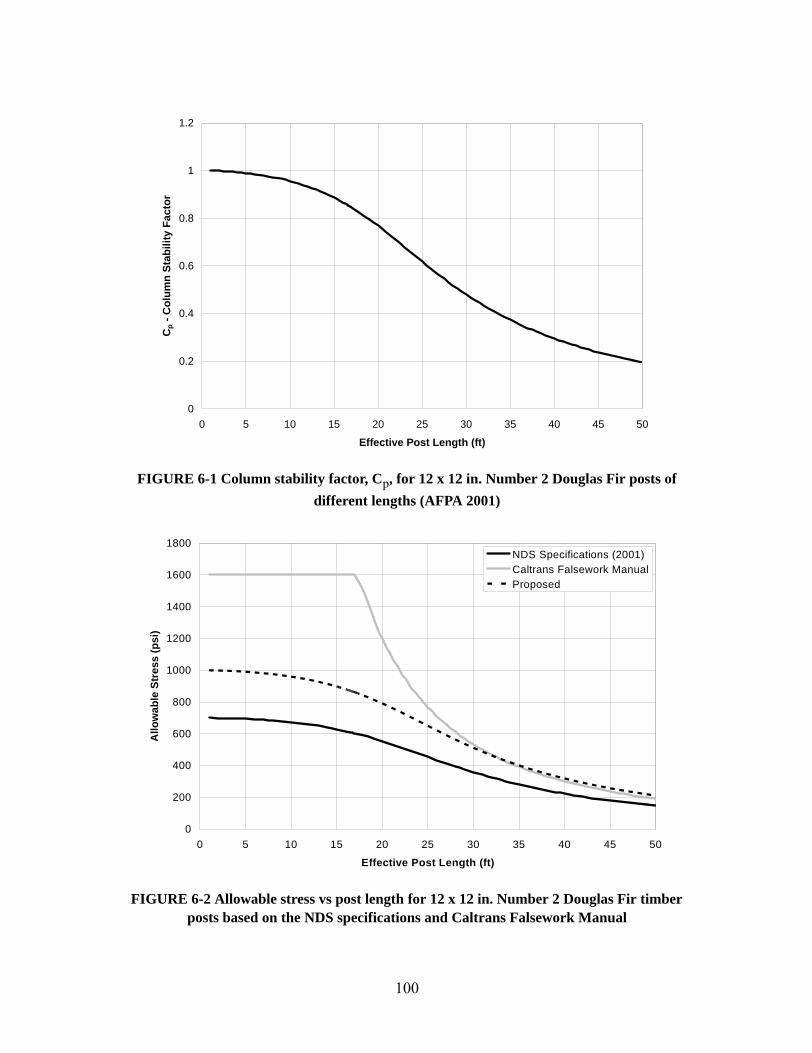
FIGURE 6-1 Column stability factor, Cp, for 12 x 12 in. Number 2 Douglas Fir posts of different lengths (AFPA 2001)
FIGURE 6-2 Allowable stress vs post length for 12 x 12 in. Number 2 Douglas Fir timber posts based on the NDS specifications and Caltrans Falsework Manual
0
0.2
0.4
0.6
0.8
1
1.2
0 5 10 15 20 25 30 35 40 45 50
Effective Post Length (ft)
Cp
- Col
umn
Stab
ility
Fac
tor
0
200
400
600
800
1000
1200
1400
1600
1800
0 5 10 15 20 25 30 35 40 45 50
Effective Post Length (ft)
Allo
wab
le S
tres
s (p
si)
NDS Specifications (2001)Caltrans Falsework ManualProposed
100

conditions, Cp is plotted against column length in Figure 6-1. The slenderness of the postle/dp should not exceed 50.
The maximum a llowable stres s parallel to the grain, F c*, is 700 psi for a Number 2Douglas Fir member based on the NDS specif ications. Thus the allowable stress indifferent length posts are given in Figure 6- 2. This resu lts in muc h lower allowablestresses than the Caltrans Falsework Manual, wh ich has a maximum allowable stress of1600 psi, with no reduction for posts up to 16.5 ft. long. Ba sed on the componentexperiments using three short (4 ft. long) posts, the minimu m failure load from the threeposts was 221 kip, corresponding to a failure stress based on actual post dimensions is1670 psi. This is very close al most equal to the allowable st ress in the timber post basedon the Caltrans specifications, thus with no safe ty factor, the Caltrans specifications areunconservative. However, given that the allowable stress found typical for the posts, usedin the finite element model based on the other component experi ments is 2660 psi, anallowable stress of 700 psi is excessively conservative. Thus, based on this limited data,an allowable stress of 1000 psi is considered appropriate. Using nominal post dimensionsinstead of the actual dimensions, a 1000 psi allowa ble stress has a safety factor of at least1.5, with an average safety factor of 2.4. Figure 6-2 shows that assuming a maximumallowable stress of 1000 psi and using the C p factor based on th e NDS spe cificationsresults in reduced allowable st resses for shorter columns, but similar stresses for longercolumns compared to the Caltrans specifi cations. Further research on the materialproperties would be beneficial.
6.2.7 Steel Post Design
The current equation for the des ign of a steel post in the Falsework Manual requires theapplied stress to be less than the allowable stress in the post (fcp < Fcp), where Fcp (in psi)is given by:
...6.15
where: r is radius of gyration of the post. Based on the AISC specifications the allowablestress is given by:
for (Fe < 0.44Fyp) ...6.16
or
for (Fe > 0.44Fyp) ...6.17
Fcp 16000 0.38 Lr---⎝ ⎠⎛ ⎞ 2
–=
Fcp 0.525Fe=
Fcp 0.658
Fy
Fe-----
0.6Fyp( )=
101

where Fyp is the minimum yield stress of the post and Fe is given by:
...6.18
where: K is the effective length factor assumed to equal 1.0 and E is the elastic modulus ofthe steel. For a A500 GrB (42 ksi) post th e maximum allowable stress from the AISCspecifications would be 25 ks i. The maximum stress base d on the Caltrans equation isequal to 16 k si, therefore is much more conservative than the AISC specifications. Thisconservatism continues for longer posts, as shown by Figur e 6-3 for an 18 in. dia., 3/8 in.thick, round steel hollow post, up to a length of 60 ft. For posts longer than 60 ft thecapacity is similar. While ther e is no experimental data to suggest a preference of eithermethod, the AISC equation has been developed more recently based on a lar ger base ofexperimental data.
FIGURE 6-3 Allowable stress vs post length for 18 in. diameter 3/8 in. thick round hollow steel post based on the AISC specifications and Caltrans Falsework Manual
Feπ2EKL
r--------⎝ ⎠⎛ ⎞ 2----------------=
0
5
10
15
20
25
30
0 10 20 30 40 50 60 70 80 90 100
Effective Post Length (ft)
Allo
wab
le S
tres
s (k
si)
AISC Specifications (2005)Caltrans Falsework Manual
102

6.2.8 Localized Yielding of a Steel Post due to Bearing onto a Sill Beam
As at the top of a post where the cap beam b ears onto the post, the base of a steel postshould be designed for localized yielding wh ere it bears on to a sill beam. The sameformulation as that for the top of the post can be used (Eqs. 6.9 and 6.10).
6.2.9 Flange Bending-Post Crushing in a Sill Beam with a Timber Post
The design of the flange-post bearing region for a timber post bearing onto a sill beamshould be consider ed in the same way as that for a cap beam bearing onto a post usingeither of the two methods described in Section 6.2.4 (Eqs. 6.6 to 6.8).
6.2.10 Web Yielding in a Sill Beam
The web of the sill beam should be checked for localiz ed stresses using the sameequations as that for the cap beam (Eqs. 6.4 and 6.5).
6.2.11 Lateral Web Buckling in a Sill Beam
Lateral buckling of the web of a sill beam should be checked using Equations 6.1 through6.3 as for the cap beam. Where double stacked sill beams are used, the height of the webin Equation 6.3 is considered to be the comb ination of heights of the two beams. Fordouble stacked beams this limit state may b ecome critical, in which case fully weldedstiffeners should be used beneath the post or the post-flange should be laterally braced.
6.2.12 Corbel-flange Bending in a Sill Beam
The corbel-flange of the sill beam, where it bears onto the wedges, sand jacks, blocks andcorbels, should be checked for adequate beam flange capacity . This check is made byensuring that the applied stress between the beam and supports above the corbels is lessthan the allowable bearing st ress due to flange bending (f bg < F gf). The applied bearingstress, fbg, is given by:
...6.19
where: R is the applied load from a post and Abg is the bearing area between the beam andits supports above the corbels. The allo wable bearing stress based on corbel-flangecapacity and capacity of any blocks between the flanges, Fgf, is given by:
...6.20
fbgR
Abg---------=
Fgf14tfFb Fcb'Ab+
Abg--------------------------------------=
103

where: t f is the thickness of the corbel-flange, F b is the allowable bending stress in theflange, Fcb' is the allowable compression stress in the blocking (1000 psi as for post), Ab isthe cross-sectional area of the blocking and A bg is the overlap (bearing) area between theflange and corbels. This equa tion assumes that at least two corbels are used beneath eachpost with a sp acing between the corbels of at least 24 in. If only a single corbel is us edthen the equation need not be checked as corb el crushing will govern the response for allpractical beam sizes. If blocking is require d to inc rease the fla nge-corbel intera ctionstrength, it can be placed di rectly under the post, unless th ere are corbels located morethan 24 in. from the cent er of the post, in which case bl ocking should be also be placeddirectly above these corbels.
6.2.13 Corbel Capacity
The applied stress between the supports of the sill beams and the corbels should becompared to the allowable stress perpendicular to the grain in the corbels (fbg < ). Theapplied stress is given by:
...6.21
where: R is the applied post load and A bg is the bearing area onto the corbels. Theallowable stress in a Number 2 Douglas Fir member loaded perpe ndicular to the grainbased on NDS specifications is 625 psi. The allowable stre ss in the Caltrans S tandardSpecifications is 450 psi. The calculated failure stress of the corbels from the componentexperiment, which was also found to be reasonable for the other experiments, was 540 ksi.Therefore, the allowable stress from the NDS specifications is very unconservative, as theallowable stress is greater than the observed failure stress. Even the allowable stress fromthe Caltrans specifications only has a factor of safety of 1.2. As the failure mechanism fora corbel is very s table, large deformations possible and an increasing load observed afterfailure, a r elatively low fa ctor of saf ety is acceptab le. Ho wever, it is evide nt that noincrease in the allowable st ress of 450 psi should be made to compare with the NDSspecifications.
6.3 Comparison of Different Limit States in Beams and Posts
6.3.1 Comparison using Actual Strengths
The critical limit states in cap and sill beams, posts and corbels are compared using theactual strengths based on the e xperimental data in Table 6-1. It is assumed that the beam
Fc⊥
fbgR
Abg---------=
104

represents a sill beam with a post bearing on the post-flange and corbels below the beam,although the flange-post behavior is equally applicable for a cap beam. The different limitstates considered are: an interaction be tween flange bending (using the more accu rateinteraction method) and post compression stre ngth with a timber post; Localized postyielding for the steel post; co rbel-flange bending; corbel crushing; web yielding; webcrippling, and; lateral web buckling assumi ng 10 ft. long beams. Table 6-1 shows thatcorbel crushing typically govern s the response of all cases with single stacked beams.This is followed by post-flange bending a nd post crushing or localized yielding. Theflange-post capacity is smaller than the web capacity for all but the double stacked beamswhere lateral buckling can govern the capacity . It shows that for b eams with thick webs,like those typically used in bridge falsework, web limit s tates are unlikely to control thecapacity of the beam-post regions. However, for double stacked beams lateral bracing ofthe beams should be used to pr event lateral web buckling if it is calculated to govern thecapacity.
TABLE 6-1 Comparison of calculated ultimate beam, post and corbel loads based on actual strengths from experiments (kip)
HP12x53 HP14x73 HP14x89 W14x90 W14x90 HP14x117 W14x120
Timber Timber Timber Timber Steel Steel Steel
168 208 258 288 308 299 356
149 200 296 388 388 505 680
149 182 182 180 270 277 274
333 389 481 345 473 924 716
711 814 1460 521 521 7 1260
178 204 364 130 130 817 315
Post Strength - 4 ft long 352 352 352 352 888 888 888
Notes: 1. Top flange bending capacity is based on beta = 18.
2. Interaction equation used for timber post, effective post bearing area with alpha = 5 used for steel post. 3. Beta = 14 for bottom flange bending. 4. Two corbels spaced 24 in. apart o.c. assumed with timber post, three corbels with outer corbe spaced 24 in. apart o.c. assumed with steel post 5. Alpha = 2 for timber post and 5 for steel post 6. Assumed effective length of 10 ft 7. Pcr > 0.44 Fy and will not govern
Bottom Flange Bending3
Corbel Crushing4
Lateral Web Buckling6
Lateral Web Buckling for a Double Stacked Beam6
Section
Post Type
Flange - Post Interation1,2
Web Yielding5
105

6.3.2 Comparison using Allowable Stresses based Current Caltrans Provisions
Table 6-2 shows the calculated load in each of the components based on allowable stressescurrently used in Caltrans falsework desi gn. The beams are assume d to be A36, with anallowable stress of 27 ksi for web yielding (termed crippli ng in the Falsework Manual).Post compression strength is added to the comparison, with the timber posts assumed tohave an allowable maximum compression ca pacity of 1600 psi, modified for theappropriate length based on Equation 6.11. The timber corbels have an allowable stress of450 psi with the bearing area assumed to be equal to the width of the beam flangemultiplied by the combined width of the corbels. Nominal dimensions of 12 in. are usedfor the posts and corbels instead of the actual dimension of 11.5 used in generating Table6-1, as this is typical of design practice. As there are no provisions for flange bending andweb buckling, these are not included in Table 6-2.
Post compression strength is shown to gove rn for the longer timber post, and corbelcrushing governs when shorter timber posts and steel posts are used. Although, theallowable post strength for the shorter post is less than that observed in typicalexperiments, it is greater th an observed in the weakest po st component experiment (221kip), therefore the allowable post strength is not always co nservative. Table 6-1 showedthat web yielding is unlikely to govern, although when allowable stresses and A36 steel isconsidered, Table 6-2 shows that it becomes more likely.
TABLE 6-2 Comparison of calculated allowable beam, post and corbel loads based on original Caltrans allowable stresses (kip)
HP12x53 HP14x73 HP14x89 W14x90 W14x90 HP14x117 W14x120
Timber Timber Timber Timber Steel Steel Steel
130 158 159 156 235 241 238
163 189 232 177 232 454 351
Post Strength - 4 ft long 230 230 230 230 307 307 307
Post Strength - 15 ft long 230 230 230 230 304 304 304
Post Strength - 30 ft long 77 77 77 77 286 286 286
Notes: 1. No current procedure for flange bending 2. No current procedure for web buckling
Web Yielding
Lateral Web Buckling2
Lateral Web Buckling for a Double Stacked Beam2
N/A
N/A
N/A
N/A
Section
Post Type
Flange - Post Interation1
Bottom Flange Bending1
Corbel Crushing
106

6.3.3 Comparison using Allowable Stresses based Recommended Provisions
Based on the allowable stresse s recommended in this repor t for the beams, pos ts andcorbels, a comparison of the different critical limit states is made in Table 6-3. The beamsare assumed to be A36, with allowable stresses of 22 ksi for flange bending and 24 ksi forweb yielding. Fcr was reduced to 60% of the nominal value based on the allowable stressesfor web buckling. The timber posts are as sumed to have an allowable compressioncapacity of 1000 psi and the timber corbels ha ve an allowable stress of 450 psi withnominal (12 in.) post and corbel dimensions used.
The resulting comparison is qui te different from Table 6-1, as the strength of the beamsare reduced from 55 ksi, the actual strength of an A572 Gr50 or A992 beam, compared tothe 22 to 24 ksi allowable stresses. In addition, the safety factors for allowable stresses onthe corbels are smaller than those for the beams and posts, thus the relative strength of the
TABLE 6-3 Comparison of calculated allowable beam-post loads based on recommended strengths from experiments (kip)
HP12x53 HP14x73 HP14x89 W14x90 W14x90 HP14x117 W14x120Timber Timber Timber Timber Steel Steel Steel
Flange Bending -Simplif.1 47 63 93 12268 84 105 117
Localized Post Yielding3 157 152 18160 80 118 155 155 202 272
130 158 159 156 235 241 238145 168 206 157 206 403 312427 488 875 313 313 8 756
107 122 219 78 78 490 189
Post Strength - 4 ft long 143 143 143 143 480 480 480Post Strength - 15 ft long 129 129 129 129 463 463 463Post Strength - 30 ft long 74 74 74 74 398 398 398Notes: 1. Flange bending capacity is based on beta = 11 2. Flange bending capacity when using interaction equation is based on beta = 18. 3. Effective post bearing area defined with alpha = 5 for steel post. 4. Beta = 14 for corbel flange bending. 5. Two corbels spaced 24 in. apart o.c. assumed with timber post, three corbels with outer corbels spaced 24 in. apart o.c. assumed with steel post 6. Alpha = 2 for timber post and 5 for steel post 7. Assumed effective length of 10 ft 8. Pcr > 0.44 Fy and will not govern
SectionPost Type
Flange - Post Interaction2
Bottom Flange Bending4
Corbel Crushing5
Web Yielding6
Lateral Web Buckling7
Lateral Web Buckling for a Double Stacked Beam7
107
corbels increased. This is ju stified as corbel crushing will not cause immediate collapse,while post crushing or web buckling is more likely to cause collapse. Table 6-3 shows thatpost compression strength is still likely to govern for longer posts and even for a shorterpost the allowable load is reduced significantly compared to the current Caltransprocedure (Table 6-2). If the posts ar e short enough, flange bending-post crushing isshown to govern the response with the timbe r posts and smaller beams. Lateral webbuckling of double stacked beams may also be critical. Therefore, compared to Table 6-2,potentially critical limit states, such as flange-post interaction and lateral buckling, are notconsidered by the current Caltrans Falsew ork Manual. Where fl ange bending becomescritical, blocking can be used to increase th e capacity of both the po st-flange and corbel-flange.
108

SECTION 7DESIGN EXAMPLES
7.1 Overview
Two design examples are cons idered where the cap beam, post, sill beam and co rbels aredesigned. The bridge in the first example has a relatively low height and the loads arerelatively low thus timber posts are chosen. In the second example, the bridge is assumedto be higher with falsework bents and posts spaced further apart, thus steel posts arechosen. The critical steps are described for the gravity load design. Lateral loads are notconsidered.
7.2 Design of Falsework with Timber Posts
7.2.1 Loads
The critical limit states in a falsework bent with a timber post are illustrated in Figure 7-1.Based on falsework plans for the Arch Road S tage 4 Bridge (J. Lammers, Caltra ns,Personal communication), with a general falsework layout and typical cross sectionsshown in Appendix 2, it is assu med that th e applied load from the superstructure of thebridge, and including the joists and stringer beams is:
pD+L = 450 psf
For falsework bents spaced 20 ft apart, the line load on the cap beam of the falsework bentis:
w = 9000 lb/ft = 9.00 kip/ft
7.2.2 Cap Beam Bending
Try an A36, HP12x53 section for th e cap beam, with a weight of 53 lb/ft, giving a totalweight on the cap beam of:
w = 9.05 kip/ft
If the posts are s paced 10 ft apart in the be nt then the maximum bending moment in thebent can be conservatively calculated by:
kip-ft = 1360 kip-in
and the applied stress is:
M wL2
8---------- 9.05 102( )
8------------------------ 113= = =
109

FIGURE 7-1 Portion of a falsework bent with timber post identifying critical limits states
110
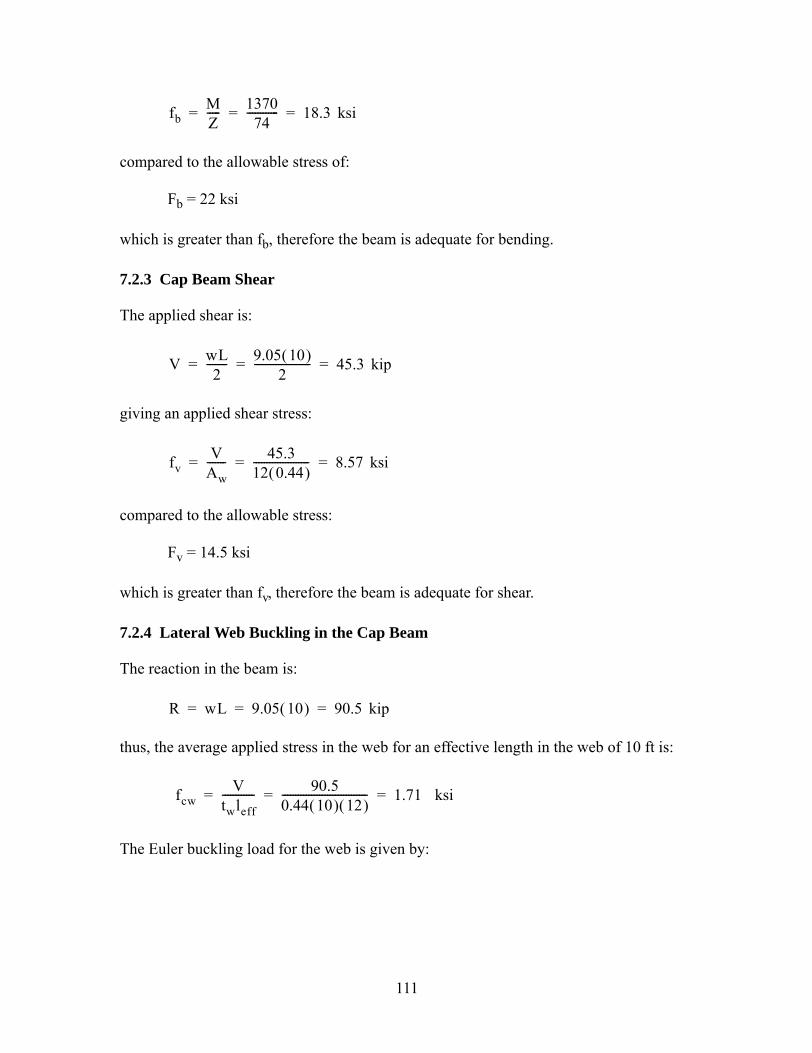
ksi
compared to the allowable stress of:
Fb = 22 ksi
which is greater than fb, therefore the beam is adequate for bending.
7.2.3 Cap Beam Shear
The applied shear is:
kip
giving an applied shear stress:
ksi
compared to the allowable stress:
Fv = 14.5 ksi
which is greater than fv, therefore the beam is adequate for shear.
7.2.4 Lateral Web Buckling in the Cap Beam
The reaction in the beam is:
kip
thus, the average applied stress in the web for an effective length in the web of 10 ft is:
ksi
The Euler buckling load for the web is given by:
fbMZ----- 1370
74------------ 18.3= = =
V wL2
-------- 9.05 10( )2
--------------------- 45.3= = =
fvV
Aw------- 45.3
12 0.44( )--------------------- 8.57= = =
R wL 9.05 10( ) 90.5= = =
fcwV
twleff------------ 90.5
0.44 10( ) 12( )-------------------------------- 1.71= = =
111

ksi
Check: Fe < 0.44 Fy < 0.44(36) < 15.8 ksi - Yes, therefore check of critical load should bemade. Note that if Fe > 0.44 Fy then web is non slender as a equivalent column and checkwould not be necessary.
The critical load is given by:
Fcr = 0.525 Fe = 0.525(14.8) = 7.77 ksi
which is greater than fcw, therefore the beam is easily adequate for web buckling (this limitstate is only likely to become critical for double stacked beams).
7.2.5 Web Yielding in the Cap Beam
The applied localized stress in the web from the 12 x 12 in timber post is:
ksi
which, assuming no blocking, is compared to:
Fcw = 24(1 + 0) = 24 ksi
which is greater than fcw, therefore the beam is adequate for web yielding.
7.2.6 Localized Flange Bending in the Flange-Post Joint Region in the Cap Beam
The applied stress at the top of the post is given by:
ksi
Assuming that the beam is unblocked, using the simplified method, the allowable stress inthe post due to prevent bending in the flange is given by:
ksi
Feπ2E6htw------⎝ ⎠⎛ ⎞ 2-------------- π2 29000( )
6 10.21( )0.44
---------------------⎝ ⎠⎛ ⎞ 2----------------------------- 14.8= = =
fcwR
2k dp+( )tw---------------------------- 90.5
2 1.13( ) 12+( ) 0.44( )--------------------------------------------------- 14.4= = =
fcpRAp------ 90.5
122---------- 0.628= = =
Fcf11t2Fb Fcb'Ab+
Ap--------------------------------------- 11 0.442( ) 22( ) 0+
122-------------------------------------------- 0.325= = =
112

which is less than f cp, therefore blocking should be us ed to increase flange bendingcapacity. With blocking the effective flange strength is:
ksi
which is greater than fcp, therefore the beam is adequate for flange bending. Note that thedesign could attempt to use the slightly more elaborate interaction method (See Section6.2.4), particularly if the unbloc ked allowable stress is close to the a pplied stress, whichmay eliminate the need for blocking. Al though, in this case, blocking would still berequired.
7.2.7 Post Compression Strength
The maximum applied load in the post, including the weight of the post, is:
P = R + Wpost = 90.5 + 12(15)(0.05) = 91.3 kip
giving an applied stress in the post of:
ksi
Cp is estimated at 0.90 from Fi gure 6-1 for the 15 ft long pos t, giving an allowable poststress of:
Fcp = CpFc* = 0.9(1.00) = 0.900 ksi
which is approximately equal to fcp, therefore the post is adequate.
7.2.8 Flange-post Interaction, Web Yielding and Web Buckling in the Sill Beam
An HP12x53 can be assumed for the sill beam also. Therefore the capacity for flange-postinteraction, web yielding and web buckling are the same as for the cap beam. As theapplied loads are also almost identical, there is no need to check the design of the blockedsill beam for these limit states.
7.2.9 Corbel-flange Bending in Sill Beam
The reaction from the corbels is given by:
kip
Fcf11t2Fb Fcb'Ab+
Ap--------------------------------------- 11 0.442( ) 22( ) 1.00 8( ) 6( ) 2( )+
122----------------------------------------------------------------------------- 0.992= = =
fcpP
Ap------ 91.3
122---------- 0.634= = =
R P Wbeam+ 91.3 10 0.053( )+ 91.8= = =
113

giving an applied stress:
ksi
With blocking used to increase the post-fla nge from bearing from the pos t, the cor bel-flange is also considered to be blocked, thus the effective allowable bearing stress for thecorbel-flange is given by:
ksi
which is greater than fbg, therefore the corbel-flange is adequate
7.2.10 Corbels
The applied bearing stress in the corbels is equal to that given above for the bearing of thecorbel-flange. The allowable stress in the corbels is:
ksi
which is greater than fbg, therefore the corbels are adequate.
7.3 Design of Falsework with Steel Posts
7.3.1 Loads
The critical limit states in a falsework bent with a timber post are illustrated in Figure 7-2.It is assumed that the applied load from the superstructure of the bridge and including thejoists and stringer beams is 450 psf as in the previous ex ample. However in this examplethe falsework bents are assumed to have tributary loads from a 35 ft length of the bridge.Thus, the line load on a the cap beam of the falsework bent is:
w = 15750 lb/ft = 15.8 kip/ft
7.3.2 Cap Beam Bending
Try an A992, W14x120 section for the cap beam, with a weight of 120 lb/ft, giving a totalweight on the cap beam of:
w = 15.9 kip/ft
fbgR
Abg--------- 91.8
2 12( ) 12.0( )----------------------------- 0.318= = =
Fgf14t2Fb Fcb'Ab+
Ap--------------------------------------- 14 0.442( ) 22( ) 1.00 6( ) 8( ) 2( )+
2 12( ) 12.0( )----------------------------------------------------------------------------- 0.540= = =
Fc⊥' 0.45=
114

FIGURE 7-2 Portion of a falsework bent with steel post identifying critical limits states
115
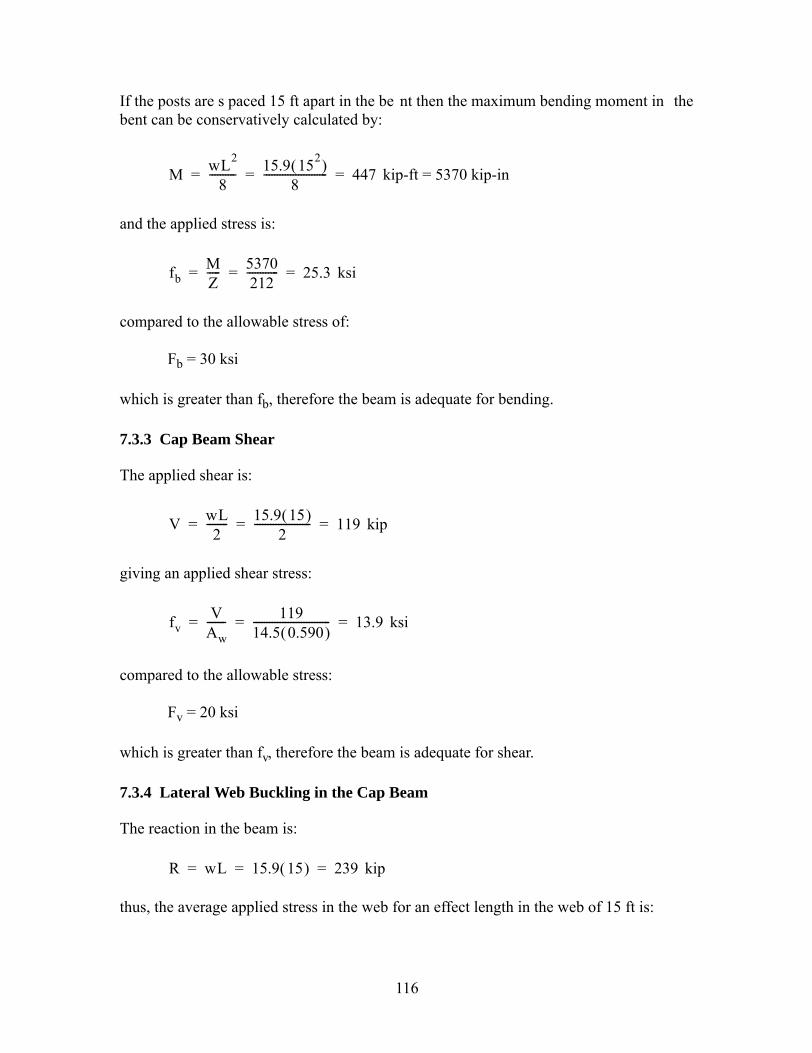
If the posts are s paced 15 ft apart in the be nt then the maximum bending moment in thebent can be conservatively calculated by:
kip-ft = 5370 kip-in
and the applied stress is:
ksi
compared to the allowable stress of:
Fb = 30 ksi
which is greater than fb, therefore the beam is adequate for bending.
7.3.3 Cap Beam Shear
The applied shear is:
kip
giving an applied shear stress:
ksi
compared to the allowable stress:
Fv = 20 ksi
which is greater than fv, therefore the beam is adequate for shear.
7.3.4 Lateral Web Buckling in the Cap Beam
The reaction in the beam is:
kip
thus, the average applied stress in the web for an effect length in the web of 15 ft is:
M wL2
8---------- 15.9 152( )
8------------------------ 447= = =
fbMZ----- 5370
212------------ 25.3= = =
V wL2
-------- 15.9 15( )2
--------------------- 119= = =
fvV
Aw------- 119
14.5 0.590( )----------------------------- 13.9= = =
R wL 15.9 15( ) 239= = =
116

ksi
The euler buckling load for the web is given by:
ksi
Check: Fe < 0.44 Fy < 0.44(50) < 22.0 ksi - Yes, therefore should check critical load.
The critical load is given by:
Fcr = 0.525 Fe = 0.525(19.5) = 10.2 ksi
which is greater than fc, therefore the beam is adequate for web buckling.
7.3.5 Web Yielding in the Cap Beam
This need not be checked as the post has a thin ner wall and lower yield str ess than thebeam web, therefore localized yielding in th e post will occur before localized yielding inthe web.
7.3.6 Localized Post Yielding in the Cap Beam
Assume an 18 in diameter , 3/8 in thick, A500 GrB (42 ksi yi eld stress) post section. Theapplied stress in the critical region of the post, when the beam is unblocked, is given by:
ksi
and the allowable stress in the post is:
ksi
The allowable stress is less than the applied stress, therefore will try using blocking to takea part of the post load. The resulting applied stress in the web is given by:
fcV
twleff------------ 239
0.59 15( ) 12( )-------------------------------- 2.25= = =
Feπ2E6htw------⎝ ⎠⎛ ⎞ 2-------------- π2 29000( )
6 11.91( )0.59( )
---------------------⎝ ⎠⎛ ⎞ 2----------------------------- 19.5= = =
fcpR
5 tf tep+( ) 2k1+( )2tp---------------------------------------------------- 239
5 0.94 0.5+( ) 2 1.5( )+( )2 0.375( )--------------------------------------------------------------------------------- 31.2= = =
Fcpb Fcp 10.3Fcb'Ab
Fc 5 tf tbp+( ) 2k1+( )2tp----------------------------------------------------------+⎝ ⎠
⎛ ⎞ 28 1 0+( ) 28= = =
Fcpb Fcp 10.3Fcb'Ab
Fc 5 tf tbp+( ) 2k1+( )2tp----------------------------------------------------------+⎝ ⎠
⎛ ⎞=
117

= ksi
which is greater than f c, therefore the blocked beam is adequate. Altern atively a lar gerend plate could be attached to the post. If a 3/4 in end plate is used the applied stress is:
ksi
which is less than Fcb, therefore adequate without the use of blocking.
7.3.7 Post Compression Strength
The maximum applied load in the 25 ft long posts, including the weight of the post, is:
kip
giving an applied stress in the post of:
ksi
The euler stress is given by:
ksi
and as Fe > 0.44Fy
ksi
which is greater than fc, therefore column is adequate.
7.3.8 Flange-post Interaction, Web Yielding and Web Buckling in the Sill Beam
A W14x120 can also be assumed for the sill beam, therefore the capacity for flange-postinteraction, web yielding and web buckling are the same as for the cap beam. As the
28 1 0.3 1.0( ) 6( ) 8( ) 2( )28 5 0.94 0.5+( ) 2 1.5( )+( )2 0.375( )----------------------------------------------------------------------------------------+⎝ ⎠
⎛ ⎞ 31.7=
fcpR
5 tf tep+( ) 2k1+( )2tp---------------------------------------------------- 239
5 0.94 0.75+( ) 2 1.5( )+( )2 0.375( )------------------------------------------------------------------------------------ 27.8= = =
P R Wpost+ 239 19.4 25( ) 0.490( )144
----------------------------------------+ 241= = =
fcpP
Ap------ 241
19.4---------- 12.4= = =
Feπ2EKL
r--------⎝ ⎠⎛ ⎞ 2---------------- π2 29000( )
1.0 25( ) 12( )6.24
-----------------------------⎝ ⎠⎛ ⎞ 2-------------------------------------- 124= = =
Fcp 0.658
Fy
Fe-----
0.6Fy( ) 0.65842
124---------
0.6( ) 42( ) 21.9= = =
118

applied loads are also almost identical, there is no need to check the design of the blockedsill beam for these limit states.
7.3.9 Corbel-flange Bending in Sill Beam
The reaction from the corbels is given by:
kip
giving an applied stress, assuming three corbels, of:
ksi
Assuming no blocking to simply the calcula tion (although blocking is required for localpost yielding) the effective allowable bearing stress for the corbel-flange is given by:
ksi
which is greater than fbg, therefore the corbel-flange is adequate.
7.3.10 Corbels
The applied bearing stress in the corbels is equal to that given above for the bearing of thecorbel-flange. The allowable stress in the corbels is:
ksi
which is approximately equal to fbg, therefore three corbels are adequate.
R P Wbeam+ 241 15 0.120( )+ 243= = =
fbgR
Abg--------- 243
3 12( ) 14.7( )----------------------------- 0.459= = =
Fgf14tf
2Fb Fcb'Ab+Ap
--------------------------------------- 14 0.942( ) 22( ) 0+2 12( ) 14.0( )
-------------------------------------------- 0.810= = =
Fc⊥' 0.45=
119

120
SECTION 8SUMMARY, CONCLUSIONS AND RECOMMENDATIONS
8.1 Summary and Conclusions
A series of experimental a nd finite element studies we re performed on post and beamconnections, typical of those found in bridge falsework, to identify the causes of observedfailures in the field and identify the crit ical limit states for design. Configurationsinvestigated included: steel still and cap b eams with timber posts, beams with steel posts,rigid patch loads on beams, and beams wit hout any lateral restraint. Using theseconfigurations various limit states, including: flange bending, post crushing, post yieldingweb yielding and post-elastic crippling, lateral web buckli ng and corbel crushing wereidentified.
The conclusions from experimental and finite element studies are:
• The axial compression fail ure stresses of three 4 ft. long, 12 x 12 in. Number 2Douglas Fir timber posts ranged between 1670 and 2770 psi.
• The axial bearing strength perpendicular to the grain for a 12 x 12 in Number 2Douglas Fir timber corbel is 540 psi.
• The axial compression failure stresses of three 12 to 14 in. long, 12 x 12 in. Number2 Douglas Fir timber blocks ranged between 3220 and 4820 psi.
• The steel sections had mate rial strengths around 0 to 12% percent greater than theminimum specified yield stress.
• Sill beams and short timber posts with timber corbels typically fail through crushingof the corbels and possible bending of the flange adjacent to the corbel.
• Without timber corbels, sill and cap b eams and timber posts t ypically fail throughbending of the flange and localized crushing of the post.
• S teel post joint regions t ypically fail though lo calized yielding of the post in theregion where the post is bearing onto the beam flange near the web.
• If the post applying the patch loading has sufficient capacity and rigidity , a beamwith a relative thick web is likely to fail by web yielding, with post-elastic cripplingoccurring after the yielding. W eb yieldi ng is most likely to govern over webcrippling for typical “stocky” falsework beams.
• Unbraced , unstif fened beams may fail through lateral buckling of the web,particularly double stacked beams.
121

• Blocks placed between the flanges and web may increase the flange bending and webyielding capacity of the be am, although their ef fect in increasing lateral bucklingcapacity is inconclusive.
• An eccentricity between the flange and post of ar ound 3 times the web thicknessreduces the flange bending, yielding and buckling capacity by around 10%.
8.2 Recommendations
From the experimental and fi nite element results, a series of design equations weredeveloped to calculate the capa city of the critical limit s tates. Recommendations for thedesign of a falsework bent are as follows:
• Cap and sill beams should be designed for lateral buckling using the equationproposed based on a column buckling equation. If double stacked sill beams areused, the web height should be taken as the summation of the heights for the twobeams. Bracing or fully welded stif feners should be used in the cap and sill beamsat the post locations if necessary to increase the lateral web buckling capacity. Theradius of gyration in the equation can be increased accordingly with stiffeners.
• Cap and sill beams should be designed fo r web yielding using a 1:1 stress gradientthrough the flange. This uses the same equation as currently in the falseworkmanual, although the name “web crippling” should be changed to “web yielding” tobe consistent with AISC specifications.
• The cap and sill beams s hould be designed for localiz ed flange bending when atimber post is used. T wo equations have been proposed for this purpose. Thesimplified equation is adequate but typica lly conservative, resulting in an increasedneed for blocking. The more elaborate in teraction equation (f or the interactionbetween flange bending and po st crushing) could be used if additional accuracy isdesired. The inclusion of the more elaborat e equation in the specifications is left tothe descretion of the falsework committee.
• A steel post should be desi gned for localized yielding wh ere the ends of the postbearing onto the adjacent b eams using a similar expression to that for web yieldingexcept with a 2.5:1 stress gradient assumed.
• The timber and steel posts need to be designed for axial loads based on their length asordinary columns. For the timber post, equations based on the NDS specificationsare more conservative than the Calt rans Falsework specifications and arerecommended based on the limit ed post experimental data . A plot showing the C Pfactor (Figure 6-1) could be included in the design guidelines to simplify thecalculation. An allowabl e stress of 1000 psi is te ntatively recommended forNumber 2 Douglas Fir posts. For the st eel post the AISC design equations wouldallow for smaller posts than the Caltrans specifications and are also recommended.
122

• The bottom flange of a sill beam should be checked for flange bending where bearingon the sand jacks, blocks wedges and corbels based on the proposed equation.
• The timber corbels should be designed for bearing using the current Caltransallowable s tress for timbe r member s. Th e allowable stress perpendicular to thegrain for Number 2 Dougl as Fir me mbers in the NDS spe cifications isunconservative compared to the experimental data.
• Blocking can be used to increase fl ange bending and web yielding capacity ifnecessary and is considered 100% ef fective for increa se flange bending capacitywith a timber post, but only 30% ef fective for increasing flange bending/postbearing capacity with a steel post. It is considered 50% effective for increasing webyielding capacity.
• Any eccentricity between the centroid of the beam and post should be minimized, butat most it should be no more than 3 times the beam web thickness, for a reduction inflange bending and web buckling capacity of no more than 10%.
123

124
REFERENCES
American Forest and Paper Association (AFPA) (1996). Load and Resistance FactorDesign - Manual for Engineered Wood Construction. AFPA, Washington, DC.
American Forest and Paper Association (AFPA) (2001). National Design Specification forWood Construction. AFPA, Washington, DC.
American Institute of Steel Construction (AISC) (2005). Specification for Structural SteelBuildings. AISC, Chicago, IL.
California Department of T ransportation (Caltrans) (2001). Falsework Manual (updatedNovember 2001). Caltrans Structure Construction, Sacramento, CA.
Chen, W .F., and Newlin, D.E. (1973). "Column W eb S trength in Beam-to-ColumnConnections." J. Struct. Div., 99(ST9), 1978-1984.
Elgaaly, M.(1983). "W eb Design U nder Compressive Edge Loads." Engrg. J., FourthQuarter, 153-171.
Galambos, T.V.(1976). Proposed Criteria for Load and Resistance Factor Design of SteelBuilding Structures. Research Report No. 45, Civil E ngineering Department, WashingtonUniversity, St Louis, MO.
Graciano, C., and Edlund, B. (2003). "Failure Mechanism of Slender Girder Webs with aLongitudinal Stiffener under Patch Loading." J. of Const. Steel Research, 59, 27-45.
Graham, J.D., Sherbourne, A.N., and Khabbaz, R.N. (1959). Welded Interior Beam-to-Column Connections. American Iron and Steel Institute, Inc., Chicago, IL.
Hadipriono, F.C. and W ang, H-K. (1986) Analys is of Causes of Fa lsework Failures inConcrete Structures.” J. of Construction Eng. and Management, 112(1), 112-121.
Hibbett, Karlson & So rensen, Inc. (2003). ABAQUS - Finite Element Program. Hibbett,Karlson & Sorensen, Inc., Fremont, CA.
Roberts, T .M., and Rockey , K.C. (1979). "A Mechanism Soluti on for Predicting theCollapse Loads for Slender Pl ate Girders when S ubjected to In-Plane Patch Loading."Proc. Instn. Civ.Engrs., 67(2), 155-175.
Roberts, T .M., and Markovic, N. (1983), "Stocky Plate Girders Subjected to EdgeLoading." Proc. Instn. Civ.Engrs., 75(2), 539-550.
Roberts, T.M., and Newark, A.C.B. (1997). "S trength of Webs Subjected to CompressiveEdge Loading." J. of Struct. Engrg., 123(2), 176-183.
125

Terry, A.S., and Easterling, W.S. (2000). “Behavior of Bottom Flange Bending Beam-to-Girder Connections.” Proceedings of the Fourth International Workshop on Connectionsin Steel Structures, Roanoke, VA, October 22-25.
Timoshenko S.P and Gere J.M., 1961. Theory of Elastic Stability. McGraw Hill Book Co.York, PA. 348-389.
126
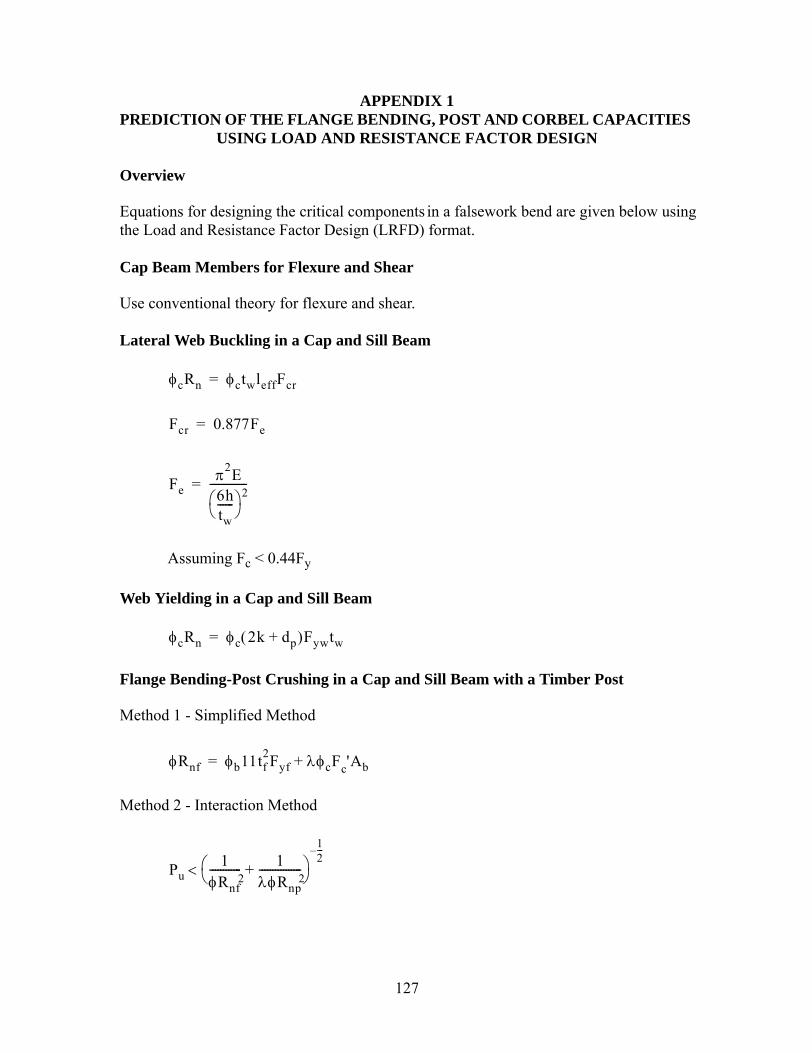
APPENDIX 1PREDICTION OF THE FLANGE BENDING, POST AND CORBEL CAPACITIES
USING LOAD AND RESISTANCE FACTOR DESIGN
Overview
Equations for designing the critical components in a falsework bend are given below usingthe Load and Resistance Factor Design (LRFD) format.
Cap Beam Members for Flexure and Shear
Use conventional theory for flexure and shear.
Lateral Web Buckling in a Cap and Sill Beam
Assuming Fc < 0.44Fy
Web Yielding in a Cap and Sill Beam
Flange Bending-Post Crushing in a Cap and Sill Beam with a Timber Post
Method 1 - Simplified Method
Method 2 - Interaction Method
φcRn φctwleffFcr=
Fcr 0.877Fe=
Feπ2E6htw------⎝ ⎠⎛ ⎞ 2--------------=
φcRn φc 2k dp+( )Fywtw=
φRnf φb11tf2Fyf λφcFc'Ab+=
Pu1
φRnf2
------------ 1λφRnp
2----------------+⎝ ⎠
⎛ ⎞12---–
<
127
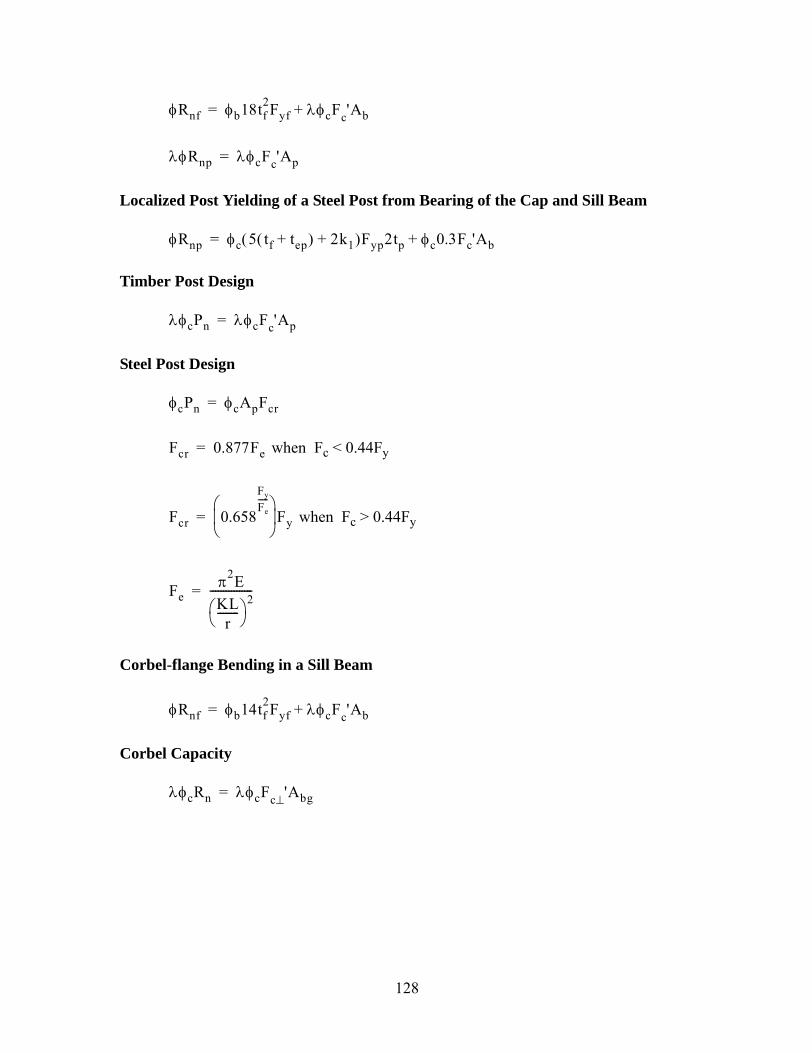
Localized Post Yielding of a Steel Post from Bearing of the Cap and Sill Beam
Timber Post Design
Steel Post Design
when Fc < 0.44Fy
when Fc > 0.44Fy
Corbel-flange Bending in a Sill Beam
Corbel Capacity
φRnf φb18tf2Fyf λφcFc'Ab+=
λφRnp λφcFc'Ap=
φRnp φc 5 tf tep+( ) 2k1+( )Fyp2tp φc0.3Fc'Ab+=
λφcPn λφcFc'Ap=
φcPn φcApFcr=
Fcr 0.877Fe=
Fcr 0.658
Fy
Fe-----
⎝ ⎠⎜ ⎟⎛ ⎞
Fy=
Feπ2EKL
r--------⎝ ⎠⎛ ⎞ 2----------------=
φRnf φb14tf2Fyf λφcFc'Ab+=
λφcRn λφcFc⊥'Abg=
128

129
APPENDIX 2GENERAL LAYOUT AND TYPICAL CROSS SECTIONS OF BRIDGE
FALSEWORK FOR THE ARCH ROAD STAGE 4 BRIDGE


132

133
LIST OF CCEER PUBLICATIONS Report No. Publication CCEER-84-1 Saiidi, M., and R. Lawver, "User's Manual for LZAK-C64, A Computer Program to
Implement the Q-Model on Commodore 64," Civil Engineering Department, Report No. CCEER-84-1, University of Nevada, Reno, January 1984.
CCEER-84-2 Douglas, B. and T. Iwasaki, "Proceedings of the First USA-Japan Bridge Engineering
Workshop," held at the Public Works Research Institute, Tsukuba, Japan, Civil Engineering Department, Report No. CCEER-84-2, University of Nevada, Reno, April 1984.
CCEER-84-3 Saiidi, M., J. Hart, and B. Douglas, "Inelastic Static and Dynamic Analysis of Short R/C
Bridges Subjected to Lateral Loads," Civil Engineering Department, Report No. CCEER-84-3, University of Nevada, Reno, July 1984.
CCEER-84-4 Douglas, B., "A Proposed Plan for a National Bridge Engineering Laboratory," Civil
Engineering Department, Report No. CCEER-84-4, University of Nevada, Reno, December 1984.
CCEER-85-1 Norris, G. and P. Abdollaholiaee, "Laterally Loaded Pile Response: Studies with the
Strain Wedge Model," Civil Engineering Department, Report No. CCEER-85-1, University of Nevada, Reno, April 1985.
CCEER-86-1 Ghusn, G. and M. Saiidi, "A Simple Hysteretic Element for Biaxial Bending of R/C in
NEABS-86," Civil Engineering Department, Report No. CCEER-86-1, University of Nevada, Reno, July 1986.
CCEER-86-2 Saiidi, M., R. Lawver, and J. Hart, "User's Manual of ISADAB and SIBA, Computer
Programs for Nonlinear Transverse Analysis of Highway Bridges Subjected to Static and Dynamic Lateral Loads," Civil Engineering Department, Report No. CCEER-86-2, University of Nevada, Reno, September 1986.
CCEER-87-1 Siddha rthan, R., "Dynamic Effective Stress Response of Surface and Embedded Footings
in Sand," Civil engineering Department, Report No. CCEER-86-2, University of Nevada, Reno, June 1987.
CCEER-87-2 Norris, G. and R. Sack, "Lateral and Rotational Stiffness of Pile Groups for Seismic
Analysis of Highway Bridges," Civil Engineering Department, Report No. CCEER-87-2, University of Nevada, Reno, June 1987.
CCEER-88-1 Orie, J. and M. Saiidi, "A Preliminary Study of One-Way Reinforced Concrete Pier
Hinges Subjected to Shear and Flexure," Civil Engineering Department, Report No. CCEER-88-1, University of Nevada, Reno, January 1988.
CCEER-88-2 Orie, D., M. Saiidi, and B. Douglas, "A Micro-CAD System for Seismic Design of
Regular Highway Bridges," Civil Engineering Department, Report No. CCEER-88-2, University of Nevada, Reno, June 1988.
CCEER-88-3 Orie, D. and M. Saiidi, "User's Manual for Micro-SARB, a Microcomputer Program for
Seismic Analysis of Regular Highway Bridges," Civil Engineering Department, Report No. CCEER-88-3, University of Nevada, Reno, October 1988.
CCEER-89-1 Douglas, B., M. Saiidi, R. Hayes, and G. Holcomb, "A Comprehensive Study of the
Loads and Pressures Exerted on Wall Forms by the Placement of Concrete," Civil Engineering Department, Report No. CCEER-89-1, University of Nevada, Reno, February 1989.
134
CCEER-89-2 Richardson, J. and B. Douglas, "Dynamic Response Analysis of the Dominion Road
Bridge Test Data," Civil Engineering Department, Report No. CCEER-89-2, University of Nevada, Reno, March 1989.
CCEER-89-2 Vrontinos, S., M. Saiidi, and B. Douglas, "A Simple Model to Predict the Ultimate
Response of R/C Beams with Concrete Overlays," Civil Engineering Department, Report NO. CCEER-89-2, University of Nevada, Reno, June 1989.
CCEER-89-3 Ebrahimpour, A. and P. Jagadish, "Statistical Modeling of Bridge Traffic Loads - A Case
Study," Civil Engineering Department, Report No. CCEER-89-3, University of Nevada, Reno, December 1989.
CCEER-89-4 Shields, J. and M. Saiidi, "Direct Field Measurement of Prestress Losses in Box Girder
Bridges," Civil Engineering Department, Report No. CCEER-89-4, University of Nevada, Reno, December 1989.
CCEER-90-1 Saiidi, M., E. Maragakis, G. Ghusn, Y. Jiang, and D. Schwartz, "Survey and Evaluation
of Nevada's Transportation Infrastructure, Task 7.2 - Highway Bridges, Final Report," Civil Engineering Department, Report No. CCEER 90-1, University of Nevada, Reno, October 1990.
CCEER-90-2 Abdel-Ghaffar, S., E. Maragakis, and M. Saiidi, "Analysis of the Response of Reinforced
Concrete Structures During the Whittier Earthquake 1987," Civil Engineering Department, Report No. CCEER 90-2, University of Nevada, Reno, October 1990.
CCEER-91-1 Saiidi, M., E. Hwang, E. Maragakis, and B. Douglas, "Dynamic Testing and the Analysis
of the Flamingo Road Interchange," Civil Engineering Department, Report No. CCEER-91-1, University of Nevada, Reno, February 1991.
CCEER-91-2 Norris, G., R. Siddharthan, Z. Zafir, S. Abdel-Ghaffar, and P. Gowda, "Soil-Foundation-
Structure Behavior at the Oakland Outer Harbor Wharf," Civil Engineering Department, Report No. CCEER-91-2, University of Nevada, Reno, July 1991.
CCEER-91-3 Norris, G., "Seismic Lateral and Rotational Pile Foundation Stiffnesses at Cypress," Civil
Engineering Department, Report No. CCEER-91-3, University of Nevada, Reno, August 1991.
CCEER-91-4 O'Connor, D. and M. Saiidi, "A Study of Protective Overlays for Highway Bridge Decks
in Nevada, with Emphasis on Polyester-Styrene Polymer Concrete," Civil Engineering Department, Report No. CCEER-91-4, University of Nevada, Reno, October 1991.
CCEER-91-5 O'Connor, D.N. and M. Saiidi, "Laboratory Studies of Polyester-Styrene Polymer
Concrete Engineering Properties," Civil Engineering Department, Report No. CCEER-91-5, University of Nevada, Reno, November 1991.
CCEER-92-1 Straw, D.L. and M. Saiidi, "Scale Model Testing of One-Way Reinforced Concrete Pier
Hinges Subject to Combined Axial Force, Shear and Flexure," edited by D.N. O'Connor, Civil Engineering Department, Report No. CCEER-92-1, University of Nevada, Reno, March 1992.
CCEER-92-2 Wehbe, N., M. Saiidi, and F. Gordaninejad, "Basic Behavior of Composite Sections
Made of Concrete Slabs and Graphite Epoxy Beams," Civil Engineering Department, Report No. CCEER-92-2, University of Nevada, Reno, August 1992.
CCEER-92-3 Saiidi, M. and E. Hutchens, "A Study of Prestress Changes in A Post-Tensioned Bridge
During the First 30 Months," Civil Engineering Department, Report No. CCEER-92-3, University of Nevada, Reno, April 1992.

135
CCEER-92-4 Saiidi, M., B. Douglas, S. Feng, E. Hwang, and E. Maragakis, "Effects of Axial Force on
Frequency of Prestressed Concrete Bridges," Civil Engineering Department, Report No. CCEER-92-4, University of Nevada, Reno, August 1992.
CCEER-92-5 Siddharthan, R., and Z. Zafir, "Response of Layered Deposits to Traveling Surface
Pressure Waves," Civil Engineering Department, Report No. CCEER-92-5, University of Nevada, Reno, September 1992.
CCEER-92-6 Norris, G., and Z. Zafir, "Liquefaction and Residual Strength of Loose Sands from
Drained Triaxial Tests," Civil Engineering Department, Report No. CCEER-92-6, University of Nevada, Reno, September 1992.
CCEER-92-7 Douglas, B., "Some Thoughts Regarding the Improvement of the University of Nevada,
Reno's National Academic Standing," Civil Engineering Department, Report No. CCEER-92-7, University of Nevada, Reno, September 1992.
CCEER-92-8 Saiidi, M., E. Maragakis, and S. Feng, "An Evaluation of the Current Caltrans Seismic
Restrainer Design Method," Civil Engineering Department, Report No. CCEER-92-8, University of Nevada, Reno, October 1992.
CCEER-92-9 O'Connor, D., M. Saiidi, and E. Maragakis, "Effect of Hinge Restrainers on the Response
of the Madrone Drive Undercrossing During the Loma Prieta Earthquake," Civil Engineering Department, Report No. CCEER-92-9, University of Nevada, Reno, February 1993.
CCEER-92-10 O'Connor, D., and M. Saiidi, "Laboratory Studies of Polyester Concrete: Compressive
Strength at Elevated Temperatures and Following Temperature Cycling, Bond Strength to Portland Cement Concrete, and Modulus of Elasticity," Civil Engineering Department, Report No. CCEER-92-10, University of Nevada, Reno, February 1993.
CCEER-92-11 Wehbe, N., M. Saiidi, and D. O'Connor, "Economic Impact of Passage of Spent Fuel
Traffic on Two Bridges in Northeast Nevada," Civil Engineering Department, Report No. CCEER-92-11, University of Nevada, Reno, December 1992.
CCEER-93-1 Jiang, Y., and M. Saiidi, "Behavior, Design, and Retrofit of Reinforced Concrete One-
way Bridge Column Hinges," edited by D. O'Connor, Civil Engineering Department, Report No. CCEER-93-1, University of Nevada, Reno, March 1993.
CCEER-93-2 Abdel-Ghaffar, S., E. Maragakis, and M. Saiidi, "Evaluation of the Response of the
Aptos Creek Bridge During the 1989 Loma Prieta Earthquake," Civil Engineering Department, Report No. CCEER-93-2, University of Nevada, Reno, June 1993.
CCEER-93-3 Sanders, D.H., B.M. Douglas, and T.L. Martin, "Seismic Retrofit Prioritization of Nevada
Bridges," Civil Engineering Department, Report No. CCEER-93-3, University of Nevada, Reno, July 1993.
CCEER-93-4 Abdel-Ghaffar, S., E. Maragakis, and M. Saiidi, "Performance of Hinge Restrainers in the
Huntington Avenue Overhead During the 1989 Loma Prieta Earthquake," Civil Engineering Department, Report No. CCEER-93-4, University of Nevada, Reno, June 1993 (in final preparation).
CCEER-93-5 Maragakis, E., M. Saiidi, S. Feng, and L. Flournoy, "Effects of Hinge Restrainers on the
Response of the San Gregorio Bridge During the Loma Prieta Earthquake," (in final preparation) Civil Engineering Department, Report No. CCEER-93-5, University of Nevada, Reno.
CCEER-93-6 Saiidi, M., E. Maragakis, S. Abdel-Ghaffar, S. Feng, and D. O'Connor, "Response of

136
Bridge Hinge Restrainers During Earthquakes -Field Performance, Analysis, and Design," Civil Engineering Department, Report No. CCEER-93-6, University of Nevada, Reno, May 1993.
CCEER-93-7 Wehbe, N., Saiidi, M., Maragakis, E., and Sanders, D., "Adequacy of Three Highway
Structures in Southern Nevada for Spent Fuel Transportion, Civil Engineering Department, Report No. CCEER-93-7, University of Nevada, Reno, August 1993.
CCEER-93-8 Roybal, J., Sanders, D.H., and Maragakis, E., "Vulnerability Assessment of Masonry in
the Reno-Carson City Urban Corridor," Civil Engineering Department, Report No. CCEER-93-8, University of Nevada, Reno, May 1993.
CCEER-93-9 Zafir, Z. and Siddharthan, R., "MOVLOAD: A Program to Determine the Behavior of
Nonlinear Horizontally Layered Medium Under Moving Load," Civil Engineering Department, Report No. CCEER-93-9, University of Nevada, Reno, August 1993.
CCEER-93-10 O'Connor, D.N., Saiidi, M., and Maragakis, E.A., "A Study of Bridge Column Seismic
Damage Susceptibility at the Interstate 80/U.S. 395 Interchange in Reno, Nevada," Civil Engineering Department, Report No. CCEER-93-10, University of Nevada, Reno, October 1993.
CCEER-94-1 Maragakis, E., B. Douglas, and E. Abdelwahed, "Preliminary Dynamic Analysis of a
Railroad Bridge," Report CCEER-94-1, January 1994. CCEER-94-2 Douglas, B.M., Maragakis, E.A., and Feng, S., "Stiffness Evaluation of Pile Foundation
of Cazenovia Creek Overpass," Civil Engineering Department, Report No. CCEER-94-2, University of Nevada, Reno, March 1994.
CCEER-94-3 Douglas, B.M., Maragakis, E.A., and Feng, S., "Summary of Pretest Analysis of
Cazenovia Creek Bridge," Civil Engineering Department, Report No. CCEER-94-3, University of Nevada, Reno, April 1994.
CCEER-94-4 Norris, G.M. and Madhu, R., "Liquefaction and Residual Strength of Sands from Drained
Triaxial Tests, Report 2," Civil Engineering Department, CCEER-94-4, University of Nevada, Reno, August 1994.
CCEER-94-5 Saiidi, M., Hutchens, E., and Gardella, D., "Prestress Losses in a Post-Tensioned R/C
Box Girder Bridge in Southern Nevada," Civil Engineering Department, CCEER-94-5, University of Nevada, Reno, August 1994.
CCEER-95-1 Siddharthan, R., El-Gamal, M., and Maragakis, E.A., "Nonlinear Bridge Abutment ,
Verification, and Design Curves," Civil Engineering Department, CCEER-95-1, University of Nevada, Reno, January 1995.
CCEER-95-2 Norris, G.M., Madhu, R., Valceschini, R., and Ashour, M., "Liquefaction and Residual
Strength of Loose Sands from Drained Triaxial Tests," Report 2, Civil Engineering Department, Report No. CCEER-95-2, University of Nevada, Reno, February 1995.
CCEER-95-3 Wehbe, N., Saiidi, M., Sanders, D., and Douglas, B., "Ductility of Rectangular
Reinforced Concrete Bridge Columns with Moderate Confinement,"Civil Engineering Department, Report No. CCEER-95-3, University of Nevada, Reno, July 1995.
CCEER-95-4 Martin, T., Saiidi, M., and Sanders, D., “Seismic Retrofit of Column-Pier Cap
Connections in Bridges in Northern Nevada,” Civil Engineering Department, Report No. CCEER-95-4, University of Nevada, Reno, August 1995.
CCEER-95-5 Darwish, I., Saiidi, M., and Sanders, D., “Experimental Study of Seismic Susceptibility

137
Column-Footing Connections,” Civil Engineering Department, Report No. CCEER-95-5, University of Nevada, Reno, September 1995.
CCEER-95-6 Griffin, G., Saiidi, M., and Maragakis, E., “Nonlinear Seismic Response of Isolated
Bridges and Effects of Pier Ductility Demand,” Civil Engineering Department, Report No. CCEER-95-6, University of Nevada, Reno, November 1995.
CCEER-95-7 Acharya, S., Saiidi, M., and Sanders, D., “Seismic Retrofit of Bridge Footings and
Column-Footing Connections,” Report for the Nevada Department of Transportation, Civil Engineering Department, Report No. CCEER-95-7, University of Nevada, Reno, November 1995.
CCEER-95-8 Maragakis, E., Douglas, B., and Sandirasegaram, U., “Full-Scale Field Resonance Tests
of a Railway Bridge,” A Report to the Association of American Railroads, Civil Engineering Department, Report No. CCEER-95-8, University of Nevada, Reno, December 1995.
CCEER-95-9 Douglas, B., Maragakis, E., and Feng, S., “System Identification Studies on Cazenovia
Creek Overpass,” Report for the National Center for Earthquake Engineering Research, Civil Engineering Department, Report No. CCEER-95-9, University of Nevada, Reno, October 1995.
CCEER-96-1 El-Gamal, M.E. and Siddharthan, R.V., “Programs to Computer Translational Stiffness of
Seat-Type Bridge Abutment,” Civil Engineering Department, Report No. CCEER-96-1, University of Nevada, Reno, March 1996.
CCEER-96-2 Labia, Y., Saiidi, M., and Douglas, B., “Evaluation and Repair of Full-Scale Prestressed
Concrete Box Girders,” A Report to the National Science Foundation, Research Grant CMS-9201908, Civil Engineering Department, Report No. CCEER-96-2, University of Nevada, Reno, May 1996.
CCEER-96-3 Darwish, I., Saiidi, M., and Sanders, D., “Seismic Retrofit of R/C Oblong Tapered Bridge
Columns with Inadequate Bar Anchorage in Columns and Footings,” A Report to the Nevada Department of Transportation, Civil Engineering Department, Report No. CCEER-96-3, University of Nevada, Reno, May 1996.
CCEER-96-4 Ashour, M., Pilling, P., Norris, G., and Perez, H., “The Prediction of Lateral Load
Behavior of Single Piles and Pile Groups Using the Strain Wedge Model,” A Report to the California Department of Transportation, Civil Engineering Department, Report No. CCEER-96-4, University of Nevada, Reno, June, 1996.
CCEER-97-1-A Rimal, P. and Itani, A. “Sensitivity Analysis of Fatigue Evaluations of Steel Bridges”,
Center for Earthquake Research, Department of Civil Engineering, University of Nevada, Reno, Nevada Report No. CCEER-97-1-A, September, 1997.
CCEER-97-1-B Maragakis, E., Douglas, B., and Sandirasegaram, U. “Full-Scale Field Resonance Tests
of a Railway Bridge,” A Report to the Association of American Railroads, Civil Engineering Department, University of Nevada, Reno, May, 1996.
CCEER-97-2 Wehbe, N., Saiidi, M., and D. Sanders, "Effect of Confinement and Flares on the Seismic
Performance of Reinforced Concrete Bridge Columns," Civil Engineering Department, Report No. CCEER-97-2, University of Nevada, Reno, September 1997.
CCEER-97-3 Darwish, I., M. Saiidi, G. Norris, and E. Maragakis, “Determination of In-Situ Footing
Stiffness Using Full-Scale Dynamic Field Testing,” A Report to the Nevada Department of Transportation, Structural Design Division, Carson City, Nevada, Report No. CCEER-97-3, University of Nevada, Reno, October 1997.

138
CCEER-97-4 Wehbe, N., and M. Saiidi, “User’s manual for RCMC v. 1.2 : A Computer Program for Moment-Curvature Analysis of Confined and Unconfined Reinforced Concrete Sections,” Center for Civil Engineering Earthquake Research, Department of Civil Engineering, University of Nevada, Reno, Nevada, Report No. CCEER-97-4, November, 1997.
CCEER-97-5 Isakovic, T., M. Saiidi, and A. Itani, “Influence of new Bridge Configurations on Seismic
Performance,” Department of Civil Engineering, University of Nevada, Reno, Report No. CCEER-97-5, September, 1997.
CCEER-98-1 Itani, A., Vesco, T. and Dietrich, A., “Cyclic Behavior of “as Built” Laced Members
With End Gusset Plates on the San Francisco Bay Bridge” Center for Civil Engineering Earthquake Research, Department of Civil Engineering, University of Nevada, Reno, Nevada Report No. CCEER-98-1, March, 1998.
CCEER-98-2 G. Norris and M. Ashour, “Liqueficiation and Undraned response evaluation of Sands
from Drained Formulation.” Center for Civil Engineering Earthquake Research, Department of Civil Engineering, University of Nevada, Reno, Nevada, Report No. CCEER-98-2, May, 1998.
CCEER-98-3 Qingbin, Chen, B. M. Douglas, E. Maragakis, and I. G. Buckle, "Extraction of Nonlinear
Hysteretic Properties of Seismically Isolated Bridges from Quick-Release Field Tests", Center for Civil Engineering Earthquake Research, Department of Civil Engineering, University of Nevada, Reno, Nevada, Report No. CCEER-98-3, June, 1998.
CCEER-98-4 Maragakis, E., B. M. Douglas, and C. Qingbin, "Full-Scale Field Capacity Tests of a
Railway Bridge", Center for Civil Engineering Earthquake Research, Department of Civil Engineering, University of Nevada, Reno, Nevada, Report No. CCEER-98-4, June, 1998.
CCEER-98-5 Itani, A., Douglas, B., and Woodgate, J., “Cyclic Behavior of Richmond-San Rafael
Retrofitted Tower Leg”. Center for Civil Engineering Earthquake Research, Department of Civil Engineering, University of Nevada, Reno. Report No. CCEER-98-5, June 1998
CCEER-98-6 Moore, R., Saiidi, M., and Itani, A., “Seismic Behavior of New Bridges with Skew and
Curvature”. Center for Civil Engineering Earthquake Research, Department of Civil Engineering, University of Nevada, Reno. Report No. CCEER-98-6, October, 1998.
CCEER-98-7 Itani, A and Dietrich, A, “Cyclic Behavior of Double Gusset Plate Connections”, Center
for Civil Engineering Earthquake Research, Department of Civil Engineering, University of Nevada, Reno, Nevada, Report No. CCEER-98-5, December, 1998.
CCEER-99-1 Caywood, C., M. Saiidi, and D. Sanders, “ Seismic Retrofit of Flared Bridge Columns
With Steel Jackets,” Civil Engineering Department, University of Nevada, Reno, Report No. CCEER-99-1, February 1999.
CCEER-99-2 Mangoba, N., M. Mayberry, and M. Saiidi, “Prestress Loss in Four Box Girder Bridges in
Northern Nevada,” Civil Engineering Department, University of Nevada, Reno, Report No. CCEER-99-2, March 1999.
CCEER-99-3 Abo-Shadi, N., M. Saiidi, and D. Sanders, "Seismic Response of Bridge Pier Walls in
the Weak Direction", Civil Engineering Department, University of Nevada, Reno, Report No. CCEER-99-3, April 1999.
CCEER-99-4 Buzick, A., and M. Saiidi, "Shear Strength and Shear Fatigue Behavior of Full-Scale
Prestressed Concrete Box Girders", Civil Engineering Department, University of Nevada, Reno, Report No. CCEER-99-4, April 1999.
139
CCEER-99-5 Randall, M., M. Saiidi, E. Maragakis and T. Isakovic, "Restrainer Design Procedures For Multi-Span Simply-Supported Bridges", Civil Engineering Department, University of Nevada, Reno, Report No. CCEER-99-5, April 1999.
CCEER-99-6 Wehbe, N. and M. Saiidi, "User's Manual for RCMC v. 1.2, A Computer Program for
Moment-Curvature Analysis of Confined and Unconfined Reinforced Concrete Sections", Civil Engineering Department, University of Nevada, Reno, Report No. CCEER-99-6, May 1999.
CCEER-99-7 Burda, J. and A. Itani, “Studies of Seismic Behavior of Steel Base Plates,” Civil
Engineering Department, University of Nevada, Reno, Report No. CCEER-99-7, May 1999.
CCEER-99-8 Ashour, M., and G. Norris, “Refinement of the Strain Wedge Model Program,” Civil
Engineering Department, University of Nevada, Reno, Report No. CCEER-99-8, March 1999.
CCEER-99-9 Dietrich, A., and A. Itani, “Cyclic Behavior of Laced and Perforated Steel Members on
the San Francisco-Oakland Bay Bridge,” Civil Engineering Department, University, Reno. December 1999.
CCEER 99-10 Itani, A., A. Dietrich, “Cyclic Behavior of Built Up Steel Members and their
Connections,” Civil Engineering Department, University of Nevada, Reno. December 1999.
CCEER 99-11 Itani, A., J. Woodgate, “Axial and Rotational Ductility of BuiltUp Structural Steel
Members,” Civil Engineering Department, University of Nevada, Reno December 1999. CCEER-99-12 Sgambelluri, M., Sanders, D.H., and Saiidi, M.S., Behavior of One-Way
Reinforced Concrete Bridge Column Hinges in the Weak Direction, Report No. Department of Civil Engineering, University of Nevada, Reno, December 1999.
CCEER-99-13 Laplace, P., Sanders, D.H., Douglas, B, and Saiidi, M, Shake Table Testing of Flexure
Dominated Reinforced Concrete Bridge Columns, Report No. Department of Civil Engineering, University of Nevada, Reno, December 1999.
CCEER-99-14 Ahmad M. Itani, Jose A. Zepeda, and Elizabeth A. Ware "Cyclic Behavior of Steel
Moment Frame Connections for the Moscone Center Expansion,” December 1999. CCEER 00-1 Ashour, M., and Norris, G. “Undrained Lateral Pile and Pile Group Response in
Saturated Sand”, Civil Engineering Department, University of Nevada, Reno, Report No. CCEER-00-1, May 1999. January 2000.
CCEER 00-2 Saiidi, M. and Wehbe, N., “A Comparison of Confinement Requirements in Different
Codes for Rectangular, Circular, and Double-Spiral RC Bridge Columns,” Civil Engineering Department, University of Nevada, Reno, Report No. CCEER-00-2, January 2000.
CCEER 00-3 McElhaney, B., M. Saiidi, and D. Sanders, “Shake Table Testing of Flared Bridge
Columns With Steel Jacket Retrofit,” Civil Engineering Department, University of Nevada, Reno, Report No. CCEER-00-3, January 2000.
CCEER 00-4 Martinovic, F., M. Saiidi, D. Sanders, and F. Gordaninejad, “Dynamic Testing of Non-
Prismatic Reinforced Concrete Bridge Columns Retrofitted with FRP Jackets,” Civil Engineering Department, University of Nevada, Reno, Report No. CCEER-00-4, January 2000.

140
CCEER 00-5 Itani, A., and M. Saiidi, “Seismic Evaluation of Steel Joints for UCLA Center for Health Science Westwood Replacement Hospital,” Civil Engineering Department, University of Nevada, Reno, Report No. CCEER-00-5, February 2000.
CCEER 00-6 Will, J. and D. Sanders, “High Performance Concrete Using Nevada Aggregates,” Civil
Engineering Department, University of Nevada, Reno, Report No. CCEER-00-6, May 2000.
CCEER 00-7 French, C., and M. Saiidi, “A Comparison of Static and Dynamic Performance of Models
of Flared Bridge Columns ,” Civil Engineering Department, University of Nevada, Reno, Report No. CCEER-00-7, October 2000.
CCEER 00-8 Itani, A., H. Sedarat, “Seismic Analysis of the AISI LRFD Design Example of Steel
Highway Bridges,” Civil Engineering Department, University of Nevada, Reno, Report No. CCEER 00-08, November 2000.
CCEER 00-9 Moore, J., D. Sanders, and M. Saiidi, “Shake Table Testing of 1960’s Two Column Bent
with Hinges Bases,“ Civil Engineering Department, University of Nevada, Reno, Report No. CCEER 00-09, December 2000.
CCEER 00-10 Asthana, M., D. Sanders, and M. Saiidi, “One-Way Reinforced Concrete Bridge Column
Hinges in the Weak Direction,“ Civil Engineering Department, University of Nevada, Reno, Report No. CCEER 00-10, April 2001.
CCEER 01-1 Ah Sha, H., D. Sanders, M. Saiidi, “Early Age Shrinkage and Cracking of Nevada
Concrete Bridge Decks, “Civil Engineering Department, University of Nevada, Reno, Report No. CCEER 01-01, May 2001.
CCEER 01-2 Ashour, M. and G. Norris, “Pile Group program for Full Material Modeling an
Progressive Failure.” Civil Engineering Department, University of Nevada, Reno, Report No. CCEER 01-02, July 2001.
CCEER 01-3 Itani, A., C. Lanaud, and P. Dusicka, “Non-Linear Finite Element Analysis of Built-Up
Shear Links.” Civil Engineering Department, University of Nevada, Reno, Report No. CCEER 01-03, July 2001.
CCEER 01-4 Saiidi, M., J. Mortensen, and F. Martinovic, “Analysis and Retrofit of Fixed Flared
Columns with Glass Fiber-Reinforced Plastic Jacketing,” Civil Engineering Department, University of Nevada, Reno, Report No. CCEER 01-4, August 2001
CCEER 01-5 Saiidi, M., A. Itani, I. Buckle, and Z. Cheng,” Performance of A Full-Scale Two-Story
Wood Frame Structure Supported on Ever-Level Isolators,” Civil Engineering Department, University of Nevada, Reno, Report No. CCEER 01-5, October 2001
CCEER 01-6 Laplace, P., D. Sanders, and M. Saiidi, “Experimental Study and Analysis of Retrofitted
Flexure and Shear Dominated Circular Reinforced Concrete Bridge Columns Subjected to Shake Table Excitation, “Civil Engineering Department, University of Nevada, Reno, Report No. CCEER 01-6, June 2001.
CCEER 01-7 Reppi, F., and D. Sanders, “Removal and Replacement of Cast-in-Place, Post-tensioned,
Box Girder Bridge,“ Civil Engineering Department, University of Nevada, Reno, Report No. CCEER 01-7, December 2001.
CCEER 02-1 Pulido, C., M. Saiidi, D. Sanders, and A. Itani, ”Seismic Performance and Retrofitting of
Reinforced Concrete Bridge Bents,” Civil Engineering Department, University of Nevada, Reno, Report No. CCEER 02-1, January 2002.

141
CCEER 02-2 Yang, Q., M. Saiidi, H. Wang, and A. Itani, ”Influence of Ground Motion Incoherency on Earthquake Response of Multi-Support Structures,” Civil Engineering Department, University of Nevada, Reno, Report No. CCEER 02-2, May 2002.
CCEER 02-3 M. Saiidi, B. Gopalakrishnan, E. Reinhardt, and R. Siddharthan, A Preliminary Study of
Shake Table Response of A Two-Column Bridge Bent on Flexible Footings Civil Engineering Department, University of Nevada, Reno, Report No. CCEER 02-03, June 2002.
CCEER 02-4 Not Published CCEER 02-5 Banghart, A., Sanders, D., Saiidi, M., “Evaluation of Concrete Mixes for Filling the Steel
Arches in the Galena Creek Bridge,” Civil Engineering Department, University of Nevada, Reno, Report No. CCEER 02-05, June 2002.
CCEER 02-6 Dusicka, P., Itani, A., Buckle, I. G., “Cyclic Behavior of Shear Links and Tower Shaft
Assembley of San Francisco – Oakland Bay Bridge Tower” Civil Engineering Department, University of Nevada, Reno, Report No. CCEER 02-06, July 2002.
CCEER 02-7 Mortensen, J., and M. Saiidi, " A Performance-Based Design Method for
Confinement in Circular Columns," Civil Engineering Department, University of Nevada, Reno, Report No. CCEER 02-07, November 2002.
CCEER 03-1 Wehbe, N., and M. Saiidi, “User’s manual for SPMC v. 1.0 : A Computer Program for
Moment-Curvature Analysis of Reinforced Concrete Sections with Interlocking Spirals,” Center for Civil Engineering Earthquake Research, Department of Civil Engineering, University of Nevada, Reno, Nevada, Report No. CCEER-03-1, May, 2003.
CCEER 03-2 Wehbe, N., and M. Saiidi, “User’s manual for RCMC v. 2.0 : A Computer Program for
Moment-Curvature Analysis of Confined and Unconfined Reinforced Concrete Sections,” Center for Civil Engineering Earthquake Research, Department of Civil Engineering, University of Nevada, Reno, Nevada, Report No. CCEER-03-2, June, 2003.
CCEER 03-3 Nada, H., D. Sanders, and M. Saiidi, “ Seismic Performance of RC Bridge Frames with
Architectural-Flared Columns,” Civil Engineering Department, University of Nevada, Reno, Report No. CCEER 03-3, January 2003.
CCEER 03-4 Reinhardt, E., M. Saiidi, and R. Siddharthan, " Seismic Performance of a CFRP/
Concrete Bridge Bent on Flexible Footings." Civil Engineering Department, University of Nevada, Reno. Report No. CCEER 03-4, August 2003.
CCEER 03-5 Johnson, N., M. Saiidi, A. Itani, and S. Ladkany, “Seismic Retrofit of Octagonal
Columns with Pedestal and One-Way Hinge at the Base,” Center for Civil Engineering Earthquake Research, Department of Civil Engineering, University of Nevada, Reno, Nevada, Report No. CCEER-03-5, August 2003.
CCEER 03-6 Mortensen, C., M. Saiidi, and S. Ladkany, “Creep and Shrinkage Losses in Highly
Variable Climates,” Center for Civil Engineering Earthquake Research, Department of Civil Engineering, University of Nevada, Reno, Nevada, Report No. CCEER-03-6, September 2003.
CCEER 03- 7 Ayoub, C., M. Saiidi, and A. Itani, “A Study of Shape-Memory-Alloy-Reinforced Beams
and Cubes,” Center for Civil Engineering Earthquake Research, Department of Civil Engineering, University of Nevada, Reno, Nevada, Report No. CCEER-03-7, October 2003.

142
CCEER 03-8 Chandane, S., D. Sanders, and M. Saiidi, "Static and Dynamic Performance of RC Bridge Bents with Architectural-Flared Columns," Center for Civil Engineering Earthquake Research, Department of Civil Engineering, University of Nevada, Reno, Nevada, Report No. CCEER-03-8, November 2003.
CCEER 04-1 Olaegbe, C., and Saiidi, M., "Effect of Loading History on Shake Table Performance of
A Two-Column Bent with Infill Wall," Center for Civil Engineering Earthquake Research, Department of Civil Engineering, University of Nevada, Reno, Nevada, Report No. CCEER-04-1, January 2004.
CCEER 04-2 Johnson, R., Maragakis, E., Saiidi, M., and DesRoches, R., “Experimental Evaluation of
Seismic Performance of SMA Bridge Restrainers,” Center for Civil Engineering Earthquake Research, Department of Civil Engineering, University of Nevada, Reno, Nevada, Report No. CCEER-04-2, February 2004.
CCEER 04-3 Moustafa, K., Sanders, D., and Saiidi, M., "Impact of Aspect Ratio on Two-Column Bent
Seismic Performance," Center for Civil Engineering Earthquake Research, Department of Civil Engineering, University of Nevada, Reno, Nevada, Report No. CCEER-04-3, February 2004.
CCEER 04-4 Maragakis, E., Saiidi, M., Sanchez-Camargo, F., and Elfass, S., “Seismic Performance of
Bridge Restrainers At In-Span Hinges,” Center for Civil Engineering Earthquake Research, Department of Civil Engineering, University of Nevada, Reno, Nevada, Report No. CCEER-04-4, March 2004.
CCEER 04-5 Ashour, M., Norris, G. and Elfass, S., “Analysis of Laterally Loaded Long or
Intermediate Drilled Shafts of Small or Large Diameter in Layered Soil,” Center for Civil Engineering Earthquake Research, Department of Civil Engineering, University of Nevada, Reno, Nevada, Report No. CCEER-04-5, June 2004.
CCEER 04-6 Correal, J., Saiidi, M. and Sanders, D., “Seismic Performance of RC Bridge Columns
Reinforced with Two Interlocking Spirals,” Center for Civil Engineering Earthquake Research, Department of Civil Engineering, University of Nevada, Reno, Nevada, Report No. CCEER-04-6, August 2004.
CCEER 04-7 Dusicka, P., Itani, A. and Buckle, I., ”Cyclic Response and Low Cycle Fatigue
Characteristics of Plate Steels,” Center for Civil Engineering Earthquake Research, Department of Civil Engineering, University of Nevada, Reno, Nevada, Report No. CCEER-04-7, November 2004.
CCEER 04-8 Dusicka, P., Itani, A. and Buckle, I., ” Built-up Shear Links as Energy Dissipaters for
Seismic Protection of Bridges,” Center for Civil Engineering Earthquake Research, Department of Civil Engineering, University of Nevada, Reno, Nevada, Report No. CCEER-04-8, November 2004.
CCEER 04-9 Sureshkumar, K., Saiidi, S., Itani, A. and Ladkany, S., “Seismic Retrofit of Two-Column
Bents with Diamond Shape Columns,” Center for Civil Engineering Earthquake Research, Department of Civil Engineering, University of Nevada, Reno, Nevada, Report No. CCEER-04-9, November 2004.
CCEER 05-1 Wang, H. and Saiidi, S., “A Study of RC Columns with Shape Memory Alloy and
Engineered Cementitious Composites,” Center for Civil Engineering Earthquake Research, Department of Civil Engineering, University of Nevada, Reno, Nevada, Report No. CCEER-05-1, January 2005.
143
CCEER 05-2 Johnson, R., Saiidi, S. and Maragakis, E., "A Study of Fiber Reinforced Plastics for Seismic Bridge Restrainers," Center for Civil Engineering Earthquake Research, Department of Civil Engineering, University of Nevada, Reno, Nevada, Report No. CCEER-05-2, January 2005.
CCEER 05-3 Carden, L.P., Itani, A.M., Buckle, I.G, "Seismic Load Path in Steel Girder Bridge
Superstructures,” Center for Civil Engineering Earthquake Research, Department of Civil Engineering, University of Nevada, Reno, Nevada, Report No. CCEER-05-3, January 2005.
CCEER 05-4 Carden, L.P., Itani, A.M., Buckle, I.G, "Seismic Performance of Steel Girder Bridge
Superstructures with Ductile End Cross Frames and Seismic Isolation,” Center for Civil Engineering Earthquake Research, Department of Civil Engineering, University of Nevada, Reno, Nevada, Report No. CCEER-05-4, January 2005.
CCEER 05-5 Goodwin, E., Maragakis, M., Itani, A. and Luo, S., "Experimental Evaluation of the
Seismic Performance of Hospital Piping Subassemblies,” Center for Civil Engineering Earthquake Research, Department of Civil Engineering, University of Nevada, Reno, Nevada, Report No. CCEER-05-5, February 2005.
CCEER 05-6 Zadeh M. S., Saiidi, S, Itani, A. and Ladkany, S., "Seismic Vulnerability Evaluation and
Retrofit Design of Las Vegas Downtown Viaduct,” Center for Civil Engineering Earthquake Research, Department of Civil Engineering, University of Nevada, Reno, Nevada, Report No. CCEER-05-6, February 2005.
CCEER 05-7 Phan, V., Saiidi, S. and Anderson, J., “Near Fault (Near Field) Ground Motion Effects on
Reinforced Concrete Bridge Columns” Center for Civil Engineering Earthquake Research, Department of Civil Engineering, University of Nevada, Reno, Nevada, Report No. CCEER-05-7, August 2005.
CCEER 05-8 Carden, L., Itani, A. and Laplace, P., “Performance of Steel Props at the UNR Fire
Science Academy subjected to Repeated Fire” Center for Civil Engineering Earthquake Research, Department of Civil Engineering, University of Nevada, Reno, Nevada, Report No. CCEER-05-8, August 2005.
CCEER 05-9 Yamashita, R. and Sanders, D., “Shake Table Testing and an Analytical Study of
Unbonded Prestressed Hollow Concrete Column Constructed with Precast Segments” Center for Civil Engineering Earthquake Research, Department of Civil Engineering, University of Nevada, Reno, Nevada, Report No. CCEER-05-9, August 2005.
CCEER 05-10 Moustafa, K. D. Sanders, and M. Saiidi, “Seismic Behavior of R/C Bridge Bents with
Architectural-Flared Columns Including both Horizontal and Vertical Gaps,” Center for Civil Engineering Earthquake Research, Department of Civil Engineering, University of Nevada, Reno, Nevada, Report No. CCEER-05-10, February 2005.
CCEER 05-11 Carden, L. P., Itani, A., and Pekcan, G., “Recommendations for the Design of Beams and
Posts in Bridge Falsework,” Center for Civil Engineering Earthquake Research, Department of Civil Engineering, University of Nevada, Reno, Nevada, Report No. CCEER-05-11, January 2006.

144