fall injuries in kansas - kdhe · fall injuries in kansas ... borom held up her band and said, “i...
TRANSCRIPT
Fall Injuries in Kansas Injury Prevention and Disability Program
Falls Injuries in Kansas
Robert Moser, MD Secretary, KDHE Paula Clayton, M.S., R.D., L.D. Director, Bureau of Health Promotion, KDHE Lori Haskett Director of Injury Prevention and Disability Program Bureau of Health Promotion, KDHE Report Preparation Ghazala Perveen, M.B.B.S, Ph.D., M.P.H Director of Science and Surveillance/Health Officer II Bureau of Health Promotion, KDHE Dan Dao, M.P.H Epidemiologist Kansas Injury Prevention and Disability Program Bureau of Health Promotion, KDHE Daina Hodges Outreach Coordinator Safe Kids Kansas Bureau of Health Promotion, KDHE Contact Information For additional information please contact Bureau of Health Promotion Kansas Department of Health and Environment 1000 SW Jackson STE 230 Topeka, KS 66612 Phone: (785) 291‐3742
Wednesday, January 30, 2013
Page 1 of 31
Report Summary PLEASE NOTE: All the fall related injuries described in this report are unintentional. Intentional fall related injuries (homicide and suicide) may have different causes and demographics. Impact Fall related injuries make up a large proportion of all the unintentional injuries across the three databases. Fall related injuries were 33 percent of all the unintentional injury emergency department visits. Fifty‐nine percent of all the unintentional injury hospital discharges were fall related, and 23 percent of all unintentional injury deaths were fall related. Age Fall related injuries and deaths rates increase with age. Those 75 years and older had the highest rates of fall related emergency department visits, hospital discharges, and deaths. The fall related hospital discharge and death rates show an extreme and sudden growth as age increases. Types of Injury Different types of fall related injuries happen in different age groups. Hospital discharges showed that younger age groups would more commonly have a traumatic brain injury diagnosis as compared to older adults who would more commonly have lower extremity fractures, especially hip fractures. Race and Ethnicity Asians had the highest age‐adjusted rate of fall related emergency department visits in Kansas. Whites had the highest age‐adjusted rates of fall related hospital discharges and deaths. Non‐Hispanics had higher rates of fall related hospital discharges compared to Hispanics. Sex Females had higher age‐adjusted rates of fall related emergency department visits and hospital discharges compared to males. Males had a slightly higher age‐adjusted fall related death rate compared to females. Traumatic Brain Injuries (TBI) Throughout this report we focus on the role of TBI in fall related injuries. The severity of TBI injury diagnosis increases with age till 70 years in hospital discharges. The highest proportion of TBI related deaths occurred in those 61‐70 years old and decreases with further increase in age. Data Sources Fall related injury data are obtained from emergency department visit (stays in the hospital lasting less than
24 hours), hospital discharge (stays in the hospital of more than 24 hours), and mortality databases. Multiple
years were used to produce numbers large enough to calculate fall related EDV, Hospital discharges, and
deaths. Summary data on this page refer to year ranges mentioned below, unless otherwise noted.
Emergency Department Visits (EDV): 2007‐2009; Hospital Discharges (HD): 2006‐20010; Deaths: 2006‐2010
Introduction Falls happen throughout the life span of an individual’s life. Falling is a part of the process that toddlers
experience while learning to stand and is a ritual that most humans experience. However, some fall related
injuries alter and change individuals’ lives for the worse. A child who falls and suffers a traumatic brain injury
(TBI) may unfortunately live with a resulting physical and or mental impairment for the rest of their life. A
senior citizen who falls may break a hip, a medical event that he/she may never be able to fully recover from.
In 2010, the cost of fall related deaths among adults ages 65 years and older cost the state more than $34*
million in medical and work loss costs.
This report describes injuries and deaths due to falls in Kansas. The introduction features a summary of
findings and resources than can be used by individuals and communities. The analysis covers how Kansans are
affected by falls and which Kansans are most frequently affected by falls. The following story illustrates how
some Kansans have been affected by falls and what they are doing to prevent further injury. For more
information on policy and prevention strategies in Kansas see page 6.
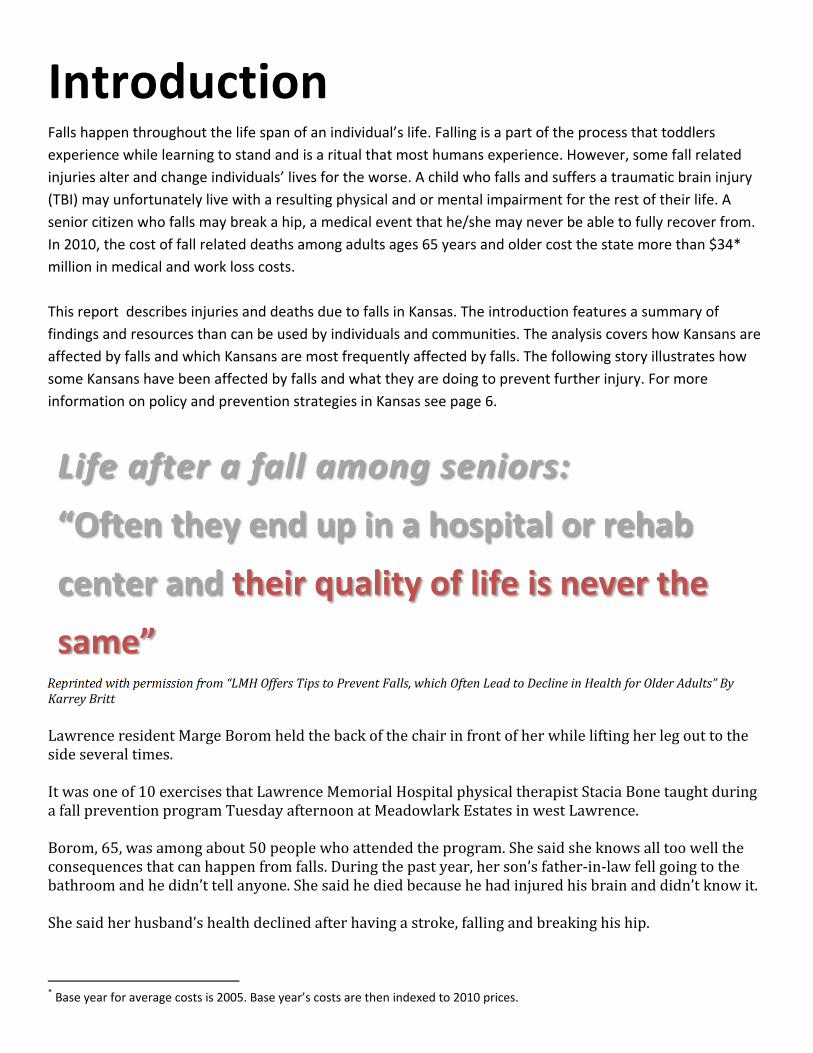
Reprintedwithpermissionfrom“LMHOffersTipstoPreventFalls,whichOftenLeadtoDeclineinHealthforOlderAdults”ByKarreyBritt LawrenceresidentMargeBoromheldthebackofthechairinfrontofherwhileliftingherlegouttothesideseveraltimes.Itwasoneof10exercisesthatLawrenceMemorialHospitalphysicaltherapistStaciaBonetaughtduringafallpreventionprogramTuesdayafternoonatMeadowlarkEstatesinwestLawrence.Borom,65,wasamongabout50peoplewhoattendedtheprogram.Shesaidsheknowsalltoowelltheconsequencesthatcanhappenfromfalls.Duringthepastyear,herson’sfather‐in‐lawfellgoingtothebathroomandhedidn’ttellanyone.Shesaidhediedbecausehehadinjuredhisbrainanddidn’tknowit.Shesaidherhusband’shealthdeclinedafterhavingastroke,fallingandbreakinghiship.
* Base year for average costs is 2005. Base year’s costs are then indexed to 2010 prices.
Life after a fall among seniors:
“Often they end up in a hospital or rehab
center and their quality of life is never the
same”

Page 3 of 31 “Hewentdownhillfromthere,”shesaid.Hewentfromusingacanetoawalkerandthentoawheelchair.Hediedfouryearsagoatage92.“Theytoldhimtowalk,whichhedidn’tdo,”shesaid.Bone,whohasbeenaphysicaltherapistfor15years,emphasizedthatthebestwaytopreventfallsistoexerciseregularlytoimprovestrengthandbalance.“It’ssoimportanttomove,”shesaid.….AynsleyAnderson,LMHcommunityeducationcoordinator,saidtheproblemisonlygoingtoescalateasthepopulationcontinuestogrowolder.In2011,therewereabout3,178LMHemergencyroomvisitsduetofallsbeingeithertheprimaryorsecondaryreasonforthevisit.Therewere899fromslippingand282fromfallingonstepsorstairs.“It’sahugeproblem,”Andersonsaid.“Oftentheyendupinahospitalorrehabcenterandtheirqualityoflifeisneverthesame,andalotofpeoplediefromfalls.It’sahugecauseofdeathforolderfolks,particularlyoldermenfallingoffroofs.”AmongAnderson’srecommendationstohelppreventfalls:
• Regularexercise.Shesaidsometimesseniorsareafraidtoexerciseiftheyhavefallen,butit’sworseiftheydon’tbecausetheylosestrength,becomeunstableandincreasetheirchancesoffallingagain.“Itbecomesaviciouscycle,”shesaid.
• Takeyourtime.Beingrushedordistractedincreasesthechancesoffalling.Also,takeyour
timegettingupfromachairoroutofbed.
• Checkmedications.It’simportanttogoovermedicationsandsupplementswithapharmacistordoctorregularlybecausetheymaycausedizzinessordrowsiness.
• Checkvisionannually.Peoplemaybewearingthewrongglassesorhaveaconditionlike
glaucomaorcataractsthatlimitsvision.
• Homesafety.About50percentofallfallshappenathome,andtheNo.1placeisthebathroom.It’simportanttousenonslipmatsandhavegrabbarsintheshowerandnexttotoilet.Othertipsincluderemovingclutterandcords,andimprovinglighting.
• Wearappropriatefootwearandclothing.Sometimes,peopletripoverclothesthataretoolong.
VirginiaKurata,89,ofLawrence,wasamongthosewhoattendedtheprogramandexperiencedafallherself.Shesaidshetrippedoverthecornerofashoppingbagwhilecarryinggroceriesintothehouseandfellonherkneeandtotheside.Shewasalone,andittookawhileforhertogetup,butshedidandwasabletorecuperateathome.“Ithoughtatthetime,‘I’vejustgottobemorecareful,’”shesaid.“I’mgladitwasn’tworse.”

Kuratasaidherclosefriendfellwhilewalkingonasidewalkandlandedfacefirst.Shesaidherfacewassobruisedthatshedidn’teatwiththeothersinherassistedlivingfacilityuntilithealed.“Shemissedthesocialization,”shesaid.KurataandBoromsaidtheprogramremindedthemabouttheimportanceofexercise.LMHprovidedanexerciseguideandfreeelasticexercisebandstotheparticipants.Boromheldupherbandandsaid,“Ihaveoneoftheseathomeandit’shangingonmydoorknob.”Now,sheplanstoputittouseinhopesofpreventinganotherfall.Shesaidshefellandhitherhead,andherdoctorransometestsandfoundthatshewasOK.“I’mverythankful,”shesaid.‐KB
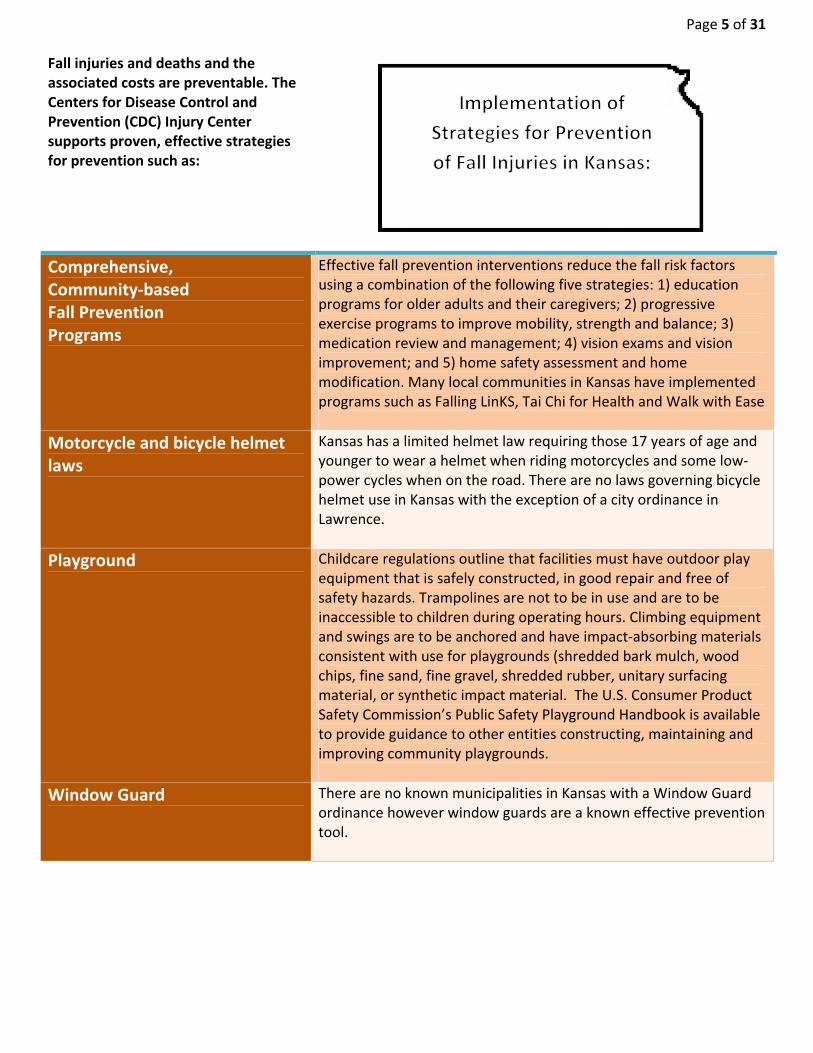
Page 5 of 31 Fall injuries and deaths and the associated costs are preventable. The Centers for Disease Control and Prevention (CDC) Injury Center supports proven, effective strategies for prevention such as:
Comprehensive, Community‐based Fall Prevention Programs
Effective fall prevention interventions reduce the fall risk factors using a combination of the following five strategies: 1) education programs for older adults and their caregivers; 2) progressive exercise programs to improve mobility, strength and balance; 3) medication review and management; 4) vision exams and vision improvement; and 5) home safety assessment and home modification. Many local communities in Kansas have implemented programs such as Falling LinKS, Tai Chi for Health and Walk with Ease
Motorcycle and bicycle helmet laws
Kansas has a limited helmet law requiring those 17 years of age and younger to wear a helmet when riding motorcycles and some low‐power cycles when on the road. There are no laws governing bicycle helmet use in Kansas with the exception of a city ordinance in Lawrence.
Playground
Childcare regulations outline that facilities must have outdoor play equipment that is safely constructed, in good repair and free of safety hazards. Trampolines are not to be in use and are to be inaccessible to children during operating hours. Climbing equipment and swings are to be anchored and have impact‐absorbing materials consistent with use for playgrounds (shredded bark mulch, wood chips, fine sand, fine gravel, shredded rubber, unitary surfacing material, or synthetic impact material. The U.S. Consumer Product Safety Commission’s Public Safety Playground Handbook is available to provide guidance to other entities constructing, maintaining and improving community playgrounds.
Window Guard
There are no known municipalities in Kansas with a Window Guard ordinance however window guards are a known effective prevention tool.
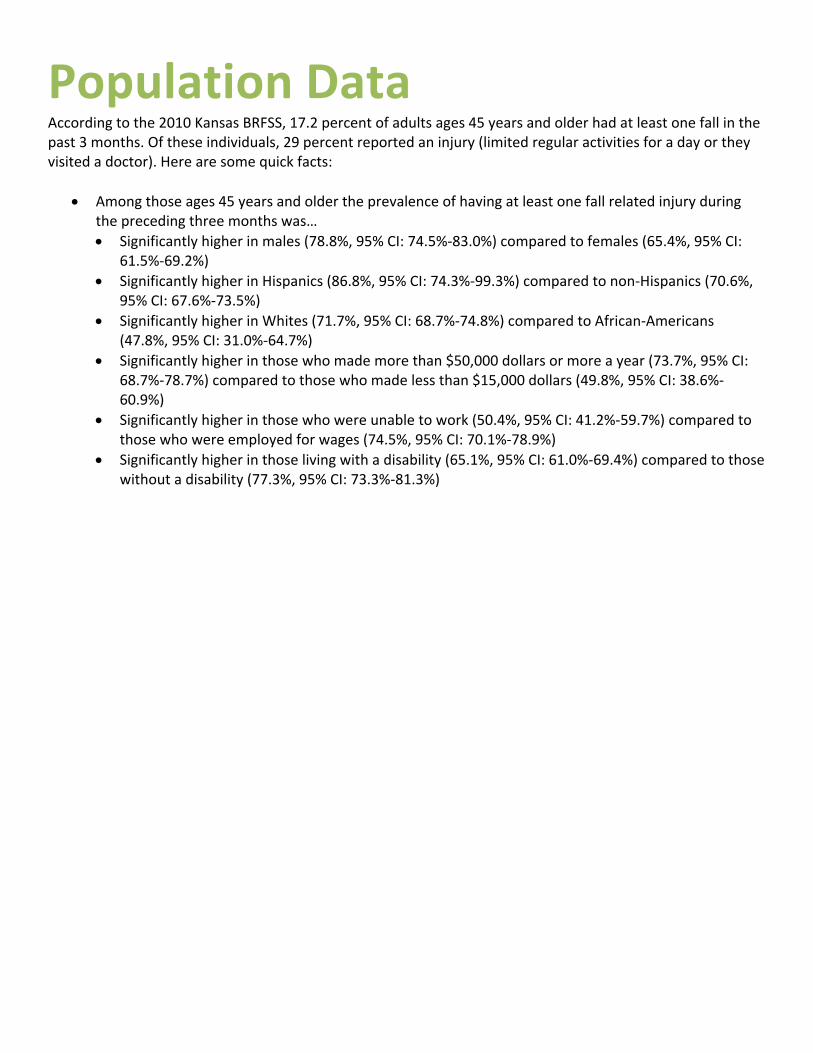
Population Data According to the 2010 Kansas BRFSS, 17.2 percent of adults ages 45 years and older had at least one fall in the past 3 months. Of these individuals, 29 percent reported an injury (limited regular activities for a day or they visited a doctor). Here are some quick facts:
Among those ages 45 years and older the prevalence of having at least one fall related injury during the preceding three months was…
Significantly higher in males (78.8%, 95% CI: 74.5%‐83.0%) compared to females (65.4%, 95% CI: 61.5%‐69.2%)
Significantly higher in Hispanics (86.8%, 95% CI: 74.3%‐99.3%) compared to non‐Hispanics (70.6%, 95% CI: 67.6%‐73.5%)
Significantly higher in Whites (71.7%, 95% CI: 68.7%‐74.8%) compared to African‐Americans (47.8%, 95% CI: 31.0%‐64.7%)
Significantly higher in those who made more than $50,000 dollars or more a year (73.7%, 95% CI: 68.7%‐78.7%) compared to those who made less than $15,000 dollars (49.8%, 95% CI: 38.6%‐60.9%)
Significantly higher in those who were unable to work (50.4%, 95% CI: 41.2%‐59.7%) compared to those who were employed for wages (74.5%, 95% CI: 70.1%‐78.9%)
Significantly higher in those living with a disability (65.1%, 95% CI: 61.0%‐69.4%) compared to those without a disability (77.3%, 95% CI: 73.3%‐81.3%)
Page 7 of 31
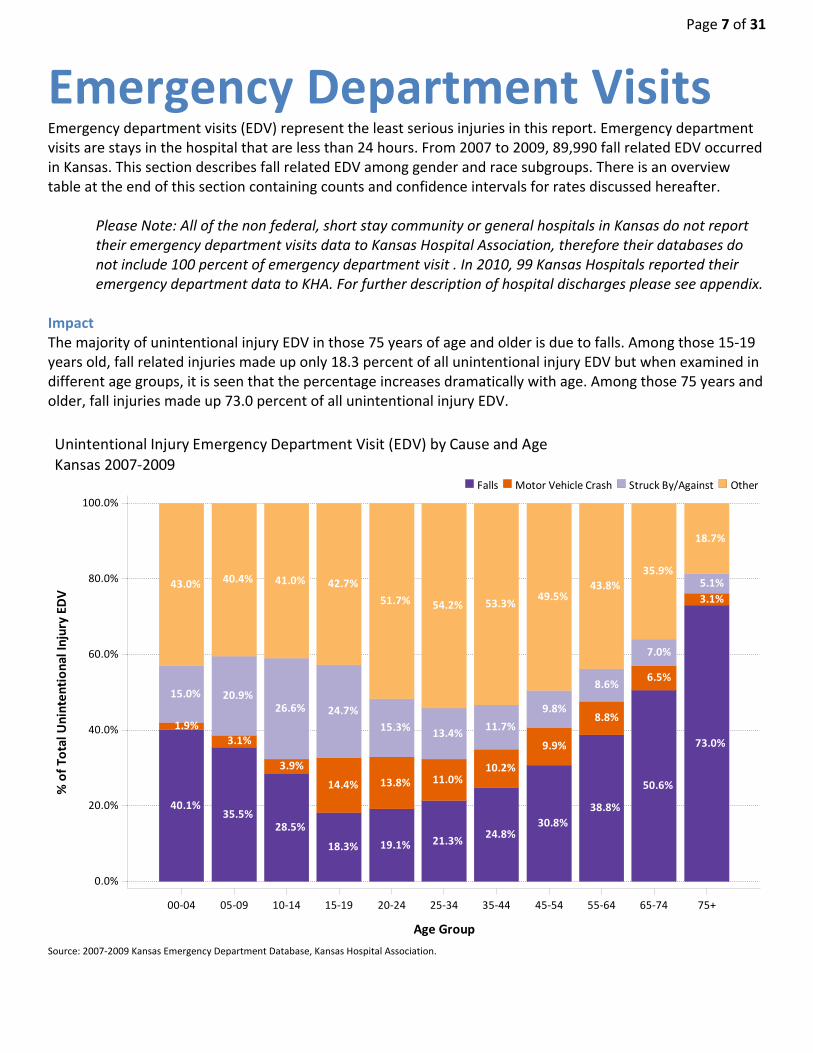
Emergency Department Visits Emergency department visits (EDV) represent the least serious injuries in this report. Emergency department visits are stays in the hospital that are less than 24 hours. From 2007 to 2009, 89,990 fall related EDV occurred in Kansas. This section describes fall related EDV among gender and race subgroups. There is an overview table at the end of this section containing counts and confidence intervals for rates discussed hereafter.
Please Note: All of the non federal, short stay community or general hospitals in Kansas do not report their emergency department visits data to Kansas Hospital Association, therefore their databases do not include 100 percent of emergency department visit . In 2010, 99 Kansas Hospitals reported their emergency department data to KHA. For further description of hospital discharges please see appendix.
Impact The majority of unintentional injury EDV in those 75 years of age and older is due to falls. Among those 15‐19 years old, fall related injuries made up only 18.3 percent of all unintentional injury EDV but when examined in different age groups, it is seen that the percentage increases dramatically with age. Among those 75 years and older, fall injuries made up 73.0 percent of all unintentional injury EDV.
Source: 2007‐2009 Kansas Emergency Department Database, Kansas Hospital Association.
40.1%
1.9%
15.0%
43.0%
35.5%
3.1%
20.9%
40.4%
28.5%
3.9%
26.6%
41.0%
18.3%
14.4%
24.7%
42.7%
19.1%
13.8%
15.3%
51.7%
21.3%
11.0%
13.4%
54.2%
24.8%
10.2%
11.7%
53.3%
30.8%
9.9%
9.8%
49.5%
38.8%
8.8%
8.6%
43.8%
50.6%
6.5%
7.0%
35.9%
73.0%
3.1%
5.1%
18.7%
0.0%
20.0%
40.0%
60.0%
80.0%
100.0%
% of To
tal U
nintentional Injury EDV
00‐04 05‐09 10‐14 15‐19 20‐24 25‐34 35‐44 45‐54 55‐64 65‐74 75+
Age Group
OtherStruck By/AgainstMotor Vehicle CrashFalls
Unintentional Injury Emergency Department Visit (EDV) by Cause and Age
Kansas 2007‐2009
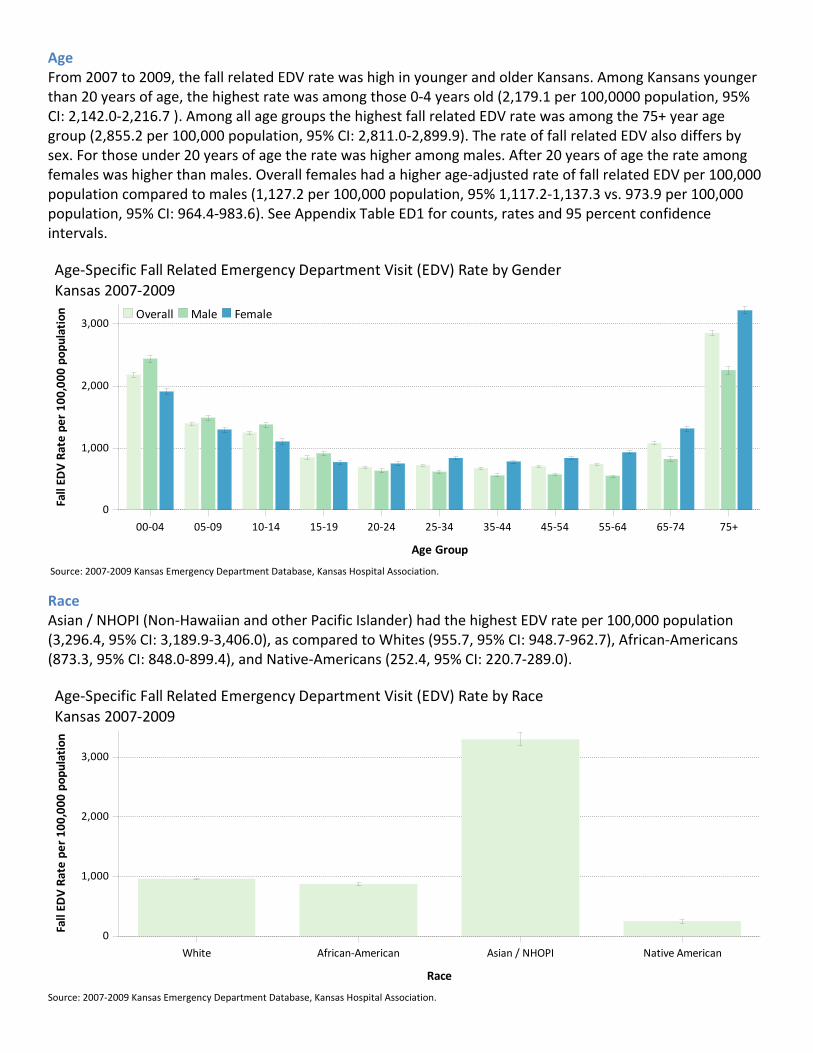
Age From 2007 to 2009, the fall related EDV rate was high in younger and older Kansans. Among Kansans younger than 20 years of age, the highest rate was among those 0‐4 years old (2,179.1 per 100,0000 population, 95% CI: 2,142.0‐2,216.7 ). Among all age groups the highest fall related EDV rate was among the 75+ year age group (2,855.2 per 100,000 population, 95% CI: 2,811.0‐2,899.9). The rate of fall related EDV also differs by sex. For those under 20 years of age the rate was higher among males. After 20 years of age the rate among females was higher than males. Overall females had a higher age‐adjusted rate of fall related EDV per 100,000 population compared to males (1,127.2 per 100,000 population, 95% 1,117.2‐1,137.3 vs. 973.9 per 100,000 population, 95% CI: 964.4‐983.6). See Appendix Table ED1 for counts, rates and 95 percent confidence intervals.
Source: 2007‐2009 Kansas Emergency Department Database, Kansas Hospital Association.
Race Asian / NHOPI (Non‐Hawaiian and other Pacific Islander) had the highest EDV rate per 100,000 population (3,296.4, 95% CI: 3,189.9‐3,406.0), as compared to Whites (955.7, 95% CI: 948.7‐962.7), African‐Americans (873.3, 95% CI: 848.0‐899.4), and Native‐Americans (252.4, 95% CI: 220.7‐289.0).
Source: 2007‐2009 Kansas Emergency Department Database, Kansas Hospital Association.
0
1,000
2,000
3,000
Fall ED
V Rate per 100,000 population
00‐04 05‐09 10‐14 15‐19 20‐24 25‐34 35‐44 45‐54 55‐64 65‐74 75+
Age Group
FemaleMaleOverall
Age‐Specific Fall Related Emergency Department Visit (EDV) Rate by Gender
Kansas 2007‐2009
0
1,000
2,000
3,000
Fall ED
V Rate per 100,000 population
White African‐American Asian / NHOPI Native American
Race
Age‐Specific Fall Related Emergency Department Visit (EDV) Rate by Race
Kansas 2007‐2009
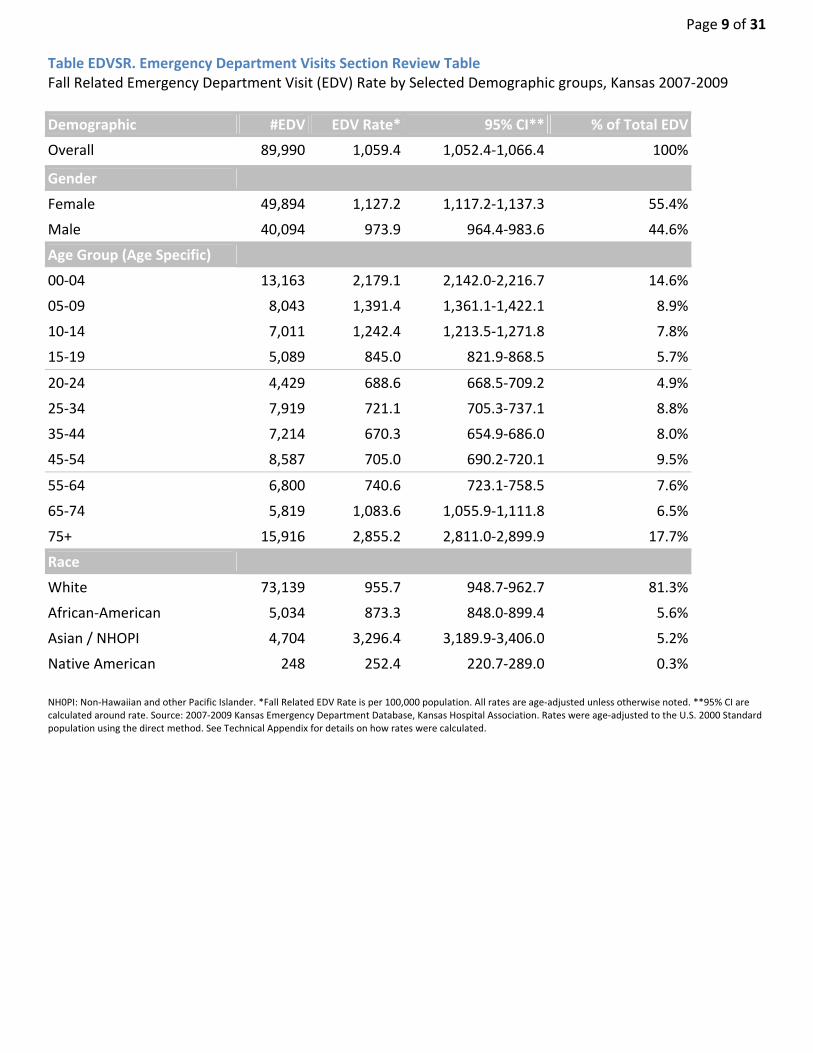
Page 9 of 31 Table EDVSR. Emergency Department Visits Section Review Table Fall Related Emergency Department Visit (EDV) Rate by Selected Demographic groups, Kansas 2007‐2009
Demographic #EDV EDV Rate* 95% CI** % of Total EDV
Overall 89,990 1,059.4 1,052.4‐1,066.4 100%
Gender
Female 49,894 1,127.2 1,117.2‐1,137.3 55.4%
Male 40,094 973.9 964.4‐983.6 44.6%
Age Group (Age Specific)
00‐04 13,163 2,179.1 2,142.0‐2,216.7 14.6%
05‐09 8,043 1,391.4 1,361.1‐1,422.1 8.9%
10‐14 7,011 1,242.4 1,213.5‐1,271.8 7.8%
15‐19 5,089 845.0 821.9‐868.5 5.7%
20‐24 4,429 688.6 668.5‐709.2 4.9%
25‐34 7,919 721.1 705.3‐737.1 8.8%
35‐44 7,214 670.3 654.9‐686.0 8.0%
45‐54 8,587 705.0 690.2‐720.1 9.5%
55‐64 6,800 740.6 723.1‐758.5 7.6%
65‐74 5,819 1,083.6 1,055.9‐1,111.8 6.5%
75+ 15,916 2,855.2 2,811.0‐2,899.9 17.7%
Race
White 73,139 955.7 948.7‐962.7 81.3%
African‐American 5,034 873.3 848.0‐899.4 5.6%
Asian / NHOPI 4,704 3,296.4 3,189.9‐3,406.0 5.2%
Native American 248 252.4 220.7‐289.0 0.3%
NH0PI: Non‐Hawaiian and other Pacific Islander. *Fall Related EDV Rate is per 100,000 population. All rates are age‐adjusted unless otherwise noted. **95% CI are calculated around rate. Source: 2007‐2009 Kansas Emergency Department Database, Kansas Hospital Association. Rates were age‐adjusted to the U.S. 2000 Standard population using the direct method. See Technical Appendix for details on how rates were calculated.

Hospital Discharge Hospital discharges (HD) occur when a person stays in the hospital for at least 24 hours. From 2006 to 2010, 40,192 fall related HD occurred in Kansas. This section describes gender, age, race, ethnicity, injury type and trends of fall related HD. There is an overview table at the end of this section containing counts and confidence intervals for rates discussed hereafter.
Please Note: All of the non federal, short stay community or general hospitals in Kansas do not report their hospital discharge data to Kansas Hospital Association; therefore their databases do not include 100 percent of hospital discharges. In 2010, 127 Kansas Hospitals reported their hospital discharge data to KHA. For further description of hospital discharges please see appendix.
Impact Fall injuries are the leading cause of unintentional injury HD in Kansas and its percentage increases with age. Once adults reach the age of 55 years, more than half of all unintentional injury HD are caused by fall related injuries. Among those 15‐19 years old, fall injuries are least common, making up only 12.2 percent of all unintentional injury HD. Among those 75 years and older, nearly 90 percent of all unintentional injury HD are due to falls.
Source: 2006‐2010 Kansas Hospital Discharge Database, Kansas Hospital Association.
29.3%
6.1%
64.6%
33.1%
17.7%
49.2%
27.3%
20.0%
52.7%
12.2%
45.6%
42.2%
14.4%
44.6%
41.0%
21.3%
36.4%
42.2%
28.2%
29.1%
42.7%
38.5%
21.7%
39.8%
56.6%
14.9%
28.5%
70.5%
8.6%
20.9%
87.1%
2.8%
10.1%
0.0%
20.0%
40.0%
60.0%
80.0%
100.0%
% of Total U
nintentional Injury HD
00‐04 05‐09 10‐14 15‐19 20‐24 25‐34 35‐44 45‐54 55‐64 65‐74 75+
Age Group
OtherMotor Vehicle CrashFalls
Unintentional Injury Hospital Discharge (HD) by Cause and Age
Kansas 2006‐2010
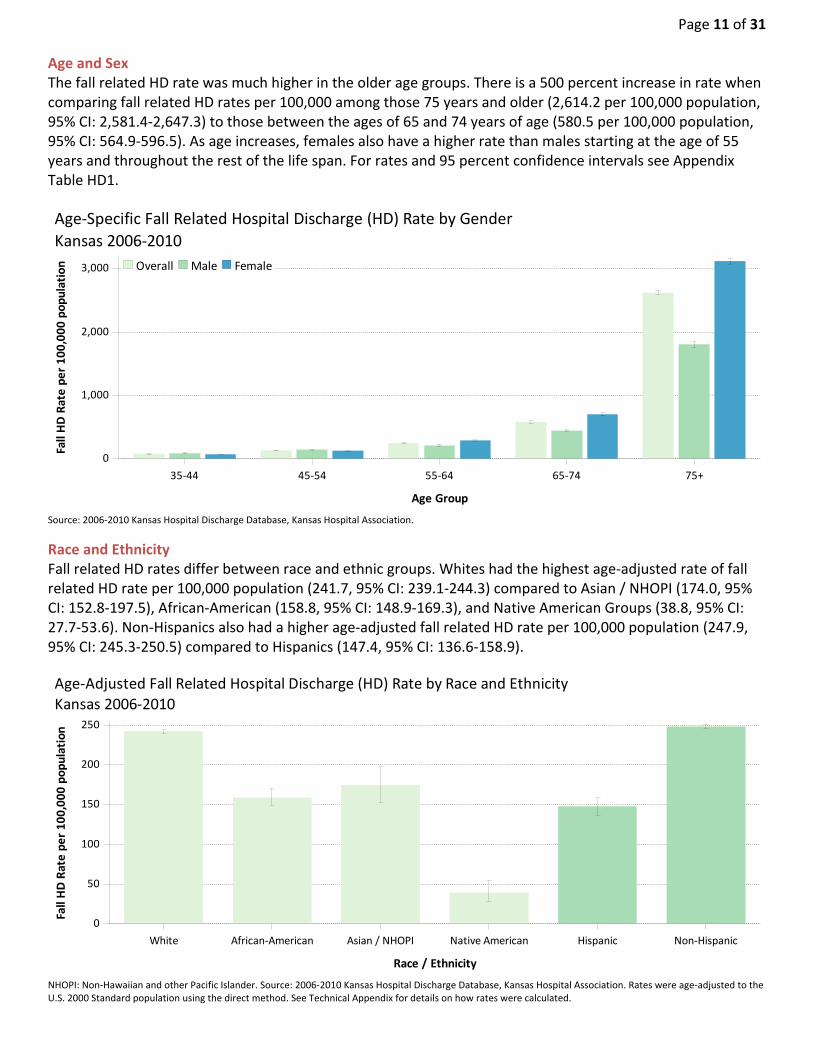
Page 11 of 31 Age and Sex The fall related HD rate was much higher in the older age groups. There is a 500 percent increase in rate when comparing fall related HD rates per 100,000 among those 75 years and older (2,614.2 per 100,000 population, 95% CI: 2,581.4‐2,647.3) to those between the ages of 65 and 74 years of age (580.5 per 100,000 population, 95% CI: 564.9‐596.5). As age increases, females also have a higher rate than males starting at the age of 55 years and throughout the rest of the life span. For rates and 95 percent confidence intervals see Appendix Table HD1.
Source: 2006‐2010 Kansas Hospital Discharge Database, Kansas Hospital Association.
Race and Ethnicity Fall related HD rates differ between race and ethnic groups. Whites had the highest age‐adjusted rate of fall related HD rate per 100,000 population (241.7, 95% CI: 239.1‐244.3) compared to Asian / NHOPI (174.0, 95% CI: 152.8‐197.5), African‐American (158.8, 95% CI: 148.9‐169.3), and Native American Groups (38.8, 95% CI: 27.7‐53.6). Non‐Hispanics also had a higher age‐adjusted fall related HD rate per 100,000 population (247.9, 95% CI: 245.3‐250.5) compared to Hispanics (147.4, 95% CI: 136.6‐158.9).
NHOPI: Non‐Hawaiian and other Pacific Islander. Source: 2006‐2010 Kansas Hospital Discharge Database, Kansas Hospital Association. Rates were age‐adjusted to the U.S. 2000 Standard population using the direct method. See Technical Appendix for details on how rates were calculated.
0
1,000
2,000
3,000
Fall HD Rate per 100,000 population
35‐44 45‐54 55‐64 65‐74 75+
Age Group
FemaleMaleOverall
Age‐Specific Fall Related Hospital Discharge (HD) Rate by Gender
Kansas 2006‐2010
0
50
100
150
200
250
Fall HD Rate per 100,000 population
White African‐American Asian / NHOPI Native American Hispanic Non‐Hispanic
Race / Ethnicity
Age‐Adjusted Fall Related Hospital Discharge (HD) Rate by Race and Ethnicity
Kansas 2006‐2010

Discharge Disposition† by Age Many older adults have fears about falls which can lead to reduction and avoidance of activitiesi. In Kansas older adults are more commonly discharged to ‘skilled nursing facility’ for a fall related HD. Among those 20 years old and younger, nearly all (95.8%) are discharged to go home after a fall related HD. For adults 81‐90 years old, 41.8 percent were discharged to a skilled nursing facility.
For more information on Discharge Disposition groupings see appendix. Source: 2006‐2010 Kansas Hospital Discharge Database, Kansas Hospital Association. Rates were age‐adjusted to the U.S. 2000 Standard population using the direct method. See Technical Appendix for details on how rates were calculated.
† For more Info on how we define discharge disposition please see appendix
95.8%
4.0%
84.0%
14.6%
62.4%
30.1%
7.6%
37.9%
43.1%
19.0%
21.7%
47.1%
31.2%
11.2%
47.0%
41.8%
7.9%
45.4%
46.7%
0.0%
20.0%
40.0%
60.0%
80.0%
100.0%
% of Fall HD
0‐20 21‐40 41‐60 61‐70 71‐80 81‐90 91+
Age Group
Skilled Nursing FacilityOtherHome
Discharge Disposition of Fall Related Hospital Discharge (HD) by Age
Kansas 2006‐2010
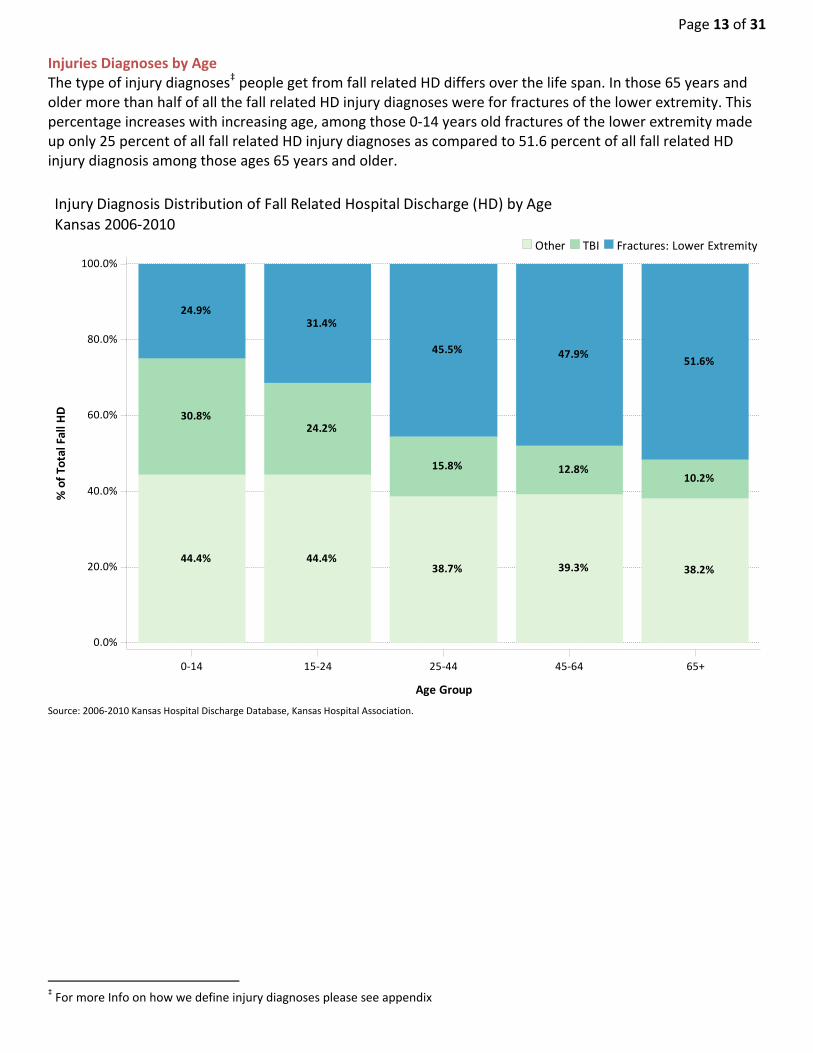
Page 13 of 31 Injuries Diagnoses by Age The type of injury diagnoses‡ people get from fall related HD differs over the life span. In those 65 years and older more than half of all the fall related HD injury diagnoses were for fractures of the lower extremity. This percentage increases with increasing age, among those 0‐14 years old fractures of the lower extremity made up only 25 percent of all fall related HD injury diagnoses as compared to 51.6 percent of all fall related HD injury diagnosis among those ages 65 years and older.
Source: 2006‐2010 Kansas Hospital Discharge Database, Kansas Hospital Association.
‡ For more Info on how we define injury diagnoses please see appendix
44.4% 44.4%38.7% 39.3% 38.2%
30.8%24.2%
15.8% 12.8%10.2%
24.9%31.4%
45.5% 47.9%51.6%
0.0%
20.0%
40.0%
60.0%
80.0%
100.0%
% of Total Fall H
D
0‐14 15‐24 25‐44 45‐64 65+
Age Group
Fractures: Lower ExtremityTBIOther
Injury Diagnosis Distribution of Fall Related Hospital Discharge (HD) by Age
Kansas 2006‐2010
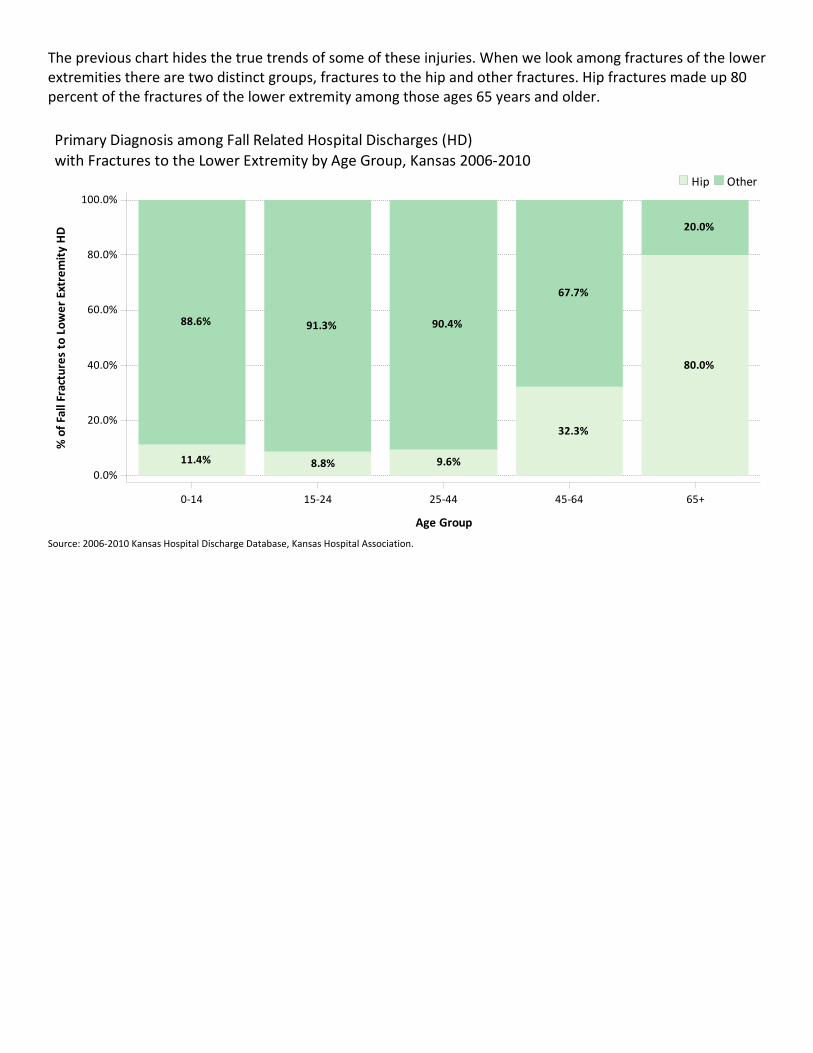
The previous chart hides the true trends of some of these injuries. When we look among fractures of the lower extremities there are two distinct groups, fractures to the hip and other fractures. Hip fractures made up 80 percent of the fractures of the lower extremity among those ages 65 years and older.
Source: 2006‐2010 Kansas Hospital Discharge Database, Kansas Hospital Association.
11.4%
88.6%
8.8%
91.3%
9.6%
90.4%
32.3%
67.7%
80.0%
20.0%
0.0%
20.0%
40.0%
60.0%
80.0%
100.0%
% of Fall Fractures to Lower Extremity HD
0‐14 15‐24 25‐44 45‐64 65+
Age Group
OtherHip
Primary Diagnosis among Fall Related Hospital Discharges (HD)
with Fractures to the Lower Extremity by Age Group, Kansas 2006‐2010
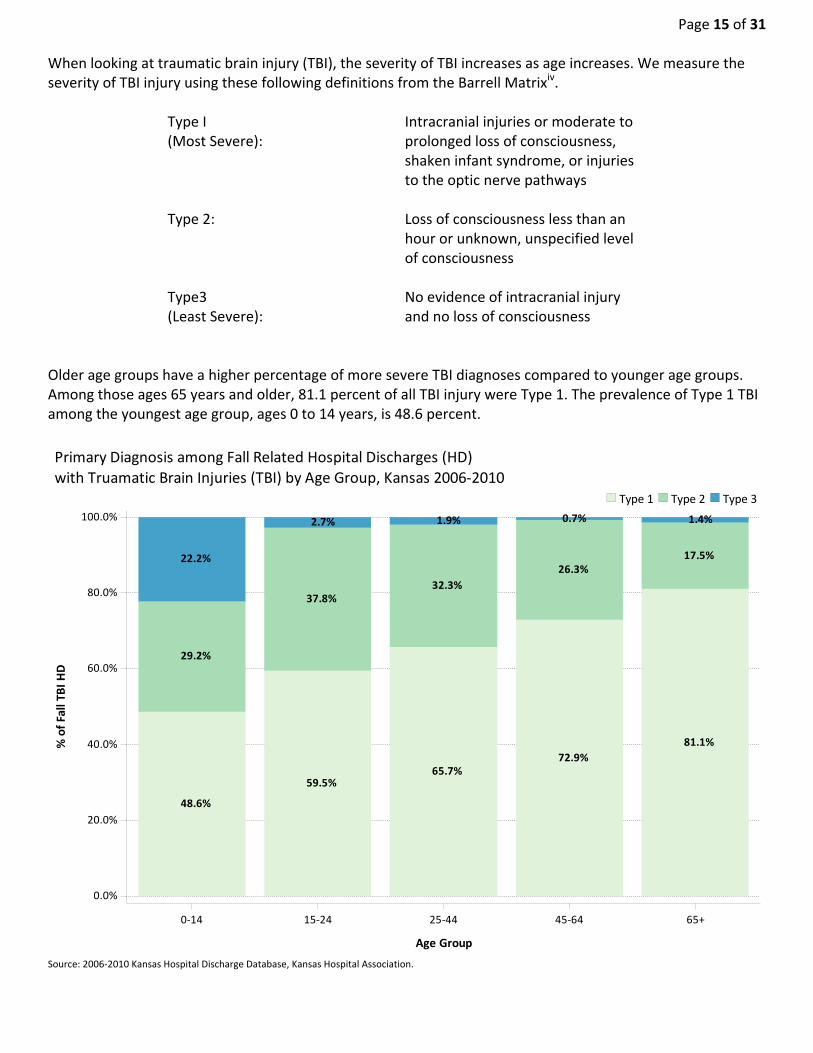
Page 15 of 31 When looking at traumatic brain injury (TBI), the severity of TBI increases as age increases. We measure the severity of TBI injury using these following definitions from the Barrell Matrixiv.
Type I (Most Severe):
Intracranial injuries or moderate to prolonged loss of consciousness, shaken infant syndrome, or injuries to the optic nerve pathways
Type 2: Loss of consciousness less than an hour or unknown, unspecified level of consciousness
Type3 (Least Severe):
No evidence of intracranial injury and no loss of consciousness
Older age groups have a higher percentage of more severe TBI diagnoses compared to younger age groups. Among those ages 65 years and older, 81.1 percent of all TBI injury were Type 1. The prevalence of Type 1 TBI among the youngest age group, ages 0 to 14 years, is 48.6 percent.
Source: 2006‐2010 Kansas Hospital Discharge Database, Kansas Hospital Association.
48.6%
29.2%
22.2%
59.5%
37.8%
2.7%
65.7%
32.3%
1.9%
72.9%
26.3%
0.7%
81.1%
17.5%
1.4%
0.0%
20.0%
40.0%
60.0%
80.0%
100.0%
% of Fall TB
I HD
0‐14 15‐24 25‐44 45‐64 65+
Age Group
Type 3Type 2Type 1
Primary Diagnosis among Fall Related Hospital Discharges (HD)
with Truamatic Brain Injuries (TBI) by Age Group, Kansas 2006‐2010
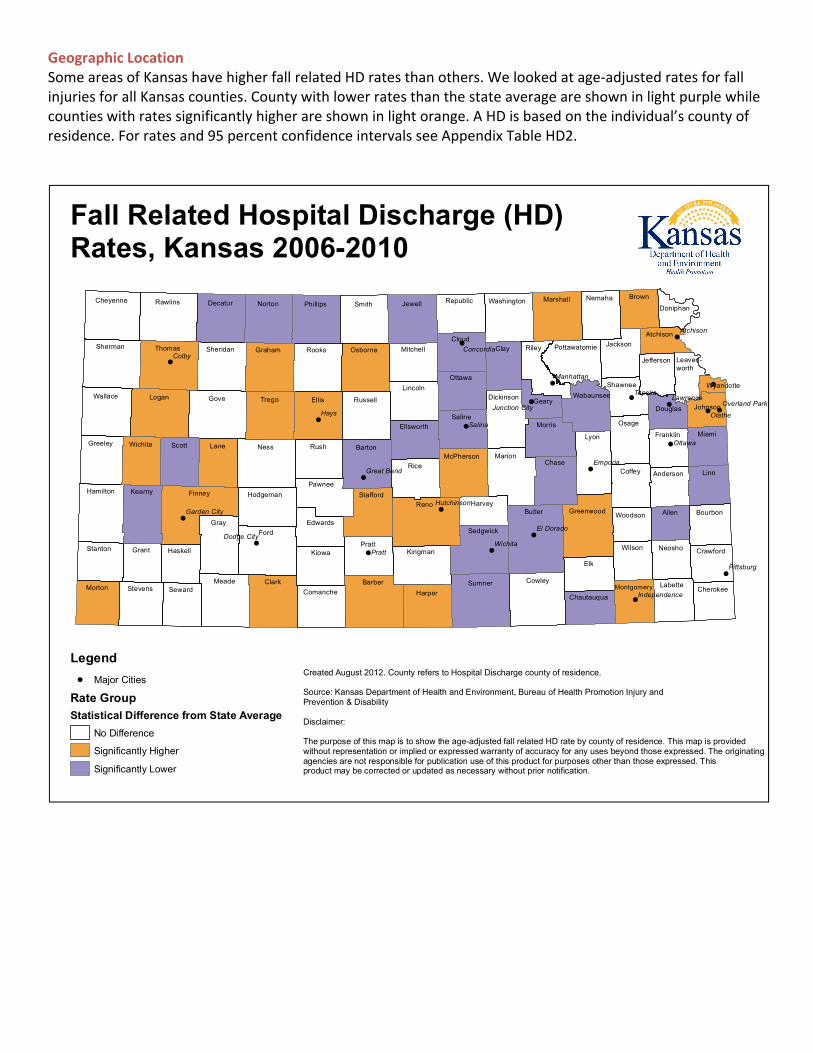
Geographic Location Some areas of Kansas have higher fall related HD rates than others. We looked at age‐adjusted rates for fall injuries for all Kansas counties. County with lower rates than the state average are shown in light purple while counties with rates significantly higher are shown in light orange. A HD is based on the individual’s county of residence. For rates and 95 percent confidence intervals see Appendix Table HD2.
!
!
!
!
!
!
!
!
!
!
!
!
!
!
!
!
!
!
!
!
!
!
!
Kearny
Grant Haskell
Meade
Hodgeman
Kingman
McPherson
Cowley
Marshall
Chase
Pottawatomie
Greenwood
Jackson
Franklin
Neosho
Stevens
Wichita
Logan
Ness
Norton Phillips
Rooks
Rush
Cloud
Sumner
Riley
Wabaunsee
Nemaha
Shawnee
Woodson
Morton
Greeley
Seward
Sheridan
Lane
Graham
Smith
Pratt
Harper
Saline
Brown
Scott
Decatur
Gove Trego
Osborne
Barber
Ellsworth
Lincoln
Butler
Geary
Atchison
Bourbon
Crawford
Sherman
Gray
Comanche
Reno Harvey
Dickinson
Marion
Osage
Labette
Johnson
Hamilton
Kiowa
Ellis
Stafford
Jewell
Ottawa
Clay
Coffey Anderson
Wallace
Cheyenne
Thomas
Finney
Barton
Mitchell
Republic
Sedgwick
Washington
Elk
Lyon
Montgomery
Wilson
Jefferson
Douglas
Allen
Leaven-worth
Cherokee
Linn
Stanton
Rawlins
Ford
Clark
Edwards
Pawnee
Russell
Rice
Morris
Chautauqua
Doniphan
Miami
Wyandotte
Hays
Colby
Pratt
Salina
Topeka
Olathe
Ottawa
Emporia
Wichita
Atchison
Lawrence
Pittsburg
Manhattan
Concordia
El Dorado
Great Bend
Dodge City
HutchinsonGarden City
Independence
Junction CityOverland Park
Legend
! Major Cities
Rate Group
Statistical Difference from State Average
No Difference
Significantly Higher
Significantly Lower
Fall Related Hospital Discharge (HD) Rates, Kansas 2006-2010
Created August 2012. County refers to Hospital Discharge county of residence.
Source: Kansas Department of Health and Environment, Bureau of Health Promotion Injury and Prevention & Disability
Disclaimer:
The purpose of this map is to show the age-adjusted fall related HD rate by county of residence. This map is providedwithout representation or implied or expressed warranty of accuracy for any uses beyond those expressed. The originatingagencies are not responsible for publication use of this product for purposes other than those expressed. This product may be corrected or updated as necessary without prior notification.

Page 17 of 31 Table HDSR. Hospital Discharge Section Review Table Fall Related Hospital Discharges (HD) Rate by Selected Demographic groups, Kansas 2006‐2010
Demographic #HD HD Rate* 95% CI** % of Total HD
Overall 40,192 268.1 265.5‐270.7 100%
Gender
Female 26,301 300.0 296.4‐303.7 65.4%
Male 13,891 215.5 211.9‐219.1 34.6%
Age Group (Age Specific)
00‐04 549 54.7 50.2‐ 59.5 1.4%
05‐09 334 34.5 30.9‐ 38.4 0.8%
10‐14 320 33.5 29.9‐ 37.4 0.8%
15‐19 358 35.5 31.9‐ 39.4 0.9%
20‐24 406 38.3 34.7‐ 42.2 1.0%
25‐34 949 51.8 48.6‐ 55.2 2.4%
35‐44 1,325 73.7 69.8‐ 77.8 3.3%
45‐54 2,630 129.7 124.8‐134.8 6.5%
55‐64 3,806 248.2 240.4‐256.2 9.5%
65‐74 5,218 580.5 564.9‐596.5 13.0%
75+ 24,297 2,614.2 2,581.4‐ 2,647.3 60.5%
Race
White 34,137 241.7 239.1‐244.3 84.9%
African‐American 1,043 158.8 148.9‐169.3 2.6%
Asian / NHOPI 286 174.0 152.8‐197.5 0.7%
Native American 47 38.8 27.7‐ 53.6 0.1%
Ethnicity
Non‐Hispanic 35,726 247.9 245.3‐250.5 88.9%
Hispanic 966 147.4 136.6‐158.9 2.4% NH0PI: Non‐Hawaiian and other Pacific Islander. *Fall Related HD Rate is per 100,000 population. **95% CI are calculated around rate. Source: 2006‐2010 Kansas Hospital Discharge Database, Kansas Hospital Association. Rates were age‐adjusted to the U.S. 2000 Standard population using the direct method. See Technical Appendix for details on how rates were calculated.
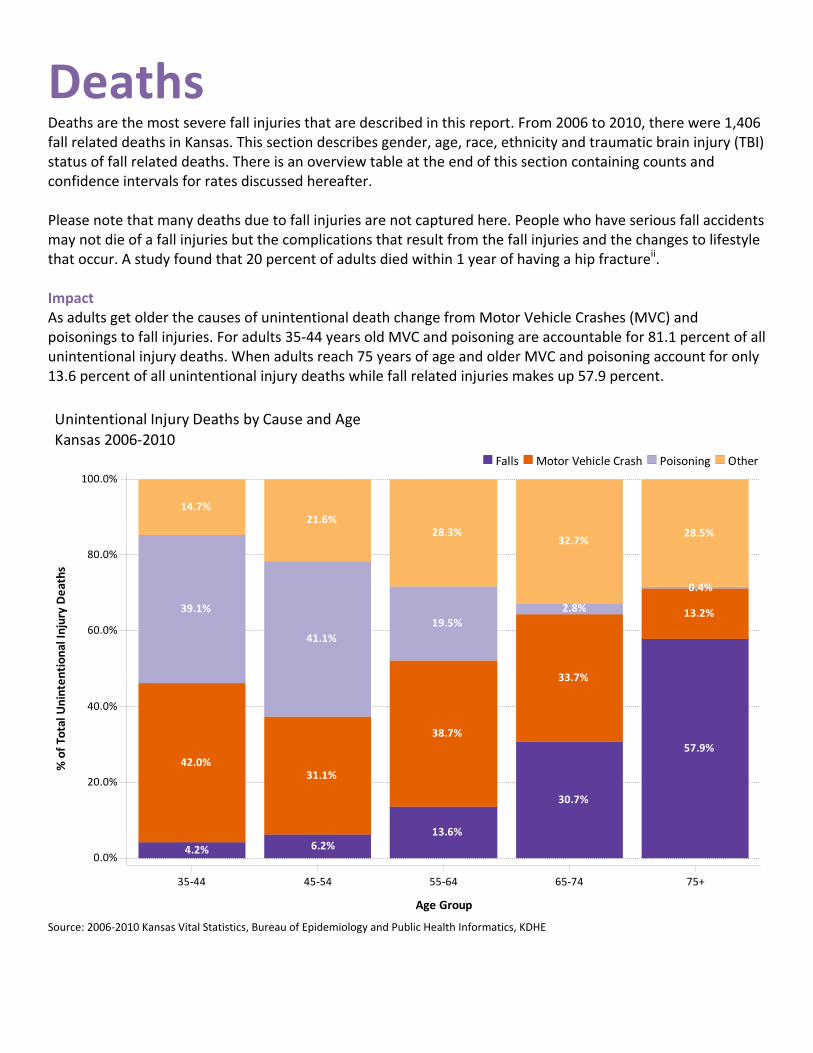
Deaths Deaths are the most severe fall injuries that are described in this report. From 2006 to 2010, there were 1,406 fall related deaths in Kansas. This section describes gender, age, race, ethnicity and traumatic brain injury (TBI) status of fall related deaths. There is an overview table at the end of this section containing counts and confidence intervals for rates discussed hereafter. Please note that many deaths due to fall injuries are not captured here. People who have serious fall accidents may not die of a fall injuries but the complications that result from the fall injuries and the changes to lifestyle that occur. A study found that 20 percent of adults died within 1 year of having a hip fractureii. Impact As adults get older the causes of unintentional death change from Motor Vehicle Crashes (MVC) and poisonings to fall injuries. For adults 35‐44 years old MVC and poisoning are accountable for 81.1 percent of all unintentional injury deaths. When adults reach 75 years of age and older MVC and poisoning account for only 13.6 percent of all unintentional injury deaths while fall related injuries makes up 57.9 percent.
Source: 2006‐2010 Kansas Vital Statistics, Bureau of Epidemiology and Public Health Informatics, KDHE
4.2%
42.0%
39.1%
14.7%
6.2%
31.1%
41.1%
21.6%
13.6%
38.7%
19.5%
28.3%
30.7%
33.7%
2.8%
32.7%
57.9%
13.2%
0.4%
28.5%
0.0%
20.0%
40.0%
60.0%
80.0%
100.0%
% of Total U
nintentional Injury Deaths
35‐44 45‐54 55‐64 65‐74 75+
Age Group
OtherPoisoningMotor Vehicle CrashFalls
Unintentional Injury Deaths by Cause and Age
Kansas 2006‐2010
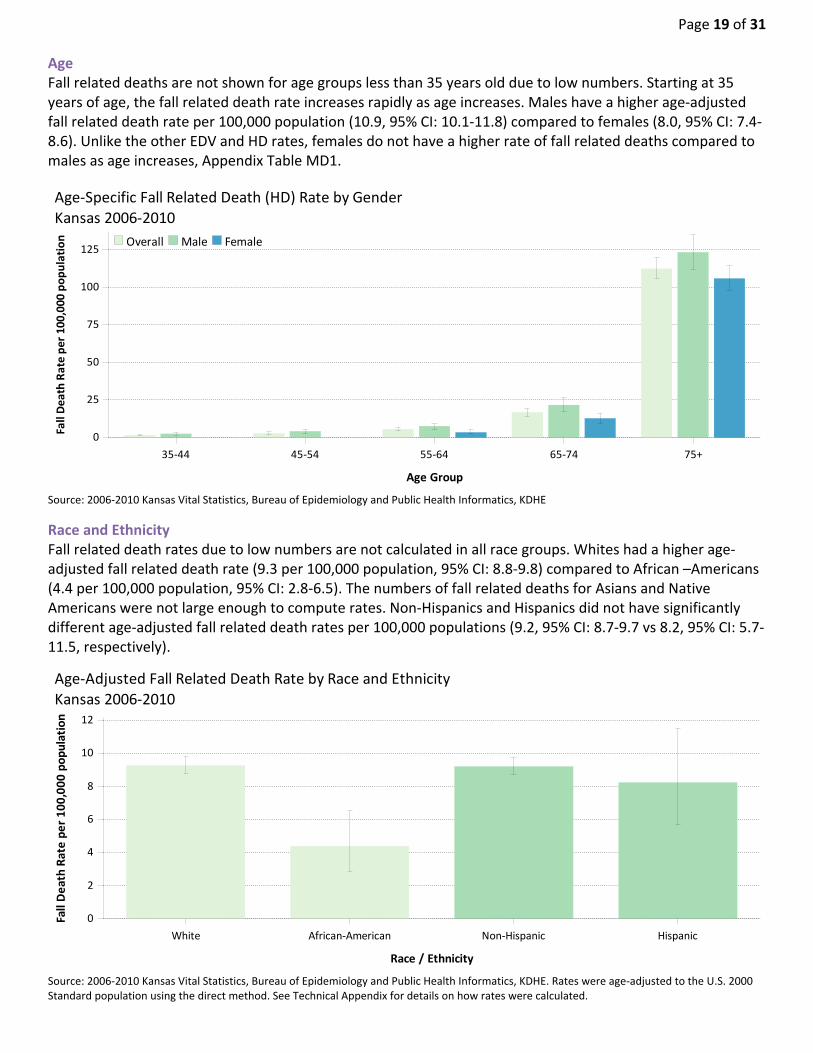
Page 19 of 31 Age Fall related deaths are not shown for age groups less than 35 years old due to low numbers. Starting at 35 years of age, the fall related death rate increases rapidly as age increases. Males have a higher age‐adjusted fall related death rate per 100,000 population (10.9, 95% CI: 10.1‐11.8) compared to females (8.0, 95% CI: 7.4‐8.6). Unlike the other EDV and HD rates, females do not have a higher rate of fall related deaths compared to males as age increases, Appendix Table MD1.
Source: 2006‐2010 Kansas Vital Statistics, Bureau of Epidemiology and Public Health Informatics, KDHE
Race and Ethnicity Fall related death rates due to low numbers are not calculated in all race groups. Whites had a higher age‐adjusted fall related death rate (9.3 per 100,000 population, 95% CI: 8.8‐9.8) compared to African –Americans (4.4 per 100,000 population, 95% CI: 2.8‐6.5). The numbers of fall related deaths for Asians and Native Americans were not large enough to compute rates. Non‐Hispanics and Hispanics did not have significantly different age‐adjusted fall related death rates per 100,000 populations (9.2, 95% CI: 8.7‐9.7 vs 8.2, 95% CI: 5.7‐11.5, respectively).
Source: 2006‐2010 Kansas Vital Statistics, Bureau of Epidemiology and Public Health Informatics, KDHE. Rates were age‐adjusted to the U.S. 2000 Standard population using the direct method. See Technical Appendix for details on how rates were calculated.
0
25
50
75
100
125
Fall Death Rate per 100,000
population
35‐44 45‐54 55‐64 65‐74 75+
Age Group
FemaleMaleOverall
Age‐Specific Fall Related Death (HD) Rate by Gender
Kansas 2006‐2010
0
2
4
6
8
10
12
Fall Death Rate per 100,000 population
White African‐American Non‐Hispanic Hispanic
Race / Ethnicity
Age‐Adjusted Fall Related Death Rate by Race and Ethnicity
Kansas 2006‐2010

Traumatic Brain Injury The percentage of traumatic brain injury (TBI) related fall deaths is highest among those ages 61 to 70 years (73.8%). The percentage of TBI related fall injury deaths decreases among the older age groups and is lowest in those 91 years and older (31.1%).
Source: 2006‐2010 Kansas Vital Statistics, Bureau of Epidemiology and Public Health Informatics, KDHE.
58.3%
41.7%
67.2%
32.8%
73.8%
26.2%
53.4%
46.6%
50.4%
49.6%
31.1%
68.9%
0.0%
20.0%
40.0%
60.0%
80.0%
100.0%
% of Fall Deaths
21‐40 41‐60 61‐70 71‐80 81‐90 91+
Age Group
No TBITBI
Percentage of Traumatic Brain Injury (TBI) of Fall Related Deaths
Kansas 2006‐2010

Page 21 of 31 Table MDSR. Mortality Section Review Table Fall Related Death Rate by Selected Demographic groups, Kansas 2006‐2010
Demographic #Death Death Rate* 95% CI** % of Total Deaths
Overall 1,406 9.3 8.8‐ 9.8 100%
Gender
Female 727 8.0 7.4‐ 8.6 51.7%
Male 679 10.9 10.1‐ 11.8 48.3%
Age Group (Age Specific)
00‐04 9 . . 0.6%
05‐09 . . . .
10‐14 . . . .
15‐19 6 . . 0.4%
20‐24 6 . . 0.4%
25‐34 17 . . 1.2%
35‐44 27 1.5 1.0‐ 2.2 1.9%
45‐54 58 2.9 2.2‐ 3.7 4.1%
55‐64 85 5.5 4.4‐ 6.9 6.0%
65‐74 151 16.8 14.2‐ 19.7 10.7%
75+ 1,044 112.3 105.6‐119.4 74.3%
Race
White 1,331 9.3 8.8‐ 9.8 94.7%
African‐American 27 4.4 2.8‐ 6.5 1.9%
Asian / NHOPI . . . .
Native American 7 . . 0.5%
Ethnicity
Non‐Hispanic 1,353 9.2 8.7‐ 9.7 96.2%
Hispanic 43 8.2 5.7‐ 11.5 3.1%
NH0PI: Non‐Hawaiian and other Pacific Islander. **95% CI are calculated around rate.. *Fall Related Death Rate is per 100,000 population. **95% CI are calculated around rate. Source: 2006‐2010 Kansas Vital Statistics, Bureau of Epidemiology and Public Health Informatics, KDHE. Rates were age‐adjusted to the U.S. 2000 Standard population using the direct method. See Technical Appendix for details on how rates were calculated.

Appendix Cause Coding: Causes are determined by using an injury matrix that is recommended by Safe States Alliance. This is a system that uses the diagnosis code (ED data and HD data) and underlying cause (Mortality Database) to give a cause and intent to an injury. Data are selected and coded for hospital discharges according to the Consensus Recommendations for Using Hospital Discharge Data for Injury Surveillance from the Safe States Alliance. This method codes injuries based on e‐codes using the injury matrix provided by the CDCiii . Data for emergency departments is similar to hospital discharge but closely follows the selection method from State Injury Indicators: Instructions for Preparing 2005 Data from the Centers for Disease Control and Prevention. Mortality Data are coded using the ICD‐10 injury matrix provided by the CDCiv. This is similar to the method described in Instructions for Preparing 2005 Data but uses a different coding scheme. Analysis was changed in 2010 in accordance with the State Injury Indicators: Instructions for Preparing 2010 Data, the two largest changes were inclusion of previously un‐coded activity codes (E000‐E030, beginning October 2009) and inclusion of records with previously non‐valid e‐codes when listed as the only e‐code. Also in 2012, the hospital discharge database was updated to remove discharges that were incorrectly entered more than once. Unintentional Falls ICD Codes were defined as follows: ICD‐9CM: E880.0‐E886.9, E888 ICD‐10: W00‐W19
Diagnosis Coding: Injury diagnosis coding was done by applying the Barrel Injury Diagnosis Matrixv to the primary diagnosis of injury hospital discharge. Every hospital discharge then has one unique injury diagnosis.
Behavioral Risk Factor Surveillance System (BRFSS) The BRFSS is an ongoing, population‐based, random‐digit‐dialed telephone survey of non‐institutionalized civilian adults 18 years and older. The survey is coordinated by the Centers for Disease Control and Prevention (CDC) and is conducted annually by all 50 states, the District of Colombia and several U.S. Territories. This report includes data collected by the Kansas Department of Health and Environment during 2001‐2010. The Kansas BRFSS employs a disproportionate stratified sampling method. During data analysis, sampling weights are applied to account for unequal selection probability and response bias. The complex survey methodology and analytical procedures for BRFSS are designed to produce valid statewide estimates of prevalence. County‐ and region‐level estimates were adjusted to reflect the age and gender distribution within the county using a sample weight post‐stratification methodology. A more detailed explanation of the weighting methodology used for the Kansas BRFSS is available from the following website: http://www.kdheks.gov/brfss/technotes.html (accessed June, 2012).
Page 23 of 31 A few considerations should be taken into account when interpreting BRFSS estimates:
BRFSS estimates do not apply to individuals without telephone service, those on military bases or living within institutions and do not include answers from individuals who are unable to complete a telephone survey.
For the years of data included in the current report, the BRFSS only sampled individuals with a landline phone. Future surveys will include a cell‐phone sample as well.
BRFSS prevalence estimates are self‐reported. Some prevalence estimates may be higher or lower than the true prevalence due to inaccuracies in self‐reported data (for example, inability to remember, exaggeration, refusal to respond to a particular question, etc…).
For some indicators it is difficult to obtain subpopulation estimates because of an insufficient number of respondents. In order to report a prevalence estimate, the sample for the population subgroup must have at least 50 denominator respondents and 6 numerator respondents.
Counts: Counts are the actual number of events that occurred. Counts below five are not displayed in this report. Rates: Age‐Specific rates are calculated by dividing the number of events by the population in that specific age group. By using rates, two differently sized communities/regions can be compared to each other. Note that rates in which the number of events is below 20 are not calculated as rates calculated for numbers less than 20 are scientifically unreliable. Age‐specific rates are calculated by dividing the number of events by the population of Kansas or by Kansas subpopulation of interest. Population denominators are taken from estimates produced by the U.S. Census Bureau. To be consistent with other KHDE publications, 2000‐2009 midyear population estimates produced for each year are used, rather than using the most recent estimate. For example, a 2005 rate will be based on the Kansas population estimate published in 2005 (2005 vintage), rather than using the most recent 2005 population estimate (2009 vintage). For 2001, the 2002 vintage estimates were used. For 2000, the census 2000 populations were used. For 2010, the census 2010 populations were used. Age adjusted rates: Age adjustment is a statistical method for standardizing rates for groups that have different underlying age distributions to be more comparable. Age‐adjusted rates should be used to compare Kansas with the United States as a whole, or for comparing two groups, or the same group over time, if the underlying population distribution is different or changes (for example, comparing rates for Hispanics and Non‐Hispanics). Age‐adjusted rates should be understood as relative indices, not as actual measures of burden, and should not be compared to unadjusted rates. All age‐adjusted rates in this report are computed using the direct method. Briefly, rates are first computed within each age group stratum. The products of each age‐specific rate multiplied by the proportion of the 2000 U.S. Standard Population in that age category are summed across the age group strata. Age‐specific rates are based on 10 age groups: 0 to 4, 5 to 9, 10 to 14, 15 to 19, 20 to 24 ,25 to 34, 35 to 44, 45 to 54, 55 to 64, 65 to 74, 75 years and older. Confidence intervals: All rates, proportions and prevalence estimates presented in this report can be thought of as estimates of a theoretical true value, or population parameter. These estimates are subject to random variation. To characterize this variability, some of the statistics presented in this report include 95 percent confidence
intervals. This can be thought of as a range of values that will contain the population parameter (theoretical true value) 95 percent of the time. To compute confidence intervals presented in this report, events were assumed to follow a Poisson distributionvi. If the number of events was 100 or higher, confidence limits were produced using the normal approximation. If the number of deaths or discharges was fewer than 100, limits are taken directly from the Poisson distribution. Age‐adjusted confidence intervals were calculated using the gamma methodvii.
Discharge Disposition
Discharge Disposition coding describes where a person to is discharged after their stay in a hospital. The groupings used in the analysis of this report are as follows. Home includes: Home/Self Care, home intravenous (IV) service. Skilled Nursing Facility includes: Skilled Nursing Facility, a nursing facility certified under Medicaid but not under Medicare. Other Includes: Another short term general hospital, intermediate care facility (ICF), another type of institution, Against Medical Advice (AMA), admitted as inpatient to this hospital, expired, still a patient, expired at home (Medicare and CHAMPUS claims for hospice care), expired in a medical facility (Medicare and CHAMPUS claims for hospice care), expired, place unknown (Medicare and CHAMPUS claims for hospice care), discharged/transferred to a federal hospital, hospice at home, hospice at a medical facility, hospital‐based swing‐bed within this institution, inpatient rehabilitation facility (IRF), long‐term care hospital, psychiatric hospital, another institution for outpatient services, this institution for outpatient services, other, missing.
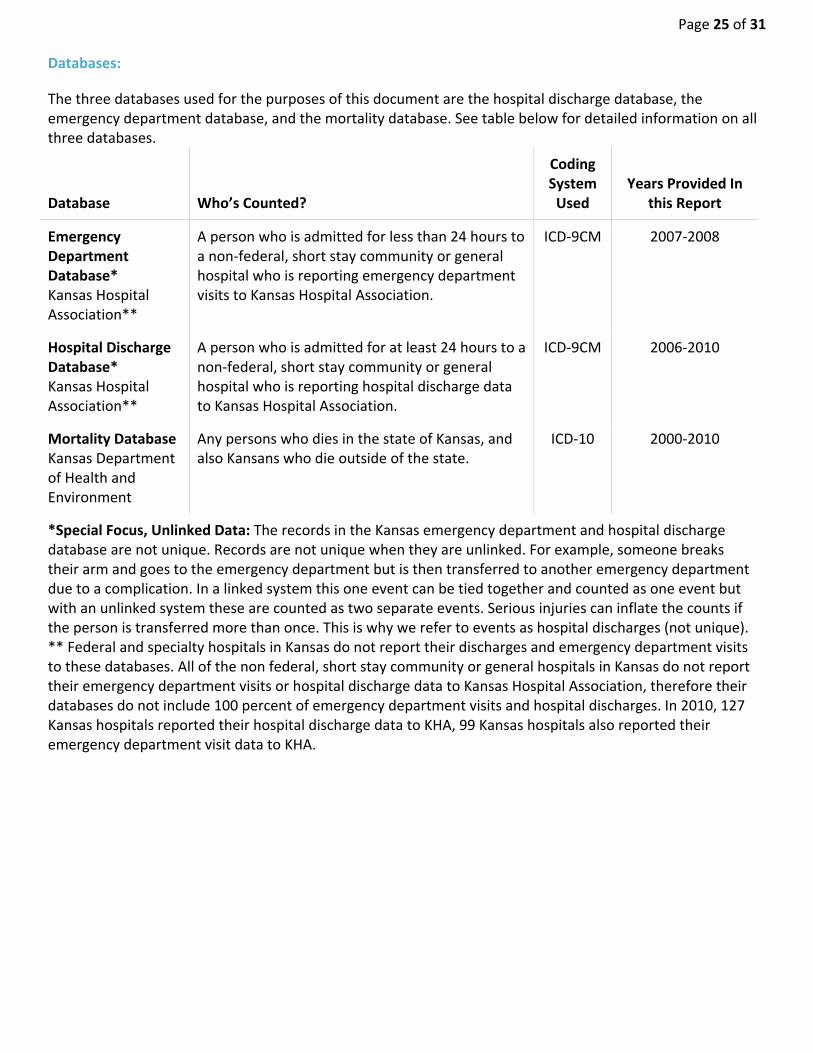
Page 25 of 31 Databases:
The three databases used for the purposes of this document are the hospital discharge database, the emergency department database, and the mortality database. See table below for detailed information on all three databases.
Database Who’s Counted?
Coding System Used
Years Provided In this Report
Emergency Department Database* Kansas Hospital Association**
A person who is admitted for less than 24 hours to a non‐federal, short stay community or general hospital who is reporting emergency department visits to Kansas Hospital Association.
ICD‐9CM 2007‐2008
Hospital Discharge Database* Kansas Hospital Association**
A person who is admitted for at least 24 hours to a non‐federal, short stay community or general hospital who is reporting hospital discharge data to Kansas Hospital Association.
ICD‐9CM 2006‐2010
Mortality Database Kansas Department of Health and Environment
Any persons who dies in the state of Kansas, and also Kansans who die outside of the state.
ICD‐10 2000‐2010
*Special Focus, Unlinked Data: The records in the Kansas emergency department and hospital discharge database are not unique. Records are not unique when they are unlinked. For example, someone breaks their arm and goes to the emergency department but is then transferred to another emergency department due to a complication. In a linked system this one event can be tied together and counted as one event but with an unlinked system these are counted as two separate events. Serious injuries can inflate the counts if the person is transferred more than once. This is why we refer to events as hospital discharges (not unique).** Federal and specialty hospitals in Kansas do not report their discharges and emergency department visits to these databases. All of the non federal, short stay community or general hospitals in Kansas do not report their emergency department visits or hospital discharge data to Kansas Hospital Association, therefore their databases do not include 100 percent of emergency department visits and hospital discharges. In 2010, 127 Kansas hospitals reported their hospital discharge data to KHA, 99 Kansas hospitals also reported their emergency department visit data to KHA.

Appendix Table EDV1: Age Specific Fall Related Emergency Department Visit (EDV) Rates by Sex Kansas 2007‐2009
Female Male Overall
Age Group # EDV EDV
Rate* 95% CI** # EDVEDV
Rate* 95% CI** #EDVEDV
Rate* 95% CI**
00‐04 5,646 1,907.3 1,857.8‐1,957.7 7,516 2,440.1 2,385.2‐2,495.9 13,163 2,179.1 2,142.0‐2,216.7
05‐09 3,649 1,292.3 1,250.7‐1,334.9 4,394 1,486.0 1,442.3‐1,530.6 8,043 1,391.4 1,361.1‐1,422.1
10‐14 3,028 1,102.9 1,063.9‐1,142.9 3,983 1,374.7 1,332.3‐1,418.0 7,011 1,242.4 1,213.5‐1,271.8
15‐19 2,253 774.9 743.2‐807.5 2,836 910.5 877.3‐944.6 5,089 845.0 821.9‐868.5
20‐24 2,291 746.6 716.4‐777.8 2,138 635.7 609.0‐663.2 4,429 688.6 668.5‐709.2
25‐34 4,463 836.7 812.3‐861.6 3,456 611.9 591.7‐632.6 7,919 721.1 705.3‐737.1
35‐44 4,164 782.2 758.6‐806.3 3,050 560.8 541.1‐581.1 7,214 670.3 654.9‐686.0
45‐54 5,133 837.3 814.6‐860.5 3,454 571.0 552.1‐590.3 8,587 705.0 690.2‐720.1
55‐64 4,320 929.4 901.9‐957.6 2,480 547.1 525.7‐569.0 6,800 740.6 723.1‐758.5
65‐74 3,772 1,311.7 1,270.1‐1,354.2 2,047 820.6 785.4‐856.9 5,819 1,083.6 1,055.9‐1,111.8
75+ 11,175 3,218.9 3,159.5‐3,279.1 4,740 2,254.3 2,190.5‐2,319.4 15,916 2,855.2 2,811.0‐2,899.9
Source: 2007‐2009 Kansas Emergency Department Database, Kansas Hospital Association.
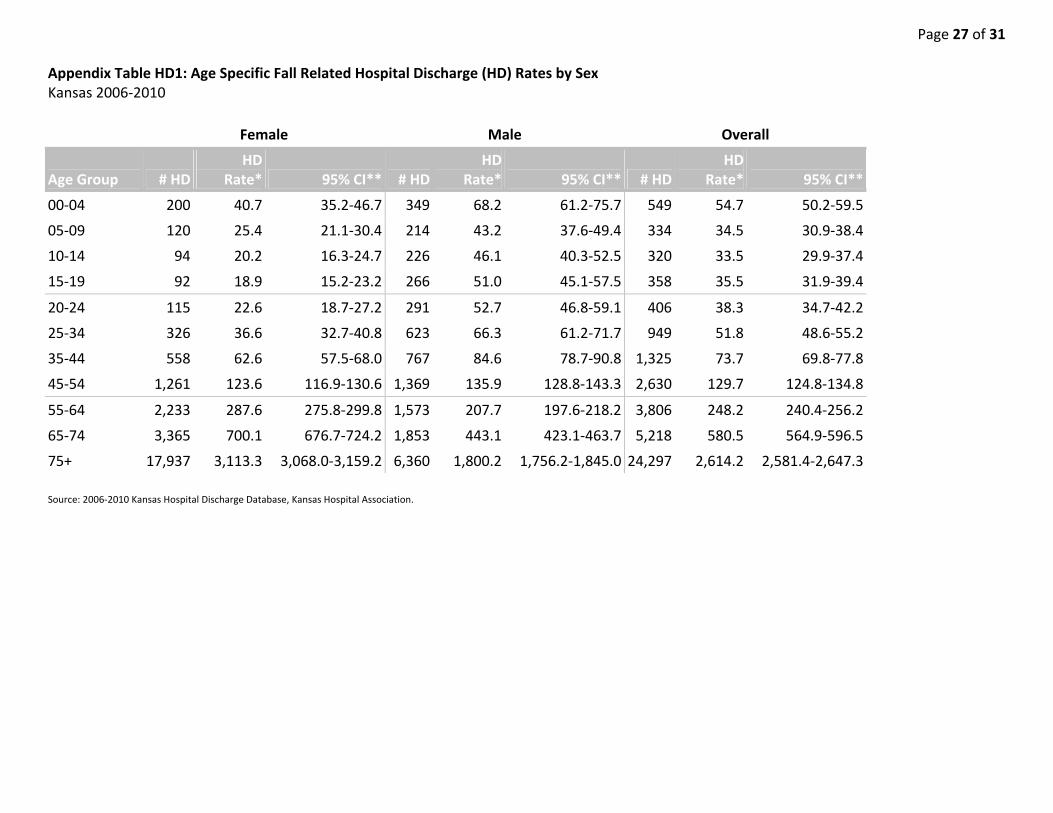
Page 27 of 31 Appendix Table HD1: Age Specific Fall Related Hospital Discharge (HD) Rates by Sex Kansas 2006‐2010
Female Male Overall
Age Group # HD HD
Rate* 95% CI** # HDHD
Rate* 95% CI** # HDHD
Rate* 95% CI**
00‐04 200 40.7 35.2‐46.7 349 68.2 61.2‐75.7 549 54.7 50.2‐59.5
05‐09 120 25.4 21.1‐30.4 214 43.2 37.6‐49.4 334 34.5 30.9‐38.4
10‐14 94 20.2 16.3‐24.7 226 46.1 40.3‐52.5 320 33.5 29.9‐37.4
15‐19 92 18.9 15.2‐23.2 266 51.0 45.1‐57.5 358 35.5 31.9‐39.4
20‐24 115 22.6 18.7‐27.2 291 52.7 46.8‐59.1 406 38.3 34.7‐42.2
25‐34 326 36.6 32.7‐40.8 623 66.3 61.2‐71.7 949 51.8 48.6‐55.2
35‐44 558 62.6 57.5‐68.0 767 84.6 78.7‐90.8 1,325 73.7 69.8‐77.8
45‐54 1,261 123.6 116.9‐130.6 1,369 135.9 128.8‐143.3 2,630 129.7 124.8‐134.8
55‐64 2,233 287.6 275.8‐299.8 1,573 207.7 197.6‐218.2 3,806 248.2 240.4‐256.2
65‐74 3,365 700.1 676.7‐724.2 1,853 443.1 423.1‐463.7 5,218 580.5 564.9‐596.5
75+ 17,937 3,113.3 3,068.0‐3,159.2 6,360 1,800.2 1,756.2‐1,845.0 24,297 2,614.2 2,581.4‐2,647.3
Source: 2006‐2010 Kansas Hospital Discharge Database, Kansas Hospital Association.

Appendix Table MD1: Age Specific Fall Related Death Rates by Sex Kansas 2006‐2010
Female Male Overall
Age Group #
Deaths Death Rate* 95% CI**
# Deaths
DeathRate* 95% CI**
# Deaths
DeathRate* 95% CI**
00‐04 . . . 6 . . 9 . .
05‐09 . . . . . . . . .
10‐14 . . . . . . . . .
15‐19 . . . 6 . . 6 . .
20‐24 . . . 6 . . 6 . .
25‐34 . . . 15 . . 17 . .
35‐44 6 . . 21 2.3 1.4‐ 3.5 27 1.5 1.0‐ 2.2
45‐54 17 . . 41 4.1 2.9‐ 5.5 58 2.9 2.2‐ 3.7
55‐64 28 3.6 2.4‐ 5.2 57 7.5 5.7‐ 9.8 85 5.5 4.4‐ 6.9
65‐74 61 12.7 9.7‐ 16.3 90 21.5 17.3‐ 26.5 151 16.8 14.2‐ 19.7
75+ 609 105.7 97.5‐114.4 435 123.1 111.8‐135.3 1,044 112.3 105.6‐119.4
Source: 2006‐2010 Kansas Vital Statistics, Bureau of Epidemiology and Public Health Informatics, KDHE. Rates

Page 29 of 31 Appendix Table HD2: Age Adjusted Fall Related Hospital Discharge Rate by County, Kansas 2006‐2010
County #HD Rate* 95% CI**
Allen 157 168.0 141.9‐198.9
Anderson 162 286.0 242.5‐337.1
Atchison 339 338.3 302.6‐377.7
Barber 142 382.6 319.5‐459.4
Barton 447 233.7 211.9‐257.6
Bourbon 276 293.3 258.6‐332.4
Brown 236 333.7 291.2‐382.2
Butler 480 145.3 132.6‐159.1
Chase 25 127.1 81.1‐197.4
Chautauqua 35 125.2 83.5‐187.0
Cherokee 365 288.1 259.1‐319.9
Cheyenne 62 229.9 168.4‐320.8
Clark 86 450.4 356.9‐575.3
Clay 131 192.5 159.4‐232.7
Cloud 142 183.3 151.9‐221.5
Coffey 155 288.4 244.1‐340.0
Comanche 51 302.9 223.0‐417.5
Cowley 561 282.3 259.2‐307.2
Crawford 650 292.9 270.5‐317.1
Decatur 44 148.0 105.7‐221.4
Dickinson 375 277.7 249.6‐308.8
Doniphan 155 311.2 263.2‐367.1
Douglas 1,028 230.9 216.8‐245.7
Edwards 65 284.0 218.6‐371.5
Elk 54 219.3 160.2‐302.3
Ellis 504 316.1 288.4‐346.3
Ellsworth 81 177.3 139.3‐226.1
Finney 427 304.8 275.7‐336.2
Ford 397 264.4 238.9‐291.9
Franklin 391 274.2 247.6‐303.2
Geary 133 110.3 92.1‐131.0
Gove 75 314.1 239.8‐419.1
Graham 119 478.4 388.6‐595.5
Grant 104 309.7 252.6‐376.5
County #HD Rate* 95% CI**
Gray 92 297.2 239.3‐366.5
Greeley 27 279.1 181.9‐444.2
Greenwood 182 326.7 279.0‐383.3
Hamilton 36 210.3 146.6‐299.3
Harper 191 388.9 332.3‐455.9
Harvey 660 290.0 267.6‐314.1
Haskell 54 287.9 215.7‐377.8
Hodgeman 30 208.9 138.9‐314.4
Jackson 198 254.9 220.5‐293.9
Jefferson 260 248.9 219.2‐282.0
Jewell 50 150.3 106.2‐225.9
Johnson 6,925 290.7 283.9‐297.7
Kearny 33 157.7 108.2‐224.1
Kingman 178 302.9 258.3‐355.8
Kiowa 66 313.5 235.1‐420.2
Labette 353 254.1 227.7‐283.1
Lane 68 479.3 367.9‐633.7
Leavenworth 907 280.8 262.5‐300.0
Lincoln 86 327.8 259.3‐416.3
Linn 130 200.1 166.3‐240.5
Logan 86 386.5 303.8‐494.2
Lyon 483 267.0 243.6‐292.3
Marion 262 258.6 226.3‐296.1
Marshall 265 308.9 271.0‐352.6
McPherson 628 300.7 276.9‐326.5
Meade 98 325.1 262.0‐402.1
Miami 280 190.6 168.8‐214.5
Mitchell 155 283.4 238.7‐337.9
Montgomery 714 297.3 275.4‐320.9
Morris 94 195.6 156.1‐245.7
Morton 92 491.0 394.5‐609.8
Nemaha 223 248.1 215.1‐287.0
Neosho 296 271.2 240.7‐305.4
Ness 88 306.7 240.0‐403.0
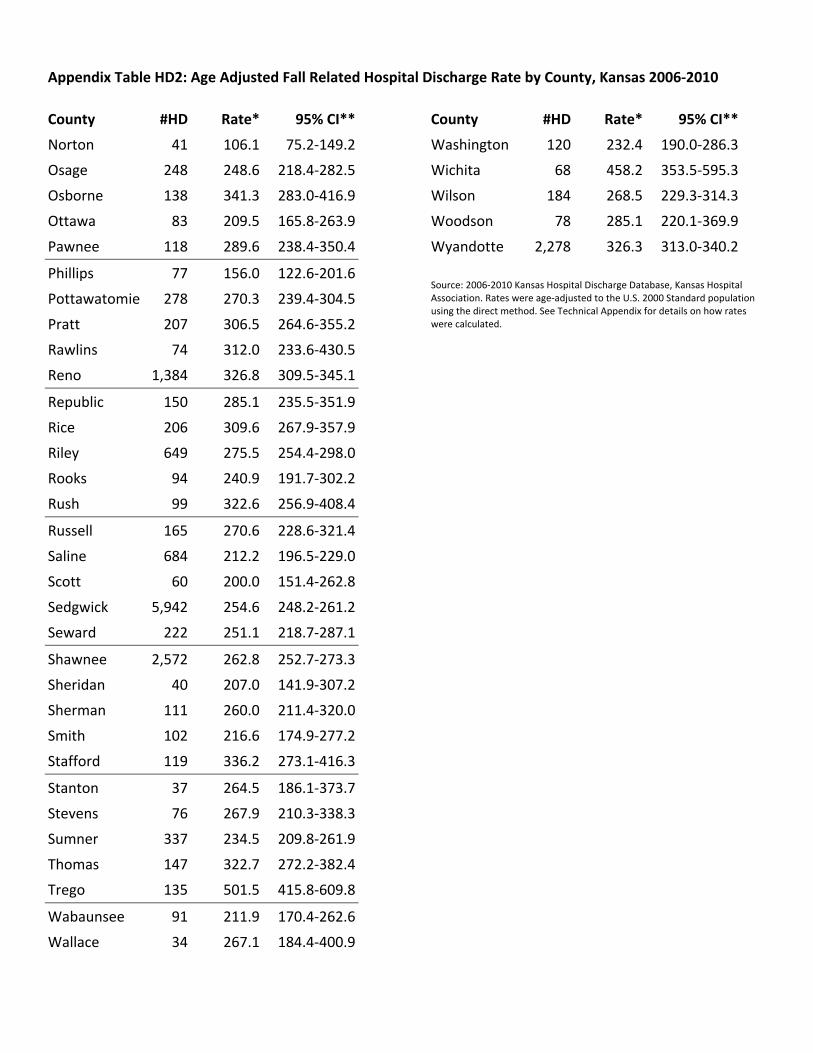
Appendix Table HD2: Age Adjusted Fall Related Hospital Discharge Rate by County, Kansas 2006‐2010
County #HD Rate* 95% CI**
Norton 41 106.1 75.2‐149.2
Osage 248 248.6 218.4‐282.5
Osborne 138 341.3 283.0‐416.9
Ottawa 83 209.5 165.8‐263.9
Pawnee 118 289.6 238.4‐350.4
Phillips 77 156.0 122.6‐201.6
Pottawatomie 278 270.3 239.4‐304.5
Pratt 207 306.5 264.6‐355.2
Rawlins 74 312.0 233.6‐430.5
Reno 1,384 326.8 309.5‐345.1
Republic 150 285.1 235.5‐351.9
Rice 206 309.6 267.9‐357.9
Riley 649 275.5 254.4‐298.0
Rooks 94 240.9 191.7‐302.2
Rush 99 322.6 256.9‐408.4
Russell 165 270.6 228.6‐321.4
Saline 684 212.2 196.5‐229.0
Scott 60 200.0 151.4‐262.8
Sedgwick 5,942 254.6 248.2‐261.2
Seward 222 251.1 218.7‐287.1
Shawnee 2,572 262.8 252.7‐273.3
Sheridan 40 207.0 141.9‐307.2
Sherman 111 260.0 211.4‐320.0
Smith 102 216.6 174.9‐277.2
Stafford 119 336.2 273.1‐416.3
Stanton 37 264.5 186.1‐373.7
Stevens 76 267.9 210.3‐338.3
Sumner 337 234.5 209.8‐261.9
Thomas 147 322.7 272.2‐382.4
Trego 135 501.5 415.8‐609.8
Wabaunsee 91 211.9 170.4‐262.6
Wallace 34 267.1 184.4‐400.9
County #HD Rate* 95% CI**
Washington 120 232.4 190.0‐286.3
Wichita 68 458.2 353.5‐595.3
Wilson 184 268.5 229.3‐314.3
Woodson 78 285.1 220.1‐369.9
Wyandotte 2,278 326.3 313.0‐340.2
Source: 2006‐2010 Kansas Hospital Discharge Database, Kansas Hospital Association. Rates were age‐adjusted to the U.S. 2000 Standard population using the direct method. See Technical Appendix for details on how rates were calculated.
Page 31 of 31
References i Scheffer, Alice C, Marieke J Schuurmans, Nynke van Dijk, Truus van der Hooft, and Sophia E de Rooij. “Fear of
Falling: Measurement Strategy, Prevalence, Risk Factors and Consequences Among Older Persons.”
Age and Ageing 37, no. 1 (January 2008): 19–24. doi:10.1093/ageing/afm169.
ii Leibson CL. (2002). Mortality, disability, and nursing home use... [J Am Geriatr Soc. 2002] ‐ PubMed ‐ NCBI.
Journal American Geriartric Society, 50(10), 1644–1650. iii CDC. (2011, August 10). CDC ‐ Proposed Matrix of E‐code Groupings ‐ WISQARS ‐ Injury. CDC‐code Groupings
‐ WISQARS ‐ Injury. Retrieved January 12, 2012, from http://www.cdc.gov/injury/wisqars/ecode_matrix.html
iv Arialdi M. Minino. (2006). Deaths: Injuries, 2002. National Vital Statistics Report, 54(10), 125. v CDC. (2010, June 24). Injury Data and Resources ‐ Barell Injury Diagnosis Matrix. Retrieved September 20,
2012, from http://www.cdc.gov/nchs/injury/ice/barell_matrix.htm vi Aschengrau, Ann, and George Seage III, R. Essentials of Epidemiology in Public Health. Second Edition.
Sudbury, MA: Jones and Bartlett, n.d. vii Washington State Department of Health ‐ Assessment Guidelines: Confidence Intervals. (2010, July
1).Washington State Department of Health: Confidence Intervals. Retrieved January 12, 2012, from http://www.doh.wa.gov/data/guidelines/confintguide.htm