fall 2019 investor relations report
TRANSCRIPT

Fall 2019 Investor Relations Report
2
Table of Contents
Table of Contents 2
Introduction 3
Investment Thesis 4
Market Developments 6
Overview 6
Interest Rates 6
Inverted Yield Curve 6
Trade War (US and China) 7
Impeachment 8
Brexit 9
Hong Kong 9
Director of Research 10
Overall Performance 10
Sector Holdings 10
Regional Analysis 11
Attribution Analysis 11
Dormant Period- [05/02/19-09/05/2019] 13
Overview 13
Market Developments 14
Bearish Period (9/05/2019 - 10/25/2019) 15
Overview 16
Market Developments 16
Asset Allocation and Trades 16
Bullish Period (10/25/2019 - 12/20/2019) 19
Overview 19
Market Developments 19
Asset Allocation and Trades 20
Missed Opportunities 22
Consumer Staples Select SPDR Fund- XLP 23
iShares Global Clean Energy ETF- ICLN 23
Investment Grade Corporate Bonds- LQD 23
iShares 20+ Year Treasury Bond ETF- TLT 24
WisdomTree U.S. High Dividend- DHS 24
iPath Series B S&P VIX Short Term Futures ETN- VXX 24
3
Dormant Period 24
Conclusion Error! Bookmark not defined.
Fund Manager Biographies 28
Faculty Advisor 311
Appendix 322
Legg Mason Low Volatility High Dividend ETF - LVHD 322
Vanguard Long-Term Bond Index Fund ETF Shares - BLV 32
iShares Edge MSCI USA Quality Factor ETF- QUAL 322
SPDR Gold Shares – GLD 333
iPath Bloomberg Cocoa Subindex Total Return(SM) ETN - NIB 333
VanEck Vectors Semiconductor ETF - SMH 333
Vanguard Real Estate ETF- VNQ 344
iShares JPMorgan USD Emerging Markets Bond ETF - EMB 344
Vanguard FTSE Europe- VGK 344
iShares iBoxx Dollar Investment Grade Corporate Bond- LQD 35
Vanguard Utilities ETF - VPU 355
Health Care Select Sector SPDR Fund - XLV 355
ProShares Short S&P500 - SH 366
iShares 20+ Year Treasury Bond ETF - TLT 366
Consumer Staples Select Sector SPDR Fund - XLP 366
iShares Global Clean Energy ETF - ICLN Error! Bookmark not defined.6
WisdomTree U.S High Dividend Fund - DHS 37
iPath Series B S&P 500 VIX Short Term Futures ETN - VXX 37
4
Introduction
The student managers of the RPI Lally James Fund would like to personally thank you for your
generosity and support over the course of the semester. The James Fund has been an extremely
rewarding learning opportunity for all members, providing students with hands on experience in
investment management. This course allowed student managers to analyze exchange traded funds
combined with a focus on current events to outperform the benchmark.
At the commencement of the semester, the managers reviewed and revised the Investment Policy
Statement (IPS) before they could take responsibility of the fund. The IPS laid out the rules and
requirements that the fund managers had to abide by. An introductory presentation by Professor
Shohfi laid out the course structure where student-managers led discussions in class and offered
their personal insights on decisions to make for the portfolio based on their research. The managers
made pitches of ETFs to buy or sell, and the pitches were voted on and passed by a 3/5ths majority
vote; this meant that the managers needed a majority vote of at least 5 out of the 8 total managers.
The managers utilized a group chat to stay in constant communication and vote on new pitches at
any time of the week.
The semester was challenging for the managers as there was a substantial amount of market
instability. This came from several major worldwide conflicts that went on, of which the China-U.S.
trade war was the most significant. Overall, this market uncertainty made it difficult to design an
optimal strategy to outperform the benchmark. However, the instability also created an excellent
learning experience.

5
Investment Thesis
The team was composed of eight student fund managers this semester, with the goal to generate
excess returns compared to fund’s benchmark (80% VTI and 20% BND). The managers gave weekly
presentations regarding the market developments over the prior week and the portfolio
performance. Afterwards, the managers pitched ETFs that they thought would help achieve the
fund’s goal in the current state of the market. Class discussions on the market’s outlook were held
before making final decisions on the portfolio.
Unfortunately, the managers could not beat the benchmark this semester. The fund had a cumulative
return of 3.89%, while the benchmark had a cumulative return of 6.78%. This report will reflect upon
the underperformance, which allows managers to learn from their mistakes. Firstly, the beginning
was slow as hesitation caused minimal changes in the portfolio, hence outperformance by the
benchmark. When the managers concluded that the market headed towards a bearish period, they
made major adjustments to the portfolio. This was an accurate strategy that had significant returns
relative to the benchmark. As the market rebounded, however, the adjustments were not enough.
This initiated an outperformance by the benchmark to which the portfolio did not adapt to quickly
enough. This report will give a more in-depth analysis and explanation.

6
Market Developments
Overview
In this section, the major macro-events of the semester will be addressed. This section will illustrate
the timelines of these events during the holding period, and how the events were considered in
decision making.
Interest Rates
During the semester, the Federal Reserve lowered interest rates twice to the range of 1.75% to 2%
on September 18th, 2019 and later the 30th of October to 1.5% to 1.75%. This shows economic
weakness as the lowering of the interest rate is meant to encourage business expenditure to boost
the economy. This is also seen with weak jobs and manufacturing reports showing a constriction of
growth in the U.S economy. Moreover, this is a good indicator of global economic direction as Europe
lowered their interest rates. Europe lowered their rates below zero, and the European Central Bank
engaged in quantitative easing to try and encourage more growth. These indicators have neutralized
for the time being as interest rates have stabilized since the last Fed Open Market Committee meeting
on December 10th and 11th and followed by a very strong jobs report. The economic assessments
made the FEDm through the FOMC statements and their movements on interest rates, play a large
role in the managers’ portfolio direction as the bearish and bullish periods almost line up directly
with the drops and stabilization of the interest rates.
Inverted Yield Curve
The inverted yield curve is considered one of the primary indicators of a recession or correction in
the economy. It is used to predict the changing of the business cycle where investors predict bond
yields to fall. This is the link between a recession and the indicator as recessions cause interest rates
to drop. This yield curve is conducted between the 2-year and 10-year Treasuries. Typically, the long-
term Treasury has a higher yield than the short term due to the risk premium of holding them for a
longer period and being more subject to changes in interest rates. When the higher yield switches to
the short-term Treasury, this is the curve inversion. To have it signal recession, it must be inverted
for a quarter of the year. This occurred during the dormant period and hit the quarter of being inverse
on the 30th of June, and these inversions historically have happened six to eighteen months before
recessions. This was illustrated in conjunction with the lowering of interest rates from August to the
7
end of October with the large amount of volatility seen in domestic equities. This was considered
heavily in the managers’ decision to go bearish directly after the dormant period.
Trade War (US and China)
This event has been persistent throughout the semester, but also since 2017, so the managers will
focus on the portion of the event since the inheriting of the portfolio.
Just before the semester began, on August 23rd, 2019, China enacted $75 billion of tariffs on US goods
as a retaliation to those sanctioned by the U.S earlier in the month. On the 1st of September these were
enacted along with a $125 billion tariff on Chinese goods that the US set on August 13th. 5 days later
the US and China agreed to trade talks for the 13th time which had been off and on for the past 2 years
as many times one country cancels just before the meetings. The positive outlook was confirmed
when on the 11th of September China announced tariff exemptions for 16 types of US imports. On the
same day, President Trump tweeted that the next round of tariffs would be pushed back from October
1st to October 15th as he wanted to respect the 70th Anniversary of the founding of the People’s
Republic. On the 13th of September, in response to the tariff push back the tariff exclusion on US
imports would also include soybeans, and other farm goods. A week later, trade officials convened in
Washington D.C. to conduct lower level trade talks which resulted in the U.S making an exemption
list of about 400 Chinese imports. On October 11th, President Trump announced that “Phase 1” of a
trade deal was in the works and would take a few weeks to finalize. With this, China will purchase
$40-$50 billion of US agricultural products and strengthen intellectual property rights.
A week after on the 18th, the U.S tariff exclusion process for US $300 billion of Chinese imports that
would go into effect at the end of the month. This was a strong signal for positive sentiment as for
about the last month, there had been news that made a trade deal seem likely in the next months. On
the 1st of November the negotiators talk over the phone and agree with the points of the “Phase 1” in
principle. This was furthered a week later as the two parties met to discuss tariff rollbacks as part of
this first phase agreement. On the 26th, there was a setback as the FCC voted to protect U.S telecom
networks from national security threats, which means the U.S Government could restrict companies
from importing foreign equipment. In a culmination of all the tribulations of the last months over
“Phase 1” it was finally agreed upon by the 2 countries on the 13th of December. The specifics are the
US would not proceed on $160 billion on mainly consumer goods and reduce the September 1st tariffs.
The Chinese agreed to buy $200 billion U.S. goods over the next 2 years, suspend more tariffs and

8
improve IPR rights. This followed almost the same path as interest rates and the general market
during the holding period. From September to the middle of October almost no progress was made,
and the US and China increased tension, tariffs, and canceled talks which hall heightened volatility.
This calmed as ‘Phase One’ was announced and slowly more positive news was released over the next
2 months until the announcement that this limited trade deal was signed. The managers missed the
initial equity surge in mid-October which lead to much of the difference between the fund the
benchmark. This news was especially strong for SMH, the semiconductor holdings, as most of the
design and manufacturing is done in U.S and China.
Impeachment
Talks of the impeachment of President Trump have been around since the beginnings of his
presidency. Since he fired FBI director James Comey in 2017 there have been calls for his removal.
This was continued with the Mueller Report as when it was released in spring of 2019 which some
argued was enough to start the impeachment process. The push was made after it was released that
President Trump had pressured the Ukrainian president Volodymyr Zelenskiy into looking in his
possible election opponent Joe Biden’s son, Hunter Biden in a Quid Pro Quo for foreign aid. On
September 24th Speaker of the House, Nancy Pelosi launched an inquiry into the matter that was
reported just 4 days earlier. In October, the House of Representatives started getting dispositions
from key members of the reported incident and at the end of the month Pelosi announced that there
would be a vote for the formal start of the impeachment process. On November 13th live hearings in
front of the House Intelligence Committee started to get official testimony from those involved. On
the 4th of December the Judicial Committee began hearing from constitutional law scholars on
whether the president broke constitutional law. The next day, the House decided to move forward
with impeachment proceedings. On the 12th the House approves 2 articles of impeachment, abuse of
power and obstruction of Congress which were ratified by vote on the 18th. The U.S. Senate has yet
to vote on the matter. Though this is a big-ticket item for many people across the U.S, it affects the
fund’s decision making and the market very little. It came up in conversation but was always
contributed as a non-factor due to it the markets constant gains over the year no matter what was
brought up about the inquiry. This was least market affecting item in which the president was
involved. This is also evident when Bill Clinton was impeached in 1998, the stock market surged
extremely high.

9
Brexit
This again has been happening for several years before the inheriting of the portfolio but came to a
head in the last 3 months. It began in 2016 when the citizens of the U.K. voted on a referendum to
leave the European Union. By the time the portfolio transferred the date of leaving the EU had already
been extended and was a tentative topic with many failed votes in the House of Parliament. Just
before the semester started the new Prime Minister Boris Johnson was voted in after the previous,
Theresa May, resigned. A new draft of withdrawal bill was created and accepted by the EU
commission, but it didn’t pass a hung parliament on the 31st of October. This caused the many parties
of the U.K to vote and approve any early general election in which the Conservative Party, the party
of the Prime Minister won a majority. The new deadline for ‘Brexit’ is January 31st, 2020. The
uncertainty and events regarding ‘Brexit’ and parliament pushed the fund away from European
assets.
Hong Kong
An extradition bill was proposed in February 2019 to extradite criminals in Hong Kong to mainland
China and other countries that Hong Kong didn’t currently have extradition treaties with. At the end
of March 2019 thousands of protestors took to the streets in opposition. This was soon followed by
an amendment to the extradition bill that would allow criminals to be tried in Chinese court. This
was met with even more protesters petitioning for the scrapping of the amendments and the bill.
There were concessions made on the bill, but it didn’t stop the protesting which led to more than half
a million in the streets by the beginning of June. On the 22nd anniversary of the handing over of British
Rule to the Chinese, protesters storm the Legislative Council and deface it. The bill is declared dead
on July 9th. Alibaba delayed its IPO on August 21st due to the protests. Protests get violent as police
start to fire live rounds as violence and vandalism erupts throughout the city in September and
October. At the end of October, Hong Kong slides into recession for the first time in the last decade.
The violence extends into November, where students become the main target as Hong Kong
Polytechnic University becomes a warzone. This resulted in a student death after being pushed off a
parking garage. The events in Hong Kong were constant risks during the holding period and are
continuing to this day. They may have contributed to the gains that were made off SMH and VXUS
later in the semester as the events that occurred had a negative effect on many Asia-centric holdings.
This allowed the managers to enter at lower prices later in the semester. These ongoing issues are
partially a reason for implementing a higher percentage of bonds over the dormant period as they
contribute to greater uncertainty.

10
Director of Research
Overall Performance
The Student Managed Fund returned 3.89% over the active trading period, and the benchmark
returned 6.78% over the semester. Additionally, the benchmark overperformed the fund by 2.89%.
The managers were able to beat the benchmark from September to early October due to quickly
allocating to overweight in bonds and conservative equities. However, when the market rebounded,
the managers could not adjust out of their defensive strategy quickly enough. The holdings used for
the funds defensive strategy may have been overvalued as VPU and VNQ performed extremely well
until October, which could have led to the sudden decrease in equities.
(Figure 1: Daily return of the Benchmark versus the Portfolio throughout the whole semester)
Sector Holdings
Initially, the managers inherited a portfolio composed of 85% SPY and 15% BND, and the portfolio
consisted of an mix of domestic bonds, technology, industrials, healthcare, financial services, and
consumer cyclical sectors. When the managers began using a more defensive strategy, they allocated
more of the portfolio towards bonds, consumer defensive, utilities, and real estate. Towards the last
few weeks, the managers removed the positions in commodities and real estate due to their poor
performances. The reason for moving towards international bonds was due to the uncertainty in U.S.
bonds, and because EMB has historically shown high yields.

11
(Figure 2: Percentage of sector contributions throughout the whole semester)
Regional Analysis
Throughout the investment period, the portfolio’s predominant region was North America. First, the
managers diversified internationally by purchasing an International Total Market ETF (VXUS). Later,
they invested in specialized ETFs such as SMH, which held semiconductor stocks in Asia and the
United States, and VGK, which increased Europe’s exposure in the portfolio. Due to the possibility of
a conservative party having majority in the UK, the managers believed that Brexit would be pushed
towards an early election. This caused them to purchase a stake in VGK to take advantage of European
stocks that would rise in reaction to the news. In addition to these holdings, the managers held VXUS
at two separate times. The first was held for a loss, while the second was for a large gain when
international developed markets performed well, which lead to the fund’s stance heading into the
dormant period.
Attribution Analysis

12
(Figure 3: Attribution Analysis of each ETF in the portfolio)
Over the first two months of the holding period, the managers allocated conservative holdings due to
the recession talks in the market. VNQ and VPU, two of the funds conservative sector holdings,
performed the worst in the portfolio, generating -1.17% and -0.88% alpha, respectively. While the
market was trending upwards, VNQ’s losses sustained due to the long holding time, and VPU
performed poorly during volatile and positive times. The volatile times were surprising, as utilities
tend to thrive in uncertain markets. The defensive strategy allocated towards fixed income
throughout the semester proved to be a major cause of the fund’s underperformance towards the
benchmark. The lowest percentage of bonds, held after the dormant period, was about 27%, and is
higher than the benchmark. The over allocation of bonds and the 6% allocated to commodities,
through GLD and NIB, contributed to an alpha of -1.09%. These gains were irrecoverable even
through some strong outperforming holdings.
The top performers, over the course of the semester in the portfolio, were the VanEck Vectors
Semiconductor ETF (SMH), and Health Care Select ETF (XLV). The fund’s best holding was the
VanEck Vectors Semiconductor ETF (SMH), which the managers invested in four weeks after it was
pitched. It created the largest gain compared to its benchmark with a 0.54% active return alpha. The
fund first allocated 9.65% of its holdings in SMH on October 25, 2019 by buying 96 shares at $126.69.
Over the course of the semester, this ETF itself returned 12.99% in its original investment during its
holding period. XLV, the second-best performer, generated an alpha of 0.36%. This was bought twice
during the semester. First, 145 shares were purchased for $94.18, then an additional 47 shares were
purchased at $98.17, yielding a combined return of 7.48%.

13
The most negative impact on the portfolio from an individual holding was VNQ (Vanguard Real Estate
ETF). VNQ disfavored the fund with an alpha of -1.17% due to its long holding period, while the
market grew rapidly and VNQ’s performance holdings declined. Its total return to its benchmark was
-8.85%. The main cause of its sudden decline was high valuation of U.S. Real Estate and stabilized
interest rates, which did not benefit REITs. 215 shares were purchased at $93.58 on the 20th of
September and were sold twice: 100 shares on the 13th of November and 115 shares on the 22nd of
December.
The other causes of underperformance included commodity ETFs such as GLD and NIB. They
contributed -0.23% and -0.27% active return, respectively. Poor allocation and selection of
commodities affected the fund’s alpha greatly. This indicates that the fund should have kept its
allocation in equities as this could have helped create a return closer to the benchmark. The
acquisition of the gold ETF was poorly timed as it was when the market started to move positively,
and the holding was not liquidated quickly. The NIB trade decision was an effort to time the market
by buying on the cocoa bean’s ETF before the Christmas holiday where the expectation of a higher
demand in chocolate was forecasted. This proved to be detrimental to the performance as the
markets continued to rise.
Dormant Period- [05/02/19-09/05/2019]
Overview
During this time period, the inherited portfolio holdings of SPY and BND seemed to have performed
better, given the markets grew the most during Quarter 3 of 2019. However, in comparison to the
benchmark, the given portfolio of SPY and BND was trailing the benchmark at the commencement of
the semester. During this time period, investors began to worry about markets in terms of what
Federal Chairman, Jerome Powell, was going to do to the Federal Funds Rate and the President’s take
on the U.S.-China Trade war. Since Quarters 1 & 2 of 2019 have shown that investor sentiment was
more positive in the fixed income area, most investors and financial news began to think they reached
a peak within the fixed income bracket and looked to pivot towards equities. So, the inherited
portfolio, an 85% allocation of SPY and a 15% allocation of BND, seemed to be in the managers’ favor
at the beginning of their management.

14
Market Developments The macroeconomic landscape during the months of May to September included ongoing economic
expansion, low inflation, and positive policy revisions. Investors within the markets began to see
weaker earnings, higher prices, and low volatility, and favored regions to invest were the United
States and emerging markets. Since volatility and valuations were high, investors started to seek for
quality equities in sectors that can sustain earnings growth even if the managers reached a slower
economy in the nearing late cycle of the markets. Such sectors included healthcare and tech firms, in
which the inherited portfolio holding, SPY, happened to benefit during the dormant period as it had
a 27.01% allocation towards technology and 13.7% allocation in healthcare.
As for the fixed income area, coupon income from the historical performance has shown to contribute
to a huge portion of the global fixed income market in times like this. Academia mentions that
declines in yield may elevate the capital appreciation in generating returns, which the managers have
seen in US Treasuries and EM debt at the end of Q1 and start of Q2 of 2019. Towards mid-Q2 of 2019,
FOMC continued to cut federal funds rates, in hopes to boost the economy in order to stall the markets
from experiencing a near term recession. As expected, M&A and IPO activity had slowed down in
response to the heightened uncertainty with US-China trade tensions and global slowdown, which
affected the way BND performed within the last few weeks of Q3. Additionally, the portfolio benefited
from a higher exposure in equities rather than fixed income during the dormant period, as
technology, media, and telecom were the leading sectors in value and volume during that time.
Starting at the commencement of the semester, the markets had a mixed mindset, with contradicting
opinions and news flows regarding the President’s stance on increasing or decreasing tariffs with
changing news between the U.S. and Chinese. News headlines filled with remarks on President Trump
and PM of China to meet and talk about trade negotiations, which at the time were to be imposing a
tariff on $300 billion dollars’ worth of Chinese imports (an increase from 15%) which would take
into effect on September 1st. Along with this, critics in the news were talking about job employment
(figures mis-forecasted for July and August), and GDP grew at a mere 2%, and talks surrounding
federal funds rate cuts. Although in the fund’s case, federal fund cuts would prove favorable to help
its fixed income allocation with BND and monetary/fiscal policy easing would help iron out potential
investment ideas in the equities market.
15
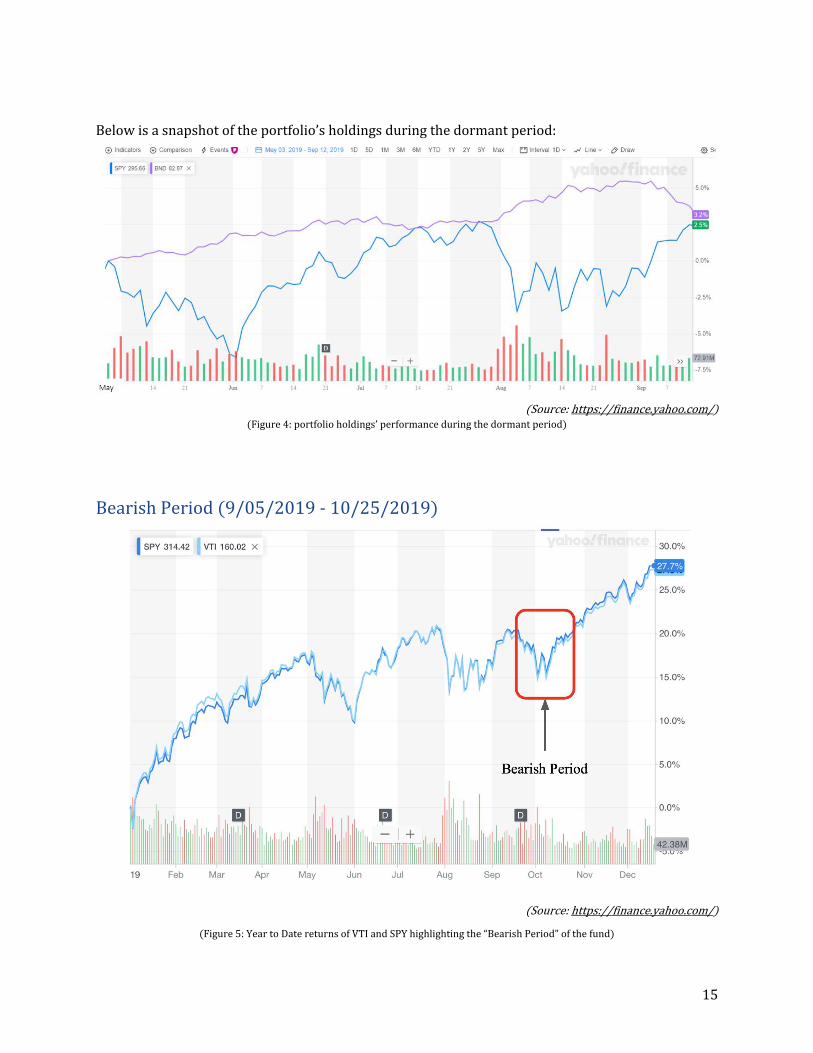
Below is a snapshot of the portfolio’s holdings during the dormant period:
(Source: https://finance.yahoo.com/) (Figure 4: portfolio holdings’ performance during the dormant period)
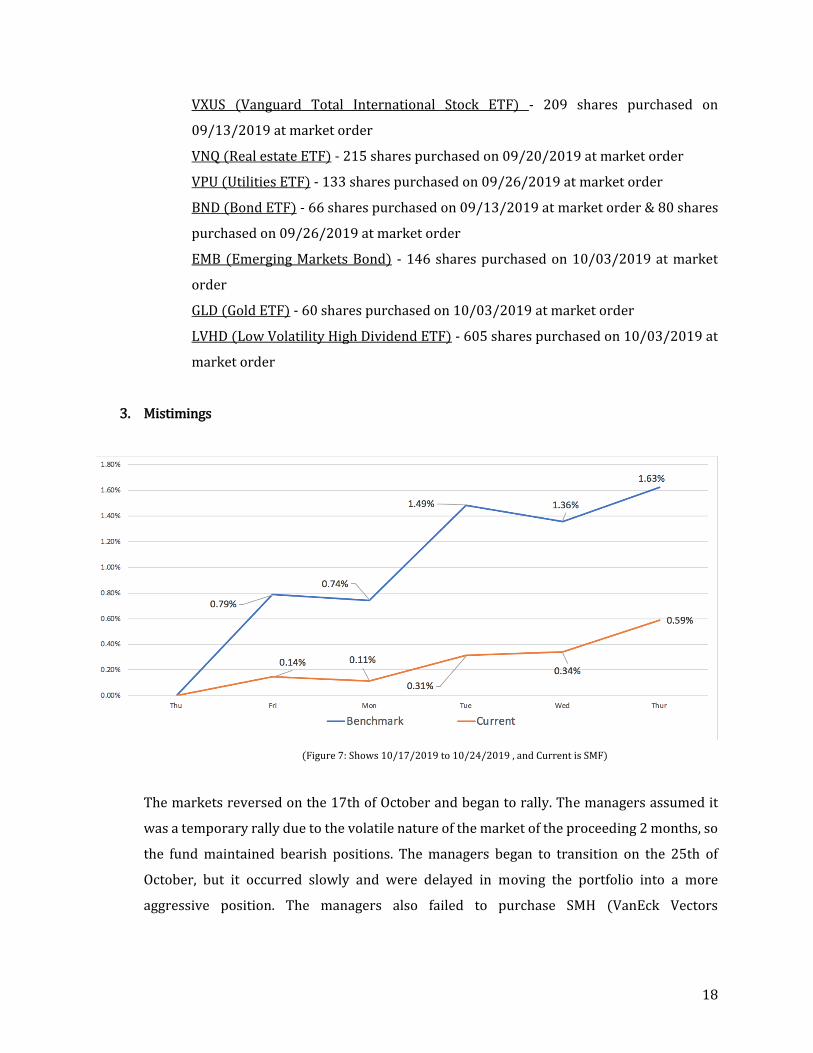
Bearish Period (9/05/2019 - 10/25/2019)
(Source: https://finance.yahoo.com/)
(Figure 5: Year to Date returns of VTI and SPY highlighting the “Bearish Period” of the fund)

16
Overview
The markets began to decline in mid-September and there were several news stories that made the
managers believe the decline would continue for considerably longer. As a result, they moved the
portfolio to a more defensive position. The following section reveals why their outlook became
bearish, and why they allocated the portfolio to a more defensive position.
Market Developments
During the bearish period the macro events pushed the managers of the fund to hold a conservative
portfolio as international and domestic uncertainty caused a high level of volatility.
1. US China Trade War
The US-China dispute which has been going on for over 18 months, with both countries
imposing tariffs on hundreds of billions of dollars worth of each other’s goods. While the US
accuses China of intellectual property theft and several other unfair trading practices, China
believes the US is trying to slow its economic growth. Between September and October, both
countries threatened to impose new tariffs and increase existing ones. The markets
constantly reacted to the trade war news, with increased volatility and a fall in the prices of
the overall market. The figure above (Figure 5) shows the price chart of SPY and VTI. Both
ETFs show increased volatility between August and November.
2. Increased fear of a recession
The trade war between the US and China created high levels of uncertainty on Wall Street.
The report from the manufacturing sector contracted to the worst level in a decade. There
were also two Federal Reserve interest rates cuts within the semester. The first rate cut
increased the fear of a recession while the other occurred after the transition to the bullish
period started. There was also a significant outflow of cash from aggressive positions to more
defensive investment positions, as shown by investors on Bloomberg.

17
Asset Allocation and Trades
1. Asset Allocation
(Figure 6: Asset Allocation during the Bearish Period)
After the dormant period ended during the first week of class, the asset allocation became
bearish. Initially the fund increased its bond allocation by 4% on the 13th of September, from
15% to 19%; then again on the 20th going up to 24%. The percentage of bonds in the portfolio
increased on the 3rd of October when the fund bought EMB. This would push the allocation
from 24% to 36% where the allocation would stay over the rest of the bearish period. This
is 16% overweight relative to the benchmark which proved beneficial as this was a time
where the fund was outperforming the benchmark. Even in the equity assets the managers
became considerably more conservative as the first two pitches presented were in real estate
and utility sectors, two defensive equity sectors, to compliment the increase in bonds the fund
held.
2. Trades
Over a period of four weeks (09/13-10/03) the managers purchased more defensive ETFs in
anticipation of further decline and the beginning of a possible recession. The following are
the ETFs that they chose to include in the portfolio:
18
VXUS (Vanguard Total International Stock ETF) - 209 shares purchased on
09/13/2019 at market order
VNQ (Real estate ETF) - 215 shares purchased on 09/20/2019 at market order
VPU (Utilities ETF) - 133 shares purchased on 09/26/2019 at market order
BND (Bond ETF) - 66 shares purchased on 09/13/2019 at market order & 80 shares
purchased on 09/26/2019 at market order
EMB (Emerging Markets Bond) - 146 shares purchased on 10/03/2019 at market
order
GLD (Gold ETF) - 60 shares purchased on 10/03/2019 at market order
LVHD (Low Volatility High Dividend ETF) - 605 shares purchased on 10/03/2019 at
market order
3. Mistimings
(Figure 7: Shows 10/17/2019 to 10/24/2019 , and Current is SMF)
The markets reversed on the 17th of October and began to rally. The managers assumed it
was a temporary rally due to the volatile nature of the market of the proceeding 2 months, so
the fund maintained bearish positions. The managers began to transition on the 25th of
October, but it occurred slowly and were delayed in moving the portfolio into a more
aggressive position. The managers also failed to purchase SMH (VanEck Vectors
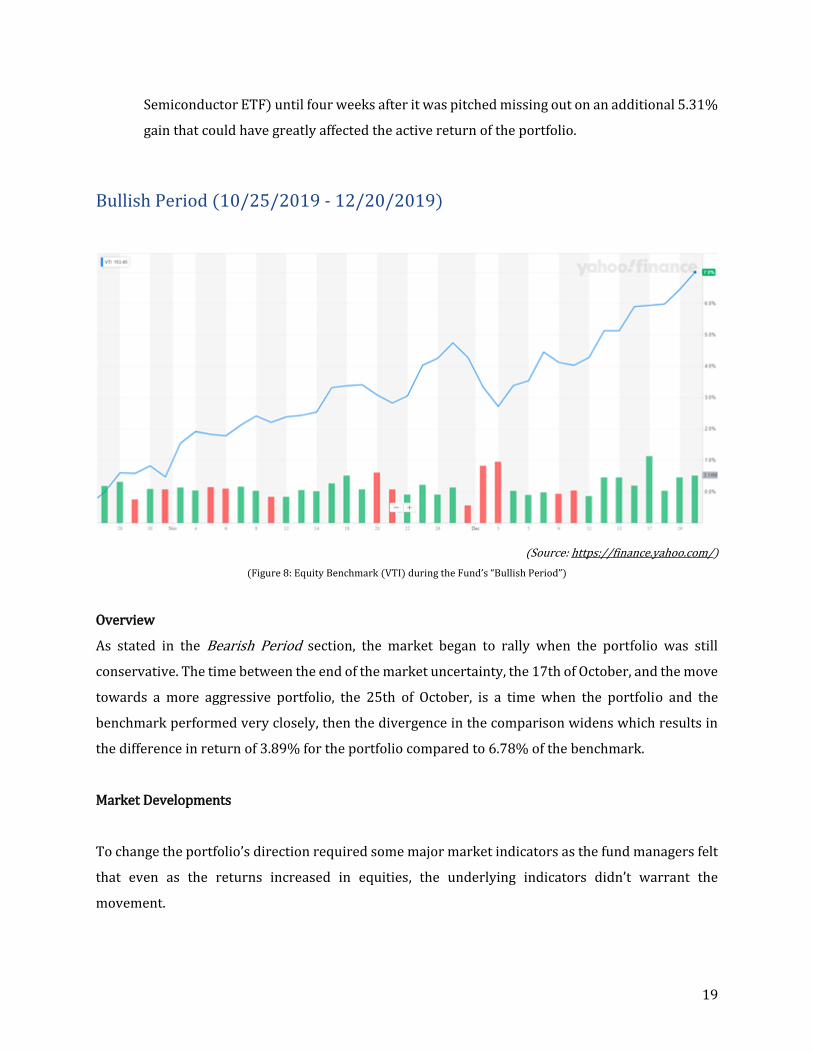
19
Semiconductor ETF) until four weeks after it was pitched missing out on an additional 5.31%
gain that could have greatly affected the active return of the portfolio.
Bullish Period (10/25/2019 - 12/20/2019)
(Source: https://finance.yahoo.com/)
(Figure 8: Equity Benchmark (VTI) during the Fund’s “Bullish Period”)
Overview
As stated in the Bearish Period section, the market began to rally when the portfolio was still
conservative. The time between the end of the market uncertainty, the 17th of October, and the move
towards a more aggressive portfolio, the 25th of October, is a time when the portfolio and the
benchmark performed very closely, then the divergence in the comparison widens which results in
the difference in return of 3.89% for the portfolio compared to 6.78% of the benchmark.
Market Developments
To change the portfolio’s direction required some major market indicators as the fund managers felt
that even as the returns increased in equities, the underlying indicators didn’t warrant the
movement.

20
1. The U.S China Trade War
Although much news on the trade war was circular, as it seemed that rumors that pushed
markets higher were always being debunk or backtracked, the trend of news was positive. As
stated in the Major Developments section, by mid-October “Phase 1” on an agreement had
been announced and the U.S. was starting to exclude Chinese products from the tariffs it had
set of the last 18 months. This news would continue as in November trade negotiators agree
to the principles of this phase of the trade deal and worked on the specifics until the signing
of it on December 13th. These growing positive indicators and lull in activity in November
push investors more firmly into a bullish demeanor.
2. Interest Rates
At the start of the bullish phase interest rates dropped on the 30th of October, which is an
indicator of weak economic position, but this decision was not unanimous. Esther George and
Eric Rosengren, two of the Federal Reserve governors voted against the decision as they did
not think the cut was warranted as the U.S economy was still strong. Chairman Powell stated
there were plenty of international risks, but a limited trade deal and a “Brexit” deal would
ease some of these risks. The chairman also said that this current stance seemed likely to be
held in the future which has been illustrated as there was no change in the December FOMC
meeting. These points pushed towards bullish sentiment even though the rate dropped, as it
seems as just a cautionary measure due to external uncertainty.
3. Brexit
Though there had been much uncertainty since the referendum was signed in 2016 and even
more with the departure of Theresa May, Boris Johnson had a deal accepted by the European
Council and endorsed by the Council President Jean Claude Juncker on the 17th of October.
As seen in the Major Developments section this vote was not passed. The fund perceived this
deal as the leverage Prime Minister Johnson needed to gain the upper hand in an early
election. This came to fruition as the Pro-Brexit Conserative Party won an outright majority
of seats. This removed much international risk as it created certainty that Brexit would be
happening and that a deal with the E.U. is imminent. This was echoed by a surge in the
strength of the British Pound and capital markets.

21
Asset Allocation and Trades
(Figure 9: Holdings allocation for the Bullish period)
1. Asset Allocation
The bullish period started as the fund moved from 36.5% Bonds in EMB and BND down to
27.6% by reducing its holdings of BND. Though this is not bullish compared to the benchmark
that holds 20% debt, this is as aggressive as the fund became. This was a major oversight as
the fund became overly focused on the makeup of the equity holdings and not the allocation.
This is the funds relatively “bullish” period. The allocation hovers around 67% equities, 27%
bonds and 6% commodities for the rest of the holding period. The lesser allocation of bonds
may be an improvement, but it was still a detriment to the overall portfolio. The gains made
over the bullish period from holding EMB (Emerging Market Sovereign Debt), which
outperformed the bond benchmark of BND, did not make up for the allocation difference. The
commodities were also drawbacks to the portfolio as GLD and NIB had a combined alpha of
-0.49% for the low allocation they had. More proof of the potency of asset allocation is the
fact the fund had multiple equity assets that outperformed the equity benchmark, VTI. These
etfs, SMH and XLV, did not help the portfolio make up the difference due to asset allocation.
The alpha of SMH and XLV together is 0.90% while the alpha of asset allocation is -1.09%.
This proves that it is just as important to consider how much of an asset to hold as the specific
holdings of that asset class.
2. Important Trades

22
During this period, the fund introduced five new holdings to the portfolio. These were VanEck
Vectors Semiconductor (SMH), Vanguard FTSE Europe (VGK), Healthcare Select Sector SPDR
(XLV), IShares Edge MSCI Quality Factor (QUAL), and iPath Bloomberg Cocoa Subindex (NIB).
On the transition day of October 25th, VGK and SMH were introduced, and VXUS was
reintroduced. SMH turned out to be the most important addition to the portfolio as it
returned 12.99% on the 96 shares that were bought at $126.69 and sold at $143.15. VGK did
not outperform the VTI benchmark as it returned 5.44% since October 25th while VTI
returned 7.43%. VGK was purchased at $55.29 and was sold at $58.30. Although this missed
the benchmark by 1.99%, this was considerably better than other holdings during the
semester. The other important addition to the portfolio was XLV, added on both the 8th and
the 22nd of November. This was a real turning point towards the most bullish the fund would
get as the conservative equity holdings would be liquidated for more aggressive assets. VPU
(Vanguard Utilities) was liquidated while VNQ (Vanguard Real Estate) would be liquidated
later in the holding period. The managers purchased 145 shares of XLV at $94.17, which
yielded an 8.97% return. Then, 47 shares were purchased at $98.17, which yielded a 4.54%
return. The total yield over the period was 7.48% from XLV.
3. Mistiming
The mistiming during this period was mostly pertinent to the liquidation of assets that were
not performing, which in this case would be due to the liquidation of VPU, VNQ, and NIB.
These returned -3.5%, -2.74% and -3.51% respectively. This is the real failure in the
transition towards a bullish portfolio. The change focused too much on just reducing the bond
allocation and not completely analyzing the equity holdings. Neither of the things were done
in a timely manner or completely done which impacted and offset strong gains from other
holdings. With VNQ specifically, during the bearish period, it reached a return of 1.78%, yet
the fund sustained a -2.65% return on the asset. 215 shares were purchased at $93.58 and
100 were liquidated on the 22nd of November at $91.69 and the remaining 115 shares were
sold on the 13th of December at $90.43.
23
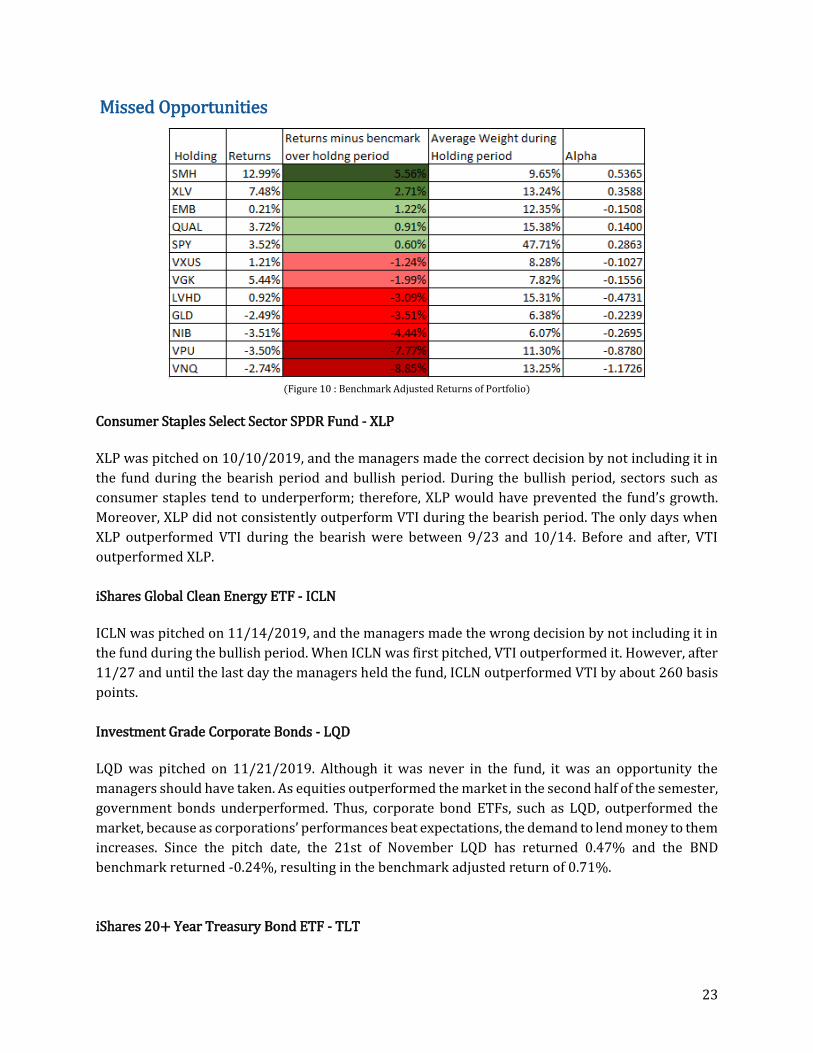
Missed Opportunities
(Figure 10 : Benchmark Adjusted Returns of Portfolio)
Consumer Staples Select Sector SPDR Fund - XLP
XLP was pitched on 10/10/2019, and the managers made the correct decision by not including it in
the fund during the bearish period and bullish period. During the bullish period, sectors such as
consumer staples tend to underperform; therefore, XLP would have prevented the fund’s growth.
Moreover, XLP did not consistently outperform VTI during the bearish period. The only days when
XLP outperformed VTI during the bearish were between 9/23 and 10/14. Before and after, VTI
outperformed XLP.
iShares Global Clean Energy ETF - ICLN
ICLN was pitched on 11/14/2019, and the managers made the wrong decision by not including it in
the fund during the bullish period. When ICLN was first pitched, VTI outperformed it. However, after
11/27 and until the last day the managers held the fund, ICLN outperformed VTI by about 260 basis
points.
Investment Grade Corporate Bonds - LQD
LQD was pitched on 11/21/2019. Although it was never in the fund, it was an opportunity the
managers should have taken. As equities outperformed the market in the second half of the semester,
government bonds underperformed. Thus, corporate bond ETFs, such as LQD, outperformed the
market, because as corporations’ performances beat expectations, the demand to lend money to them
increases. Since the pitch date, the 21st of November LQD has returned 0.47% and the BND
benchmark returned -0.24%, resulting in the benchmark adjusted return of 0.71%.
iShares 20+ Year Treasury Bond ETF - TLT
24
TLT was pitched on 10/10/2019, and the fund managers made the correct decision by not including
it in the fund. The strategy of the fund was based on exposure to long-term US Treasury Bonds, in
which the fund’s duration was 18.21 years. The managers were cognizant of the fact that fixed income
ETFs might have reached their peak during the time that this was pitched, and they were weary if the
fund would be able to chase performance given the circumstances. For these reasons alone, they
decided to keep TLT out of the fund, which in hindsight was a good play for the fund overall.
WisdomTree U.S High Dividend Fund – DHS
DHS was pitched on October 10th, 2019 and was never included in the portfolio over the semester.
From the date it was pitched to December 20th, this ETF returned 4.8% where we missed the price
appreciation and high yield distribution of monthly dividends. It has a slight growth perspective and
has most of its allocation in large-cap stocks, which was one of the biggest gainers in market
capitalization types. It had stable growth over the 2-month period that the managers had the
opportunity to allocate in. The biggest risk factor for this ETF is the lack of liquidity, the average trade
volume was much smaller than the rest of the ETFs the portfolio held over the semester.
iPath Series B S&P 500 VIX Short Term Futures ETN - VXX VXX was pitched on 10/31/2019, and it was never included in the portfolio. Since pitched, VXX
went down by -20.3% compared to VTI that went up by 5.4% and its individual benchmark, QMN,
that went up by 1.1%. Nevertheless, VXX did have a big peak within this period, from 11/27 to
12/03, where it increased by 17.4%, compared to VTI (-2.3%) and QMN (7.4%). Hence, the
managers could have gotten a big performance out of VXX. However, given the risk and volatility
that comes with VXX and attempting to time volatility trades, the managers did not include it into
the portfolio.
Dormant Period
Since there will be no class next semester for student managers to control the portfolio, it is crucial
to note that the dormant period will last until the beginning of September 2020 (about 9 months).
According to the IPS, the chart below demonstrates the asset classes and the asset class allocation
ranges that the team are permitted to hold.
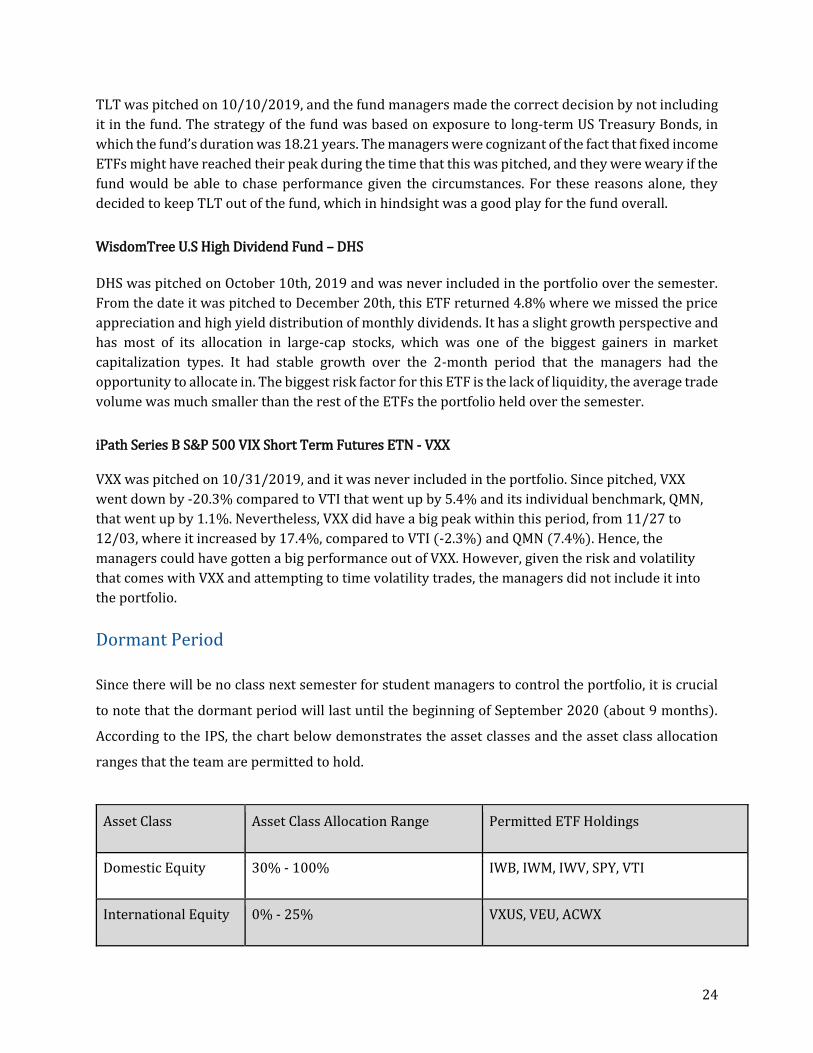
Asset Class Asset Class Allocation Range Permitted ETF Holdings
Domestic Equity 30% - 100% IWB, IWM, IWV, SPY, VTI
International Equity 0% - 25% VXUS, VEU, ACWX

25
Bonds 0% - 35% AGG, BND, TLT, BNDX
Special Situations 0% None
Cash 0% - 40% Brokerage Money Market, BIL
During the active period of Fall 2019, events such as the trade war between the U.S. and China, Brexit,
Hong Kong protests, and the decrease in interest rates (twice during the active portfolio period)
mainly influenced the portfolio. Each one of these events affected the market in some ways, and some
of these events are still in situations where it could negatively affect the market. Thus, the managers
decided to diversify the holdings by concentrating more on holding a wider variety of companies and
the team strongly believes that the portfolio needs a wider exposure to the market - not only the
large, mid, and small cap companies within the U.S. but also foreign companies located outside of the
U.S., mainly in the European and Asian regions. Therefore, the managers’ final decision for the
dormant period portfolio consists of 488 shares of BND (30%), 418 shares of VTI (50%), and 489
shares of VXUS (20%).
Due to the constant political and economic unrest within the country, the team believed it is best to
hold VTI, which tracks the performance of CRSP U.S Total Market Index, and VXUS, which holds a
wide variety of European equities, instead of focusing on SPY which tracks just S&P 500 companies,
which could be heavily affected by domestic or international events. Both ETFs offer a much broader
exposure to the market than does the holdings of SPY and this diversification thus illustrates that the
portfolio will be more internationally balanced. The main reasoning behind holding 30% of BND is
that the managers felt as though they still need to be somewhat conservative, because they are still
very uncertain as the portfolio will be sitting dormant for a considerably longer period than in the
past.
Figure 10 illustrates the annual performance of the four ETFs (SPY, VXUS, VTI, BND) in 2018.

26
(Figure 10: 2018 Performance of VTI, VXUS, BND, & SPY)
The 2018 performance chart shows that SPY, VTI and VXUS (worst performance) performed
extremely poorly during the year relative to BND, which returned -2.62% in terms of annual return.
Figure 11 demonstrates the 2019 performance of the four ETFs.
(Source: https://finance.yahoo.com/) (Figure 11: 2019 Performance of VTI, VXUS, BND, & SPY)

27
In 2019, the Year-To-Date returns for SPY and VTI are extremely high compared to those of either
VXUS and BND. Just by looking at the graphs above, one might believe that inheriting VXUS instead
of SPY could possibly be a wrong choice since SPY has been outperforming VXUS overall for the past
2 years. However, in terms of the performance of each ETF, the managers found an interesting result.
While VTI shows a nearly identical movement with SPY, the managers witnessed that during the
active period, VXUS almost always outperformed SPY (11.0% and 10.3%, respectively) except 11/25
to 12/04, and 12/6 to 12/10. The managers believe that one of the major reasons why this occurred
was mostly due to the negative news and events across the U.S. that heavily affected the market.
Moreover, while BND did not perform particularly well during this period, the managers still believe
that holding 30% of BND instead of any other ETFs is a defensive way of protecting the portfolio
should the equities take an unexpected turn.
Conclusion
In conclusion, the team’s main decision of holdings for the dormant period stems from the uncertain
factors that still lie ahead that could potentially and negatively influence the market, thereby
diversifying the holdings by representing a wider variety of companies. Since the portfolio will be
dormant for about nine months and no trades could be made during the time, BND will be the
portfolio’s defensive holding that could hopefully offset the loss of equities during the times of an
unstable market. Since the benchmark’s allocation of BND is 20% and SMF’s allocation of BND is 30%,
if equities underperform, SMF will beat its benchmark. Moreover, if the equities in North America
and/or foreign markets diverge, then there is a big chance the fund will outperform its benchmark
due to having holdings in both domestic and international equities.
Although there was a definite underperformance by the fund versus the benchmark, the managers
learned a great deal since inheriting the portfolio. Important skills, such as taking the initiative to
lead a pitch or having good communication skills to illustrate events, were honed throughout the
semester. The presentations and ideas became more diverse as the search for tailoring a strong
strategy continued. Managing the fund also gave insight on the importance to assess the future value
of an asset when determining an investment strategy. Once more, the managers are grateful for this
opportunity and would like to thank the board and the James family, as well as professor, Dr. Shohfi,
for his guidance throughout this journey.

28
Fund Manager Biographies
Christian Assimus Christian is currently pursuing a bachelor’s degree in Economics with a focus in international economics. He had worked in a business centric role in the past helping create distribution networks and managing pricing at small firms. Christian hopes to gain valuable investment experience for personal and professional use. In his spare time, he enjoys golf, traveling, and art.
Brad Kim Currently pursuing a bachelor’s degree in Business and Management with a minor in Economics and a concentration in Finance. His original intention was to study accounting, but recently changed his mind to study finance. He is currently thinking about pursuing a MS degree in finance (not 100% sure yet).
Michael Gazsi Michael has a passion for business, especially in the area of finance and analytics where he has developed strengths in mathematical analysis and knowledge in finance. As a student-athlete on the Rensselaer football team, he has chosen and currently pursuing a 5th-year MBA. As a collegiate athlete, over the years he has developed skills like strong communication, a rigorous work ethic, dedication, time management, and great teamwork. Michael has been able to take these skills in football and apply them towards his career path. He enjoys building relationships. Originally from California, studying in New York has stretched his networking abilities.

29
Deepika Senthilnathan Deepika will be completing her bachelor’s in Business Management with a minor in Economics and a concentration in Finance in May and pursue a MS in Quantitative Finance afterwards. This past summer, Deepika interned with BlackRock and had the opportunity to work with strategists on ETFs. In the past, Deepika has interned with a financial advising firm where she helped clients reach their financial goals through different investment products and tools that the firm offered. Deepika hopes to build on her experiences and further expand her skill set to explore in the investment industry. Outside the classroom, Deepika enjoys spending her time with friends and playing tennis.
Beck Zhu Beck Zhu is currently pursuing his bachelor’s in Business Management with a concentration in Finance and a minor in Economics. In the past, Beck has worked at IBM assisting consultants at their Institute for Business Value. After graduation, Beck hopes to start a career in the finance industry. Outside of the classroom, Beck spends his time swimming and hanging out with brothers at Lambda Chi Alpha.
Pavankumar RamadassVenkatesulu Pavankumar is currently pursuing a bachelor’s degree in computer science. He occasionally trades in the forex and commodities market (specifically oil and gold), and he hopes to use his programming experience to do quantitative analyses. He hopes to get an internship during the summer involving quant work.

30
Nkechinyere N. Agu Nkechinyere N. Agu is a 2nd-year graduate student in the Computer Science Department. She was born in Nigeria and majored in Software Engineering at Baze University before coming to Rensselaer. Her research interest is on developing deep learning techniques aimed at enhancing global healthcare. Her long-term goal is to start up her own health analytics company.
Nicolas Hoeksema Nicolas is an exchange student from the University of Groningen. He is currently in his last year of his bachelor’s degree in Economics & Business Economics. After this year he will start a pre-master in Econometrics & Operations Research. His interests are in Operations Research, data analysis, and entrepreneurship. He has experience in commercial relations, which he did for his student association last year

31
Faculty Advisor
Professor Tom Shohfi, CFA, CAIA, FRM
Prior to advising the RPI Lally James Fund, Tom served as an
assistant adjunct professor for the undergraduate Applied
Investment Management class at the University of North
Carolina at Chapel Hill’s Kenan-Flagler Business School. He was
also a member of the board of advisors for UNC Chapel Hill's
BSBA and MBA Applied Investment Management funds
Mr. Shohfi was a Dean's Scholar at New York University and
earned a BA in Computer Science and Mathematics. He also
received his MBA from Kenan-Flagler Business School at the
University of North Carolina at Chapel Hill. He holds the
Chartered Financial Analyst, Chartered Alternative Analyst, and
Financial Risk Manager designations. He was awarded a PhD in
Financial Economics from the University of Pittsburgh. Mr.
Shohfi’s research interests include textual analysis applications
in finance and financial analyst behavior.
Professor Shohfi, in addition to academic events, has presented
his work at Citadel Global Equities, Blackrock Scientific Active
Equities, T. Rowe Price, and Wharton Research Data Services.

32
Appendix *This appendix consists of all the ETFs that were pitched during the active period.
Legg Mason Low Volatility High Dividend ETF - LVHD The investment seeks to track the investment results of the QS Low Volatility High Dividend Index (the "underlying index"). The fund will invest at least 80% of its net assets, plus borrowings for investment purposes, if any, in securities that compose the underlying index. The underlying index is composed of equity securities of U.S. companies with relatively high yield and low price and earnings volatility. Unfortunately, this investment did not give the return that the managers hoped it would. It was initially pitched because the market was at a very volatile state at the time and a fund that provided stocks with low volatility and high dividend yield seemed like the right choice to make. Also, there was a sudden drop after a gradual increase and the price was slowly making its way back to its previous-high price and the team believed that it was the right time to purchase this ETF. Vanguard Long-Term Bond Index Fund ETF Shares - BLV The investment seeks to track the performance of the Bloomberg Barclays U.S. Long Government/Credit Float Adjusted Index. Bloomberg Barclays U.S. Long Government/Credit Float Adjusted Index includes all medium and larger issues of U.S. government, investment-grade corporate, and investment-grade international dollar-denominated bonds that have maturities of greater than 10 years and are publicly issued. All of its investments will be selected through the sampling process, and at least 80% of the fund's assets will be invested in bonds held in the index.
This ETF is definitely one of the missed ETF holding opportunities because the ETF returned over 2.1% ($100.46 when pitched and the price rose up to $102.59) starting from the day after this ETF was pitched until just shy of two weeks later. BLV was initially pitched because the student manager believed that this ETF had been on a downward trend for some time, and that it was just about the right time for it to make a comeback.
iShares Edge MSCI USA Quality Factor ETF- QUAL
This ETF fund seeks to track the investment results of an index that measures the performance of U.S. large to mid-cap stocks that are screened by three variables, including return on equity, earnings variability, and debt-to-equity. As proven by these three characteristics screeners, some of the household stocks this ETF carries are JNJ, FB, AAPL, MSFT, etc. This ETF has a high allocation of information technology, healthcare, and financials, all of which are strong sectors that have performed well in 2019. The companies within these sectors can weather through some of the rough moments in the market cycle, and yet still provide a return to investors that is better than the S&P 500. This investment performed well with a cumulative return of 30.95% year to date, and for the last three months, 8.74%. While the managers did own similar ETFs in the portfolio, LVHD and VTI, they

33
decided to liquidate out of LVHD as the performance was not parallel to how the markets were performing all around. QUAL and VTI had shown to be parallel performers during the start of Quarter 4. The managers purchased 208 shares of QUAL on November 22nd, 2019 at $97.12 and have made a profit of 4% by selling the shares on December 20th, 2019 at $100.93. SPDR Gold Shares – GLD
The fund seeks to track the overall price of gold. It does this using the gold price of gold bars held in London vaults minus liabilities and expenses. Investors always return to gold (and silver) when the market goes into a recession. And by this time there was a lot of uncertainty in the market coming from multiple sources. First of all, there is a general thought that the market will have to go down soon. Secondly, the U.S.-China trade war was a rising concern and did not seemed to be revolved. Finally, it was not at all certain whether or not Britain would leave the European Union with or without a deal. These reasons could mean that investors will go back to gold which entails an increase in the price of GLD. Moreover, gold is a good asset to have in a portfolio in order to have some stability. The investment did not perform the way the managers hoped it did. This was mostly because it seemed to follow the direction of the market during the holding period, rather than going the opposite way. iPath Bloomberg Cocoa Subindex Total Return (SM) ETN - NIB The fund seeks to track the price of cocoa by holding a cocoa futures contracts with varying maturities. The growing wealth in emerging countries causes the demand of chocolate and hence cocoa to go up. In addition to this, there is also an increase in demand coming from the more health-conscious consumers. Namely, dark chocolate has a lot of health benefits and tastes relatively better than other healthier products. Furthermore, as global warming trends go up trees are damaged, this results in a decrease in the supply of cocoa. This overall increase in demand and decrease in supply should entail an increase in the price of NIB. However, the direction of NIB is not only affected by the above-mentioned reasons: Brexit is another one. London is a hub of international cocoa trading; thus cocoa is traded in pounds. A weak pound would mean that the price of cocoa goes up. VanEck Vectors Semiconductor ETF - SMH
The investment seeks to replicate as closely as possible, before fees and expenses, the price and yield performance of the MVIS® US Listed Semiconductor 25 Index. The fund normally invests at least 80% of its total assets in securities that comprise the fund's benchmark index. The index includes common stocks and depositary receipts of U.S. exchange-listed companies in the semiconductor industry. Such companies may include medium-capitalization companies and foreign companies that are listed on a U.S. exchange. The fund is non-diversified.

34
This investment performed well throughout the holding period and was able to take advantage of several positive earnings reports from major semiconductor companies such as AMD. The high beta took advantage of the bull run in the recent months. This was the portfolio’s most profitable investment and returned 12.99% on the 96 shares that were bought at $126.69 and sold at $143.15. Vanguard Real Estate ETF- VNQ
It holds primarily REITs across all sectors (industrial, commercial, residential and specialized), real estate services and Real Estate Development. It seeks to produce a yield as close to the MSCI US IMI Real Estate 25/50 Index. Most of its holdings, REITs, are tax advantaged when paying out 90% of profit to its shareholders. Shareholders are taxed at income tax for this yield. This was chosen during the earliest period, the bearish portion, as the economy seemed to be heading towards a contraction as the Federal Reserve had just lowered interest rates the day before and there was much trade war uncertainty. 215 shares were bought for $93.44 a share on the 20th of September. Initially throughout most of the bearish period, it performed well peaking on the 21st of October as at a closing of $95.25. This was nearing the end of the uncertainty in market and when it surged up. VNQ also benefited from the reduction in interest rates as much of real estate is bought using debt and mortgages which have lower interest rates. This quickly lost its momentum and bottomed out as the market grew as the Fed would keep interest rates stable and many of the primary U.S real estate trusts are extremely overpriced. This negative sentiment continued until the managers eventually sold the holdings, 100 shares on the 22nd of November for $91.69 and liquidated the rest on the 13th of December for $90.43. This is an effective loss of 2.65%. This was a good pick while the markets were uncertain, and people were looking for yield, but as economic outlooks became positive again it fell off due to interest rate stabilization and high valuation. This should have been liquidated earlier. iShares JPMorgan USD Emerging Markets Bond ETF - EMB
It focuses on sovereign debt from emerging economies by trying to replicate The JPMorgan EMBI Global Core Index. This is a higher risk bond holding as these are back by non-developed countries that have a higher yield than traditional bond ETFs. This performed better than the bond benchmark, BND, over the holding period, from the 3rd of October to the 20th of October yielding 37 basis points compared to the -80 bps that BND earned over the period. This shift of 117 basis points was good to the gains from bonds, but the portfolio suffered from an over allocation of bonds throughout the bullish period. The reasoning to enter this position was that investors were looking for yield as interest rates dropped and the world economy seems stable. It did its job to outperform the benchmark but couldn’t overcome asset allocation Vanguard FTSE Europe- VGK
The fund follows the FTSE Developed Europe All Cap Index, which is just a market weighting of all stocks listed across developed Europe. This has a heavy focus on traditional sectors of financials and industrials. It holds names like HSBC, Novartis, SA, and Nestle. Year to date VGK underperformed VTI by 7.5% returning 22.72% while the latter returned 30.48%. This is in line with historical data that other developed markets outside the US underperform it year on year. It was added to the portfolio surrounding the Brexit deal being accepted by the EU Council

35
on the 17th of October and the vote soon after. The managers waited to buy until after the election was announced. 184 shares were bought at $55.29 and were liquidated on the last active day of the semester on the 20th of December for $58.30. This yielded a 5.44% return which was 1.99% lower than the benchmark over the same period. The funds support of international developed markets continued into the dormant period with VXUS. iShares iBoxx Dollar Investment Grade Corporate Bond- LQD
The fund invests in investment grade corporate debt. These firms are well cemented in the market with debt coming from firms such as CVS, Goldman Sachs and Anhesuer-Busch. These have a higher yield than government issued debt but have more risk associated as there is a higher chance of default by a private institution. The strategy that was trying to be enacted would be growth during a strong earnings season as the perceived risk of the debt would decrease and the yield would be higher. This is spoken of in the missed opportunities as it would have generated active return compared to bond benchmark.
*Never in portfolio
Vanguard Utilities ETF - VPU Seeks to track the performance of a benchmark index that measures the investment return of stocks in the utilities sector. VPU is a passively managed ETF, using a full-replication strategy when possible and a sampling strategy if regulatory constraints dictate. Includes stocks of companies that distribute electricity, water, or gas, or that operate as independent power producers. The utilities sector acts as a defense strategy during a bearish decline. When the markets began to decline, it provided a safety net for the fund. It has a 23.7% return year to date, however it underperformed VTI and SPY by approximately 5%. It was added to the portfolio on 27th September and liquidated on 7th November. This yielded a return of 3.4% which underperformed the benchmark. It resulted in a lot of the decline in the portfolio’s performance against the benchmark. Health Care Select Sector SPDR Fund - XLV The Fund seeks to provide investment results that, before expenses, correspond generally to the price and yield performance of the Health Care Select Sector Index. Under normal market conditions, the fund generally invests substantially all, but at least 95%, of its total assets in the securities comprising the Index. The utilities sector ETF (VPU) was liquidated in favor of XLV. XLV proved to be a better alternative as it provided a positive return both during bullish and bearish market periods. The fund also liquidated parts of Real estate ETF (VNQ) in favor of XLV. XLV has a 20.54% return year to date, underperforming both VTI and SPY by approximately 8%. The ETF was added to the portfolio on 8th November and liquidated on the last day of class (20th December). The return for XLV over that period was 8%. It outperformed the benchmark over the same period by 4.2%.

36
ProShares Short S&P500 - SH The investment seeks daily investment results that correspond to the inverse (-1x) of the daily performance of the S&P 500® Index. The index is a measure of large-cap U.S. stock market performance. This was pitched to hedge the portfolio during a perceived market downturn. Although it was motioned, it never passed the vote due to positive market developments such as jobs and manufacturing reports. *Never in portfolio iShares 20+ Year Treasury Bond ETF - TLT
This fund seeks to track the investment results of an index that has exposure to long-term US
Treasury bonds with maturities greater than 20 years. TLT offers a 18.05 yr duration, a 4.12
convexity and a 2.33% average yield to maturity as of December 20th, 2019. TLT allows investors to
invest in US government bonds with a tax efficient method. This fund is held to add protection to your
investment portfolio with high quality, AAA securities that add diversification. These specific bonds
in the fund can provide a hedging strategy against risk-off periods. Although the fund’s strategy is a
good outlook, it was an incorrect time to hold this fund in the portfolio. With bonds underperforming
equities and rates rising slightly, fund managers took the right decision in not including this ETF in
the fund.
*Never in portfolio
Consumer Staples Select Sector SPDR Fund - XLP
XLP tracks a market-cap-weighted index of consumer-staples stocks drawn from the S&P 500. The
fund’s holdings are nearly all large-cap corporations. Over the course of the semester, XLP yielded
7.2%, underperforming both SPY and VTI. XLP allows investors to prevent major underperformance
during bearish markets, because it has holdings in companies that sell basic needs such as food,
drinks, and utensils. Consumers are less likely to forgo these types of goods even during recessions.
Some noteworthy corporations held by XLP are Procter & Gamble Company, Coca-Cola Company, and
PepsiCo Inc.
*Never in portfolio
iShares Global Clean Energy ETF - ICLN
ICLN tracks a market-cap-weighted index of thirty of the most liquid companies involved in the clean
energy sector. It holds companies that are a part of the biofuels, ethanol, geothermal, hydroelectric,
solar, and wind industries. Over the course of the semester, ICLN yielded 3.3%. Although overall VTI
outperformed ICLN, ICLN outperformed VTI by 260 basis points during the bullish period. ICLN is a
good investment during bullish periods, because it holds small-cap corporations, which tend to grow
more than large-cap corporations during times of economic growth.

37
*Never in portfolio
WisdomTree U.S High Dividend Fund - DHS
This ETF tracks the WisdomTree U.S. High Dividend Index where it yields a monthly return based
on dividends. The focus behind this pitch was to continue the yield of dividend reinvestment for a
long-term strategy in the fund. ETFs tend to return good return on dividends and dividend
reinvestment outperforms the market with less risk than chasing price appreciation. However, it
turns out the fund is not able to set up fractional shares for dividend reinvestment back into the
fund. That’s a main reason why this ETF was never put into our portfolio.
*Never in portfolio
iPath Series B S&P 500 VIX Short Term Futures ETN - VXX
This ETN attempts to track the VIX through the daily percentage returns of near term VIX futures.
This is an ETN that the managers needed to have available for purchase as it allowed them to
outperform the benchmark by a big margin in case of a market downfall. However, as they found out,
it is very difficult to predict the market accurately and the enormous volatility of VXX makes it a big
risk to take on. This risk is shown in its performance after it was pitched on 10/31/2019 until the
end of the semester (12/20/2019). VXX went down by -20.3% compared to VTI that went up by 5.4%
and its individual asset class special situations benchmark, QMN, that went up by 1.1%. Nevertheless,
VXX did have a big peak within this period, from 11/27 to 12/03, where it increased by 17.4%,
compared to VTI (-2.3%) and QMN (7.4%).
*Never in portfolio