fall 08 jambi city waste-to-energy baseline survey city waste-to... · 1 map of jambi city ......
TRANSCRIPT
Member of Indonesia Solid Waste Association
Jambi City Waste-to-Energy Baseline Survey
08 Fall
G e d u n g I S P l a z a , 5
t h F l o o r – R o o m 5 0 4
J L P r a m u k a R a y a K a v 1 5 0 , J a k a r t a T i m u r 1 3 1 2 0 T : + 6 2 2 1 2 9 6 1 3 9 3 3 F : + 6 2 2 1 2 9 6 1 3 9 8 1 s w i @ s w - i n d o . c o m , w w w . s w - i n d o . c o m
Dini Trisyanti Director
Hp : 0817867032 Email : [email protected] Website : sustainablewaste.co.id
Office : Jl. Angkasa I No: 7 Halim Perdana Kusuma Jakarta-Timur 13610

Table of Contents
List of Abbreviation ............................................................................... i
Introduction ......................................................................................... ii
Part I – Context and Background .......................................................... 1
1. Overview of Municipal Solid Waste Practices in Jambi .......................................... 1
1.1 City Profile ........................................................................................................ 1
1.2 Municipal Solid Waste Collection Methods .................................................... 4
1.3 Formal Waste Collection: Organization and Structure .................................... 6
1.4 Waste Collection Tools .................................................................................... 8
1.5 Waste Treatment Facility ............................................................................... 10
1.6 Existing Waste Separation Practices and 3R Initiatives ................................. 14
1.7 Disposal and its Characteristics ..................................................................... 16
1.8 Institutional Capacity and Key Policies, Laws and Regulation at the city on Solid Waste Management ............................................................................. 17
1.9 Informal Sectors and their Involvement in MSW System ............................. 20
Part II – Empirical survey to support the development of
the waste-to-energy pilot ..................................................... 21
2. Identification of the proposed locations of organic waste source and waste-to energy plant in the city ....................................................................................... 21
3. Marketing of biogas and assessment of indicators for financial-economic
analysis .................................................................................................................. 31
4. Identification of waste characteristics at the shortlisted site .............................. 36
Recommendation
List of References
ANNEXES

i
List of Abbreviation
APBD = Regional Government Budget
BLH = Environmental Agency
BPS = Statistics Indonesia
CBO = Community Based Organization
DISPENDA = Local Revenue Agency
DKPP = Sanitation, Landscaping, and Cemetery Agency
Ha = Hectare
km = Kilometer
Lt = Liter
m = Meter
RT = Household Association
TPA = Final Disposal Site
TPS = Temporary Collection Point
TPS 3R = Material Recovery Facility
TPST 3R = Integrated Material Recovery Facility
UCLG ASPAC = United Cities and Local Government Asia Pacific
UN ESCAP = United Nations of Economic and Social Commission for Asia and the Pacific
UPTD = Local Technical Implementation Unit

ii
Introduction
This Baseline Survey Report is made upon the request of the United Cities and Local Government Asia Pacific (UCLG ASPAC), the United Nations of Economic and Social Commission for Asia and the Pacific (UN ESCAP), and Waste Concern. The aim of this report is two-fold: (i) to identify possible locations for a waste-to-energy pilot plant in Indonesia; (ii) and to analyze the characteristics of the shortlisted locations in order to determine the most suitable location. In November 2014, UN ESCAP and UCLG ASPAC organized a national workshop in Jakarta “Pro-Poor and Sustainable Solid Waste Management in Secondary Cities and Small Towns: Prospects for the application of anaerobic digestion to treat municipal solid waste in Indonesia.” As an outcome of this workshop, four of the cities among those attending the workshop were selected as the shortlisted candidates to host the waste-to-energy pilot. The selected cities were: (1) Jambi City; (2) Malang City; (3) Malang Regency; and (4) Probolinggo City. This report pertains to the baseline assessment of Jambi City, while separate reports have been prepared for the three other cities. This baseline survey was conducted by Sustainable Waste Indonesia (SWI) from the beginning of February until the end of May 2015. Two field visits were conducted to Jambi City. The first field visit was conducted on 10 and 11 February 2015, and a second field visit was conducted from 19 to 30 March 2015. In between these two visits, a fact-finding mission by representatives from UN ESCAP, UCLG ASPAC, and Waste Concern was conducted on 3 and 4 March 2015. During the fact-finding mission, a representative from SWI joined the delegation, and together the delegation shortlisted the possible locations for the waste-to-energy project. It should be noted at the outset that all potential locations surveyed have been proposed by the local government authorities of Jambi City. Among these, the most feasible location has been further analyzed in order to understand key aspects such as the characteristics of the incoming waste, possible end users of the energy generated, and the processing capacity of the plant. In this context, the baseline survey was conducted in two phases as follows: Phase One: An assessment was conducted to the proposed plant locations in order to select the most feasible site for hosting the waste-to-energy pilot. During this phase, the proposed locations were characterized with some level of detail. Phase Two: A detailed survey was conducted to further analyze the suitability of the shortlisted location. Aspects analyzed included the waste generation rates, the physical and chemical characteristics of the waste, the density of the waste, and the potential demand of the energy generated by the plant. During this phase, waste sampling was conducted and questionnaires were prepared.

iii
The fact-finding mission to Jambi City by ESCAP, UCLG-ASPAC and Waste Concern was conducted after the completion of Phase 1. During that mission, one of the proposed locations was shortlisted and subsequently analyzed in Phase Two of the study. The structure of this report is as follows: Part One consists of an overview of municipal solid waste practices in the city of Jambi. The aspects described include the local authority’s budget for waste management, municipal waste collection methods, formal collection system in the city, system for transfer and transport of waste, waste treatment methods, institutional capacity and key policies, practices for waste segregation, disposal sites and its main characteristics, and the activities of the informal sector. Part Two consists characterizes the proposed locations for hosting the project in Jambi. Among these, the shortlisted location is analyzed in further detail. Th report concludes with a set of recommendations. Part One mostly consists of secondary data, whereas Part Two combines primary and secondary data. The primary data was collected during the field visit by SWI team. The structure of this report followed the guidelines provided by UN ESCAP, Waste Concern and UCLG.

1
Part I – Context and Background
1. Municipal Solid Waste Practices in Jambi City
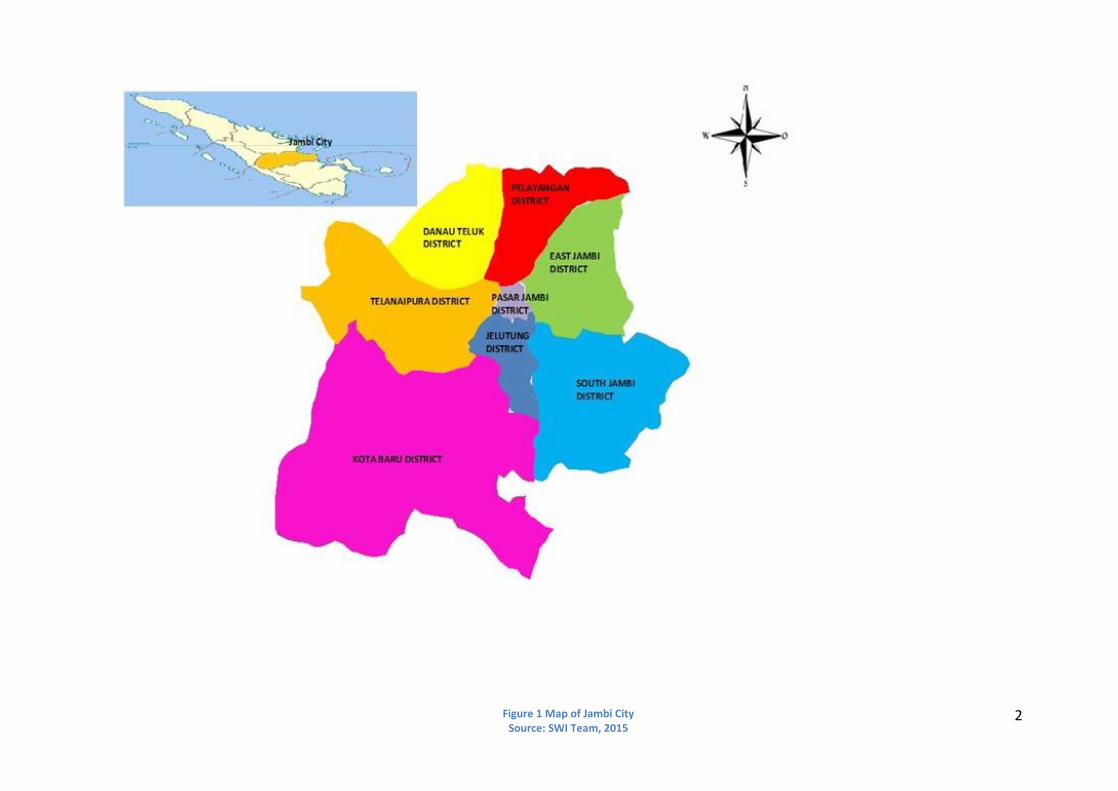
1.1 City Profile Jambi City, the capital city of Jambi Province, has an area of 205.40 km2, with a total population of 681,616 inhabitants (Adipura Book, 2014). The city comprises of 9 districts, with the density ranging between 865 person/km2 at the lowest, in Danau Teluk District, to 7,979 person/km2 at the highest in Lelutung District. The city is borders the surrounding Muaro Jambi Regency (Figure 1). Areas of Jambi City, especially the area near the Batanghari River, are located in lowlands. These areas are the most exposed area to floods, which can result in water levels 2m above ground level. In response to the risk of flooding, many inhabitants have built their house on stilts. The economy of Jambi City is dominated by the trading sector, followed by the restaurants and hotel industry, treatment industries, logistics, communications and services. Other industries that contribute to Jambi City’s economy include the building, electricity, gas, drinking water, finance, agriculture and mining industries. Based on the BPS 2013 data, the main sources of employment are in the wholesale and retail trade, restaurants and hotels (32%) and in community, social and personal services (33%). The waste generation of Jambi City is 362.5 tons of waste per day, with an average waste generation per capital of 0.53 kg/cap/day. Generally, the waste management system applies a conventional method which relies on the collection, transportation and disposal of waste. On the other hand, the introduction of waste treatment facilities as well participatory initiatives at community level have recently started to develop in the city. A summary of the main characteristics of the city is provided in the table below: Table 1 City Profile (Sources: Adipura Book (2013-2014) and SWI Team (2015)
No Information Data
1 Population 681,616 inhabitants
2 Area 205.40 km2
3 Daily waste generation 362.5 tons/day
4 Waste generation rate 0.53 kg/cap/day
5 Waste collection rate (waste transported to the landfill)
72.41%
6 Institution responsible for waste management Sanitation, Landscaping, and Cemetery
Agency
7 Coverage area of waste management services 100%
8 Final Disposal site Talang Gulo (15 km from the city centre)
apply the semi-controlled system
2
Figure 1 Map of Jambi City Source: SWI Team, 2015

3
Local Authority’s Budget Allocation for Waste Management
In Jambi City, the two key local authorities involved in the management of waste related activities are the Environmental Agency or Badan Lingkungan Hidup (BLH) and the City Cleansing Agency (Sanitation, Landscaping, and Cemetery Agency) or Dinas Kebersihan, Pertamanan dan Pemakaman (DKPP). As occurs in other provinces in Indonesia, all budget allocation plans (expenditures and revenues) are out in the Anggaran Pendapatan Belanja Daerah (APBD), the Regional Government Budget. One of the items in APBD is the direct expenditure for waste management development programs. These programs include workshops for the development of waste management policies; the procurement for tools and equipment for waste handling; the development of waste management technologies; the improvement of community involvement programs; operational improvement and maintenance of supporting tools and equipment; and operational improvement and maintenance of the landfill site. The total local authority budget allocation for waste management includes salaries for permanent and contractual-based employees, expenditures for services and products (this includes computer services, operational and maintenance of the vehicles, business trips, administrative costs), and expenditures for capital/investment such as tools and buildings. In 2013, the total budget for waste management at the local authority reached 1.05 percent, equivalent to 12,108,992,400 IDR. From the total regional expenditure in 2013, the allocated amount was worth 1,151,565,666,248.19 IDR. The amount of 155,547,600 IDR was allocated for BLH and 11,953,374,800 IDR was allocated for DKPP. The city projection for direct expenditure in the year 2015 is of 33,103,840,804 IDR. Please refer to Table 2 for further details on this.
Table 2 Local Authority's Budget Allocation for Waste Management in Jambi City
No Institution
Budget Allocation For Waste Management Program
Proportion to Regional Expenditure
2013 (IDR)
1 Environmental Agency 155.547.600,00
1,05 % 2
City Cleansing Agency (Sanitation, Landscaping, and Cemetery Agency)
11.953.374.800,00
Total Expenditure 12.108.992.400,00
Total Regional Expenditure 1.151.565.666.248,19
4
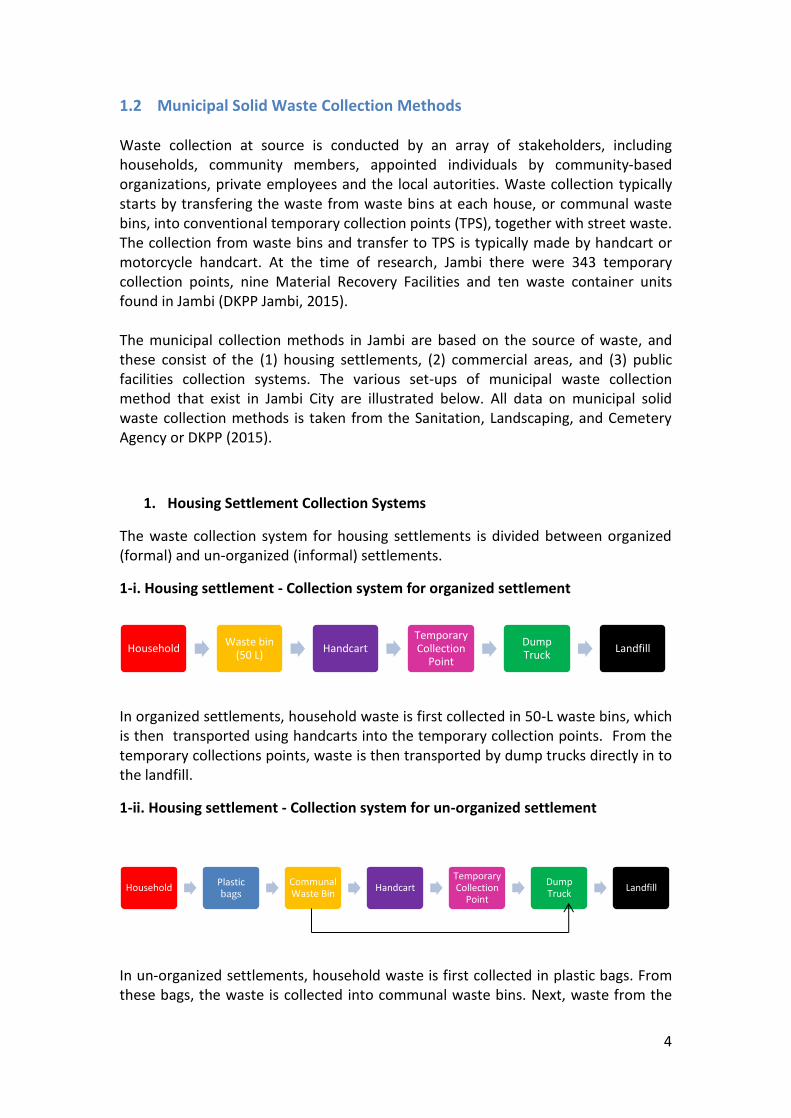
1.2 Municipal Solid Waste Collection Methods Waste collection at source is conducted by an array of stakeholders, including households, community members, appointed individuals by community-based organizations, private employees and the local autorities. Waste collection typically starts by transfering the waste from waste bins at each house, or communal waste bins, into conventional temporary collection points (TPS), together with street waste. The collection from waste bins and transfer to TPS is typically made by handcart or motorcycle handcart. At the time of research, Jambi there were 343 temporary collection points, nine Material Recovery Facilities and ten waste container units found in Jambi (DKPP Jambi, 2015). The municipal collection methods in Jambi are based on the source of waste, and these consist of the (1) housing settlements, (2) commercial areas, and (3) public facilities collection systems. The various set-ups of municipal waste collection method that exist in Jambi City are illustrated below. All data on municipal solid waste collection methods is taken from the Sanitation, Landscaping, and Cemetery Agency or DKPP (2015).
1. Housing Settlement Collection Systems
The waste collection system for housing settlements is divided between organized (formal) and un-organized (informal) settlements.
1-i. Housing settlement - Collection system for organized settlement
In organized settlements, household waste is first collected in 50-L waste bins, which is then transported using handcarts into the temporary collection points. From the temporary collections points, waste is then transported by dump trucks directly in to the landfill.
1-ii. Housing settlement - Collection system for un-organized settlement
In un-organized settlements, household waste is first collected in plastic bags. From these bags, the waste is collected into communal waste bins. Next, waste from the
Household Waste bin
(50 L) Handcart
Temporary Collection
Point
Dump Truck
Landfill
Household Plastic bags
Communal Waste Bin
Handcart Temporary Collection
Point
Dump Truck
Landfill

5
communal waste bins is either transported using handcart into temporary collection points before being transported using dump truck to the city landfill. Or, alternatively, the waste in the communal waste bins is transported directly to the landfill using dump trucks without being transferred to temporary collection points.
2. Commercial Municipal Areas
The set-up for waste collection in commercial areas is split between markets and business stores.
2i. Commercial Areas – Markets
Waste from markets is collected in plastic bags, and then brought to communal waste bins using wheelbarrows. From the communal waste bins, the waste is transported to the landfill using dump trucks.
2ii. Commercial Areas - Business Stores
There are two methods of waste collection for commercial business establishments. In the first method, waste is collected in 50 or 70-L waste bins and then transported to dump trucks using handcarts.. The dump trucks then transport the waste to the landfill. In the second method, the waste is brought from the commercial businesses directly to the dump truck. Then the dump truck will bring the waste in o the landfill.
3. Public Facilities
In the third set-up, the municipal solid waste collection method is addressed to public facilities. These include office buildings, streets and other public places.
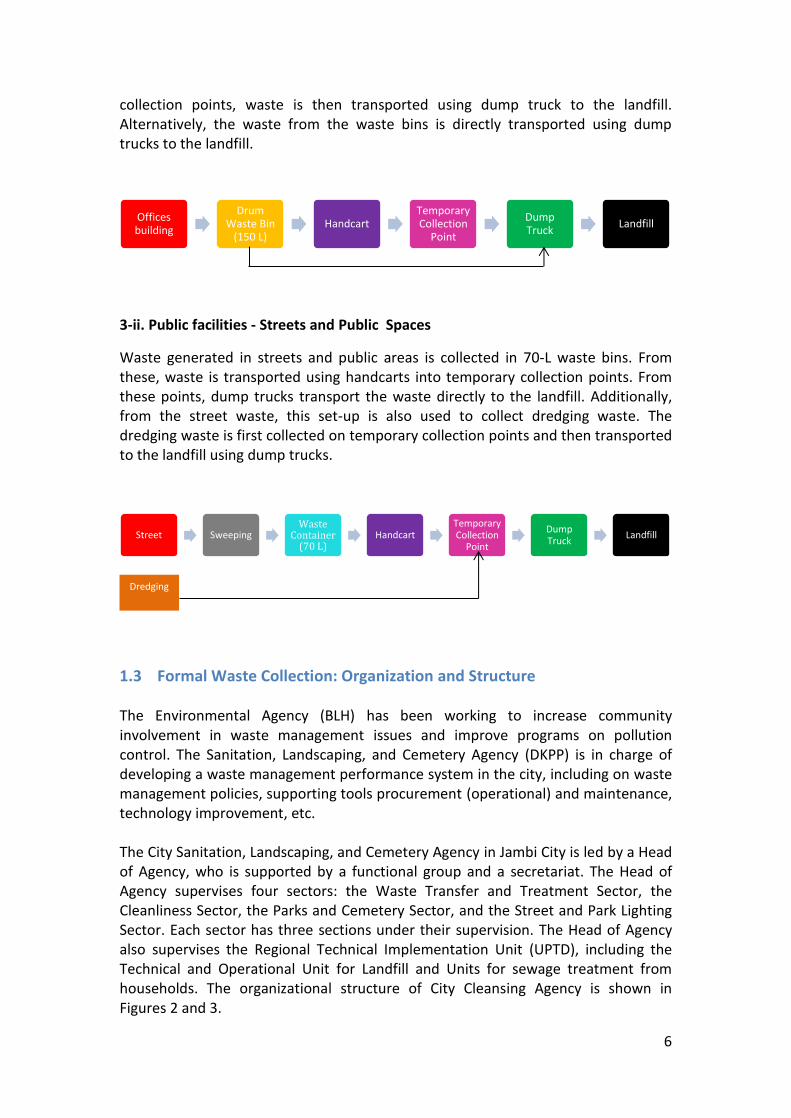
3i. Public Facilities - Office Buildings
The waste originating from office buildings is collected in 150-L waste bins of, which is then transported by handcarts to temporary collection points. From the temporary
Market Plastic bags Communal Waste Bins
Dump Truck Landfill
Stores Waste Bins (50 / 70 L)
Handcart Dump Truck Landfill
6
collection points, waste is then transported using dump truck to the landfill. Alternatively, the waste from the waste bins is directly transported using dump trucks to the landfill.
3-ii. Public facilities - Streets and Public Spaces
Waste generated in streets and public areas is collected in 70-L waste bins. From these, waste is transported using handcarts into temporary collection points. From these points, dump trucks transport the waste directly to the landfill. Additionally, from the street waste, this set-up is also used to collect dredging waste. The dredging waste is first collected on temporary collection points and then transported to the landfill using dump trucks.
1.3 Formal Waste Collection: Organization and Structure The Environmental Agency (BLH) has been working to increase community involvement in waste management issues and improve programs on pollution control. The Sanitation, Landscaping, and Cemetery Agency (DKPP) is in charge of developing a waste management performance system in the city, including on waste management policies, supporting tools procurement (operational) and maintenance, technology improvement, etc. The City Sanitation, Landscaping, and Cemetery Agency in Jambi City is led by a Head of Agency, who is supported by a functional group and a secretariat. The Head of Agency supervises four sectors: the Waste Transfer and Treatment Sector, the Cleanliness Sector, the Parks and Cemetery Sector, and the Street and Park Lighting Sector. Each sector has three sections under their supervision. The Head of Agency also supervises the Regional Technical Implementation Unit (UPTD), including the Technical and Operational Unit for Landfill and Units for sewage treatment from households. The organizational structure of City Cleansing Agency is shown in Figures 2 and 3.
Offices building
Drum Waste Bin
(150 L) Handcart
Temporary Collection
Point
Dump Truck
Landfill
Street Sweeping Waste
Container (70 L)
Handcart Temporary Collection
Point
Dump Truck
Landfill
Dredging

7
In addition to the above, in Jambi City the team of Market Agency (or Dinas Pasar) also contributes to the waste management system. The Market Agency reports to the Local Government of Jambi City. The Secretariat, Functional Group, and several boards support this agency, including the Local Technical Implementation Unit (UPTD). Please refer to Figure 3 for details.
Figure 2 The Organizational Structure of the City Sanitation, Landscaping, and Cemetery Agency of Jambi
Figure 3 The Organizational structure of Market Agency in Jambi City

8
1.4 Waste Collection Tools and Equipment
From 2009 onwards, the Sanitation, Landscaping, and Cemetery Agency has been the lead agency responsible for the waste collection in Jambi. Forty-one dump trucks with the capacity of 6m3 and three units of armroll trucks with the capacity of 4m3 support the collection activities in the city. For the collection of waste at source, conventional handcarts are typically used for this activity (see Table 3 for details).
Table 3 Lists of Waste Collection Supporting Tools
Tools Unit Capacity (m3) Trip (daily) Functioning Not-functioning
Conventional Handcart 380 1 2 209 171
Motorcycle Handcart 28 1,5 3 27 1
Dump Truck 41 5-6 3 41 0
Arm Roll 3 3-4 5 3 0 Source: Adipura Book, 2013-2014
Based on the capacity and the number of trips of the waste collection supporting equipment, the total daily waste collection capacity in Jambi city reaches 468.13 tons per day. The daily waste generation in Jambi is 362.5 tons per day with the waste generation rates of 0.53 kg per capita per day. The amount of waste that goes to the landfill is 262.5 tons per day. The remainer of the daily waste generated in Jambi, around 100 tons per day, could not be tracked. It is unknown whether this unaccounted for waste goes to waste banks, composting facilities, or if it discharged freely to the environment.
The efficiency of waste collection services in Jambi - calculated from comparing the waste transported to the landfill with the daily waste generation in the city – is said to be 72.41 percent. Nevertheless, this does not reflect the collection rate directly, as not all the waste collected is transported to the landfill. Some of the waste generated is also transported to the waste treatment facilities but complete information regarding the flow of waste in Jambi City is not available. Additionally, waste management services still rely on the collection of waste to the landfill without any prior treatment.
On the other hand, the waste collection efficiency in the city is considerably high since the total daily waste collection capacity is higher than the daily waste generation. As a result, the existing waste collection equipment is sufficient to collect the waste generated in the city. Although the collection efficiency is considerably high, it could not be ensured that all the waste generated in the city has been collected since the waste flow in the city could not be identified.
The collection activities differs from source to the temporary collection point. This activity involves four conventional temporary collection points (TPS) and two transfer points (depo) in the city. Below is the map showing the location of temporary collection points, transfer station, landfill, and traditional market in Jambi City.

9
Legend of the map above is presented below:
Symbol Information
1 Temporary Collection Point Perumnas Aur Duri
2 Transfer Station TAC Market
3 Temporary Collection Point Cempaka Putih
4 Transfer Station Yusuf Nasri
5 Temporary Collection Point Kota Baru
A Olak Kemang Market
B Pelayangan Market
C Kasang Market
D Angso Duo Market
E Dalam Kota Market
F Fruits Market
G Talang Banjar Market
H Kebun Handil Market
I TAC Market
Figure 4 Map locations of the potential organic waste sources and facilities related to waste management and in Jambi

10
The role of conventional temporary collection points in Jambi City is mainly for storing the waste before it is transported to the landfill. The local government does not encourage the community to conduct waste separation at the source or the facility, which results in the generation of mixed waste. The main challenge of such facilities is how to encourage the community to make use and extract concrete benefits from the facility.
1.5 Waste Treatment Facilities
Characterization of Waste Banks in Jambi City According to the Adipura Book (2013-2014), there are 30 waste banks in Jambi City. However, this report only provides an overview of the five most active waste banks, which are all located in the Kota Baru District. The number of customers served by each waste bank ranges from below 50 to more than 100 customers. Based on the data from the Sanitation, Landscaping, and Cemetery Agency (2015), each of the waste banks collects an average of approximately 0.3 ton per month of recyclables. This brings incoming revenue of around 0.8 to 10 million IDR per month. In Jambi City, the total amount of recyclables collected in the waste bank reaches around 10.05 ton per month, or 0.34 ton per day. Information about the waste mass balance and the details of recyclables collected at the waste bank are not available. These figures are considerably low and appear to not significantly reduce the waste that is transported to the landfill site. In brief, the percentage of recyclables reduction through waste banks in the city has only reached 0.09 percent from the total waste generated in Jambi City. Therefore, the recyclables in waste banks only reach less than 1 ton per month on average. This can be explained because waste banks in Jambi are still in a developing/initial stage of existence. Waste banks are still improving their services and struggling to optimize their operation. One of the recognized factors that limits optimum recycling is that waste banks operate only two to three times in a week. Nevertheless, there is a possibility for a significant reduction in the amount of recyclables disposed in landfills.
Waste banks are operated by community-based organizations and members play a role as workers of the waste bank. Each waste bank has its own costumer base of regular members. Anyone can be a member of a waste bank and many of these are housewives who voluntarily join the system. These members are typically the individuals who store their waste on the banks and play a role as a bank costumer. Subsequently, the waste bank will collect their waste and put a price on that based on the current market prices. They collect and measure the waste from the costumer-base and then sell the recovered waste materials to potential stakeholders, such as recycling industries.

11
Table 4 List of Waste Banks in Jambi City
Name of Plant Operational details
Bank Sampah Barokah Bersama Located in Simpang III Sipin sub-district, Kota Baru District.
Waste handled = 1.2 ton/month
Members = 125
Incoming revenue around 6 to 10 Mio IDR/month
Bank Sampah Makmur Jaya Located in Eka Jaya sub-district, Jambi Selatan District.
Waste handled = 0.45 ton/month
Members = 135
Incoming revenue around 1.95 Mio IDR/month
Bank Sampah Beringin Located in Beringin sub-district, Pasar District.
Waste handled = 0.3 ton/month
Members = 80
Incoming revenue around 0,75 Mio IDR/month
Bank Sampah Bangkitku Located in Paal Lima sub-district, Kota Baru District.
Waste handled = 0.3 ton/month
Members = 80
Incoming revenue around 0.8 Mio IDR/month
Bank Sampah Sinar Kenali Located in Kenali Asam Bawah, Kota Baru District.
Waste handled = 0.3 ton/month
Members = 88
Incoming revenue around 1.05 Mio IDR/month Source: Adipura Book 2013-2014
Characterization of Existing Composting Plants in 3R Facility In Jambi City, several composting plants can be found at the Reduce, Reuse and Recyle (3R) facilities. According to the Adipura Book (2014), there are nine composting plant at 3R facilities, with the average capacity of one ton per day. The typical method of composting found at 3R facilities in Jambi City the windrow composting method. At Jambi City’s main landfill - Talang Gulo Landfill - these include one unit of composting facilities with the capacity of one ton per day, and two units of waste separation facilities with the average capacity of half a ton per day. However, the waste separation facilities only separate the waste between organic and non-organic waste/recyclables, to be further utilized outside the facility while the residue is delivered to the landfill. There is no additional treatment applied at the waste separation facilities. It is estimated that the total waste treated at the composting facility in Jambi City is ten tons per day while the total waste separated at the waste separation facility to be further processed reached only one ton per day. From the collected data, it is concluded that the amount of the organic waste composted in Jambi City has not significantly reduced the amount of organic waste transported to the landfill. The percentage of organic waste reduction by composting activities in the city is only 2.76 percent of the total waste generated in Jambi City.

12
The table below presents an overview of the 3R facility’s composting plants which were visited during the site visit. The location of the waste management facilities in Jambi City is shown in Figure 5. Table 5 MRF Facilities (TPS 3R)
Name of Plant Operational details
3R Facility in Sinar Kenali Located in Asam Kenali Bawah Sub-districts, Kota Baru District
Facilities: composting area, sieving, crushing, shredding machines. biodigester capacity of 4.5 m
3 and 4.m
3, motorcycle handcarts, and pick-
up van.
Organizational structure: 1. Number of operator: 3 persons 2. Community-based organization: 4 persons
Area: 600 m2
Compost product: 250 kg/month
Compost users and usage: DKPP and for agricultural farming
Composting procedure: 1. Household waste as the input is separated and then shredded in the
facility; 2. The waste is then placed in to a fenced bin to start the closed-
fermentation process; 3. Homogenization using bio-activator EM4; 4. Process lasts for 5-6 days; 5. The compost is sieved.
3R Facility “Depo Kompos” The compost products is used by the local authorities and also by the community.
Facilities: screening, shredding machines, four composting units, reservoir (to collect liquid compost), waste separation area, one unit of conventional handcart capacity of 1m
3.
The waste separation is manually conducted and occurs at the composting facility or on-site (not directly at source).
Additive: bio activator EM4 mixed with rice, bamboo shoot (rebung), pineapple, which are stored for 5-6 days.
The operator uses odor indicator to ascertain whether the composting process is working properly.
Waste input (organic waste): 1. 215 – 300 kg/month of vegetable waste 2. 100 – 150 kg/month of additives
The mixing combination consists of organic waste (vegetable waste) and an additive applied in a proportion of 1:1. In this way 2.5 m
3 of
vegetable waste is added to 2.5 m3 of additive.
Source: SWI Team (February – March, 2015)

13
Figure 5 Map Location of Waste Treatment Facilities in Jambi City

14
3R Facilities Consist of Small-Scale Material Recovery Facility (MRF). The 3R facility in Sinar Kenali treats organic waste by composting and anaerobic digestion from leachate that is produced from the composting process. The 3R facility Depo Kompos treats both organic and inorganic waste, using a composting plant and a waste bank. At the time of the SWI filed visit to Depo Kompos, the waste bank facility was not active.
1.6 Existing Waste Separation Practices and 3R Initiatives There are several waste-separation initiatives at the community-level, which are promoted and supported by the local government authorities. Waste separation typically involves separating organic and non-organic waste. The compost produced from the organic waste is applied in the surrounding parks. Table 6 presents a list of initiatives conducted by the community at the housing settlement, office buildings, and schools.
Housing Settlement
Table 6: 3R Initiatives at the settlements
Name of the location Operational Detail Notes
Putri Mayang Residence, Mayang Mangurai Sub-district, Kotabaru District
Type of waste treatment Composting
Scale Housing Settlement
Technology Composter
Actors Community member
Utilization Settlement Park
Taman Adipura Residence, Paal V Sub-district, Kotabaru District
Type of waste treatment Composting
Scale Housing Settlement
Technology Composter
Actors Community member
Utilization Settlement Park
Camat Handil Jaya Resindence
Type of waste treatment Composting
Scale Housing Settlement
Technology Composter
Actors Community member
Utilization Settlement Park Source: Adipura Book 2013-2014
Organic waste treatment at the housing settlement level is typically initiated and conducted by the community members. The compost produced is used in parks or gardens in the areas surrounding the settlements. The composting process uses small-scale composter technology with a capacity of 60 to 120-L.
15
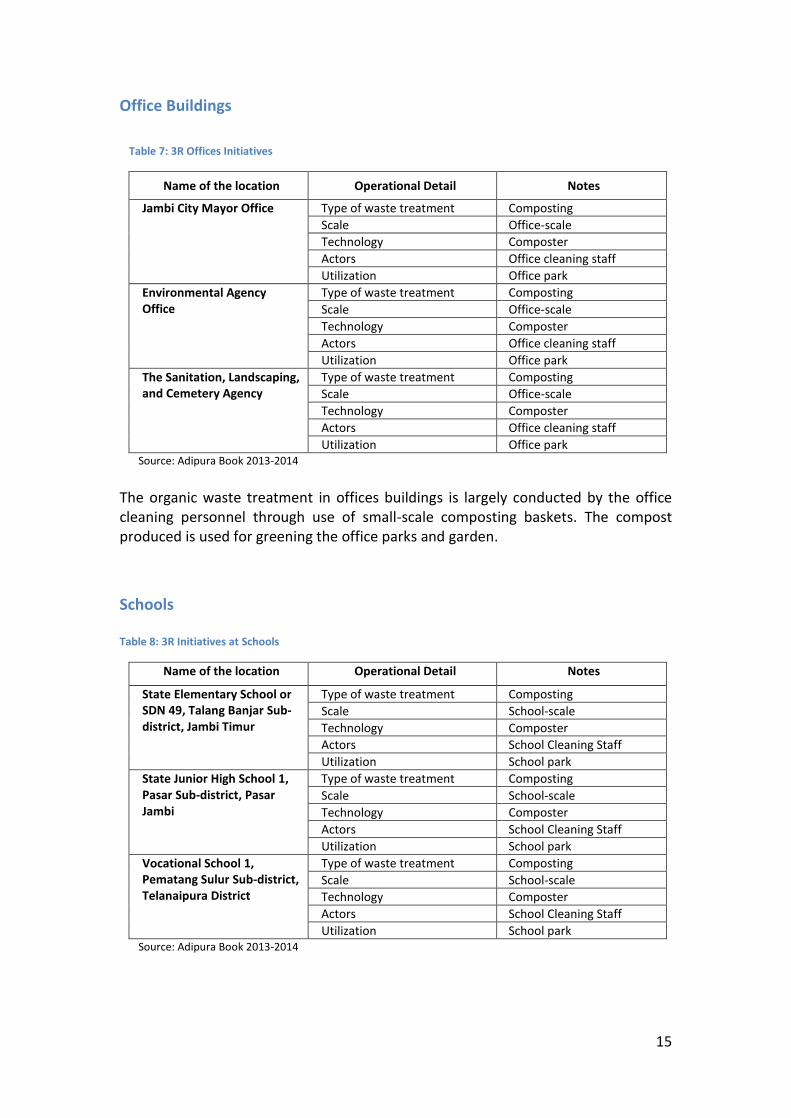
Office Buildings
Table 7: 3R Offices Initiatives
Name of the location Operational Detail Notes
Jambi City Mayor Office Type of waste treatment Composting
Scale Office-scale
Technology Composter
Actors Office cleaning staff
Utilization Office park
Environmental Agency Office
Type of waste treatment Composting
Scale Office-scale
Technology Composter
Actors Office cleaning staff
Utilization Office park
The Sanitation, Landscaping, and Cemetery Agency
Type of waste treatment Composting
Scale Office-scale
Technology Composter
Actors Office cleaning staff
Utilization Office park Source: Adipura Book 2013-2014
The organic waste treatment in offices buildings is largely conducted by the office cleaning personnel through use of small-scale composting baskets. The compost produced is used for greening the office parks and garden.
Schools
Table 8: 3R Initiatives at Schools
Name of the location Operational Detail Notes
State Elementary School or SDN 49, Talang Banjar Sub-district, Jambi Timur
Type of waste treatment Composting
Scale School-scale
Technology Composter
Actors School Cleaning Staff
Utilization School park
State Junior High School 1, Pasar Sub-district, Pasar Jambi
Type of waste treatment Composting
Scale School-scale
Technology Composter
Actors School Cleaning Staff
Utilization School park
Vocational School 1, Pematang Sulur Sub-district, Telanaipura District
Type of waste treatment Composting
Scale School-scale
Technology Composter
Actors School Cleaning Staff
Utilization School park Source: Adipura Book 2013-2014

16
Composting in schools is largely conducted by cleaning personnel, using small-scale composting baskets. The compost produced is used in school parks or gardens.
1.7 Landfill Disposal Characteristics
Jambi City disposes its municipal solid waste in the Talang Gulo Landfill, located approximately 15 km from the city center, in the Kenali Asam Bawah sub-district of Kotabaru. Talang Gulo Landfill is located approximately 1km from the nearest housing settlement and 2km from the nearest river. Talang Gulo Landfill is planned to be operated until 2018. After this time, the government plans to expand the landfill site. Talang Gulo Landfill is comprised of a combination of semi-controlled landfill and open dump areas. There are about 110 scavengers working on this landfill. The area of the landfill site is of 31.6 ha. Currently the total area used for the landfill is 10 ha, with depths of 12 to 20m. The landfill site is divided into four zones - two active and two are passive. One of the passive zones is already closed with landfill gas being recovered. At the time of the SWI team visited the landfill, the gas recovering facility was not working. For more detailed info about the Talang Gulo Landfill please refer to Table 9.
Table 9 Profile of Talang Gulo Landfill
No Parameter Information
1 Width 5 km
2 Length 1.3 km
3
Projected Landfill Area/ Existing Landfill Area: 31.6 ha/10 ha
a. Used area for landfill (December 2014) 8 ha
b. Available area for landfill 2 ha
c. Topography slides 0 - 15%
4 Soil type Combination Latosol and Brown
and grayish Litosol
5 Distance from the landfill to the river 2 km
6 Distance from the landfill to the nearest settlement
0.5 – 1 km
7 Distance to the Groundwater (depth) 6 km
8 Distance from the landfill to the city center 15 km
Source: DKPP Kota Jambi 2015

17
1.8 Institutional Capacity: Jambi City’s Key Solid Waste Management Policies, Laws and Regulations
At the national level, the main regulation that governs waste management in Indonesia is the Waste Management Act No.18, enacted by the National Government of Indonesia in 2008. Household waste management is also is governed by Government Regulation No. 81 which was launched in 2012. The Waste Management Act No.18 is intended to:
a. Lay out a legal framework binding local authorities to apply environmentally sound waste management practices at the legal, institutional, technical, operational, financial, social dimensions;
b. Establish a distribution of responsibilities in conducting waste management, starting from the ministry/government, provincial level, local authority, business sector, regional managers up to the community members;
c. Provide the fundamental background for implementing a waste management based on 3R approaches as an alternative to the old paradigm (collection-transport-disposal of waste);
d. Provide the fundamental background to encourage the business sector to be actively involved in the management of waste.
The key priorities of Waste Management Act No. 18 are:
a. Disposal of waste practices to evolve from open dumping to sanitary landfilling;
b. The implementation of Extended Producer Responsibility (EPR) by the business sector, as part of their contribution in improving the environmental quality and public health;
c. Introduce the practice of waste separation at source, including in settlements, industries, commercial establishments, etc.
The national-level waste management regulations are supported and implemented at the local level in Jambi city through several municipal regulations. The key local ordinance regulating the implementation of waste management in Jambi City is the Local Regulation Number 8/2013. This regulation consists of a general provision for managing waste in the city, which emphasizes waste minimization and the appropriate handling of waste. In addition, this regulation also establishes the scope and strategies of waste management in the city, including the financing of waste management, among other provisions. Local Regulation Number 8/2013 also sets out the roles (task, responsibility, rights, obligations, etc.) for waste management actors, including the local government, community, and business actors. Despite the local and national level waste management policies, specific policies related to 3R strategies, including waste separation and zero waste strategies, do not exist in Jambi City. An overview of local regulations related to waste management is presented in the table below.

18
Table 10 Institutional Capacity and Key Policies
No.
Title Legal Form Documents Number and Dates About
Key Information
1
Environmental Management (including water and air polution control) or Pengelolaan lingkungan hidup (termasuk pengendalian pencemaran udara dan air)
Local Regulation
Number 09/2005 (18
August 2005)
Legal permission for Companies and Industries.
Any individual or entity that runs business activities, companies and industries that cause interference with the environment are required to hold a permission from the city Mayor. The local government conducts the supervision and control of the business activities that potentially affect the environment. The retribution permission is measured based on the intensity of the disturbance and environmental impacts that might occur, including the number of people affected, the area of distribution of the impact, duration of the impact and intensity of the impact.
2 Waste Management or Pengelolaan sampah/kebersihan
1. Local Regulation Number 10/2008 (21
February 2008)
Formation of Board Organizations in Jambi Area
The agencies include the education agency, public health agency, social and labor agency, public works, spatial planning and housing agency, sanitation, landscaping and cemeteries agency, fire and rescue department. The Sanitation, Landscaping and Cemeteries agency encompasses a waste transfer and treatment section, a cleanliness section, a parks and cemetery section, and a street and park lighting section.
2. Local Regulation
Number 2/2012 (7 May 2012) Retribution for
Public Services (waste services)
1. Category of public service retributions: The user is charged for health services, waste management services, funeral services, parking services at the public road, and market services; 2. The waste services include waste collection from the source to the temporary collection point, waste transportation from the source and/or temporary collection point to the final disposal site/landfill, and provision of the location of final disposal/processing of waste. 3. Category and rates of waste retribution fee for waste services.
3. Local Regulation Number 3/2012 (7 May 2012) Retribution Services 1. The object of retribution is addressed to the services provided by the local governments in the utilization of public services, such as: land, buildings, public rooms, heavy equipment, other supporting facilities. 2. The category of tariff charged is determined by area, volume, the type and duration of use of the properties
4. Local Regulation Number 8/2013 (22 November 2013)
Waste Management or Pengelolaan Sampah
This regulation addresses the following features: 1. Developing and increasing the community awareness and culture awareness for waste management, 2. Developing research and technology in waste management

19
No.
Title Legal Form Documents Number and Dates About
Key Information
3. Encourage to be actively involved in waste minimization and waste handling 4. Implementing the appropriate waste management system and conduct the permission for waste management implementation, 5. Facilitate the i m p r o v e m e n t o f waste management 6. Encourage and facilitate the utilization of waste e n d products, 7. Facilitate the waste treatment technology at the local community level 8. Coordination among government institutions, community, business sector in order to perform the integrated waste management.
3. Management of Market
1. Local Regulation Number 6/2006 Management Market
1. The Local Government is authorized to regulate both, businesses and selling market, managed by local government and private. This includes: a. The arrangement of the shops, stores, kiosks and stalls, courtyard, and also in selling and/or constructing the market; b. Manage the parking lot, security, and cleanliness in the market area; c. Develop, construct and maintain the public facilities in the market. 2. Parking management and sanitation carried out by relevant agencies. 3. The market area is classified based on the comprehensiveness of the infrastructure, the number of stalls, the market location, and public facilities 4. Each market should meet the requirements of market standarization
2. Local Regulation Number 9/2006 Market Retribution 1. The object of retributions is addressed to the services provided in the utilization of market facilities which includes kiosk/stall, outdoors/yard, tables and umbrellas, public toilet, waste services, loading/unloading activities within the market. 2. The level of services, category, and tariff of retribution rates are determined by the category, size, and duration of use of each facility and the market as well. 3. The method in collecting the market retribution uses SKRD, or tickets, or other similar documents 4. The total retribution collected is then deposited to the Local Treasury Agency/Local Revenue Agency on a daily basis

20
1.9 Informal Waste Sector Involvement in the MSW System The involvement of the informal waste sector in the municipal solid waste system is defined by scavengers at the landfill and waste-pickers found throughout the city. A scavenger works to collect the waste at the landfill site and usually lives in the area surrounding the landfill area. Most of the scavengers are male, with 20-30 years old; however, female scavengers do exist. During the SWI visit no children scavengers were found. The income of scavengers is estimated to be or 100,000 to 170,000 IDR per full day. Waste-pickers are those who collect waste at the housing settlements, offices, or markets. There is no data available related to the operation of waste-pickers in the city but it is understood that these are rarely found in Jambi City. There are three waste collectors registered with the local authorities. These collectors bring the recyclable waste, such as plastic, metal, aluminum and paper, to the industrial waste recycling level. The number of recyclable materials in the city may reach three tons per day per waste collector. Despite the limited data on waste balances and activities of waste pickers, informal waste sector members are known to be actively involved in the waste-value chain, especially with regards to the handling of recyclable materials.

21
Part II – Empirical Survey to Support Development of The Waste-to-Energy Pilot
1. Organic Waste Source and Waste-to-Energy Plant
The identification and characterization of the organic waste sources and the potential location for waste-to-energy plant were conducted during the first phase of the baseline survey (see Introduction, p. ii).
A shortlist of the potential locations for the plant were proposed by the local authorities of Jambi based on the requirements outlined by UN ESCAP and UCLG ASPAC.
These requirements include that the land should be owned by the local government and be available to the project being a form of participation and contribution from the local authorities.The waste-to-energy plant will consists of an anaerobic digestion facility for treating the organic waste fraction of municipal solid waste. The envisaged characteristics are as follows:
a. Location of the plant: preferably located close to the source of organic waste generated;
b. Envisaged capacity of Anaerobic Digester: 2-5 ton per day of source-separated organic waste;
c. Area: 800 to 1,000 m2 of land; d. Proximity: Close to a source of demand for the energy generated by the
plant.
Based on these criteria, three locations have been proposed by the local government of Jambi. The sites proposed were then analyzed in detail by the SWI team, as outlined in the subsequent sections. An overview of these locations is provided in the table below:

22
Table 11: Proposed locations for organic waste source and waste-to-energy plant
No Parameter Location 1 Location 2 Location 3
Potential organic waste sources:
1 Potential Location Traditional Market - Angso Duo Slaughterhouse Traditional Market - Talang banjar
2 Estimated total waste collected (ton/day)
8 - 10 n/a 4
Estimated organic waste (ton/day) 4 - 6 0.6 - 0.8 (cow manure) 2.4
3 Other possibility of waste input (ton/day)
Fruit Market = 2.5 ton/day (organic waste)
No other waste input available No other waste input available
4 Availability large portion of meat and fish waste
Low portion (< 10%) No meat and fish waste available Waste composition data not available
5 Waste management: Combination of direct system/ collection of waste "stall to stall" (using human handcart) done by the market agency and communal collection system with 4 temporary waste collection point
Communal collection system to the on-site temporary collection point
Combination of direct system/ collection of waste "stall to stall" (using human handcart) done by the market agency and communal collection system
a. Waste collection
b. Waste transportation Dumptruck of 6 - 7 m3 Cow manure is not transported Dumptruck 6 - 7 m
3
c. Waste disposal Landfill without any further treatment The nearby community/citizens utilize the waste for composting, free of charged
Landfill without any further treatment
6 Waste condition (segregated or mixed) Mixed Separated (cow manure) Mixed
7 Energy consumed at the site
There are 2 kWh meter installed at the location: 1. Total monthly energy consumed
(16500 VA) = 2,288.00 kWh 2. Total monthly energy consumed
(900 VA) = 255.33 kWh
6 kWh/day Data not available
Energy consumed per stall (total stall 2688) = 215 Kwh/month (450 VA)
23
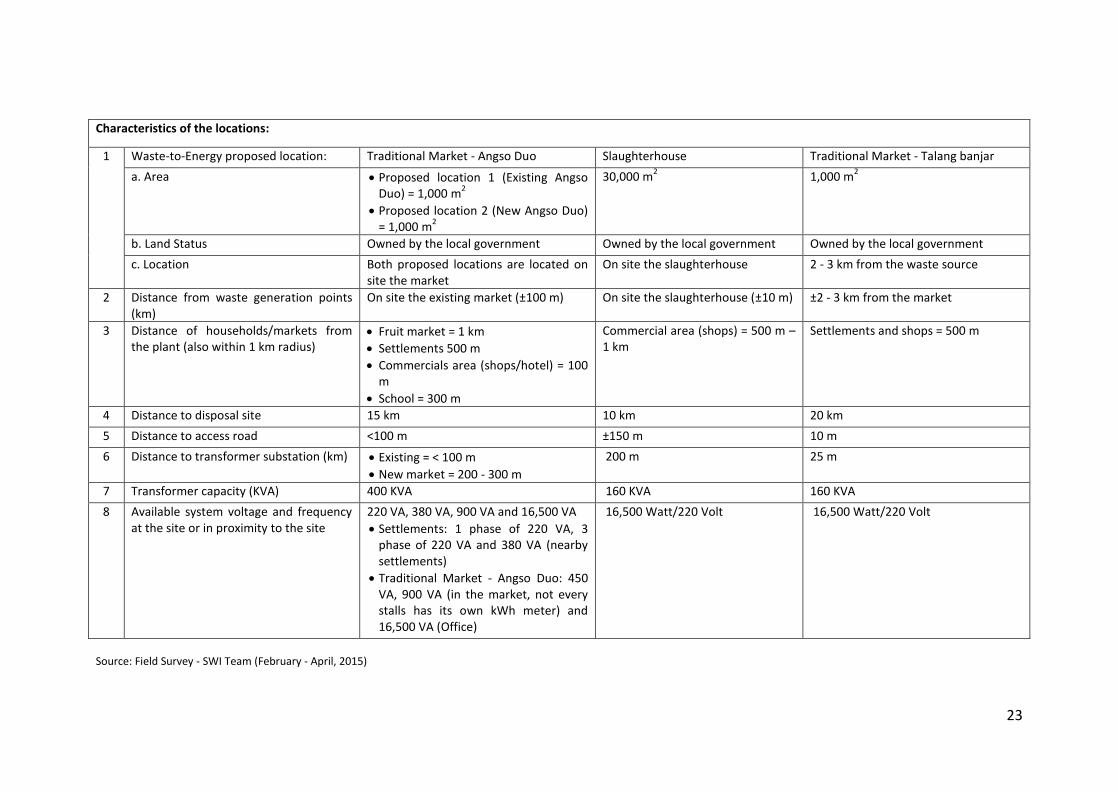
Characteristics of the locations:
1 Waste-to-Energy proposed location: Traditional Market - Angso Duo Slaughterhouse Traditional Market - Talang banjar
a. Area Proposed location 1 (Existing Angso Duo) = 1,000 m
2
Proposed location 2 (New Angso Duo) = 1,000 m
2
30,000 m2 1,000 m
2
b. Land Status Owned by the local government Owned by the local government Owned by the local government
c. Location Both proposed locations are located on site the market
On site the slaughterhouse 2 - 3 km from the waste source
2 Distance from waste generation points (km)
On site the existing market (±100 m) On site the slaughterhouse (±10 m) ±2 - 3 km from the market
3 Distance of households/markets from the plant (also within 1 km radius)
Fruit market = 1 km
Settlements 500 m
Commercials area (shops/hotel) = 100 m
School = 300 m
Commercial area (shops) = 500 m – 1 km
Settlements and shops = 500 m
4 Distance to disposal site 15 km 10 km 20 km
5 Distance to access road <100 m ±150 m 10 m
6 Distance to transformer substation (km) Existing = < 100 m
New market = 200 - 300 m
200 m 25 m
7 Transformer capacity (KVA) 400 KVA 160 KVA 160 KVA
8 Available system voltage and frequency at the site or in proximity to the site
220 VA, 380 VA, 900 VA and 16,500 VA
Settlements: 1 phase of 220 VA, 3 phase of 220 VA and 380 VA (nearby settlements)
Traditional Market - Angso Duo: 450 VA, 900 VA (in the market, not every stalls has its own kWh meter) and 16,500 VA (Office)
16,500 Watt/220 Volt 16,500 Watt/220 Volt
Source: Field Survey - SWI Team (February - April, 2015)

24
Figure 6: Locations of the Proposed Site as the Potential Waste Sources and Waste-to-Energy Plant Source: SWI Team, 2015

25
Location 1: Angso Duo – Traditional Market The first proposed location - Angso Duo – is the largest traditional Market in Jambi, located approximately 500 meters from the city center, with total the total area of 56,404 m2 (Market Agency, 2014). The total number of stall and vendor operators at the market is of approximately 3202 and consists of 2688 stalls and 514 street vendors. It operates daily, starting from 22.00 to 18.00 A range of goods are sold at the market, including vegetables, fruits, fish, meat, spices, groceries, clothing, etc. Based on the information from the Market Agency, the total waste generated at Angso Duo is of 8 – 10 ton per day with the organic waste generated approximately 4 to 6 ton per day. Waste separation at source is not practiced in Angso Duo. Complete data about the main types of waste generated at the market is not available. However, according to on-site observations, the main type of waste generated at Angso Duo is vegetable waste, while the portion of meat and fish waste generated is relatively low compared to the portion of vegetable waste, At Angso Duo, the waste collection system implemented is a combination of a stall-to-stall waste collection system – which is operated by the Market Agency under the supervision of the Sanitation, Landscaping, and Cemetery Agency – and a communal system practiced by some of the traders. The waste collected is gathered at the temporary waste collection point and is then transported to landfill by trucks with the capacity of 6 – 7 m3. The waste is then disposed of at the landfill without any further treatment. The transportation of waste by dump trucks usually conducted 2 – 3 times per day, depending on the waste generated from the market. The Market Agency owns and operates the fleet of ten dump trucks used for transporting the waste to from public markets across Jambi City.
Figure 7 Traditional Market Angso Duo

26
Energy Consumption
There are 2 kWh-meters that belong to Angso Duo. Most of the energy consumed at the market is used for lighting purposes. The energy consumed for cooking purposes is relatively low given there are only a small number of traditional food stalls. The energy consumed at the market office is mainly for lighting purposes.
At the time of research, plans were already under to relocate the existing market to a new site adjacent the existing location. In line with the local government’s aim to increase the green open spaces in the city, once the existing market is relocated, the old site will be converted into a green open space At the time of writing, construction of the new site for Angso Duo was underway, lead by the awarded contractor, PT. ERAGUNA BUMI NUSA. Construction is expected to be complete in October 2016. The construction company will also operate the market for 5 years. The local government plan to relocate the loading activities to a new location in 2016, in order to decrease the crowd and heavy traffic at Angso Duo. However, the relocation is not expected impact waste generation at the market. The location of the loading activities will be transported approximately 15km to Pasar Induk, which is located at Kenali Asam Bawah sub-district, Kotabaru District, near the Talang Gulo Landfill. Thus, all of the commodities from the producers will be transferred, which will be transported using big vehicles, to the wholesalers in Pasar Induk first. Afterwards, the products will be distributed using smaller vehicles to the retailers and/or traders in each traditional market, including Angso Duo market. The main activities during loading consist only of transferring the products from big vehicles to smaller ones and distributing them to the retailers in Jambi. The relocation plan is still being negotiated between the government bureaus, while a budget submission for this plan has not been made yet.
Figure 8 The New Angso Duo Market

27
Given that the Angso Duo market will be relocated in 2016, the local government proposed two potential sites for the waste-to-energy plant in Angso Duo Traditional Market – one at the current location of Angso Duo market and another at the new Angso Duo location.
The possible site for the waste-to-energy plant at the existing market has an area of 1,000 m2. For the new market location, the local government has confirmed that they have already provided a minimum area of ± 1,000 m2 for the plant though the exact location was still under discussion at the time of the research. Local authorities and related stakeholders were still discussing how large should be the area that could be allocated for the waste-to-energy plant. According to the site plan, the total area of the new Angso Duo market is of 71.45 ha, including an open green space area nearby the Batanghari River. Thus, there is a possibility to allocate an area larger than 1,000 m2.
The possible location of the plant at the existing Angso Duo is shown in Annex 1. Meanwhile at the new market, the SWI team could only obtain the site plant of the new market, while the exact location for the plant could not be shown since a discussion was still in progress.
Figure 9: Pasar Induk
28
The potential for energy consumption in close proximity to the site is relatively high as Angso Duo is located in the center of Jambi and, consequently, this market is surrounded within a radius of 1 km by commercial and business activities including shops, hotels, and offices. Numerous middle-low income settlements are found approximately 500 m behind the market. There is a school approximately 300 m form the market.
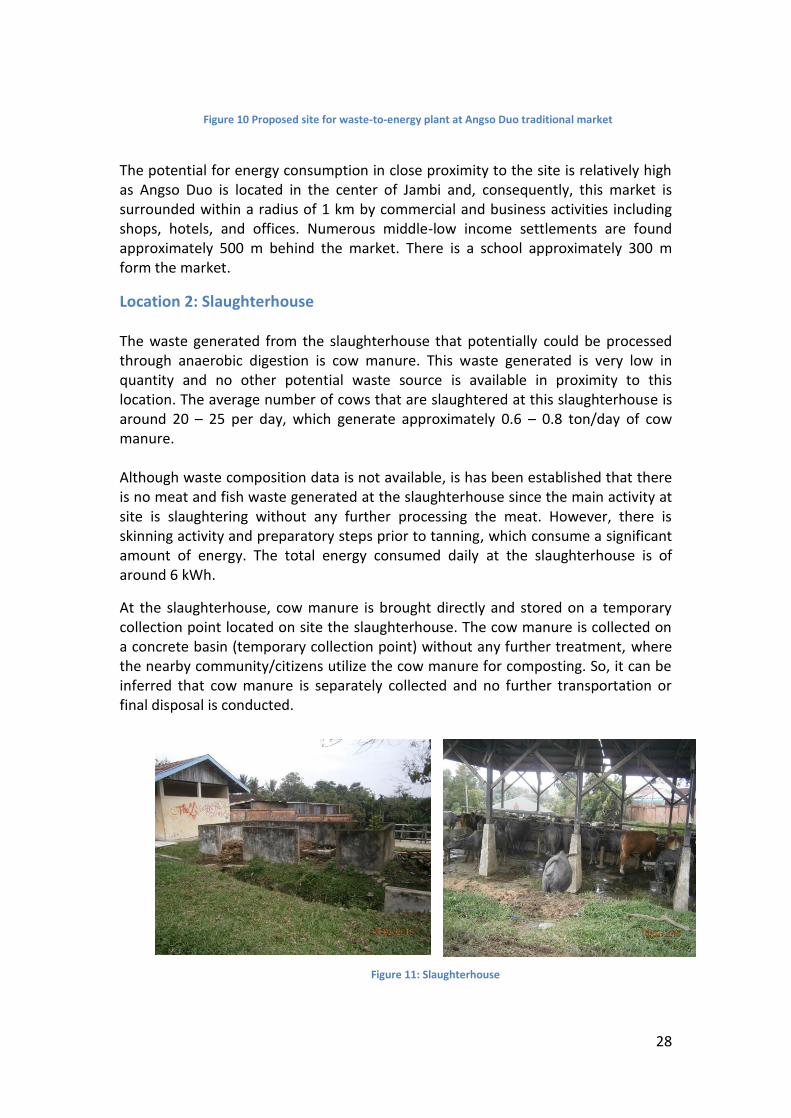
Location 2: Slaughterhouse The waste generated from the slaughterhouse that potentially could be processed through anaerobic digestion is cow manure. This waste generated is very low in quantity and no other potential waste source is available in proximity to this location. The average number of cows that are slaughtered at this slaughterhouse is around 20 – 25 per day, which generate approximately 0.6 – 0.8 ton/day of cow manure. Although waste composition data is not available, is has been established that there is no meat and fish waste generated at the slaughterhouse since the main activity at site is slaughtering without any further processing the meat. However, there is skinning activity and preparatory steps prior to tanning, which consume a significant amount of energy. The total energy consumed daily at the slaughterhouse is of around 6 kWh.
At the slaughterhouse, cow manure is brought directly and stored on a temporary collection point located on site the slaughterhouse. The cow manure is collected on a concrete basin (temporary collection point) without any further treatment, where the nearby community/citizens utilize the cow manure for composting. So, it can be inferred that cow manure is separately collected and no further transportation or final disposal is conducted.
Figure 10 Proposed site for waste-to-energy plant at Angso Duo traditional market
Figure 11: Slaughterhouse
29
An anaerobic digester was observed at the site, however it was not in operation due to technical issues and operational and maintenance costs. If repairs ti the digester were made it would be possible to utilize and treat abattoir waste with the existing anaerobic digester. According to Al Seadi (2008), cow manure has a rather low methane yield which reaches only 0.2 m3/kg VS. Thus, in order to boost the biogas production, cow manure should be mixed with other co-substrates with high methane yield.
The proposed location for waste-to-energy plant is located at an area of 30,000 m2 on the slaughterhouse site, around 10 m from where the existing anaerobic digester is located. The slaughterhouse is located approximately 0.5 – 1 km to a commercial area, which could be a source of energy demand. The energy demand of the surrounding area is relatively low, although the energy consumption of the slaughterhouse is relatively high due to the skinning activities.
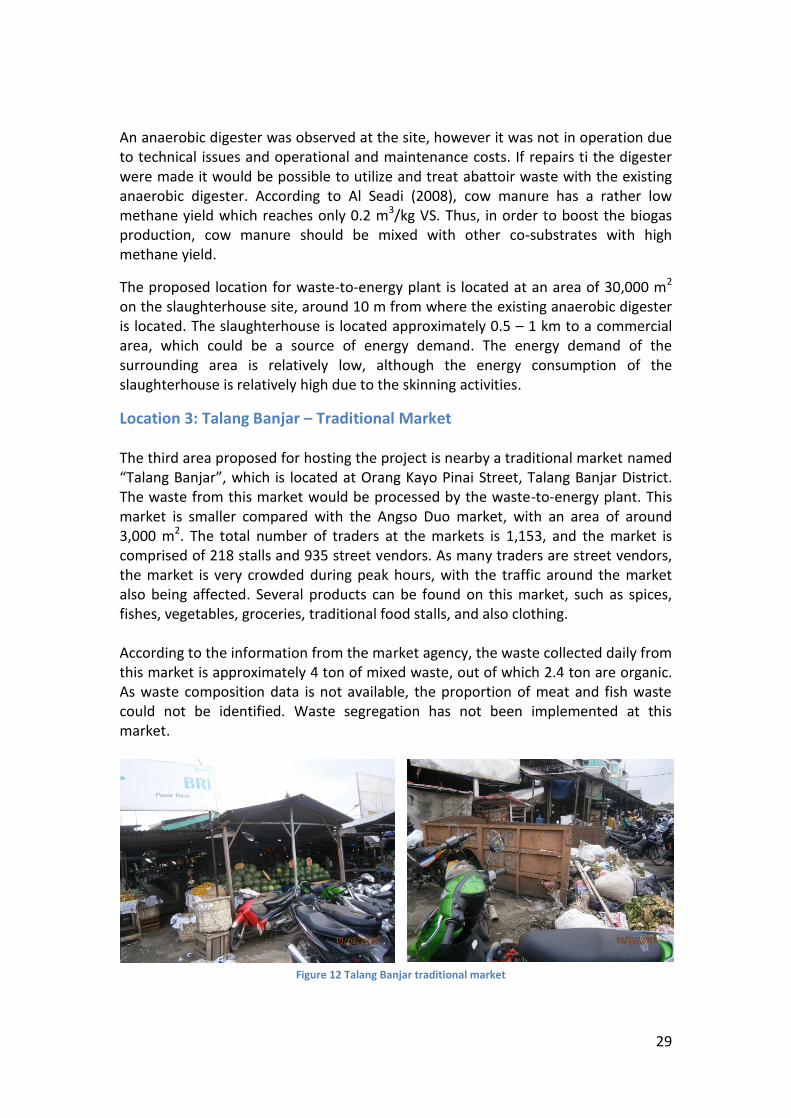
Location 3: Talang Banjar – Traditional Market The third area proposed for hosting the project is nearby a traditional market named “Talang Banjar”, which is located at Orang Kayo Pinai Street, Talang Banjar District. The waste from this market would be processed by the waste-to-energy plant. This market is smaller compared with the Angso Duo market, with an area of around 3,000 m2. The total number of traders at the markets is 1,153, and the market is comprised of 218 stalls and 935 street vendors. As many traders are street vendors, the market is very crowded during peak hours, with the traffic around the market also being affected. Several products can be found on this market, such as spices, fishes, vegetables, groceries, traditional food stalls, and also clothing. According to the information from the market agency, the waste collected daily from this market is approximately 4 ton of mixed waste, out of which 2.4 ton are organic. As waste composition data is not available, the proportion of meat and fish waste could not be identified. Waste segregation has not been implemented at this market.
Figure 12 Talang Banjar traditional market

30
Both Talang Banjar and Angso Duo are public markets, managed by the same market agency, and, therefore, the waste management system implemented in both is similar The waste collection system in place is a combination of stall-to-stall collection and a communal collection system. After waste is collected and gathered at the temporary waste collection point, it is transported and disposed directly to the landfill without any further treatment. The transport of waste system is similar to the process at Angso Duo, with dump trucks of 6 – 7m3 capacity collecting and transporting the waste.
Energy consumed is mostly used for lighting purposes, and only few traditional food stalls use energy for cooking. Even though the monthly energy consumption could not be determined, it can be assumed that the average energy consumed per stall is roughly the same as in Angso Duo, as the lighting system installed at the stalls is similar.
The proposed site for the waste-to-energy plant is located approximately 2 – 3km away from the Talang Banjar Traditional Market, with a site area of 1,000 m2. The site is located approximately 500m from households and shops - potential sources of demand for the energy generated by the plant.
Observation and Conclusions From the research above it is observed that Location 1 best meets the feedstock criteria for the waste-to-energy pilot as the amount of organic waste generated reaches 4 to 6 ton per day. Another source of organic waste is a fruits market located 1 km away from location 1, with an estimated total generation of 2.5 ton/day. Sources of organic waste are relatively limited in and around locations 2 and 3. Waste for Locations 1 and 2 is available on-site and/or in close proximity to these locations. Conversely, for a plant in Location 3, waste would need to be transported for processing. The difficult access and heavy traffic surrounding the market close to Location 3 would pose additional difficulties for the collection of waste.
Figure 13 Proposed site for waste-to-energy plant (2 - 3 km from Talang Banjar traditional market)

31
Another aspect considered is the proximity of the energy plant relative to potential consumers of the energy produced from a future plant. Location 1 best meets these requirement as it situated at a very close distance from potential consumers. At the site itself there is also the option of utilizing this energy as gas, electricity or both. On the other hand, Location 2 and 3 are situated approximately 500m from potential end-users, which also appear to have a relatively low energy consumption profile, in addition to the fact that they are also connected to the grid.
Based on the research and analysis outlined above, it is concluded that Location 1 is the most suitable for hosting the waste-to-energy pilot. This conclusion is in line with the preliminary assessment made by UN ESCAP, UCLG ASPAC and Waste Concern representatives during the fact finding mission in March 2015. Therefore, it was decided that a more detailed analysis of the waste characteristics and potential end-users would be conducted for a plant to be located in Location 1.
3. Marketing of Biogas and Assessment of Indicators for Financial-Economic Analysis
The SWI team was requested to collect information related to the demand and marketing of the biogas generated by the plant, and to conduct of a financial-economic analysis in line with a set of pre-determined indicators. The data was collected through interviews and questionnaires. Respondents included representatives of the local government, traders operating in the Angso Duo market, and some households surrounding the market. It should be noted that some data was very challenging to obtain, either because it was not available or due to confidentiality issues. Based on the information from the Head of Angso Duo Market, the total income generated by the market, which results from payments by each individual vendor, totals 310,000,000 IDR/month. This total amount consists of the fees for several services provided by the market, including a waste charge. However, a detailed breakdown of the fee charged for waste could not be determined. The market fee is the payment made by a vendor for the use of market facilities managed by the local government. According to the Local Regulation No. 9/2006, the market facility normally includes stalls/kiosks, outdoors/yards, tables and umbrellas, public toilet, waste services, and loading/unloading activities within the market. Currently, the market charges paid by each vendor ranges from 2,000 IDR/day to 6,000 IDR/day. The fees charged to the vendor/traders depend on the type, size, and duration of the facility used and type of business. In addition to the above, the total income generated by charging the fees is collected daily by the Market Agency and then transferred to the Local Revenue Agency (DISPENDA) to be further distributed to the related agencies which provide the services. For waste services at the market, the Market Agency transferred the

32
amount of 4,200,000 IDR/month from the income generated through the market fees to the Sanitation, Landscaping and Cemetery Agency. Indeed, the amount transferred to the Sanitation, Landscaping, and Cemetery Agency is considerably low, since most of the waste management implementation at Angso Duo Market is operated by the Market Agency. As previously mentioned, the activity managed by the Market Agency in waste management mainly includes the collection of waste from the stalls and the transportation of waste to the landfill. Meanwhile, the Sanitation, Landscaping, and Cemetery Agency has the responsibility to supervise the implementation of waste management in the market. Furthermore, there is no tipping fee charged for waste services, either in the market or at the settlement/household level. The price of land in Jambi price per square meter in the Talang Gulo landfill is of 80,000 IDR/m2 while the price of square meter in Angso Duo Market is of 1,000,000 IDR/m2. Meanwhile, the price of compost in Jambi is ranging between 900 – 1,000 IDR/kg. One roundtrip of the waste dump truck from the temporary collection point to the landfill, in a total of 30km, consumes about 8 liter of diesel fuel. The price of diesel is 6,900 IDR per liter, while the price of gasoline is of 7,400 IDR per liter. At the time of research, the price of fuel in the market is 135,000 IDR per LPG gas cylinders for the capacity of 12 kg and 16,000 IDR per LPG gas cylinders for the capacity of 3 kg. In addition, the maximum price for natural gas distributed through the pipeline for households, under the category of small-scale customers, is in the range of 4,500 – 7,000 IDR/m3, depending on the category of customers. The tariff charged for household-1 (RT-1) and small-scale customers-1 (PK-1) is 4,500 IDR/m3. Meanwhile, tariff charges for household-2 (RT-2) and small-scale customers-2 (PK-2) is 7,000 IDR/m3. These prices are determined based on the national regulation from the oil and gas downstream regulatory agency. As for the drinking water, the unitary prices differ per costumer type. For example, government institutions in Jambi City are charged by the State Drinking Water Company (PDAM) 2.1 IDR per liter of water, for a maximum of 10,000 l water. Furthermore, the installation fee for the government institution is 1,500,000 IDR. Please refer to annex 4 for more information. In terms of the energy supply, Angso Duo has one transformer substation with the capacity of 400 kVA that located near the market (< 100m). There are 2 stand-meters in Angso Duo market with installed power of 900 VA (B1) and 16500 VA (P1) that serves the office, street lightings, and other supporting facilities. There are two methods for supplying energy to the stalls at Angso Duo market. First, some stalls have an individual stand-meter installed at the stall and are connected directly to it. As alternative, some stalls are connected to a nearby stall which owns an individual stand-meter. This means that these individual stand-meters may be serving more than one stall (i.e. this is a shared stand-meter). However, the number of stalls under

33
his arrangement could not be determined. The power installed on the stalls can vary and detailed data was not available. During the survey period, the SWI team collected the receipts of electricity payments in Angso Duo market for two stand-meters and three stalls. Based on these receipts, the average electricity consumptions is presented in the table below: Table 12 Electricity Consumption in Angso Duo market
No Information Average energy
consumed (kWh)
Average monthly payment
(IDR)
Average tariff paid per kWh
(IDR/kWh)
1 Angso Duo market:
Category: B1/900 VA 255.33 137,720.00 539.41
Category: P1/16500 VA 2,288.00 3,413,442.33 1,490.66
2 Stalls at Angso Duo market:
Category: B1/450 VA 100 53,927.00 539.27
Category: R1/450 VA 190 94,132.00 495.43
Category: R1/900 VA 274 160,536.00 585.90 Source: SWI Team (2015)
SWI also conducted direct interviews to determine the monthly electricity expenditure of the stalls as well as surrounding households. On average these stalls spent between 50,000 to 100,000 IDR per month for electricity consumption. These are average figures from the stalls interviewed by the team. On the other hand, the households spent between 100,000 to 200,000 IDR per month. In Indonesia, the basic price of electricity applies nationally and are categorized based on the type of consumers. The electricity tariff and its category are shown in Annex 4. As shown in Table 12, the customer category and power installed at Angso Duo market vary significantly. Generally, the customer categories in Angso Duo consist of Business (B), Residential (R), and Government Office (P), with the corresponding power installed for small-sized consumption being B1, R1, and P1, respectively. The government plans to increase the electricity tariff as of May 2015, as it is stated on the Ministry Regulation of Ministry of Energy and Mineral Resources of Republic Indonesia (ESDM) no. 9 year 2015, referring to the changes from Regulation no. 31 year 2014 on electricity tariffs, which is under the scope of the State Electricity Company (PLN). According to this regulation, the electricity tariff will be adjusted monthly when there is any changing in the main factors that influencing the basic tariff of electricity. The factors influencing the basic tariff of electricity are the price of national crude oil/ICP, the exchange rate of the local currency (IDR) vis-à-vis the US Dollar, and the inflation rate. On the new regulation, there is no increase in the electricity tariff charged to household with an installed capacity of 450 and 950 VA. Unfortunately the SWI team was unable to obtain any information regarding the average production cost of electricity in Jambi City even though a direct formal interview had been conducted with a local government representative.

34
The customers with an electricity installation of between 450 and 900 VA are charged 495 IDR/kWh, which is a subsidized electricity price. The provision of subsidies to electricity is also applied nationally in Indonesia. Meanwhile, the electricity tariff for the non-subsidized customer (>900 VA) is of 1.352 IDR/kWh (nationally), which is almost three times as high in comparison to the basic electricity tariff for subsidized customers. According to data from the State Electricity Company of Jambi City, there are currently 285 and 409 electricity customers for 450 VA and 900 VA in the group category of social services, 17,943 and 31,646 for residential category R1, and 12 and 31 for business category. No subsidy applies for electricity customers in the industrial sector as the power installed in this category is higher than 900 VA. Regarding the electricity consumption surrounding Angso Duo, the peak hour for energy consumption in usually between 17:00 and 18:00, with a decrease in consumption typically by 20:00. The community reports that black outs rarely happen, about once every 6 months, and when this occurs it is normally between 11.00 and 13.00 and just for a few minutes. The nearest sub-districts surrounding the Angso Duo market are Beringin and Legok. Beringin sub-district has an area of 1.08 km2 and has 3,756 inhabitants (approximately 900 households). There are 4 household associations (a group contains households or Rukun Tetangga/RT) in Beringin sub-districts which are located nearby the Angso Duo market. Those are RT 15 (41 households), RT 16 (41 households), RT 17 (87 households) and RT 18 (47 households). Legok sub-district has an area of 3.4 km2 and has 13,744 inhabitants (approximately 3,187 households). In this sub-district there are three RTs which are located near the Angso Duo market. Those are RT 29 (60 households), RT 30 (70 household) and RT 31 (70 household). All RTs in Beringin and Legok range from dense to middle dense settlements with low to middle income communities. A map showing the nearest sub-district to Angso Duo market is not available. The SWI team conducted a questionnaire to examine the energy consumption at household and market level. The questionnaire surveyed gas and electricity consumption and was distributed to 25 people from the Beringin sub-district and 12 people from the Legok sub-district. Within the market, the total number of participants/respondents was of 248 traders, which included 16 fruit traders, 83 vegetable traders, 76 fish and meat traders, 70 traditional food/spices traders, and 3 eggs traders. The main results of the questionnaire are summarized as follows:
1. Information from the Head of Market Agency revealed that the total area for the Angso Duo Market is of approximately 18,000 km2. The market is operated from 10AM to 6PM. The power installed at the market is of 16,500 VA.

35
2. Information from the vendors in Angso Duo market found that, on average,
the income generated per stall is of 1,500,000 to 2,500,000 IDR. On each stall, the installed power capacity is between 450-900 VA with the electricity expenditure ranging between 50,000 and 100,000 IDR per month. These figures were obtained through interviews since most of the traders kept electricity bills at home. However, the team also collected the electricity receipts from 3 stalls, which also took part in the sampling activity, as previously shown in table 12. According to the questionnaire results, 64.52 percent of the traders prefer electricity as the final output from the waste-to-energy plant, while 7.66 perecent of traders said they prefer the use of the biogas as a heating fuel. Some 26.62 percent of the traders said they are interested in both electricity and gas as the final output of the plant. The remainder are not interested on the use of the biogas. Therefore, the energy generated from the waste-to-energy pilot would be preferably used in the form of electricity. Consumers of LPG are mainly traditional food stalls with an average consumption of 3 to 10 gas cylinders of 3kg per month. The total number of traditional food stalls that use LPG identified by the team was 51. The questionnaire also revealed that the traders are willing to pay an additional 10 percent to the existing market charges as a contribution to the waste-to-energy plant. The survey also found that only 4.44 percent of the traders are not willing to separate their waste at source.
3. Information from the households/settlements found that a household generates and income of 2,500,000 to 4,000,000 IDR per month. Each household has an installed electricity capacity ranging from 450 VA to 1,300 VA. This brings the electricity expenditure to between 100,000 to 200,000 IDR per month. In terms of LPG use, a household uses one to four gas cylinders per month. This equals to an expenditure of 75,000 to 100,000 IDR per month. In the survey, it was found that 94.59 percent of the respondents never conducts the separation of waste at source. Surprisingly 86.49 percent of the respondents said they do not pay waste fees as no collection fees are charged, and these are only applied in the household/settlements surrounding Angso Duo market. Another finding shows that even though many respondents are willing to separate their waste and willing to pay 10 percent more as waste collection fees, around 13 perecent of the respondents oppose it. This is due to their habit of dumping their waste into the river or simply burning it.
Detailed information about the questionnaire results can be found in Annex 3.

36
4. Angso Duo Waste Characteristics In the next phase of assessment, the waste characteristics of Angso Duo Traditional Market were conducted. The Angso Duo Market is managed by the Market Agency, while its operation is conducted by the Sanitation, Landscaping and Cemetery Agency. A similar arrangement is in place for other publicly-owned traditional markets in Jambi. The waste is collected from each three times a day to a temporary collection point by the operator using wheelbarrow with a load capacity of 130 kg. Some traders bring their waste directly to the temporary waste collection point. The Angso Duo Market has 60 workers employed for collecting waste, working across three shifts per day, and serving four temporary waste collection points. The waste is collected from the temporary collection points and transported to the landfill three times per day with a dump truck with a capacity of 6 – 7 m3. Waste separation at source has not yet been implemented in any of the traditional markets in Jambi.
Physical Characteristics Certain stalls have been identified as those that can potentially generate higher amounts of organic waste. These stalls equate to approximately 89 percent of the total stalls in the market. The waste sources/stalls with a potentially high amount of organic waste generation are identified as follows:
Table 13. Organic waste sources in Angso Duo Market
No Waste Sources n Stall/Point Proportion of the total stalls with high amount of organic waste (%)
n Sample
1 Vegetables Stalls 778 6.52 83
2 Fruit Stalls 152 33.38 26
3 Meat & Fish Stalls 714 30.63 57
4 Traditional-Food/Spices Stalls 656 28.14 31
5 Egg Stalls 31 1.33 3
6 Temporary Collection Points 4 - 2
Source: SWI Team (March, 2015)
In Angso Duo, the stalls mentioned above are mostly clustered in one specific area, except for traditional food stalls which are located dispersed within the market area. Some of the fruit stalls are located in one specific area while some others are located near the vegetable stalls. In the new Angso Duo market, stalls to be clustered in one specific area based on their category. In order to identify the daily waste generation rates, physical and chemical characteristics, and density of waste at Angso Duo, waste sampling was conducted for eight successive days to allow for variations over that period. All of the waste

37
generation points noted above were sampled. As a national standardized method for conducting the waste sampling does not exist, the Slovin Method was used to determine the sample size, as suggest in recent research by Harno et al (2011). The Slovin Method is used to determine the number of market stall samples required from the market. Then, the total number of samples need to be collected were multiplied with the proportion of each stall category so as to determine the number of samples from each stall category. The Slovin Methods equation is as follows:
where:
n = Total number of samples
N = Population in a specific area
e = Margin of error (= 0.06)
Based on the list of vendors in Angso Duo market, the team identified different categories of stalls that were assumed to be generating higher amounts of organic waste compared to other stalls. The identified category of stalls includes vegetable stalls, fruit stalls, meat and fish stalls, traditional food/spices stalls, and egg stalls. Based on the list of vendors, the total number of stalls is 2331. The error tolerance was adjusted to be lower than 10% to ensure the validity of data so the team agreed to set 6% as the margin error. Thus, the calculation is n = 2331/(1 + (2331 x 0.062)) = 248 traders with the following details: vegetable stalls (83 stalls), fruit stalls (16 stalls), meat and fish (76 stalls), traditional food/spices stalls (70 stalls), and egg stalls (3 stalls). Meanwhile, the number of samples from each stall category was determined through the proportion of each stall category multiplied by the total number of samples, as shown in Table 13. This step was undertaken to ensure even representation of each stall category. However, during the waste sampling research, the number of waste samples obtained did not reach the predetermined goals due to the lack in cooperation from the vendors. Most vendors were not willing to give their waste to be sampled despite a preceding public information announcement about the research activity. Hence, the number of samples collected daily from each stall categories during the eight days of sampling is presented in Table 13 with the column titled “n Sample”. During the sampling activity, the waste was collected each day from the stall and directly transported to the sampling location for further identification. It can
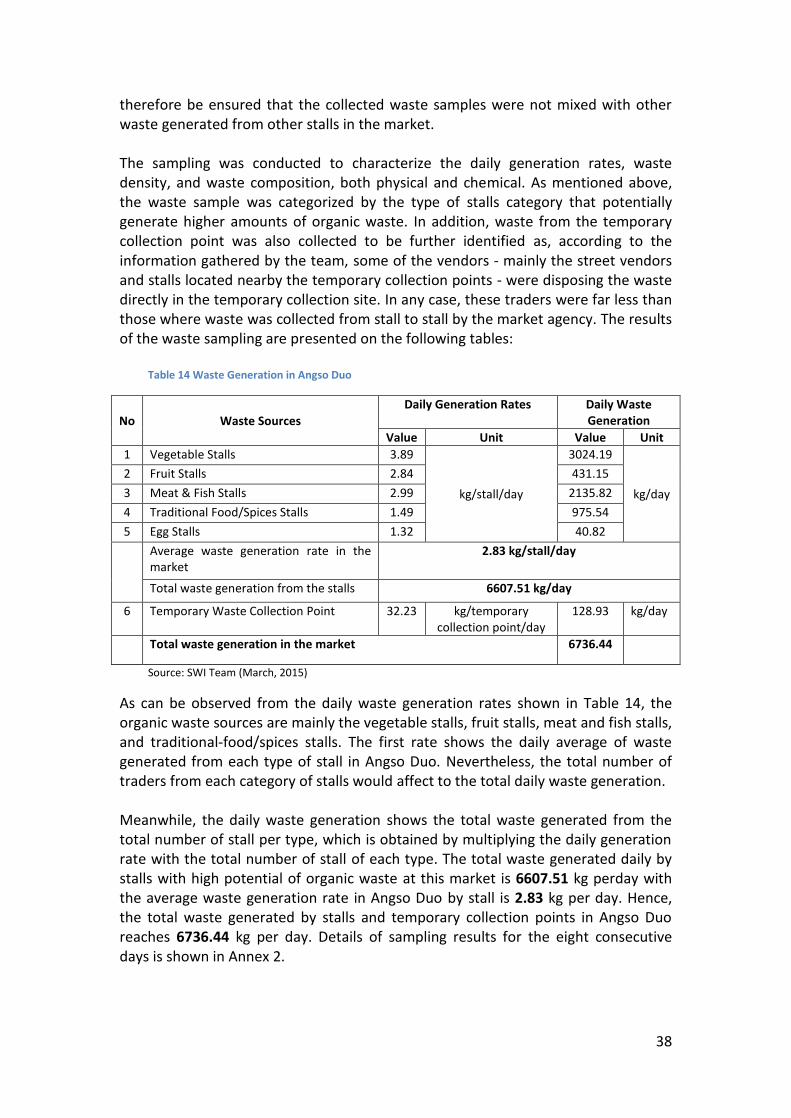
38
therefore be ensured that the collected waste samples were not mixed with other waste generated from other stalls in the market. The sampling was conducted to characterize the daily generation rates, waste density, and waste composition, both physical and chemical. As mentioned above, the waste sample was categorized by the type of stalls category that potentially generate higher amounts of organic waste. In addition, waste from the temporary collection point was also collected to be further identified as, according to the information gathered by the team, some of the vendors - mainly the street vendors and stalls located nearby the temporary collection points - were disposing the waste directly in the temporary collection site. In any case, these traders were far less than those where waste was collected from stall to stall by the market agency. The results of the waste sampling are presented on the following tables:
Table 14 Waste Generation in Angso Duo
No Waste Sources
Daily Generation Rates Daily Waste Generation
Value Unit Value Unit
1 Vegetable Stalls 3.89
kg/stall/day
3024.19
kg/day
2 Fruit Stalls 2.84 431.15
3 Meat & Fish Stalls 2.99 2135.82
4 Traditional Food/Spices Stalls 1.49 975.54
5 Egg Stalls 1.32 40.82
Average waste generation rate in the market
2.83 kg/stall/day
Total waste generation from the stalls 6607.51 kg/day
6 Temporary Waste Collection Point 32.23 kg/temporary collection point/day
128.93 kg/day
Total waste generation in the market 6736.44
Source: SWI Team (March, 2015)
As can be observed from the daily waste generation rates shown in Table 14, the organic waste sources are mainly the vegetable stalls, fruit stalls, meat and fish stalls, and traditional-food/spices stalls. The first rate shows the daily average of waste generated from each type of stall in Angso Duo. Nevertheless, the total number of traders from each category of stalls would affect to the total daily waste generation. Meanwhile, the daily waste generation shows the total waste generated from the total number of stall per type, which is obtained by multiplying the daily generation rate with the total number of stall of each type. The total waste generated daily by stalls with high potential of organic waste at this market is 6607.51 kg perday with the average waste generation rate in Angso Duo by stall is 2.83 kg per day. Hence, the total waste generated by stalls and temporary collection points in Angso Duo reaches 6736.44 kg per day. Details of sampling results for the eight consecutive days is shown in Annex 2.
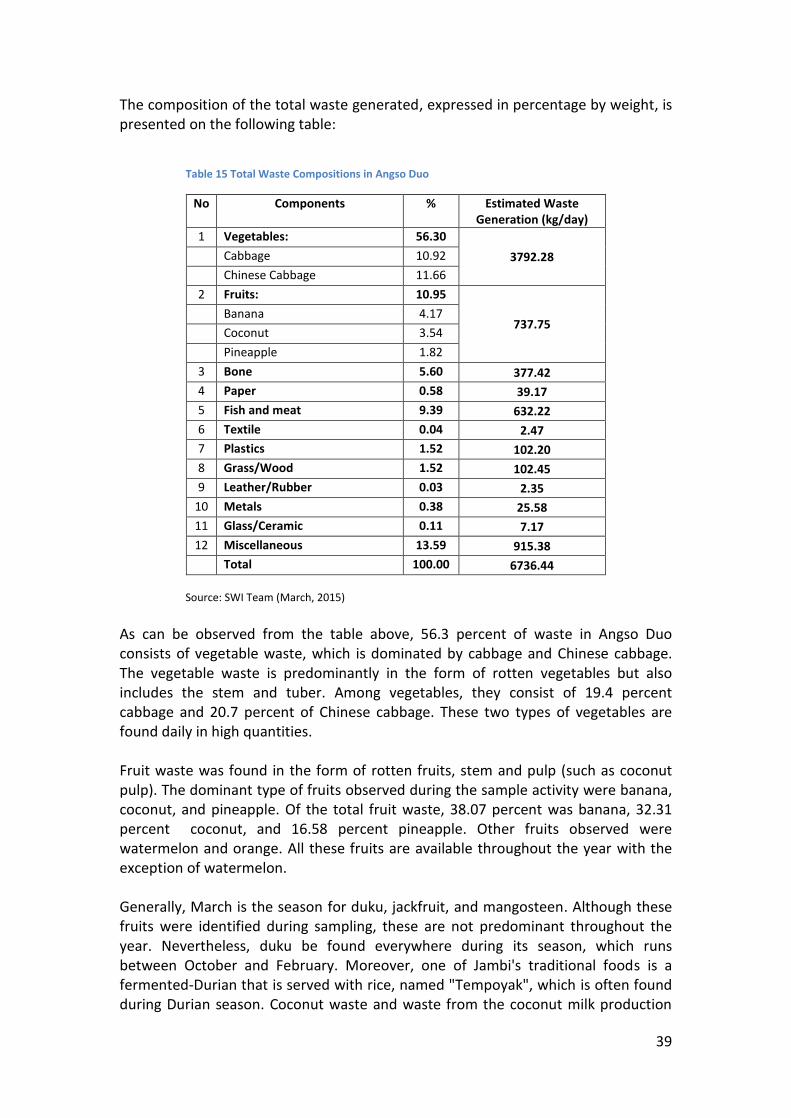
39
The composition of the total waste generated, expressed in percentage by weight, is presented on the following table:
Table 15 Total Waste Compositions in Angso Duo
No Components % Estimated Waste Generation (kg/day)
1 Vegetables: 56.30
3792.28 Cabbage 10.92
Chinese Cabbage 11.66
2 Fruits: 10.95
737.75 Banana 4.17
Coconut 3.54
Pineapple 1.82
3 Bone 5.60 377.42
4 Paper 0.58 39.17
5 Fish and meat 9.39 632.22
6 Textile 0.04 2.47
7 Plastics 1.52 102.20
8 Grass/Wood 1.52 102.45
9 Leather/Rubber 0.03 2.35
10 Metals 0.38 25.58
11 Glass/Ceramic 0.11 7.17
12 Miscellaneous 13.59 915.38
Total 100.00 6736.44
Source: SWI Team (March, 2015)
As can be observed from the table above, 56.3 percent of waste in Angso Duo consists of vegetable waste, which is dominated by cabbage and Chinese cabbage. The vegetable waste is predominantly in the form of rotten vegetables but also includes the stem and tuber. Among vegetables, they consist of 19.4 percent cabbage and 20.7 percent of Chinese cabbage. These two types of vegetables are found daily in high quantities. Fruit waste was found in the form of rotten fruits, stem and pulp (such as coconut pulp). The dominant type of fruits observed during the sample activity were banana, coconut, and pineapple. Of the total fruit waste, 38.07 percent was banana, 32.31 percent coconut, and 16.58 percent pineapple. Other fruits observed were watermelon and orange. All these fruits are available throughout the year with the exception of watermelon. Generally, March is the season for duku, jackfruit, and mangosteen. Although these fruits were identified during sampling, these are not predominant throughout the year. Nevertheless, duku be found everywhere during its season, which runs between October and February. Moreover, one of Jambi's traditional foods is a fermented-Durian that is served with rice, named "Tempoyak", which is often found during Durian season. Coconut waste and waste from the coconut milk production

40
process, can be expected throughout the year as coconut milk in Sumatra is commonly used. For more detailed information, please refer to Annex 2. Based on the sampling results in Table 15, the proportion of fish and meat waste reach 9.39 percent from the total waste generated in Angso Duo. The daily waste generation rate for meat and fish reaches 2.99 kg per day per stall with the number of meat and fish stalls being of 714, which is the second most frequently observed type of stall in Angso Duo. The waste composition in Angso Duo also consists of a miscellaneous fraction, reaching a proportion of 13.59 percent from the total waste composition. This type of waste is composed mainly of food waste, eggshell, chicken fur, and other residues. The daily waste density was calculated from each stall category/waste source, as shown in Annex 2. The average waste density per stall category/waste source is presented in the following table. As can be observed, the average of total waste density per day in Angso Duo is 321.88 kg/m3.
Table 16 Average Waste Density per Stall Category/Waste Source
No Waste Sources Density (kg/m3)
1 Vegetable Stalls 300.39
2 Fruit Stalls 318.50
3 Meat & Fish Stalls 719.42
4 Traditional Food/Spices Stalls 222.93
5 Egg Stalls 1465.44
6 Temporary Waste Collection Point 258.30
Source: SWI Team (March, 2015)
Chemical Characteristics of the Waste Sampled The chemical characteristics of organic waste is one of the most important factors affecting the decomposition process. Due to this, organic waste was sent to a laboratory for an analysis of its chemical characteristics. To ensure the stability of the waste variation and obtain a representative result, the waste samples were taken on the seventh day. The samples analyzed in the laboratory were only the organic component of the waste since it is the organic matter which generates the biogas through the anaerobic decomposition process. The total weight of the sample required by the laboratory was of 1kg, but the team decided to send 3.5kg to ensure there was plenty of feedstock for the analysis. In order to ensure the validity of the results, two additional samples with the same source and quantity were also sent to the laboratory.
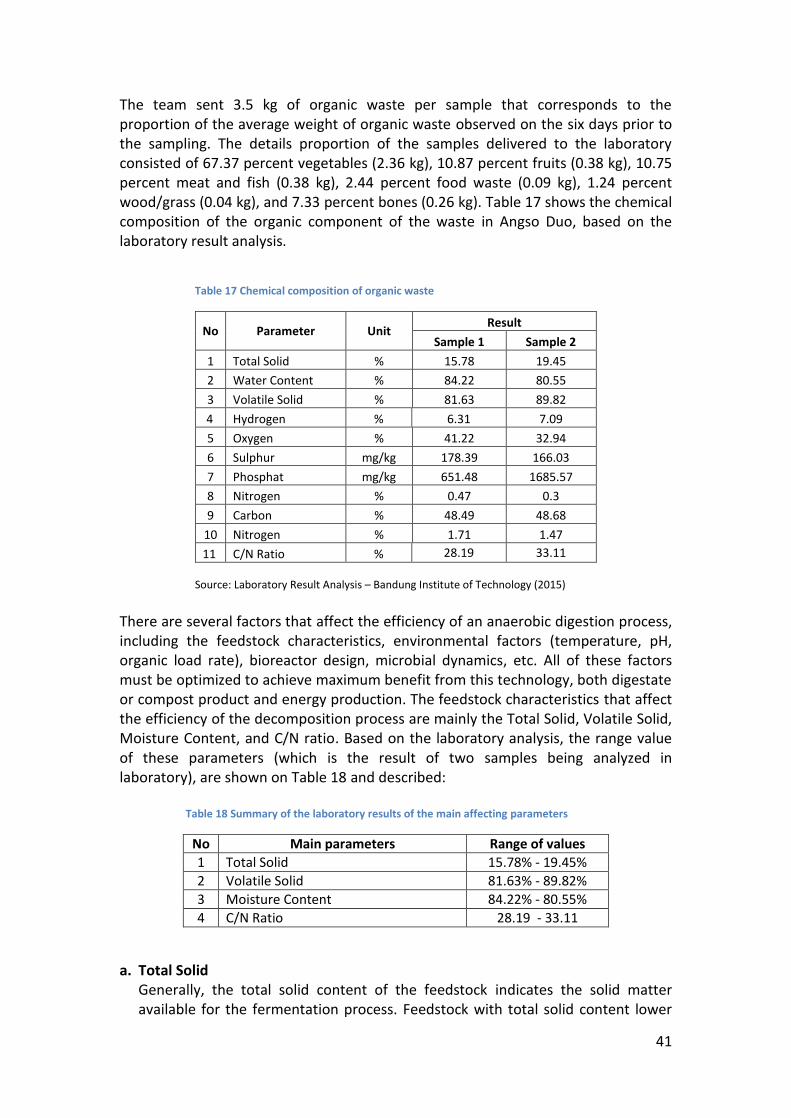
41
The team sent 3.5 kg of organic waste per sample that corresponds to the proportion of the average weight of organic waste observed on the six days prior to the sampling. The details proportion of the samples delivered to the laboratory consisted of 67.37 percent vegetables (2.36 kg), 10.87 percent fruits (0.38 kg), 10.75 percent meat and fish (0.38 kg), 2.44 percent food waste (0.09 kg), 1.24 percent wood/grass (0.04 kg), and 7.33 percent bones (0.26 kg). Table 17 shows the chemical composition of the organic component of the waste in Angso Duo, based on the laboratory result analysis.
Table 17 Chemical composition of organic waste
No Parameter Unit Result
Sample 1 Sample 2
1 Total Solid % 15.78 19.45
2 Water Content % 84.22 80.55
3 Volatile Solid % 81.63 89.82
4 Hydrogen % 6.31 7.09
5 Oxygen % 41.22 32.94
6 Sulphur mg/kg 178.39 166.03
7 Phosphat mg/kg 651.48 1685.57
8 Nitrogen % 0.47 0.3
9 Carbon % 48.49 48.68
10 Nitrogen % 1.71 1.47
11 C/N Ratio % 28.19 33.11
Source: Laboratory Result Analysis – Bandung Institute of Technology (2015)
There are several factors that affect the efficiency of an anaerobic digestion process, including the feedstock characteristics, environmental factors (temperature, pH, organic load rate), bioreactor design, microbial dynamics, etc. All of these factors must be optimized to achieve maximum benefit from this technology, both digestate or compost product and energy production. The feedstock characteristics that affect the efficiency of the decomposition process are mainly the Total Solid, Volatile Solid, Moisture Content, and C/N ratio. Based on the laboratory analysis, the range value of these parameters (which is the result of two samples being analyzed in laboratory), are shown on Table 18 and described:
Table 18 Summary of the laboratory results of the main affecting parameters
No Main parameters Range of values
1 Total Solid 15.78% - 19.45%
2 Volatile Solid 81.63% - 89.82%
3 Moisture Content 84.22% - 80.55%
4 C/N Ratio 28.19 - 33.11
a. Total Solid Generally, the total solid content of the feedstock indicates the solid matter available for the fermentation process. Feedstock with total solid content lower

42
than 25 percent should be processed with wet digestion (wet fermentation), while dry digestion (dry fermentation) is normally applied to a feedstock with total solid content of 30-40 percent (Karagiannidis and Perkoulidis, 2009). Feedstocks with a range of total solids in between are considered suitable for “semi-dry” fermentation (Mata-Alvarez, 2002).
The laboratory results of organic waste in Angso Duo indicate a total solid content between 15.78 percent and 19.45 percent, indicating that the most suitable approach is wet fermentation. The increasing of total solid content will decrease the digester volume due to lower water requirements (Monnet, 2003). Furthermore, the amount of available energy from a material rises with increased dry matter content.
According to Deublein and Steinhauser (2008), the total solid content of market waste ranges from 8 percent to 20 percent. It can be noted that the laboratory analysis of the samples show the total solid content between 15.78 percent and 19.45 percent, which lies in the upper limit of the range. The high content of total solid on the samples may be due to the combination of several components with high total solid content in the sampled waste stream.
b. Volatile Solid/Organic Loading Rate
Organic loading rate is a measure of the biological conversion capacity of the anaerobic digestion system. The organic loading rate is expressed in kg Chemical Oxygen Demand (COD) or Volatile Solid (VS) per cubic meter of reactor, which is linked with the retention time of any particular feedstock and anaerobic reactor (Monnet, 2003). Volatile solids represent the organic matter in a sample, which is measured as solid content minus ash content, as obtained by complete combustion of the feed waste. Volatile Solids comprise the Biodegradable Volatile Solids (BVS) fraction and the Refractory Volatile Solids (RVS). High volatile solids content with low RVS are more suitable for anaerobic digestion (Monnet, 2003). Higher volatile solids value typically result in a higher energy yield of the feedstock.
Based on the results of the laboratory tests, the organic waste in Angso Duo has considerably high volatile solid (as a percentage of TS) content, of between 81.63 percent and 89.82 percent, which tends to result in a high-energy yield. Furthermore, gas yields are directly correlated with the decomposition rates that a certain substrate has. Specific methane yields for different types of feedstock are presented on the following table:
Table 19 Specific methane yields
Substrate Methane yield
(l/kg VS) References
Municipal Solid Waste 360 Vogt et al. (2002)
Fruit and Vegetable Wastes 420 Bouallagui et al. (2005)
Fruit and Vegetable Waste, and Abattoir Wastewater
850 Forster-Carneiro et al. (2007)
Food Waste Leachate 294 Behera et al. (2010)

43
Rice Straw 350 Lei et al. (2010)
Maize Silage and Straw 312 Mumme et al. (2010)
Household Waste 350 Ferrer et al. (2011)
Lignin-rich Organic Waste 200 Jayasinghe et al. (2011)
Food Waste 396 Zhang et al. (2011)
c. Moisture/Water Content
High moisture content usually facilitates the anaerobic digestion. However, it is difficult to maintain the same level of water availability throughout the digestion cycle (Hernandez-Berriel et al., 2008). High water contents are likely to affect the process performance by dissolving readily degradable organic matter. It has been reported that the highest methane production rates occur at 60-80 percent of humidity (Bouallagui et al., 2003).
The moisture content of the organic waste samples from the Angso Duo market are in the range of 84.22 percent and 80.55 percent, which is slightly higher than the range of optimum methane production rates as mentioned above.
d. Carbon to Nitrogen Ratio (C/N) The relationship between the amount of carbon and nitrogen present in organic materials is expressed in the C/N ratio. The C/N ratio of the organic material plays a crucial role in the anaerobic digestion process, as unbalanced nutrients are regarded as limiting factor on the AD of organic waste. For improving C/N ratios, the co-digestion of an organic mixture should be conducted (Cuetos et al,. 2008). A C/N ratio of 20-30 may provide sufficient nitrogen for the AD process (Weiland, (2006). Meanwhile, Bouallagui et al. (2009a) suggest that a C/N ratio of 22-25 seems to be the ideal for the AD of fruit and vegetable waste, whereas, Guermoud et al. (2009) and Lee et al. (2009b) reported that the optimal C/N ratio for AD of organic waste is of 20-35. According to Monnet (2003), high C/N ratio is an indication of a rapid consumption of nitrogen by methanogens and results in a lower gas production. On the other hand, a lower C/N ratio causes ammonia accumulation and pH values exceeding 8.5, which is toxic to methanogenic bacteria. An optimum C/N ratio of feedstock materials can be achieved by mixing waste of low and high C/N ratio, such as organic solid waste mixed with animal manure (Monnet, 2003). Co-digestion of a low C/N ratio feedstock with a high C/N ratio feedstock can adjust the ratio closer to ideal conditions (Ward, J Alastair et al., 2008). Based on the laboratory result, the C/N ratio of the organic waste in Angso Duo ranges between 28.19 and 33.11. According to Guermoud et al. (2009) and Lee et al. (2009b), this range is the optimum condition for AD of organic waste, which lies between 20 and 35.
44
Recommendation
1. Current waste management practices in Jambi City rely on the collection-transport-disposal of waste, whereby there is considerable scope for improvement. The reliance on the city landfill is very high, as no significant waste reduction occurs prior to the final disposal. With current waste practices, waste that is reduced or recycled is less than 3 percent of the city’s total waste. Therefore, there is a need for proper waste treatment methods which reduce the waste at source in a significant manner.
2. In Jambi City, there are several sources of organic waste and locations that could
host a waste-to-energy plant applying an anaerobic decomposition process. The most suitable site among those proposed by the local government authorities has been determined to be Angso Duo market. The empirical analysis conducted by SWI concluded that the total waste generated in Angso Duo is of 6736.44 kg per day.
3. Angso Duo is known as the largest traditional market in Jambi, producing
approximately 67.25 percent of fruit and vegetable waste, which is considered as the appropriate feedstock for anaerobic digestion. It was confirmed with a lab analysis that its chemical composition presents suitable conditions anaerobic digestion. It is therefore recommended that the waste-to-energy pilot be located at Angso Duo.
4. One of the challenges to be taken into account at Angso Duo is that the current
market is to relocated to a new, adjacent site in 2016. The relocation should be taken into account for the implementation timeframes of the waste-to-energy pilot project.
5. The successful implementation of the waste-to-energy pilot significantly depends
on the integration among related institutions and regulations. Therefore, in the future, a local technical implementation unit should take overall responsibility for operating/managing project, and it t should be clear determined which unit will be responsible for these duties.

List of References
Al Seadi, 2008, Biogas Handbook, Published by University of Southern Denmark Esbjerg, Niels Bohrs Vej 9-10. www.lemvigbiogas.com
Anaerobic Digestion Science: http://www.nethyenergy.co.uk/ad-science.aspx BAPPEDA, 2013.Laporan Keterangan Pertanggung Jawaban Walikota Jambi BAPPEDA, 2013. Rencana Pembangunan Jangka Menengah Daerah Kota Jambi 2013-2018 BAPPEDA, 2014.Rencana Pembangunan Jangka Menengah Daerah Kota Jambi 2014-2019 Bouallagui, H., Touhami, Y., Cheikh, R.B., Hamdi, M., 2005. Bioreactor performance in
anaerobic digestion of fruit and vegetable wastes. Process Biochem. 40, 989–995. Behera, S.K., Park, J.M., Kim, K.H., Park, H., 2010. Methane production from food waste
leachate in laboratory-scale simulated landfill. Waste Manage. 30, 1502–1508. DKPP, 2015. Dokumen Dinas Kebersihan, pertamanan dan Pemakaman kota Jambi DKPP, 2011. Dokumen Dinas Kebersihan, pertamanan dan Pemakaman kota Jambi Ferrer, I., et al. 2011. Biogas production in low-cost household digesters at the Peruvian
Andes. Biomass Bioenergy. doi: 10.1016/j.biombioe.2010.12.036. Forster-Carneiro, T., Pérez, M., Romero, L.I., Sales, D., 2007. Dry-thermophilic anaerobic
digestion of organic fraction of the municipal solid waste: focusing on the inoculum sources. Bioresour. Technol. 98, 3195–3203.
Harno et al, 2011. Factors influencing waste generation in traditional market – a case study at Gemolong Market, Sragen Regency, Indonesia. University of Miyazaki.
Jambi Provincial Government, 2013. Adipura Book Report Jambi City 2013-2014 Jambi Local Government, 2009. Rencana Tata Ruang Wilayah Kota Jambi 2009-2028 Jambi Local Govermeny, 2013. Rencana Tata Ruang Wilayah Kota Jambi 2013-2034 Jayasinghe, P.A., Hettiaratchi, J.P.A., Mehrotra, A.K., Kumar, S., 2011. Effect of enzyme
additions on methane production and lignin degradation of landfilled sample of municipal solid waste. Bioresour. Technol. 102, 4633–4637.
Khalid, Azeem et al. 2011. The Anaerobic Digestion of Solid Organic Waste. Elsevier Lei, Z., Chen, J., Zhang, Z., Sugiura, N., 2010. Methane production from rice straw with
acclimated anaerobic sludge: effect of phosphate supplementation. Bioresour. Technol. 101, 4343–4348.
Market Agency, 2014. Profile of The Market Agency in Jambi City Ministry of Public Works, 2011. Penyusunan Masterplan dan DED Persampahan Kota Jambi
Tahun Anggaran Ministry of Public Works, 2014. Strategi Sanitasi Kota Jambi 2014-2018 Ministry of Public Works, 2011. Draft Memorandum Program Sektor Sanitasi Kota Jambi
2011-2014 Monnet, Fabian. 2003. Final report: An Introduction to Anaerobic Digestion of Organic
Waste. Remade Scottland Mumme, J., Linke, B., Tölle, R., 2010. Novel upflow anaerobic solid-state (UASS) reactor.
Bioresour. Technol. 101, 592–599. PT. Bumaka Ripta Engineering and Management Consultant in association with National Gas
Company, GBU, and Götz GmBH. Final Report: Organic Waste treatment Plant for Energy Source Alternatives in DKI Jakarta and Bogor-Tangerang-Bekasi Areas. March 1995
Statistical Bureau, 2014. Jambi City in Numbers The oil and gas downstream regulatory agency. 2015. Regulation Number 3/2015 regarding
the price of Natural Gas distributed through the pipeline for households and the category of small scale customers on the distribution pipe network in Jambi City.

Vogt, G.M., Liu, H.W., Kennedy, K.J., Vogt, H.S., Holbein, B.E., 2002. Super blue box recycling (SUBBOR) enhanced two-stage anaerobic digestion process for recycling municipal solid waste: laboratory pilot studies. Bioresour. Technol. 85, 291–299.
Ward, J Alastair et al. 2008). Optimisation of the anaerobic digestion of agricultural resources. Elsevier.
Zhang, L., Lee, Y.W., Jahng, D., 2011. Anaerobic co-digestion of food waste and piggery wastewater: focusing on the role of trace elements. Bioresour. Technol.doi: 10.1016/j.biortech.2011.01.082.

ANNEX 1
The location of waste-to-energy pilot at Angso Duo market

Map of the new Angso Duo market

ANNEX 2
Waste Composition (kg)
No Components Day 1 Day 2 Day 3 Day 4 Day 5 Day 6 Day 7 Day 8 Total Weight %
1 Vegetables 428.27 522.19 386.1 348.5 434.5 357.2 342.8 249.2 3068.76 56.30
2 Fruits 34.6 67.1 88.5 75.9 72.4 108.3 100.6 49.6 597 10.95
3 Bone 32.11 30.1 32.3 90.2 43.4 44.1 17.6 15.6 305.41 5.60
4 Paper 0.6 6 1.9 5.6 6.6 3.1 3.2 4.7 31.7 0.58
5 Fish and meat 43.9 45.6 77.3 89.6 78.5 73.7 77.5 25.5 511.6 9.39
6 Textile 0 0 0 1.5 0.5 0 0 0 2 0.04
7 Plastics 5 16 9.4 8.3 8.2 15.5 12 8.3 82.7 1.52
8 Grass/Wood 1.7 3.6 9.7 16.2 7.5 17.1 8.8 18.3 82.9 1.52
9 Leather/Rubber 0 1.4 0 0.5 0 0 0 0 1.9 0.03
10 Metals 1 1.4 2.2 2.3 1.8 2.5 2.1 7.4 20.7 0.38
11 Glass/Ceramic 0.5 0.3 0.7 1.4 0.8 0.3 0.9 0.9 5.8 0.11
12 Miscellaneous 70.64 87 109.3 77.5 80.7 154.3 106.6 54.7 740.74 13.59
Total 618.32 780.69 717.4 717.5 734.9 776.1 672.1 434.2 5451.21 100.00
Density (kg/m3) 299.22 240.21 316.81 389.51 351.26 356.12 338.32 283.57
Average Density (kg/m3) 321.88

Density of the waste (kg/m3)
No Stalls Day 1 Day 2 Day 3 Day 4 Day 5 Day 6 Day 7 Day 8 Ave
1 Vegetables 254.77 360.07 288.05 275.31 310.89 322.83 305.45 285.73 300.39
2 Fruit 262.12 225.93 446.97 383.33 365.66 298.35 315.15 250.51 318.50
3 Meat & Fish 908.10 720.71 871.86 878.41 644.32 652.07 658.71 421.21 719.42
4 Traditional Food Stalls/Spices 168.69 191.52 171.86 290.40 221.21 260.98 221.65 257.14 222.93
5 Egg 606.06 0.00 1969.70 4090.91 534.09 3787.88 242.42 492.42 1465.44
6 Temporary Waste Collection Point 0.00 366.39 106.54 683.50 297.08 189.90 249.49 173.48 258.30

Waste composition equal or above 10%
No Components Day 1 Day 2 Day 3 Day 4 Day 5 Day 6 Day 7 Day 8 Total Weight % to Σ Vegetables/Fruits
1 Vegetables:
Cabbage 96.97 53 94.7 71.6 62.6 94.6 74.3 47.6 595.37 19.40
Chinese Cabbage 72.28 62.6 102.4 87.9 133.7 76.2 49.7 50.7 635.48 20.71
Leek 45.52 0 0 0 38.7 38.2 45.8 55.4 223.62 7.29
Corn 0 0 0 30.8 0 0 0 0 30.8 1.00
Chayotes 0 0 0 0 0 0 30.8 0 30.8 1.00
Residue 89.6 0 0 0 0 0 0 0 89.6 2.92
Total 1605.67 52.32
2 Fruit:
Banana 14.3 28.1 38.4 18.3 29.3 55.8 28.2 14.9 227.3 38.07
Coconut 20.3 23.6 36.7 33.2 9 30.3 24.1 15.7 192.9 32.31
Pineapple 0 12 9.9 10.5 29.5 20.4 9.3 7.4 99 16.58
Watermelon 0 0 0 10.6 0 0 0 0 10.6 1.78
Orange 0 0 0 0 0 0 12.2 0 12.2 2.04
Total 542 90.79

Waste Generation Rates (Kg/stall/day)
No Components Day 1 Day 2 Day 3 Day 4 Day 5 Day 6 Day 7 Day 8 Generation Rates
A. Vegetables Stalls (kg/stall/day) (per component)
1 Vegetables 5.16 3.26 4.12 3.71 4.57 3.85 3.64 2.73 3.88
2 Fruits 0 0 0 0 0 0 0 0 0
3 Bone 0 0 0 0 0 0 0 0 0
4 Paper 0 0.01 0.005 0.01 0 0 0 0 0.003
5 Fish and meat 0 0 0 0 0 0 0 0 0
6 Textile 0 0 0 0 0 0 0 0 0
7 Plastics 0.01 0.01 0 0 0 0 0 0 0.002
8 Grass/Wood 0 0 0 0 0 0 0 0 0
9 Leather/Rubber 0 0.02 0 0.01 0 0 0 0 0.003
10 Metals 0 0 0 0 0 0 0 0 0
11 Glass/Ceramic 0 0 0 0 0 0 0 0 0
12 Miscellaneous 0 0 0 0 0 0 0 0 0
Daily Generation Rates 5.17 3.29 4.12 3.72 4.57 3.85 3.64 2.73 3.89
TOTAL waste generation (kg/day) 3024.19
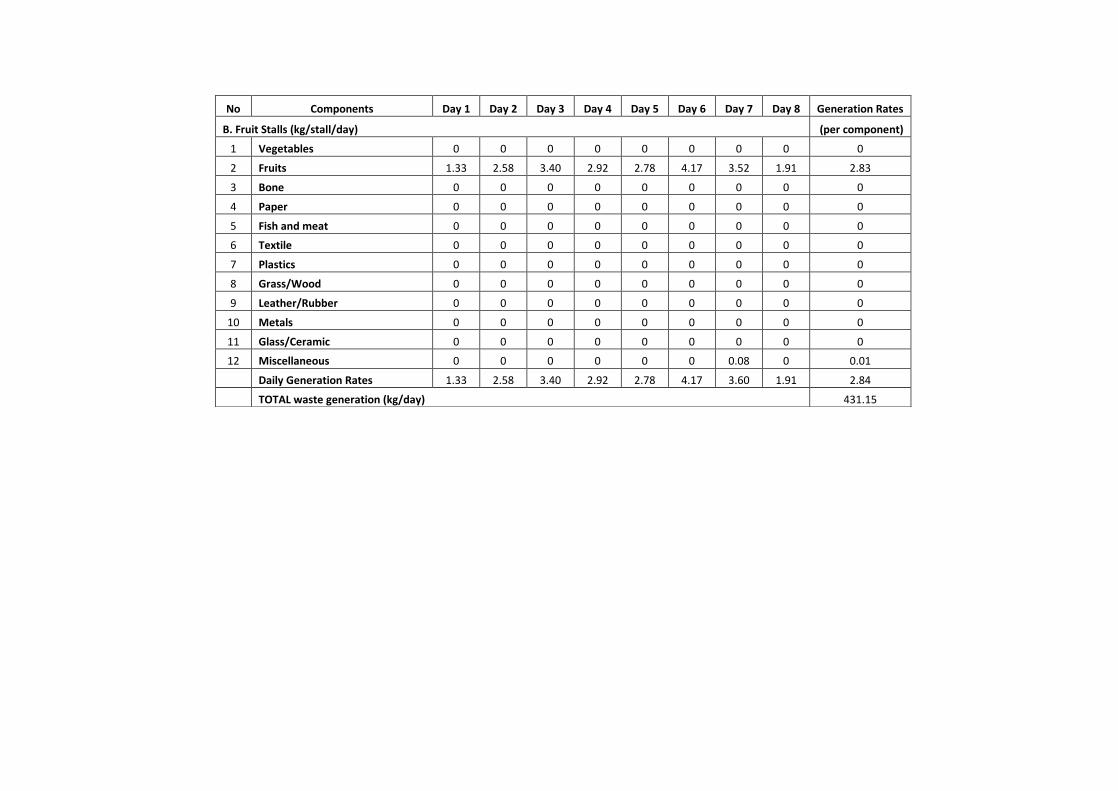
No Components Day 1 Day 2 Day 3 Day 4 Day 5 Day 6 Day 7 Day 8 Generation Rates
B. Fruit Stalls (kg/stall/day) (per component)
1 Vegetables 0 0 0 0 0 0 0 0 0
2 Fruits 1.33 2.58 3.40 2.92 2.78 4.17 3.52 1.91 2.83
3 Bone 0 0 0 0 0 0 0 0 0
4 Paper 0 0 0 0 0 0 0 0 0
5 Fish and meat 0 0 0 0 0 0 0 0 0
6 Textile 0 0 0 0 0 0 0 0 0
7 Plastics 0 0 0 0 0 0 0 0 0
8 Grass/Wood 0 0 0 0 0 0 0 0 0
9 Leather/Rubber 0 0 0 0 0 0 0 0 0
10 Metals 0 0 0 0 0 0 0 0 0
11 Glass/Ceramic 0 0 0 0 0 0 0 0 0
12 Miscellaneous 0 0 0 0 0 0 0.08 0 0.01
Daily Generation Rates 1.33 2.58 3.40 2.92 2.78 4.17 3.60 1.91 2.84
TOTAL waste generation (kg/day) 431.15

No Components Day 1 Day 2 Day 3 Day 4 Day 5 Day 6 Day 7 Day 8 Generation Rates
C. Meat and Fish Stalls (kg/stall/day) (per component)
1 Vegetables 0 0 0 0 0 0 0 0 0
2 Fruits 0 0 0 0 0 0 0 0 0
3 Bone 0.56 0.53 0.57 1.58 0.76 0.77 0.31 0.27 0.67
4 Paper 0 0 0 0 0 0 0 0 0
5 Fish and meat 0.77 0.80 1.36 1.57 1.38 1.29 1.36 0.45 1.12
6 Textile 0 0 0 0 0 0 0 0 0
7 Plastics 0.02 0.04 0 0 0 0 0 0 0.01
8 Grass/Wood 0 0 0 0 0 0 0 0 0
9 Leather/Rubber 0 0 0 0 0 0 0 0 0
10 Metals 0 0 0 0 0 0 0 0 0
11 Glass/Ceramic 0 0 0 0 0 0 0 0 0
12 Miscellaneous 1.07 1.14 1.61 0.91 0.85 2.09 1.38 0.50 1.19
Daily Generation Rates 2.42 2.50 3.53 4.07 2.98 4.15 3.05 1.22 2.99
TOTAL waste generation (kg/day) 2135.82
No Components Day 1 Day 2 Day 3 Day 4 Day 5 Day 6 Day 7 Day 8 Generation Rates
D. Traditional-Food/Spices Stalls (kg/stall/day) (per component)
1 Vegetables 0 0 0 0 0 0 0 0 0
2 Fruits 0 0 0 0 0 0 0 0 0
3 Bone 0 0 0 0 0 0 0 0 0
4 Paper 0.02 0.04 0.04 0.13 0.05 0.06 0.08 0.04 0.05
5 Fish and meat 0 0 0 0 0 0 0 0 0
6 Textile 0 0 0 0.05 0.02 0 0 0 0.01
7 Plastics 0.11 0.20 0.30 0.27 0.26 0.5 0.39 0.27 0.29
8 Grass/Wood 0.05 0.12 0.31 0.52 0.24 0.55 0.28 0.59 0.33
9 Leather/Rubber 0 0 0 0 0 0 0 0 0
10 Metals 0.03 0.05 0.07 0.07 0.06 0.08 0.07 0.24 0.08
11 Glass/Ceramic 0.02 0.01 0.02 0.05 0.03 0.01 0.03 0.03 0.02
12 Miscellaneous 0.31 0.62 0.54 0.77 0.76 1.02 0.81 0.75 0.70
Daily Generation Rates 0.54 1.02 1.28 1.85 1.41 2.22 1.65 1.92 1.49
TOTAL waste generation (kg/day) 975.54

No Components Day 1 Day 2 Day 3 Day 4 Day 5 Day 6 Day 7 Day 8 Generation Rates
E. Egg Stalls (kg/stall/day) (per component)
1 Vegetables 0 0 0 0 0 0 0 0 0
2 Fruits 0 0 0 0 0 0 0 0 0
3 Bone 0 0 0 0 0 0 0 0 0
4 Paper 0 0 0.13 0.4 1.7 0.43 0.27 1.17 0.51
5 Fish and meat 0 0 0 0 0 0 0 0 0
6 Textile 0 0 0 0 0 0 0 0 0
7 Plastics 0 0 0 0 0 0 0 0 0
8 Grass/Wood 0 0 0 0 0 0 0 0 0
9 Leather/Rubber 0 0 0 0 0 0 0 0 0
10 Metals 0 0 0 0 0 0 0 0 0
11 Glass/Ceramic 0 0 0 0 0 0 0 0 0
12 Miscellaneous 0.13 0 0.3 0.5 3 1.23 0.27 1 0.80
Daily Generation Rates 0.13 0.00 0.43 0.90 4.70 1.67 0.53 2.17 1.32
TOTAL waste generation (kg/day) 40.82
No Components Day 1 Day 2 Day 3 Day 4 Day 5 Day 6 Day 7 Day 8 Generation Rates
F. Temporary Waste Collection Point (kg/point/day) (per component)
1 Vegetables 0 126 22.15 20.3 27.45 18.8 20.2 11.45 30.79
2 Fruits 0 0 0 0 0 0 4.5 0 0.56
3 Bone 0 0 0 0 0 0 0 0 0
4 Paper 0 2 0 0 0 0 0 0 0.25
5 Fish and meat 0 0 0 0 0 0 0 0 0
6 Textile 0 0 0 0 0 0 0 0 0
7 Plastics 0 3.5 0 0 0 0 0 0 0.44
8 Grass/Wood 0 0 0 0 0 0 0 0 0
9 Leather/Rubber 0 0 0 0 0 0 0 0 0
10 Metals 0 0 0 0 0 0 0 0 0
11 Glass/Ceramic 0 0 0 0 0 0 0 0 0
12 Miscellaneous 0 1.5 0 0 0 0 0 0 0.19
Daily Generation Rates 0 133 22.15 20.3 27.45 18.8 24.7 11.45 32.23
TOTAL waste generation (kg/day) 128.93

ANNEX 3
Questionnaire Results
Traders
No. Entry Findings
1. GENERAL OVERVIEW
Respondents: Fruit stalls (6.45%); vegetable stalls (33.47%); fish & meat stalls (30.65%); traditional food stall (28.23%); eggs (1.21%). Area of stall : > 5 - ≤ 7.5 m
2
2. ENERGY CONSUMPTION
a. Education Level Elementary (24.19 %); Junior High School ( 18.55 %); Senior High School (47.98 %); Undergraduate Degree (4.03 %)
b. Monthly Income > IDR 1,000,000 - IDR 1,500,000 (23.39 %); > IDR 1,500,000 - IDR 2,500,000 ( 22.58 %); > IDR 2,500,000 - IDR 4,000,000 (20.97 %); > IDR 4,000,000 - IDR 5,000,000 (11.29 %)
c. Electricity Utilization i. Installed capacity 450 VA (37.50%); 900 VA (25.81%); 1300 VA (13.31%); not utilizing (22.18%)
ii. Lighting point: 1 point (44.56%); ≥ 1 to 3 points (48.70%)
iii. Usage: lighting (78.78%); electronic goods (16.73%)
iv. Bills: < IDR 50,000 (27.98%); > IDR 50,000 - IDR 100,000 (40.93%); > IDR 100,000 - IDR 200,000 (23.32%)
d. Gas Utilization i. LPG use: Yes (20.56%), No (79.44%)
ii. Number of cylinder (monthly): between 3 to 10 cylinders of 3kg/month
iii. Expenses for LPG: IDR 60,000 - IDR 300,000
3. WASTE MANAGEMENT
a. Waste bin Plastic bag (35.08%); Waste bin (21.37%); Basket (21.37%); Others (sack, cardboard, or stacked) (19.76%)
b. Waste sorting Yes ( 10.48%); Not yet (89.52%)
c. Waste disposal system at the stalls Stored in front of stall
d. Waste collection system (by cleaning staff)
Collected by market staff
e. Waste collection vehicles Motor cart
f. Tipping fee None
g. Fuel consumption from temporary collecting point to final disposal
-
4. PAYMENT MECHANISM
a. Market Retribution Fee Daily: IDR 2,000 (47.58%); > IDR 2,000 - IDR 4,000 (31.85%); > IDR 4,000 - IDR 6,000 (12.90%)
b. Payment Mechanism Collected by market staff (100%)
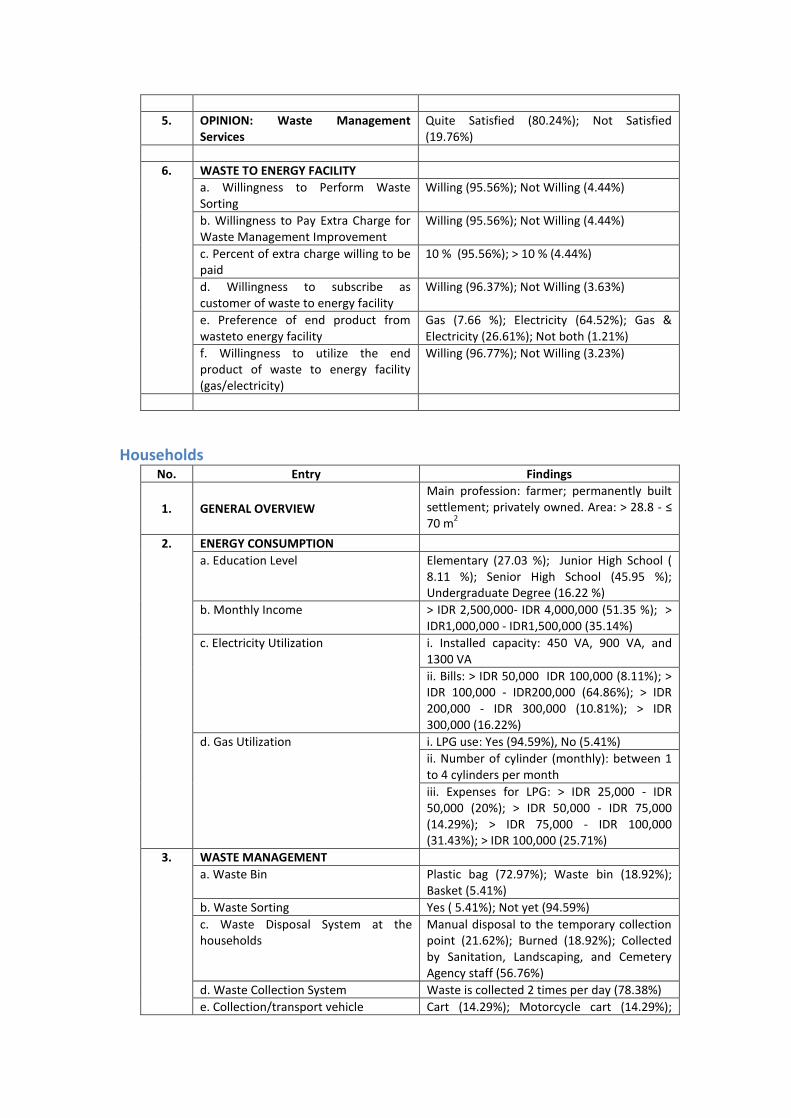
5. OPINION: Waste Management Services
Quite Satisfied (80.24%); Not Satisfied (19.76%)
6. WASTE TO ENERGY FACILITY
a. Willingness to Perform Waste Sorting
Willing (95.56%); Not Willing (4.44%)
b. Willingness to Pay Extra Charge for Waste Management Improvement
Willing (95.56%); Not Willing (4.44%)
c. Percent of extra charge willing to be paid
10 % (95.56%); > 10 % (4.44%)
d. Willingness to subscribe as customer of waste to energy facility
Willing (96.37%); Not Willing (3.63%)
e. Preference of end product from wasteto energy facility
Gas (7.66 %); Electricity (64.52%); Gas & Electricity (26.61%); Not both (1.21%)
f. Willingness to utilize the end product of waste to energy facility (gas/electricity)
Willing (96.77%); Not Willing (3.23%)
Households No. Entry Findings
1. GENERAL OVERVIEW
Main profession: farmer; permanently built settlement; privately owned. Area: > 28.8 - ≤ 70 m
2
2. ENERGY CONSUMPTION
a. Education Level Elementary (27.03 %); Junior High School ( 8.11 %); Senior High School (45.95 %); Undergraduate Degree (16.22 %)
b. Monthly Income > IDR 2,500,000- IDR 4,000,000 (51.35 %); > IDR1,000,000 - IDR1,500,000 (35.14%)
c. Electricity Utilization i. Installed capacity: 450 VA, 900 VA, and 1300 VA
ii. Bills: > IDR 50,000 IDR 100,000 (8.11%); > IDR 100,000 - IDR200,000 (64.86%); > IDR 200,000 - IDR 300,000 (10.81%); > IDR 300,000 (16.22%)
d. Gas Utilization i. LPG use: Yes (94.59%), No (5.41%)
ii. Number of cylinder (monthly): between 1 to 4 cylinders per month
iii. Expenses for LPG: > IDR 25,000 - IDR 50,000 (20%); > IDR 50,000 - IDR 75,000 (14.29%); > IDR 75,000 - IDR 100,000 (31.43%); > IDR 100,000 (25.71%)
3. WASTE MANAGEMENT
a. Waste Bin Plastic bag (72.97%); Waste bin (18.92%); Basket (5.41%)
b. Waste Sorting Yes ( 5.41%); Not yet (94.59%)
c. Waste Disposal System at the households
Manual disposal to the temporary collection point (21.62%); Burned (18.92%); Collected by Sanitation, Landscaping, and Cemetery Agency staff (56.76%)
d. Waste Collection System Waste is collected 2 times per day (78.38%)
e. Collection/transport vehicle Cart (14.29%); Motorcycle cart (14.29%);

Truck (57.14%)
f. Tipping Fee None
g. Fuel consumption from temporary collecting point to final disposal
-
4. PAYMENT MECHANISM
a. Waste Retribution Fee > IDR 2,000 (8.11 %); > IDR 2,000 - IDR 3,000 (5.41 %); No Payment (86.49%)
b. Payment Mechanism No waste fee collected
5. OPINION: Waste Management Services
Quite Satisfied (48.65%); Not Satisfied (51.35%)
6. WASTE TO ENERGY FACILITY
a. Willingness to Perform Waste Sorting
Willing (86.49%); Not Willing (13.51%)
b. Willingness to Pay Extra Charge for Waste Management Improvement
Willing (89.19%); Not Willing (10.81%)
c. Percent of extra charge willing to be paid
10 % (89.19%); > 10 % (10.81%)
d. Willingness to subscribe as customer of waste to energy facility
Willing (91.89%); Not Willing (8.11%)
e. Preference of end product from waste to energy facility
Gas (24.32 %); Electricity (32.43%); Gas & Electricity (43.24%)
f. Willingness to utilize the end product of waste to energy facility (gas/electricity)
Willing (97.30%); Not Willing (2.70%)
Head of Angso Duo Market
No. Entry Findings
1
ENERGY CONSUMPTION
a. Electricity Utilization Installed capacity: 16500 VA. Average monthly bill: IDR 3,314,000. Monthly energy consumption 2,288 kWh
2. WASTE MANAGEMENT
a. Waste Management System Waste from the stalls are collected by cleaning staff from Market Agency, then disposed directly to temporary collection point (TPS)
b. Waste Collection System (by cleaning staff)
3 times per day (from stalls to temporary collection point/TPS) and from TPS to final disposal (TPA)
c. Waste Transport Vehicle From stalls to TPS using motor cart with capacity of 130 kg/65 lt, from TPS to final disposal (TPA) using Dump Truck with capacity of 6 m³
d. Tipping Fee None
e. Fuel consumption from temporary collecting point to final disposal
Diesel oil: 0.2 lt/km
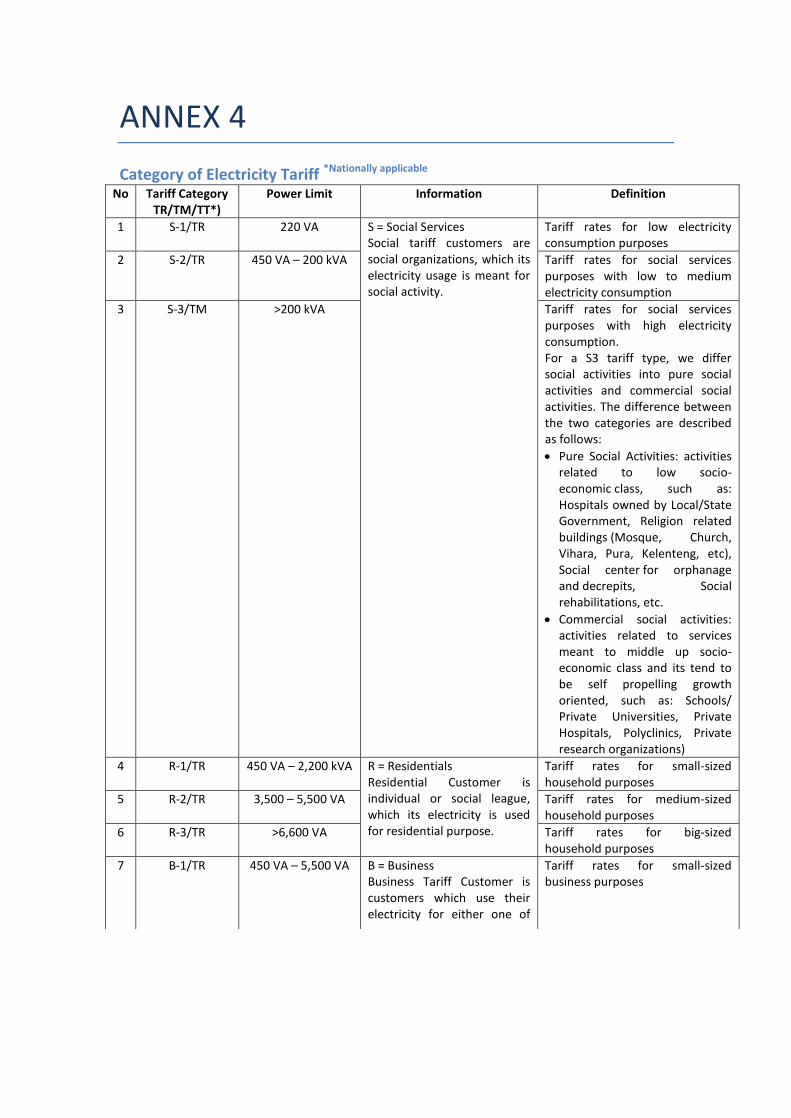
ANNEX 4
Category of Electricity Tariff *Nationally applicable No Tariff Category
TR/TM/TT*) Power Limit Information Definition
1 S-1/TR 220 VA S = Social Services Social tariff customers are social organizations, which its electricity usage is meant for social activity.
Tariff rates for low electricity consumption purposes
2 S-2/TR 450 VA – 200 kVA Tariff rates for social services purposes with low to medium electricity consumption
3 S-3/TM >200 kVA Tariff rates for social services purposes with high electricity consumption. For a S3 tariff type, we differ social activities into pure social activities and commercial social activities. The difference between the two categories are described as follows:
Pure Social Activities: activities related to low socio-economic class, such as: Hospitals owned by Local/State Government, Religion related buildings (Mosque, Church, Vihara, Pura, Kelenteng, etc), Social center for orphanage and decrepits, Social rehabilitations, etc.
Commercial social activities: activities related to services meant to middle up socio-economic class and its tend to be self propelling growth oriented, such as: Schools/ Private Universities, Private Hospitals, Polyclinics, Private research organizations)
4 R-1/TR 450 VA – 2,200 kVA R = Residentials Residential Customer is individual or social league, which its electricity is used for residential purpose.
Tariff rates for small-sized household purposes
5 R-2/TR 3,500 – 5,500 VA Tariff rates for medium-sized household purposes
6 R-3/TR >6,600 VA Tariff rates for big-sized household purposes
7 B-1/TR 450 VA – 5,500 VA B = Business Business Tariff Customer is customers which use their electricity for either one of
Tariff rates for small-sized business purposes

8 B-2/TR 6,600 kVA – 200 kVA
many of these activities:
Buy and sell of an object, services and hospitality
Banking industry
Export/import businesses
Firms, law firm, limited corporation/ personal corporation in commerce
Stowage business whereas a part or a whole of the building were used for material savings.
Personal business or a law firm which part or a whole of its activity is selling material or services.
Other commercial businesses such as Professional Physicians
Tariff rates for medium-sized business purposes
9 B-3/TM >200 kVA Tariff rates for large-sized business purposes
10 I-1/TR 450 VA – 14 kVA I = Industry Tariff for industrial customers is the tariff charged to personal or corporation, which used electricity for its cultivation industry, beside its usage for household, social, business and public activity. Cultivation industry here stands for economical activities, which converts forms mechanically, physically, chemical or by handmade that made them gets higher value.
Tariff rates for small-scale industry purposes
11 I-2/TR 14 kVA – 200 kVA Tariff rates for medium-scale industry purposes
12 I-3/TM >200 kVA Tariff rates for intermediate-scale industry purposes
13 I-4/TT 30,000 kVA Tariff rates for large-scale industry purposes
14 P-1/TR 450 VA – 200 kVA P = Government Office and Public Street Lighting (PSL) Government Office and Public Street Lighting Customer refer to customers, who use their electricity for public utility and public activities, government activities, foreign government office facilities. Type of Tariff of P3 is type of tariff for public facilities and public street lighting facilities, to street lighting, or non commercial/non profit recreational venue/park.
Tariff rates for both small and medium-sized government offices.
15 P-2/TM >200 kVA Tariff rates for large-sized government offices
16 P-3/TR Tariff rates for street lighting purposes
17 T/TM >200 kVA T = Traction Customer Traction Customer (Type of Tariff of Traction) refer to company/enterprise which rely on public transportation which operated by PT Kereta Api Indonesia (Indonesia
Tariff rates for traction purposes intended for the National Company of Indonesian Train Railway
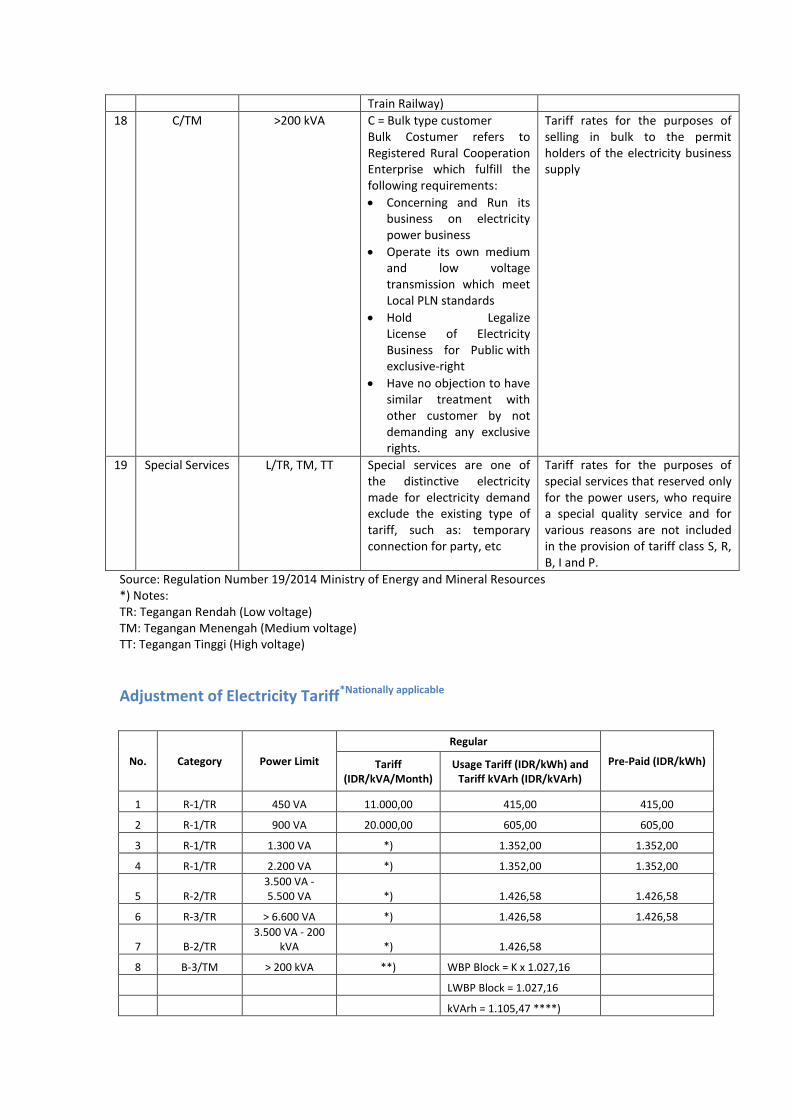
Source: Regulation Number 19/2014 Ministry of Energy and Mineral Resources *) Notes: TR: Tegangan Rendah (Low voltage) TM: Tegangan Menengah (Medium voltage) TT: Tegangan Tinggi (High voltage)
Adjustment of Electricity Tariff*Nationally applicable
No. Category Power Limit
Regular
Pre-Paid (IDR/kWh) Tariff (IDR/kVA/Month)
Usage Tariff (IDR/kWh) and Tariff kVArh (IDR/kVArh)
1 R-1/TR 450 VA 11.000,00 415,00 415,00
2 R-1/TR 900 VA 20.000,00 605,00 605,00
3 R-1/TR 1.300 VA *) 1.352,00 1.352,00
4 R-1/TR 2.200 VA *) 1.352,00 1.352,00
5 R-2/TR 3.500 VA - 5.500 VA *) 1.426,58 1.426,58
6 R-3/TR > 6.600 VA *) 1.426,58 1.426,58
7 B-2/TR 3.500 VA - 200
kVA *) 1.426,58 8 B-3/TM > 200 kVA **) WBP Block = K x 1.027,16
LWBP Block = 1.027,16
kVArh = 1.105,47 ****)
Train Railway)
18 C/TM >200 kVA C = Bulk type customer Bulk Costumer refers to Registered Rural Cooperation Enterprise which fulfill the following requirements:
Concerning and Run its business on electricity power business
Operate its own medium and low voltage transmission which meet Local PLN standards
Hold Legalize License of Electricity Business for Public with exclusive-right
Have no objection to have similar treatment with other customer by not demanding any exclusive rights.
Tariff rates for the purposes of selling in bulk to the permit holders of the electricity business supply
19 Special Services L/TR, TM, TT Special services are one of the distinctive electricity made for electricity demand exclude the existing type of tariff, such as: temporary connection for party, etc
Tariff rates for the purposes of special services that reserved only for the power users, who require a special quality service and for various reasons are not included in the provision of tariff class S, R, B, I and P.

9 I-3/TM > 200 kVA **) WBP Block = K x 1.027,16
LWBP Block = 1.027,16
kVArh = 1.105,47 ****)
10 I-4/TT > 30.000 kVA ***) Block WBP dan LWBP Block = 965,00
kVArh = 965,00
11 P-1/TR 6.600 VA - 200
kVA *) 1.426,58 1.426,58
12 P-2/TM > 200 kVA **) WBP Block = K x 1.027,16
LWBP Block = 1.027,16
kVArh = 1.105,47 ****)
13 P-3/TR *) 1.426,58 1.426,58
14 L/TR, TM, TT 1.501,46 Source: www.pln.co.id
Note: *) Minimum Account (RM) is applied. RM 1 = 40 (hours used) x Installed Capacity (kVA) x Consumption Fee **) Minimum Account (RM) is applied. RM 2 = 40 (hours used) x Installed Capacity (kVA) x LWBP Consumption Fee. Hours used : Monthly kWh divided by installed kVA ***) Minimum Account (RM) is applied. RM 2 = 40 (hours used) x Installed Capacity (kVA) x WBP and LWBP Consumption Fee. Hours used : Monthly kWh divided by installed kVA ****) Overused hour (kVArh) fee is charged in event where monthly average power is less than 0,85 K: Comparative factor between WBP and LWBP is in accordance to the local characteristic of electricity load (1,4 ≤ K ≤ 2), which is appointed by the Board of Director of State Electricity Company WBP : Peak Hour LWBP : Non peak hour Pre-paid electricity system: Customer control their own electricity usage according to the needs and
abilities. The customers also buy the vouchers electric rechargeable in advance. Then, 20-digit token number was entered into Prepaid Meter with the help of a keypad that has been available in the meter. Electricity consumption can be adjusted with the value of the voucher varies from 20.000,- IDR until 1.000.000,- IDR
Costs of Water Consumption
No. Type of Costumers Cost per Littre (IDR)
1 – 10.000 10.001-20.000 >20.000
1.A Public Hydrants 1.80 2.00 2.40
1.B Public Toilet 1.8 2.00 2.0
1.C Worship 1.8 2.00 2.0
2.A Orphanage 1.8 2.00 2.9
2.B Soisal Institution 1.8 2.8 3.9
2.C Schools 1.8 2.8 3.9
2.D Non-Permanent houses 2.00 3.6 5.1
2.E Permanent Houses 2.10 3.6 6.5
2.F Semi-Permanent houses 2.10 3.60 5.30
2.G Low – middle Income Houses 2.10 3.60 5.70
2.H Flats 3.0 4.50 5.70
2.I Government institution, Indonesian National Police, Indonesian National Armed
2.10 3.90 5.30

Forces & Sub-district
3.A Non Low – middle Income Houses
2.10 3.60 6.50
3.B College 2.40 4.50 6.50
3.C Government Institution, Indonesian National Police, Indonesian National Armed Forces City Level
2.60 4.50 6.50
3.D Hospital/ clinic 2.60 4.50 6.50
3.E Small Business 1 4.00 3.60 8.30
3.F Small Business 2 4.10 5.60 8.30
3.G Small Business 3 44.20 6.20 9.30
3.H Small industries 1 4.00 5.30 7.50
3.I Small industries 2 4.10 5.60 8.30
3.J Small industries 3 4.20 6.20 9.30
3.K Budget Hotel / Inn 4.60 7.90 11.20
4.A Real Estate 2.60 4.50 7.50
4.B Government Institution, Indonesian National Police Provincial Level
2.90 5.00 7.10
4.C Industries & Large Commercial 8.10 12.00 16.6
4.D Harbour & Airport 8.10 12.00 18.40
4.E Foreign Consulate 8.10 12.00 18.40 Source: Leaflet PDAM Tirta Mayang - Jambi
The installation of water connection is under the responsibility of PDAM Tirta Mayang Jambi :
1. The installation of the pipe in ± 20 m distances from tertiary pipe to the
costumer.
2. The installation of water measurement meter
3. Box meter, Stand Pipe.
4. And other accessories.
Meanwhile, the area responsibility of the costumer is from the connection to the installation at the house. According to PDAM Regulation of Tirta Mayang Number 1st year 2011, the installation costs of the new connection pipe are presented on the following table:
Category Note Junction Costs (IDR)
1A, 1B, 1C 2A, 2B
Public Hydrants/ Public Toilet Worship, orphanage, social institutions
850.000,-
2C, 2D, 2E, 2F, 2G, 2H, 5C
Schools, Non-Permanent house, Permanent house Non-Permanent house, Low – middle Income Houses, flats, Specific Groups (MBR)
1.200.000,-
2I, 3A, 5B Government Institution, Indonesian National Police, Indonesian National Armed Forces sub-district and distric Level. Non Low – middle Income Houses, real estate, Specific groups (settlement)
1.500.000,-

3C Government Institution, Indonesian National Police, Indonesian National Armed Forces City Level
1.700.000,-
3B, 3D, 3E, 3F, 3G, 3H, 3I, 3J, 3K, 4A, 4B, 4C, 4D, 4E, 5A
college, hospital/clinic, Small Business 1, Small Business 2, Small Business 3, small industries 1, small industries 2, small industries 3, budget hotel/Inn, Real Estate, Government Institution, Indonesian National Police Provincial Level, Industries & Large Commercial, Harbour & Airport, Foreign Consulate , Specific Groups (Main kWh meter)
2.500.000,-
Source: Leaflet PDAM Tirta Mayang - Jambi
ANNEX 5
Waste sampling activity


Sample delivered to the laboratory

ANNEX 6
Proof of electricity bill paid by Angso Duo traditional market:
January 2015

February 2015

March 2015

Proof of electricity bill paid by the traders in Angso Duo:


Laboratory Results
