fair wear foundation · the fair wear foundation has developed the fair wear ... operates in...
TRANSCRIPT

Fair Wear Foundation
Risk assessment study of Central and Eastern European Countries
Fair Wear Foundation PO Box 69265
1060 CH Amsterdam The Netherlands
Tel: +31 - (0)20 - 408 42 55 Fax: +31 - (0)20 - 408 42 54
E-mail: [email protected] Version: March 2006

LABOUR STANDARDS IN TRANSITION
Risk assessment study of Central and Eastern European Countries
Sjef Stoop/Aleksandar Stamboliev Amsterdam, March 2006 Table of Contents 1. Introduction, background to this survey ........................................................................................ 5 2. Research Framework.................................................................................................................... 6
2.1 General level of compliance....................................................................................................... 6 2.2 Institutional capacity................................................................................................................... 8
3 The garment sector ....................................................................................................................... 9 4. Specific characteristics of Central and Eastern European Countries.......................................... 11 5. Sources ....................................................................................................................................... 15 6. Comparative analyses................................................................................................................. 19
6.1 State capacity and corruption.............................................................................................. 19 6.2 Labour legislation and protection ........................................................................................ 28 6.3 Informal sector..................................................................................................................... 33 6.4 Trade unions and Industrial Relations................................................................................. 40 6.5 Average income, poverty, inequality and minimum wages ................................................. 47 6.6 Gender gap ......................................................................................................................... 59 6.7 Child labour ......................................................................................................................... 61 6.8 Forced labour ...................................................................................................................... 63 6.9 Working Time ...................................................................................................................... 64 6.10 Occupational Safety and Health.......................................................................................... 67
7. Country profiles............................................................................................................................... 79 7.1. Lithuania................................................................................................................................... 79 7.2. Bulgaria .................................................................................................................................... 80 7.3. Romania................................................................................................................................... 82 7.4. Ukraine..................................................................................................................................... 82 7.5. Belarus..................................................................................................................................... 84 7.6. Poland...................................................................................................................................... 85 7.7. Republic of Macedonia............................................................................................................. 86 7.8. Croatia...................................................................................................................................... 88 7.9. Hungary.................................................................................................................................... 89 7.10. Czech Republic ...................................................................................................................... 90 7.11. Moldova.................................................................................................................................. 90 7.12. Russia .................................................................................................................................... 91 7.13. Estonia ................................................................................................................................... 92
7. Conclusions .................................................................................................................................... 94 8. Literature ..................................................................................................................................... 96 Annex 1: Graphical representation of World Bank Governance Data................................................. 99 Annex 2: Using ILO ratifications as a measure for quantifying countries compliance....................... 101 Annex 3: Summary tables of the country profiles ............................................................................. 104
Table 1 General socio-economic situation in the country ............................................................. 105 Table 2 Human Rights Status ....................................................................................................... 107 Table 3 Trade union rights, collective bargaining and Occupational Safety & Health................... 111
2

Acronyms and Abbreviations ACTRAV Bureau for Workers' Activities (ILO) BEEPS Business Environment and Enterprise Performance Survey BGR Bulgaria BLR Belarus C(B) A Collective bargaining agreement CEB Central Eastern Europe and the Baltic states CEE Central and Eastern Europe (note, in this study this includes all European countries east
of Germany/Austria/Italy apart from quotes used from the World Bank Institute. The WBIsometimes excludes South Eastern European Countries and the Baltic, the other formerCIS countries from the CEE category)
CIS Commonwealth of Independent States CZE Czech Republic EBRD European Bank for Reconstruction and Development EIRO European Industrial Relations Observatory EPL EPL employment protection legislation EuroFound European Foundation for the Improvement of Living and Working Conditions EU-15 European Union of 15 members before the 2004 enlargement EST Estonia FDI Foreign Direct Investment FoA Freedom of Association FT Financial Times FWF Fair Wear Foundation GCR Global Competitiveness Report GLS Global Labour Survey HDI Human Development Index HR Human Rights HRV Croatia HUN Hungary ILO International Labour Organization (plenary body) or International Labour Office (the
secretariat and publisher) LC Labour code LT Latvia L(T)U Lithuania MDA Moldavia MKD Macedonia
MLSP Ministry for Labour and Social Policy NGO Non Governmental Organization NLI National Labour Inspectorate OSH Occupational safety and health POL Poland ROM Romania RUS Russia SEE South East Europe SH Sexual harassment SMS’e Small and medium sized enterprises SOE State owned enterprises
3

TI Transparency International TU Trade Union TUL Trade Union Leaders TUM Trade Union Members TUR Trade Unions rights UCW Understanding Children's Work and its Impact; a joint inter-agency research programme
ILO/UNICEF/WB UKR Ukraine UNDP United Nations Development Programme WB(I) World Bank (Institute) WB Study Enhancing Job Opportunities: Eastern Europe and the Former Soviet Union, 2005 WEF World Economic Forum
4

1. Introduction, background to this survey
The Fair Wear Foundation has developed the Fair Wear Code of Labour Practices, which was based on the ICFTU Basic Code. Companies, which become member of FWF, take on them to implement this code throughout their supply chain. These companies start a process of monitoring the labour conditions in their supplier factories. To be able to verify the implementation of the Code of Labour Practices, the Fair Wear Foundation operates in various countries where garments are being produced. In these countries, partner organisations and local stakeholders are systematically consulted about the labour conditions in the garment industry, investigations are carried out into the labour conditions and into relevant laws and regulations, audits on labour conditions are being executed in garment factories, and a complaints procedure is inaugurated. For a more detailed description of FWF's method of working, one is referred to the FWF policy document "Principles and Policies", which is posted on the FWF web site, www.fairwear.nl. In 2004 the FWF introduced the concept of ‘low-risk’ countries, being countries where the risk of serious non-compliance with the basic labour standards in garment factories can be expected to be limited in comparison to other countries.1 Member companies are not required to perform monitoring in the same way everywhere. FWF considered countries in the European Union (plus Norway and Switzerland) as regions with a relatively low risk of labour problems. Moreover, these countries generally have better guarantees of labour surveillance, in the form of trade unions, the labour inspectorate and generally accepted practices in the industrial sector. In such low risk regions member companies do not need to audit all factories every year; other tools can also be used. After the enlargement of the EU to include amongst others Poland, Hungary, Czech Republic, Slovakia, Slovenia and the Baltic Countries the question arose whether to extend FWF “low risk policy” to these countries. The FWF board took the decision to consider all 25 EU in principle as low risk countries, pending further investigation and some trial audits to test whether this decision is justified. There were two fundamental reasons for this decision. First of all auditing takes up a lot of resources in time and money. Considering the limited resources available they should be applied as effectively as possible. Secondly, there is an aspect of legitimacy to social auditing that can cause some debate. Supplier companies and other stakeholders may argue that they have the right to make their own decisions and foreigners should not intrude on that. They may point the finger to labour problems that indeed exists in the EU countries in Western and Southern Europe. Therefore one must be able to proof that in a specific country (a) the risk of level of non-compliance with the internationally accepted labour standards is substantially bigger than in the EU and (b) that there is for the time being not enough institutional capacity in and around the garment industry that can bring the labour standards up to the level that is internationally accepted as presenting the basic human and workers’ rights. It is FWF's task to assess whether there are justifications for reducing or omitting factory audits in specific regions. In order to do so, FWF will mainly examine the labour problems that occur and their severity. Individual background studies report these. This study does not replace these but it is an attempt to check whether it is possible to assess courtiers on a general level as a first step to develop this policy. It is not meant as a final assessment of the countries covered in this study, but to assess whether the concept of low risk/ high-risk countries can be made operational. The study concentrates on countries of Central and Eastern Europe. The thirteen countries analysed in the present report are
5
1 Member companies are recommended to audit factories in low risk regions when starting code implementation, and to repeat audits now and then, for example at factories where non-compliance occurs. A monitoring plan for low risk regions consists of a Questionnaire, the FWF complaints procedure, visits by the member company, to acquaint themselves with typical labour problems also using FWF's Background Studies and by contacting local persons nominated by FWF. During visits the member company discusses common labour problems, if necessary measures are taken, which will be reported (internally) in writing. Furthermore, FWF will nominate contact persons in various places in these regions, who can inform member companies about the local labour situation. They can also receive complaints from workers and pass them on to FWF.

Lithuania, Bulgaria, Romania, Ukraine, Belarus, Poland, Macedonia, Croatia, Hungary, Czech Republic, Moldova, Russian Federation and Estonia. The FWF has tentatively defined low-risk countries as those belonging to the EU-25. Thus it is of special interest to see if one can see a difference between CEE countries between the new EU members and others. Comparing audit outcomes over 2005, some indication is there already: Average issues of non compliance per supplier found during audits of FWF members in 2005 China 19 India 13 Macedonia 12 Turkey 10 Poland 9 Tunesia 7 Source: www.fairwear.nl The study was written by Sjef Stoop. During an internship Aleksandar Stamboliev collected the first body of data. He also wrote Chapter 7 on the individual country assessments. This part was finalised by the end of 2005 so it does not take into account the recent elections in Ukraine en Belarus. 2. Research Framework The objective of the assessment is to provide an assessment of the risks that major elements of Fair Wear’s Code of Labour Practices will not be complied within garment companies in specific CEE countries. This can be assessed in two different ways:
1- What is the general level of compliance with international labour standards in these countries and in the garment companies specifically;
2- What is the level of institutional capacity in and around the garment industry that can bring the labour standards up to the level that is internationally accepted as presenting the basic human and workers’ rights, how effective are systems that deal with protecting workers’ rights; like labour inspections, unions, work council systems etc.?
In this study both methods will be applied.
2.1 General level of compliance There are several ways in which the labour standards of a country can be assessed. First of all one can look at the countries legal system and its ratification of ILO and UN conventions. Although we are interested in the level of labour standards in practice, it could be argued that a comparison of labour laws can give an indication for this. But is will be crucial not to look just at the formal labour standards, as set by legislation and collective agreements (de jure), but at the actual situation (de facto). Other research (e.g. the Global Labour Survey, Freeman 2004) already found out that de jure labour regulations will inevitably diverge from de facto workplace practices. See also the Annex 2 in this report “Using ILO ratifications as a measure for quantifying countries compliance“. A similar conclusion can be drawn from Verite’s report “Emerging Markets” (2003); Research Project Year-end Report Prepared for the California Public Employees Retirement System (CalPERS) November 2003. Just like the GLS, the Verite report covers only a few countries that our research covers, but the table below, an excerpt of their study (page 11), still provides for some useful insights:
6

Ratification of core
ILO conventions (out of 4 points)
Laws (out of 10 points)
Institutional capacity (out of 6 points)*
Implementation (out of 20 points) **
Czech Rep. 3.5 8.5 4.4 17.6 Hungary 4.0 9.2 4.4 18.7 Poland 4.0 8.2 2.8 17.7 Russia 4.0 8.4 0.4 7.1 Turkey 4.0 7.4 2.0 10.6 Morocco 3.5 5.9 2.4 9.3 China 1.5 7.1 1.6 5.7 India 2.0 7.8 1.2 5.0 * Indicates whether the country has sufficient institutional capacity to monitor and enforce its labor laws and whether nongovernmental organizations (NGOs) in the country exist and are able to operate without legal or informal restrictions. ** The most important indicators for this section were the scale of the problems themselves. The first 2 columns present de jure levels. Comparing for instance China and India with Turkey we can see that even there there can be big differences between ratification of core ILO conventions and the actual quality of labour legislation. Comparing de jure with the 2 columns on the right presenting de facto again shows remarkable discrepancies. Russia stands out as being strong in de jure and weak in de facto standards. Poland’s high implementation standard compared to its relatively low institutional capacity is remarkable too. Countries with better (in the sense of protecting workers rights) labour laws do not always perform better in practice on labour standards than countries with weaker legislation. These findings are in line with Freeman’s conclusion: “Again, this is a warning that legal regulations need not tell what actually happens in work places.” This conclusion will be reinforced by our research. So how can the real, de facto, level of compliance with labour standards be measured? Since no country is entirely without problems in this respect, and since the aim of this study is to establish where the limited resources available for monitoring labour standards can best be applied, a comparative approach is needed. This means the research much use, as much as possible, quantitative and standardized measures. This is not without problems, as we will discuss in the next paragraph. Using this comparative approach should also enable us to compare the countries of this survey with the ‘Old EU’-members. This may answer the question whether or not it is justified to have specific monitoring requirements for companies in the new EU countries or in the EU-accession countries, that are not applied for any of the old EU members, even though some of these may be performing badly too. In this study we will use the following indicators to assess the compliance with labour standards.
7
Labour Standard Available Quantitative indicators of the level of compliance with labour standards
Indirect indicators
1 Employment is freely chosen/ no forced labour.
According to all studies and stakeholders concerned this is not an issue in the export garment companies of CEE
2 There is no discrimination in employment
Gender gap Gender empowerment measure
Positions of minorities
3 No exploitation of child labour
ILO /UNICEF studies and statistics
According to all studies and stakeholders concerned this is not an issue in the export garment companies of CEE
4 Freedom of association and the right to collective
Union Density CBA coverage Works place representation
Trade union pluriformity Democracy and freedom of speech indexes

bargaining systems Number of strikes Trade unions rights index
5 Payment of a living wage
Legal Min. Wage % Of working population living in poverty
GDP per capita, equality index Level of Employment Protection Legislation Human Development Index
6 No excessive working hours
Working time statistics Level of Employment Protection Legislation
7 Safe and healthy /No Physical abuse, threats of physical abuse, unusual punishments, sexual and other harassment, and intimidation
Large diversity of indicators used in European and ILO reports
Harassment/Abuse: see under 2 Level of Employment Protection Legislation
8 Legally-binding employment relationship Every worker should get a written contract and all legal social security charges should be paid.
% Of informal sector Unemployment benefits coverage
Unemployment Level of Employment Protection Legislation
Besides there is a relation between the level of labour standards and some general macro economic conditions. The GLS shows that practices favourable to workers are more prevalent in countries with high levels of income per capita. The measurement of income inequality is also of importance since according to the GLS less income inequality correlates with effective pro-labour institutions. The Human Development Index is a useful figure too to assess whether the development level of a country benefits only a few or broad layers of the population. The relevance of the labour market situation for actual labour standards is beyond dispute. But it is harder to establish clear correlations. In the GLS it was found that there is a modestly positively correlation between practices favourable to workers and unemployment, suggesting some proof for the ‘Washington consensus’ ideology of labour market inflexibility as a cause for unemployment. On a micro level however it can be argued that high unemployment may lead to a de facto lowering of labour standards because workers will be willing to take on any job and accept any kind of treatment, depending also on the level of unemployment benefits. Whether or not unemployment will lead to a weakening of trade unions in general is dependent basically on the unions’ ability to organise the unemployed. In some North European countries unions have a role in the unemployment benefit system and thus workers have an incentive to join the union when they become or fear to become unemployed. The effectiveness of union’s to protect workers on shop floor level will however most likely decrease with rising unemployment.
2.2 Institutional capacity Institutional capacity, can be defined as “Capacity of country enforcement and inspection mechanisms to monitor and enforce laws and policies on labour standards; and capacity of in-country nongovernmental organizations to operate in an unrestricted fashion in their involvement in social issues” (Verite 2003), with the addition that we include the existence and effectiveness of trade unions and other shop floor workers’ representative bodies like Work Councils explicitly under this Institutional capacity. Surveys can give indicators on trade union density, CBA coverage, and proliferation of shop floor workers representation. State effectiveness is measured by indicators such as: rule of law, control of corruption, regulatory quality, and government effectiveness. The World Bank provides for quantitative indicators for these issues, as does Transparency International on corruption.
8

In can also be argued that the capacity of government to protect labour rights, will be strengthened by an effective system of checks and balances in a society, by freedom of speech, etc. This will also enforce freedom of association. Hence the World Banks ‘voice and accountability ‘ is an indicator that is important for our survey too. The European Bank for Reconstruction and Development, (EBRD) in its 2005 Transition report presents a detailed analysis of environmental inspections in transition countries. By lack of a similar report on labour inspection, we will use this study too for the measurement of institutional capacity. The importance of the informal sector will by definition decrease institutional capacity and thus has a negative impact on labour standards. The only counter argument to be considered her is that a large informal sector, when this means possibilities to earn an income outside the labour market may decrease the wage dependency and thus decrease the need for workers to take on any job. Finally, the level of inflation might be an important contextual variable. It has an influence on state capacities (and might even be seen as an indicator of this); it has a direct bearing on the income security of the population. This will not be an item of the comparative part of this study but it will figure in the country profiles. To sum up, this research will use a wide range of indicators: Direct quantitative indicators relating to specific labour standards2
Gender gap/Gender Empowerment Measure (discrimination); trade union density, CBA coverage, proliferation of shop floor workers representation (FOA, Collective bargaining); Minimum wage and poverty line (living wage), working time indicators, accidents at work (OHS), incidence of Child Labour.
General quantitative indicators relating to labour standards Wealth and distribution: GDP per capita (PPP US$), Level of minimum wage, Average Gross wage, Percent of population below poverty line; Human Development index (HDI) rank / value; Unemployment; Social Insurance coverage, Employment Protection Legislation, Size of the informal economy.
Indicators of institutional capacity EBRD environmental inspections analysis; Bribery; World Bank indicators for: rule of law, control of corruption, regulatory quality, government effectiveness; voice and accountability; freedom of speech, trade union density, CBA coverage, proliferation of shop floor workers representation.
Qualitative indicators: Trade union pluriformity; Positions of minorities; Human rights record; status of the Judiciary system; Reported issues on FOA
This study contains two parts. The first part is a comparative study on some crucial indicators, the second part contains a detailed factual comparative description of each of those countries is provided in the second part of this report. This overview aims to point out some of the major issues, problems and recent trends that have emerged in the region. Before we get to these parts however, we must first look at some specific characteristics of the garment sector and of Central and Eastern European Countries to be able to put a right perspective on what is to follow.
3 The garment sector This report has looked at general trends and average figures for every country. The situation in the garment industry may well be different from the general picture. This sector does not require large investment. For manufactures it also does not require to have marketing channels or skills to enter western markets, since most manufactures are enlisted into the international supply chain by buyers (brands or retailers) that are always looking for sources that can provide for even lower costs of production. Since labour costs are the major component of production costs, this sector provides for many countries with low-income levels an opportunity to enter export
9
2 See also www.trikat.com/WEBMILS/
markets. But since the barrier of entry is quite low, there is very strong competition between companies and countries to attract foreign orders. The dominant system in CEE countries is the ”lohn system” or outward processing. Fabrics are sent in to be cut and further processed into garments. Manufactures do not buy the fabric themselves; the buyer only pays for the cut-make-trim activities. These new export garment factories either resulted from privatisation of former state companies. In general these are small left over from large conglomerate that both were textile and garment producers. Most over the largest part of these conglomerates have gone into liquidation and, often literally only a small corner of the giant sites is still in use for producing export garments. Other garment factories are totally new companies set up after the collapse of communism, in some regions by foreign investors. This can be 100% foreign owned or joint ventures with local investors. The few state owned factories that remained are more often than not producing for domestic markets. The majority of workers in this industry (more than 90%) are women. Wages in the sector are amongst the lowest in every country (in majority of cases no more than minimum legal wage), working conditions are very precarious. The trade union movement is very weak in the garment industry of most countries since it was in many cases traditionally centred on heavy industry and on male workers. In many of the newly created companies/sweatshops the workers’ right to organize is “unofficially” denied. Since buyers are in the dominant position and the markets are volatile, order patterns are very irregular. Because workers are in a weak position the burden of this is shifted to them, leading to irregular working times, much overtime in some periods, often non-paid extra work hours. According to the WTO, the textile and clothing sector has grown very fast in more developed countries that have entered into preferential agreements with the EU or the US or both (e.g. Bulgaria, Lithuania, Macedonia and Jordan (WTO 2004). For the more traditional the textile and clothing centres they gave the following figures: Employment in textile and clothing (thousands) 1995 1996 1997 1998 1999 2000 2001 2002 Textiles Czech Republic 100 86 90 86 74 79 76 72 Poland 159 153 146 128 108 97 88 N/A Romania 186 189 159 128 105 94 98 91 Clothing Czech Republic 50 52 49 50 47 41 37 36 Poland 240 260 254 259 225 211 194 N/A Romania 189 203 181 246 240 261 290 302 Italy 274 243 235 229 209 206 206 198 Portugal 143 131 124 176 164 156 151 143 Spain 117 114 120 111 126 123 125 116 United Kingdom 173 165 163 159 133 109 88 78 It can be clearly seen that the garment industry is in decline in Czech Republic and Poland. In Romania the industry grew, at least until 2002, employing more people than in the main old EU producers like Spain and Portugal. In relative terms clothing is most important to Macedonia, accounting for 30% of its total merchandise exports. According to the UNCTAD trade figures, in absolute terms the largest exporters are Romania, Poland, Bulgaria, and Lithuania. Slovakia, Croatia, Ukraine and Hungary also have substantial exports. (http://stats.unctad.org/Handbook/TableViewer/tableView.aspx?ReportId=135) The situation may have changed drastically since 2005. As destination for Foreign Direct Investment in textile and garments, Bulgaria and Hungary figure amongst the highest ranked countries: FDI Projects in textiles and clothing manufacturing, 2002-2004, by host country (number of projects; %) China 48 Bulgaria 18
10

USA 16 Hungary 13 Brazil 12 Viet Nam 8 India 9 Thailand 8 France 8 Poland 7 Uzbekistan 7 Morocco 6 Slovakia 6 Mexico 6 Croatia 6 Russian Fed. 6 Other host countries 97 Source UNCTAD: TNCs and the Removal of Textiles and Clothing Quotas, UN 2005
4. Specific characteristics of Central and Eastern European Countries. The former communist countries have some characteristics that distinguish them for many other Middle Income or Developing Countries. True, many of the former communist countries have a similar dual economy that is characteristic of most developing countries with a large informal sector, a small core of urban workers that are protected by labour laws and/or unions and a large pool of un- or underemployed ready to take any opportunity to improve their economic position. But on top of that they have more rifts that divide their societies. There is the existence of a market economy besides state owned enterprises. Even in the new EU members that have more or less completed the transitions to a market economy, there are State owned enterprises (SOEs) and former SOEs that have strong unions and other institutes to protected labour, a newly started private enterprises where unions are almost absent. Therefore, all the quantitative data that are presented in this study must be interpreted with great care. We will show time and again that figures from ‘authoritive sources’ often contradict each other. Besides one must keep in mind that many of these figures are 2-5 years old before they appear in international statistics and reports. Since these countries are in transition a lot can and will have changed since then. On top of that, transition is not an even and smooth process, all the more so since it is a complex of many different processes of change: change from a planned economy to a free market economy, a totalitarian state to a democratic rule of law, and sometimes a process of long overdue modernisation of neglected rural areas; and all this combined with the processes of change that are not unique to CEE countries like globalisation and de-industrialisation. Transition also affects different actors, different sub-systems of society and different regions to a different extent and with different speed. Elements of postmodern service societies can be found alongside elements of feudal, pre-industrial societies and remnants of the more recent communist past. This makes for instance the informal economy a complex issue: partly stemming from rural traditions, the traditions of barter and muddling through in a planned economy and partly connected to flexible global supply chains as will be discussed below. The rifts in the economy and society and the transformational nature of institutions imply that one should be careful in using average figures as a tool for understanding the position of different groups of workers. For instance the report ‘Working conditions in the acceding and candidate countries’ (European Foundation for the Improvement of Living and Working Conditions, 2003), provides for an enormous amount of data on working time, OSH, discrimination and more topics related to this survey. But since these figures are not corrected for differences in employment structures (e.g. differences in magnitude for heavy industry, agriculture or services), their usefulness is limited for comparing countries records in complying with OSH or working hours labour standards.
11

Other reasons why we should be careful too in using averages that are specific for this study are: (1) garment workers often belong to the lowest paid workers and weakly unionized groups, (2) the garment industry is often close to the informal sector (3) garment regions are often located in the poorest regions so it is also important to consider the regional differences within countries. Especially in Poland and Bulgaria there are marked regional differences unemployment rates. It would be much easier if we had specific data on garment factories and garment workers, but these are hardly available. Where these data are available and relevant, we have added them in the different chapters to follow. In these kind of fast changing societies statistical concepts easily loose their meaning because the underlying reality has changed. The concept of ‘informal economy’ provides for an interesting example in this, as Musiolek (2002) shows. She argues that formality and informality in transitional societies are inevitably a mixture of existing and new patterns; in the region, they are mixtures of features typical for developed and developing economies. They can only be understood in their unique transitional nature that defies a simple comparison with "known" phenomena in other countries. Informal employment is - maybe more than in any other region - by no means a distinct entity. There is no clear border between a "formal", "organised" and an "informal", "unorganised" sector, as it is the case in so-called developing countries. The "explosion" of informality in the region has developed in two waves: In early 90s, a fierce economic, financial and social crisis followed the "shock therapy" of transition. The de-industrialisation and de-agriculturalisation of the economies, which created a situation of widespread unemployment from previously full employment within a few years, devaluation of the currencies and often hyperinflation with subsequently eroded purchasing power of wages, introduced poverty to a majority of the populations. The UNDP called this change the "most acute poverty and welfare reversal in the world". For these reasons, people were forced to look for income alternatives in informal and subsistence activities. Since the late 90s, transition processes have converged more intensively with globalisation and EU-integration. Factors that cause more informal and non-standard employment worldwide also become increasingly relevant in the region. Globalisation is commonly related to the search for more flexible forms of labour to sustain a competitive edge. Labour markets have been deregulated; the mobility of capital increased and global commodity chains have been restructured. The region has become a preferred target for production relocation, outsourcing, subcontracting and assembly production/outward processing trade for Western European companies and markets. All these processes have commonly been linked with a new wave of informal work arrangements. Globalisation pressures add to transition problems. The dramatic downsizing of the public sector and social services e.g. has been seen as an inevitable result of both globalisation and transition. It has gendered impacts; the UNDP reported that the CEE/CIS region is the only region in the world where there is a considerable increase of women's household/reproductive workload while their participation in the labour market remains high and their contribution to the household income is badly needed. Available evidence suggests that the economic recovery in terms of GDP growth that occurred in some countries did not lead to a decrease in informal employment and could not absorb the high unemployment. Women are less likely to get well protected and well remunerated employment in the emerging private sector, but are more likely to work in informal arrangements well below their generally high levels of formal education. Women are also more likely to be subject to violations of labour rights. (End of quotes from Musiolek) Also in these kind of rapidly broken up societies national averages loose their ability to indicate what is happening because they do not show the differences between regions, sectors, social groups, etc. An example of this is the problematic issue of union density. The World Bank Institute (Enhancing Job Opportunities: Eastern Europe and the Former Soviet Union, 2005) concludes for all former communist countries: “Despite declining membership, union bargaining strength in specific sectors has remained relatively strong. Examples include natural monopolies, transport, heavy industry, and mining, which have been more likely to stay in public ownership. In contrast, expanding sectors comprising largely private enterprises, such as trade, business, and personal services, have tended to have much lower union presence. Similarly, union presence in newly created small and medium enterprises is low. State-owned firms (which have higher union density) consistently have a greater share of firm surplus devoted to wages, reflecting insider bargaining power relative to both the
12

privatized and de novo private firms. This pattern has been found in analyses of Bulgaria, Poland, and Russia.” Another element that might be a heritage of the communist era is the lack of reliable statistics in many countries. For a number of the countries in this survey it is very hard to get by comparable and reliable data on basic issues such as unemployment, average wages per sector, let alone more complicated issues such as the size of the informal economy. Since communism was not just an economic model, but also a political, social and one could even say a psychological model, the transition affected many levels. But the transition at one level, for instance that of institutions did not necessarily catch up with other levels, like that of the economy. As an example we might again refer to the issue of the trade unions. Many observers distinguish between the so-called new and old unions. “New unions were perceived as unions that emerged independently, often in the political underground, towards the end of the Communist era. Leaders among them were Poland’s NSZZ Solidarnosc, Bulgaria’s Podkrepa, Hungary’s Liga and Romania’s Fratia. These trade unions received substantial support, particularly from American resources, as well as European trade unions and foundations. None of these trade unions grew to become the largest and the most representative trade union in their respective countries; instead, they remained relatively small. (…) By the mid-1990s, more tolerant relationships between the so-called old and new trade unions started developing, particularly as some new people appeared at the head of the so-called old reformed trade unions. However, in many trade unions, particularly those that call themselves reformed, there remain old trade union leaders, and old, Communist patterns of thinking and behaving. Older trade union cadres are to be found mainly at the level of branch federations, that suddenly declared autonomy and are behaving in a rather feudalist manner, refusing joint integration with other unions. Many things are indeed changing, however. Recently, for example, in the area of former Yugoslavia, numerous charismatic trade union leaders that came to power during Communism lost their leading positions. Thus, in a democratic fight, a Bosnian and Herzegovinian trade union leader lost his position. In April, the Macedonian leader similarly lost a democratic contest, and just recently, the Kosovar leader withdrew from the electoral run at the last moment by resigning. Similar changes have been noted at the head of the Romanian CNSLR-Fratia and the Moldavian FGSRM. “ (Quoted from Multinational Monitor, May 2002-VOLUME 23/5: An Interview with Jasna Petrovic, editor in chief of the International Confederation of Free Trade Unionsí Central and Eastern Europe Network Bulletin.) The break up of the old communist model meant for many of the countries of this survey also the building of new states within new geographical boundaries and building new states. The Baltic States had been annexed by the Soviet Union in the early forties, and gained independence only in the early nineties. Soviet law applied in these countries until independence. “With regard to international obligations vis-à-vis the ILO, the three Baltic States considered that they were not bound by the conventions that had been ratified by the former Soviet Union and applied in their territory prior to independence; instead, they confirmed their acceptance of the conventions they had ratified as independent ILO Members before occupation by the Soviet Union30, and examined the remaining conventions on an individual basis. Slovenia followed an approach different to that of the Baltic States, as it accepted the international obligations that applied in its territory before it declared independence from Yugoslavia; it also continued to apply former Yugoslav law, which it has progressively replaced by new legislation. Likewise, the Czech Republic and the Republic of Slovakia also confirmed the validity of both the international obligations and the federal legislation that applied in the territory of the former Czechoslovakia before it split into two countries. “(ILO Bronstein 2003) Apart from this there are also important differences between sub-groups. First of all there is the element of pre-communist history. Before 1940 for instance what is now the Czech Republic was a highly developed industrial region with over 40% working in industry, compared to for instance 10% in Bulgaria (Rothschild 1974).
13
Secondly there are political and socio-economic divisions of more recent nature. It is usual to distinguish our current survey group into: (1) EU Members: Poland, Hungary, Czech Republic, Slovakia, Slovenia and the Baltic Countries; (2) EU candidates or EU-accession countries: Romania, Bulgaria, Croatia. (3) South East Europe/Former Yugoslavia: Macedonia, Serbia and Montenegro,

Federation of Bosnia and Herzegovina. (4) Former Soviet Union States: Ukraine, Belarus, Russian Federation, and Moldova. Given the aim of this survey, we are especially interested to see if there is a marked difference between the labour standards performance of the in EU countries and the others. A last element that distinguishes the countries from this survey is that all of them have gone through a very serious crisis. Instead of the almost continuous, even if at times very modest, improvement of average income per capita that many Asian and EU countries have experienced, the people in these countries had to deal with a hugh decline in income, made even worse by a total collapse of their social institutions that were meant to protect the poor. This has led to a sharp increase in inequality. The situation in the CEE countries was in many cases much worse than that of the leading Western economies in the 1930s as the table below shows:
The Transition Recession
Countries Consecutive years of output decline
Cumulative output decline (percent)
Real GDP 2000 (1990 = 100)
CSB 3.8 22.6 106.5 Albania 3 33 110 Bulgaria 4 16 81 Croatia 4 36 87 Czech Republic 3 12 99 Estonia 5 35 85 Hungary 4 15 109 Latvia 6 51 61 Lithuania 5 44 67 Poland 2 6 112 Romania 3 21 144 Slovakia 4 23 82 Slovenia 3 14 105 CIS 6.5 50.5 62.7 Armenia 4 63 67 Azerbaijan 6 60 55 Belarus 6 35 88 Georgia 5 78 29 Kazakhstan 6 41 90 Kyrgyz Republic 6 50 66 Moldova 7 63 35 Russian Federation 7 40 64 Tajikistan 7 50 48 Turkmenistan 8 48 76 Ukraine 10 59 43 Uzbekistan 6 18 95 Output decline during the Great Depression 193034 France 3 11 N/A Germany 3 16 N/A United Kingdom 2 6 N/A United States 4 27 N/A Source: World Bank 2002: Transition, The First Ten Years. The graph below shows the wage development for 6 countries. By 2001 only Croatia, Czech republic and Poland had at least regained the level of the 1989 wages.
14

Source H.J.M. Fenger: Trade Unions and Welfare Reform in Central and Eastern Europe, 2004, https://ep.eur.nl/bitstream/1765/1755/2/NIG3-02.pdf Although the gap in GDP per capita between Western and Eastern Europe had already been increasing since the 1950, the increase in the 1990s was without precedent. GDP per capita as a % of Western Europe 1950 1962 1973 1990 2001 Eastern Europe 46,15 43,26 43,22 34,01 30,61 Former USSR 61,69 54,98 52,52 42,98 24,14 Source Maddison, A., The World Economy: A Millennial Perspective, OECD, 2001..
5. Sources In the first part of this study we use databases containing international quantitative data that can provide for comparisons between the different countries. It can be said that this report, especially for these comparisons, relies heavy on data from Western organizations like the World Bank, US State Department and even CIA (the last one for factual information only), and also less controversial organisations like ILO and the European Foundation for the Improvement of Living and Working Conditions. The reason for this is that one needs a consistent structure so that every country is assessed in a similar way. The most elaborated figures are the World Banks governance indicators. It is worthwhile looking at them in some more detail to show the limitations and possible biases of these data. The WB presents six governance indicators 1. Voice and Accountability – measuring political, civil and human rights 2. Political Instability and Violence – measuring the likelihood of violent threats to, or changes in, government, including terrorism 3. Government Effectiveness – measuring the competence of the bureaucracy and the quality of public service delivery 4. Regulatory Burden (also used as Regulatory Quality)– measuring the incidence of market-unfriendly policies 5. Rule of Law – measuring the quality of contract enforcement, the police, and the courts, as well as the likelihood of crime and violence 6. Control of Corruption – measuring the exercise of public power for private gain,
15

including both petty and grand corruption and state capture. The WB estimates of governance are based on a large number of individual data sources which provide them with information on perceptions of governance. These data sources consist of surveys of firms and individuals, as well as the assessments of commercial risk rating agencies, non-governmental organizations, and a number of multilateral aid agencies. For this round of the governance indicators, WB relies on a total of 352 individual variables measuring different dimensions of governance. These are taken from 37 different sources, produced by 31 different organizations. “Several of our data sources are surveys of individuals or domestic firms with first-hand knowledge of the governance situation in the country. These include the World Economic Forum’s Global Competitiveness Report, the Institute for Management Development’s World Competitiveness Yearbook, the World Bank’s business environment surveys, and a variety of global polls of individuals conducted by Gallup, and others.” (Kaufmann et al 2005b). They also capture the perceptions of country analysts at the major multilateral development agencies (the European Bank for Reconstruction and Development, the African Development Bank, the Asian Development Bank, the UN Economic Commission for Africa, and the World Bank), reflecting these individuals’ in-depth experience working on the countries they assess. Other data sources from NGOs (such as Amnesty International, Reporters Without Borders, and Freedom House), as well as commercial risk rating agencies (such as EIU and DRI) base their assessments on a global network of correspondents typically living in the country they are rating. (Kaufmann et al 2005b). Note the absence of unions or ILO. In general one can clearly see that most sources are business linked or at least ‘business friendly’. Especially since the three main sources of firm-level survey data are the Geneva-based World Economic Forum’s Global Competitiveness Report, the Lausanne-based Institute for Management Development’s World Competitiveness Yearbook, and the Washington-based World Bank’s business environment surveys. (Kaufmann et al 2004) The WB acknowledges that this can lead to potential ideological biases: “A potential drawback of subjective data from polls of experts is that this kind of data may reflect the ideological tendencies of the institutions compiling the performance ratings. Our prior has been that this is not a major concern for the sources on which we rely. This is because we find a very high degree of correlation among virtually all of our sources, which is difficult to reconcile with a systematic ideological bias among certain sources. “ Of course it can also be said that this correlation may reflect that almost all sources have the same business bias. The WB however presumes that business in general has no specific ideological leaning: “Our identifying assumption is that surveys of firms (…) are not tainted by ideology, since they reflect the views of a large number of respondents in each country.” (Kaufmann et al 2004) Still the WB Governance indicators have a much broader base than for instance the European Bank for Reconstruction and Development (EBRD) Transition Report, whose ratings are primarily based on the assessments of EBRD staff based in London and the State Department component of our Human Rights measure reflects the views of U.S. State Department employees. (Kaufmann et al 2004) The WB stresses time and again “that individual sources of governance data are imperfect and provide only noisy signals of unobserved governance. We emphasize at the outset that this problem is not unique to the subjective or perceptions-based measures of governance on which we rely. Rather, it is pervasive in all efforts to measure governance, or any other socioeconomic variable for that matter.” (Kaufmann et al 2005a) Another problem that we will encounter in many surveys is that “ostensibly identical survey questions are interpreted differently by respondents with different cultural and/or socioeconomic backgrounds, it can be difficult to make cross-country comparisons using survey responses. For example, it is easy to see how responses to a question on the prevalence of “improper practices” can be affected by country-specific perceptions of what such practices might be.” Although the WB figures are clearly based on a specific ideology, like good regulations are market friendly regulations and corruption is only a problem if it hinders business, the risk of a potential political bias in using these sources can be expected to be limited. Freeman (2004) compares his 2004 Global Labour Survey (GLS) (an Internet-based survey that seeks to measure de facto labour practices in countries around the world, covering issues such as freedom of association, the
16

regulation of work contracts, employee benefits and the prevalence of collective bargaining) with other efforts to measure labour practices as part of surveys of economic freedom (Fraser Institute) and competitiveness (World Economic Forum). Although the GLS pool of respondents (labour practitioners, ranging from union officials and activists to professors of labour law and industrial relations,) differs greatly from the conservative foundations and business leaders who contribute respectively to the Fraser Institute and World Economic Forum reports, “the GLS and the labour market components of the economic freedom and competitiveness measures give similar pictures of labour practices across countries. This similarity across respondents with different economic interests and ideological perspectives suggests that they are all reporting on labour market realities in a relatively unbiased way.” Freeman notes: “This reflects well on the validity of all of the studies, suggesting that they tap a common component of information on labour market conditions rather than hinge on the right-left or labour-management views of respondents. However we have tried to be aware of any structural biases and noted these where we suspected them. The second part of this study consists of a country profiles, that are summarised in the tables of Annex 3. We had no resources to conduct a large questionnaire based survey. This survey is based on desk research, deliberately limiting us to international sources that could provide for systematic comparative analysis. This was also due to the limited success of an earlier stage of the research process in which different institutions were contacted in the countries of this survey and as well representing those countries:
• The Netherlands embassies in the selected countries. Six out of thirteen replied providing partly or full answer to the questionnaire, from their own sources or they have point out the most suitable data sets.
• The embassies of those countries represented in The Netherlands. Four of them replayed, mostly pointing out other sources.
• The Helsinki committee and some other local human rights organisation. Only few of them replayed without any precise answer about the human and workers right’s status in those countries. Some even point out other sources.
• Trade unions, represented in those countries. Almost all existing trade unions were contacted, trying to get clearer picture about the workers rights in those countries, but unfortunately none of them even replayed.
• Several ministries of Labour and Social policy were contacted. During the writing of this report, no answer was received.
• Several National labour inspectorates were contacted, but only Polish and Bulgarian provide us with some information’s.
• National Foreign Investment Agencies were contacted with some poor data received by their side.
All in all, the received data were not very useful for making in dept and comparative analyse and therefore we moved to the next step that included checking the data from international organisation’s with aim to get unified data per country. Apart from numerous studies from ILO, IMF, World Bank Institute, European Bank for Reconstruction and Development, European Industrial Relations Observatory and European Foundation for the Improvement of Living and Working Conditions, the following institutions were used as a base source for the survey (data per tables / columns as well as chapters): 1. The International Confederation of Free Trade Unions (ICFTU), Country’s reports for 2004. This
source was mostly used for the data submitted in table T. 17. The data were mostly related to the existing legislation towards trade unions existence and their member’s rights, freedom of association and collective bargaining and how that legislation is implemented in practise.
2. Conclusions from the International seminar “Working conditions and labour market in Central and South-Eastern European countries under the context of globalisation” Bucharest, 15 – 16 April 2004. This source was mostly used for the data submitted in chapter 5 (http://www.evkb.org/aidrom/docs/Raport%20Work%20Cond.doc and http://www.ilo.org/public /english/region/eurpro/budapest/social/safety_cd/seminar/bulg.htm).
3. United State of America, State Department, Human rights country’s reports for 2004. This source was mostly used for the data submitted in columns 3, 4, 8 and 9, part of table T. 15. partly for
17

table T. 17 and as well as for getting clear perception of the human right status in the country’s analyses.
4. International Labour Organisation (ILO) was consulted for getting the general overall picture of the labour standards in the region as well for the data in table T. 16. Column 16.
5. Central Intelligent Agency (CIA), World Fact book for 2003 – Their data were used for columns 1, 2, 5, 6, and 7, part of table T. 15.
6. World Bank Institute survey, Aggregate Governance Indicators 1996-2004. The governance indicators presented here reflect the statistical compilation of responses on the quality of governance given by a large number of enterprise, citizen and expert survey respondents in industrial and developing countries, as reported by a number of survey institutes, think tanks, non-governmental organizations, and international organizations. This source was used for the data submitted in table T. 18.
7. UNDP World development report 2005 The human development index (HDI) is a composite index that measures the average achievements in a country in three basic dimensions of human development: a long and healthy life, as measured by life expectancy at birth; knowledge, as measured by the adult literacy rate and the combined gross enrolment ratio for primary, secondary and tertiary schools; and a decent standard of living, as measured by GDP per capita in purchasing power parity (PPP) US dollars. The index is constructed from indicators that are currently available globally using a methodology that is simple and transparent. While the concept of human development is much broader than any single composite index can measure, the HDI offers a powerful alternative to income as a summary measure of human well-being. It provides a useful entry point into the rich information contained in the subsequent indicator tables on different aspects of human development. This source was used for the data submitted in table T. 15, columns 10 and 11, as well for table T. 16 columns 14 and 15.
18

6. Comparative analyses
6.1 State capacity and corruption One of the issues that have been much researched over the past years, leading to many comparative benchmarks and figures is the issue of governance. A special focus of these studies is the measurements of corruption. We will take these studies as indicators for state capacity, because corruption seriously weakens any state capacity to implement its laws. At the same time we should bear in mind the warning of Daniel Kaufmann, director of global governance at the World Bank Institute who was quoted by the FT as saying that, despite TI's (and others’) keenness to publish its results in league table form, "no international indicator of governance, corruption or the business environment can be used for precisely ranking countries from best to worst". (Taken from Development Gateway, November 4, 2004). Secondly corruption is for any verification initiative an important issue to pay attention to because its own work may be affected by it. And thirdly, by comparing different studies we can also get some insights in the reliability and ideological distortions of some different agents publishing surveys. We will start with this last element. “The most frequently used index of corruption is Transparency International’s Corruption Perceptions Index, which is a survey of surveys based on outside assessments of corruption and on a particular methodology subject to changes over time (as well as its country coverage, which even though it has grown over the years, currently covers only about one-half of all countries for which there is data). At any rate, any such aggregate comparative index will have serious limitations in diagnosing in-depth governance and corruption challenges within a country.” (Joel S. Hellman et al, EBRD and the World Bank 2000). This quote, taken from the one of the many papers by the EBRD and the World Bank on corruption, points to the second body of data on corruption. Although much more detailed and more systematic, these data however also have their shortcomings. Their data, like TI’s, are also based on surveys. In line with the World Banks ideology in which the state almost by definition is seen as a negative element in the economy, ‘a grabbing hand’, corruption was narrowly defined by them as the ‘abuse of public office fro private gain’. Hence any payments from companies to private agents, for instance for providing a certificate that the legally required OSH training has taken place, are excluded. Corruption of trade unions is also not surveyed. Corruption is measured by perception, mostly by surveys asking business in a certain country if corruption is a problem for them, thus not measuring any type of corruption that is ‘helpful’ to business; for instance paying a bribe to a fire safety inspector may be much cheaper than to install a fire escape. Thus the ones that pay the bribes are seen as victims, the state that is corrupted by bribes as the culprit. This may most often be the case for individual citizens that have to pay bribers to get health service, a licence or a space to life, but for business “the original motivation for bribing officials is not to defend some legal right of theirs, as with the ordinary citizens, but to obtain “favors”, such as short cutting existing laws and regulations.” She also states “Business-related corruption may be the one involving the largest amount of money, but corruption related to everyday life and the public service, which the administration is supposed to deliver, is the one burdening people.” (Mungiu-Pippidi 2003). In the most recent Transition Report the EBRD states “firms that bribe tend to have a better level of performance. This implies that firms gain some advantage from corruption (even though it is detrimental to the performance of the economy as a whole) or that government officials — the main beneficiaries of bribery — tend to target better-performing firms.” The conclusion to be drawn from the first possibility is that corruption should not be measured by asking firms whether corruption is a hindrance to business, but the Bank has not yet adjusted its methods.
19
In the same line, while ‘measuring’ regulatory quality the World Bank and EBRD ask for ‘obstacles’ for business start ups, without considering that it may be a public good that a state has a reliable way to check before a business starts on things like the safe construction of the building where people

have to work. Since we are interested in corruption because it weakens seriously any state capacity to implement its labour laws, the figures derived for these surveys need to be used with much care. Only in recent publications, the WBI criticizes the fallacy to focus solely on the failings of the public sector (GCR (Kaufmann) 2005:88), and recognises that the private sector is an active player too in the corruption game and that the “rules of the game” may have been captured by the elite (so-called state capture). (GCR 2004:83). It has taken them a long time to accept that “ the reality of corruption is two-fold: first, it most often involves collusion between at least two parties, typically from the public and private sectors, for a corrupt act to take place; second, where the rules of the game, laws and institutions have been shaped, at least in part, to benefit certain vested interests, some forms of corruption may be legal in some countries. (GCR 2004:90). Other agents collecting data, like the World Economic forum, Freedom House ad the EBRD have not yet come to the same conclusions. An interesting analysis of the relation between transformation, state capacity, and corruption in the field of factory inspections can be found in the Transition report 2005 of the European Bank for Reconstruction And Development. The report contains a special section on environmental regulation. Although FWF does concentrate on labour issues and has excluded environmental issues from its standards, this analysis may serve as indicator since there seem to be no similar report on labour inspections. However one should bear in mind that the countries concerned had a long tradition in care for health and safety issues, much more developed than the care for environmental issues. The EBRD analyses: “During the transition process, most countries have revised their environmental policies and developed new programmes, often in the context of National Environmental Action Plans. However, implementation has generally been slow. Only in the more advanced transition countries have governments and the business sector been able to commit funds for environmental protection. Elsewhere, the environmental situation has not improved and in some cases has deteriorated. For the countries of central Eastern Europe and the Baltic states (CEB) and the EU candidate countries of south-eastern Europe (SEE-3), the prospect of EU membership and the need to adopt and implement EU standards and legislation have been the impetus for reform. Countries have taken steps to build capacity by developing new legislation, strengthening institutions, introducing innovative policies and encouraging public participation. Nevertheless, the weakness of enforcement agencies and the low level of penalties continue to be a problem. In the other countries in south-eastern Europe (SEE-4), too little attention is still being paid to environmental enforcement and institutional capacity. Some of the common difficulties include a lack of human, technical and financial resources and weaknesses in the regulatory framework. Also, a high degree of discretion enjoyed by inspectors leads to arbitrary enforcement and encourages corruption. Institutional weaknesses and implementation problems are also prevalent in the Commonwealth of Independent States (CIS). New policy and legal frameworks have often inherited old practices from the central planning era, adopting ambitious and unrealistic standards with insufficient monitoring or enforcement. As a consequence, the communist culture of non-compliance has tended to prevail. Environmental inspections in transition countries are not very frequent; 74 percent of the enterprises participating in Business Environment and Enterprise Performance Survey (BEEPS) were not inspected on environmental grounds in the 12 months prior to the survey, 16 per cent of firms were inspected once and 10 per cent more than once. However, there was considerable variation between countries. In Moldova and Tajikistan, for example, over 60 per cent of firms reported at least one inspection in the previous 12 months (see Chart:).
20

Taken from EBRD, Transition Report 2005 More frequent inspections do not necessarily imply more effective enforcement. In Germany, for instance, only about 6 per cent of firms are inspected at least once each year. Nevertheless, regulatory oversight may well be more effective in Germany than in Moldova or Tajikistan due to the thoroughness of inspections, a consistent stance against non-compliance, a well developed compliance culture and a lower incidence of corruption. The likelihood of bribing officials increases according to the length of time spent on environmental inspections although overall corruption levels also play a role. This suggests that bribery is not used by firms to avoid inspections or lighten the regulatory burden. Rather, bribes are used to avoid or reduce costly fines for non-compliance. The incidence of bribery is highest in environmentally risky sectors and in countries where inspections are frequent but it is also closely linked to the overall level of corruption in the country. Environmental regulation (in the CIS) is characterised by an overly complex structure and a lack of transparency and consistency, making enforcement and the development of a “compliance culture” more difficult. The BEEPS suggests that, while the frequency of inspections is relatively high in many CIS countries, the duration of inspections is short and bribery is prevalent (although no more so than in other areas). (End of quotes from EBRD) Before turning to the available measurements of corruption, we can look at some figures showing how bribery in the sectors that relate to FWF’s work (like Health and Safety or Fire Inspections) compare to the overall picture of corruption. The next table shows different types of bribery. In the context of this study especially bribing Health/Fire Inspectors is of concern: this is a relatively large amount of all bribes in Lithuania, Belarus, and Russia:
21

The average proportion of bribes spent on each 'service'
Country
Connection to Public services Licenses Taxes
Government Contracts Customs Courts
Health/ Fire Inspectors
Influence Legislation Other Total
Armenia 10.9 9.8 30.6 5.8 14.0 4.7 2.9 3.2 18.0 100.0Azerbaijan 9.2 20.2 31.6 17.4 8.6 6.0 4.3 2.4 0.1 100.0Belarus 9.6 30.4 28.2 7.3 7.1 3.6 13.6 0.2 0.0 100.0Bulgaria 17.7 22.6 14.1 6.6 11.9 13.6 8.2 2.8 2.6 100.0Croatia 9.1 6.7 7.3 44.7 10.7 8.8 4.1 4.0 4.5 100.0Czech Republic 8.3 16.3 7.2 43.0 6.4 6.5 9.2 1.6 1.6 100.0Estonia 2.0 26.5 6.4 34.5 15.2 2.5 4.2 5.9 2.8 100.0Georgia 11.0 18.3 29.3 3.6 9.6 11.3 10.4 6.6 0.0 100.0Hungary 7.3 43.6 10.9 11.1 14.2 3.1 3.3 1.4 4.9 100.0Kazakhstan 10.7 23.2 20.3 5.3 14.4 12.7 9.5 1.3 2.8 100.0Kyrgyzstan 5.0 15.2 53.5 6.5 6.8 4.5 7.4 1.1 0.0 100.0Lithuania 14.0 8.5 16.3 5.0 15.1 8.7 17.6 4.3 10.6 100.0Moldova 14.9 29.7 21.4 3.9 10.4 9.0 7.0 1.6 2.2 100.0Poland 7.4 26.1 8.8 17.7 15.8 9.9 5.7 4.3 4.3 100.0Romania 16.1 39.8 6.3 7.8 15.2 5.2 5.7 3.4 0.6 100.0Russian Federation 11.7 20.4 18.5 11.3 8.8 11.1 11.6 2.8 3.7 100.0Slovakia 5.7 33.2 10.1 18.3 11.8 12.9 4.3 1.3 2.5 100.0Slovenia 6.5 24.9 4.3 36.3 8.7 5.3 5.8 8.2 0.0 100.0Ukraine 10.3 21.3 25.8 10.4 12.2 6.8 9.7 2.5 1.1 100.0Uzbekistan 8.5 18.0 27.9 15.4 10.9 5.2 12.0 0.9 1.2 100.0Overall 10.6 22.0 19.4 14.6 12.2 7.9 7.8 2.6 2.9 100.0Source: Measuring Governance, Corruption, and State Capture, EBRD and the World Bank 2000 It is also important to note that corruption is not something that only involves domestic firms. In transition countries where procurement kickbacks (payments from companies to get government contracts) are common in dealing with the state, both FDI and domestic firms are equally likely to pay them; while in countries where kickbacks are less common, FDI firms are more likely to engage in this form of corruption. Though in the case of kickbacks these differences between FDI and domestic firms may not be very substantial, it is interesting to see that despite recent developments in ethics codes, compliance procedures and transnational anti-bribery conventions, FDI firms do not demonstrate any higher standards of behaviour than domestic firms. Indeed, nearly a third of all FDI firms surveyed report paying kickbacks to public officials when dealing with state procurement contracts. With respect to state capture, the differences between domestic firms and FDI firms appear more pronounced in certain contexts. In countries with a significant state capture problem, FDI firms are almost twice as likely as domestic firms to be engaged in efforts to capture the state. Where state capture has been more effectively contained, FDI firms are much less likely than domestic firms to engage in it. (Source:Joel S. Hellman et al. 2002). How do the figures of the World Bank and of TI compare? The next table shows the main results:
22

Control of Corruption Comparison of World Bank and TransparencyInternational outcomes WB rank within the group
Country WB value TI rank TI rank within the group
1 EST 0,82 32 1 2 HUN 0,65 42 2 3 LTU 0,36 45 3 4 CZE 0,30 51 4 5 POL 0,16 69 7 6 HRV 0,08 67 6 7 BGR -0,04 54 5 8 ROM -0,25 89 9 9 MKD -0,52 99 11 10 RUS -0,72 95 10 11 MDA -0,86 117 12 12 UKR -0,89 128 13 13 BLR -0,91 74 8 compare USA 1,83 17 NL 2,08 10 Greece 0,56 47
There are some important differences between the outcomes of the Word Bank and Transparency International. Most remarkable is the difference in perception of Belarus: worst performers according to the WB, in the middle range according to TI, not much worse than Poland. Apart from that, both rankings show Ukraine en Belarus to be much worse than the others. Russia and Macedonia form the second worst group in the WB league, TI adds Romania to that. The best in class are according to the WB Estonia and Hungary, after that there is a big gap, TI leaves Estonia standing out and puts Hungary together with Lithuania in the same league. Bulgaria is according to TI close to the Czech Republic, but the WB ranks it much lower. Cross checking these outcomes with the outcomes of the EBRD 2005 survey (see below) does not lead to much clarification. Belarus’ bad performance that WB reports is not supported by EBRD, but now we see Lithuania is doing much worse in frequency of bribery, even worse than Romania. Note from this table that most CEE countries, apart from Lithuania, the and SEE-3 countries, apart from Romania, do better than Greece on frequency.
23

Types of corruption Country Bribe tax Frequency of bribery 2002 2005 2002 2005 Central eastern Europe and Baltic states Czech Republic 0.92 0.63 13.33 9.93 Estonia 0.34 0.29 12.14 6.47 Hungary 0.97 1.06 22.56 9.93 Latvia 0.93 0.71 17.90 7.49 Lithuania 0.74 0.87 20.62 24.08 Poland 1.22 0.70 18.57 14.77 Slovakia 1.45 0.93 36.02 10.64 Slovenia 0.80 0.17 7.15 4.65 Average 0.92 0.67 18.54 11.00 South-eastern Europe Albania 3.31 1.80 36.37 46.11 Bosnia and Herzegovina 0.95 0.39 22.42 19.63 Bulgaria 1.95 1.58 32.79 15.70 Croatia 0.64 0.76 12.86 11.27 FYR Macedonia 0.79 0.62 22.70 25.28 Romania 2.57 0.81 36.74 22.56 Serbia and Montenegro 1.52 0.67 15.88 33.20 Average 1.67 0.95 25.68 24.82 Commonwealth of Independent States Belarus 1.49 1.11 23.97 21.65 Moldova 2.07 1.09 34.32 22.42 Russian Federation 1.43 1.07 38.72 39.30 Ukraine 2.19 1.52 34.93 27.53 Germany 0.40 8.17 Greece 0.49 22.48 Portugal 0.26 8.82 South Korea 0.06 8.20 Turkey 2.36 13.23 Vietnam 0.85 34.14 Notes: The figures for other countries, except Turkey, are from the BEEPS survey carried out in 2004. Turkish figures refer to 2005. The bribe tax and kickback tax for Turkey were calculated differently and are therefore not directly comparable with other countries. 1 Bribe tax refers to typical unofficial payments/gifts to public officials as a percentage of annual sales.The figures reported are un- weighted country averages. 2 The frequency of bribery is the percentage of respondents who agreed they have to pay some irreg- ular payments/gifts for activities related to customs, taxes, licences, regulations or services frequently. Sources: BEEPS 2002, 2004 and 2005; reported in EBRD 2005 We can also compare TI’s traditional corruption (of governments) index with the new corporate corruption index:
24

TI 2004 Corruption Perceptions Index World Bank Corporate Corruption GCR 2004
Country
Country Rank/Within the TI survey
2004 CPI Score*
Rank CEI CICC CLCC
Estonia 32/1 6 1 72.7 40.9 Hungary 42/2 4,8 2 42.8 22.5 Lithuania 45/3 4,6 3 46.0 16.3 Czech Republic 51/4 4,2 4 32.1 30.9 Bulgaria 54/5 4,1 5 38.6 18.4 Croatia 67/6 3,5 6 29.9 18.5 Poland 69/7 3,5 11 25.3 14.4 Belarus 74/8 3,3 - - Romania 89/9 2,9 10 21.0 19.5 Russia 95/10 2,8 8 19.9 21.2 Macedonia 99/11 2,7 7 25.2 20.2 Moldova 117/12 2,3 -- - Ukraine 128/13 2,2 9 18.0 22.5 USA 17 7,5 84.0 30.8 NL 10 8,7 91.1 79.2 Greece 47 4,3 47.0 26.1 CICC (Corporate Illegal Corruption Component): Percentage of firms in the country that give satisfactory ratings (answers 5, 6 or 7) to the questions on corporate ethics, illegal political funding, state capture cost, average of frequency of bribery in procurement and active capture, corruption in banking (average of formal money laundering and bribery for loans), and percentage firms reporting 0percent procurement and administrative bribe shares. CLCC (Corporate Legal Corruption Component): Percentage of firms in the country that give satisfactory ratings (answers 5, 6 or 7) to the questions on influencing legal political funding and undue political influence. CEI: Average of firms’ scores on CLCC and CICC It is interesting to see the change of place between on the one hand Poland and Romania, and on the other Ukraine, Macedonia and Russia. The last three countries have worse government corruption scores than the first two, but better corporate corruption scores. For Poland this is due to a high Corporate Illegal Corruption Component, The specific indexes to measure state performance of the WB give the following results:
25

WB Rankings within Sample
Country Average Total rank
Rule of law Voice Gov. Effectiveness Reg. Quality Corruption
EST 1 1 1 1 1 1 HUN 2,2 2 2 3 2 2 LTU 3,4 4 5 2 3 3 CZE 3,8 3 4 4 4 4 POL 4,6 5 3 5 5 5 HRV 6,4 6 7 6 7 6 BGR 6,6 7 6 7 6 7 ROM 8 8 8 8 8 8 MKD 9 9 9 9 9 9 RUS 11 11 12 10 12 10 MDA 10,8 10 10 12 11 11 UKR 11,2 12 11 11 10 12 BLR 13 13 13 13 13 13 As might be expected, partly because of the social political logic and partly because of the specific survey methods used to measure these indexes, the ranking for the different issues is most of the time similar.3 Lithuania ranks badly under voice (democracy), on the other issues Poland ranks worst amongst the EU countries. The non-EU countries rank worse on every issue compared to the EU members. It is also interesting to see how the best group in limiting corruption compares to the old EU members. It seems that the best among the new EU members (Estonia, Hungary and in the TI ranking also Lithuania) clearly do a better job in controlling corruption than the worst of the old members (Greece); the other CEE countries perform worse, but the gap between them and Greece is much smaller than between Greece and the Netherlands. This picture also arises from the next table from the EBRD 2005 report. The frequency of bribes is higher in Portugal than in the Central Eastern Europe and the Baltic states, whereas South-Eastern Europe scores a lower frequency than Portugal on 6 out of 10 types. Greece does better than Portugal but in general it is more close to Central Eastern Europe than to Germany: Frequency of bribery by sector, 2002 and 2005 Types of corruption CEB SEE CIS Other countries 2004 2002 2005 2002 2005 2002 2005 Germany Greece Portugal Public services 2.7 2.2 3.6 6.2 7.6 5.3 0.5 1.4 13.5 To get business licences 7.7 6.5 21.6 14.7 18.7 8.9 3.0 11.9 17.1 To get government contracts 16.8 16.8 21.0 20.2 13.0 13.4 13.5 7.7 10.8 Health and safety inspections 9.3 8.0 17.4 11.2 9.8 8.2 1.6 6.2 11.3 Fire and building inspections 7.8 6.2 12.8 6.8 15.6 13.9 0.8 5.4 8.4 Environmental inspections 6.1 4.5 9.3 5.2 9.1 8.0 2.1 2.7 6.4 Taxes and tax collection 6.0 5.6 18.3 12.1 23.0 21.3 1.1 17.4 14.5 Customs/imports 6.8 6.1 24.3 15.0 15.2 12.5 1.9 3.6 8.3 To deal with courts 3.8 4.7 14.9 14.0 7.3 16.2 0.3 2.6 9.9 To influence law making 3.9 4.5 7.3 5.8 4.4 4.1 3.4 1.8 1.4 Note: Respondents were asked to report on how often they make unofficial payments in a given year for a range of public goods and services. The figures in the table represent the share of firms in each sub-region responding that such payments would be made frequently, usually or always in 2002 and 2005. The data for the CIS exclude Turkmenistan, where the survey could not be implemented. Source ERD 2005 3 According to Kaufmann et al (2005a) one critique of subjective or perceptions-based governance measures is that they are subject to “halo effects” – respondents rating countries might provide good governance scores to richer countries simply because they are richer. We might expect this “halo effect” to be more general; e.g. the positive perception of social and political relations in the Czech Republic for instance, may will have a general bearing on all outcomes, as will the negative perception of social and political relations in for instance Belarus. Kaufmann et al (2004) also noted that on Regulatory Quality, the disagreement between different sources on Belarus is very high.
26

Based on the specific indexes of the WB we can distinguish different groupings, which takes into account not just the ranking, but also the quantitative gaps between the different scores (see Annex 1 for a graphical display of this): Groupings: Country Rule of law Voice Gov.
Effectiveness Reg. Quality Corruption
EST 1 1 1 1 1 HUN 1 1 1 1 1 LTU 1 1 1 1 2 CZE 1 1 1 1 2 POL 1 1 1 1 2 HRV 2 2 1 2 3 BGR 2 2 2 1 3 ROM 2 2 2 2 3 MKD 2 2 2 2 4 RUS 3 3 2 3 4 MDA 3 3 3 3 4 UKR 3 3 3 3 4 BLR 4 4 3 4 4
27

6.2 Labour legislation and protection A global assessment of the labour legislation is possible on the basis of a large body of research into labour legislation and protection level, albeit often from the viewpoint that this considers this only a hindrance to business (“Rigidity Of Labour”) and not from the viewpoint of protecting basic workers rights (“Doing Business Questionnaires”). The World Bank (2003) study provides for a comprehensive overview. The table shows the main indicators. They include:
• Difficulty of hiring a new worker (Difficulty of Hiring Index), restrictions on expanding or contracting the number of working hours (Rigidity of Hours Index),
• Difficulty and expense of dismissing a redundant worker (Difficulty of Firing), • An average of the three indices (Rigidity of Employment Index), and • Cost of a redundant worker, expressed in weeks of wages (Firing Costs).
Higher values in the table indicate more rigid regulations.
Region or Country Difficulty of hiring index
Rigidity of hours index
Difficulty of firing index
Rigidity of employment index
Firing costs (weeks of wages)
East Asia & Pacific 26.0 29.6 23.0 26.2 44.2 Europe & Central Asia 34.5 56.9 41.5 44.3 32.8 OECD: High income 30.1 50.4 27.4 36.1 35.1 South Asia 41.9 35.0 42.5 39.9 75.0 Belarus 0 40 40 27 20.9 Bulgaria 61 60 10 44 29.8 Croatia 61 60 50 57 42.4 Czech Republic 33 20 20 24 21.6 Estonia 33 80 40 51 16.0 FYR Macedonia 61 60 40 54 40.7 Hungary 11 80 20 37 33.5 Latvia 67 40 70 59 17.0 Lithuania 33 60 40 44 33.8 Moldova 33 100 70 68 20.9 Poland 11 60 40 37 24.9 Romania 67 60 50 59 98.0 Russian Federation 0 60 30 30 16.6 Slovakia 17 60 40 39 12.9 Ukraine 33 80 80 64 94.0 Netherlands 28 60 60 49 16.0 Source: Doing Business Database, http://www.doingbusiness.org/Default.aspx In countries like Czech Republic, Estonia, Hungary and Poland, attracting foreign investors have been considered more important than ensuring higher wages or better working conditions. Major investors are often able to avoid bureaucracy, but small and medium-sized enterprises have to face highly bureaucratic regulations that limit the creation of new jobs. This dilemma is acute in a large number of countries in the region, where the former sense of solidarity between workers has been replaced by intense competition. The table below shows that there might be a big difference in the regulations for temporary employees and for regular employees. Bulgaria, and to a lesser extend Lithuania stand out as countries offering strict protection to regular employees and very weak protection for temporary employees, whereas in many CIS and former Yugoslav countries this hardly makes a difference.
28
Source: WB Study 2005 Characteristics of unemployment insurance system in selected transition countries, 1998
Country Benefit replace- ment Ratio (1)
Benefit replace-ment Ratio (2) Benefit duration (3)
Coverage rates (4)
Bulgaria 60% 32% 6-12 months depending on age and length of
employment 24.8% Czech Republic 60% 24% 6 months 48.8% Estonia 7% 7% (a) 6 months 59.3% Hungary 65% 27.5% 3-12 months depending on length of employment 73.9% Poland 40% 36%(c) 12 months 23.1% Russian Fed. 75% 25.5%(d) 12-24 months within 36 months 89.5% Slovakia 60% 32.8% 6-12 months depending on length of employment 27% Slovenia 63% 43.9% 3-24 months depending on length of employment 32.6% Ukraine 100% 22.7% 180-360 days within 2 years 53.1% (1) UB replacement rate is measured by the average benefits as a percentage of gross average wage. (2) Initial benefits level divided by previous earned wage. (3) Duration of payment (4) Percentage of unemployed receiving unemployment insurance benefits. (a) Flat rate of EEK 300 (b) The ratio includes means-tested unemployment assistance, once UB are exhausted. In contrast with other transition countries this de facto social assistance is paid from the Labour Market Fund while in other countries it usually is paid from social budgets. (c) Flat rate of 393.60 Polish zloty in June 1999. (d) It broadly corresponds to 42 per cent of the national subsistence level in 1997. Source Cazes/ILO 2002
29

Citing the WBI report Labour Market Policy and Institutions: “At the beginning of the transition, workers in the Region were among the most protected in the world. This was reflected in the socialist-era Employment Protection Legislation (EPL), under which dismissals were very difficult, full-time permanent employment was the norm, and workers were entitled to a wide range of workplace benefits and protection. At the same time, protections such as severance pay and notice periods upon dismissal were largely unnecessary (because dismissals were prohibited, except for severe misconduct). Former Yugoslavia, which had very generous provisions on both, was a notable exception. Nearly all transition countries subsequently carried out significant reforms of EPL, though at varying points during the transition. The direction of initial reforms has been toward greater flexibility in labour relations, including in hiring and firing (for example, lower direct dismissal costs or removal of trade union veto on dismissals), promoting temporary and part-time employment, allowing for opting out of collective agreements, and so forth. Most CEE countries achieved their first wave of EPL reforms early in the transition, while other regions such as SEE and the CIS often delayed reforms until the late 1990s. Many countries have continued to adjust reformed legislation, although in some cases reducing flexibility in later revisions (for example, Romania’s second wave of EPL reforms after 1998 and Hungarian reforms effective from 1997). Although the overall trend in EPL reforms is therefore clearly toward greater flexibility, the progression (note the ideological terminology, where change or transition might have been the more appropriate terminology/FWF) has not been linear. For 10 transition economies, information has been gathered on the evolution of employment protection legislation since the beginning of the 1990s. These data suggest that transition economies that were approaching entry into the European Union (for example, Hungary, Poland, and the Slovak Republic) have been more aggressive in liberalizing EPL than others whose accession was further in the future (for example, Bulgaria and Romania) or not foreseen in the short term (for example, Ukraine). It should be stressed, however, that most of the reforms have been concentrated on liberalizing temporary contracts by extending maximum duration of fixed-term contracts or by legalizing temporary work agencies. In other words, following the experience of many continental European countries, EU transition economies have liberalized at the margin, lowering the costs of temporary employment, with more modest reductions in the protection of permanent workers. This may have contributed to the observed duality in the labour market whereby vulnerable groups, including youth, women, and the unskilled, churn from one job to another without being able to build a proper career, while those who maintain a regular contract still enjoy a significant degree of job protection.” Note: the figures provided by Eurostat however show that only in Poland amongst the CEE countries temporary contracts are used to a high degree, many CEE countries are actually hardly using temporary contracts:
30

Source: EuroFound: Annual review of working conditions in the EU: 2004-2005 For the countries that stood out in the WB study as countries offering strict protection to regular employees and very weak protection for temporary employees Lithuania uses on average less temporary contracts than Belgium or Austria (Bulgaria is not included in the table above). Whereas in the EU-25 in general women have slightly more temporary contracts than men, in the CEE countries this is the other way round except for the Czech Republic and Slovenia. The World Bank study continues: “Despite the importance of the many reforms, EPL in the Region remains (on average) stricter than in other regions in the world. There is no clear subgroup pattern to the relative levels of regular and temporary EPL. However, in some cases, the differentials are very pronounced, in both directions. For example, Bosnia and Herzegovina, Bulgaria, and Latvia mainly limit temporary employment and regulate permanent employment less, while Albania, Estonia, Kazakhstan, Poland, and Slovenia provide significantly more protection to permanent employment. There is evidence of weak enforcement of EPL in most of the transition countries, except for CEE. This appears to be particularly the case in the CIS and a significant factor in much of SEE. This suggests that the effective rigidity imposed by EPL varies from that indicated by simple comparison of legislation. The point is supported by the available evidence on settlement of labour disputes. Greater job security for those with jobs appears to come at a cost for the unemployed and new entrants in the labour market, so that (re)entry into formal sector employment is negatively affected. This “insider-outsider” impact on formal sector employment rates would appear to undermine the claim that strict EPL is “always good for workers” in the aggregate. There are differences between the legislative difficulty of hiring and firing and the ease of both reported by employers (for example, in Romania and Ukraine). In Belarus, Russia, Ukraine, and other CIS countries, there is widespread evidence of weak enforcement of EPL. By contrast, CEE countries have less strict EPL (on average), but are considered more likely to enforce it (for example, evidence from Bulgaria, Lithuania, and Poland indicates that the costs of court challenges to dismissals act as additional disincentives to firing workers). Finally, there is evidence (for example, from Lithuania and Poland) that EPL is more strongly enforced in large firms, which typically have a stronger union presence. The effective impact of strict EPL in the Region may be less than comparisons of labour legislation would suggest, with only Slovenia having both strict EPL and strict enforcement:
31

Flexible EPL More restrictive EPL Very rigid EPL
Weaker enforcement Albania, Kazakhstan
Armenia, Georgia, Russian Federation, Serbia and
Montenegro, Turkey
Intermediate enforcement Bulgaria Croatia, FYR Macedonia,
Romania
Stronger enforcement
Czech Republic, Estonia, Hungary, Poland,Slovakia
Source: Bank staff calculations. Note: (i) Strictness defined as whether country EPL index below world average EPL index in Doing Business 2005, up to 20% higher and more than 20% higher; (ii) strength of enforcement based on share of informal sector employment. The degree of enforcement is proxied by the size of the informal economy; the higher the informal economy the weaker the estimated degree of enforcement (Schneider and Klinglmair 2004, and country studies where available). For Russia the EPL index was corrected toward stricter EPL following comments from Russian experts. Although the characterization is crude, the above table indicates that countries in the top right of the table need to focus more on credibly enforceable laws as opposed to “paper protections,” which at best protect a limited share of formal sector workers. (End of quotes taken from World bank 2003: Labour Market Policy and Institutions, http://siteresources.worldbank.org/ INTECA/Resources/laborstudy05-ch6.pdf)
However we must take into account that there are figures showing a totally different picture. The next table is taken from an EBRD /World Bank study of 2000 and looks at the de-facto regulation according to companies. To compare with the other sources we added the three last columns: % Of firms subject to state intervention
Azerbaijan, Belarus, Bosnia and Herzegovina, Kyrgyz,
Molodova, Ukraine, Uzbekistan
Latvia, Lithuania, Slovenia
The WB table above shows a large similarity with the political grouping. Strong enforcement is to be found in the new EU states, intermediate enforcement in the new candidate countries plus Macedonia. Rigid EPL can not be found in the new EU states and Bulgaria, but it can be found in all the other countries including two of the new candidate countries plus Macedonia.
Compare:
WB EPL classification
Employment % of firms
Employment Rank (1=highest %)
Wages % of
Wages Rank (1= highest %) firms
Average rank
Rank Rigidity of Employment index (1=most rigid)
Formal EPL Enforcement
Flexible Estonia 1 13 8,5 11 12 7 flex strong Croatia 2 12 8 12 12 5 rigid medium Romania 5 9 6,5 13 11 3 rigid medium Medium Moldova 5 9 14 8 10 1 rigid Weak Poland 8 6 12 9 9 5 flex strong Lithuania 6,5 8 18 6 6 8 medium strong Belarus 10 5 12 9 6 12 rigid Weak Russia 5 9 19,5 5 6 11 medium Weak Strict Czech 12 3 15 7 5 13 flex strong Ukraine 11 4 24 4 4 2 rigid Weak Bulgaria 8 6 44 1 3 8 medium medium Hungary 21 2 42 2 1 10 flex strong Slovakia 34 1 26 3 1 9 flex strong Source: Measuring Governance, Corruption, and State Capture, EBRD /World Bank 2000 and tables presented above. According to this table, there is hardly the same assessment of any country by the different sources, apart from the assessment of Ukraine as a ‘strict country. Further more for Slovakia and Bulgaria there seem to be ample evidence that labour is relatively well protected, whereas Estonia seems to have one of the most liberal labour market regimes. Possibly this is a field where transition is ever changing the scene, or it is just another example of how surveys aren’t a very reliable source.
32

6.3 Informal sector Despite differing methodologies and, therefore, differing estimates the tendencies of informal sectors’ share in GDP, as reported in nearly all CEE/CIS countries are rising, although to differing degrees. The informal sector is an important issue to be looked at from the point of view of code implementation. But is also is a multi facetted issue. On the one hand the informal economy is beyond the scope of labour legislation and labour protection. On the other hand it often offers a way of survival outside the market economy, for instance for workers who also have also some plot of land to their disposal. Hence we should try to distinguish between illegal or non-registered wage labour and non-market activities. A high share of the informal sector in general cannot directly be translated into an assessment of the situation in garment factories. In more traditional economies, like Moldova, two-thirds of informal workers work in agriculture, forestry and fishing, and are outside wage-employment. In more modern economies, like Hungary, the informal sector largely consists market activities including wage labour (Kallay 2003) that are not registered. Related to the informal economy is the issue of home based workers as a labour force, that consists mostly of women, in some countries for about of 90%. In some countries, for instance Macedonia, according to FWF contacts, it is an important segment of the garment industry (embroidery, sewing pearls, home based seamstresses). Since in social audits an important element is to check whether workers are sufficiently covered under the legal social insurance systems, and since dodging these contributions is in many countries an important reason for employing un-registered workers or paying unregistered parts of the wage, we will also look at this element. There exists an interesting tradition in the economic literature to estimate the size of the informal economy. But most of the literature on this topic has tended to view the category as a homogeneous lump, all those economic activities not reported to the government to appear in official GDP statistics. Schneider & Enste (2002) distinguish four fields of activity: At one extreme are completely legal household sector activities that would not be included in official GDP statistics, even if they were reported to the government. Next is what they label the informal sector. This involves market activities that are not reported to the government, but which are tolerated by the government, despite their technical illegality due to non-payment of taxes. Then comes the intensively studied irregular economy, market activities illegal only due to non-payment of taxes and which the government does not tolerate. Finally there is the criminal sector. Since our focus is on labour, the most useful definition can be taken from the study done for the European Commission (Piet Renoy et al 2004), that uses registration according to national requirements as the criterion for what is to be understood as undeclared work. The definition is: “ productive activities that are lawful as regards to their nature, but are not declared to the public authorities, taking into account the differences in the regulatory system between Member States.” This definition strongly coincides with that of underground production and production of households for own final use in the OECD terminology for the Non Observed Economy. Traditional measurements of the informal economy have been strongly criticized by Hanousek and Palda (2004), who have argued convincingly that these measures are hardly adequate for fast changing societies like the transition countries. Moreover Barkley Rosser (http://cob.jmu.edu/rosserjb/ book.rev.schneider&enste.doc) in a review of the work of two leading experts on the informal economy, Schneider and Enste has criticised this tradition for having an ideological basis against taxes (high taxes most of the time being considered as the main cause for the existence of informal economies). This discussion has many similarities with the discussion we presented on corruption indexes. The informal economy is a many facetted phenomenon. A ILO report on the informal sector in Moldova makes this clear. (ILO 2004.) Below are some extracts: In the second quarter of 2003, the enterprises of the informal sector had 266 thousand jobs,
33
which constituted 18% of the total number of jobs in the country. Of them, 78% were in the main activity of employed persons. Over 59 thousand persons had a secondary activity in the informal sector, the majority of them being concentrated in agriculture and working as own-account workers and unpaid family workers.

Jobs in the Republic of Moldova, 2nd quarter 2003 (in thousands) Total of which in: Main activity Secondary activity Total jobs 1483 1415 68 of which in: Formal sector enterprises 1079 1070 9 Informal sector enterprises 266 207 59 Households 138 138 - *) Persons employed in the household production of agricultural goods exclusively for own consumption (if working for 20 or more hours), and persons employed as paid domestic employees by private households. The formal sector is a wage employment sector. 80,9% of the persons employed in the formal sector were employees. By contrast, the informal sector is a self-employment sector composed of 89,4% own account workers, employers, or members of producers cooperatives and 7,9% unpaid family workers, but only 2,7% employees. Informal employment was not limited to informal sector enterprises or households. 18,4% of the persons employed in the formal sector, and 26,4% of the persons employed in the non-public formal sector, had informal jobs. Among the employees of the non-public formal sector, 31,5% were in informal employment. 46,8% of the employees with formal jobs worked in public sector enterprises and 53,2% in non-public formal sector enterprises. By contrast, 94,1% of the employees with informal jobs worked in non-public formal sector enterprises, 3,1% in informal sector enterprises. The highest shares of informal employment were in construction (58,2%), agriculture, forestry and fishing (57,3%) and trade, hotels and restaurants (50,3%). 68,6% of the persons in informal employment were engaged in agriculture, forestry and fishing, 16,0% in trade, hotels and restaurants and 5,3% in construction. (end of extracts from ILO 2004) With the earlier mentioned caution in mind, we will now turn to some empirical studies of comparative figures. The European Commission presented a study (Renoy et al, 2004) .The extent of undeclared work varies significantly across the Member States. The estimates range from a relatively modest 1.5% of gross domestic product (GDP) in Austria, 2% in the Netherlands and UK, and 3% in Sweden, to 16%-17% in Italy, 15%-19% in Lithuania and more than 20% of GDP in Greece. In addition to other complex factors throughout the EU, cultural traditions in some countries, like Greece and Italy, and deeply-rooted informal economies in Poland, Hungary and Slovenia, are significant reasons for the high extent of undeclared work. In the new Member States, ‘envelope wages’, i.e. under-reporting income, is a frequent practice – alongside non-reporting. The study identifies three clear groups regarding the scale and dynamics of undeclared work in the CEE countries: 1. A low level (8-13 % of GDP) and decreasing share: Czech Republic, Estonia and Slovakia 2. A medium level (14-23 % of GDP) and decreasing share: Poland, Slovenia, Hungary, Lithuania, Latvia 3. A high level (21-22 % of GDP) and increasing share: Bulgaria and Romania. Musiolek (2002) presents the next overview of estimates:
34

Share of informal sectors in terms of GDP and employment Informal sector % of total GDP
Informal sector % of total employment
Average 89-90 Average
90-93 Average 94-
95 1999 Recent Bulgaria 24.2 26.2 30-35.3 Ca. 33.1 Romania 16.2 16.2 18.2 20-50 Croatia 23.2 24.2 29.2 Czech Republic 6.2 13.2 15.2 Hungary 28.2 31.2 Ca. 30 Poland 18.2 20.2 14.2 Slovakia 7.2 14.2 10.2 Estonia 20.2 24.2 18.2 Lithuania 11.2 26.2 25.2 Latvia 13.2 24.2 35.2 Russian Federation 15.2 27.2 41.2 50-90 50-90 Georgia 25.2 44.2 63.2 Azerbaijan 22.2 34.2 59.2 FYR Macedonia 20-30 30 Albania 50 40-80 Average for Bulgaria, Romania, Croatia, Poland, Czech Republic, Hungary, Slovenia, Baltics 30-50 30-50 Average for Yugoslavia, Montenegro, Bosnia Herzegovina, CIS 50-70 50-70 Latin America Philippines 25.28 34 (1995) Asia 34 Mali 23 13 (1989) Kenya 18 29 (1999) Germany 15 18 Average for developing countries 20-40 All figures presented as percentage. Sources: for Germany: DIW; others: Charmes, 1= expert estimations for 1996 and 1997 (Gradev 1999); for Hungary: Hethy 1999, 85; for Romania unless (2): Balaita/ French/ Ticsa 1999 + Ionita, Mandruta and Pippidi 2000; 2 = estimations by Schneider (1999); the average figures for CEE/CIS are based on own estimations by the rapporteur given all accessible information. Sources for Macedonia: interview with Ljiljana Jankulovska; for Albania: recent figures: Dulmani 2001, mid 90ies figures: Gerxhani 2000. For Russia - unless (2): Heller/Nuss 1999, 569. (3) Bulgarian Academy of Science 1999. Taken from Musiolek 2002 The next table presents figures from the study by Simeon Djankov et al. (2003).
35

Size of the informal economy in transition countries Country Share of GDP (2001) Share of employment (1999)Armenia 45.3 40.3 Azerbaijan 60.1 50.7 Belarus 47.1 40.9 Bulgaria 36.4 30.4 Croatia 32.4 27.4 Czech Republic 18.4 12.6 Estonia 39.1 33.4 FYR Macedonia 66.1 53.2 Georgia 24.4 20.9 Hungary 42.2 33.6 Kazakhstan 39.4 29.4 Kyrgyzstan 39.6 29.6 Latvia 29.4 20.3 Lithuania 45.1 35.1 Moldova 44.1 35.1 Poland 27.4 20.9 Romania 33.4 24.3 Russian Federation 45.1 40.9 Serbia 34.5 34.6 Slovakia 18.3 16.3 Slovenia 26.7 21.6 Ukraine 31.2 41.2 Uzbekistan 33.4 33.2 Note that in all countries apart from Serbia the GDP share is higher than the employment share, indicating that the overall productivity in the informal sector is higher than the formal economy! The data from the table above are combined in the next table with the data from Friedman et al. (2000), and the afore mentioned EU study. To give an indication how the CEE countries rank against the ‘old EU’: Poland’s figures for column 4&5 (share 1&2) are very close to Belgium. Informal economy; Country rankings according to different estimates Country Name
Employment share
GDP share
Base estimate (share 1)
Alternative Esti-mate (share 2)
Average rank (*)
EU study
Bulgaria 7 8 3 5 6 High Belarus 2 2 10 13 5 Czech Rep. 15 14 13 14 14 Low Estonia 6 7 12 8 8 Low Croatia 9 10 9 9 9 Hungary 11 13 6 1 9 Medium Lithuania 13 11 8 6 10 Medium Latvia 8 6 5 7 7 Medium Macedonia 4 3 2 Moldova 4 5 4 2 4 Poland 11 12 11 10 11 Medium Romania 10 9 7 11 9 High Russia 2 3 2 4 3 Slovakia 14 15 14 12 14 Low Ukraine 1 1 1 3 1
36

(*) Since the first two tables contain more recent information and also are more in line with general perceptions on Belarus and Hungary, in the average rank we have weighted these with a factor 2. Comparing the two tables we can see big differences for some countries’ estimates, especially for Belarus and Hungary indicating that at least for Belarus and Hungary, but also for Bulgaria, Estonia, and Lithuania the single estimates are not very convincing. The EU study differs strongly from the other studies on Romania and Estonia. This leaves 7 countries where there are less inconsistencies, but that is partly due because they are not included in all the studies: Informal economy: Average rank within our survey
(italics: different data not consistent) Very High Ukraine, Macedonia, Moldova, Russia, Belarus High Bulgaria, Latvia, Romania, Croatia, Estonia Medium Hungary, Lithuania, Poland Low Slovakia, Czech Republic The ranking is almost similar to the ‘political ranking’ (EU status), apart from Estonia and Latvia as EU members sharing the ranking more common to new applicant countries and Since in the studies with a wider number of countries, the former Soviet countries rank as the highest, that may explain some of the Baltic characteristics too. The two descendants of the former state Czechoslovakia clearly outrank the other CEE countries, which might be due to their longer history of industrialisation. The countries in the ‘Medium’ category would rank with the upper half of old EU members in regards to size of their informal category; the countries in the ‘High’ category would be in the company of Greece. An often-cited cause for a high share of the informal sector and for ‘under the table’ payments is the high wedge between gross and net wages in formal employment because of high taxes. Do our figures show a relation with the tax wedge on labour? The tax wedge on labour in the transition countries is high—in many cases, very high. Payroll taxes (defined as the difference between real labour cost paid by employers and after tax real consumption wage received by workers) in transition countries are high, even for EU standards. Rates range from 33 per cent in Estonia to as high as 50 per cent in Slovakia. While these rates vary enormously across OECD countries, they do not exceed 40 per cent: payroll taxes stretch from almost zero in Denmark to 38.8 per cent and 40.2 per cent in France and Italy respectively in the mid-nineties. In transition countries, deteriorating labour market outcomes push. The income tax schedule is progressive in all the countries and the degree of progressivity is important. In a number of countries, in particular small firms officially pay the minimum wage to their employees for tax reasons while paying another part of the wage under the table. (Cazes 2002) At the same time, like most labour market institutions, the tax wedge exhibits considerable variation across countries, both in aggregate level and composition (see figure below). Overall, the tax wedge on labour in CEE and Turkey is very high by any standard, while labour taxation in CIS countries is lower (on average). The tax burden on labour is at an intermediate level in SEE countries, but remains high by international standards. On average, the tax wedge on labour in Belarus, Russia, Ukraine, and other CIS countries is more than 14 percentage points lower than that in CEE and Turkey, while for SEE, it averages around 11 percentage points lower than that in CEE and Turkey. For CEE, the comparison with OECD countries is of interest. The regional average tax wedge is around 8 percent lower than the OECD average (excluding CEE OECD countries). However, the averages mask considerable variety in both groupings. The tax wedge on labour in CEE countries is noticeably higher than the OECD average.
37

Hungary is the only country of the Region that would fit firmly within the high labour tax OECD group. In contrast, CIS has an average tax wedge on labour equal to the average for the low-labour-tax OECD group, which includes Korea and Mexico, which are the only OECD members with comparable income levels. The SEE average is between the low- and medium-labour-tax OECD groups and somewhat below the overall OECD average. (World Bank: Job opportunities) The comparison shows that a high tax wedge does not correspond in our sample with a high share of the informal economy, if anything the relation is inverse. This may indicate support for Rossers et al (2003)’ point that there is a robustly strong and significant negative relationship between tax rates and the size of the informal economy. (The argument is that a low informal economy requires a positive tax morality, that can be boosted by a sense of social justice generated by lower incomes inequality, that needs redistribution of income, that is usually paid for by taxes). We also include the table from paragraph 6.2 on the % of firms that report to be subject to state intervention in wages. Apart from Slovakia, this ranking is a little closer to the informal economy ranking. Informal economy
Average rank within our survey
Tax wedge rank Rank % of firms subject to state intervention
Bulgaria 6
Belarus 5 11 9
Czech 14 3 7
Estonia 8 7 11
Croatia 9 5 12
Hungary 9 1 2
38
Lithuania 10 5 6
Latvia 7 8
Macedonia 2 9
Moldova 4 8
Poland 11 4 9
Romania 9 2 13
Russia 3 13 5
Slovakia 14 10 3
Ukraine 1 11 4
39

6.4 Trade unions and Industrial Relations An assessment of the state of Trade Unions and Industrial Relations serves two purposes within this survey. First of all it is an indicator of the level of institutional capacity that can bring the labour standards up to the level that is internationally accepted as presenting the basic human and workers’ rights. Secondly it may be used as an indicator for the core labour standards ‘Freedom of Association’ and ‘Right to Collective Bargaining’. But trade unions rights are hard to measure. The U.S. National Research Council (2004) came up with 21 legal aspects to be checked, 13 indicators for practical implementation and 4 overall indications, including union density and number of strikes. But they also stated that these overall indications should be used within an overall understanding of the context: “Union density might be considered a good objective indicator of compliance with freedom of association, but the information must be considered in context and cannot simply be used alone. First, union density numbers are often not reliable. (…) Second, high union density numbers may not be indicative of genuine freedom of association because national governments or political parties may exercise control over membership. (…) Low union density in countries where freedom of association is respected could occur if workers have simply not opted for union representation or where other forms of worker-management interaction are prevalent. The use of union density as a proxy for compliance with freedom of association is built on the implicit assumption that, in the presence of genuine freedom of association, all workers would join a trade union, but this assumption might be at variance with reality.” “A large volume of strikes—measured in terms of frequency, length, or person-days—can be taken to indicate respect for the right to strike with a healthy collective bargaining system, or it can indicate the reverse. A small number of strikes might mean that labour and management bargain freely and readily compromise to reach agreements. But a small number of strikes can also be symptomatic of a repressive system in which workers are afraid to strike for fear that they will suffer reprisals or be replaced.” Bearing this in mind we will look at union density first. In a large number of countries around the globe, trade unions have experienced a considerable drop in membership over the past ten years. In some cases, as in central and eastern Europe, this development is linked to the end of compulsory union membership: Estonia (-71.2%), Czech Republic (-50.6%), Poland (-45.7%), Slovakia (-40.1%), Hungary (-38%). In Germany (-20.3%), the drop in membership in the former East Germany largely accounts for the decline (The World Labour Report, ILO 1997). More recent figures from EIRO confirm this:
Country Confederation /centre 1993* 2003*** Change 1993-2003 CITUB 1,426,000 390 -72.7% CL Podkrepa 500 109 -78.2% Promiana - 5 -37.5%**** ADTU 30 4 -86.7% NTU 30 4 -86.7% Others 206 3 -98.5%
Bulgaria
Total 2,192,000 515 -76.5% EAKL 342 48 -86.0% TALO 55 35 -36.4% Others Nd 10 -
Estonia
Total - 93 - SZEF 270 270 0 MSZOSZ Nd 240 ASZSZ 110 150 +36.4% LIGA 100 100 0 ÉSZT 100 85 -15.0% MOSZ 65 56 -13.8% Others 35 35 0
Hungary
Total - 936 - Poland OPZZ 4,500,000 800 -82.2%
40

NSZZ Solidarność 2,000,000 780 -61.0% FZZ - 320 - Total 6,500,000 1,900,000 -70.8% Meridian 40 1,500,000 +3,650.0% Cartel Alfa 1,200,000 1,000,000 -16.7% CNSLR 1,284,000 798 -37.9% CSDR 650 650 0 BNS Nd 421 - Others 150 30 -80.0%
Romania
Total - 4,399,000 - KOZ SR 1,574,000 554 -64.8% Others 9 22 +144.4% Slovakia Total 1,583,000 576 -63.6% ZSSS Nd 180 - KNSS Nd 15 - Pergam Nd 15 - Konfederacija '90 Nd 10 - Others Nd 140 -
Slovenia
Total Nd 360 - * Except for: Hungary (SZEF) 1995; *** Except for: Slovenia - 2001; Estonia **** Change from 1998 to 2003. ***** Change from 1993 to 1998.
Source: (http://www.eiro.eurofound.eu.int/2004/03/update/tn0403105u.html)
This table should be read in conjunction with the following notes: Bulgaria. As well as the five centres listed by name, an overall membership figure is available for the 'other' unions. The 'total' figure can be assumed to be reasonably complete. Promiana did not exist in 1993. The 1993 data are self-reported by unions, and the 1998 and 2003 figures are from official censuses. Estonia. As well as the two centres listed by name, an overall estimated membership figure is available for the 'other' unions, though only for 2003. The 'total' figure can be assumed to be reasonably complete. The data are self-reported by unions. However, there are no accurate data on the membership of 'other' unions, and the figure given for 2003 is an estimate based on trade union sources. Hungary. As well as the six centres listed by name, an overall estimated membership figure is available for the 'other' unions. The 'total' figure can be assumed to be reasonably complete. The figures are self-reported by unions (surveys and reports from Tax and Financial Control Administrationfind considerably lower figures. However, there are no accurate data on the membership of 'other' unions, and the figure given is an estimate. All figures do not include pensioners (see below under 'Issues related to union density' ). Poland. The great majority of union members belong to the affiliates of the three centres listed. However, there are, or have been, a number of other, smaller centres, for which no figures are available. In 1993, there was Solidarność ’80, with around 150,000 members, plus several other centres - such as Sierpień 80, Kadra and Kontra- for which no membership figures are available. In 1998, Solidarność 80 had some 80,000 members, while there were at least seven other significant union organisations. By 2003, FZZ had been formed, bringing together most of the organisations not affiliated to OPZZ and NSZZ Solidarność. Thus the 'total' figures given for 1993 and 1998 are clearly incomplete, while the 2003 figure is nearer being complete, though still somewhat short. The data are self-reported by unions. Romania. As well as the five centres listed by name, an overall estimated membership figure is available for the 'other' unions. The 'total' figure (for 2003, no data are available for BNS for 1993 and 1998) can be assumed to be reasonably complete. The data are self-reported by unions. However, there are no accurate data on the membership of 'other' unions, and the figure given is an estimate. Slovakia. As well as the centre listed by name (Slovakia’s sole significant confederation), an overall estimated membership figure is available for the 'other' unions. The 'total' figure can be assumed to be reasonably complete. The data for KOZ SR are self-reported. The figure for 'others' includes self-reported data for the Independent Christian Trade Union of Slovakia (Nezávislé krestanské odbory Slovenska, NKOS), plus estimates for other unions. Slovenia. No reliable data are available from trade unions or from national sources. The figures given in the 2003 column are based on estimates from the European Commission for 2001 (mid-range used when range given). The data are presented as 'indicative' .
41
Comparing the average trade union density in the EU between the ‘old’ members and the members from CEE, weighting the average for the differing sizes of the countries' labour forces indicates an

hugh gap – the EU figure (30.4%) is nearly half as high as the candidate countries figure (21.9%). This reflects the fact that union density is below average in the largest candidate countries – Poland, the Czech Republic and Hungary. But average density does not tell the whole story. The EU average is high because of the very high figures in the Nordic countries, but France, the Netherlands and the Mediterranean countries show a density that is lower than the CEE countries. Within the CEE the figures also hide important differences. First of all, there are huge differences relating to the stage of transition of the economy. The ILO survey “Safety and Health at the Workplace - Trade Union Experiences in Central and Eastern Europe (2000)” clearly indicates that trade unions membership in the CEE countries in public owned enterprises is much larger than in privatised enterprises, which in turn is still larger than in new private enterprises. Apart from the stage of transition of the economy, also the transitional stage of the social and political structures makes a difference too. Thus countries that are still in an earlier stage of transition may show higher density rates, but also ‘weaker’ unions. The World Bank study notes “Official density rates in the waged sector in Belarus, Russia, and Ukraine and other CIS countries remain high by OECD standards (estimated between 55 and 90 percent), although effective coverage rates are likely to be lower, given large informal sectors and inflated membership numbers in most countries.” But the same report qualifies the unions in these countries with high density as ‘weak’: “the weakness of unions and employers is a shared feature of Belarus, Russia, Ukraine, and other CIS countries” because “in Belarus, Russia, Ukraine, and other CIS countries, the government remains a much more pervasive force in formal sector wage determination. Unions have not (for the most part) evolved into independent forces in bargaining; they have retained a dominant role, but are almost entirely subject to the determination of wages by the government. In general the communist past has discredited the trade union movement. For example less than half of the unionized workers surveyed Hungary and an even lower proportion of non-unionized workers – had a positive attitude towards unions, or agreed that the existing unions represented workers’ rights adequately. (ILO 2004b) Because of explicit policy choices and a more general rejection of the Soviet inheritance, Estonia has seen the most fundamental changes in wage bargaining of any country of the Region. Together with Latvia and Lithuania, Estonia has witnessed the most dramatic decline in union density and bargaining coverage in the Region. By 2003, union density had fallen to around 16 percent, with 22 percent coverage. The private sector had only 8 percent density and around 19 percent coverage, in contrast to density and coverage rates of 28 and 31 percent, respectively, in the public sector. Although some sectors such as banking, construction, and services have very low unionization, others such as light industry, energy, education, and transport have strong unions, with much higher density. The small enterprise sector, which accounts for around 90 percent of private sector employment, has very limited unionization. The low density and coverage, especially in the private sector, are partly the result of a lack of legal privileges for trade unions. This is reflected in the Collective Agreements Act of 1993, which abandoned the former union monopoly to conclude agreements and to represent workers at the enterprise level. There are no restrictions as to who may be elected or in which proportion to workers. This principle has been upheld not only for collective agreements, but also in later legislation on worker representation, such as the Trade Union Law of 2000. Estonian laws do not restrict union activity, but they do not stipulate any special bodies for codetermination or representation that are reserved for unions, the right to demand the conclusion of collective agreements, or any obligation on employers to enter collective bargaining. Since this survey deals especially with the institutional capacity in and around the garment industry, we are not in the first place interested in the strength of unions at national level, nor in central bargaining structures, but at their ability to protect workers at the shop floor or in courts and other complaints procedures. Comparative figures on union density in the garment industry are lacking. Since the garment industry is highly feminised, we may look at the position of women in the unions instead. EIRO reports: “ Although women make one half of the trade union membership, there are only 27.8 percent of them at congresses of trade union confederations. There are considerable differences between countries, thus at trade union congresses in Baltic countries women are as much as 41.7 percent, while in the Balkans countries there is 19.3 percent on average. Among delegates to the latest congress of Poland’s Solidarnosc, women were less than 10 percent.
42

Percentage women:
Country Confederation /centre 2003***
Bulgaria CITUB 48
EAKL 58,3 Estonia TALO 60
SZEF 70
MSZOSZ 47.9
ASZSZ 35.0
LIGA 30.0
Hungary
MOSZ 30.0
Meridian
Cartel Alfa 45
CNSLR 27
CSDR 30.8
Romania
BNS 29.9
KOZ SR 42.2 Slovakia Others 38.1
Source: EIRO. Another way of representing workers is through works councils. The EU has made some kind of consultation structure mandatory for companies with more than either 20 or 50 workers (Directive 2002/14/EC of 11 March 2002 establishing a general framework for informing and consulting employees in the European Community). But some countries of the CEE had already works council systems in place. Since reliable comparative studies are not available as to how effective they are, this will not be part of this survey. Going to the second measure for trade unions rights, ‘strike frequency’, we are in for some surprises. The less independent Ukrainian or Russian unions are organising strikes, where the Lithuanian unions have not done so: Strikes and Lock outs
2003 2004
Belarus 0 0 Estonia 1 1 Hungary 7 8 Lithuania 0 0 Poland 24 2 Romania 9 11 Russia 291 (2001) 80 (2002) Ukraine 15 4 Source ILO stat ; http://laboursta.ilo.org/cgi-bin/brokerv8.exe Turning now to collective bargaining we will use a summary of the paragraphs in the World Bank Study “Enhancing Job Opportunities: Eastern Europe and the Former Soviet Union”.
43

Taken from WBI 2005 “For most CEE countries, wage bargaining takes place primarily at the enterprise level. The individual work contract is also a very important factor in the most-advanced reformers such as Estonia and Latvia. By contrast, the role of sectoral bargaining is generally limited in CEE countries, with the exception of the Slovak Republic and Bulgaria— with around 40 percent of the workforce covered by sectoral collective agreements—and Slovenia. In some countries, such as Bosnia and Herzegovina they remain very high in the formal sector, because of the strong role of general and sectoral collective agreements. Although more research is needed, this pattern may be typical of former Yugoslav countries, reflecting the residual influence of worker self-management and the role of trade unions prevalent under the former regime. At the same time, the role of the government in formal sector wage setting remains strong. There is also a strong role for sectoral unions and bargaining, the presence of employers as an independent voice again being negligible. Serbia and Montenegro and FYR Macedonia provide examples of more-fragmented union movements, although a general collective agreement and sectoral collective agreements have a strong role in both countries. “ In Belarus, Russia, Ukraine, and other CIS countries, the government remains a much more pervasive force in formal sector wage determination. Unions have not (for the most part) evolved into independent forces in bargaining; they have retained a dominant role, but are almost entirely subject to the determination of wages by the government. In Russia, flexible wage setting coexists with the use of the coefficient system in the private sector. Although most firms use firm-level wage scales, a significant fraction of private firms has adopted the public sector coefficient system.
44

Another problem in regard to collective bargaining is that “In the Republic of Moldova, Serbia and Montenegro and Slovenia, the law stipulates that all collective agreements have to be signed by the chambers of commerce, which are compulsory membership organizations. According to the ILO Governing Body’s Committee on Freedom of Association, this situation is not in line with the principle of voluntary collective bargaining. In Bulgaria, the Republic of Moldova and Romania, the labour code makes collective bargaining compulsory. Most of these problems are hangovers from the previous system, but they appear to be taking a long time to change. “ (ILO 2004c) By far the most elaborate indicator of trade union rights, although still in its infant stage, is Kucera’s index, based on coding violations recorded in three textual sources: the International Confederation of Free Trade Unions’ (ICFTU) Annual Survey of Violations of Trade Union Rights, the United States State Department’s Country Reports on Human Rights Practices, and the ILO’s Report of the Committee on Freedom of Association (Kucera 2004). He notes the limits of these indivual sources and the need for more systematic comparision: The sources are, in many respects, anecdotal in nature, and it is not clear how telling and representative are these anecdotes. It is not difficult to imagine, for instance, that there might have been in nearly every country in the world at least one dismissal of an employee for union-related activities in the 1993 to 1997 period, while such violations are only reported for a smaller share of countries in our three sources. More generally, it is unclear the extent to which the report of violation in a country is indicative of what actually occurred in that country as compared to a country for which no such violation is reported. A similar assessment of existing information sources is made in the U.S. National Research Council’s report (2004). Below the outcomes of Kucera’s study are presented:
GDP per capita, USD
GDP per capita, PPP
FH civil liberties index
FH political rights index
Trade union rights index, unweighted
Trade union rights index, weighted
Albania 658 2659 5.00 6.67 4.76 5.49 Armenia 568 1940 5.00 5.42 Azerbaijan 460 2233 2.08 1.67 9.05 9.10 Belarus 2166 5746 3.75 3.33 4.29 3.98 Bosnia and Herzegovina 648 2.08 2.08 Bulgaria 1277 5225 7.92 8.33 6.19 6.24 Croatia 3457 5955 5.00 5.00 6.19 6.77 Czech Republic 4624 12268 8.33 10.00 7.14 7.29 Estonia 2931 6751 8.33 7.92 8.10 8.05 Georgia 515 2169 3.75 4.17 9.52 9.55 Hungary 4218 9465 8.33 10.00 6.67 6.84 Kazakhstan 1381 4673 3.75 1.67 6.19 6.24 Kyrgyzstan 626 2287 5.83 4.58 Latvia 2098 5142 7.92 7.50 9.05 9.10 Lithuania 1929 5836 7.50 10.00 6.67 6.84 FYR Macedonia 1388 4361 6.67 5.42 Moldova 642 2512 4.58 5.00 Poland 2993 6746 8.33 9.17 8.10 8.20 Romania 1346 6290 6.25 5.83 3.33 4.29 Russian Federation 2574 7403 5.00 6.67 3.33 3.98 Slovakia 3210 8640 5.83 7.92 8.10 8.20 Slovenia 8353 13147 8.33 10.00 8.10 8.05 Tajikistan 283 0.00 0.00 Turkmenistan 772 3422 0.00 0.00 Ukraine 1122 4044 5.00 6.25 5.24 5.04
45
Note: Kucera stresses “Because of the incompleteness of existing information sources and other sources of measurement error, it was never thought that the indicator would be suitable for any application for which each country score must stand on its own, such as for socially responsible investing or monitoring progress in individual countries. The intent in constructing the indicator was, rather, to provide a usable if noisy sense of cross-country variation.” As the table shows, trade union rights are generally not a huge problem in the countries of our survey. Even Belarus and Russia, the worst performers score higher than South Korea (2.93) and Brazil (3.83) for instance. Note that Romania also scores relatively bad (4.29) but still better than the UK, with 4.14 the worst performer in the OECD. Ukraine (5.04) scores better than the USA (4.74). The second worst after the UK in the EU is Spain (8,05). Bulgaria (6.24), Croatia (6.77), Hungary and Lithuania (6.84) all have modest scores (comparable to Japans 6.39). The best performers are Czech Republic (7.29), Estonia (8.05), Poland (8.2) and Latvia (9.1), comparable to Denmark (8.2). Compare: the Trade union rights index, weighted for China and Vietnam is 0.0, for Turkey it is 0.68, USA 4.74, Netherlands 9.55. Ireland, Portugal and Austria are the only countries to score a full 10. The next table shows a clustering of the countries from our survey and some indicators that might offer explanations of the findings. Violations index TU Density CB Coverage Civil Liberties Political
rights Private sector % of GDP
Relatively bad Belarus Russia Romania Ukraine
88***
74.8*** 40 **** 68**
High** -
High**
3.75 5.00 6.25 5.00
3.33 6.67 5.83 6.25
25 65 70 65
Modest Bulgaria Croatia Hungary Lithuania
30* 47* 20 15
Middle**
- 30/High**
15
7.92 5.00 8.33 7.5
8.33 5.00 10 10
75 60 80 75
Relatively good Czech Republic Estonia Poland Latvia
30 15 15 25*
30/Middle** 30/Middle** 40/High**
20
8.33 8.33 8.33 7.92
10
7.92 9.17 7.5
80 80 75 70
Source Kucera 2004
EIRO 2002; * ICFTU CEE 2000; ** Cazes: 2002; ***: World Labour Report 1997-1998 ILO; **** EIRO 2003
Source Freedom house recalculated in Kucera 2004
Source EBRD estimates
Note from EIRO 2003: It should be noted that accurate density figures for the candidate countries are particularly hard to come by, and that in most cases the rates given are estimates. Density is measured generally as union membership as a percentage of all employment, but its should be noted that the various figures given are based on national data, and may be based on different definitions in terms of the union members included (e.g. whether or not retired or inactive members are counted) or the measure of employment used. The table shows a perverse relation between TU density and the violations index, the group with the highest density having the most violations. There is a clear relation between more violations of TU rights and less civil and political liberties. But violations may be caused by governments and/or by employers: “Since early 2000, the ILO Committee has continued to examine cases where it has found that anti-union discrimination has taken place for a variety of reasons. The cases involve anti-union harassment by public authorities sometimes involving interference and intimidation (Belarus, Ukraine), as well as by employers (Romania).” (ILO: Your voice at work, Geneva, 2000). The Freedom House indicators do not look at this last kind of violations. The relatively good performers also have a low % of the informal economy –apart from Latvia, whereas the relatively bad performers are also marked by a high % of the informal economy.
46

6.5 Average income, poverty, inequality and minimum wages A first and obvious reason to look at average income, poverty, inequality and minimum wages is that these indicators may crudely assess the risk of non-compliance with the living wage standard. Moreover, the level of GDP per capita is according to many studies a key indicator for the level of compliance to international labour standards; the poorer a country is, the less likely it will be fully complying to international labour standards. This should not be interpreted as a simple causal relation. Drawing the analogy with governance “a large body of research indicates that there is substantial causation in the other direction as well – better governance leads to higher incomes.” (Kaufmann 2005a). The relation is never one to one. We may point to the analogy to the UNDP Human development index; there are countries that show much higher human development than their rank in GDP per capita would suggest and others where the high average wealth benefits only a few. The first table shows that the CEE countries fall into 4 categories in terms of GPD per capita, with Croatia somewhat in between and Moldova being a sad category of its own: GDP per capita expressed in terms of the EU25 average. EU25 = 100 GDP per capita in 2003 in PPS
Ireland Netherlands
131 120
Czech Republic Slovenia Hungary
77 69 61
Slovakia
51
EU25 100 Estonia 48 Spain 95 Lithuania 46 Portugal 75 Poland 46
Greece 79 Croatia
38
Russia
33
Romania 30 Bulgaria 29 Turkey 27
Macedonia
23
Belarus 22 Ukraine 21
Moldova
6
To get a view what this means in real income figures we present the next table:
47

GDP per capita in PPP 2003 Survey rank Lithuania 11702 4 Bulgaria 7731 8 Romania 7277 9 Ukraine 5491 12 Belarus 6052 11 Poland 11379 5 Macedonia 6794 10 Croatia 11080 6 Hungary 14584 2 Czech Republic 16357 1 Moldova 1510 13 Russian Federation 9230 7 Estonia 13539 3 Source UNDP Human Development Report 2005
Does these income differences translate into cost advantages for garment exporters? The next table makes a comparison:
Country Total costs
Total costs incl. logistics
GDP per capita in % of EU
Costs in Eurocent per Standard Allowed Minute Uzbekistan 2 4 India 3 6 China Inland 3 4 Belarus 7 8 22 FYR Macedonia 8 10 23 Moldova 8 9 6 Romania 8 11 30 Ukraine 8 9 21 Bulgaria 9 11 29 Latvia 9 11 Lithuania 9 12 46 Russian Federation 9 11 33 Serbia 9 10 Estonia 10 12 48 Slovakia 10 12 51 Czech Republic 12 13 77 Hungary 12 14 61 Croatia 13 14 38 Slovenia 13 16 69 Poland 18 21 46 Portugal 18 21 75 Greece 29 32 79 Netherlands 38 40 120 Source: Kurt Salmon Associates, "Global Sourcing Reference” 2005.
Comparing these figures we see that some countries are much more expensive than their average GDP per capita would suggest: Croatia, Poland, Ukraine, Moldova; others are cheaper: Lithuania,
48

Czech Republic. Productivity differences might account for most of these differences, but the outcomes for Poland and Croatia would call for further investigation.
Apart from Russia, most countries do relatively better in regard to human development than would be expected from their GDP ranking. This is mainly due to their good educational results. World wide UNDP
rank Difference with GDP rank
Gini Index of income inequality
Slovenia 26 4 28.4 Czech Rep. 31 7 25.4 Hungary 35 5 26.9 Poland 36 12 34.1 Estonia 38 4 37.2 Lithuania 39 8 31.9 Slovakia 42 1 25.8 Croatia 45 5 29.0 Latvia 48 7 33.6 Bulgaria 55 10 31.9 Macedonia 59 16 28.2 Russia 62 -3 31.0 Romania 64 4 30.3 Belarus 67 17 30.4 Ukraine 78 12 29.0 Moldova 115 3 36.9 USA 10 -6 40.8 Netherlands 12 -1 30.9 Source UNDP Human Development Report 2005
Since garment workers in most countries belong to the lowest paid workers, the average income figures should be qualified by looking at the inequality of income, for which a commonly used indicator is the Gini index (see table above). The inequality of income can also be an indication of the position of the working population because it can be argued that a lower inequality points to a relatively stronger position of workers vis-à-vis other social classes. However, as the table above indicates, there seem to be no relation between the Human Development Index and the Gini coefficient.
The income inequality is still relatively low in our survey countries. Everywhere it is lower than in the US, and much lower than for instance Brazil with a Gini Index of 59.3.
Still income inequality is increasing:
49

Source: Worldbank 2002: Transition, The First Ten Years As can be seen from the table the biggest increases occurred in the countries of the former Soviet Union, including the Baltics. The next, somewhat more detailed table from the same report shows that for 1996-1998 Russia, Moldova and Bulgaria have the biggest income inequality, followed by Estonia, Croatia and Lithuania. Czech Republic and Hungary have by far the lowest income inequality in 1996-98, followed by Belarus. Note that this contradicts the UNDP figures given earlier especially for Russia, Bulgaria and Belarus).
Changes in inequality during the transition, various yearsCountry Gini coefficient of income per capita 1987-1990 1993-1994 1996-1998 CSB 0.23 0.29 0.33 Bulgaria 0.23 0.38 0.41 Croatia 0.36 - 0.35 Czech Republic 0.19 0.23 0.25 Estonia 0.24 0.35 0.37 Hungary 0.21 0.23 0.25 Latvia 0.24 0.31 0.32 Lithuania 0.23 0.37 0.34 Poland 0.28 0.28 0.33 Romania 0.23 0.29 0.30 Slovenia 0.22 0.25 0.30 CIS 0.28 0.36 0.46 Armenia 0.27 - 0.61 Belarus 0.23 0.28 0.26 Georgia 0.29 - 0.43 Kazakhstan 0.30 0.33 0.35 Kyrgyzstan 0.31 0.55 0.47 Moldova 0.27 - 0.42 Russian Federation 0.26 0.48 0.47 Tajikistan 0.28 - 0.47 Turkmenistan 0.28 0.36 0.45 Ukraine 0.24 - 0.47 Source: World Bank 2000
50

Balancing the different figures we may distinct a few groups, but many countries cannot be clearly categorised: Czech Republic and Hungary have clearly the lowest income inequality, joined by Slovakia, Slovenia and possibly Macedonia and Belarus. The highest income inequality can be found in Moldova and Estonia. For all the other countries the data are to contradictionairy. The next table shows the % of population living below the poverty line of 2.15$ per day. Moldova has by far the biggest share, followed by Romania and Russia. Hungary and Czech Republic do best. To shed some light on the situation of the working poor we distinguish in the table between unemployed and wage earners. In general there are no big differences. The unemployed are worse off compared to wage earners in Poland, Lithuania and Bulgaria, compared to Macedonia, Ukraine and Belarus. % of population below poverty line*
Wage Earners Unemployed All Rank
Lithuania 1 9 4 6 Bulgaria 2 10 4 6 Romania 7 21 12 11 Ukraine 1 2 1 3 Belarus 2 5 2 4 Poland 1 7 3 5 Macedonia 2 5 4 6 Croatia Hungary 0 1 0 1 Czech Republic . . . 1 Moldova 47 71 56 12 Russian Federation 7 16 9 10 Estonia 3 10 4 6 *: 2.15$ per day (adults >.15 years old) Source: WB Poverty Report. table 6 Note that according to these figures, poverty is worse in Poland than in Belarus and Ukraine. According to a more detailed study (World Bank 2005) Macedonia does relatively well in poverty reduction:
Poverty is defined as percent of population living below PPP-adjusted $4.30 per day per capita. The UNDP also provides for poverty figures. These show a somewhat different picture:
51

Population below poverty line of 4$ a day
1996-1999 Survey rank % of population Lithuania 4 17 Bulgaria 6 22 Romania 7 23 Ukraine 8 25 Belarus .. Poland 3 10 Macedonia .. Croatia .. Hungary 1 <1 Czech Republic 1 <1 Moldova 10 82 Russian Federation 9 53 Estonia 5 18 Source UNDP Human Development Report 2005
Russia and Estonia do worse in poverty ranking than in GDP which may be caused by their large inequality in income distribution. Poland does slightly better.
Note the different ranking in the tables for Romania, in the same league as Bulgaria according to the UNDP, double the % of poor according to the World Bank, worse than Russia, which according to the UNDP again has double the % of poor of Romania. Similar confusing figures are found for Ukraine.
The next table gives for the EU and accession countries a more subjective measurement of poverty. The picture is different from the table above.
Quality of Life Survey Eurofound 2003. Bulgaria, Poland and Latvia do worst here, Slovenia, Czech Republic, Slovakia and Hungary do best amongst the CEE countries, each of them scoring better than Greece, the worst ‘old EU’ member in this respect. Another measurement of poverty might be the % of people living on the minimum wage:
52

As we can see the old EU countries and new EU mix among each other here. Estonia has the lowest share of the whole EU, Latvia and Lithuania the highest:
No surprise the differences in the height of the minimum wage are much more pronounced between the ‘Old EU’ members and the new members from CEE. Romania, Bulgaria, Latvia and Lithuania that also have the highest share of people earning the minimum wage!) have the lowest minimum wage; amongst the CEE countries Slovenia has the highest followed by Czech Republic and Hungary.
Applying PPP does reduce the gap, but the ranking remains. Note that Slovenia now shows a higher figure than Portugal:
53

Another measure for the relative height of the minimum wage, is to measure it against the average wage, see table below. Lithuania now ranks amongst the highest, together with Slovenia and Hungary. Slovakia, Poland, Czech Republic and Latvia rank amongst the worst, together with the UK:
Looking at a wider sample, the World Bank concluded that minimum wages vary a great deal across the transition countries. “Minimum wages in the transition countries exhibit a clear divide between CEE and SEE on the one hand, where they average close to 40 percent of the average wage (AW) in 2002, and the CIS (except Ukraine) on the other hand, where they are only around 20 percent (and for several countries less than 10 percent) of the average wage. These ratios place CEE at the high end of the range of minimum wages by international standards and CIS at the low-to-modest end. In Ukraine, where the minimum wage is comparatively high, there is evidence that it is not enforced. Macedonia has a high minimum-wage-to-average-wage ratio.
54
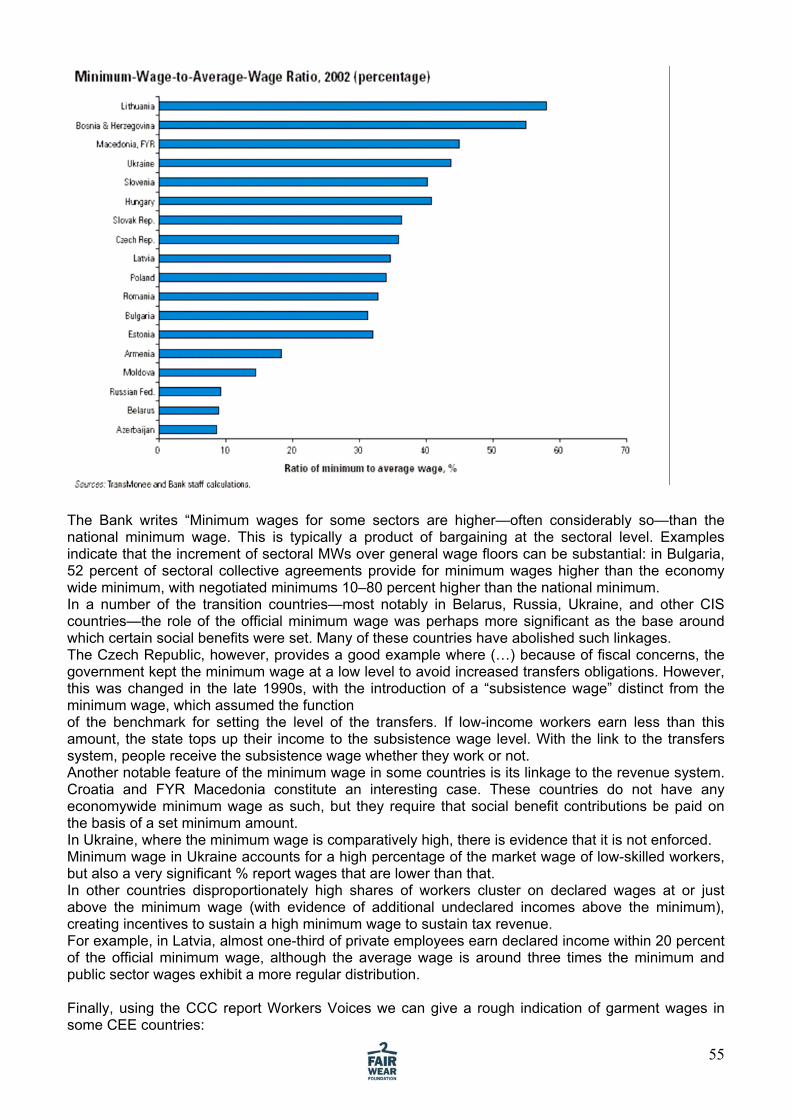
The Bank writes “Minimum wages for some sectors are higher—often considerably so—than the national minimum wage. This is typically a product of bargaining at the sectoral level. Examples indicate that the increment of sectoral MWs over general wage floors can be substantial: in Bulgaria, 52 percent of sectoral collective agreements provide for minimum wages higher than the economy wide minimum, with negotiated minimums 10–80 percent higher than the national minimum. In a number of the transition countries—most notably in Belarus, Russia, Ukraine, and other CIS countries—the role of the official minimum wage was perhaps more significant as the base around which certain social benefits were set. Many of these countries have abolished such linkages. The Czech Republic, however, provides a good example where (…) because of fiscal concerns, the government kept the minimum wage at a low level to avoid increased transfers obligations. However, this was changed in the late 1990s, with the introduction of a “subsistence wage” distinct from the minimum wage, which assumed the function of the benchmark for setting the level of the transfers. If low-income workers earn less than this amount, the state tops up their income to the subsistence wage level. With the link to the transfers system, people receive the subsistence wage whether they work or not. Another notable feature of the minimum wage in some countries is its linkage to the revenue system. Croatia and FYR Macedonia constitute an interesting case. These countries do not have any economywide minimum wage as such, but they require that social benefit contributions be paid on the basis of a set minimum amount. In Ukraine, where the minimum wage is comparatively high, there is evidence that it is not enforced. Minimum wage in Ukraine accounts for a high percentage of the market wage of low-skilled workers, but also a very significant % report wages that are lower than that. In other countries disproportionately high shares of workers cluster on declared wages at or just above the minimum wage (with evidence of additional undeclared incomes above the minimum), creating incentives to sustain a high minimum wage to sustain tax revenue. For example, in Latvia, almost one-third of private employees earn declared income within 20 percent of the official minimum wage, although the average wage is around three times the minimum and public sector wages exhibit a more regular distribution. Finally, using the CCC report Workers Voices we can give a rough indication of garment wages in some CEE countries:
55

Wages in garment companies Wages in Euro Min. wage Poland 184-207, with OT 230-253 189 Bulgaria 55 gross/48 net monthly;
61-77 monthly
55/48
Macedonia 50-200 monthly/ 4,4-6,5 daily Romania 86 net, with OT
111-125 average take-home
86
Moldova Average income per year: 300 Source: CCC: Workers Voices, 2005. The official unemployment figures for the countries of this survey are not very reliable since definitions are not similar and statistics from some countries are not very reliable. Still the magnitude of the problem in countries like Macedonia, Poland, Croatia and Bulgaria is obvious. For the EU and the Accession Countries the next table shows the situation as of 2004:
Unemployment levels in Poland and Slovakia are unmatched for in the EU. For women also Estonia scores very badly, just like Greece and to a lesser extend Italy. Official figures in Czech Republic, Slovenia, Hungary and Lithuania are below the EU 25 average. The WBI (2005b) has published a comparison of different employment measures. Figures from Household Budget Survey (HBS) or variations on it, such as the Integrated Survey or the Living Standards Measurement Study (LSMS). These figures may differ from official labour data, which rely on different sources. Such discrepancy is not unique to the Region, with HBS data generally capturing higher employment ratios than specialized labour market surveys. Such a discrepancy may come from a different reference period to qualify respondents as employed (in the HBS, typically a longer survey period) or to better capture some informal activities in the HBS/LSMS integrated surveys.
56
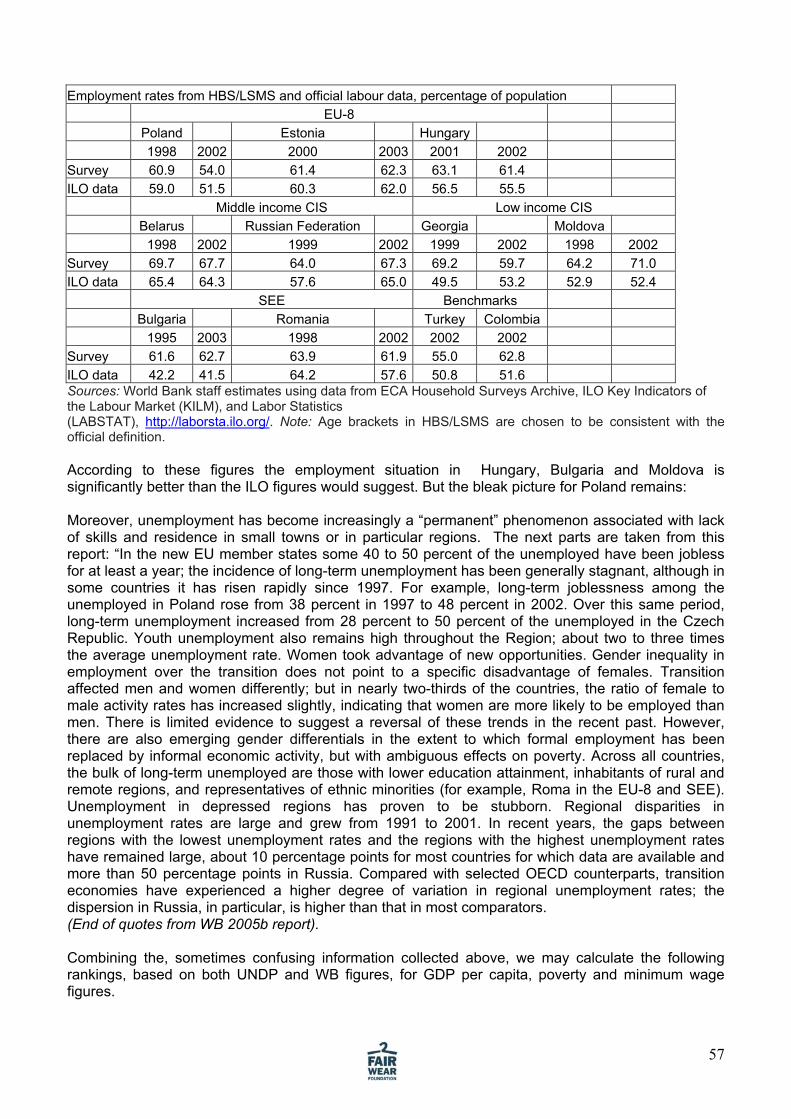
Employment rates from HBS/LSMS and official labour data, percentage of population EU-8 Poland Estonia Hungary 1998 2002 2000 2003 2001 2002 Survey 60.9 54.0 61.4 62.3 63.1 61.4 ILO data 59.0 51.5 60.3 62.0 56.5 55.5 Middle income CIS Low income CIS Belarus Russian Federation Georgia Moldova 1998 2002 1999 2002 1999 2002 1998 2002 Survey 69.7 67.7 64.0 67.3 69.2 59.7 64.2 71.0 ILO data 65.4 64.3 57.6 65.0 49.5 53.2 52.9 52.4 SEE Benchmarks Bulgaria Romania Turkey Colombia 1995 2003 1998 2002 2002 2002 Survey 61.6 62.7 63.9 61.9 55.0 62.8 ILO data 42.2 41.5 64.2 57.6 50.8 51.6 Sources: World Bank staff estimates using data from ECA Household Surveys Archive, ILO Key Indicators of the Labour Market (KILM), and Labor Statistics (LABSTAT), http://laborsta.ilo.org/. Note: Age brackets in HBS/LSMS are chosen to be consistent with the official definition. According to these figures the employment situation in Hungary, Bulgaria and Moldova is significantly better than the ILO figures would suggest. But the bleak picture for Poland remains: Moreover, unemployment has become increasingly a “permanent” phenomenon associated with lack of skills and residence in small towns or in particular regions. The next parts are taken from this report: “In the new EU member states some 40 to 50 percent of the unemployed have been jobless for at least a year; the incidence of long-term unemployment has been generally stagnant, although in some countries it has risen rapidly since 1997. For example, long-term joblessness among the unemployed in Poland rose from 38 percent in 1997 to 48 percent in 2002. Over this same period, long-term unemployment increased from 28 percent to 50 percent of the unemployed in the Czech Republic. Youth unemployment also remains high throughout the Region; about two to three times the average unemployment rate. Women took advantage of new opportunities. Gender inequality in employment over the transition does not point to a specific disadvantage of females. Transition affected men and women differently; but in nearly two-thirds of the countries, the ratio of female to male activity rates has increased slightly, indicating that women are more likely to be employed than men. There is limited evidence to suggest a reversal of these trends in the recent past. However, there are also emerging gender differentials in the extent to which formal employment has been replaced by informal economic activity, but with ambiguous effects on poverty. Across all countries, the bulk of long-term unemployed are those with lower education attainment, inhabitants of rural and remote regions, and representatives of ethnic minorities (for example, Roma in the EU-8 and SEE). Unemployment in depressed regions has proven to be stubborn. Regional disparities in unemployment rates are large and grew from 1991 to 2001. In recent years, the gaps between regions with the lowest unemployment rates and the regions with the highest unemployment rates have remained large, about 10 percentage points for most countries for which data are available and more than 50 percentage points in Russia. Compared with selected OECD counterparts, transition economies have experienced a higher degree of variation in regional unemployment rates; the dispersion in Russia, in particular, is higher than that in most comparators. (End of quotes from WB 2005b report). Combining the, sometimes confusing information collected above, we may calculate the following rankings, based on both UNDP and WB figures, for GDP per capita, poverty and minimum wage figures.
57

World wide UNDP rank
GDP Poverty Gini Index of income inequality
Height of Minimum wage rank
Subjective poverty *
Czech Rep. 31/1 1 1 Low 1 1 10,6 Hungary 35/2
Unemploy-ment rate % 2004
2 1 Low 2 2 5,9 Poland 36/3 5 3 19,5 Estonia 38/4 3 6 4 3 9,6 Lithuania 39/5 4 5 4 8 Croatia 45/6 13,8 Bulgaria 7 6 6 7 12,7
59/8 9 6 Low? 37,7 Russia 62/9 6 11 Romania 64/10 8
3 6 High
5 5?
55/7 Macedonia
8,3 10 7 5 6,3
Belarus 67/11 10 3 Low? 2 Ukraine 78/12 11 6 9-10** Moldova 115/13 12 12 High 8 *: % of households having problems making ends meet; ** ILO estimate (CIA: 3,5%) Estonia, Russia and Romania do much worse on poverty than might be expected form their GDP per capita; Belarus, Ukraine, Macedonia and Poland do better. Still for Ukraine and Belarus, their Human development index is as low as their GDP per capita would suggest. Russia and Romania have a much lower Human development index is as low as their GDP per capita would suggest which corresponds with their high poverty shares. The opposite is true for Poland and Macedonia. It is also interesting to see that how, amongst EU and applicant countries, the Minimum wage ranking exactly follows the Human Development Index, but not for GDP per capita because of Poland’s relatively high minimum wage, which corresponds to Poland doing better also on poverty levels compared to the Baltic states. Poland however scores very high on the % of households having problems making ends meet, whereas Romania does much better than might be expected on the basis of the other measures. Again this shows how careful one must be in using single measurements.
58

6.6 Gender gap In general, in the CEE countries, gender segregation is lower than in the EU and the dual workload is more gender balanced. Women in the CCs are more likely to be in a higher hierarchical position than their EU counterparts (15 per cent of men report a woman as their boss, compared to 7 per cent in the EU). (Rice/ ILO 2002) The World Economic Forum released a study in 2004 that attempts to quantify the size of the "gender gap" in 58 countries in five critical areas based on UNIFEM's (United Nations Development Fund for Women). Two of them are especially interesting for our survey: 1) economic participation - equal remuneration for equal work; 2) economic opportunity - access to the labour market that is not restricted to low-paid, unskilled jobs. While no country has yet managed to eliminate the gender gap, the Nordic countries have succeeded best in narrowing it and, in a very clear sense, provide a workable model for the rest of the world. In the overall ranking, including also politics, education and health, EU countries do generally well in the rankings, with 10 EU members in the top 15 positions. Setting aside the three Nordic countries that are also EU members (Sweden, Denmark and Finland), the United Kingdom (8) and Germany (9) lead the way. Some of the new EU members place well, with Latvia (11), Lithuania (12) and Estonia (15), well ahead of Belgium (20), Portugal (23) and Spain (27). Italy (45) and Greece (50) have the lowest rankings in the EU. Former Soviet bloc countries, such as Poland (19), Hungary (24), the Slovak (21) and Czech (25) republics do generally well, reflecting the fact that these countries for long periods of time subscribed to an ideology that encouraged a "worker-woman" notion of equality, although one in which women bore an unusually heavy burden, at home and in the workplace. The Russia Federation (31) shows similar results to those of China, boosted in the rankings by a high economic participation (3), but compromised by low political empowerment (47) and health and well being (57). The next table shows the economic rankings from the World Economic Forum. Added are two measures from the Human Development report 2005. Gender Gap ranking (1= lowest gap, 58 highest)
Economic participation -
Economic opportunity
Average ranking (column 2+3)/2
Gender empowerment measure (GEM
Ratio of estimated female to male earned income (%)
Latvia 4 6 5 0,606 62 Russia 3 10 6,5 0,477 64 Estonia 8 5 6,5 0,595 64 Lithuania 10 11 10,5 0,614 68 Bulgaria 11 14 12,5 0,604 67 Czech Rep. 24 4 14 0,595 64 Hungary 30 3 16,5 0,528 62 Slovenia 26 15 20,5 0,603 62 Poland 25 19 22 0,612 62 Slovakia 14 33 23,5 0,597 65 Romania 23 31 27 0,488 58 Ukraine 0,417 53 Belarus - 65 Macedonia 0,555 56 Croatia 0,599 56 Moldova 0,668 65 Netherlands 32 16 24 0,814 53 US 19 46 32,5 0,793 62 Greece 44 48 46 0,594 45
59
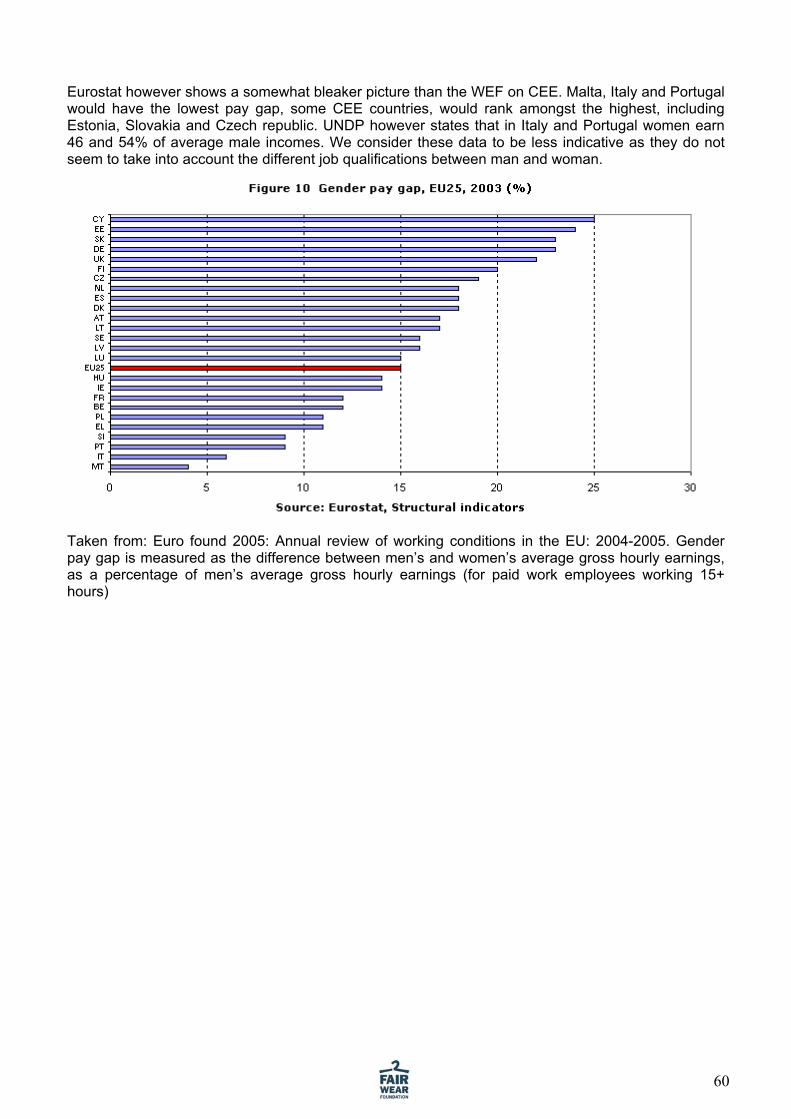
Eurostat however shows a somewhat bleaker picture than the WEF on CEE. Malta, Italy and Portugal would have the lowest pay gap, some CEE countries, would rank amongst the highest, including Estonia, Slovakia and Czech republic. UNDP however states that in Italy and Portugal women earn 46 and 54% of average male incomes. We consider these data to be less indicative as they do not seem to take into account the different job qualifications between man and woman.
Taken from: Euro found 2005: Annual review of working conditions in the EU: 2004-2005. Gender pay gap is measured as the difference between men’s and women’s average gross hourly earnings, as a percentage of men’s average gross hourly earnings (for paid work employees working 15+ hours)
60

6.7 Child labour Figures on ‘child labour’ can be hard to compare since there is a difference between ‘economically active children’ and ‘child labourers’. The first category includes children who do paid and unpaid work (including those who are temporarily unemployed), self-employed children, apprentices, and paid family workers. The second definition, based on ILO conventions ‘child labour‘ means work that is hazardous to the emotional and physical development of children below a specified minimum age, as distinguished from “child work,” which is not automatically considered problematic. A broader definition includes children who do paid and unpaid work (including those who are temporarily unemployed), self-employed children, apprentices, and paid family workers. “According to Ritualo, the “economic activity” definition has both strengths and limitations. One strength lies in the fact that this type of data has been gathered in many labour force surveys, providing experience in design of questionnaires. Another strength is that there is a large amount of data on children’s work in many countries, based on this common definition. This means that “it is easier to compare countries” with this definition than with a “child labour” definition. However, the economic activity definition is limited in its ability to measure unpaid family work, part-time work, work such as carrying wood or water, illegal activities, begging, and household chores.” (NRC 2003). “With respect to certain elements in the definition of child labour, the ILO has deliberately built in a large degree of national discretion, both in defining different categories of work (e.g., light or hazardous work) and in setting minimum ages for employment of children (which may vary with the level of development and with the ages of compulsory schooling). Although it is understandable and appropriate to allow national discretion in setting standards, variations across nations in standards make cross-country comparisons quite difficult. And the variability of national laws can also yield a seemingly odd result in terms of measuring progress. Countries that set higher or more ambitious standards for themselves may appear to be making less progress than countries that set lower standards. For example, if in one country some activities are declared as hazardous to children, but not in another country, even if the same proportion of children are found to be working in these activities, the former country would seem to be making less progress in meeting its own standards than the latter.” (NRC 2004) “An economically active child may or may not be engaged in child labour by ILO definitions. For example, a 14-year-old child working in a family shop after school is considered economically active but is probably not engaged in child labour, because this work may be categorized as light work appropriate for children over 12, since it is not physically or emotionally harmful and does not interfere with the child’s education, or a child kept home from school to do unpaid heavy household work for long hours may be engaged in child labour but might not be considered economically active.”(IBID) Data Analyst Amy Ritualo (2002), of the ILO International Programme on the Elimination of Child Labour, states that the “economic activity” definition has both strengths and limitations. One strength lies in the fact that this type of data has been gathered in many labour force surveys, providing experience in design of questionnaires. Another strength is that there is a large amount of data on children’s work in many countries, based on this common definition. This means that “it is easier to compare countries” with this definition than with a “child labour” definition. However, the economic activity definition is limited in its ability to measure unpaid family work, part-time work, work such as carrying wood or water, illegal activities, begging, and household chores. Since the aim of our survey is to shed some light on conditions in the export garment industry, some of these distinctions might be ignored, although if garment production chains involve home working, children can be involved in helping out with this production. One of the most authorative sources on child labour, the UNICEF does not publish child labour figures for most of the countries covered in this survey. The table compares some countries in which FWF is active with a few CEE countries and suggest that on the Balkan and some former CIS countries the problem is huge. Country Child labour (5-14 years) 1999-2004 Albania 23 Bosnia and Herzegovina 11 Bangladesh 7 India 14
61

Moldova 28 Romania 1 Viet Nam 23 Child labour – Percentage of children aged 5 to 14 years of age involved in child labour activities at the moment of the survey. A child is considered to be involved in child labour activities under the following classification: (a) children 5 to 11 years of age that during the week preceding the survey did at least one hour of economic activity or at least 28 hours of domestic work, and (b) children 12 to 14 years of age that during the week preceding the survey did at least 14 hours of economic activity or at least 42 hours of economic activity and domestic work combined. Source: UNICEF the Future of the Worlds Children 2006 Another authoritative source, the ILO (Every Child counts, ILO 2002), using a more limited definition estimates the % of children of a 5-14 to be working to be 2% in the developed countries, 4% in transition economies, 19% in Asia and 15% in Middle East and North Africa. For working teenagers (15-17) the picture is totally different, the % all over the world ranges from 30 to 50 per cent, be 31% in the developed countries, 29% in transition economies, 48% in Asia and 32% in Middle East and North Africa highest relative number of working teenagers. "Child labour" as estimated by the ILO consists of all children under 15 years of age who are economically active excluding (i) those who are under five years old and (ii) those between 12-14 years old who spend less than 14 hours a week on their jobs, unless their activities or occupations are hazardous by nature or circumstance. Added to this are 15-17 year old children in the worst forms of child labour. Some individual country reports confirm that child labour is not huge phenomenon in. In 2001, the ILO estimated that less than 1 percent of children ages 10 to 14 years in Macedonia were working. The European Environment and Health Committee stated that child labour is not a problem in Belarus. On Moldova, the US Dept. of State Country Report on Human Rights Practices – 1999 (25 February 2000) reported that child labour is not used in industry, although children living in rural areas often assist in the agricultural sector. Moldova is a primarily agricultural country, and it is common for children in rural areas to work on family farms or help with household chores. So it comes as no surprise that the UCW reports a percentage of children economically active only or economically active and studying (including children that carry out household chores more than 4 hours a day) to be 22% in the age of 5-9 and 48% in the age of 10-14. Eric Neumayer (Trade Openness, Foreign Direct Investment and Child Labour 2004) states that the former Communist countries of Eastern Europe and the former Soviet Union, “traditionally have low child labour incidence (or possibly under-reporting of such incidence).” He concludes: “Higher per capita income levels and a higher urbanization rate are associated with lower child labour incidence as expected. The coefficient of the GDP share of agriculture is positive, but marginally insignificant. Both trade openness and the stock of FDI per GDP are highly significant and negatively associated with the labour force participation rate of children. As we would expect, all other things equal, Eastern European and Central Asian countries have a lower labour force participation rate than South Asia, the reference category.“ Since child labour does not seem to be an issue in the industries of the CEE countries, we will not present a country ranking.
62

6.8 Forced labour Forced labour is not reported to be a problem in the region part from victims of trafficking. The next table gives an indication of the problem: The link between trafficking and poverty
Identified victims of trafficking
Population living on less
than Selected European countries of origin
(2000-June 2003)
USD 2 a day (%)
Albania 2241 11.8 Moldova 1131 63.7 Romania 778 20.5 Bulgaria 352 16.2 Ukraine 293 45.7 Croatia 3 <2 Czech Republic 2 <2 Poland 1 <2 Hungary 1 7.3 1 The data are only illustrative and represent a tentative indication of the link between trafficking and poverty. Sources: Counter-Trafficking Regional Clearing Point, op. cit., p. 10; poverty figures from World Bank, op. cit., table 2.5. Taken from ILO 2005
63

6.9 Working Time The European Foundation for the Improvement of Living and Working Conditions produces a wealth of figures on this issue. However these data are of limited use to FWF’s work, since the give averages. In the garment industry, with its high peaks followed by slack periods of little work, averages may hide extreme OT in peaks, they do not show how high these peaks are and how often they occur. Also since they deal with the acceding and candidate countries, they only cover 7 countries from our survey. Still the next table shows a first indicator of the magnitude of the problem: the usual hours of male workers in the UK, Latvia and Poland are already very close to the maximum limit of what is allowed according to the ILO standard. (Since amongst female workers part time work is more common and thus the average is lower, this distorts the picture too much to take that figure as a standard). Note that the old EU member UK performs the worst; from the CEE countries only Lithuania is below the EU 25 average.
Source: Annual review of working conditions in the EU: 2004–2005, EuroFound 2005. Another EuroFound publication, Working and living’ in an enlarged Europe, 2005 shows that large shares in the acceding and candidate countries work more than 48 hours. Hungary doing the worst of the CEE countries (excluding Turkey), Estonia doing best from the acceding and candidate countries. Note that the UK is doing much better in this table.
64

A third publication, Working conditions in the acceding and candidate countries European Foundation for the Improvement of Living and Working Conditions, 2004 gives the most detailed information: The average working week for all workers is 44.44 hours in the acceding and candidate countries, against 38.19 hours in the EU. Moreover 21 % of employees report to make weeks of 45-59 hours (EU 15: 2) and even 9 % (EU 15: 3) report weeks of 60-80. For manufacturing these figures for the acceding and candidate countries are 29% and 17%. Since country figures per sector are lacking, and the share of agriculture makes a big difference, especially in the 60-80 category, the next table should be interpreted with care: Length of the working week by country Hours: BG CZ EE LT LV HU PO RO SI SK ACC12 EU15
<10 2 1 1 1 1 1 3 2 1 1 2 2 10-19 1 2 1 2 2 1 3 3 3 1 2 6 20-29 4 4 3 6 5 3 6 8 5 4 6 9 30-39 7 12 6 9 9 5 7 9 35 5 9 35 40-49 53 54 63 48 45 62 38 34 33 59 44 28 50-59 21 21 17 17 24 17 22 24 17 24 22 14 60-80 13 8 8 17 15 10 21 20 5 6 16 6
There are considerable variations in the average working week between countries, ranging from 39.8 hours in Slovenia to 45.9 hours in Romania (which has the highest proportion of agricultural workers). Apart from indicating that excessive OT is a big problem, these figures do not allow us to draw detailed conclusions. To summarize from the three indicators we may study the next table: Worst performers rank, 1= worst
Usual hours worked per week
% Working over 48 hours
% Working over 45 and over 59 hours
Poland 2 4 2 Latvia 1 3 3 Romania - 2 1 Bulgaria - 6 4 Hungary 5 1 7 Czech Republic 3 5 6 Lithuania 7 7 5
65

Estonia 4 9 8 EU 15/25 Average -/6 10/8 9/- The figures indicate that OT occurs to a much higher degree in the CEE countries than in the EU-15. On usual hours worked per week only Lithuania scores below the EU25 average, on % working over 48 hours only Estonia scores below the EU25 average. Apart from Poland and Romania clearly performing badly and Estonia and Lithuania clearly performing much better, there is little to conclude further from this little exercise, apart from the fact that these figures do not seem to be very reliable, given the different outcomes for counties amongst similar indicators.
66

6.10 Occupational Safety and Health Professor Andrew Watterson, in his article ‘Occupational health in Central and Eastern Europe in the 1990s: one step forward and two steps backward?’ writes “The tragedy of CEE occupational health is that good practices and substantial knowledge bases have sometimes been destroyed completely this decade. For example, factory-based health care schemes operated in some respects in a far more effective way 10 years ago than they do now. Occupational medicine in CEE, in terms of resources and staffing, was in several respects a model worth following in Western Europe. The regulation including banning of substances, for instance particular pesticides, in countries such as Hungary and Poland also ensured better health and safety standards and practices for employees. Toxicology research which informed regulatory standards carried out in Slovakia, Russia and Hungary was for instance sometimes decades ahead of Western Europe practice although these strengths had limited recognition in the west. Now we have seen a dismantling of some good practice and successful health and safety systems in favour of much more hazardous approaches. Russia has been a world leader for many years in setting standards preventing exposure of women to reproductive hazards.” He also states: “increasingly the strengths of ‘old’ CEE occupational health principles appear to be being eroded and position has often been further damaged along with or as part of declining economic and social infrastructure. It could be argued that CEE occupational health now is now trebly adversely affected: by the past focus on heavy industry with greater hazards to greater numbers of employees; by the run down of those traditional industries in the new market economies and hence declining health and safety standards and systems compared to the pre-1988 period; and by the adverse effects on health of an unemployed or underemployed workforce. On the other hand Rice (2002), Senior Specialist Occupational Safety and Health, ILO Central and Eastern European Team (Budapest) states, that much progress has been made, “most noticeable in the European Union (EU) candidate countries, for which the process of accession involves the adoption of EU directives on occupational safety and health. But still there are marked differences between the candidate countries and the EU. If we consider fatal occupational accident rates, for example, ILO estimates for the countries of former socialist Europe show a work-related fatality rate of 11.1 per 100,000 workers. This compares most unfavourably with the calculated rate for EU countries of 5.89/100,000 in general, and even of 3/100,000 in some Nordic countries.” The contradiction with Watterson’s remarks may be not as big as it seems, since Rice continues: “Exposure to physical risk factors, especially noise, heat and painful positions, is higher. Use of personal protective equipment is, on the other hand, more developed, particularly in Poland, Romania and Slovenia, indicating more collective means of prevention in the EU. Not all aspects of the former system can be considered as bad. For example, it included a highly developed occupational health services component, an element that still dominates even if it has dwindled along with resources.” Rice also notes: “But one aspect that is still characteristic of countries in Central and Eastern Europe and which does nothing to help prevent risks and protect workers is the institutionalized classification and certification of hazardous industries. This determines if a worker is entitled to extra pay, early retirement, shorter working hours and/or food and beverages to counteract the ill effect of hazardous working conditions. Indeed, the ACTRAV survey found that hazard pay was still widespread in the region and very common in Bulgarian and Lithuanian workplaces. The Hungarian Occupational Safety and Health Act of 1993 specifically states that “the employer may not replace compliance with the requirements of healthy and safe working conditions with monetary or other inducements to the employee”. Hazard pay and other benefits for working in dangerous conditions are obviously deeply rooted in the region, but as the experience in Hungary shows, this can be rethought. This is not just a question of reviewing and reforming legislation but also of changing deeply entrenched attitudes. As elsewhere in the world, the recent proliferation of small and medium-sized enterprises means that many workplaces will fall outside the scope of understaffed and underfunded enforcement agencies.
67

But added to this is the general upheaval caused by restructuring of labour inspection services from the domain of trade unions in the former socialist economies. Coupled with this are the remnants of the inherited system of control and delivery of occupational health services which are still in flux. Many countries are modernizing their labour inspection services into a state system which integrates health and safety responsibilities. In many cases, the new state-run inspection services are still fragmentary, falling under the responsibilities of two or more ministries. While general or state labour inspectorates have been set up, accompanied by regional inspectorates, it is still standard practice in most countries to rely on the Ministry of Labour for regulation of safety and employment aspects of compliance with legislation, and the Ministry of Health for health-related aspects, including monitoring of hazardous agents. The aim is a rationalization of labour inspection services through integration of occupational safety and occupational hygiene responsibilities under a single central authority.” (End of quotes from Rice). There are hardly any useful data comparing the level of OSH standards across countries. The American Committee that discussed measuring labour standards concluded that there is no comparable international consensus supporting a defined set of standards governing working conditions. (NRC 2004: 225). ILO maintains a database, ATLAS, with data on the number, characteristics, roles, training, and functions of labour inspectors. But of the CEE countries it only covers Poland and Latvia. Moreover OSH is hard to measure. The NRC (2004:241) committee proposed to use two indicators: the number of work-related fatalities per 100,000 workers, both overall and by industry sector; and the number of occupational injuries, both absolute and as a fraction of the total workforce and the workforce covered by health and safety laws. But they also note that definitions and survey methods differ across countries. Moreover they note (243) “Researchers have found that occupational injuries and illnesses are systematically underreported, even (sic) in the United States, a developed nation with both extensive health and safety regulations and expertise in surveys and statistics, (Azaroff et al., 2002). At the ILO, experts developing indicators of “decent work” have chosen to focus only on occupational fatalities because of the limited reliability of data on occupational accidents and diseases. In addition to fatalities, their indicators include the number of labour inspections, the number of employees covered by occupational injury insurance”. Watterson notes that the Finns “probably have the best system of occupational disease reporting, the best health and safety at work standards and also in some instances the highest occupational disease rates. This reflects the poor reporting standards elsewhere in Europe and the very good reporting standards in Finland.” A crucial element defining the accuracy of these figures is the question who is registering and why? If the company registers these injure in order to get insurance money to pay the worker there may be a positive incentive to register. But if registering means that the factory that does this will be subject to thorough investigation and punishment, there is no incentive to do so. Hence the next table that shows that the Baltic countries score high on accidents at work, together with Sweden and the Netherlands; and Poland and Hungary score low together with Greece and Italy is of questionable value.
68

Because reporting as such is not very reliable, the ILO has developed a model for estimating fatality rates per 100.000 workers: Fatality rate Accident rateBelarus 112 8574 Bulgaria 114 8718 Croatia 129 9812 Czech Rep. 123 9398 EME* 4.2 3240 Estonia 92 7049 Hungary 103 7853 Latvia 101 7647 Lithuania 111 871 Macedonia 139 10571 Moldova 90 6905 Poland 100 7649 Romania 144 11008 Russian Fed. 110 8368 Slovakia 106 8059 Slovenia 123 9409 Ukraine 173 13224 * EME: Established Market Economies. Source Hämäläinen et al 2006 Apart from Lithuania the model provides for similar rankings for the two indicators. According to this model most of the new EU members do reasonably well, but so does Moldova. Romania and Slovenia have high fatality and accident figures. Eurostat’s high figures fro Estonia and Latvia are not confirmed. Compared to the EME countries only Spain shows worse fatality figures (89) than the best in class Moldova, on accident figures Spain (6803), Italy, US, and Ireland (3956) do worse than the best in class of our survey, but the Lithuanian figure is not very convincing.
69
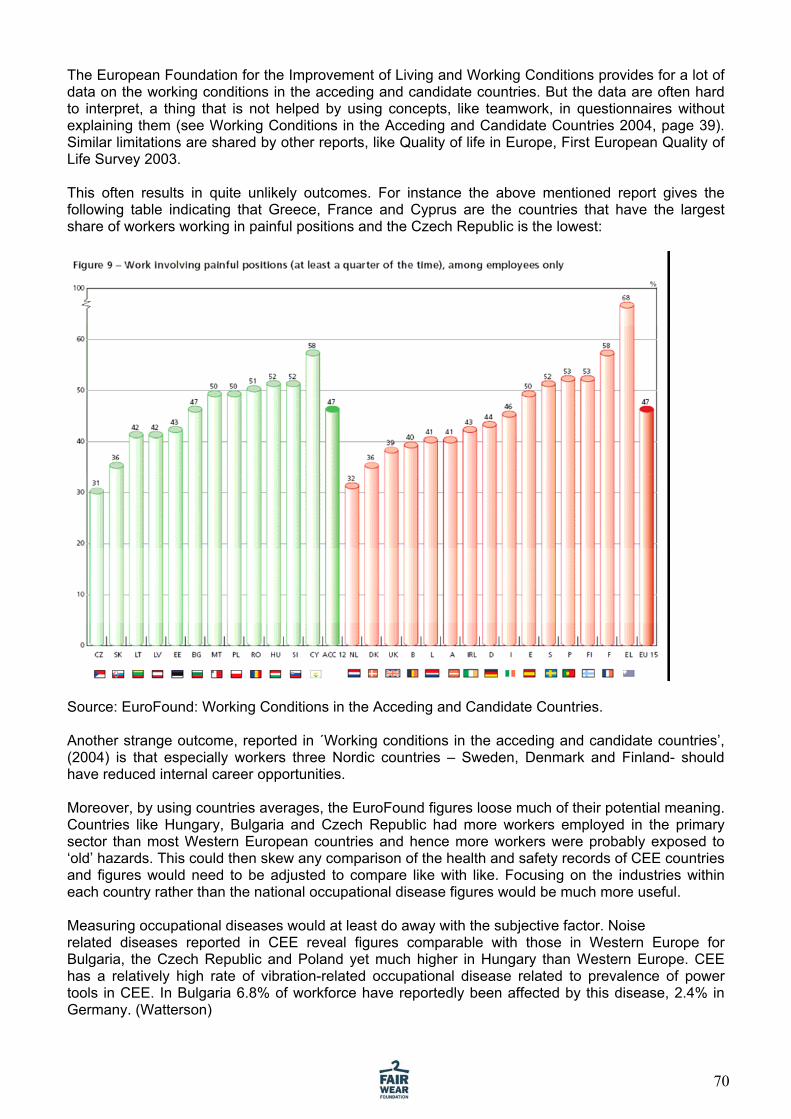
The European Foundation for the Improvement of Living and Working Conditions provides for a lot of data on the working conditions in the acceding and candidate countries. But the data are often hard to interpret, a thing that is not helped by using concepts, like teamwork, in questionnaires without explaining them (see Working Conditions in the Acceding and Candidate Countries 2004, page 39). Similar limitations are shared by other reports, like Quality of life in Europe, First European Quality of Life Survey 2003. This often results in quite unlikely outcomes. For instance the above mentioned report gives the following table indicating that Greece, France and Cyprus are the countries that have the largest share of workers working in painful positions and the Czech Republic is the lowest:
Source: EuroFound: Working Conditions in the Acceding and Candidate Countries. Another strange outcome, reported in ´Working conditions in the acceding and candidate countries’, (2004) is that especially workers three Nordic countries – Sweden, Denmark and Finland- should have reduced internal career opportunities. Moreover, by using countries averages, the EuroFound figures loose much of their potential meaning. Countries like Hungary, Bulgaria and Czech Republic had more workers employed in the primary sector than most Western European countries and hence more workers were probably exposed to ‘old’ hazards. This could then skew any comparison of the health and safety records of CEE countries and figures would need to be adjusted to compare like with like. Focusing on the industries within each country rather than the national occupational disease figures would be much more useful. Measuring occupational diseases would at least do away with the subjective factor. Noise related diseases reported in CEE reveal figures comparable with those in Western Europe for Bulgaria, the Czech Republic and Poland yet much higher in Hungary than Western Europe. CEE has a relatively high rate of vibration-related occupational disease related to prevalence of power tools in CEE. In Bulgaria 6.8% of workforce have reportedly been affected by this disease, 2.4% in Germany. (Watterson)
70

Taking, with due care, some results from “Working conditions in the acceding and candidate countries 2004”, we may conclude in the first place that there is no significant overall difference between the EU 15 and CEE countries on intimidation and harassment:
Sexual harassment still remains present at the work place. Almost all of the countries explicitly prohibit sexual harassment, but in almost all countries surveys done shows between 17% up to 40 % of the women were sexual harassed at work. Per country there may be wide differences, for instance sexual harassment was reported by a larger proportion of the Czech (4%) and Romanian (3%) workforces and a smaller proportion of Slovenians and Hungarians (0.2% each). Another research shows that workers subject to physical violence by persons belonging to the workplace is relatively high in Romania, Bulgaria and Slovenia, and low in Estonia, Hungary and Czech Republic.
71

In ‘Working and living in an enlarged Europe, 2005’ the EuroFound compares the percentage of workers exposed to demanding physical working conditions. Clearly the new member states and accessing countries score higher her than the old EU15; mainly Poland and Bulgaria score very high among the CEE countries.
Note also that Greece scores highest, Portugal is on the level of Lithuania, Hungary and the Czech Republic are quite low, on the level of France. Comparing the % of workers experiencing low autonomy, the picture is more clearly overall worse for the CEE countries than the EU-15. Only Latvia clearly outranks its fellow CEE countries:
72

The percentage for high work intensity varies widely among European countries. Again the Greeks report to be worst off: the percentage for high work intensity is 30%, four times the level in Estonia (7%), and three times the level in Portugal (10%). Among the EU15 countries, Scandinavian countries, the UK and Ireland report high levels of work intensity. In most CEE countries, work intensity is significantly lower than the average, apart from Hungary and Bulgaria. A more detailed study by ILO “Safety and Health at the Workplace - Trade Union Experiences in Central and Eastern Europe (2000)” http://www.ilo.org/public/english/region/eurpro/budapest/social/safety_cd/ gives interesting comparisons per sector and countries, albeit only for 8 countries.
73
Below are some interesting outcomes indicating the relevance of systems for maintaining labour standards:

“It was estimated that health and safety regulations were put into practice in 70% of the workplaces surveyed, but in 18% it was stated categorically that they were not (11% gave no opinion). Those industries where it was estimated that regulations were least often put into practice included agriculture and textiles and clothing. These are both relatively dangerous industries, so why are regulations not applied? The textiles and clothing trade is often characterized by small workshops and out-sourcing. All would thus have conceivably less contact with health and safety services. 58% of the respondents said that penalties were imposed in their workplace for violations of regulations, but 21% said that they were not. (21% did not know.) It should logically be the case that where regulations are not put into practice then such contraventions would be penalized by law. But those workplaces mentioned above - agriculture and textiles and clothing – were also among those where penalties were imposed least often. The key factors which may make them less likely to implement regulations also mean that they are more likely to be by-passed in government inspectors. Both implementation of regulations and penalties for violations varied considerably between countries. In general, the survey found that Russian, Slovakian, Hungarian and Czech workplaces implemented health and safety standards much better than did Bulgarian workplaces. Penalties for violations were also imposed most often in Russia and Hungary, but least often in Lithuania and Slovakia.” (End of quote of ILO report) A wealth of qualitative information can also be obtained from the reports of the sub-regional seminars held by the ILO in 1999-2000, (Rice 2000). Below is a short summary. One of the major reasons for the deterioration of workers health and safety that was identified by the participants is the Expansion of the informal sector. Bulgarian representatives reported that only 2.5 million people are paying their social security contributions, and approximately 1.5 million people are employed by the shadow economy. The latter are not covered by social security or any other occupational health and safety institutions. The shadow economy has also reached dangerous dimensions in other countries. Unemployment was named as another major contributor to the deterioration of workers' health and safety. In the context of high unemployment, people live in constant fear of losing their jobs so that people are ready to work in any conditions. In the Baltic region it was reported that there was a general agreement that workers did not value their own health because of the current stressful job market and they do not recognize the long-term consequences. In SE-Europe high unemployment has also resulted in the tendency for many workers to neglect their regular medical check-ups, because they are afraid that if their health is seriously damaged they could lose their jobs. The Bulgarian representatives stated that this neglect is one reason why national statistics on occupational illnesses do not reflect the real situation. Introduction of liberal models and the consequent lack of social dimension in the labour market was perceived as an underlying factor in the overall low standard of living and its impact on workers' health and safety. Implementation of existing laws was perceived as a major problem by all participants. The legal framework as such was considered to be comprehensive enough by most representatives. However, the Moldovan representatives observed a clear deterioration in their national legislation. As an example, they mentioned the 1995 law on labour conditions which was better than the new one. In the Baltics due to dismantling of existing labour inspectorates and changes in training systems which neglected workers health and safety, legal provisions were more relics of the past protective system than an actual operational framework.Non-compliance with legal provisions and collective agreements by the employers had increased in recent years. (mid -1990s) Another example is the new Ordinance from 1997 in Slovakia obliges employers to provide personal protective equipment, but most employers still follow the older laws concerning provision of PPE. In Croatia, legislation stipulates that machinery has to be labelled with safety instructions but this is rarely the case in reality. Solutions at local level revolve around collective bargaining to get a commitment from employers. The Bulgarian representatives were disappointed with the new Bulgarian social insurance bill, which states that an employee who does not obey health and safety instructions would be deprived of benefits in case of an accident. The Moldovan representatives faced the same kind of situation, but
74

they had been able to work out a compromise whereby an injured worker would not be entitled to compensation only if the accident was caused by the abuse of alcohol. This was challenged by the Romanian representatives who argued that if an employer allows an employee to work whilst he or she is drunk, then the employer should be responsible for any accident that occurs. Lack of an institutional network for implementation of laws was a bigger problem in Moldova and Macedonia than in Bulgaria or Romania. Occupational health and safety committees were missing and the labour inspectorate only recently created in Moldova. In the Baltic countries it was reported that Occupational health and safety committees were lacking and the labour inspectorate greatly neglected. The weak administrative capacity of social institutions manifested itself especially in the monitoring of working conditions. As in most transition countries, trade unions used to be responsible for workplace monitoring in the Soviet era, but this has been given over to state authorities which lack expertise and resources. Systematic interventions are therefore largely missing. Due to the lack of capacity of the labour inspectorate, occupational accident and disease statistics do not fully reflect the situation. According to Estonian representatives, the employer is not legally obliged to investigate accidents when they are first reported, as these are taken into account only if they involve a leave of three or more days. Thus national statistics are not accurately reported. Due to a lack of occupational safety and health inspectors large enterprises might receive a visit once in 5 years and SMEs only once in 15 years, another reason why national statistics on occupational illnesses do not reflect the actual situation. The weak administrative capacity of labour inspection manifested itself especially in the monitoring of working conditions. State authorities are also often missing the basic resources in terms of equipment. As the Bulgarian representatives pointed out, the authorities lack even the necessary vehicles for visiting workplaces. Lack of motivation by the health and safety representatives and worker representatives was perceived as one of the reasons why these people were not effectively using those powers provided for in the legal framework. All the participants listed a number of reasons for the lack of motivation: usually the representatives did not get paid for the time they spent on health and safety duties, they did not get enough credit or support for their work and/or they did not have adequate training for their duties etc. It is especially important in view of the weak administrative capacities of State authorities that local health and safety representatives should be able to perform a number of information, instruction and monitoring-related tasks. In the Baltics employers’ attitudes were manifested in dismissing or ignoring health and safety representatives, dissolving health and safety committees, refusing collective bargaining or implementation of the collective agreement. Sanctions on employers who violate occupational health and safety standards. Although legislation provides for the closure of workplaces which do not fulfil required occupational health and safety standards, the participants were cautious in pursuing this option. It was acknowledged that this course of action would mean loss of jobs and also leave the already polluted environment untouched. Closure of workplaces was seen as the last possible resort. It was felt that in the first place, trade unions should motivate and train local health and safety representatives and committee members to actively take part in workplace monitoring and inspections, report the situation to the state authorities, especially to labour inspectorates, demand independent workplace inspections if necessary, make shortcomings public through the mass media, organise campaigns together with other relevant organizations, negotiate and agree action plans with the employer, etc. Trade union representation in workplace health and safety committees has to be improved. It was noted by the Bulgarian representatives that workers who are elected as worker representatives to local health and safety committees are not necessarily trade union members. In Romania, the law providing for health and safety committees (passed in 1996) states that all committees are chaired by an employer representative. The Romanian representatives argued that neither employer representatives nor employee representatives should have dominance in the committees, but that the distribution of seats should be balanced. The adjoining report contents some interesting comparisons between textiles, clothing and leather industries of different countries. The most common problems concerning health hazards were noise, eye strain, and dust and fumes. Noise was experienced as a problem of some degree in an astounding 67 per cent of workplaces surveyed, eye strain in 62 per cent and dust and fumes in 58 per cent. In this respect, the textile, clothing and leather industries in Lithuania and Bulgaria seemed
75

to be burdened by health problems, and especially serious health problems, much more so than in other survey countries.
Prevalence of eye strain in the textiles, clothing and leather industries of different countries
Prevalence of problems caused by dust and fumes in the textiles, clothing and leather industries of different countries
Prevalence of work overload in the textile, clothing and leather industries of different countries
76

77

Symptoms and diseases from which workers were suffering frequently % of surveyed workplaces for three industries.
Metal manufacturing
Food, beverages and tobacco
Textiles clothing and leather
Deafness 7.8 3.7 12.3
Ringing in the ears 8.2 6.9 15.4
Headaches 14.1 13.1 27.6
Dizziness 6.0 6.1 13.0
Irritability 17.1 12.0 21.9
Forgetfulness 7.1 5.7 7.0
Depression 8.9 7.4 10.1
Tiredness 23.3 26.5 34.7
Stress 15.1 15.6 19.5
High blood pressure
17.1 14.0 18.8
Sore eyes 10.1 4.7 18.8
Visual changes 4.9 2.3 9.7
Sore throat 8.6 6.5 7.8
Coughing 12.6 9.6 13.6
Breathing difficulties
9.2 6.6 10.9
Skin irritation 8.1 4.6 13.0
Pain. Tingling or numbness
5.8 4.7 11.3
Backache 25.0 20.1 38.7
Allergies 7.1 8.4 13.4
Asthma 2.9 2.8 5.1
Cuts or bruises 18.3 12.6 8.7
Gastro-intestinal disturbances
5.7 4.7 8.2
Cancer 1.1 0.5 3.5
Menstrual problems 3.1 2.8 6.6
Reproductive problems
1.2 0.5 3.1
The above table shows that working in the TC&L industries causes a relatively high number of diseases, in all but 3 of the 26 problems, TC&L scores higher than the other two industries used for comparison. Since reliable and meaningful data are lacking we will abstain from a categorization of countries on OSH. The most significant body of data to look at if we want to be informed about the level of compliance with basic OSH standards might well be the effectiveness of OSH monitoring systems. This of course is strongly related to state capacities (see 6.1).
78

7. Country profiles 7.1. Lithuania Lithuania is a constitutional parliamentary democracy. The last presidential, European Parliamentary and national parliamentary elections were generally free and fair. The judiciary is independent. Lithuania has a functioning market economy. The Government generally respected the human rights of its citizens; however, there were problems in some areas. There were some restrictions on privacy rights. Anti-Semitic incidents increased during the year. Societal violence against women and child abuse were serious problems. Trafficking in women and girls was a problem. There were some limits on workers' rights. This Baltic state that has conducted the most trade with Russia has slowly rebounded from the 1998 Russian financial crisis. Growing domestic consumption and increased investment have furthered recovery. Trade has been increasingly oriented toward the West. Foreign government and business support have helped in the transition from the old command economy to a market economy. Lithuania has showed an impressive economic performance during the last few years. “The Ballistic Baltic” and “The Baltic Tiger” are only two of the labels attached to Lithuania by foreign market observers to signify the speed and expected sustainability of its recent economic growth. The textile and clothing production accounts for 16% of total exports. T. 1.4 The great
STRENGTH of Lithuania is the stabile macro economy with and a small inflation rate, which gives good perspective for further development. Lithuania’s recent economic growth owes to a large extent to the growing productivity of its labour force. Low labour costs, coupled with growing productivity, allowed Lithuania to maintain its international competitiveness. Entry into the single EU market and other external forces, presents big new challenges. Part of it is the liberalization of the global textiles and clothing market for which Lithuania has been traditionally strong.
4 Notes on the tables: Percent of population below poverty line 1 is taken from UNDP (2004), based on a poverty line 4$ a day, most figures are from the period 1996-1999.
Percent of population below poverty line 2 is taken from World Bank (2004), based on a poverty line of (purchasing power parity) 2.15$ a day per adult wage earner, most figures are from the period 1996-1999.
The value of the indicators for Rule of law and Control of corruption are the ranks of the current country within this group of countries taken from the much larger sample of the World Bank surveys. Thus 1 present the best and 13 the worst performance within our sample.
No. Main Indicators Value Population 2005 3,596,617
12,500 Trade Union Density Real growth rate 2004 6.60% Level of minimum wage in US $ 2004 178 Average gross wage in US $ 2004 427 Percent of population below poverty line 2004 / Unemployment ratio's 2004 8% Inflation % (consumer prices) 1,1% Human Development index (HDI) rank / value 2003 39 / 0,852 Rule of law 2004 4 Control of corruption 3
1. 2. GDP per capita (PPP US$) 2004 3. 15% 4. 5. 6. 7. 8. 9. 10. 11. 12.
79

Lithuania maintains uncomplicated market entry procedures for companies. Establishing a company is quick and inexpensive. Good established legislative. Respect for human rights with relatively low percent of corruption and good Human development index provides good base for further development of the cooperation between stakeholders. Trade Unions have to increase their influence among the employees and becoming recognised as equal player by the business sector and managers. WEAKNESS: Lithuania is still specializing in low-tech exports. Labour costs may not stay competitive for too long and organic productivity growth has its limits. To keep its investment climate accommodating and growth oriented, and its global competitiveness strong, Lithuania needs a quantum leap towards higher-tech, higher quality economy. The new labour code has provided the possibility of freedom of association and collective bargaining. However in practise is not often implemented. Union lawyers lost the right to defend their members in the Supreme Court and unions lost assets inherited from the Soviet era. The majority of the economy is privatised. Those managers are simply ignoring the Trade Union rights determining the wages without entering into bargaining with the unions. That leaves the employees depending on the good will of the managers. The exceptions are the large factories with well-organised unions. 16.5 % of the population is from ethnic minorities with persistent intolerance towards them. Sexual harassment is still enormous by statistics. There are plenty of workers on short-term contracts and sometimes without any contract, which excludes them from unionising.
7.2. Bulgaria Bulgaria is a parliamentary democracy. The Constitution provides for an independent judiciary; however, the judiciary suffered from corruption and wide-ranging systemic problems. The Government generally respected the human rights of its citizens; however, there were problems in several areas. Problems of accountability persisted and inhibited government attempts to address police abuses. The executive and judicial branches continued to struggle with wide-ranging systematic problems and suffered from serious corruption. Official unemployment in 2004 was 12,7 percent, long-term unemployed persons accounted for over 60 percent of total unemployment. According to the National Statistical office the share of light processing industry in the overall gross national product amounted to almost 20 %, in which textile industry represents 19.6% and the garment industry 43.5%. The textile and clothing sector has become one of the Bulgaria’s most
80

competitive industries in recent years with considerable investment, and export and employment opportunities. The textile and clothing industry’s share of exports rose to 25% in 2002. The sector employs more than 150,000 people. Reasons making Bulgaria an attractive investment location is the high quality products, competitive workforce and operational costs respectively, well developed clusters, closeness to consumers, free transfer of goods and capital, political stability. The average annual wage is US$934 in 2002 in garments and US$1,168 in textiles.
T.2.
STRENGTH: Bulgaria, a former communist country striving to enter the European Union, has experienced macroeconomic stability and strong growth since a major economic downturn in 1996 led to the fall of the then socialist government. As a result, the government became committed to economic reform and responsible fiscal planning. Low inflation and steady progress on structural reforms improved the business environment and has begun to attract significant amounts of foreign direct investment. Entering into a new era of political coalition of the current government provides inclusion of the biggest parties on power. That could provide an opportunity for sharing the opposite parties the power as well the responsibilities for the action taken. The legislation provides the right for freedom of association and the collective bargaining. Macro economic indicators show movements towards European Union.
WEAKNES: Corruption in the public administration, a weak judiciary, and the presence of organized crime remain the largest challenges for Bulgaria. There were restrictions on freedom of the press. Societal violence and discrimination against women, persons with disabilities and against Roma were problems. Trafficking in persons was a serious problem, which the Government took some steps to address. Child labour was a problem up to 14 % of children aged 5-17. The government is ignoring the social partners. Some employers ban the trade unions and the collective bargaining and force newly employed workers to sign declarations that they will not establish or join unions. Temporary employment contracts are increasingly being used to prevent workers from demanding their rights, as the labour code does not properly protect workers with a temporary contract. Having a big coalition on power is defocusing the political agenda and may lead to slow enforcement of the legal system. The biggest harassments and work violations are mostly done in small and micro enterprises, which easily corrupt the inspectors. Cheap labour force (minimum wage of approximately 80 US$) and weak trade unions (18.2 % of employees unionised) provide for a weak perspective for the improvement of the labour rights.
No. Population 2005 7,450,349 GDP per capita (PPP US$) 2004 8,200
30% Real growth rate 2004 5.3 % Level of minimum wage in US $ 2004 80 Average gross wage in US $ / Percent of population below poverty line 2002 13.40% Unemployment ratio's 2004 12,7 % Inflation % (consumer prices) 2004 6,1 % Human Development index (HDI) rank / value 2003 55 / 0,808 Rule of law 2004 7 Control of corruption 2004 7
Main Indicators Value 1. 2. 3. Trade Union Density 4. 5. 6. 7. 8. 9. 10. 11. 12.
81

7.3. Romania
The rights to form trade unions are generally not respected in practise. The difficulties are eve bigger to strike. The National Trade Union Block (BNS) has reported that the Foreign Investors´ Council has been pushing for labour law reform that would facilitate dismissals and weaken trade unions collective bargaining rights. Having a minimum wage of only 85 US $ and weak trade unions provide for a weak perspective for the improvement of the labour rights.
Romania is a constitutional democracy. The Constitution provides for an independent judiciary; however, in practice, the judiciary remained subject to political influence. Widespread corruption remained a problem, although the Government took initial, but only partial, steps to address the problem.
No. Main Indicators Value
PP US$) 2004 700 Trade Union Density 90% Real growth rate 2004 8.10% Level of minimum wage in US $ 2004 85 Average gross wage in US $ / Percent of population below poverty line 2004 28.9% Unemployment ratio's 2004 6.30% Inflation % (consumer prices) 2004 9.60%
T.3
STRENGTH: Romania’s strategic location towards Europe and Asia provides for good economic opportunities. Romania began the transition from Communism in 1989 with a largely obsolete industrial base and a pattern of output unsuited to the country's needs. The country emerged in 2000 from a punishing three-year recession thanks to strong demand in EU export markets. Being a large and stabile market attract the multinational companies to establish their regional headquarters in Romania. Becoming member of EU is more likely than ever before. That could speed up the reorganisation of the system and will work on improving the workers rights. WEAKNESS: Recent macroeconomic gains have done little to address Romania's widespread poverty, while corruption and red tape continue to handicap the business environment. Government action and inaction at times restricted freedom of speech and of the press. Discrimination and instances of societal violence against Roma, journalist and women continued. There were large numbers of impoverished homeless children in major cities. Trafficking for the purpose of prostitution was a problem that the Government increasingly took steps to address. Child labour abuses continued. There were reports of government interference in trade union activity. Neither the Government nor industry improved workplace health and safety conditions significantly.
7.4. Ukraine
The country is a mixed presidential and parliamentary republic. A series of elections for national and local offices during the year (2003) revealed serious shortcomings in democratic practice. The Constitution provides for an independent judiciary; however, many courts were inefficient and subject to political interference and corruption. Shortly after independence in December 1991, the Ukrainian Government liberalized most prices and erected a legal framework for privatization, but widespread resistance to reform within the government and the legislature soon stalled reform efforts and led to some backtracking. The economy is mixed, with the private sector accounting for 65 to 70 percent of gross domestic product. The economy remains burdened by a lack of transparency, with the shadow economy accounting for a significant proportion of real income. Wage arrears, a problem in prior years,
1. 10. 12. Population 2005 22Human Development index 64Control of corruption 2004 8 ,329,977 (HDI) rank / value for 2003 / 0,792
GDP per capita (P 7,Rule of law 2004 8 2. 11.
3. 4. 5. 6. 7. 8. 9.
82

decreased, partly because of election year politics. Wealth was concentrated within the political elite and among directors of the state dominated and newly privatised sectors. The citizens' right to change their government peacefully was restricted by the authorities, who engaged in many forms of manipulation of parliamentary and local elections. However, the repeat runoff on December 26th, 2004, which followed the Supreme Court's invalidation of the first, was judged by international observers, including the OSCE, to have reflected the will of the people and to have brought. Many observers agree that the regime change in the country (January 2005) has not yet brought many results. Transparency International rates Ukraine in its anti-corruption rating list for 2005 0.4 points better than last year's. Ukraine shares its 107th place with Belarus, Eritrea, Nicaragua, Palestine, Vietnam and Zimbabwe. T. 4. STRENGTH: Having low unemployment rate and high growth rate are good indicators for the Ukraine economy. Ukrainian government officials have taken some steps to reform the country's Byzantine tax code, such as the implementation of lower tax rates aimed at bringing more economic activity out of Ukraine's large shadow economy, but more improvements are needed, including closing tax loopholes and eliminating tax privileges and exemptions.
No. Main Indicators Value Population 2005 47,425,336 GDP per capita (PPP US$) 2004 6,300 Trade Union Density ? Real growth rate 2004 12%
39-45 Average gross wage in US $ 2004 114 Percent of population below poverty line 2004 29% Unemployment ratio's 2004 3.5%, ILO 9-10%Inflation % (consumer prices) 2004 12% Human Development index (HDI) rank / value 2003 78 / 0,766 Rule of law 2004 12 Control of corruption 2004 12
1. 2. 3. 4.
Level of minimum wage in US $ 2004 5. 6. 7. 8. 9. 10. 11. 12.
The country has well-developed social legislation and well established trade unions provides an opportunity of improving workers rights in the future. Growth has been supported by strong domestic demand, low inflation, and solid consumer and investor confidence, despite a loss of momentum in needed economic reforms. WEAKNESS: The former government's human rights record was poor. Long delays in trials were a problem, and judges continued to readily grant most requests by prosecutors for residential search and wiretap warrants. Authorities interfered with the news media by harassing and intimidating journalists, censoring material, blocking interregional broadcasts of independent media, closing down independent media outlets, and pressuring them into practicing self-censorship. Freedom of association was restricted. The Government discouraged workers from organizing independent unions and regularly harassed independent unions. Restrictions on the Freedom of Association and on the right to strike remained on the statute books. How far things have been improved under the new government is not totally clear. The change of government showed the country to be deeply divided and the new government is plagued with internal struggles and the population shows growing signs of dissatisfaction with this government. Violence and discrimination against women, including sexual harassment in the workplace, were problems as was violence against children. Trafficking in women and children for commercial sexual exploitation was a serious problem, which the Government took steps to address. Ethnic minorities and Muslims complained of harassment and frequent identity checks.
83

7.5. Belarus
stration exercise control over the security
largely centrally planned with industry accounting for approximately 50 percent of
demonstrations made it difficult nions to strike or to hold public rallies furthering their objectives.
. 5.
s were employed in the state industrial and state agricultural sectors. The living standards for many segments of society remained low, and wages in the state sector were lower than the national average.
According to its amended constitution, the country is a parliamentary republic. President Aleksandar Lukashenko, first elected in 1994, has systematically undermined the country's democratic institutions. Through a series of flawed referenda, manipulated elections, and undemocratic laws and regulations, he has concentrated all power in the executive branch and extended his term in office. The judiciary is not fully independent and operates under significant control by the presidential administration. The President and the Presidential Adminiforces, which committed numerous human rights abuses. The economy was economic output. The Government's human rights record remained very poor and worsened in some areas, and the Government continued to commit numerous serious abuses. The Government continued to restrict the freedoms of speech, press, assembly, and association. It further restricted the activities of NGOs by using legal technicalities to deregister them and subjecting them to frequent tax investigations and other forms of harassment. The Government shut down most major registered human rights NGOs, and state security authorities increasingly harassed those that remained. Societal violence and discrimination against women remained problems, as well as trafficking, although the Government continued serious efforts to combat it. The authorities intensified their already severe restrictions on workers' rights to associate freely, organize, and bargain collectively. A change to FPB regulations has given its Executive the ability to de-register unions that refuse to join the government-created Belarus Industrial Association. Tight control by the Government over public
for u
T
STRENGTH: Low unemployment, balanced growth rate. WEAKNESS: Belarus’ economy in 2003-04 posted 6.1% and 6.4% growth. Still, the economy continues to be hampered by high inflation and persistent trade deficits. Belarus has seen little structural reform since 1995, when President Lukashenko launched the country on the path of "market socialism." In keeping with this policy, Lukashenko reimposed administrative controls over prices and currency exchange rates and expanded the state's right to intervene in the management of private enterprises. In addition, businesses have been subject to pressure on the part of central and local governments, e.g., arbitrary changes in regulations, numerous rigorous inspections, retroactive application of new business regulations, and arrests of "disruptive" businessmen and factory owners. The majority of worker
No. Main Indicators Value Population 2005 10,300GDP per capita (PPP US$) 2004 0 6,80Trade Union Density ?% Real growth rate 2004 6.40Level of minimum wage in US $ 2004 40 Average gross wage in US $ 2004 126-175Percent of population below poverty line 2003 27.1%Unemployment ratio's 2004 (more unregistered) 2% Inflation % (consumer prices) 2004 17.40% Human Development index (HDI) rank / value 2003 0,786 67 /Rule of law 2004 13
1. ,483 2. 3. 4. % 5. 6. 7. 8. 9. 10. 11. 12. Control of corruption 2004 13
84

Belarus has become an international outsider because of its lack of freedom and democracy. For the time being, Belarus remains self-isolated from the West. Growth has been buoyed by increased Russian demand for generally non-competitive Belarusian goods. 7.6. Poland Poland is a multiparty democracy. The Constitution provides for an independent judiciary, and the Government generally respected this provision in practice; however, the judiciary remained inefficient and lacked resources and public confidence. The Government generally respected the human rights of its citizens; however, there were problems in some areas. A cumbersome legal process, poor administration, and an inadequate budget hampered the court system, and court decisions frequently were not implemented. The Government maintained some restrictions in law and in practice on freedom of speech and of the press. Women continued to experience serious discrimination in the labour market and were subject to various legal inequities. Child prostitution was a problem. There were reports of some societal discrimination and violence against ethnic minorities. Trafficking is a problem. Governments frequently change. In Poland, the recent right's return to power is not necessarily a positive signal for investors. Unlike many countries in Europe, the Polish right has not been especially liberal in its approach to economic policy—mainly because it grew out of the trade union movement Solidarity, and as a result has always laid a strong emphasis on worker protection rather than the encouragement of investment. T.6. As for On On OHS,
Watterson has stated that in the 1990s there was apparently a system of ‘competent and self-confident government’ but lack of trade union support for health and safety action and a generally low interest in the subject from employers. This related to a lack of ownership of the health and safety system beyond the state bureaucracy. At the same time there were ‘stringent but often unimplementable exposure standards’. In a free market economy, unions balance their advocacy for a healthy workplace with considerations of employment and compensation. Solidarity noted that they had to concern themselves with unemployment threats as well as working conditions post-1989. In this climate, occupational health and safety was marginalised. In the 1990s the protection of an employee from workplace risks depended primarily on the attitude of an employer and the vigilance of the state bureaucracy. Inability of the state services to inspect and monitor regularly the working conditions in SMEs and the failure of SMEs to register their existence with state occupational health agencies increased the problems.
No. Main Indicators Value Population 2005 38,635,144 GDP per capita (PPP US$) 2004 Trade Union Density 15% Real growth rate 2004 5.60% Level of minimum wage in US $ 2004 275 Average gross wage in US $ / Percent of population below poverty line 2000 18.40% Unemployment ratio's 2004 Inflation % (consumer prices) 2004 3.40% Human Development index (HDI) rank / value 2003 36 / 0,858 Rule of law 2004 5 Control of corruption 2004 5
1. 2. 12,000 3. 4. 5. 6. 7. 8. 19.50% 9. 10. 11. 12.
Polish trade unions have recently faced a relatively serious crisis in terms of their membership levels. After 14 years of political and economic transformation, the level of unionisation has fallen below that in virtually all other countries of central and eastern Europe.
85
STRENGTH: Poland has steadfastly pursued a policy of economic liberalization throughout the 1990s and today stands out as a success story among transition economies. Stabile macro economy with an average growth rate among the other’s CEE countries and small inflation rate, gives good perspective for further development. Sharing the first position with Croatia for the height of the minimum wage shows that the country is well underway in adjusting its labour standards to the European one. Poland joined the EU in May 2004, and surging exports to the EU contributed to Poland's strong growth in 2004, though its competitiveness could be threatened by the zloty's appreciation. GDP per capita roughly equals that of the three Baltic States. Well-developed legislation will provide further enforcement of rule of law and the economical development of Poland. WEAKNESS: Much remains to be done, especially in bringing down unemployment. The privatization of small and medium-sized state-owned companies and a liberal law on establishing new firms has encouraged the development of the private business sector, but legal and bureaucratic obstacles alongside persistent corruption are hampering its further development. Reforms in health care, education, the pension system, and state administration have resulted in larger-than-expected fiscal pressures. Further progress in public finance depends amongst others on overhauling the tax code to incorporate the growing grey economy and farmers, most of whom pay no tax. Some employers violated worker rights, particularly in the growing private sector, and antiunion discrimination persisted. Apart from the fact that trade unions have undergone a process of erosion, it is evident that they have also become less appealing to workers. In state enterprises trade union members differed only to a small degree from their non-union colleagues, as regards age, educational background, position held and earnings. However, in former state enterprises, which had been taken over by private investors, the situation was different: the union members were on average older than their non-union colleagues, only a few of them were members of supervisory boards, and they had lower average pay. This marginalisation of union members was deeper in new companies set up on the basis of private capital. The union members in these enterprises on average had much lower pay than the rest of the workers, did not hold managerial functions, and were found in the lower categories of workers. The working population is weakly protected, unionisation is only 14% and there exist a fast-growing trend to fire employees and hire them back as "self-employed workers", because such workers are not covered by an employment contract or collective bargaining. Increasing numbers of minors worked and that many employers violated labour rules by underpaying them or paying them late 7.7. Republic of Macedonia Macedonia is a parliamentary democracy. In 2001, the country experienced an insurgency conducted by Kosovar and indigenous ethnic Albanians. In August 2001, domestic political parties signed the Framework Agreement (FWA) that called for implementation of constitutional and legislative changes to lay the foundation for improved civil rights for ethnic minority groups. The Constitution provides for an independent judiciary; however, corruption, coercion and political influence at times limited its ability to function efficiently. The Government generally respected the human rights of its citizens; however, there were problems in some areas. On some occasions, the judiciary did not effectively investigate or prosecute state agents and civilians for alleged human rights abuses. Several judges were dismissed during the year on charges of unprofessional and unethical behaviour. Violence and social discrimination against women (particularly in the Roma and ethnic Albanian communities) and minorities in general, remained problematic. Trafficking in women and girls for prostitution was a problem; however, the Government continued to aggressively combat trafficking.
86

T. 7. No. Main Indicators Value
Population 2005 2,045,262 GDP per capita (PPP US$) 2004 7.100 Trade Union Density ?% Real growth rate 2004 1.30% Level of minimum wage in US $ 100 Average gross wage in US $ 2004 244 Percent of population below poverty line 2003 30.20% Unemployment ratio's 2004 37.70% Inflation % (consumer prices) 2004 0.40% Human Development index (HDI) rank / value 2003 59 / 0,797 Rule of law 2004 9 Control of corruption 2004 9
1. 2. 3. 4. 5. 6. 7. 8. 9. 10. 11. 12.
STRENGTH: Having implemented almost whole of the FWA gives a good base for a further improvement of the transition system towards the market economy. More than 50% of the work force is unionised, which can indicate that workers rights may be well protected. A great number of NGO’s put in force activities towards improvement of the human and labour rights and freedom of association. The new Law for Labour rights indicates more open possibilities to respect labour rights and different possibilities for dealing with any discrimination at work. New reforms in jurisdiction are improving the legal framework. Reorganization of the Trade Unions may provide greater opportunity to increase their influence among the employees. That may lead to better recognition a as equal player by the business sector and the managers. Individual unions are leaving the Confederation of the trade union of Macedonia (SSM) and new independent unions are set up, which may lead to a new dynamic of independence and democratisation of the unions. SSM still keeps close relationship with the government although is independent. Having the biggest unemployment rate among the others countries, allows employers to ignore the interests of the workers and take the decisions on their own or interfering in the work of the trade union. WEAKNESS: At independence in September 1991, Macedonia was the least developed of the Yugoslav republics, producing a mere 5% of the total federal output of goods and services. The collapse of Yugoslavia ended transfer payments from the centre and eliminated advantages from inclusion in a de facto free trade area. An absence of infrastructure, the UN sanctions against Yugoslavia, Macedonia’s largest market, and a Greek economic embargo over a dispute about the country's constitutional name and flag hindered economic growth until 1996. GDP subsequently rose each year through 2000. However, the leadership's commitment to economic reform, free trade, and regional integration was undermined by the ethnic Albanian insurgency of 2001. Unemployment at one-third of the workforce remains a critical economic problem. Since the transition began in 1990, the number of formally employed persons has more than halved, from 470,000 to a little over 220,000 in the year 2000. Of those officially unemployed, estimates of which ranged from 32% to 43% of the workforce, 45% were women and 55% were men. Nearly three fourths (72%) are under the age of 40, meaning that the most productive and creative part of the workforce is unemployed. There are also ethnic differences. For example, ethnic Macedonians comprise 84% of the workforce, but 68% of the unemployed, whereas Albanians comprise 10% of the workforce, but 20% of the unemployed. Those with less education and skills experience rates of up to 47%, whereas those with higher education experience only 2-3% unemployment. (Source: “Federation of Trade Unions of Macedonia and the Informal Sector” by Liljana Jankulovska, in ILO Working papers Decent Work and the Informal Economy:2002.) Much of the extensive grey market activity falls outside official statistics. The corruption is wide spread and still remains a main problem for the future development of Macedonia.
87

The Confederation of the trade union of Macedonia (SSM) still keeps close relationship with the government although is independent. Having the biggest unemployment rate among the others countries, allows employers to ignore the interests of the workers and take the decisions on their own or interfering in the work of the trade union. 7.8. Croatia The Republic of Croatia is a constitutional parliamentary republic. The November 2003 parliamentary elections were generally free and fair, despite some irregularities. The Constitution provides for an independent judiciary; however, the judiciary continued to suffer from political influence at the local level. The Government generally respected the human rights of its citizens; however, there were problems in some areas. Lower courts were occasionally subject to political influence, and the judicial system suffered from bureaucratic inefficiency, insufficient funding, and a severe backlog of cases. The Government did not interfere in the editorial decisions of the print media; however, electronic media were susceptible to political pressure and attempts were made to influence reporting on the two national television stations. Violence and discrimination against women occurred. Occasional violence continued toward ethnic minorities, particularly Serbs and Roma; some faced serious discrimination. Ethnic tensions in the war-affected areas were less pronounced than in previous years, and abuses, including ethnically motivated harassment and assaults, occurred less frequently. Trafficking in women was a problem. T. 8.
No. Main Indicators Value Population 2005 4,495,904 Labour force 2004 1,710,000 GDP per capita (PPP US$) 2003 11,200 Trade Union Density Real growth rate 2004 3.7% Level of minimum wage in US $ for 2004 276 Average gross wage in US $ for 2004 757 Percent of population below poverty line 2003 11% Unemployment ratio's 2004 13.8% Inflation % (consumer prices) 2004 2.5% Human Development index (HDI) rank / value for 2003 45 / 0,841 Rule of law 2004 6
6
1. 2. 3. 4. 47% 5. 6. 7. 8. 9. 10. 11. 12.
Control of corruption 2004 13.
STRENGTH: Before the dissolution of Yugoslavia, the Republic of Croatia, after Slovenia, was the most prosperous and industrialized area, with a per capita output perhaps one-third above the Yugoslav average. The economy emerged from a mild recession in 2000 with tourism, banking, and public investments leading the way. The relatively high minimum wage shows that the country is well underway in adjusting its labour standards to the European one. The government is gradually reducing a heavy backlog of civil cases, many involving land tenure. Craotia enjoys a stabile macro economy. 67% of the work force is unionised, which can indicate that workers rights may be well protected. The EU accession process should accelerate fiscal and structural reform and will work on improving the workers rights. WEAKNESS: Unemployment remains high, at about 14 percent, with structural factors slowing its decline. While macroeconomic stabilization has largely been achieved, structural reforms lag because of deep resistance on the part of the public and lack of strong support from politicians. Growth, while impressively about 4% for the last several years, has been achieved through high fiscal and current account deficits.
88

There exist a fast-growing trend to fire employees and hire them back as "self-employed workers", because such workers are not covered by an employment contract or collective bargaining. 7.9. Hungary Hungary is a parliamentary democracy. The last multiparty elections in April 2002 were considered generally free and fair. The judiciary is independent. The country has completed its transition from a centrally directed economy to a fully functioning market economy. The private sector accounted for more than 80 percent of gross domestic product. The informal sector is estimated around 25% with a slightly decreasing trend.
T. 9.
The Socialist government maintained a strong commitment to a market economy but has not succeeded in addressing remaining problems in agriculture, health care, and tax reform. A survey carried out among member organisations of trade union MSZOSZ found evidence of a lack of protection and breaches of labour law, such as restrictions of the possibilities of establishing trade unions and the right to collective bargaining, and holding back information with a view to impeding the protection of workers' interests.
No. Main Indicators Value Population 2005 10,006,835 Labour force 2004 4,170,000 GDP per capita (PPP US$) 2003 14,584 Trade Union Density 20% Real growth rate 2004 3.9% Level of minimum wage in US $ 2004 260 Average gross wage in US $ 2004 550 Percent of population below poverty line 2004 25% Unemployment ratio's 2004 5.9% Inflation % (consumer prices) 2004 7% Human Development index (HDI) rank / value 2003 35 / 0.862 Rule of law 2004 2 Control of corruption 2004 2
1. 2. 3. 4. 5. 6. 7. 8. 9. 10. 11. 12. 13.
STRENGTH: Hungary has made the transition from a centrally planned to a market economy, with a per capita income one-half that of the Big Four European nations, with strong enforcement of the law in practise. Low unemployment rate ensure stabile labour market without workers suffer extreme fears of losing jobs. The freedom of speech and media provides the policy makers to have direct feedback on the action taken. As to the compliance with labour standards, Hungary meets the requirement set by the EU. Hungary continues to demonstrate strong economic growth and acceded to the European Union in May 2004. Good established legislative give the further options of tripartite agreements between the stakeholders. Foreign ownership of and investment in Hungarian firms are widespread, with cumulative foreign direct investment totalling more than $23 billion since 1989. Hungarian sovereign debt was upgraded in 2000 and together with the Czech Republic holds the highest rating among the Central European transition economies. WEAKNESS: Despite 7 years of strong economic growth, an estimated 25 percent of the population still lived in poverty, with the elderly, large families, and the Roma most affected. The Government generally respected the human rights of its citizens; however, there were problems in some areas. There were some allegations of government interference in editorial and personnel decisions of state-owned media. Violence against women and children remained significant problems. Sexual harassment in the workplace also continued to be a problem. Racial discrimination persisted. Trafficking in persons was a problem.
89

7.10. Czech Republic The Czech Republic is a constitutional democracy. Elections are free and fair. The judiciary is independent. The country's economy is market-based. T. 10.
STRENGTH: The Czech Republic is one of the most stable and prosperous of the post-Communist states of Central and Eastern Europe. Growth in 2000-04 was supported by exports to the EU, and a strong recovery of foreign and domestic investment. Domestic demand is playing an ever more important role in underpinning growth. The law provides for works' councils in workplaces where there is no trade union representation, and these works' councils provide all workers with the right to information and consultation regarding major company decisions. Recent accession to the EU gives further impetus and direction to structural reform. In early 2004 the government passed tightened eligibility for social benefits. Intensified restructuring among large enterprises, improvements in the financial sector, and effective use of available EU funds should strengthen output growth.
No. Main Indicators Value 10,241,138
Labour force 2004 5,250,000 GDP per capita (PPP US$) 2003 16,357 Trade Union Density 30% Real growth rate 2004 3.7% Level of minimum wage in US $ 2004 260 Average gross wage in US $ 2005 780 Percent of population below poverty line / Unemployment ratio's 2004 10.6% Inflation % (consumer prices) 2004 3.2% Human Development index (HDI) rank / value 2003 31 / 0.874 Rule of law 2004 3 Control of corruption 2004 4
1. Population 2005 2. 3. 4. 5. 6. 7. 8. 9. 10. 11. 12. 13.
WEAKNESS: The Government generally respected the human rights of its citizens; however, there were problems in some areas. Long delays in trials were a problem. There was some violence and discrimination against women and children. Occasional skinhead violence and discrimination against Roma, particularly regarding housing, remained a problem. Trafficking in persons is a problem. Structural and procedural deficiencies, as well as a lack of training and resources, hampered the effectiveness of the judiciary. There were allegations of judicial corruption, particularly surrounding bankruptcy and commercial courts. Problems of freedom of association occur in small and medium-sized enterprises, as well as some of the big ones owned by foreign investors. It is common practice for employers to carry out special checks on trade unionists’ performance of their normal workday tasks. Another tactic is for union members to be told directly that trade union membership is not company policy. In others cases, employers have refused to pay wages to union representatives. Some employers refuse to bargain with union representatives, or obstruct the conclusion of collective agreement. 7.11. Moldova The Constitution provides for a multiparty representative government. Parliamentary elections in 2001 were generally free and fair. The Constitution provides for an independent judiciary; however, judges were reportedly subject to outside influence and corruption.
90

Separatist elements, assisted by Russian military forces in the area, have declared a "Transdniester Moldovan Republic" and the Government does not control this region. Authorities in the separatist Transnistria region interfered with the ability of residents there to vote. Unless otherwise stated, all references herein are to the rest of the country. The Government generally respected the human rights of its citizens; however, there were problems in some areas, and the human rights record of the Transnistrian authorities was poor. During the year, libel was removed from the criminal code; however, other laws that encouraged self-censorship in the media remained. Societal violence and discrimination against women, children, and Roma persisted. Trafficking in women and girls remained a very serious problem. Human rights groups were permitted to visit prisoners in Transnistria, but obtaining permission from the Transnistrian authorities was difficult. Transnistrian authorities mistreated and arrested one journalist from the government-controlled area, harassed independent media and opposition lawmakers, restricted freedom of association and of religion, and discriminated against Romanian-speakers.
7.12. Russia
T. 11. No. Main Indicators
Population 2005 4,455,421 1,900
Trade union density ?% Real growth rate 2004 6.8% Level of minimum wage in US $ 2004 17-37 Average gross wage in US $ / Percent of population below poverty line 2003 23% Unemployment ratio's 2002 (note: 25% of working population is employed abroad)
8%
Inflation % (consumer prices) 2004 11.5% Human Development index (HDI) rank / value 2003 115 / 0,671 Rule of law 2004 10 Control of corruption 2004 11
Value 1. 2. GDP per capita (PPP US$) 2004 3. 4. 5. 6. 7. 8.
9. 10. 11. 12.
STRENGTH: Moldova is one of the countries which transition is still going on with not that much visible result. Moldova remains one of the poorest countries in Europe despite recent progress from its small economic base. It enjoys a favourable climate and good farmland but has no major mineral deposits. TREATS: Being the last country according to the GDP per capita with a minimum wage in the interval of only 17-37 US$ and moreover a controlled society is not giving space for fast development. The government is trying to break the independent union movement and create government-controlled unions. The economy remains vulnerable to higher fuel prices, poor agricultural weather, and the scepticism of foreign investors. The Government maintained some limits on workers' rights. The country has a shadow economy that represents a large share of economic activity.
The country has a multi-party system. President Vladimir Putin was re-elected in March in an election process that the OSCE determined did not meet international standards in a number of respects, However, the voting itself was relatively free of manipulation and the outcome was generally understood to have represented the will of the people.
91
The Constitution provides for an independent judiciary, but the executive branch appeared to drive judicial decisions in high profile or Kremlin directed cases. Although also impaired by corruption, the judiciary continued to show greater independence in non-politicized cases, and the criminal justice system was slowly undergoing reforms.

Changes in the parliamentary election laws and a move from election to nomination by the President of regional governors further strengthened the power of the executive branch and, together with media restrictions, and other shortcomings, raised concerns about the erosion in accountability of government leaders to the people. Authorities continued to infringe on citizens' privacy rights. Government pressure continued to weaken freedom of expression and the independence and freedom of the media, particularly major national television networks and regional media outlets, which were the primary source of information for most of the population. The print media remained vibrant and pluralistic, but low circulation numbers limited its impact on public opinion. Government institutions intended to protect human rights were relatively weak but remained active and public. Ethnic minorities, including Roma and persons from the Caucasus, Central Asia, Asia, and Africa faced widespread governmental and societal discrimination, and, increasingly, racially motivated attacks. Trafficking in persons remained a serious problem despite progress in combating it. There were some reports of forced labour and child labour.
STRENGTH: The biggest strength of Russian economy is the opportunities that provide this huge market and to certain extent stabile and developing economy. Russia ended 2004 with its sixth consecutive year of growth, averaging 6.5% annually since the financial crisis of 1998. Although high oil prices and relatively cheap rouble are important drivers of this economic rebound, since 2000 investment and consumer-driven demand have played a noticeably increasing role too.
7.13. Estonia
T. 12. No. Main Indicators Value Population 2005 143,420,309 GDP per capita (PPP US$) 2004 9,800 Trade Union Density ?% Real growth rate 2004 6.7% Level of minimum wage in US $ 2004 26 Average gross wage in US $ 2003 255 Percent of population below poverty line 2003 25%
(considerable underemployment) 8.3%
Inflation % (consumer prices) Human Development index (HDI) rank / value for 2003 62 / 0,795 Rule of law 2004 11 Control of corruption 10
1. 2. 3. 4. 5. 6. 7.
Unemployment ratio's for 2004 8.
9. 11.5% 10. 11. 12.
WEAKNESS: Nevertheless, serious problems persist. Russia's manufacturing base is dilapidated and must be replaced or modernized if the country is to achieve broad-based economic growth. Other problems include a weak banking system, a poor business climate that discourages both domestic and foreign investors, corruption, and widespread lack of trust in institutions. The latest interference in the business sector have raised concerns by some observers that President Putin is granting more influence to forces within his government that desire to reassert state control over the economy. The legislation still denies many workers the right to strike and the new labour code has not helped improve union rights. Anti-union behaviour is still common and the enforcement of union rights, such as reinstatement of unfairly dismissed workers, takes time. Despite the Russian Federation’s recovery from financial collapse in 1998, official statistics show that almost one person out of five still lives in poverty. What’s more, a high percentage of those living in poverty are Russia’s so-called ‘working poor’: at least half actually have jobs.
Estonia is a constitutional parliamentary. Free and fair parliamentary elections were held in March 2003. The judiciary is independent. The civilian authorities maintained effective control of the security forces. There were some reports of police mistreatment of prisoners and detainees and the use of
92

excessive force. The Constitution provides for an independent judiciary, and the Government generally respected this provision in practice. T. 13.
No. Main Indicators Value Population 2005 1,332,893 GDP per capita (PPP US$) 2004 14,300 Real growth rate 2004 6% Trade union density 14.8% Level of minimum wage in US $ 2004 197 Average gross wage in US $ Percent of population below poverty line / Unemployment ratio's 2004 9.6% Inflation % (consumer prices) 2004 3 % Human Development index (HDI) rank / value 2003 38 / 0,853 Rule of law 2004 1 Control of corruption 1
1. 2. 3. 4. 5. 6. / 7. 8. 9. 10. 11. 12.
STRENGTH: Estonia, as a new member of the World Trade Organization and the European Union, has transitioned effectively to a modern market economy with strong ties to the West, including the pegging of its currency to the euro. The economy benefits from strong electronics and telecommunications sectors and is greatly influenced by developments in Finland, Sweden, and Germany, three major trading partners. The country scores best out of the sample in this survey for the indexes Role of Law and Control of Corruption. WEAKNESS: While wages and benefits kept up with inflation, there was growing disparity between Tallinn (where one third of the population resides) and the slower growing rural southeast and industrial northeast. The Government generally respected the human rights of citizens and the large ethnic Russian non-citizen community; however, there were problems in some areas. There are some gaps between the legal framework and the practice. In some enterprises, workers are advised against forming unions, threatened with dismissal or a reduction in wages, or promised benefits if they do not join unions. Sometimes so-called "yellow unions" are formed. Although law prohibits all such action, the National labour inspectorate does not pursue cases. By the end of 2003 not a single fine had been imposed. Dismissed workers rarely seek reinstatement or compensation because of a reluctance to go to court.
93

7. Conclusions
1. One needs to be careful with drawing conclusions on any single set of data. In this sense we may generalise the warning that the World Banks gives for using their governance data: that it is misguided to generalize, based on the assessment of one particular governance dimension, or of an average for the country. This is because there are large variations in governance quality and performance across different dimensions. This also hold true for the other dimensions of this study.
2. We found many contradictions between data sets. This may be partly due to the fast changes
that these countries are undergoing. However the vast amount of data enables to draw some conclusions.
3. On the basis of the available data on the 11 dimensions, a clear pattern of country groupings
arises. This may off course be partly due to the measurement errors we discussed, like the halo effect. Another important bias may be caused by the ´closeness effect’. In an important study, Bollen and Paxton provide evidence that evaluator bias is a significant source of systematic measurement error for a number of indicators of democracy, including the Freedom House indices (2000). That is, evaluators are biased by what Bollen and Paxton call “situational closeness,” the extent to which the countries being scored are more or less alike the evaluators’ own countries. But existing research also suggests strong correlations or mutual enforcement between different dimensions that may be a more important cause for the clear pattern of country groupings that has arisen form our survey. Here, we may echo the conclusions from the Global Labor Survey (2004): ‘To see whether workplace institutions and practices come together as a bundle, we calculated a correlation matrix for all of the summary indices . The correlation matrix suggests that workplace institutions broadly fit together into labour relations systems that can be classified as more or less favorable to workers. For example, economies with more pro-worker “Labour Market Conditions” in terms of wage-setting institutions also tend to have greater “Freedom of Association & Collective Bargaining” and higher levels of “Employee Benefits”. They also have a low “% informal sector”, as well as high unionization and collective bargaining coverage rates.’ A more elaborate research might also show that the outcomes of many of these different dimensions are caused by the same complex of causes, be it history, culture, geopolitical position or economic development. For instance there exists clear correlation between high levels of income inequality, high incidence of corruption, and a large informal economy. Also Geopolitical location and level of economic development are closely related: Income groups: GDP per capita, 2002 Geopolitical groups Top Tercile Middle Bottom Tercile Mean value US$
8 12,984 CEE EU accession 1 2 8,032 SEE 3 1 5,685 Middle income CIS 3 1 6,122 Low income CIS 7 2,428
CEE EU members
On average, richer countries are perceived to be less corrupt than poorer countries and have better labour standards. The GLS reports ‘as a broad summary statement, the GLS shows that practices favorable to workers are more prevalent in countries with high levels of income per capita; are associated with less income inequality; are unrelated to aggregate growth rates; but are modestly positively associated with unemployment.’ The same conclusion is drawn by Kucera (2004): “Correlation coefficients between GDP per capita (in PPP terms) and the Freedom House indices hovers around 0.60 and for the trade union rights indices around 0.35. This suggests that there may be a developmental aspect to democracy (civil liberties and political rights taken together) and trade union rights, with a tendency for democracy and trade union rights to be stronger in more economically developed countries, though the
94

pattern is clearly less strong for trade union rights.” Only in Transition Countries and Africa and Middle East is the trade union rights index higher than civil and political liberties index .
4. Our research comes to the following grouping of countries:
Country Group Countries (Near) EU level performance Czech Republic, Hungary, Baltic countries, Slovenia, Slovakia Intermediate case Poland Medium scores Bulgaria, Croatia Intermediate case Romania Low level of compliance Belarus, Macedonia, Moldova, Russia, Ukraine
What makes Poland an intermediate case? It has compared to the other countries of this group a very high unemployment, which makes workers very vulnerable. Poland also has a high % of households having difficulties making ends meet, a relatively weak economic position of women, a high incidence of OT, and a relatively high ranking on many corruption scales. Especially its Corporate Illegal Corruption Component score is bad, on the level of Macedonia, in between Croatia and Romania. This is balanced on the other hand by a lower poverty %, and a positive HD index score. Romania is another intermediate case. In almost all dimensions it scores below Bulgaria. Its Corporate Illegal Corruption Component score is bad, below Poland and just above Russia. . For Trade unions rights it is placed in the lowest group of our survey. According to some sources the informal economy is bigger than in Bulgaria, the gender gap is bigger, the accident and fatality rates are higher, the HD index is significantly lower, but unemployment is also lower. (Note –1- that this is based on data mostly up till 2004 and according to osme observers Romania has done better over the past 2 years than Bulgaria: -2- that for Croatia less data have been available).
The last country group represents a large variety of countries; Macedonia, one of the poorest with giant unemployment, but also with democracy and rule of law, Belarus with much less poverty but with no democracy and free trade unions. Russia, richer in GDP per person than Bulgaria, but with poverty levels only better than Moldova and serious problems concerning governance.
5. On the basis of these outcomes there is no ground to exclude the new EU members from the
‘low risk’ category established by the ‘old’ EU members. The best new EU members do better on some dimensions than the worst or even average EU members. For instance on corruption here is substantial variation within EU countries. The long-standing EU members from southern Europe exhibit higher levels of bribery prevalence than the tigers of East Asia, or of some emerging countries in other regions, such as Slovenia and other new EU members from Central and Eastern Europe. The high variation within the EU is illustrated by the fact that the gap in the prevalence of bribery between the exemplary Nordic countries, on the one hand, and southern Europe, on the other, is larger than the gap between southern Europe and the average for all emerging economies.
6. Whether the same will be true for Bulgaria and Rumania after their accession to the EU,
scheduled in 2007, remains to be seen. It could be necessary to continue doing social audits there at least for 1-3 years, and study recent data of the kind collected in this report to establish whether compliance to labour standards is up to general EU levels.
7. There is a great variance of outcomes within a country and between countries. This shows
that there will be a sustained need for some form of monitoring per factory in all countries, especially taking into account the nature of the garment industry.
95

8. Literature Bronstein A, (ILO) 2003, High-Level Tripartite Conference on Social Dialogue and Labour Law reform in EU Accession Countries Malta, 28 February – 1 st March 2003 .Labour Law Reform in EU Candidate Countries: achievements and challenges. A Discussion Paper .
Cazes S 2002 Do labour market institutions matter in transition economies? An analysis of labour market flexibility in the late nineties, International Institute for Labour Studies Geneva. Clean Clothes Campaign (CCC) 2005: Workers' Voices - The situation of women in the Eastern European and Turkish garment industries http://www.saubere-kleidung.de/download/workers-voice.pdf Djankov S, Ira Lieberman, Joyita Mukherjee and Tatiana Nenova, Going Informal: Benefits and Costs, in The Informal Economy in the EU Accession Countries; Size, Scope, Trends And Challenges to the Process of EU Enlargement/Boyan Belev Editor Centre For The Study Of Democracy, 2003. EBRD, Transition Report 2005 European Foundation for the Improvement of Living and Working Conditions, (2003), ‘Working conditions in the acceding and candidate countries’. European Foundation for the Improvement of Living and Working Conditions, (2003), Quality of Life Survey. European Foundation for the Improvement of Living and Working Conditions, (2005), Annual review of working conditions in the EU: 2004-2005 European Foundation for the Improvement of Living and Working Conditions, (2005) Working and living’ in an enlarged Europe. Eurostat 2005: MINIMUM WAGES 2005 Major differences between EU Member States., Statistics in Focus, Population and social conditions
Friedman E, S. Johnson, D. Kaufmann, and P. Zoido-Lobatón (2000) Dodging the Grabbing Hand: The Determinants of Unofficial Activity in 69 Countries", from Journal of Public Economics June 2000 available at http://www.World Bank.org/wbi/governance Hämäläinen (P.) et al 2006, Global estimates of occupational accidents in Safety Science 44 (2006) 137–156. Hanousek, Jan and Filip Palda 2004 Mission Implausible III: Measuring the Informal Sector in a Transition Economy using Macro Methods William Davidson Institute Working Paper Number 683 Hellman J S, Geraint Jones, Daniel Kaufmann, Mark Schankerman Measuring Governance Corruption, and State Capture. How Firms and Bureaucrats Shape the Business Environment in Transition Economies. EBRD and the World Bank 2000 Hellman Joel, Geraint Jones Daniel Kaufmann 2002. Far From Home: Do Foreign Investors Import Higher Standards of Governance in Transition Economies? http://lnweb18.worldbank.org/ECA/eca.nsf/Attachments/Transition1/$File/complete.pdf http://siteresources.worldbank.org/INTECA/Resources/laborstudy05-ch6.pdf ILO (2000) Safety and Health at the Workplace, Trade Union Experiences in Central and Eastern Europe http://www.ilo-ceet.hu/public/english/region/eurpro/budapest/social/safety_cd/index.htm ILO 1997, World labour report
96

ILO 2004 Employment in the informal economy in the Republic of Moldova, Working Paper No. 41, Policy Integration Department Bureau of Statistics International Labour Office, Geneva December 2004. ILO 2004b Organizing for social justice Global Report under the Follow-up to the ILO Declaration on Fundamental Principles and Rights at Work International Labour Conference 92nd Session 2004 http://www.ilo.org /dyn/declaris/DECLARATIONWEB.DOWNLOAD_BLOB?Var_DocumentID=2502 ILO 2004c “Trade unions and industrial relations Report Of The Director-General Organizing For Social Justice, Global Report under the Follow-up to the ILO Declaration on Fundamental Principles and Rights at Work, International Labour Conference 92nd Session 2004 Report I (B). ILO 2005: A global alliance against forced labour. Global Report under the Follow-up to the ILO Declaration on Fundamental Principles and Rights at Work. INTERNATIONAL LABOUR CONFERENCE 93rd Session 2005 Report I (B), http://news.bbc.co.uk/1/shared/bsp/hi/pdfs/10_05_05_forcedlabour.pdf ILO Time For Equality At Work Global Report under the Follow-up to the ILO Declaration on Fundamental Principles and Rights at Work INTERNATIONAL LABOUR CONFERENCE 91st Session 2003 Report I (B) INTERNATIONAL LABOUR OFFICE GENEVA ILO, Every Child counts, Geneva 2002. ILO: Your voice at work, Geneva, 2000. Kallay L 2002, Barriers to Participation: The Informal Sector in Emerging Democracies. The case of Hungary. In: The Informal Economy in the EU Accession Countries; Size, Scope, Trends And Challenges to the Process of EU Enlargement/Boyan Belev Editor Centre For The Study Of Democracy, 2003. Kaufmann et al 2004 Governance Matters III: Governance Indicators for 1996-2002 (Daniel Kaufmann, Aart Kraay, Massimo Mastruzzi). The World Bank First Draft: June, 2003, Revised Version: April, 2004
National Research Council 2003:Monitoring International Labor Standards: Quality of Information, Summary of a Workshop. Margaret Hilton, Editor, National Research Council
Kaufmann et al 2005a, Governance Matters IV: Governance Indicators for 1996-2004,The World Bank. Kaufmann et al 2005b, Measuring Governance Using Cross-Country Perceptions Data.The World Bank Kucera D 2004, Measuring trade union rights: A country-level indicator constructed from coding violations recorded in textual sources. Working Paper No. 50 Policy Integration Department ILO 2004 http://www.ilo.org/public/english/bureau/integration/download/publicat/4_3_301_wp-50.pdf Maddison, A., The World Economy: A Millennial Perspective, OECD, 2001. Multinational Monitor, May 2002 - VOLUME 23 - NUMBER 5; Countering the New Masters; Central and Eastern European Workers Struggle to Hold Their Ground in Hard Economic Times. An Interview with Jasna Petrovic. Mungiu-Pippidi A. 2003 Corruption or State Failure? In: The Informal Economy in the EU Accession Countries; Size, Scope, Trends And Challenges to the Process of EU Enlargement/Boyan Belev Editor Centre For The Study Of Democracy, 2003. Musiolek B. Decent Work in the Informal Sector - CEE/CIS region", ILO-Employment Sector
97
National Research Council 2004: Monitoring International Labor Standards Techniques and Sources of Information Committee on Monitoring International Labor Standards 2004 Neumayer E (2004) : Trade Openness, Foreign Direct Investment and Child Labour. London School of Economics Indra de Soysa Norwegian University of Science and Technology, Trondheim 2004 Renoy, Piet, Staffan Ivarsson, Olga van der Wusten-Gritsai Emco Meijer Employment Analyses. European Commission Directorate-General for Employment and Social Affairs. Unit EMPL/A/1. 2004: Undeclared Work in an Enlarged Union. Rice A. (2000), Health and safety at the workplace : trade union experiences in Central and Eastern Europe : a report of an ILO survey in Bulgaria, Czech Republic, Estonia, Hungary, Lithuania, Russian Federation, Slovakia and Ukraine by Rice, Annie and Repo, Paula (ILO-CEET). Rice A., “Health and safety in transition” in Labour Education 2002/1 No. 126, ILO. Rosser, J. Barkley, Jr., Marina V. Rosser, and Ehsan Ahmed. 2003. Multiple unofficial economy equilibria and income distribution dynamics in systemic transition. Journal of Post Keynesian Economics 25: 425-47. Rothschild J. East Central Europe Between the Two World Wars. A History of East Central Europe 9. Seattle: Univ. of Washington, 1974. Schneider F. & Dominik H. Enste The Shadow Economy: An International Survey, Cambridge, Cambridge University Press, 2002 UNICEF 2006: the Future of the Worlds Children 2006 Verite “Emerging Markets”; Research Project Year-end Report Prepared for the California Public Employees Retirement System (CalPERS) November 2003. Watterson A. 2000, Occupational Health in Central and Eastern Europe (CEE) in the 1990s: One Step Forward and Two Steps Backward? ECOHSE 2000 Symposium Kaunas Lithuania, 4-7 October 2000 Abstract. http://www.gla.ac.uk/ecohse/2000abstracts/watterson.pdf WBI 2005 Labour Market Policy and Institutions: Combining Protection with Incentives for Job Creation
WBI 2005b, Growth, poverty, and inequality: Eastern Europe and the former Soviet Union / Alam Asad, Mamta Murthi, Ruslan Yemtsov. World Bank 2002: Transition, The First Ten Years World Bank 2005, Report No. 34324-MK, FYR of Macedonia; Poverty Assessment for 2002–2003
World Bank Institute Enhancing Job Opportunities: Eastern Europe and the Former Soviet Union, 2005 http://siteresources.World Bank.org/INTECA/Resources/labourstudy05-ch1.pdf World Economic Forum: Global Competitiveness Report 2004/Corruption, Governance and Security: Challenges for the Rich Countries and the World by Daniel Kaufmann World Economic Forum: Global Competitiveness Report 2005-2006/Myths and Realities of Governance and Corruption by Daniel Kaufmann World Economic Forum 2005: Women's Empowerment: Measuring the Global Gender Gap. WTO 2004: The Global Textile and Clothing Industry post the Agreement on Textiles and Clothing Hildegunn Kyvik Nordås,1 ERSD, World Trade Organization 2004).
98
Annex 1: Graphical representation of World Bank Governance Data
Control of Corruption - 2004
-3
-2
-1
0
1
2
3
204 Countries
HIGH
LOW
Rule of Law - 2004
BEL
AR
US
UK
RA
INE
RU
SSIA
MO
LDO
VA
MA
CED
ON
IA
RO
MA
NIA
BU
LGA
RIA
CR
OA
TIA
POLA
ND
LITH
UA
NIA
CZE
CH
REP
UB
LIC
HU
NG
AR
YES
TON
IA
-3
-2
-1
0
1
2
3
208 Countries
Nor
mal
ized
Rul
e of
Law
Inde
x
HIGH
LOW
99

Voice and Accountability - 2004
BEL
AR
US
RU
SSIA
UK
RA
INE
MO
LDO
VA
MA
CED
ON
IA
RO
MA
NIA
CR
OA
TIA
BU
LGA
RIA
LITH
UA
NIA
CZE
CH
REP
UB
LIC
POLA
ND
ESTO
NIA
HU
NG
AR
Y
-3
-2
-1
0
1
2
3
207 Countries
Nor
mal
ized
Voi
ce a
nd A
ccou
ntab
ility
Inde
x HIGH
LOW
Government Effectiveness- 2004
-3
-2
-1
0
1
2
3
209 Countries
HIGH
LOW
BEL
AR
US
MO
LDO
VAU
KR
AIN
E
RU
SSIA
MA
CED
ON
IAR
OM
AN
IAB
ULG
AR
IA
CR
OA
TIA
POLA
ND
CZE
CH
REP
UB
LIC
HU
NG
AR
YLI
THU
AN
IA
ESTO
NIA
Note: Blue dots represent estimates for the 2004 governance indicators. The thin vertical lines represent standard errors around these estimates for each country in world-wide sample. Black dot represents the chosen year comparator (if any). Source: "Governance Matters IV Governance Indicators for 1996-2004 " by Daniel Kaufmann, Aart Kraay and Massimo Mastruzzi, 2005. Disclaimer: The governance indicators presented here reflect the statistical compilation of responses on the quality of governance given by a large number of enterprise, citizen and expert survey respondents in industrial and developing countries, as reported by a number of survey institutes, think tanks, non-governmental organizations, and international organizations. The aggregate indicators in no way reflect the official position of the World Bank, its Executive Directors, or the countries they represent. As discussed in detail in the accompanying papers, countries' relative positions on these indicators are subject to margins of error that are clearly indicated. Consequently, precise country rankings should not be inferred from this data.
100

Annex 2: Using ILO ratifications as a measure for quantifying countries compliance The ILO seeks to promote core labour standards by advocating that its member’s nations adopt series of conventions, with the belief that adopting a convention will result in the enactment of national legislation and its enforcement in member countries. The implementation of these conventions is left up to each national government. Failure to implement can result in a complaint to the ILO. However, ILO does not have any punitive power and must rely on moral suasion. We should take in consideration of the role of the national governments. It is failure of them to adequately enforce their own legislation that has created the labour problems. But the national governments should not been seen only as a source of the problems, but should be included as part of solution. This is because they offer substantial advantages in improving labour standards. Several problems inhere in any effort to quantify countries’ compliance with freedom of association requirements by objectively measured proxy indicators. Analysts have mostly used, either alone or together, ratification of ILO conventions and union density to reflect freedom of association. The crudeness of ILO ratifications as an indicator of respect for workers’ freedom of association does not need elabouration. Many of the worst labour rights violators have duly ratified ILO conventions 87 and 98. Some countries with better records have not. Union density may be a better indicator than ILO convention ratifications, but unless it is contextualized, union density by itself does not say much. History is replete with examples of countries adopting ILO conventions and not implementing or enforcing labour laws.
101

102

FWF Code of labour
Employment is freely chosen
No discrimination in employment
Freedom of association and the right to collective bargaining
Payment of a living wage
No excessive working hours
Safe and healthy working conditions
Country
ILO conventions ratified
29 105 111 138 182 87 135 143 26 131 155
LTU 39 9/26/94
26/09/94
26/09/94
22/06/98
26/09/94
26/09/94
26/09/94 / / 26/09/
94 19/06/31 /
95 23/03/99
07/11/55
23/04/80
No exploitation of child labour practise
s
100 98 16/19/31
29/09/03
BGR 22/07/60
28/07/00
08/06/59
08/06/59 / 04/06/
35 / / 14/02/22 /
ROM 28/05/57
03/08/98
28/05/57
06/06/73
19/11/75
28/05/57
26/11/58
28/10/75 / / 13/06/21 /
UKR 60 14/12/00
10/08/56
04/08/61
03/05/79
14/12/00
14/09/56
03/09/03 / / / /
BLR 49 21/08/56
21/08/56
04/08/61
03/05/79
31/10/00
06/11/56 / 30/05/00 / 15/09/
93 / /
POL 89 30/07/58
30/07/58
30/05/61
22/03/78
09/08/02
25/02/57
25/02/57
09/06/77 / / / / /
MKD 68 17/11/91
15/07/03
17/11/91
17/11/91
30/05/02
17/11/91
17/11/91
17/11/91
05/03/
28/10/75
13/12/00 54
10/08/56
14/09/56 16/05/94
25/09/95
06/11/56
25/10/54
17/11/91 17/11/9
1 17/11/91 / 17/11/91/
HRV 57 08/10/91
08/10/91
08/10/91
10/8/1991
08/10/91
08/10/91
08/10/91 / / /
HUN 08/06/56
04/01/94
08/06/56
28/05/98
4/20/2000
06/06/57
11/09/72 / 30/07/
32 / / 04/01/94
68 01/01/93
06/08/96
01/01/93 / 19/06/0
1 01/01/93
09/10/00 / / 01/01/93 01/01/93
MDA 34 23/03/00
23/03/00
12/08/96
21/09/99
14/06/02 28/04/00 12/08/
96
97 7/17/2001 / 08/10/91
20/06/61
06/06/57 71
01/01/93
01/01/93
01/01/93 CZE
10/03/93
12/08/96
12/08/96
23/03/00 / / /
23/06/56
02/07/98
30/04/56
04/05/61
03/05/79
25/03/03
10/08/56
10/08/56 / / / / / 02/07/98RUS 61
07/02/96
07/02/96
10/05/96
17/08/05
24/09/01
22/03/94
22/03/94
07/02/96 / / / / /EST 37 /
103

Annex 3: Summary tables of the country profiles
1. GDP per capita (PPP US$) 2004, 2. Real growth rate 2004, 3. Level of minimum wage in US $ 2004,
5. Percent of population below poverty line 2004, 6. Unemployment ratio's 2004, 7. Inflation % (consumer prices) 2004, 8. Freedom of speech and the media, 9. Judiciary system, 10. Human Development index (HDI) rank / value 2003, 11. GDP per capita (PPP US$) rank minus HDI rank 2003
Explanation of the columns of table 1.
4. Average gross wage in US $ 2004,
104

Table 1 General socio-economic situation in the country
General socio-economic situation in the country
T. 1 1 (US$) 2 (%) 3 (US$) 4 (US$) 11** 5 (%) 6 (%) 7 (%) 8 9 10*
LTU 12.500 6,60% 427 / 8% 1,10%The Constitution provides for an independent judiciary, and the Government generally respected this provision in practice. Four-tier court system: The Supreme Court; the Court of Appeals; district courts; and local courts.
39 / 0,852 8
BGR 8.200 5,30% 80 / 6.1% Y/ some restrictio
ns
The Constitution provides for an independent judiciary; however, the judiciary suffered from corruption and wide-ranging systemic problems. The court system consists of regional courts, district courts, appellate courts, military courts (on the district and appellate levels), the Supreme Court of Cassation, and the Supreme Administrative Court. The Constitutional Court, which is separate from the rest of the judiciary, is empowered to rescind legislation that it considers unconstitutional, settle disputes over the conduct of general elections, and resolve conflicts over the division of powers between the various branches of government
55 / 0,808 10
7.277 85 / 28.9% (2002) 6.3% 9.6% Y/N
The law provides for the right to a fair trial; however, a widespread perception of judicial corruption remained. Trials are open to the public. The law does not provide for trial by jury.
64 / 0,792 4
UKR 6300 12% 39-45 114 29% 3.5% ILO 9-10%
12% 78 / 0,766 12
6.800 6.4% 40 126-175 27.1%
2% , more
unregistered
17.4% Y/N 17
POL 12.000 5.6% 275 18.4% (2000) 19.5% Y/Y
There is a four-tiered court and prosecutorial structure. The courts consist of regional, provincial, and appellate divisions, as well as a Supreme Court. These tiers are subdivided further into five parts: Military, civil, criminal, labour, and family. The Criminal Code states that an individual who "publicly insults or humiliates a constitutional institution" of the country is subject to a fine or imprisonment of up to 2 years, while an individual who insults a public functionary is subject to a fine or imprisonment of up to 1 year
36 / 0,858 12
MKD 7.100 244 30.2% (2003) 37.7% 0.4%
Y/ some restrictio
ns
The Constitution provides for an independent judiciary, and the Government generally respected this provision in practice; however, the judiciary was generally weak, at times inefficient, and sometimes influenced by political pressure, intimidation, and corruption.
59 / 0,797 16
11.200 3.7% 757 13.8% 2.5% Y/Y
The Constitution provides for an independent judiciary; however, the judiciary continued to suffer from some political influence a backlog of approximately 1 million cases, and funding and training shortfalls. Although the Constitution provides for the right to a fair trial and a variety of due process rights in the courts, the Constitutional Court determined that at times citizens were denied these rights and took corrective action
45 / 0,841 5
178 Y/Y
13.4% (2002) 12.7%
ROM 8.1%
Y/N The Constitution provides for an independent judiciary; however, in practice, the judiciary was subject to considerable political interference from the executive branch, often in the form of phone calls to judges by senior government officials The criminal justice system has three tiers: District courts, regional courts, and the Supreme Court. A Constitutional Court was established to adjudicate serious constitutional issues; however, it was dependent on the executive branch. In practice, it did not challenge presidential initiatives and had no means of enforcing its decisions.
67 / 0,786 BLR
3.4%
1.3% 100
HRV 276 11% (2003)
105

HUN 3,90% 260 550 25% 5.9% 7% Y/Y
The Constitution provides for an independent judiciary, and the Government generally respected this provision in practice. Under the Constitution, the courts are responsible for the administration of justice, with the Supreme Court exercising control over the operations and judicial procedure of all other courts. Effective July 2003, a regional court system was established. The new regional courts serve as the court of appeals for county cases, thus creating a fourth level of appeals in the court system. The Supreme Court is the final court of appeal, and the Constitutional Court can hear appeals of military court decisions
5
CZE 16.357 3.7% 262 780 / Y/Y
The Constitution provides for an independent judiciary, and the Government generally respected this provision in practice; however, structural and procedural deficiencies, as well as a lack of training and resources, hampered the effectiveness of the judiciary. There were allegations of judicial corruption, particularly surrounding bankruptcy and commercial courts. The court system consists of district, regional, and high courts. The Supreme Court is the highest court of appeal. The separate Constitutional Court has final authority for cases concerning the constitutionality of legislation
31 / 0,874 7
MDA 1.900 33 6.8% 17-37
14.584 35 / 0,862
10.6% 3.2%
8% 11.5% Y/ some restrictio
ns
The Constitution provides for an independent judiciary; however, official pressure and corruption of judges remained a problem. There continued to be credible reports that local prosecutors and judges extorted bribes in return for reducing charges or sentences, and observers charged that courts were sometimes politically influenced. Political factors have played a large role in the reappointment of judges. The judiciary consists of lower courts, courts of appeals, and the Supreme Court of Justice. A separate Constitutional Court has exclusive authority in cases regarding the constitutionality of draft and final legislation, decrees, and other government acts. The Constitutional Court was the only court generally regarded as fair and objective
115 / 0,671 / 23%
RUS 9.800 6.7% 26 255 25% (2003) 8.3% 11.5% Y/ N
The Constitution provides for an independent judiciary, and there were some signs of judicial independence; however, the judiciary did not act as an effective counterweight to other branches of the Government
62 / 0,795 -3
14.300 6% 197 / / 9.6% 3% Y/Y
The Constitution provides for an independent judiciary, and the Government generally respected this provision in practice. The judiciary operates through a three tier court system: Rural and city courts, district courts, and the Supreme Court. The district courts and Supreme Court are also courts for "constitutional supervision." The Constitution provides for the right to a fair trial, and an independent judiciary generally enforced this right
38 / 0,853 4 EST
106

Explanation of the columns of table 2. 12. Human rights status, 13. Existence of groups that may experience discriminated in the labour market, 14. Gender empowerment measure (GEM) rank/value, 15. Ratio of estimated female to male earned income,
17. Sexual harassment. Table 2 Human Rights Status
HUMAN RIGHTS STATUS T. 2
12 13 14 15 16 17
LTU
Government generally respected HR, with exception in police, prison, privacy rights. Societal violence against women and child abuse were a serious problems. Limits on WR
Roma +16,5 other minorities with persisted intolerance
26 / 0,614 68% 10%, mainly agriculture SH was prohibited by law; but 2002 study by the Women's Information Center indicated that 80% experienced psychological abuse in the workplace or at home, 35% experienced physical violence and 17% were sexually abused
BGR
In general, HR observers reported continued receptivity and dialogue on the part of the Government and law enforcement officers toward HR concerns; however, law enforcement practices at the working level had not changed noticeably. The Parliamentary Committee on HR was active in highlighting areas of concern throughout the year and introducing legislation to combat abuses of H&CR
Women, Roma & disabled
29 / 0,604 67% ILO 2000 14% of children 5-17, 130 cases of violations
The law prohibits SH; however, it was a widespread problem. A survey conducted by the Agency for Social Research (ASR) in 2002 found that approximately 40 % of women had suffered SH in the workplace. Of the women's organizations that existed mainly to defend women's interests, the two largest were the Women's Democratic Union in Bulgaria and the Bulgarian Women's Association.
ROM
A number of domestic and international human rights groups generally operated without government restriction, investigating and publishing their findings on human rights cases. Government officials were generally cooperative and responsive to NGOs, although some offices were slow to respond to inquiries.
Women, Roma, and other minorities were subject to various forms of discrimination
56 / 0,488 58% The law prohibits any act of gender discrimination, including SH.
UKR
Domestic and international HR groups generally operated without government restriction, investigating and publishing their findings on HR cases. Government officials were somewhat cooperative and responsive to the views of NGOs; but, HR and election monitoring groups reported that they faced many difficulties.
Ethnic minorities & Muslims
66 / 0,417 53% /
16. Occurrence of (illegal) child labour,
~ 70 % economically active: 7%child laboters, 19% households, 6% hard works, 1% worst works
Government and private businesses regularly specified the gender of employees in their help wanted advertisements, and employers frequently demanded information about a woman's family situation and subsequently used it to deny employment to women who were likely to become pregnant. Physical appearance and age were often taken into account in employment decisions involving women.
107

BLR
Several domestic human rights groups were active in the country; but, authorities hindered their attempts to investigate alleged HR violations. The authorities monitored NGO correspondence and telephone conversations and harassed NGOs by bureaucratic means. The authorities generally ignored reports issued by human rights NGOs and did not meet with these groups during the year. Official state media did not report on HR NGOs and their actions; independent media that reported on HR' issues were subjected to closure and harassment. Government regulations effectively prohibited HR NGOs from receiving support from foreign sources. A 2003 Presidential decree stipulated that international assistance may only be granted to, or accepted by, an organization that is registered with the Ministry of Economy.
Roma 65% / / SH was reportedly widespread, but no specific laws other than those against physical assault deal with the problem. There is no explicit law against spousal rape and there have been no prosecutions.
POL
A number of domestic and international HR groups generally operated without government restriction, investigating and publishing their findings on HR cases. Government officials often were cooperative and responsive to their views.
/ 27 / 0,612 62% NLI: increasing numbers of minors worked and that many employers violated labour rules by underpaying them or paying them late.
While there are no laws specifically addressing SH, social awareness of the problem continued to increase, and there are mechanisms available to deal with the problem
MKD
The Government generally respected the HR with some exception. Law enforcement officers occasionally beat suspects, particularly during initial arrest and detention. In contrast with previous years, arbitrary arrest and prolonged pre-trial detention occurred infrequently
Roma 41 / 0,555 56% Street children, selling cigarettes and small works
SH of women in the workplace is a problem, particularly in the private sector; with little public attention. SH was not specifically addressed by law; it could be prosecuted as a criminal act under antidiscrimination legislation
HRV
A variety of domestic and international HR groups generally operated without government restriction, investigating and publishing their findings on HR cases. Government officials were often cooperative and responsive to their views. There were no reports of Government harassment of NGOs. The Government's Office for Cooperation with NGOs and other Government ministries and offices were active in coordinating and promoting NGO and Governmental efforts on HR & CS
Roma and Serbs
32 / 0,599 56% Regulated by law in theory and in practica. Only two cases were brought on court.
The law prohibits SH in the workplace; however, it was a problem. According to a survey conducted during the year by Poslovni Forum, over 17% experienced SH in the workplace at some point in their career. According to TU, the problem was most pronounced in the textile and leather, trade, and catering industries
108

HUN
62%A number of domestic and international HR groups generally operated without government restriction, investigating and publishing their findings on HR cases. Many NGOs reported that the Government continued to be responsive to their requests for information. HR groups indicated improvement in the degree of cooperation from government ministries and prosecutors' offices on cases involving Roma and police abuse. An increasing number of NGOs were involved in the law-making process; however, NGOs claimed that the Government's cooperation in this area was insufficient.
/ 44 / 0,528 / The Penal Code does not explicitly prohibit SH in the workplace, but there are laws prohibiting general harassment and the LC has a section addressing the right to a secure workplace. However, SH remained a widespread problem. Women's groups reported that there was little support for efforts to criminalize SH and that SH was tolerated by women who feared unemployment more than harassment. The LC, which regulates questions of security in the workplace, provides for sentences of up to 3 years' imprisonment for SH; non-violent acts of SH may also be prosecuted under the defamation statutes. During the year, no charges were brought under this provision of the LC
CZE
A number of domestic and international HR groups generally operated without government restriction, investigating and publishing their findings on HR cases. Government officials were cooperative and responsive to their views.
Roma 34 / 0,595 64% /
A number of domestic and international HR groups generally operated without government restriction, investigating and publishing their findings on HR cases, except in the Transnistrian region; however, officials were generally not responsive to their views
/ 53 / 0,494 65% / The law does not prohibit SH, and it was a problem
The labour law continued to prohibit SH and, as of March 1, an amendment put the burden of proof on the person accused of SH; however, SH remained a problem. Those found guilty of SH can be fined up to approximately $2,750 , dismissed from work, or sentenced. In February 2003, a survey found that one-tenth of respondents felt they had been subject to SH. Thirteen percent of female respondents reported having dealt with SH, as opposed to 4 % of male respondents. Other studies have concluded that approximately one-half of all women have experienced SH in the workplace.
MDA
109

RUS
Government institutions intended to protect HR were relatively weak but remained active and public. The Government continued to place restrictions on the activities of both humanitarian non governmental organizations (NGOs) and international organizations in Chechnya, at least in part for security reasons. The authorities regarded some NGOs with increasing suspicion, and the security services and other authorities harassed or threatened to close some local HR NGOs
Ethnic minorities, including Roma and persons from the Caucasus, Central Asia, Asia, and Africa faced widespread governmental and societal discrimination, and, increasingly, racially motivated attacks
60 / 0,477 64% Adults workers at min.wage prevent the abuse of child labor, but street children are most vulnerable. 2001 - 12,000 cases
No law prohibits SH, and women have no recourse when SH. Anecdotal information suggested that many potential employers sought female employees who were receptive to sexual relations. Some firms asked applicants for employment to complete a form including the abbreviation "VBO," a Russian language abbreviation for "possibility of close relations," to which the applicant was expected to reply "yes" or "no." Alternatively, advertisements sometimes sought applicants "without complexes," which is taken to mean someone who was not opposed to relations with the potential boss as part of the job
EST
The HR Institute, which received a small amount of funding from the Government, monitored human rights and provided information to the international community. It investigated reports of HR violations, such asallegations of police abuse and the inhumane treatment of detainees. The Institute operated an information center in Johvi, in the north-eastern part of the country where the Russian speaking community is in the majority
/ 35 / 0,595 64% The NLI had responsibility for enforcing these laws, and did so in practice
Violence against women, including spousal abuse, reportedly was common and continued to be the subject of discussion and media coverage. Domestic violence and rape, including spousal rape, were illegal and prosecuted under the law
110

Table 3 Trade union rights, collective bargaining and Occupational Safety & Health TUR in law TUR in Practise OSH
T. 3. General overview TU FoA CB Strike restriction FoA CB 18
LTU
A new LC came into force establishing CB as the main tool to regulate labour relations. There were several cases of unfair dismissal due to TU activity during the year
10 % unionise
d Y Y
Only if approved by secret ballot & notice given 7 days in advance in written. At least 2/3 of employees on enterprise level or 1/2 of subdivision
Anti-union discrimination against organisers and the dismissal of workers for their union activities. The judicial system is slow. Employers often did not renew contracts of workers that belonged to unions.
Relatively rare in practice. Managers often determine wages without entering into bargaining with the unions, except in larger factories with well-organised unions
The Constitution provides that workers have the right to OHS conditions, and the NLI is responsible for implementing the Labour Safety Law. From January to October 2004, the NLI conducted 16,691 inspections of companies. The most numerous abuses included wage arrears, illegal employment (working without a written contract), the violation of labour contracts, time off and work time accounting, harmful working conditions, and the unsatisfactory investigation of accidents. Workers have the right, both in law and practice, to remove themselves from dangerous work environments without jeopardizing their continued employment. From January to November, the NLI recorded 161 fatal accidents at work and 190 other serious work accidents.
BGR
The right to CB is still not sufficiently protected. The government has chosen to ignore the social partners' call for the abolition of the strike ban in the energy, communication and healthcare sectors and wants to introduce compulsory arbitration
18,2% unoinzed with
decreasing trend
Y Y
Allowed when negotiations to resolve a collective dispute do not reach agreement and law allows strikes to be declared illegal if the decision is upheld by two courts, i.e. after an initial judgement and anappeal to a higher court
Some employers ban TU membership within their enterprise and force newly employed workers to sign declarations that they will not establish or join TU. Temporary employment contracts are increasingly being used to prevent workers from demanding their rights
Employers often refuse to negotiate CA, delay negotiations unnecessarily or refuse to sign agreements. In other cases, employers sign agreements but do not apply them. CB has proved particularly difficult in small and micro enterprises.
There was a national labor safety program, with standards established by the LC. The Constitution states that employees are entitled to healthy and nonhazardous working conditions, and the MLSP was responsible for enforcing these provisions. However, conditions in many cases continued to worsen due to budget constraints and the growth of a private sector that labor inspectors did not supervise effectively. Protective clothing often was absent from hazardous areas. The law requires joint employer and labor health and safety committees to monitor workplace conditions; however, implementation was slow and these committees remained in developmental stages at year's end. Under the LC, employees have the right to remove themselves from work situations that present a serious or immediate danger to life or health without jeopardy to their continued employment; however, in practice, refusal to work in such situations could result in the loss of employment.
ROM
TU rights are fairly well protected in law, but important restrictions on the right to strike remain. TU reported cases of private sector employers - mainly foreign - seeking to prevent any TU activity
18 TU and
some smaller
Y 15
members to formTU, not from
same company
but belonging to same branch
Y only if more
than 21 employees are working
Strikes are illegal if a CA is in existence, If a strike is declared illegal the TU leader can legally be fired, even if the strike is ended immediately after being declared illegal
The right to form TU is generally not respected in practice
Many employers do not respect the right to CB and do not conclude CA with the TU. Insufficient enforcement of labour legislation
The law requires employers to pay additional benefits and allowances to workers engaged in particularly dangerous or difficult occupations. Neither the Government nor industry improved workplace health and safety conditions significantly. The Ministry of Labour, Social Solidarity, and Family established and enforced safety standards for most industries. However, it lacked trained personnel for enforcement, and employers often ignored its recommendations. Workers have the right to refuse dangerous work assignments but seldom invoked it in practice.
111

UKR
Many restrictions on the FoA and on the right to strike remained on the statute books, while, generally, TU were still discriminated against in practice. Many cases of anti-union harassment were reported during the year.
106 TU Y
Y Not
official registrat
ion of TU
needed,in order to enter
CB
/
TUM are often subject to discrimination, often intimidated, put under pressure to leave TU, suffer wage arrears or are transferred to positions that do not correspond to their skills. TUL are often threatened and are given assignments where working conditions are dangerous. Government agencies participate in the intimidation of TU.
Employers often refuse to enter into CB with iTU that have not obtained registration. The CFTUUreports frequent attacks on iTU by companies and authorities. The free TU Fauna (Kyiv) has reported frequent harassment against its members
The law contains OHS standards; but, these frequently were ignored in practice. In particular, illegal coalmines connected to organized crime and corrupt leaders operated in unsafe conditions, resulting in scores of deaths. Lax safety standards and aging equipment caused approximately 25,000 injuries on the job each year. During the year, 23,200 individuals were injured (1,648 fewer than in 2003), including 1,163 job related fatalities (67 fewer than in the previous year). Increased enforcement of safety regulations was a major factor in this reduction, although the numbers remain quite high. In theory, workers have a legal right to remove themselves from dangerous work situations without jeopardizing continued employment; however, independent trade unionists reported that, in practice, asserting this right would result in retaliation or perhaps dismissal by management.
BLR
The situation in Belarus steadily deteriorated, with numerous cases of government interference in TU affairs. The leadership Federation of TU of Belarus (FPB), under the control of the "Presidential Administration", has been very active in quelling any dissenting voices. A change to FPB regulations has given its Executive the ability to de-register unions that refuse to join the government-created Belarus Industrial Association. 3TUL were sent to prison. ILO decided to set up a Commission of Inquiry to examine the violation of TUR in Belarus.
92 % unionize
d
Y 1996
Constitution
technically recognises the right of workers to form and
join TU, but both the
TU Law of January
2000 and several
Presidential Decrees contain serious
violations of TUR
Y
Tight control by the Government over public demonstrations made it difficult for unions to strike or to hold public rallies furthering their objectives
Governmentally controlled TU's, under the "Presidential authority". Plenty of violation and obstructionfor "non governmental and independent" TUL.
The authorities and state owned enterprises hindered the ability of workers to CB and, in some instances, arbitrarily suspended CB agreements. An ILO Commission of Inquiry concluded that several TU had been denied the right to CB because of the deregistration and nonregistration of unions
The law establishes minimum conditions for OHS; however, these standards often were ignored. Workers at many heavy machinery plants did not wear even minimal safety gear, such as gloves, hard hats, or welding glasses. A NLI existed but did not have the authority to enforce compliance, and violations often were ignored. During the year, 250 workers died and 840 were seriously injured in workplace accidents. The high accident rate was due to a lack of protective clothing, shoes, equipment, failure to observe temperature regulations, the use of outdated machinery, and inebriation on the job. 46 percent of those who died in workplace accidents were inebriated. There is no provision in the law that allows workers to remove themselves from dangerous work situations without risking loss of their jobs
112

POL
The "business-friendly" labour legislation adopted in 2002 entered into force in 2003. As a consequence, TUR in Poland have been fundamentally changed. The right to strike has been seriously impaired by amendments to the law on road traffic, which makes it almost impossible for TU to organise legal demonstrations
14% unionize
d
Y The law gives all workers,
the right to form and join TU. There is
one notable
exception however:
workers on individual contracts may not
form or join unions.
local union-10 and 30 a national one. TU
organisations are
required to give
employers quarterly
reports on the total
number of TUM
Y
The right to strike is recognised, other than in essential services which are broadly defined (exceeding the ILO definition) to include uniformed services, state administration and local government, where workers only have the right to protest. Procedures for calling a strike arelong and cumbersome
TU report that employers discriminate against workers who try to organise in the private sector, and that the legal protection is not sufficient to prevent harassment. According to the NLI, the number of violations related to TUR, as well as the protection of workers, is constantly increasing. The most frequent violations are changes in or the termination of labour contracts of TUM and their transfer to other positions. Where courts rule in the union's favour, employers often ignore the reinstatement order. Further legal action by the union is either dealt with inefficiently, or the case is simply closed. Some employers refuse to release union officers from their work duties to carry out TU activities, despite being required by law to do so. A growing number of people are forced to take jobs in the informal economy, where they are not entitled to join a TU. Legal strikes are complicated.
A fast-growing trend is to fire employees and hire them back as "self-employed workers", because such workers are not covered by an employment contract or CA
In 85,440 work-related accidents reported during 2003, 522 individuals were killed and 1,005 seriously injured. During the first 9 months of the year, 311 workers were killed and 608 were seriously injured in a total of 57,489 workplace accidents. The Government reported that while most accidents were in the public sector, most serious accidents occurred in the private sector, where proportionally more deaths also occurred. Employers routinely exceeded standards for exposure to chemicals, dust, and noise. In addition, it was unclear which government body had responsibility for enforcing the law. The PIP may shut down workplaces where it finds unsafe conditions. Workers may remove themselves from dangerous working conditions without losing their jobs, but there were reports that fears of employment loss prompted workers to remain on the job.
113

MKD
50 % unionize
d Y Y
The Constitution provides the right to strike and workers exercisedthis right in practice during the year. Some members of the military and the police were permitted to strike but only if they adhered to restrictive guidelines and continued to perform essential duties; however, unlike in previous years, there were no reports of police strikes
The law prohibits antiunion discrimination; however, it existed in practice. Workers in private companies on several occasions were fired for participating in union activities. Because of the slow pace of the court system, at times, it took 2 to 3 years to regain employment legally. Employers sometimes became involved in the internal affairs of unions. Most often, they dominated union election campaigns or ran their own candidates in elections. Consequently, workers sometimes were afraid to run for local union office and union elections were not always free and fair
Concept of CB remains in its infancy, and many CB agreements were outdated and have failed to keep pace with changes in the environment and workplace. CB took place, but in the country's weak economic environment, employees had very little practical negotiating leverage. CA were negotiated between TU and MLSP
The Constitution provides for OHS conditions, temporary disability compensation, and leave benefits. Although there are laws and regulations on worker safety, they were not enforced strictly by the MLSP. Workers have the right to remove themselves from situations that endangered their health or safety without jeopardy to their future employment; however, employers did not always respect this right in practice.
HRV
A new labour law restricts the rights of workers and facilitates lay offs. Civil servants are still denied the right to strike. CB rights are often ignored
64% unionize
d Y Y
Strikes can only take place at the end of a CB agreement or in specific circumstances mentioned in the agreement. If the strike is over the negotiation of a new CA, there must be a mediation process before any action can be taken
Private employers in small enterprises resist union organising. The majority of new workers - approximately 80 % - are on fixed-term contracts. There have been many cases of employer harassment of TUM and officials, despite the protection provided in law. Court procedures last an average of more than 3 years. The TU have called for real labour courts, which could significantly reduce the duration of a court case
Employers often do not want CB and even cancel existing agreements, claiming they are unable to respect the terms. The state has also been guilty of ignoring CBR. The Commercial TU of Croatia reported other forms of obstruction of TU activity, such as keeping mail addressed to the TUM, the surveillance of union members by cameras in company offices, and the refusal to allow unions to use company premises for meetings
OHS standards are set by the Government and were enforced by the Ministry of Health; however, in practice industries often do not meet the standards for worker protection. The NLI had jurisdiction over enforcement of health and safety laws at the workplace and annually compiled data on injuries and health and safety code violations. In 2003, the NLI received 162 reports of employers violating work safety regulations. According to 2002 statistics, an average of 25,500 persons annually suffered injuries at work, of which 40 resulted in death. Under the law, workers may remove themselves from hazardous conditions at work and have recourse through the courts if they believe that they have been dismissed wrongfully for doing so; however, according to the NLI, workers did not exercise this right in practice and normally only reported employers after they had left their job.
114
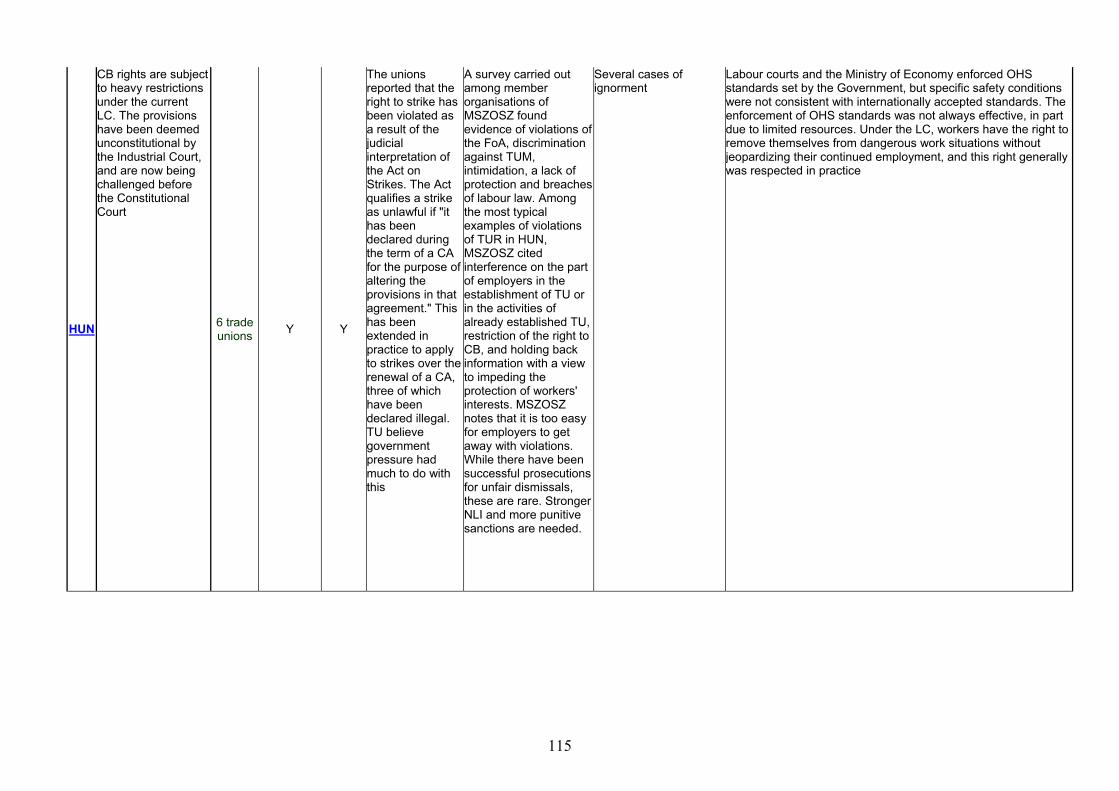
HUN
CB rights are subject to heavy restrictions under the current LC. The provisions have been deemed unconstitutional by the Industrial Court, and are now being challenged before the Constitutional Court
6 trade unions Y Y
The unions reported that the right to strike has been violated as a result of the judicial interpretation of the Act on Strikes. The Act qualifies a strike as unlawful if "it has been declared during the term of a CA for the purpose of altering the provisions in that agreement." This has been extended in practice to apply to strikes over the renewal of a CA, three of which have been declared illegal. TU believe government pressure had much to do with this
A survey carried out among member organisations of MSZOSZ found evidence of violations of the FoA, discrimination against TUM, intimidation, a lack of protection and breaches of labour law. Among the most typical examples of violations of TUR in HUN, MSZOSZ cited interference on the part of employers in the establishment of TU or in the activities of already established TU, restriction of the right to CB, and holding back information with a view to impeding the protection of workers' interests. MSZOSZ notes that it is too easy for employers to get away with violations. While there have been successful prosecutions for unfair dismissals, these are rare. Stronger NLI and more punitive sanctions are needed.
Several cases of ignorment
Labour courts and the Ministry of Economy enforced OHS standards set by the Government, but specific safety conditions were not consistent with internationally accepted standards. The enforcement of OHS standards was not always effective, in part due to limited resources. Under the LC, workers have the right to remove themselves from dangerous work situations without jeopardizing their continued employment, and this right generally was respected in practice
115

CZE
Restrictions to the right to strike remain. Reforms of labour legislation are underway, and the TU are following developments closely 25 %
unionised
Y The law provides for works' councils in workplaces
where there is no
TU representat
ion, The legislation prohibits
discriminatiof wc’s
members
Y
The law on CB, which also regulates strikes, requires TU to provide employers with a list of the names of strikers at least one day before the strike
It is common practice for employers to carry out special checks on TU performance of their normal workday tasks. Another tactic is for TUM to be told directly that TU membership is not company policy or simply for TU officers to be dismissed on false grounds. In others cases, employers have refused to pay wages to TU representatives.
Some employers refuse to bargain with union representatives, or obstruct the conclusion of CA. CMKOS reported that there were several cases during the year in which employers used various tactics to ensure that CA would not be legally valid.
The Office of OHS was responsible for enforcing OHS standards. Workers had the right to refuse work endangering their life or health without risking the loss of their employment. The law treats foreign workers the same as other workers in terms of wages and working conditions, although in practice undocumented foreign workers generally did not receive equal treatment
MDA
The new LC strengthens existing legal provisions on TUR but is not backed up by the necessary mechanisms to ensure the respect of labour standards. The government is trying to break the independent union movement and introduce government-controlled unions
50 % belongs
to 2 unions: TNCM
and CFTN
Solidarite (state controlle
d)
Y Y /
The government is trying to break the independent union movement and create government-controlled unions. CSRM has reported that the government is forcing CSRM affiliates to become a member of the government-supported confederation Solidaritate
Some major valiations! Although the new NLI was established, but no active steps taken
The Government is required to establish and monitor OHS standards in the workplace. The NLI in the MLSP is responsible for enforcing OHS standards; however, OHS standards were not adequately enforced. Workers have the right to refuse to work if working conditions represent a serious health threat; however, there were no reports that workers exercised this right in practice. In practice, poor economic conditions have led enterprises to economize on safety equipment and show little concern for worker safety. According to the NLI preliminary data, there were 101 serious workplace accidents during the year, of which 53 resulted in deaths
RUS
The legislation still denies many workers the right to strike and the new LC has not helped improve TUR. Anti-union behaviour is still common and the enforcement of TUR, such as reinstatement of unfairly dismissed workers, takes time
60% unionized, 10% belongs to free
TU
Y Y
New LC weakens workers' rights
Anti-union discrimination is fairly common in practice. Union leaders have been followed by security services, detained for questioning by police, subjected to heavy fines and dismissals, lost bonuses and been demoted
CB rights are often ignored by employers, who refuse to negotiate or refuse to provide the financial information requested by TU 16-18% of enterprises
The LC provides workers with the right to remove themselves from hazardous or life threatening work situations without jeopardy to their continued employment; however, NLI resources to enforce this right remained limited. Workers were entitled to such compensations as shorter hours, increased vacations, extra pay, and pension benefits for working under such conditions; however, the pressure for survival often displaced concern for safety, and the risk of industrial accidents or death for workers remained high. Even fatal workplace accidents due to unsafe work conditions often went unpunished. There were reports that foreign workers were brought into the country to perform forced work (see section 6.c.).. There were credible reports that 100,000s of Ukrainians, Belarusians, Moldovans, and Central Asians were living and working illegally in larger cities for lower wages than citizens and under generally poor conditions
116

117
EST
The government introduced legislation requiring TU to provide a list of all members, including their personal identity codes. Journalists working for the country's biggest newspaper are screened for union membership
/ Y Y
Other workers than public one have the right to strike, and retribution against strikers is prohibited
In some enterprises, workers are advised against forming TU, threatened with dismissal or a reduction in wages, or promised benefits if they do not join TU. Sometimes "yellow unions" are formed. Although all such action is prohibited by law, the NLI does not pursue cases. By the end of 2003 not a single fine had been imposed. Dismissed workers rarely seek reinstatement or compensation because of a reluctance to go to court
Employers tend to be reluctant to engage in CB and delay the process. It is estimated that 20-25 % of the workforce is covered by CA
OHS standards are satisfactory in theory; however, they were extremely difficult to achieve in practice. The NLI is responsible for enforcement of these standards. The labour unions also had OHS experts who assisted workers to bring employers into compliance with legal standards. Workers have the right to remove themselves from dangerous work situations without jeopardizing their continued employment, and they exercised this right in practice