fair enough? food security and the international trade of
TRANSCRIPT
Fair Enough? Food Security and the International Trade of Seafood
Frank Asche, Department of Industrial Economics, Universitetet i Stavanger, 4036 Stavanger, Norway.
Email: [email protected]. Marc F. Bellemare,*
Department of Applied Economics, University of Minnesota, 1994 Buford Avenue, St. Paul, MN 55108, USA. Email: [email protected].
Cathy Roheim, Department of Agricultural Economics and Rural Sociology, University of Idaho, 875 Perimeter Drive MS 2334,
Moscow, ID 83844-2334, USA. Email: [email protected]. Martin D. Smith,
Nicholas School of the Environment, Duke University, Box 90328, Durham, NC 27708, USA. Email: [email protected].
Sigbjørn Tveteras, Norwegian School of Hospitality Management, University of Stavanger, 4036 Stavanger, Norway.
Email: [email protected]. *Corresponding author
Short (100-Word) Abstract: Does international trade make all parties better off? We study the relationship between food security and the international trade of fish and seafood between developing and developed countries. Specifically, we look at and discuss the evolution of trade flows – values, quantities, and prices – between developing and developed countries. The picture that emerges suggests that the quantity of seafood exported from developing countries to developed countries is close to the quantity of seafood imported by developing countries from developed countries. What takes place is a quality exchange: developing countries export high-quality seafood in exchange for lower-quality seafood.
1

Highlights
• Improved governance increases seafood consumption without reducing foreign exchange. • Seafood quantity net exports from developing to developed countries are close to zero. • Exports with high per-unit prices explain the developing country seafood trade deficit. • The seafood trade deficit does not appear to threaten food security in developing countries.
2

“What does the fish remind you of?” “Other fish.” “And what do other fish remind you of?” “Other fish.”
- Joseph Heller (1961), Catch-22.
1. Introduction Seafood contributed at least 15% of average animal protein consumption to 2.9 billion people
worldwide in 2006,1 and fisheries and aquaculture directly employed 43.5 million people, with 520
million people indirectly deriving their livelihoods from seafood-related industries (FAO, 2012).2 Not
only is seafood is an important source of protein, it is also a highly traded good, which makes it a key
source of income for many individuals, households, and firms across many countries. In fact, seafood is
among the most traded of all food commodities, exceeding the combined trade value of sugar, maize,
coffee, rice and cocoa, as shown in figure 1. The trade of seafood is also more important than that of
pork and poultry combined (figure 1). In 2009, 39% of the global seafood production was traded
internationally, and as much as 78% of seafood products are estimated to be exposed to international
trade competition (Tveteras et al., 2012).
As with food in general (Pinstrup Andersen, 2002), there is disagreement about whether the
benefits of exporting seafood outweigh the costs for developing countries. One reason for that
disagreement is that the lens used to investigate this issue differs radically among studies (Béné et al.,
2009). In particular, the focus of the studies that argue in favor of seafood trade tends to be aggregate
flows measured in monetary value (Valdimarsson and James, 2001; Thorpe, 2004). The studies that
argue against trade tend to be micro-oriented and to focus on socio-economic variables for specific sub-
1 In the interest of brevity, we use the term “seafood” to refer to both marine and freshwater fish and other seafood products throughout this paper. We exclude fish not for human consumption such as fishmeal and fish oil and also other production from the sea such as sea mammals and plants. 2 Moreover, Toufique and Belton (2014) find that aquaculture might have indirect, positive welfare impacts on the poor via increased fish consumption.
3

population (Ruddle 2008), with Béné et al. (2009) as a partial exception, looking at seafood trade for a
subset of African countries. By distinguishing among aggregate values, prices and quantities, we
contribute a different insight to this debate.3
The annual aggregate Food and Agriculture Organization (FAO) of the United Nations seafood trade
data are currently the only data that can address the link between food security and seafood trade at
the global level. While micro-level studies based on more granular data can offer a more detailed picture
of distributional aspects related to seafood trade in specific regions or countries, there is an inherent
tradeoff between studying global phenomena and the level of detail one can attain. As such, it will take
many years and several more such studies before a meta-analysis of micro-data can be used to draw any
conclusions on the question we pose in this article. In the meantime, the FAO aggregate trade data we
use can help generate several insights that can inform the debate surrounding the benefits of seafood
trade, which is highly relevant given the importance of seafood for nutrition globally.
The impact of seafood trade on food security creates further controversies because it is perceived to
move large volumes of fish of high nutritional value from poor (i.e., developing) to rich (i.e., developed)
countries. For example, Troell et al (2014) use aggregate data to conclude that demand for high-value
seafood from aquaculture could threaten food security for low-income households. Indeed, in 2010,
developing countries accounted for only 23% of the value of global seafood imports while they
accounted for 50% of the value of global seafood exports. We refer to this concern as the seafood trade
deficit throughout this paper. On the one hand, from a food security perspective, this could be
interpreted as a substantial problem, as it might mean that poor countries are deprived of sorely
3 Many food supply chains are highly concentrated upstream, with an oligopsonistic structure (i.e., few buyers, many sellers), and seafood is no exception. For this reason, we make no assumption about the degree of competitiveness on the market for fish and seafood. Rather, we look at aggregated income streams, which can tell us whether trade can be beneficial overall, without assuming anything about the distribution of potential benefits.
4

needed proteins (Swartz et al., 2010). On the other hand, this could be interpreted as contributing to
poverty alleviation due to the increased earnings and purchasing power resulting from export growth.
Béné et al. (2010) provide an overview of the literature on these different perspectives on seafood
trade, summarizing, “While some claim that fish trade has a pro-poor effect, others denounce the
negative effect of fish export on local populations’ food security and doubt its contributions to the
macro-economy.” (p. 933). Studying data from Africa, the authors find neither evidence for nor against
the seafood trade as a threat to food security. Thus, while the increase in trade flows is indisputable, the
effect on poverty reduction, via economic growth, of those trade flows is contentious (Edward, 2006).
Moreover, there are growing concerns that economic growth might have adverse effects on income
distribution and equity (Basu, 2006; Goldberg and Pavcnik, 2007).
Our contribution is to use data on the prices and quantities of traded seafood to shed light on
channels through which the seafood trade could contribute to or undermine food security. Studies such
as Troell et al. (2014) raise important issues but do not analyze global seafood trade with an explicit
decomposition of value into prices and quantities. The FAO seafood trade data allow us to distinguish
between developing and developed countries’ exports and imports. Based on these data, we can
calculate unit prices for the actual trade flows, as well as the imputed value of the quantities that are
obtained or given up by trade. Looking at prices and quantities, in addition to total value, shows a more
nuanced picture of the actual effects of seafood trade; it shows gains and losses from different – but
highly policy-relevant – perspectives.
The remainder of this paper is organized as follows. Section 2 provides background on the
production and trade of seafood worldwide. In section 3, we discuss the trade data. Section 4
characterizes the total values as well as the prices and quantities of the international trade flows of
seafood, and discusses the seafood trade deficit between developing and developed countries. To more
5

comprehensively explore variations in income and seafood consumption across nations, a stochastic
frontier model is estimated. In section 5, we offer policy recommendations and directions for future
research.
2. The Production and Trade of Seafood Worldwide The international trade of seafood has grown rapidly over the last few decades, enabled by a
corresponding increase in the global supply of seafood. The availability of seafood has more than
doubled over the last 40 years as the total supply of seafood increased from 65.3 million metric tons in
1970 to 148.9 million metric tons in 2011 (FAO, 2012). Seafood supply originates from two main
production technologies, namely capture fisheries and aquaculture. Until the 1970s, aquaculture was
relatively unimportant as a source of seafood supply. Since then, however, there has been a virtual
explosion in aquaculture as a seafood production technology. Figure 2 shows the relative shift in
production from wild fisheries to aquaculture as well as total global edible seafood production.
Aquaculture growth has been sufficient not only to maintain, but also to slightly increase, the global per
capita consumption of seafood (FAO, 2012).
Capture fisheries supply, on the other hand, is not expected to increase very much, as the majority
of fish stocks are either fully exploited or over-exploited (FAO, 2012). The world may thus be fairly close
to extracting as much seafood as possible from ocean capture fisheries.
The increasing importance of aquaculture in global seafood supply helps explain the export-
orientation of the seafood industry. As in other food-related value chains (Barrett et al., 2012;
Bellemare, 2012) the combination of (i) the significant investments needed to start up aquaculture
production and (ii) limited domestic markets for aquaculture products (due for example to purchasing
power constraints in developing countries, but also because of the size of domestic population and
other factors) provide incentives for the industry to adopt a global outlook on marketing of seafood
6

products. Likewise, fisheries have gradually become more capital-intensive worldwide, providing a
similar incentive scheme for this industry. In addition, consumer preferences for different species of
seafood do not necessarily align with those species available within the home country – i.e. due to
differing seafood resource endowments and other factors of comparative advantage in fisheries and
aquaculture production. Trade then is a way to align consumer preferences with seafood supplies.
Technological innovations have facilitated the international orientation of the seafood industry
(Anderson et al., 2010). Transportation and logistics have improved significantly, resulting in lower costs
and expanding producers’ access to the global market. Progress in storage and preservation has
continued, allowing a wider range of seafood products to be traded. Lastly, the improved control in the
harvesting process in fisheries and throughout the production process in aquaculture has enabled
producers to better target the needs of the modern consumer and to further innovate in the supply
chains.
While technological changes have been critical, institutional changes have also facilitated global
seafood trade. Beginning in 1952, coastal nations adopted 200-mile exclusive economic zones (EEZs). By
the time the U.S. instituted its 200-mile limit, 37 nations had already done so and by 1982 virtually all
coastal nations had declared this limit (Roheim, 2004). This institutional shift created strong incentives
to increase the trade of seafood. Countries with large distant-water fishing fleets, such as Spain and
Japan, were negatively affected, as other coastal nations expanded their own domestic fleets, increased
production, and in many cases became exporters of seafood from within their 200-mile EEZs. As a result,
distant-water fishing countries that relied on harvesting within 200 miles of other countries had to turn
to increased imports to maintain domestic consumption of that foregone seafood.
These various factors tend to reinforce each other, even though the strength of each differs by
market and species. Increased trade has profoundly affected seafood markets; an increasing number of
7

markets have gone from regional to global and as more species from widely different places and with
widely different characteristics have become substitutes (Asche et al., 2001). Moreover, a growing share
of producers have access to the global market as global transportation systems improve and can take
advantage of new market opportunities, increasing trade competition in export as well as import
markets. For those consumers who have the ability to pay, these trends increase the available supply of
seafood in the short run. Hence, the share of the imports of developed countries – the European Union,
Japan, and the US in particular – remains high. Economic growth in many developing countries also
increases demand (World Bank, 2013). As a result, there is a declining import share for developed
countries despite growth in total values of seafood exports from developing to developed countries.
3. Data We use aggregated seafood trade data on an annual basis, obtained from the Fishstat J software (FAO,
2013). The data are separated into exports from and imports to both developing and developed
countries from 1976 when the data are first published by the FAO, to the most recently available data in
2009. Appendix A lists the developing and developed countries included in the analysis based on the
FAO’s own classification. The FAO systematically collects these data from its member countries. We
exclude the product categories “aquatic plants”, ”inedible” (meaning fish not for human consumption
such as fish meal and fish oil), “sea mammals”, and ”sponges, corals, shells” from the FAO seafood trade
statistics. Thus the focus of the analysis is on the trade in edible seafood proteins.
There are, of course a number of challenges when using highly aggregated data. For seafood, a number
of these issues relate to China because of its dominant role in seafood production. In 2011, China was by
far the largest producer with 34% of total seafood production. China was also the largest exporter, but
with a less dominant role as it export share was 24% by quantity. However, the prices with and without
China are virtually identical, and although China’s share of total trade is increasing somewhat, the main
8

trends are similar with and without China. Hence, China does not have a substantial impact on the
results, and we will therefore not present separate results without China. In recent years, re-exports of
seafood have becoming increasingly common (Anderson et al, 2010), with China as the leading re-
exporter. Data on re-exports are scarce, so it is not possible to analyze the issue in detail. However, as
the results are not very sensitive to China in total, there is little reason to expect them to be sensitive to
re-exports, as these make up substantially smaller quantities. There are also claims that people in
developing countries utilize a larger part of the fish than in developed countries. However, according to
Kelleher (2013), there is little difference in this respect when comparing OECD to non-OECD countries.
The export and import values 𝑉𝑉𝑋𝑋 and 𝑉𝑉𝑀𝑀 are in nominal terms and are denoted by the FAO in US
dollars (USD), and the corresponding quantity weights (i.e., trade volume) 𝑞𝑞𝑋𝑋 and 𝑞𝑞𝑀𝑀 are measured in
metric tons. The value data are converted to real terms (i.e., adjusted for inflation) using the US
consumer price index. Given the value and quantity data, one can also recover the unit prices of exports
and imports 𝑝𝑝𝑋𝑋 and 𝑝𝑝𝑀𝑀 by dividing value by quantity, such that
𝑝𝑝𝑋𝑋 = 𝑉𝑉𝑋𝑋𝑞𝑞𝑋𝑋
, since 𝑉𝑉𝑋𝑋 ≡ 𝑝𝑝𝑋𝑋𝑞𝑞𝑋𝑋, and (1)
𝑝𝑝𝑀𝑀 = 𝑉𝑉𝑀𝑀𝑞𝑞𝑀𝑀
, since 𝑉𝑉𝑀𝑀 ≡ 𝑝𝑝𝑀𝑀𝑞𝑞𝑀𝑀, (2)
The second relationship in each of equations 1 and 2 is an accounting identity. In what follows, we show
these variables – 𝑉𝑉𝑋𝑋, 𝑉𝑉𝑀𝑀, 𝑝𝑝𝑋𝑋 𝑝𝑝𝑀𝑀, 𝑞𝑞𝑋𝑋, and 𝑞𝑞𝑀𝑀 – separately for developing and developed countries. We
denote developing countries with the subscript 0 and developed countries with the subscript 1. Thus,
the variables we use are 𝑉𝑉0𝑋𝑋, 𝑉𝑉0𝑀𝑀, 𝑝𝑝0𝑋𝑋 𝑝𝑝0𝑀𝑀, 𝑞𝑞0𝑋𝑋, and 𝑞𝑞0𝑀𝑀 for developing countries and 𝑉𝑉1𝑋𝑋, 𝑉𝑉1𝑀𝑀, 𝑝𝑝1𝑋𝑋
𝑝𝑝1𝑀𝑀, 𝑞𝑞1𝑋𝑋, and 𝑞𝑞1𝑀𝑀 for developed countries. Table 1 shows descriptive statistics for the twelve variables.
The upper half of table 1 covers developing countries’ exports and imports and the bottom half
developed countries’ seafood trade.
9

4. Empirical Results
4.1. Export and Import Values We first show export and import values, which clearly reveal the growth in seafood trade since 1976.
Figure 3 shows the real value of the global seafood exports for developing and developed countries,
with 2009 as the base year. The international trade of seafood, as measured in total real value exported
𝑉𝑉𝑋𝑋 = 𝑉𝑉0𝑋𝑋 + 𝑉𝑉1𝑋𝑋, has grown substantially over the past four decades. In 1976 the total traded value was
23.7 billion USD. This increased to 82.7 billion USD in 2009, which is more than a threefold increase. The
developing countries’ share of seafood exports by value rose steadily from 36.5% in 1976 to 49.8% in
1994, after which it has remained stable at around 50%. Exports by value from developing countries
have thus grown faster than the total increase in exports until the mid-1990s, and have had a similar
growth rate as those of developed countries after the mid-1990s.
Figure 4 shows 𝑉𝑉𝑀𝑀 = 𝑉𝑉0𝑀𝑀 + 𝑉𝑉1𝑀𝑀, the global value of seafood imports for developing and developed
countries. Here, the story is different. The growth in the total real value of seafood imports is very
similar to that of the total value of seafood exports, since seafood exports from somewhere necessarily
end up as imports elsewhere, i.e., 𝑉𝑉𝑋𝑋 ≡ 𝑉𝑉𝑀𝑀.4 However, there is a striking difference in import value
shares between developing and developed countries. In 1976, developing countries imported only
12.2% of the total value of seafood imports. While that share steadily increased throughout the period
1976-2009, it was no more than 22.1% of the total value of seafood imports in 2009. This asymmetry in
export and import value shares between developing and developed countries is at the core of the
perception that exporting seafood is detrimental for the food security of developing countries
(Valdimarsson and James, 2001; Thorpe, 2004). In what follows, we show that focusing solely on values
can be misleading and may lead to the wrong conclusions.
4 There are some deviations in all the actual data, as the registration date for export data is not the same as for imports. This is because export and import data are reported by different countries.
10

4.2. Quantities Figure 5 shows the quantities 𝑞𝑞0𝑋𝑋 and 𝑞𝑞1𝑋𝑋 of seafood exported by developing and developed countries.
Except for the fact that the growth in exported quantities is sharper than the growth in exported values,
figure 5 paints a picture similar to figure 3. For developing countries, the exported quantity of seafood
increased until the mid-1990s, at which point it tapered off around 50% of global exports. The growth in
trade measured by quantity was fourfold, starting at 7.9 million metric tons in 1976 and increasing to
32.1 million metric tons in 2009. But recall that the corresponding value only increased threefold, which
suggests that the unit value of traded seafood – in other words, the real price – has been declining over
time.
Figure 6 shows the quantities 𝑞𝑞0𝑀𝑀 and 𝑞𝑞1𝑀𝑀 of seafood imported by developing and developed
countries. An important difference here is that the asymmetry we observe between the seafood exports
and imports of developed and developing countries are much less pronounced than in value terms. First,
the quantity import share for developing countries rose steadily from 24.7.6% in 1976 to 41.5% in 2009.
While developing countries make up only 22.1% of the imports in 2009 when measured in value, they
made up 41.5% of the imports measured in quantity. In other words, the seafood trade deficit for
developing countries is much smaller when measured in quantity than in value. However, this simple
comparison does not account for the possibility that some seafood net export values may be spent on
importing other foods.
4.3. Prices The data shown in figures 3 to 6 suggest that, in aggregate terms, developing countries export relatively
high-valued and import lower-valued seafood. The reason for the difference in value between seafood
exports and imports among developing countries is apparent when we compute prices. The four unit
11

prices, export and import prices for developed and developing countries, respectively, are shown in
Figure 7.
All four prices 𝑝𝑝0𝑋𝑋, 𝑝𝑝0𝑀𝑀, 𝑝𝑝1𝑋𝑋, and 𝑝𝑝1𝑀𝑀 exhibit downward trends; the unit values of seafood have
been declining worldwide over the past 40 years. This pattern reflects the Law of Demand. As the supply
of seafood increases and one moves along the seafood demand curve, there is a corresponding decrease
in consumer marginal willingness to pay for seafood, which translates into a decrease in market price.
Indeed, the ability to sell farmed fish at ever more competitive prices is recognized as the driving factor
in making aquaculture the world’s fastest growing food production technology in recent decades (Asche,
2008; FAO, 2006). Moreover, the high degree of substitutability between wild and farmed seafood also
ensures that reductions in production costs spill over to prices for wild fish (Asche et al., 1999;
Valderrama and Anderson, 2010). Of course, demand has not been constant in the past four decades.
Nevertheless, supply appears to have grown fast enough to reduce real prices despite demand growth.
Besides exhibiting a downward trend, the four prices series exhibit similar fluctuations over time: all
prices peak in the late 1970s, and all experienced the same decline. This pattern reflects the fact that
the seafood market has become increasingly integrated (Asche, et.al. 1999; Tveteras et al. 2012). It also
shows that seafood trade flows are exposed to the same shocks, irrespective of geography.
Our most important observation is that the import price level is much lower in developing compared
to developed countries. The average export prices from developing and developed countries are
relatively similar, i.e., there are no substantial differences when it comes to export prices between
developing and developed countries. This result suggests that, in the aggregate, developing and
developed countries are endowed with seafood resources with a composition that is of similar monetary
value, despite substantial variation in species over countries and regions. Import prices, however, are
very different: developed countries clearly pay the much higher import prices, and developing countries
12

pay lower prices. In other words, wealthy developed countries have a preference for high-value seafood,
and poorer developing countries import cheap protein. The value difference can be due to different
species as well as differences in product composition.
So what may be occurring is as follows. Both seafood and food quality are normal goods, i.e., a good
whose quantity demanded increases as income increases, and consumers in developed countries exhibit
a higher willingness to pay for high-quality food, including seafood. Indeed, previous studies have found
that seafood demand in most cases is income elastic (World Bank, 2013; Asche et al., 2007). Given that
the market for seafood is well integrated, and because efficiency dictates that goods and services should
gravitate toward those who value them the most, developed countries import high-quality seafood from
developing countries. Since consumers in developing countries in aggregate have been getting better off
over the past few decades (Kenny, 2012), their demand for seafood has been increasing. Indeed, a well-
known empirical regularity, Bennett’s Law, states that as incomes increase, people substitute away from
coarse grains (e.g., cassava) toward finer grains (e.g., rice), and that at higher incomes still, people
substitute way from grains and cereals toward meat and protein (Bennett, 1941). The scatter plot in
Figure 8 depicts a positive relationship between gross domestic product per capita (averaged for 2003-
2005 in USD) and per capita seafood consumption by country (both on a logarithmic scale). Apparent
per capita edible seafood consumption (2003-2005 average kg/year in live weight equivalent) includes
all edible seafood (FAO 2009). Apparent consumption is calculated for each nation by adding total edible
seafood production to total imports, and subtracting total exports. Per capita consumption divides
apparent consumption by population. Clearly, per capita income and per capita seafood consumption
are correlated (𝜌𝜌 = 0.506, p-value = 0.000, n=198). To better explain variation in the relationship
between income (x) and seafood consumption per capita (q), we estimate a stochastic frontier model
(Kumbhakar and Lovell 2000), presented in equations 3 and 4:
13
(3) ln(𝑞𝑞𝑖𝑖) = 𝛽𝛽0 + 𝛽𝛽1𝑥𝑥𝑖𝑖 + 𝑣𝑣𝑖𝑖 − 𝑢𝑢𝑖𝑖
(4) ln�𝜎𝜎𝑢𝑢𝑖𝑖2 � = ∑ 𝜃𝜃𝑘𝑘𝑧𝑧𝑘𝑘𝑛𝑛
𝑘𝑘=1
The frontier represents the highest expected seafood consumption possibility given different
countries’ income levels. Deviations from this efficient frontier (as measured by increased variance in
the half-normal error) are explained by the following covariates (z): natural advantages (proxied by
production), trade (exports less imports), and governance. We assume an iid error structure (v) and a
half-normal deviation from the frontier (u). At the outset, it is essential to note that this exercise
explores cross-sectional correlations but should not be interpreted causally. It may be that correlation
results are indeed picking up causation, but we do not have the ability to identify causal impacts with
the available data.
Production, imports, and exports are from the same data source used to calculate apparent
consumption (FAO 2009). Apparent consumption may also be correlated with institutional effectiveness
– the ability of governments to adequately manage the resource, protect property rights, and otherwise
show effective governance. To capture that correlation, we use an index developed by the World Bank
as a measure of governance at the country level. The index averages four indicators of governance (rule
of law, control of corruption, governmental effectiveness, and regulatory quality) (Kaufmann, Kraay,
Mastruzzi, 2009; Smith et al. 2010). These four indicators are based upon hundreds of specific and
disaggregated individual variables measuring various dimensions of governance (Kaufmann, Kraay,
Mastruzzi, 2009). Missing data for governance variables for some of the countries listed in Appendix A
caused dropping 11 observations (primarily of territories, such as Greenland, Falkland Islands) leaving
the 198 observations used in evaluating the correlation between per capita income and per capita
seafood consumption above. A further 12 observations were dropped due to missing data on either next
14

exports or production, leaving 186 observations for the frontier analysis. Nations with missing data were
again primarily territories (e.g. Puerto Rico, U.S. Virgin Island, West Bank Gaza among others) or land-
locked nations (e.g. Luxembourg).
Results of the stochastic frontier model are in Table 2. All coefficients are significant at the 1% level,
including the test for model significance χ2 =13.42 (p=0.0002). We use the corrected Akaike Information
Criterion (AIC) for model selection to explain deviations from the frontier. The results indicate that after
conditioning on other factors, wealthier countries, on average, consume more seafood (equation 3).
Negative coefficients in equation 4 indicate that a country is closer to the frontier with a higher value of
the covariate. Thus, on average, countries with high seafood production, low net exports (high imports
or low exports), and, critically, strong governance consume more seafood. Holding trade flows and other
variables constant, countries with weak governance have lower seafood consumption per capita. Figure
8 presents the results graphically. The solid red line depicts the estimated frontier of seafood
consumption with the dotted red lines representing the 95% confidence interval of the frontier.
In Figure 9, we show the same scatter plot as Figure 8 but filter the data to only countries with at
least 500,000 metric tons of seafood production per year. Despite filtering, the pattern in Figure 9 is
similar to that of Figure 8. Choosing three different levels of per capita income, the darkened points with
labels illustrate regression results by showing the variability in seafood consumption at each income
level. If the correlations identified in Table 2 represent causal channels, countries could move closer to
the frontier theoretically by improving governance, producing more seafood (including aquaculture
production), or consuming more of their production and exporting less. We assume natural advantages
in capture fisheries are fixed and would offer limited opportunities for expanding production. Because
exporting less seafood reduces the benefits from participating in the global seafood trade, improving
15

governance and expanding aquaculture then would appear to be the primary viable options for efficient
seafood consumption.
4.4. Compensating for the Seafood Trade Deficit The fact that developing countries export high-value and import low-value seafood implies that the
trade deficit is much smaller when measured in quantity than in value. There is still a net quantity
outflow from developing to developed countries (i.e., 𝑞𝑞0𝑋𝑋−𝑞𝑞0𝑀𝑀), which peaked at 3.5 million metric
tons in 2003 and remained high at 2.3 million metric tons in 2009. While this outflow is problematic if
one only considers food security from a production perspective, it need not be problematic if countries
receive sufficient compensation that enables them to import other foods.
An important question is then how large is the compensation that developing countries receive in
exchange for their seafood exports? The simplest answer, of course, is that they receive the revenue
from exports net of their expenditures on seafood imports. But this does not take the quantity
exchanged into account. Thus, a better measure is the unit value of the net quantity outflow from
developing countries. This can be computed as the net export value divided by the net export quantity,
or 𝑝𝑝𝑐𝑐𝑐𝑐𝑐𝑐𝑐𝑐 = 𝑉𝑉0𝑋𝑋−𝑉𝑉0𝑀𝑀𝑞𝑞0𝑋𝑋−𝑞𝑞0𝑀𝑀
. These two variables are shown in Figure 10 together with the actual export price,
𝑝𝑝0𝑋𝑋.
Given that exports are increasing, as shown in figure 3, it is not surprising that the real net export
value is also increasing. In 2009 the real net export value was equal to 25.1 billion USD compared with
15.9 billion USD in 1990. The unit value compensation for every kilogram of seafood net exported is
more interesting. In 2009 it was 7.83 USD/kg, somewhat down from the peak of 9.80 USD/kg in 2007.
16

However, this compensation is more than twice the actual export price in most years. Hence, the
developing countries are well paid for the seafood quantities they export.
5. Conclusions The results of the preceding sections show that even though the total value – that is, price times
quantity – of seafood exported by developing countries to developed countries has increased, this need
not have ill effects on food security in developing countries, consistent with other findings (e.g., Dorosh,
2001, who found that the trade of rice contributes to short-term food security in Bangladesh). The
pattern of exporting higher valued seafood and importing lower valued seafood largely confirms
Bennett’s Law in that people substitute away from cheaper food with higher incomes. In other words,
developing countries exporting high-value seafood to developed countries and importing lower-valued
seafood from developing countries, illustrates how the market system works in reallocating the most
valuable resources to those with the highest ability to pay.
Food sovereignty remains an issue, because there is a seafood trade deficit for developing countries.
While it is more apparent when measured in value than in volume, in either regard one may believe this
to be a negative effect of trade. Whether it actually is depends on one’s point of view. The seafood trade
deficit can be viewed negatively if one believes that all reductions in availability for a specific food
source are a negative outcome. However, if one accepts that food types are substitutable, increasing
developing nations’ incomes from trade in seafood allows for purchases of other food types thus making
them better off.5 The data analyzed in this paper do not allow us to draw conclusions about whether
developing countries as a group actually use the income from seafood exports to (i) replace the lost
5 Cheaper seafood does not mean that the nutritional value of the seafood imported by developing countries is lower. This is especially so if we take into account that much of the seafood imports of developing countries are composed of pelagic species high in omega-3 fatty acids. For example, chub mackerel, herring, and jack mackerel are commonly imported by sub-Saharan African countries.
17

quantities of seafood with other foods, (ii) use the proceeds for other useful purposes like funding
infrastructure or education, or (iii) whether they are appropriated by a powerful elite. However, the
data clearly show that the developing countries as a group are well compensated for the quantities of
seafood that they export, and the increased income is more than sufficient to replace the food that is
given up at prevailing market prices. As such, a trade deficit in seafood should not necessarily contribute
to decreased food security.
Yet that developing countries as a group are well compensated for their seafood exports does not
mean that everyone within these countries will be better off. From the time of David Ricardo,
economists have understood that while society in general is better off with trade, there are winners and
losers within each trading country. As such, our results do not in any way remove the possibility that the
poorest people in developing countries are made worse off by seafood trade. Our results only show that
the countries are being given the means to improve societal welfare, although gains from the
international trade of seafood from developing to developed countries could be misappropriated
(Barrientos et al., 2011).
Our final point is theoretical in nature and relates to the necessary conditions for free trade to
ensure welfare improvement. Detailed models of resource extraction with poorly managed natural
resources show that trade liberalization leading to increase traded provides a short-run benefit to the
resource exporter at a long-run cost due to resource overexploitation (Brander and Taylor, 1998).
Whether the benefits of trade outweigh the costs then becomes an empirical question. In this sense,
seafood illustrates a trade-governance dilemma (Bailey, 1988), as aggregate governance indicators tend
to indicate significant scope for improved governance for seafood net exporters (Smith et al., 2010).
18

References Anderson, J. L., Asche, F. and Tveterås, S., 2010. “World Fish Markets”. In: Handbook of Marine Fisheries Conservation and Management (Eds, Grafton, R. Q., Hilborn, R., Squires, D., Tait, M. and Williams, M.) Oxford University Press, Oxford. Anderson, Kym, Gordon Rausser, and Johan Swinnen (2013), “Political Economy of Public Policies: Insights from Distortions to Agricultural and Food Markets,” Journal of Economic Literature 51: 423-477.
Asche, F., 2008. “Farming the Sea”. Marine Resource Economics. 23, 527-547. Asche, F., Bremnes, H., Wessells, C.R., 1999. “Product Aggregation, Market Integration and Relationships Between Prices: An Application to World Salmon Markets”. American Journal of Agricultural Economics. 81, 568-581. Asche, F., Bjørndal, T., Young, J. A., 2001. “Market Interactions for Aquaculture Products”. Aquaculture Economics and Management. 5, 303-318. Asche, F., Bjørndal, T., Gordon, D.V., 2007. “Studies in the Demand Structure for Fish and Seafood Products,” In: Handbook of Operations Research in Natural Resources.(Weintraub, A., Romero, C., Bjørndal, T. and Epstein, R., (eds)), pp. 295-314. Springer: Berlin. Bailey, R. 1988. “Third World Fisheries: Prospects and Problems.” World Development 16, 751-757. Barrett, C. B., Bachke, M.E., Bellemare, M.F., Michelson, H.C., Narayanan, S., Walker, T.F., 2012. “Smallholder Participation in Contract Farming: Comparative Evidence from Five Countries”. World Development. 40, 715-730. Barrientos, S., Mayer, F., Pickles, J., Posthuma, A.,2011. “Decent Work in Global Production Networks: Framing the Policy Debate,” International Labour Review. 150, 297-317. Basu, K., 2006. “Globalization, poverty and inequity: What is the relationship? What can be done?” World Development. 34, 1361–1373. Bellemare, M.F., 2012. “As You Sow, So Shall You Reap: The Welfare Impacts of Contract Farming”. World Development. 40, 1418-1434. Béné, C., Lawton, R., Allison, E.H. 2010. “Trade matters in the Fight Against Poverty: Narratives, Perceptions and, (Lack of) Evidence in the Case of Fish Trade in Africa”. World Development 38, 933-954. Bennett, M.K., 1941. Wheat in National Diets, Stanford, CA: Stanford University Press. Brander, J.A., Taylor, M.S., 1998. «Open Access Renewable Resources Trade and Trade Policy in a Two-country Model”. Journal of International Economics. 44, 181-210.
19
Dorosh, P. (2001), “Trade Liberalization and National Food Security: Rice Trade between Bangladesh and India.” World Development, 29, 673-689. Edward, P., 2006. “Examining inequality: Who really benefits from global growth?” World Development. 34, 1667–1695. FAO, 2006. The state of world fisheries and aquaculture 2006. Food and Agriculture Organization of the United Nations, Rome. FAO, 2009. FishStat Plus. http://www.fao.org/fishery/statistics/en FAO, 2012. The state of world fisheries and aquaculture 2012. Food and Agriculture Organization of the United Nations, Rome. FAO (2013). FishStatJ. http://www.fao.org/fishery/statistics/software/fishstatj/en Forum for Food Sovereignty, 2007., “Declaration of Nyéléni,” http://www.nyeleni.org/%20spip.php?article290, last accessed June 11, 2013. Goldberg, P., Pavcnik, N., 2007. “Distributional effects of trade liberalization in developing countries. “ Journal of Economic Literature. 45, 39–82. Kaufmann, D., Kraay, A.,Mastruzzi, M., 2009. Governance Matters VIII: Aggregate and Individual Governance Indicators 1996–2008,World Bank Policy Research Working Paper No. 4978, World Bank, Washington, DC,. Kelleher, K. (2013) Green growth and waste. TAD/FI(2013)3. OECD: Paris.
Kenny, C., 2012. Getting Better: Why Global Development Is Succeeding—and How We Can Improve the World Even More, New York: Basic Books. Kumbhakar, S. C., Lovell, C.A.K., 2000. Stochastic Frontier Analysis, Cambridge University Press, New York. Parker, R.O., 2011. Aquaculture Science, 3rd edition. Cengage Learning, NY. Pinstrup-Andersen, P., 2002. “Food and Agricultural Policy for a Globalizing World: Preparing for the Future.” American Journal of Agricultural Economics. 85, 1201-1214. Ricardo, D., 1996, On the Principles of Political Economy and Taxation, Amherst, NY: Prometheus Books. (Original work published 1817.) Roheim, C. 2004. “Trade Liberalization in Fish Products: Impacts on Sustainability of International Markets and Fish Resources.” In: Global Agricultural Trade and Developing Countries, A. Aksoy and J. Beghin, eds. The World Bank, Washington, DC: 275-295. Ruddle, K., 2008. “Reconsidering the contribution of fisheries to society and Millennium Development Goals.” In: K. Tsukamoto, T. Kawamura, T. Takeuchi, T.D. Beard, & M.J. Kaiser (Eds.), Fisheries for global
20

welfare and environment, 5th World Fisheries congress (pp. 399–411). Smith, M. D., Roheim, C.A., Crowder, L.B., Halpern, B.S., Turnipseed, M., Anderson, J.L., Asche, F., Bourillón, L., Guttormsen, A.G., Kahn, A., Liguori, L.A., McNevin, A., O’Connor, M., Squires, D., Tyedemers, P., Brownstein, C., Carden, K., Klinger, D.H., Sagarin, R., Selkoe, K.A., 2010. “Sustainability and Global Seafood.” Science, 327, 784-786. Swartz, W., Sumaila, U.R., Watson, R., Pauly, D., 2010. “Sourcing seafood for the three major markets: The EU, Japan and the USA.” Marine Policy. 34, 1366-1373. Thorpe, A., 2004. Growth and equity: Grounds for inserting the sector is PRSPs and NDPs. In Mainstreaming fisheries into national development and poverty reduction strategies: Current situation and opportunities. FAO Fisheries Circular. No. 997. Rome: FAO. Toufique, K.A., and B. Belton (2014). “Is Aquaculture Pro-Poor? Empirical Evidence of Impacts on Fish Consumption in Bangladesh.” World Development, 64, 609-620. Tveteras, S., Asche, F., Bellemare, M.F., Smith, M.D., Guttormsen, A.G., Lem, A., Lien, K., Vannucini, S., 2012. “Fish is Food – The FAO’s Fish Price Index.” PLoS ONE 7(5): e36731. Valdimarsson, G., James, D., 2001. “World Fisheries – Utilization of catches.” Ocean and Coastal Management. 44, 619–633. World Bank, 2013. Fish to 2030: Prospects for Fisheries and Aquaculture. World Bank Report number 83177-GLB, Washington , D.C., December.
21

Appendix A Table A1. Developing countries included in seafood statistics
Developing countries
Algeria Congo, Republic of Honduras Mozambique Sierra Leone
Angola Cook Islands India Myanmar Singapore
Antigua and Barbuda Costa Rica Indonesia Namibia Solomon Islands
Argentina Cuba Iran (Islamic Rep. of) Nepal Somalia
Aruba Cyprus Iraq Netherlands Antilles Sri Lanka
Bahamas Côte d'Ivoire Jamaica New Caledonia St. Pierre and Miquelon
Bahrain Djibouti Jordan Nicaragua Sudan
Bangladesh Dominica Kenya Niger Suriname
Barbados Dominican Republic Kiribati Nigeria Swaziland
Belize Ecuador Korea, Dem. People's Rep Northern Mariana Is. Syrian Arab Republic
Benin Egypt Korea, Republic of Oman Taiwan Province of China
Bermuda El Salvador Kuwait Pakistan Tanzania, United Rep. of
Bhutan Equatorial Guinea Lao People's Dem. Rep. Palau Thailand
Bolivia (Plurinat.State) Eritrea Lebanon
Palestine, Occupied Tr. Timor-Leste
Botswana Ethiopia Lesotho Panama Togo
Brazil Ethiopia PDR Liberia Papua New Guinea Tonga
Brunei Darussalam Falkland Is.(Malvinas) Libya Paraguay Trinidad and Tobago
Burkina Faso Fiji, Republic of Madagascar Peru Tunisia
Burundi French Guiana Malawi Philippines Turkey
Cambodia French Polynesia Malaysia Qatar Turks and Caicos Is.
Cameroon Gabon Maldives Rwanda Tuvalu
Cape Verde Gambia Mali Réunion Uganda
Cayman Islands Ghana Marshall Islands Saint Helena United Arab Emirates Central African Republic Greenland Martinique Saint Kitts and Nevis Uruguay
Chad Grenada Mauritania Saint Lucia Vanuatu
Chile Guadeloupe Mauritius Saint Vincent/Grenadines
Venezuela, Boliv Rep of
China Guam Mayotte Samoa Viet Nam China, Hong Kong SAR Guatemala Mexico
Sao Tome and Principe Yemen
China, Macao SAR Guinea Micronesia, Fed.States of Saudi Arabia Zambia
Colombia Guinea-Bissau Mongolia Senegal Zimbabwe
Comoros Guyana Montserrat Seychelles Congo, Dem. Rep. of the Haiti Morocco
22

Table A1. Developed countries included in seafood statistics
Developed countries
Albania Lithuania
Armenia Luxembourg
Australia Macedonia, Fmr Yug Rp of
Austria Malta
Azerbaijan Moldova, Republic of
Belarus Montenegro
Belgium Netherlands
Bosnia and Herzegovina New Zealand
Bulgaria Norway
Canada Poland
Croatia Portugal
Czech Republic Romania
Czechoslovakia Russian Federation
Denmark Serbia
Estonia Serbia and Montenegro
Faroe Islands Slovakia
Finland Slovenia
France South Africa
Georgia Spain
Germany Sweden
Greece Switzerland
Hungary Tajikistan
Iceland Turkmenistan
Ireland Ukraine
Israel Un. Sov. Soc. Rep.
Italy United Kingdom
Japan United States of America
Kazakhstan Uzbekistan
Kyrgyzstan Yugoslavia SFR
Latvia
23

Table 1. Descriptive statistics Variables Unit Observations Mean Std. Dev. Min Max
Developing Countries
𝒒𝒒𝟎𝟎𝟎𝟎 Metric ton 34 6.766 4.059 1.504 13.886 𝑽𝑽𝟎𝟎𝟎𝟎 Billion USD 34 19.424 12.993 2.523 47.159 𝒑𝒑𝟎𝟎𝟎𝟎 USD per kg 34 2.698 0.470 1.639 3.404 𝒒𝒒𝟎𝟎𝟎𝟎 Metric ton 34 4.889 3.244 1.283 11.877 𝑽𝑽𝟎𝟎𝟎𝟎 Billion USD 34 7.192 5.751 .937 21.270 𝒑𝒑𝟎𝟎𝟎𝟎 USD per kg 34 1.334 0.284 0.721 1.881
Developed Countries
𝒒𝒒𝟏𝟏𝟎𝟎 Metric ton 34 8.521 3.016 3.399 13.168 𝑽𝑽𝟏𝟏𝟎𝟎 Billion USD 34 21.599 12.720 4.386 49.184 𝒑𝒑𝟏𝟏𝟎𝟎 USD per kg 34 2.328 0.671 1.210 3.838 𝒒𝒒𝟏𝟏𝟎𝟎 Metric ton 34 10.228 4.214 3.970 16.476 𝑽𝑽𝟏𝟏𝟎𝟎 Billion USD 34 36.987 21.424 6.763 81.188 𝒑𝒑𝟏𝟏𝟎𝟎 USD per kg 34 3.330 0.807 1.704 4.947
24

Table 2. Stochastic Frontier Model Results. The dependent variable is the natural log of seafood
consumption per capita.
Coefficient SE Z-statistic
Frontier Estimation
Constant 2.06 0.36 5.70 ln(Per Capita Income) 0.14 0.04 3.66
Deviations from the Frontier Constant 1.14 0.29 3.97 ln(Per Capita Production) -1.09 0.17 -6.57 ln(Per Capita Net Exports) 0.22 0.07 3.05 World Bank Governance Index -0.67 0.26 -2.54
n 186
25

Figure 1. Export Value of Selected Food Commodities in 2009 (Source: FAO, 2013)
95.7
33.1
33.0
31.1
25.1
22.0
19.9
19.8
19.1
13.5
0.0 20.0 40.0 60.0 80.0 100.0
Seafood
Soybeans
Pig
Wheat
Poultry
Sugar
Maize
Coffee
Rice
Cocoa
Billion USD
26

Figure 2. The Global Production of Seafood by Production Technology, 1970-2011 (Source: FAO, 2013)
27
Figure 3. Global Seafood Exports in Real Terms, 2009=1 (Source: FAO, 2013)
0
20
40
60
80
100
120
1976
1979
1982
1985
1988
1991
1994
1997
2000
2003
2006
2009
Bill.
USD
Developing
Developed
28

Figure 4. Global Seafood Imports in Real Terms, 2009=1 (Source: FAO, 2013)
29

Figure 5. Global Seafood Exports (Source: FAO, 2013)
30

Figure 6. Global Seafood Imports (Source: FAO, 2013)
31
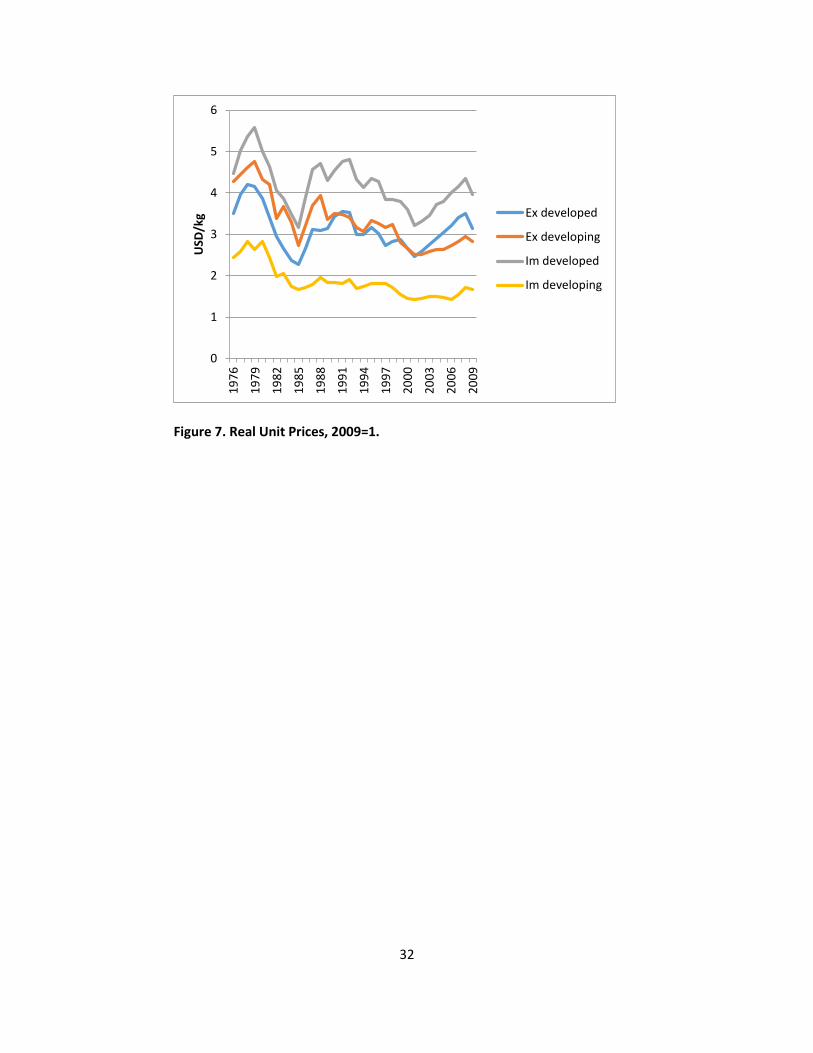
Figure 7. Real Unit Prices, 2009=1.
0
1
2
3
4
5
6
1976
1979
1982
1985
1988
1991
1994
1997
2000
2003
2006
2009
USD
/kg Ex developed
Ex developing
Im developed
Im developing
32

Figure 8. The Relationship between Income and Seafood Consumption.
33

Figure 9. The Relationship between Income and Seafood Consumption for Selected Countries.
34

Figure 10. Real Export Price from Developing Countries, Net Export Surplus Value and Real Unit Compensation for Net Quantity Exported, 2009=1.
35

36